indicators of the city blueprint … of the...1 indicators of the city blueprint framework...
TRANSCRIPT

1
INDICATORS OF THE CITY BLUEPRINT FRAMEWORK (14-08-2017)
Key publications Koop, S.H.A. and C.J. Van Leeuwen. (2015a). Assessment of the Sustainability of Water Resources Management: A Critical Review of the City Blueprint Approach. Water Resources Management. 29:5649–5670 (open access) Koop, S.H.A. and C.J. Van Leeuwen. (2015b). Application of the Improved City Blueprint Framework in 45 municipalities and regions. Water Resources Management, 29(13), 4629-4647 (open access) Koop, S.H.A. and Van Leeuwen, C.J.(2016). The challenges of water, waste and climate change in cities. Environment, Development and Sustainability, DOI :10.1007/s10668-016-9760-4. (open access)
Secondary WWTTertiary WWT
Groundwater quality
Solid waste collected
Solid waste recycled
Solid waste energy recovered
Access to drinking water
Access to sanitation
Drinking water quality
Nutrient recovery
Energy recovery
Sewage sludge recyclingWWT Energy efficiencyAverage age sewer
Operation cost recovery
Water system leakages
Stormwater separation
Green space
Climate adaptation
Drinking water consumption
Climate robust buildings
Management and action plans
Public participation
Water efficiency measuresAttractiveness
2
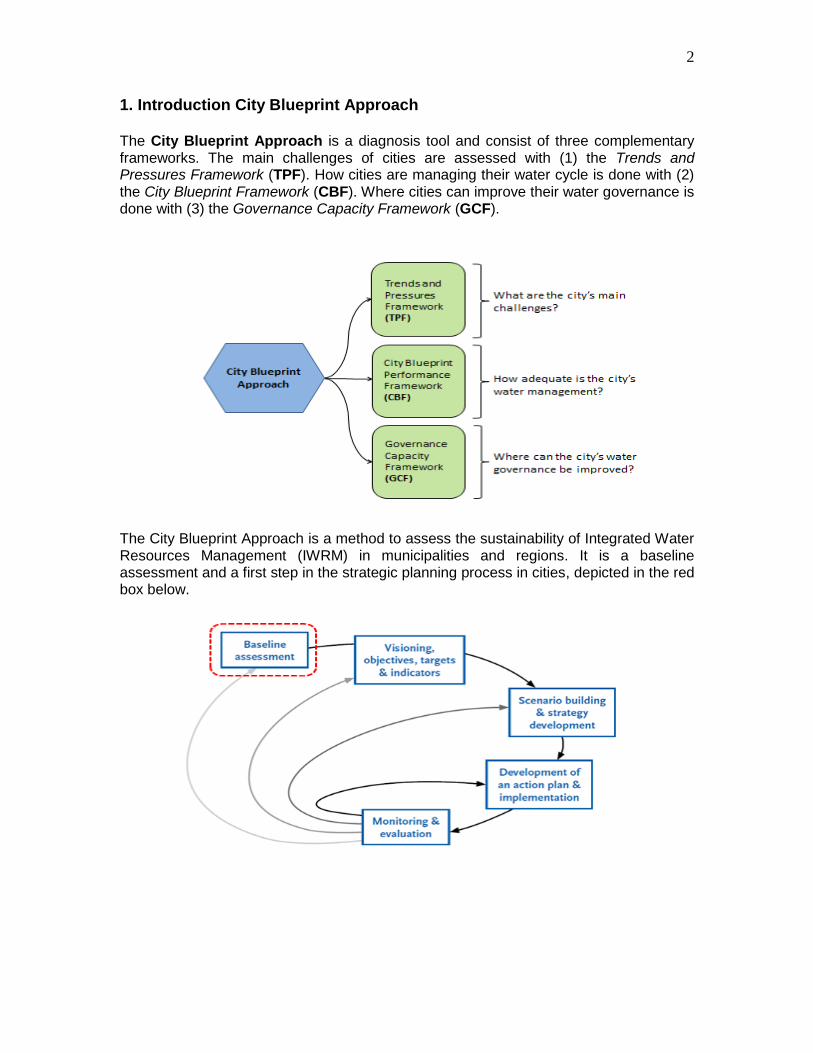
1. Introduction City Blueprint Approach The City Blueprint Approach is a diagnosis tool and consist of three complementary frameworks. The main challenges of cities are assessed with (1) the Trends and Pressures Framework (TPF). How cities are managing their water cycle is done with (2) the City Blueprint Framework (CBF). Where cities can improve their water governance is done with (3) the Governance Capacity Framework (GCF).
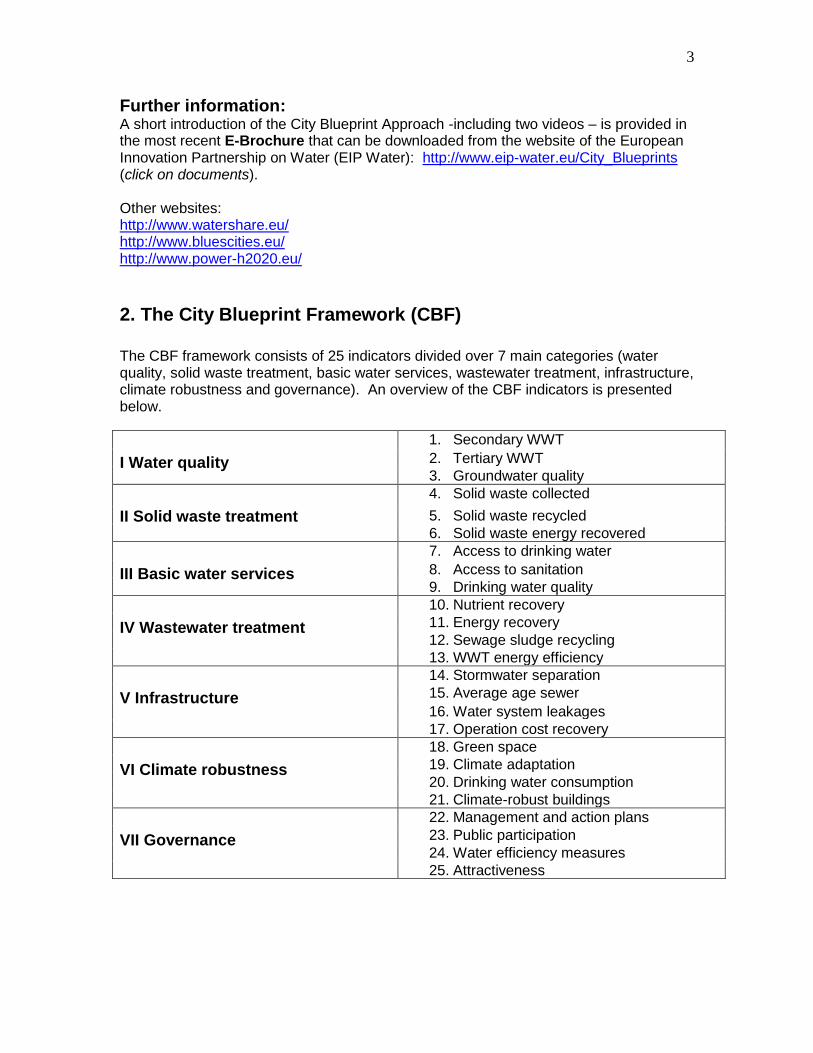
The City Blueprint Approach is a method to assess the sustainability of Integrated Water Resources Management (IWRM) in municipalities and regions. It is a baseline assessment and a first step in the strategic planning process in cities, depicted in the red box below.
3
Further information: A short introduction of the City Blueprint Approach -including two videos – is provided in the most recent E-Brochure that can be downloaded from the website of the European Innovation Partnership on Water (EIP Water): http://www.eip-water.eu/City_Blueprints (click on documents). Other websites: http://www.watershare.eu/ http://www.bluescities.eu/ http://www.power-h2020.eu/
2. The City Blueprint Framework (CBF)
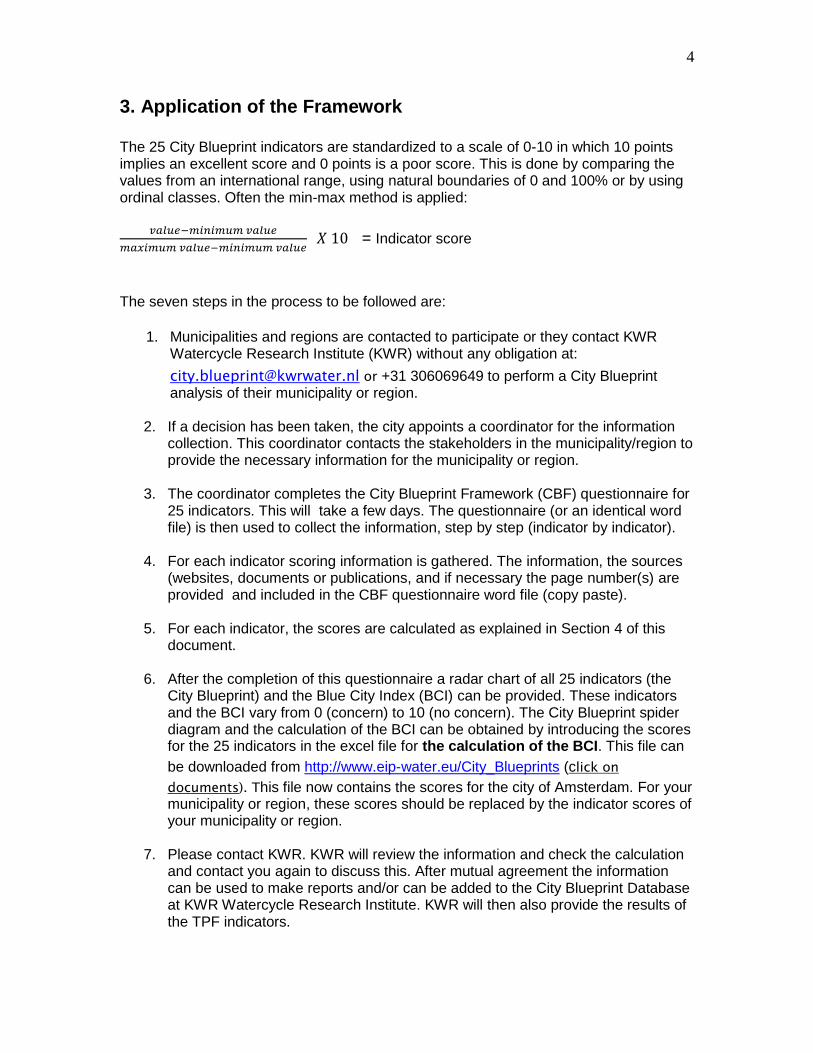
The CBF framework consists of 25 indicators divided over 7 main categories (water quality, solid waste treatment, basic water services, wastewater treatment, infrastructure, climate robustness and governance). An overview of the CBF indicators is presented below.
I Water quality
1. Secondary WWT
2. Tertiary WWT
3. Groundwater quality
II Solid waste treatment
4. Solid waste collected
5. Solid waste recycled
6. Solid waste energy recovered
III Basic water services
7. Access to drinking water
8. Access to sanitation
9. Drinking water quality
IV Wastewater treatment
10. Nutrient recovery
11. Energy recovery
12. Sewage sludge recycling
13. WWT energy efficiency
V Infrastructure
14. Stormwater separation
15. Average age sewer
16. Water system leakages
17. Operation cost recovery
VI Climate robustness
18. Green space
19. Climate adaptation
20. Drinking water consumption
21. Climate-robust buildings
VII Governance
22. Management and action plans
23. Public participation
24. Water efficiency measures
25. Attractiveness
4
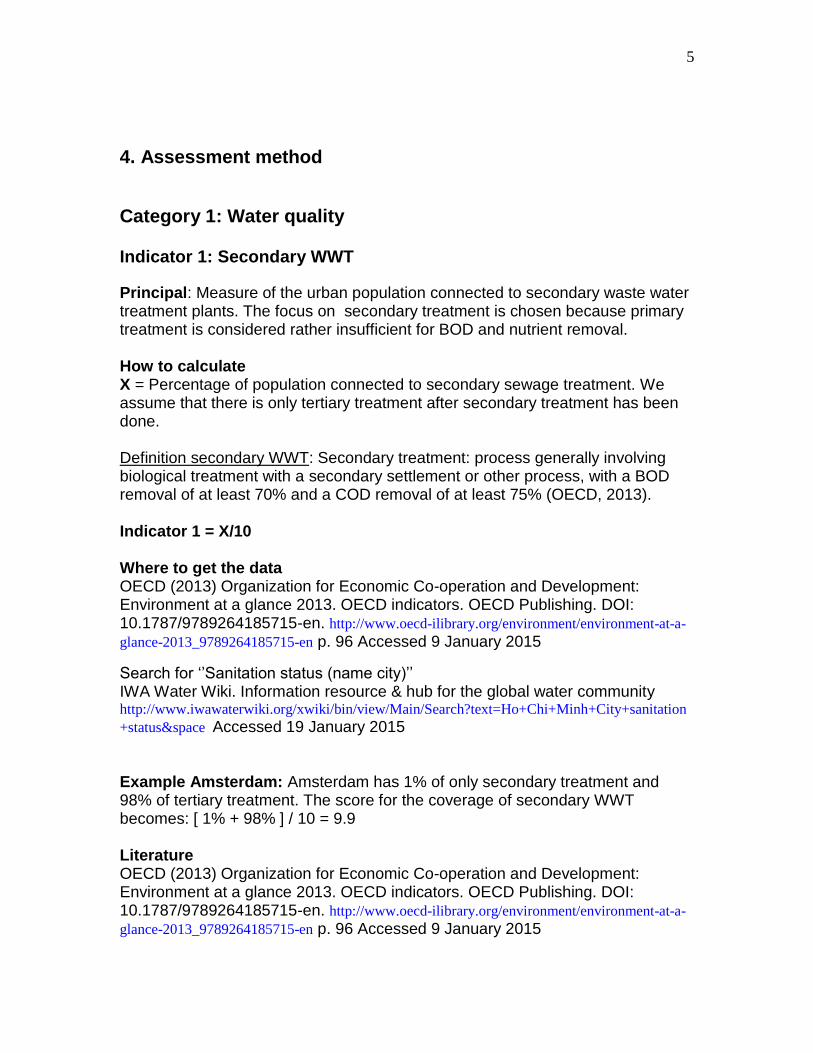
3. Application of the Framework The 25 City Blueprint indicators are standardized to a scale of 0-10 in which 10 points implies an excellent score and 0 points is a poor score. This is done by comparing the values from an international range, using natural boundaries of 0 and 100% or by using ordinal classes. Often the min-max method is applied:
𝑣𝑎𝑙𝑢𝑒−𝑚𝑖𝑛𝑖𝑚𝑢𝑚 𝑣𝑎𝑙𝑢𝑒
𝑚𝑎𝑥𝑖𝑚𝑢𝑚 𝑣𝑎𝑙𝑢𝑒−𝑚𝑖𝑛𝑖𝑚𝑢𝑚 𝑣𝑎𝑙𝑢𝑒 𝑋 10 = Indicator score
The seven steps in the process to be followed are:
1. Municipalities and regions are contacted to participate or they contact KWR
Watercycle Research Institute (KWR) without any obligation at:
[email protected] or +31 306069649 to perform a City Blueprint analysis of their municipality or region.
2. If a decision has been taken, the city appoints a coordinator for the information
collection. This coordinator contacts the stakeholders in the municipality/region to provide the necessary information for the municipality or region.
3. The coordinator completes the City Blueprint Framework (CBF) questionnaire for 25 indicators. This will take a few days. The questionnaire (or an identical word file) is then used to collect the information, step by step (indicator by indicator).
4. For each indicator scoring information is gathered. The information, the sources (websites, documents or publications, and if necessary the page number(s) are provided and included in the CBF questionnaire word file (copy paste).
5. For each indicator, the scores are calculated as explained in Section 4 of this document.
6. After the completion of this questionnaire a radar chart of all 25 indicators (the City Blueprint) and the Blue City Index (BCI) can be provided. These indicators and the BCI vary from 0 (concern) to 10 (no concern). The City Blueprint spider diagram and the calculation of the BCI can be obtained by introducing the scores for the 25 indicators in the excel file for the calculation of the BCI. This file can
be downloaded from http://www.eip-water.eu/City_Blueprints (click on
documents). This file now contains the scores for the city of Amsterdam. For your municipality or region, these scores should be replaced by the indicator scores of your municipality or region.
7. Please contact KWR. KWR will review the information and check the calculation and contact you again to discuss this. After mutual agreement the information can be used to make reports and/or can be added to the City Blueprint Database at KWR Watercycle Research Institute. KWR will then also provide the results of the TPF indicators.
5
4. Assessment method
Category 1: Water quality Indicator 1: Secondary WWT
Principal: Measure of the urban population connected to secondary waste water treatment plants. The focus on secondary treatment is chosen because primary treatment is considered rather insufficient for BOD and nutrient removal. How to calculate X = Percentage of population connected to secondary sewage treatment. We assume that there is only tertiary treatment after secondary treatment has been done. Definition secondary WWT: Secondary treatment: process generally involving biological treatment with a secondary settlement or other process, with a BOD removal of at least 70% and a COD removal of at least 75% (OECD, 2013). Indicator 1 = X/10 Where to get the data OECD (2013) Organization for Economic Co-operation and Development: Environment at a glance 2013. OECD indicators. OECD Publishing. DOI: 10.1787/9789264185715-en. http://www.oecd-ilibrary.org/environment/environment-at-a-
glance-2013_9789264185715-en p. 96 Accessed 9 January 2015
Search for ‘’Sanitation status (name city)’’ IWA Water Wiki. Information resource & hub for the global water community http://www.iwawaterwiki.org/xwiki/bin/view/Main/Search?text=Ho+Chi+Minh+City+sanitation
+status&space Accessed 19 January 2015 Example Amsterdam: Amsterdam has 1% of only secondary treatment and 98% of tertiary treatment. The score for the coverage of secondary WWT becomes: [ 1% + 98% ] / 10 = 9.9 Literature OECD (2013) Organization for Economic Co-operation and Development: Environment at a glance 2013. OECD indicators. OECD Publishing. DOI: 10.1787/9789264185715-en. http://www.oecd-ilibrary.org/environment/environment-at-a-
glance-2013_9789264185715-en p. 96 Accessed 9 January 2015
6
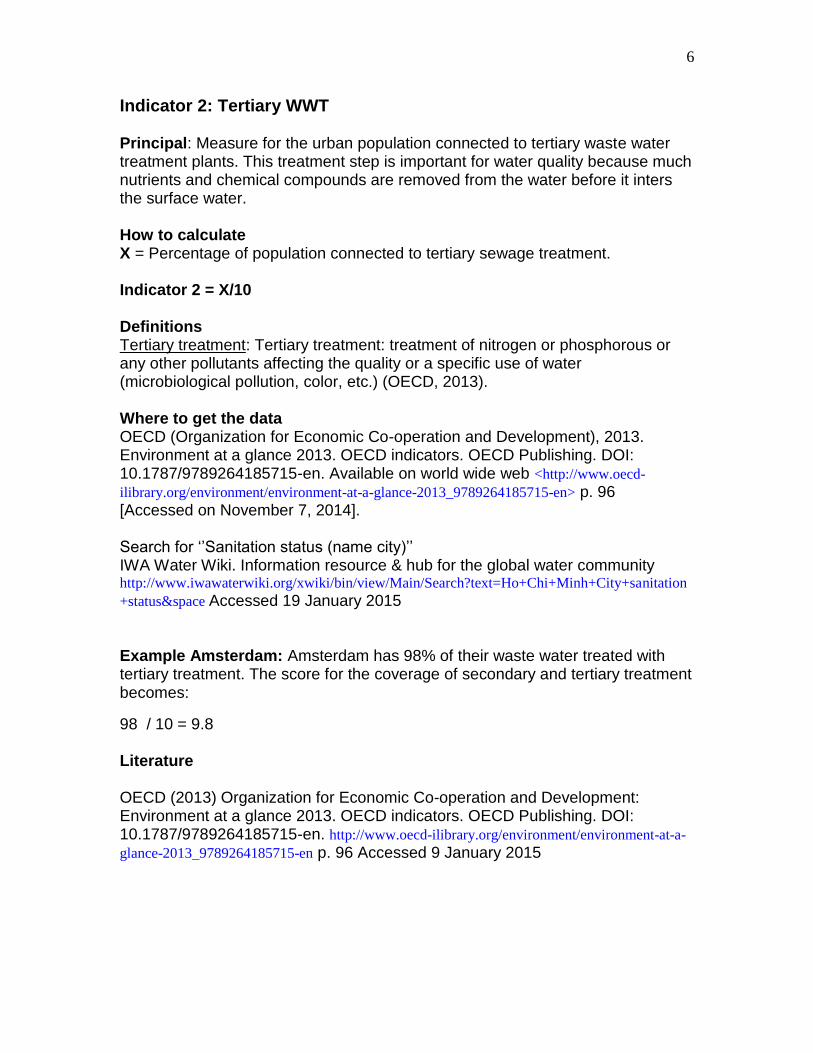
Indicator 2: Tertiary WWT Principal: Measure for the urban population connected to tertiary waste water treatment plants. This treatment step is important for water quality because much nutrients and chemical compounds are removed from the water before it inters the surface water. How to calculate X = Percentage of population connected to tertiary sewage treatment. Indicator 2 = X/10 Definitions Tertiary treatment: Tertiary treatment: treatment of nitrogen or phosphorous or any other pollutants affecting the quality or a specific use of water (microbiological pollution, color, etc.) (OECD, 2013). Where to get the data OECD (Organization for Economic Co-operation and Development), 2013. Environment at a glance 2013. OECD indicators. OECD Publishing. DOI: 10.1787/9789264185715-en. Available on world wide web <http://www.oecd-
ilibrary.org/environment/environment-at-a-glance-2013_9789264185715-en> p. 96 [Accessed on November 7, 2014]. Search for ‘’Sanitation status (name city)’’ IWA Water Wiki. Information resource & hub for the global water community http://www.iwawaterwiki.org/xwiki/bin/view/Main/Search?text=Ho+Chi+Minh+City+sanitation
+status&space Accessed 19 January 2015
Example Amsterdam: Amsterdam has 98% of their waste water treated with tertiary treatment. The score for the coverage of secondary and tertiary treatment becomes:
98 / 10 = 9.8 Literature OECD (2013) Organization for Economic Co-operation and Development: Environment at a glance 2013. OECD indicators. OECD Publishing. DOI: 10.1787/9789264185715-en. http://www.oecd-ilibrary.org/environment/environment-at-a-
glance-2013_9789264185715-en p. 96 Accessed 9 January 2015

7
Indicator 3: Groundwater quality Principal: Measure of relative groundwater quality. A lower Indicator score is given for poorer quality. How to calculate Base the calculation on national or regional data where city-level data are not available. A limitation is that in any country, city water quality is typically worse than the national average. For EU countries, data are available to estimate a measure of national groundwater quality. An EU database shows the number of groundwater samples of ‘good chemical status’ out of a total number of samples. X = Number of samples of ‘good chemical status’ Y = Number of samples of ‘poor chemical status’ Indicator 3 = X / (X+Y) x 10 Note: for non-EU countries, an alternative method should be applied, depending what data are available. Where to get the data From the ‘Ground Water Viewer’ of the European Environment Agency (EEA). EEA (2012) WISE WFD Database. http://www.eea.europa.eu/data-and-
maps/data/wise_wfd Accessed on 15 June 2015 Example Amsterdam: X = Good chemical status: 14 Y = Poor chemical status: 9 Indicator score = [14 / (14 +9) ] * 10 = 6.1
8
Category 2: Solid waste treatment
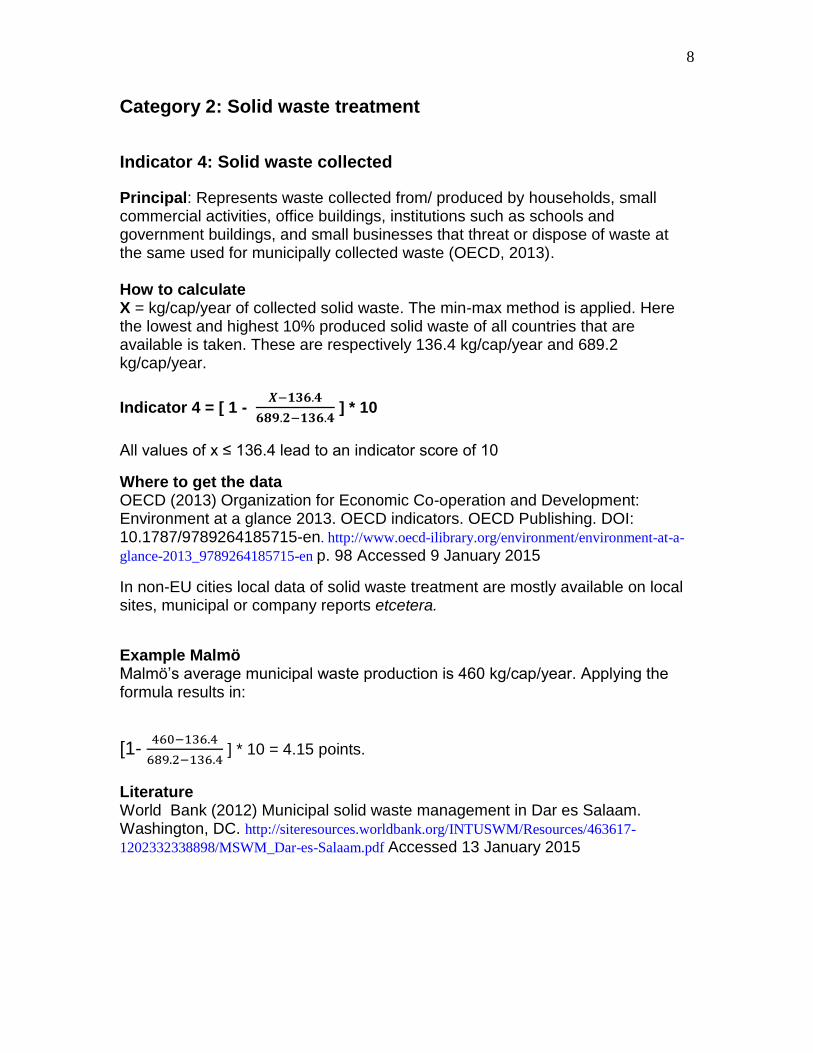
Indicator 4: Solid waste collected
Principal: Represents waste collected from/ produced by households, small commercial activities, office buildings, institutions such as schools and government buildings, and small businesses that threat or dispose of waste at the same used for municipally collected waste (OECD, 2013). How to calculate X = kg/cap/year of collected solid waste. The min-max method is applied. Here the lowest and highest 10% produced solid waste of all countries that are available is taken. These are respectively 136.4 kg/cap/year and 689.2 kg/cap/year.
Indicator 4 = [ 1 - 𝑿−𝟏𝟑𝟔.𝟒
𝟔𝟖𝟗.𝟐−𝟏𝟑𝟔.𝟒 ] * 10
All values of x ≤ 136.4 lead to an indicator score of 10
Where to get the data OECD (2013) Organization for Economic Co-operation and Development: Environment at a glance 2013. OECD indicators. OECD Publishing. DOI: 10.1787/9789264185715-en. http://www.oecd-ilibrary.org/environment/environment-at-a-
glance-2013_9789264185715-en p. 98 Accessed 9 January 2015
In non-EU cities local data of solid waste treatment are mostly available on local sites, municipal or company reports etcetera.
Example Malmö Malmö’s average municipal waste production is 460 kg/cap/year. Applying the formula results in:
[1- 460−136.4
689.2−136.4 ] * 10 = 4.15 points.
Literature World Bank (2012) Municipal solid waste management in Dar es Salaam. Washington, DC. http://siteresources.worldbank.org/INTUSWM/Resources/463617-
1202332338898/MSWM_Dar-es-Salaam.pdf Accessed 13 January 2015
9
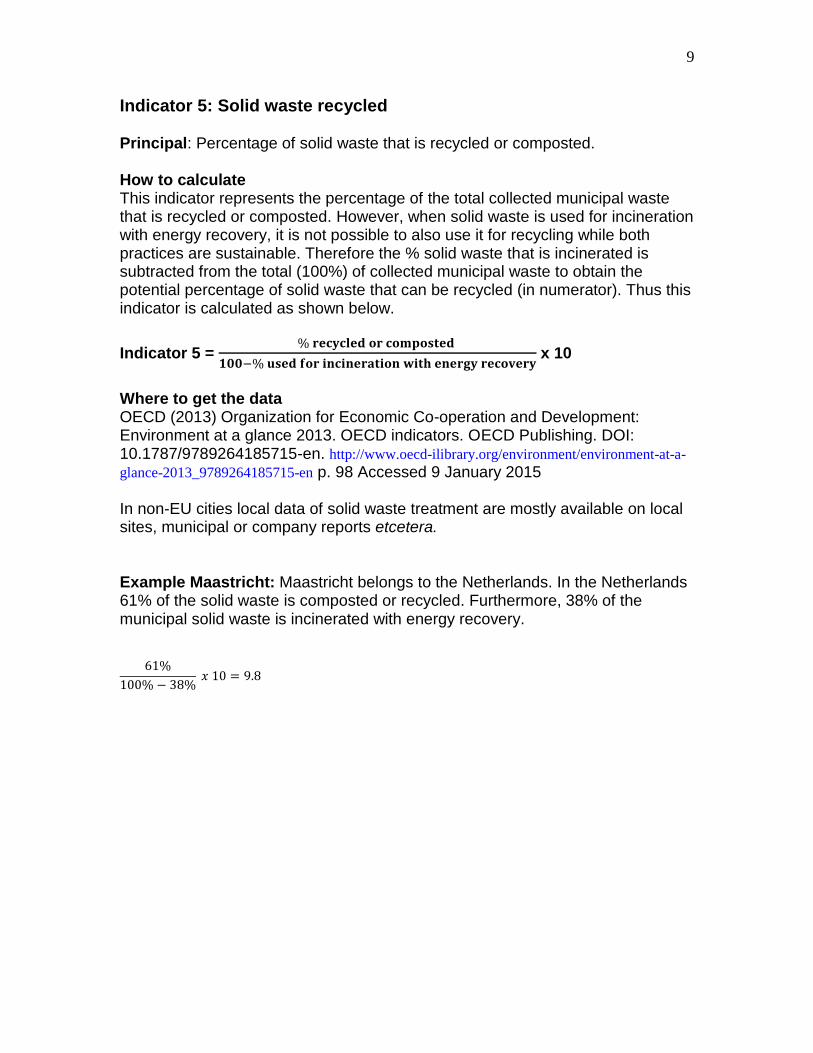
Indicator 5: Solid waste recycled Principal: Percentage of solid waste that is recycled or composted. How to calculate This indicator represents the percentage of the total collected municipal waste that is recycled or composted. However, when solid waste is used for incineration with energy recovery, it is not possible to also use it for recycling while both practices are sustainable. Therefore the % solid waste that is incinerated is subtracted from the total (100%) of collected municipal waste to obtain the potential percentage of solid waste that can be recycled (in numerator). Thus this indicator is calculated as shown below.
Indicator 5 = % 𝐫𝐞𝐜𝐲𝐜𝐥𝐞𝐝 𝐨𝐫 𝐜𝐨𝐦𝐩𝐨𝐬𝐭𝐞𝐝
𝟏𝟎𝟎−% 𝐮𝐬𝐞𝐝 𝐟𝐨𝐫 𝐢𝐧𝐜𝐢𝐧𝐞𝐫𝐚𝐭𝐢𝐨𝐧 𝐰𝐢𝐭𝐡 𝐞𝐧𝐞𝐫𝐠𝐲 𝐫𝐞𝐜𝐨𝐯𝐞𝐫𝐲 x 10
Where to get the data OECD (2013) Organization for Economic Co-operation and Development: Environment at a glance 2013. OECD indicators. OECD Publishing. DOI: 10.1787/9789264185715-en. http://www.oecd-ilibrary.org/environment/environment-at-a-
glance-2013_9789264185715-en p. 98 Accessed 9 January 2015 In non-EU cities local data of solid waste treatment are mostly available on local sites, municipal or company reports etcetera. Example Maastricht: Maastricht belongs to the Netherlands. In the Netherlands 61% of the solid waste is composted or recycled. Furthermore, 38% of the municipal solid waste is incinerated with energy recovery.
61%
100% − 38% 𝑥 10 = 9.8
10
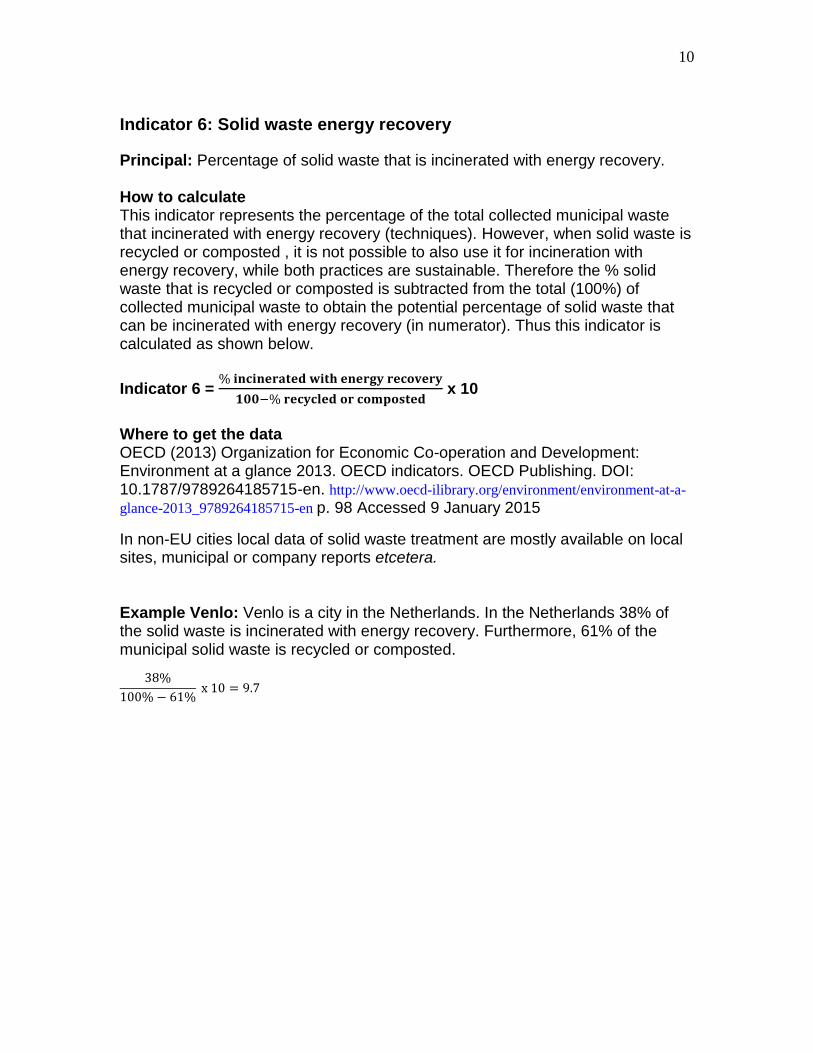
Indicator 6: Solid waste energy recovery
Principal: Percentage of solid waste that is incinerated with energy recovery. How to calculate This indicator represents the percentage of the total collected municipal waste that incinerated with energy recovery (techniques). However, when solid waste is recycled or composted , it is not possible to also use it for incineration with energy recovery, while both practices are sustainable. Therefore the % solid waste that is recycled or composted is subtracted from the total (100%) of collected municipal waste to obtain the potential percentage of solid waste that can be incinerated with energy recovery (in numerator). Thus this indicator is calculated as shown below.
Indicator 6 = % 𝐢𝐧𝐜𝐢𝐧𝐞𝐫𝐚𝐭𝐞𝐝 𝐰𝐢𝐭𝐡 𝐞𝐧𝐞𝐫𝐠𝐲 𝐫𝐞𝐜𝐨𝐯𝐞𝐫𝐲
𝟏𝟎𝟎−% 𝐫𝐞𝐜𝐲𝐜𝐥𝐞𝐝 𝐨𝐫 𝐜𝐨𝐦𝐩𝐨𝐬𝐭𝐞𝐝 x 10
Where to get the data OECD (2013) Organization for Economic Co-operation and Development: Environment at a glance 2013. OECD indicators. OECD Publishing. DOI: 10.1787/9789264185715-en. http://www.oecd-ilibrary.org/environment/environment-at-a-
glance-2013_9789264185715-en p. 98 Accessed 9 January 2015
In non-EU cities local data of solid waste treatment are mostly available on local sites, municipal or company reports etcetera. Example Venlo: Venlo is a city in the Netherlands. In the Netherlands 38% of the solid waste is incinerated with energy recovery. Furthermore, 61% of the municipal solid waste is recycled or composted.
38%
100% − 61% x 10 = 9.7
11
Category 3: Basic water services Indicator 7: Access to drinking water Principal: The proportion of the population with access to affordable safe drinking water. A lower Indicator score is given where the percentage is lower. How to calculate X = Percentage (%) of total urban population with access to potable drinking water.
Indicator 7 = 𝐗
𝟏𝟎
Where to get the data Many cities will have easy access to this data, which should be presented as %. Where city data are not known, a national figure may be used. WHO/UNICEF: Progress on Sanitation and Drinking Water 2013 update: http://www.who.int/water_sanitation_health/publications/2013/jmp_report/en/
Example Venlo: X = Access to drinking water = 100%
100
10 = 10
12
Indicator 8: Access to sanitation Principal: A measure of the percentage of the population covered by wastewater collection and treatment. A lower Indicator score is given where the percentage is lower. How to calculate X = Percentage (%) of total urban population with access to proper sanitation facilities.
Indicator 8 = 𝐗
𝟏𝟎
Where to get the data Many cities will have easy access to this data, which should be presented as %. Where city data are not known, a national figure may be used. Example Rotterdam: X = Access to sanitation = 97.3%
97.3
10 = 9.7
13
Indicator 9: Drinking water quality Principal: A measure of the level of compliance with local drinking water regulations. A lower Indicator score is given where compliance is lower. How to calculate The result is expressed as a percentage of the samples meeting the applicable standards. X = Total number of samples meeting standards Y = Total number of samples
Indicator 9 = 𝐗
𝐲 * 10
Where to get the data The city should normally have the data required to calculate. Example
Number of samples meeting standards: 999
Total number of samples: 1010
Score = (999/1010) x 10 = 9.89
14
Category 4: Wastewater treatment
Indicator 10: Nutrient recovery
Principal: Measure of the level of nutrient recovery from the wastewater system. How to calculate A. Wastewater treated with nutrient recovering techniques at the wastewater treatment plants (Mm3 year-1) B. Total volume of wastewater passing the wastewater treatment plants (Mm3 year-1)
Indicator 10 = 𝑨
𝑩 *
% 𝐬𝐞𝐜𝐨𝐧𝐝𝐚𝐫𝐲 𝐖𝐖𝐓 𝐜𝐨𝐯𝐞𝐫𝐚𝐠𝐞
100 * 10
Where to get the data OECD (2013) Organization for Economic Co-operation and Development: Environment at a glance 2013. OECD indicators. OECD Publishing. DOI: 10.1787/9789264185715-en. http://www.oecd-ilibrary.org/environment/environment-at-a-
glance-2013_9789264185715-en p. 96 Accessed 7 January 2015 Improvement in calculation method: Previously, in the city blueprint only water that entered the WWT facilities was considered as total volume of water. Hereby disregarding the city’s wastewater that is not treated at all. Therefore the City Blueprint scores are now multiplied by the share of WWT coverage. In this way the concept of urban metabolism is better represented. To measure the full potential of nutrient abstraction from all wastewater the above equation is applied.
15
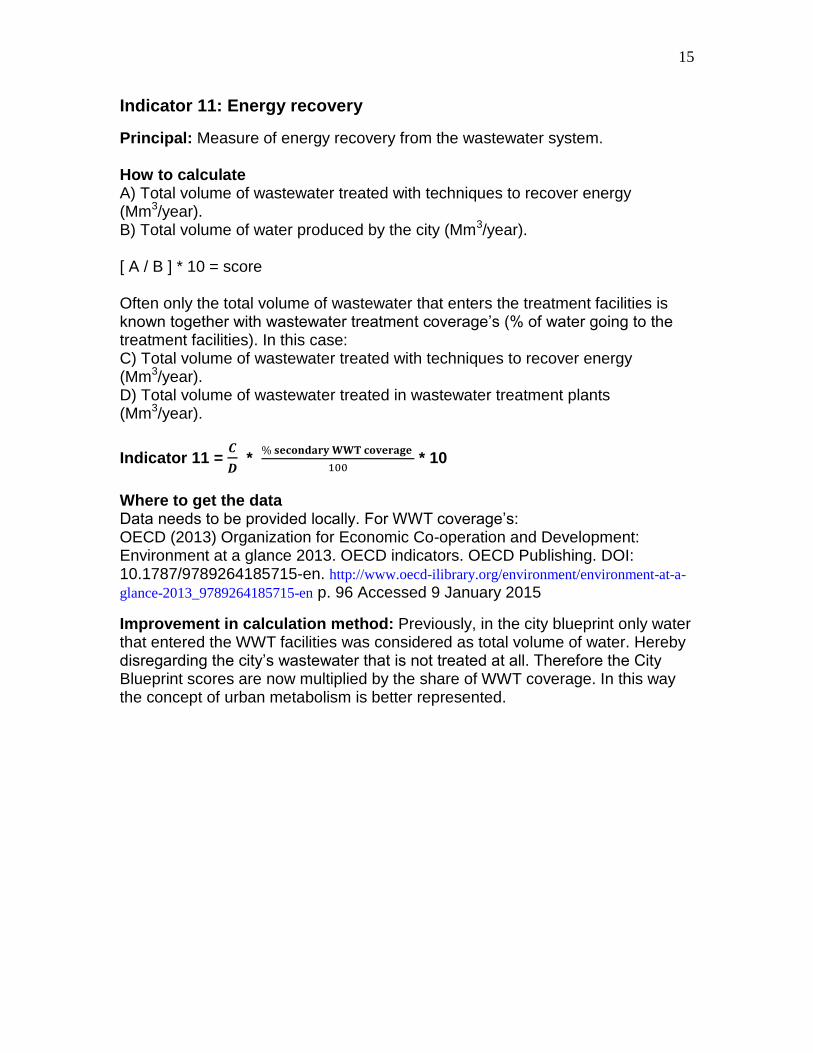
Indicator 11: Energy recovery
Principal: Measure of energy recovery from the wastewater system. How to calculate A) Total volume of wastewater treated with techniques to recover energy (Mm3/year). B) Total volume of water produced by the city (Mm3/year). [ A / B ] * 10 = score Often only the total volume of wastewater that enters the treatment facilities is known together with wastewater treatment coverage’s (% of water going to the treatment facilities). In this case: C) Total volume of wastewater treated with techniques to recover energy (Mm3/year). D) Total volume of wastewater treated in wastewater treatment plants (Mm3/year).
Indicator 11 = 𝑪
𝑫 *
% 𝐬𝐞𝐜𝐨𝐧𝐝𝐚𝐫𝐲 𝐖𝐖𝐓 𝐜𝐨𝐯𝐞𝐫𝐚𝐠𝐞
100 * 10
Where to get the data Data needs to be provided locally. For WWT coverage’s: OECD (2013) Organization for Economic Co-operation and Development: Environment at a glance 2013. OECD indicators. OECD Publishing. DOI: 10.1787/9789264185715-en. http://www.oecd-ilibrary.org/environment/environment-at-a-
glance-2013_9789264185715-en p. 96 Accessed 9 January 2015
Improvement in calculation method: Previously, in the city blueprint only water that entered the WWT facilities was considered as total volume of water. Hereby disregarding the city’s wastewater that is not treated at all. Therefore the City Blueprint scores are now multiplied by the share of WWT coverage. In this way the concept of urban metabolism is better represented.

16
Indicator 12: Sewage sludge recycling
Principal: A measure of the proportion of sewage sludge recycled or re-used. For example, it may be thermally processed and/or applied in agriculture. The decision whether or not to apply sewage sludge in agriculture depends on the levels of organic and inorganic micro-contaminants. Often, sewage sludge is contaminated and in many countries it is not allowed to apply sewage sludge in agriculture. Instead, the sludge is burned in waste destruction installations or as biomass in power plants for the generation of electricity. How to calculate A. Dry weight of sludge produced in wastewater treatment plants serving the city B. Dry weight of sludge going to landfill C. Dry weight of sludge thermally processed D. Dry weight of sludge disposed in agriculture E. Dry weight of sludge disposed by other means (As a check, A should = B + C + D +E)
Indicator 12 = 𝑪+𝑫
𝑨 *
% 𝐬𝐞𝐜𝐨𝐧𝐝𝐚𝐫𝐲 𝐖𝐖𝐓 𝐜𝐨𝐯𝐞𝐫𝐚𝐠𝐞
100 * 10
To measure the full potential of nutrient and energy recovery, it is specifically chosen to multiply the first term in the equation above with the percentage of secondary WWT coverage as secondary WWT produces much more sewage sludge than primary WWT. Where to get the data Data needs to be provided locally. For WWT coverage’s: OECD (2013) Organization for Economic Co-operation and Development: Environment at a glance 2013. OECD indicators. OECD Publishing. DOI: 10.1787/9789264185715-en. http://www.oecd-ilibrary.org/environment/environment-at-a-
glance-2013_9789264185715-en p. 96 Accessed 9 January 2015
Improvement in calculation method: Previously, in the city blueprint only water that entered the WWT facilities was considered as total volume of water. Hereby disregarding the city’s wastewater that is not treated at all. To measure the full potential of nutrient and energy recovery from wastewater by using wastewater abstracted sewage sludge, secondary WWT is incorporated in the calculation and not primary WWT. In this way the concept of urban metabolism is better represented. Example Scotland: A total sludge produced is 20030 tonnes dry DS/year (dry substance per year); B n.a.; C Zero tonnes DS/year is thermally processed; D 19520 tonnes DS/year is processed in agriculture; % secondary WWT coverage in Scotland is 97%. [ ( 0 + 19520 ) / 20030 ] x 0.97 x 10 = 9.45.

17
Indicator 13: Energy efficiency WWT Principal: A measure of the energy efficiency of the wastewater treatment. A lower Indicator score is given where efficiency measures are more limited. How to calculate This measure is unlikely to already have a value applied. Instead, apply a self-assessment based on the plans, measures and their implementation to improve the efficiency of wastewater treatment. Self-assessment based on information from public sources (national/regional/local policy document, reports and websites of actors (e.g. water companies, cities, provincial or national authorities).
Indicator 13 =
Indicator score
Assessment
0 no information is available on this subject
1 limited information is available in a national document
2 limited information is available in national and local documents
3 the topic is addressed in a chapter in a national document 4 the topic is addressed in a chapter at the national and local level 5 a local policy plan is provided in a publicly available document 6 as 5 and the topic is also addressed at the local website 7 plans are implemented and clearly communicated to the public 8 as 7 plus subsidies are made available to implement the plans 9 as 8 plus annual reports are provided on the progress of the implementation and/or any other
activity indicating that this is a very high priority implemented at the level of the local
community. 10 as 9 and the activity is in place for = 3 years
Where to get the data Local data sources can provide an adequate estimate.
18
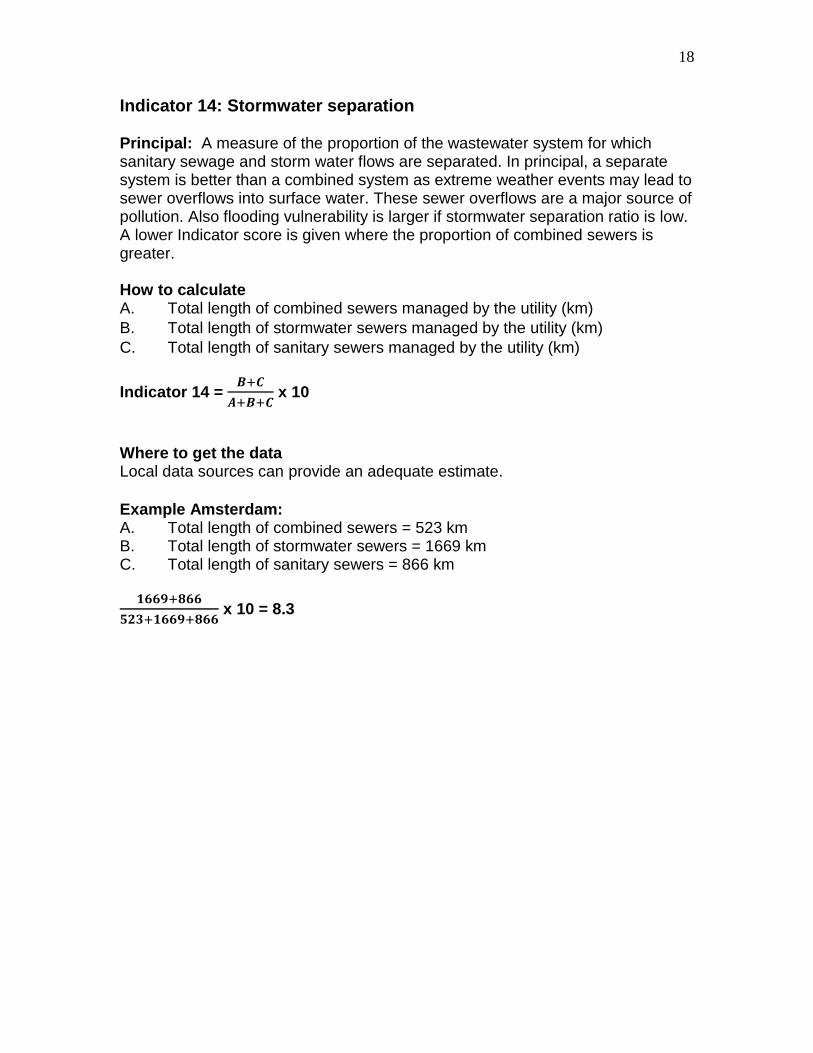
Indicator 14: Stormwater separation Principal: A measure of the proportion of the wastewater system for which sanitary sewage and storm water flows are separated. In principal, a separate system is better than a combined system as extreme weather events may lead to sewer overflows into surface water. These sewer overflows are a major source of pollution. Also flooding vulnerability is larger if stormwater separation ratio is low. A lower Indicator score is given where the proportion of combined sewers is greater. How to calculate A. Total length of combined sewers managed by the utility (km)
B. Total length of stormwater sewers managed by the utility (km)
C. Total length of sanitary sewers managed by the utility (km)
Indicator 14 = 𝑩+𝑪
𝑨+𝑩+𝑪 x 10
Where to get the data Local data sources can provide an adequate estimate.
Example Amsterdam: A. Total length of combined sewers = 523 km B. Total length of stormwater sewers = 1669 km C. Total length of sanitary sewers = 866 km
𝟏𝟔𝟔𝟗+𝟖𝟔𝟔
𝟓𝟐𝟑+𝟏𝟔𝟔𝟗+𝟖𝟔𝟔 x 10 = 8.3

19
Category 5: Infrastructure
Indicator 15: Average age sewer Principal: The age of the infrastructure for wastewater collection and distribution system is an important measure for the financial state of the UWCS. How to calculate The average age of the infrastructure is an indication of the commitment to regular system maintenance and replacement. The method compares the average age of the system to an arbitrarily maximum age of 60 years. Moreover, it is assumed that an age of <10 years receives a maximum score since younger systems generally well maintained.
X = Average age sewer
Indicator 15 = 𝟔𝟎−𝑿
𝟔𝟎−𝟏𝟎 x 10
NB. All values of x > 60 will lead to an indicator score of 0.
Where to get the data Local data sources can provide an adequate estimate. Improvement in calculation method: Previously, in the City Blueprint the average age was set on 100 years. Infrastructure refurbishment requirements obviously depend on age but this depends highly on subsoil, material used, etcetera. The differences in scores for this indicator appeared to be minimal because most sewers are much younger that the maximum age. Together with literature based estimates the average maximum age has now been set at 60 years. Moreover, it is assumed that a sewer with an age of <10 years is generally well maintained and should therefore receive a maximum score.
Example Amsterdam: The average age of the sewer system in Amsterdam is 28 years.
60−28
60−10 x 10 = 6.4 points.
20
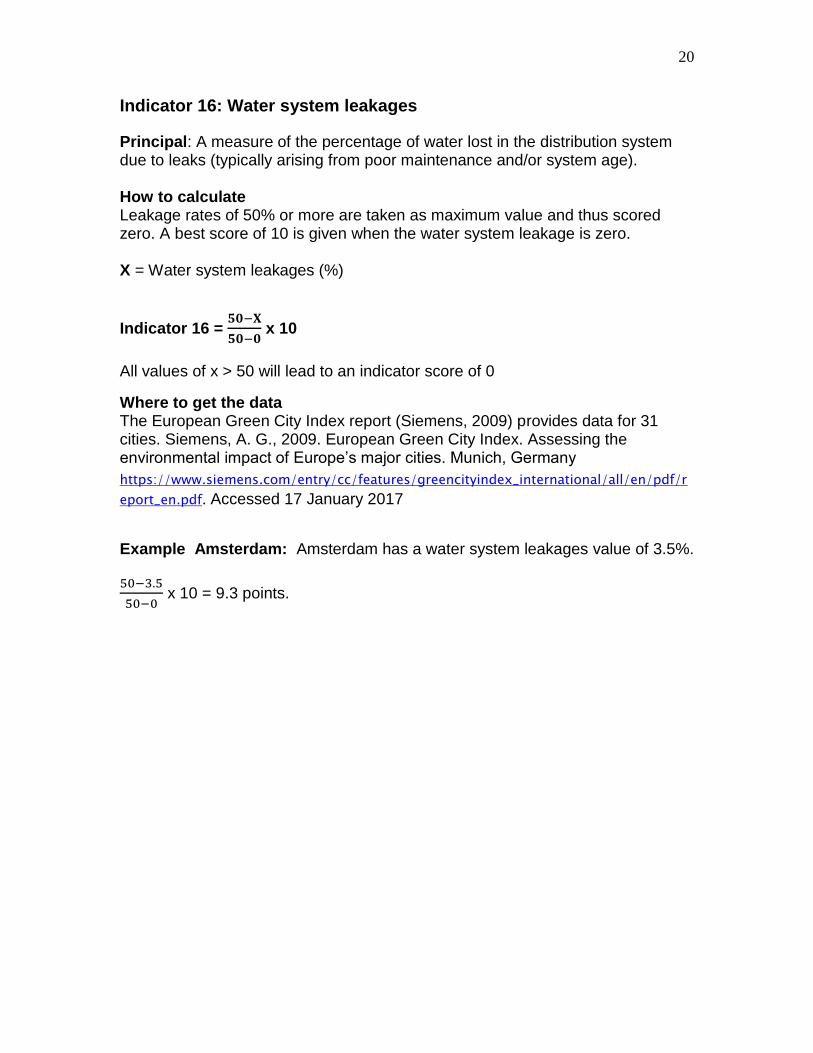
Indicator 16: Water system leakages
Principal: A measure of the percentage of water lost in the distribution system due to leaks (typically arising from poor maintenance and/or system age). How to calculate Leakage rates of 50% or more are taken as maximum value and thus scored zero. A best score of 10 is given when the water system leakage is zero. X = Water system leakages (%)
Indicator 16 = 𝟓𝟎−𝐗
𝟓𝟎−𝟎 x 10
All values of x > 50 will lead to an indicator score of 0
Where to get the data The European Green City Index report (Siemens, 2009) provides data for 31 cities. Siemens, A. G., 2009. European Green City Index. Assessing the environmental impact of Europe’s major cities. Munich, Germany
https://www.siemens.com/entry/cc/features/greencityindex_international/all/en/pdf/r
eport_en.pdf. Accessed 17 January 2017
Example Amsterdam: Amsterdam has a water system leakages value of 3.5%. 50−3.5
50−0 x 10 = 9.3 points.

21
Indicator 17: Operating costs recovery (ratio)
Principal: Measure of revenue and cost balance of operating costs of water
services. A higher ratio means that there is more money available to invest in
water services, e.g. infrastructure maintenance or infrastructure separation.
How to calculate
Only the operational cost and revenues for Domestic water supply and sanitation
services are included.
Operating cost recovery (ratio) = Total annual operational revenues
Total annual operating costs
Definitions:
Total annual operational revenues: Total annual income from tariffs and charges
for drinking water and sanitation services (US$ or any other currency/year).
Total annual operating costs: Total annual operational expenditures for drinking
water and sanitation services (US$ or any other currency/year).
If the ratio is >1 than there is no 100% coverage of operating costs. However,
ratios <1 are often applied at utilities. This means that there is more than a 100%
coverage in many cases (Figure 7.3.1).
Fig. 7.3.1 Operating cost recovery ratio for all 117 countries available (ib-net.org). Note that the
majority of the countries have more than 100% operating cost recovery (which is a ratio of 1).
Of the operating cost recovery ratio’s for all countries available (shown in Figure
7.3.1) the highest and lowest 10% are averages and used as minimum and
maximum value to rescale the operating cost recovery ratio’s to a score between
0 and 10 points. The minimum and maximum are respectively 0.33 and 2.34. The
0
1
2
3
0 20 40 60 80 100 120
Op
erat
ing
cost
re
cove
ry
(rat
io)
Country rank
22
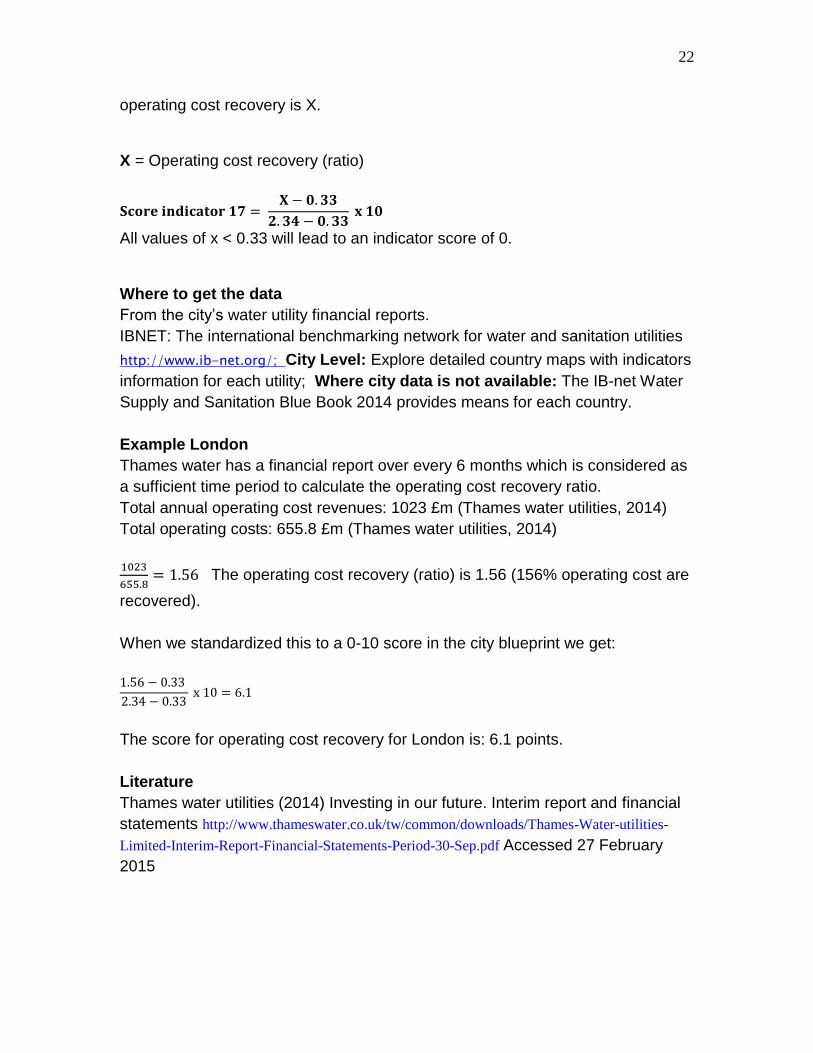
operating cost recovery is X.
X = Operating cost recovery (ratio)
𝐒𝐜𝐨𝐫𝐞 𝐢𝐧𝐝𝐢𝐜𝐚𝐭𝐨𝐫 𝟏𝟕 = 𝐗 − 𝟎. 𝟑𝟑
𝟐. 𝟑𝟒 − 𝟎. 𝟑𝟑 𝐱 𝟏𝟎
All values of x < 0.33 will lead to an indicator score of 0.
Where to get the data
From the city’s water utility financial reports.
IBNET: The international benchmarking network for water and sanitation utilities
http://www.ib-net.org/; City Level: Explore detailed country maps with indicators
information for each utility; Where city data is not available: The IB-net Water
Supply and Sanitation Blue Book 2014 provides means for each country.
Example London
Thames water has a financial report over every 6 months which is considered as
a sufficient time period to calculate the operating cost recovery ratio.
Total annual operating cost revenues: 1023 £m (Thames water utilities, 2014)
Total operating costs: 655.8 £m (Thames water utilities, 2014)
1023
655.8= 1.56 The operating cost recovery (ratio) is 1.56 (156% operating cost are
recovered).
When we standardized this to a 0-10 score in the city blueprint we get:
1.56 − 0.33
2.34 − 0.33 x 10 = 6.1
The score for operating cost recovery for London is: 6.1 points.
Literature
Thames water utilities (2014) Investing in our future. Interim report and financial
statements http://www.thameswater.co.uk/tw/common/downloads/Thames-Water-utilities-
Limited-Interim-Report-Financial-Statements-Period-30-Sep.pdf Accessed 27 February
2015
23
Category 6: Climate robustness
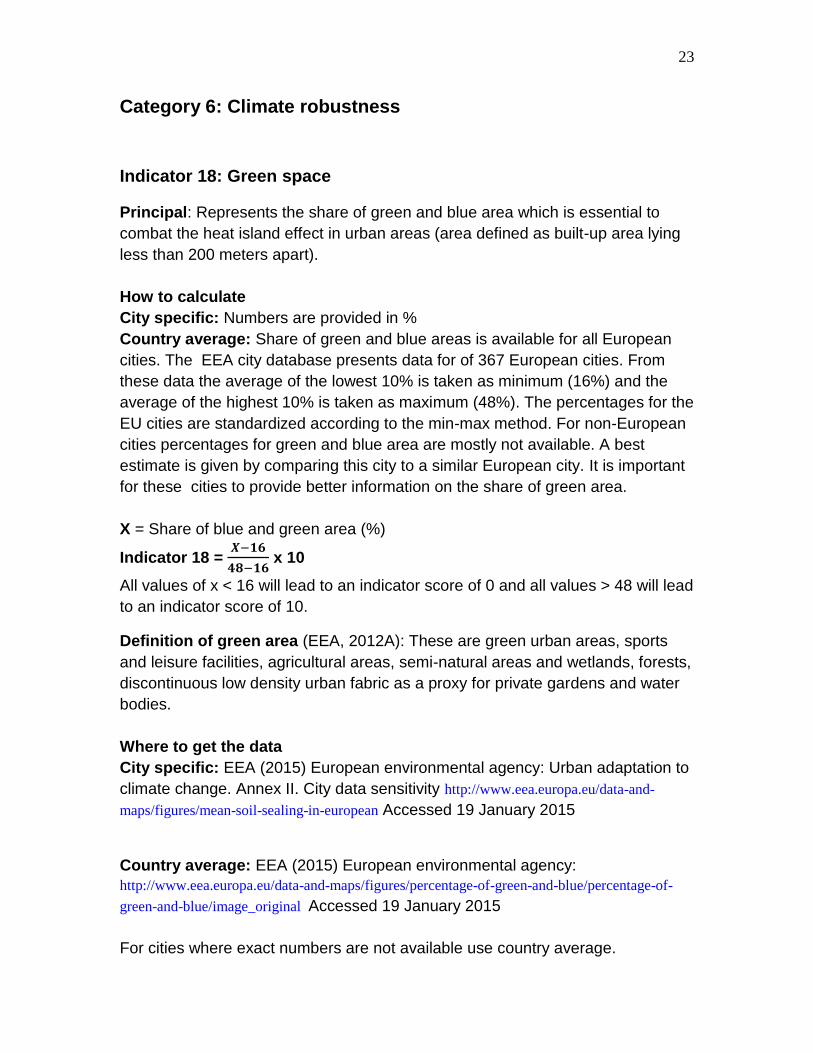
Indicator 18: Green space
Principal: Represents the share of green and blue area which is essential to
combat the heat island effect in urban areas (area defined as built-up area lying
less than 200 meters apart).
How to calculate
City specific: Numbers are provided in %
Country average: Share of green and blue areas is available for all European
cities. The EEA city database presents data for of 367 European cities. From
these data the average of the lowest 10% is taken as minimum (16%) and the
average of the highest 10% is taken as maximum (48%). The percentages for the
EU cities are standardized according to the min-max method. For non-European
cities percentages for green and blue area are mostly not available. A best
estimate is given by comparing this city to a similar European city. It is important
for these cities to provide better information on the share of green area.
X = Share of blue and green area (%)
Indicator 18 = 𝑿−𝟏𝟔
𝟒𝟖−𝟏𝟔 x 10
All values of x < 16 will lead to an indicator score of 0 and all values > 48 will lead
to an indicator score of 10.
Definition of green area (EEA, 2012A): These are green urban areas, sports
and leisure facilities, agricultural areas, semi-natural areas and wetlands, forests,
discontinuous low density urban fabric as a proxy for private gardens and water
bodies.
Where to get the data
City specific: EEA (2015) European environmental agency: Urban adaptation to
climate change. Annex II. City data sensitivity http://www.eea.europa.eu/data-and-
maps/figures/mean-soil-sealing-in-european Accessed 19 January 2015
Country average: EEA (2015) European environmental agency:
http://www.eea.europa.eu/data-and-maps/figures/percentage-of-green-and-blue/percentage-of-
green-and-blue/image_original Accessed 19 January 2015
For cities where exact numbers are not available use country average.

24
Example Venlo: For Maastricht the share of green and blue area is 24,3%. The
mean highest 10% of green and blue area measured by the EEA is 48%. The
mean lowest 10% of green space measured by the EEA is 16%. With min-max
transformation the score for Maastricht becomes:
24.3−16
48−16 x 10 = 2.6 points

25
Indicator 19: Climate adaptation
Principal: A measure of the level of action taken to adapt to climate change
threats. A lower Indicator score is given where actions or commitments are more
limited.
How to calculate
This measure is unlikely to already have a value applied. Instead, apply a self-
assessment of the measures and their implementation to protect citizens against
flooding and water scarcity related to climate change (e.g. green roofs, rainwater
harvesting, safety plans etc.). Self-assessment based on information from public
sources (national / regional / local policy document, reports and websites of
actors (e.g. water companies, cities, provincial or national authorities).
Indicator score
Assessment 0 no information is available on this subject
1 limited information is available in a national document
2 limited information is available in national and local documents
3 the topic is addressed in a chapter in a national document
4 the topic is addressed in a chapter at the national and local level
5 a local policy plan is provided in a publicly available document
6 as 5 and the topic is also addressed at the local website
7 plans are implemented and clearly communicated to the public
8 as 7 plus subsidies are made available to implement the plans
9 as 8 plus annual reports are provided on the progress of the implementation
and/or any other activity indicating that this is a very high priority implemented at
the level of the local community.
10 as 9 and the activity is in place for = 3 years
Where to get the data
Various data sources can be used for this assessment.
26
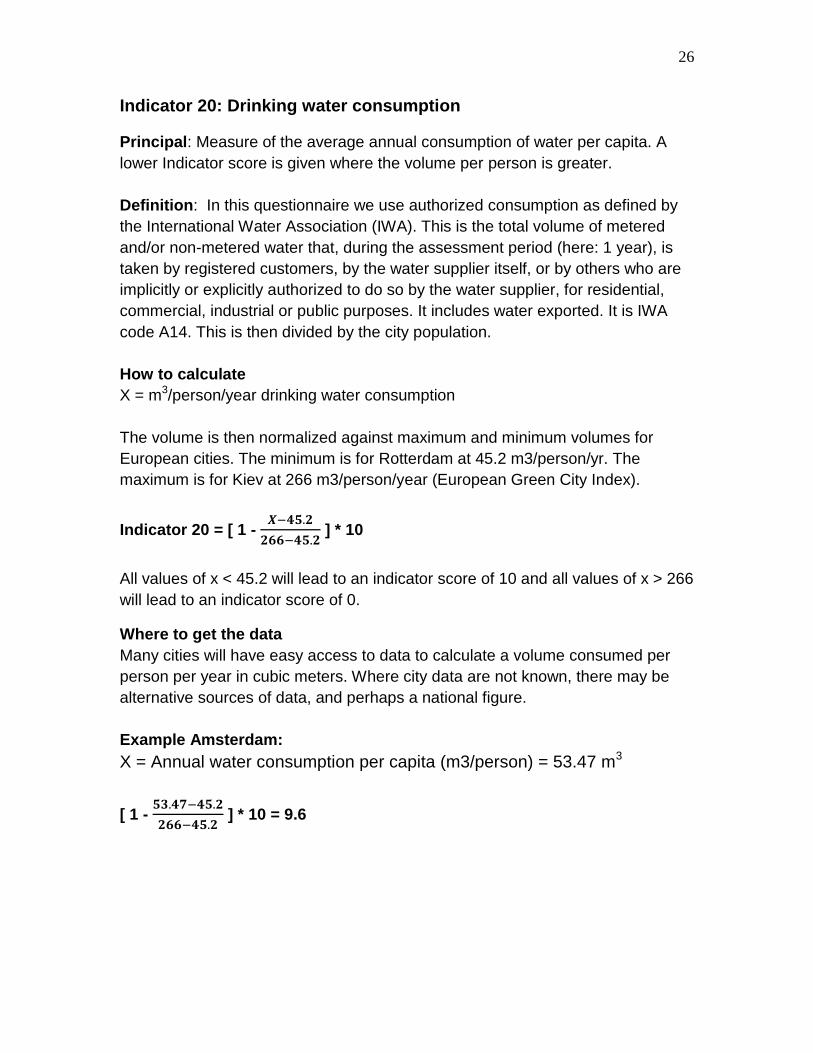
Indicator 20: Drinking water consumption
Principal: Measure of the average annual consumption of water per capita. A
lower Indicator score is given where the volume per person is greater.
Definition: In this questionnaire we use authorized consumption as defined by
the International Water Association (IWA). This is the total volume of metered
and/or non-metered water that, during the assessment period (here: 1 year), is
taken by registered customers, by the water supplier itself, or by others who are
implicitly or explicitly authorized to do so by the water supplier, for residential,
commercial, industrial or public purposes. It includes water exported. It is IWA
code A14. This is then divided by the city population.
How to calculate
X = m3/person/year drinking water consumption
The volume is then normalized against maximum and minimum volumes for
European cities. The minimum is for Rotterdam at 45.2 m3/person/yr. The
maximum is for Kiev at 266 m3/person/year (European Green City Index).
Indicator 20 = [ 1 - 𝑿−𝟒𝟓.𝟐
𝟐𝟔𝟔−𝟒𝟓.𝟐 ] * 10
All values of x < 45.2 will lead to an indicator score of 10 and all values of x > 266
will lead to an indicator score of 0.
Where to get the data
Many cities will have easy access to data to calculate a volume consumed per
person per year in cubic meters. Where city data are not known, there may be
alternative sources of data, and perhaps a national figure.
Example Amsterdam:
X = Annual water consumption per capita (m3/person) = 53.47 m3
[ 1 - 𝟓𝟑.𝟒𝟕−𝟒𝟓.𝟐
𝟐𝟔𝟔−𝟒𝟓.𝟐 ] * 10 = 9.6
27
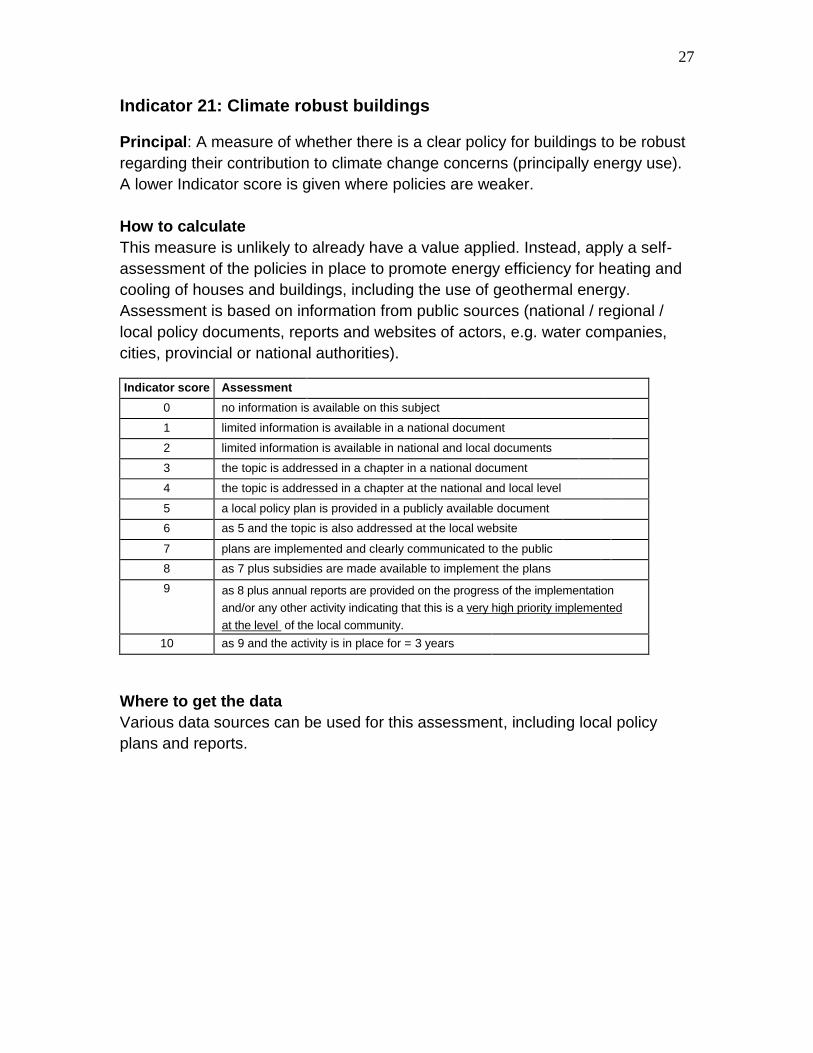
Indicator 21: Climate robust buildings
Principal: A measure of whether there is a clear policy for buildings to be robust
regarding their contribution to climate change concerns (principally energy use).
A lower Indicator score is given where policies are weaker.
How to calculate
This measure is unlikely to already have a value applied. Instead, apply a self-
assessment of the policies in place to promote energy efficiency for heating and
cooling of houses and buildings, including the use of geothermal energy.
Assessment is based on information from public sources (national / regional /
local policy documents, reports and websites of actors, e.g. water companies,
cities, provincial or national authorities).
Indicator score Assessment
0 no information is available on this subject
1 limited information is available in a national document
2 limited information is available in national and local documents
3 the topic is addressed in a chapter in a national document
4 the topic is addressed in a chapter at the national and local level
5 a local policy plan is provided in a publicly available document
6 as 5 and the topic is also addressed at the local website
7 plans are implemented and clearly communicated to the public
8 as 7 plus subsidies are made available to implement the plans
9 as 8 plus annual reports are provided on the progress of the implementation
and/or any other activity indicating that this is a very high priority implemented
at the level of the local community.
10 as 9 and the activity is in place for = 3 years
Where to get the data
Various data sources can be used for this assessment, including local policy
plans and reports.
28
Category 7: Governance
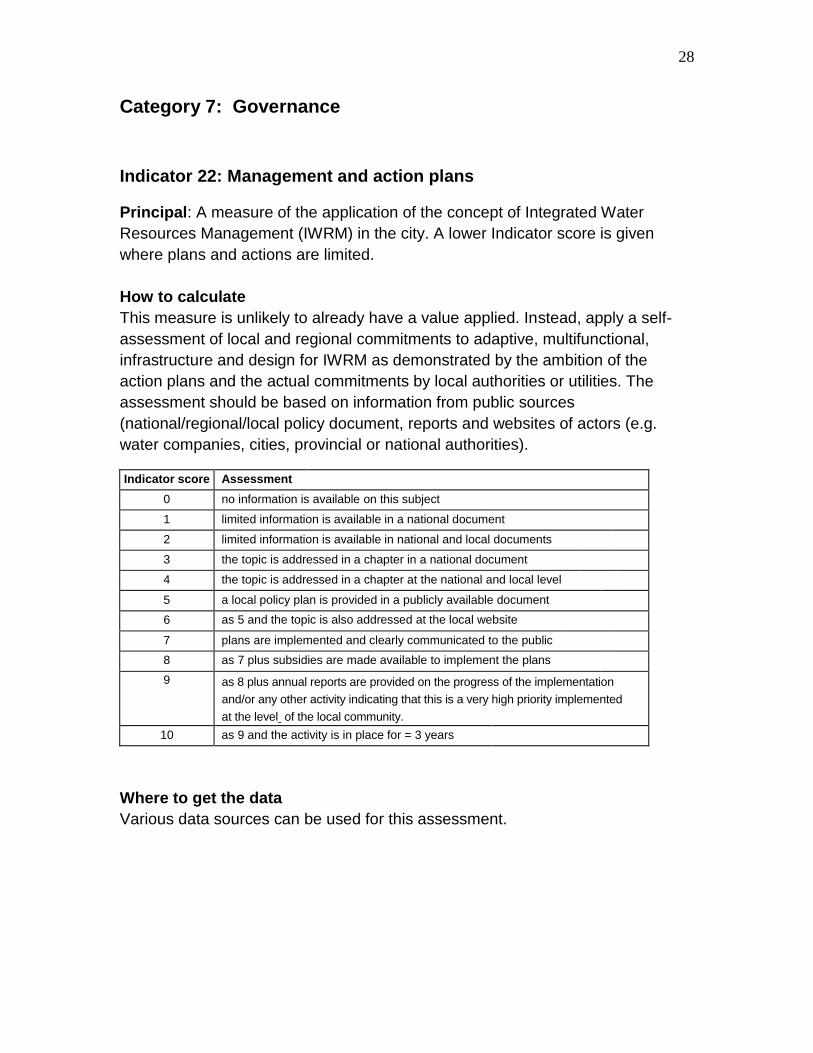
Indicator 22: Management and action plans
Principal: A measure of the application of the concept of Integrated Water
Resources Management (IWRM) in the city. A lower Indicator score is given
where plans and actions are limited.
How to calculate
This measure is unlikely to already have a value applied. Instead, apply a self-
assessment of local and regional commitments to adaptive, multifunctional,
infrastructure and design for IWRM as demonstrated by the ambition of the
action plans and the actual commitments by local authorities or utilities. The
assessment should be based on information from public sources
(national/regional/local policy document, reports and websites of actors (e.g.
water companies, cities, provincial or national authorities).
Indicator score Assessment
0 no information is available on this subject
1 limited information is available in a national document
2 limited information is available in national and local documents
3 the topic is addressed in a chapter in a national document
4 the topic is addressed in a chapter at the national and local level
5 a local policy plan is provided in a publicly available document
6 as 5 and the topic is also addressed at the local website
7 plans are implemented and clearly communicated to the public
8 as 7 plus subsidies are made available to implement the plans
9 as 8 plus annual reports are provided on the progress of the implementation
and/or any other activity indicating that this is a very high priority implemented
at the level of the local community.
10 as 9 and the activity is in place for = 3 years
Where to get the data
Various data sources can be used for this assessment.
29
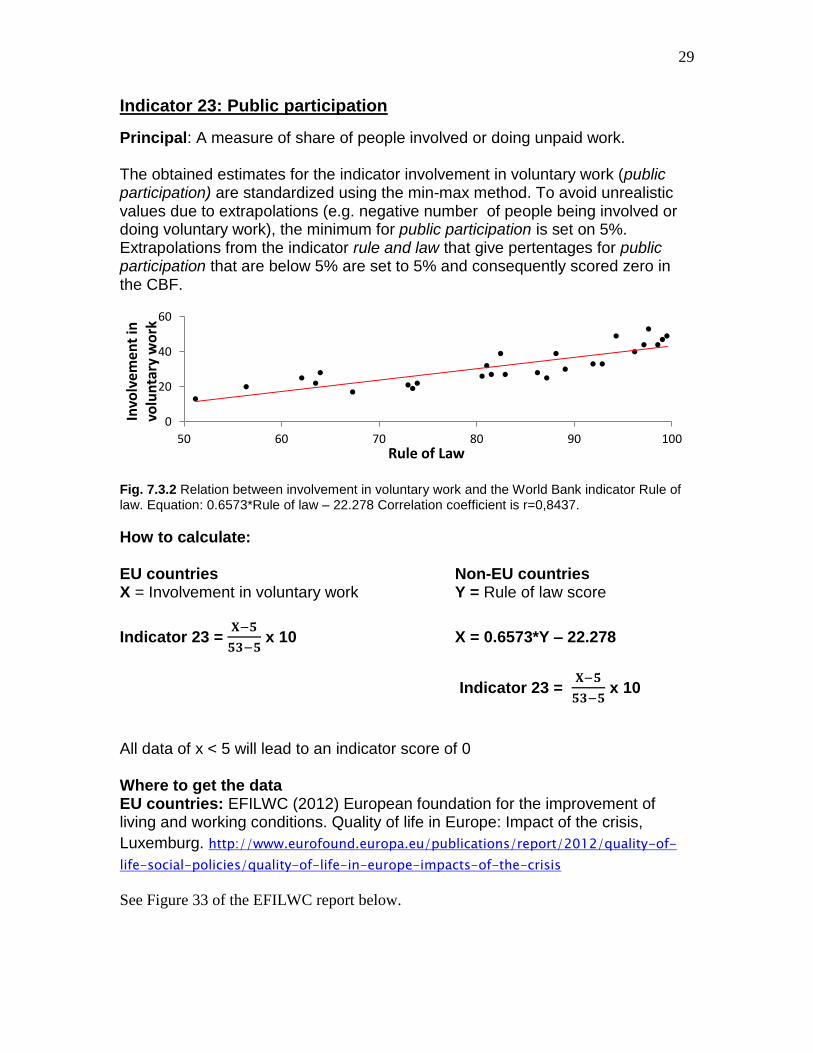
Indicator 23: Public participation
Principal: A measure of share of people involved or doing unpaid work. The obtained estimates for the indicator involvement in voluntary work (public participation) are standardized using the min-max method. To avoid unrealistic values due to extrapolations (e.g. negative number of people being involved or doing voluntary work), the minimum for public participation is set on 5%. Extrapolations from the indicator rule and law that give pertentages for public participation that are below 5% are set to 5% and consequently scored zero in the CBF.
Fig. 7.3.2 Relation between involvement in voluntary work and the World Bank indicator Rule of law. Equation: 0.6573*Rule of law – 22.278 Correlation coefficient is r=0,8437.
How to calculate: EU countries Non-EU countries X = Involvement in voluntary work Y = Rule of law score
Indicator 23 = 𝐗−𝟓
𝟓𝟑−𝟓 x 10 X = 0.6573*Y – 22.278
Indicator 23 = 𝐗−𝟓
𝟓𝟑−𝟓 x 10
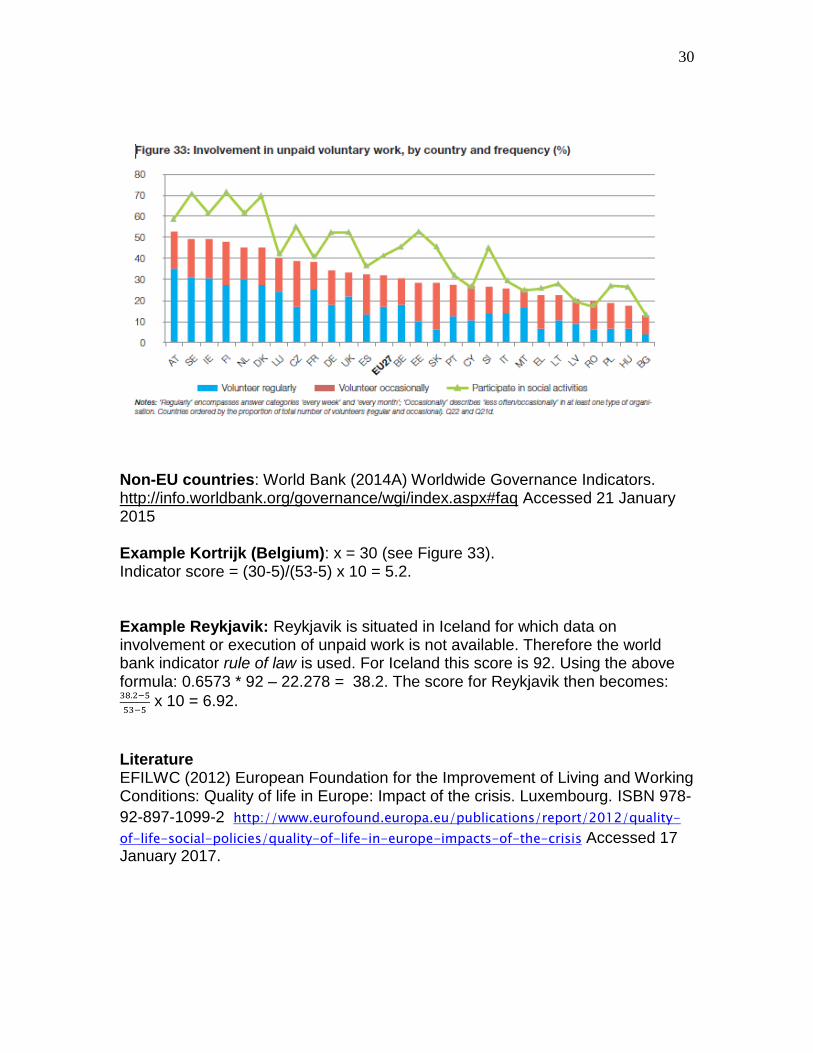
All data of x < 5 will lead to an indicator score of 0 Where to get the data EU countries: EFILWC (2012) European foundation for the improvement of living and working conditions. Quality of life in Europe: Impact of the crisis,
Luxemburg. http://www.eurofound.europa.eu/publications/report/2012/quality-of-
life-social-policies/quality-of-life-in-europe-impacts-of-the-crisis
See Figure 33 of the EFILWC report below.
0
20
40
60
50 60 70 80 90 100
Invo
lvem
ent
in
volu
nta
ry w
ork
Rule of Law
30
Non-EU countries: World Bank (2014A) Worldwide Governance Indicators. http://info.worldbank.org/governance/wgi/index.aspx#faq Accessed 21 January 2015 Example Kortrijk (Belgium): x = 30 (see Figure 33). Indicator score = (30-5)/(53-5) x 10 = 5.2. Example Reykjavik: Reykjavik is situated in Iceland for which data on involvement or execution of unpaid work is not available. Therefore the world bank indicator rule of law is used. For Iceland this score is 92. Using the above formula: 0.6573 * 92 – 22.278 = 38.2. The score for Reykjavik then becomes: 38.2−5
53−5 x 10 = 6.92.
Literature EFILWC (2012) European Foundation for the Improvement of Living and Working Conditions: Quality of life in Europe: Impact of the crisis. Luxembourg. ISBN 978-
92-897-1099-2 http://www.eurofound.europa.eu/publications/report/2012/quality-
of-life-social-policies/quality-of-life-in-europe-impacts-of-the-crisis Accessed 17 January 2017.
31
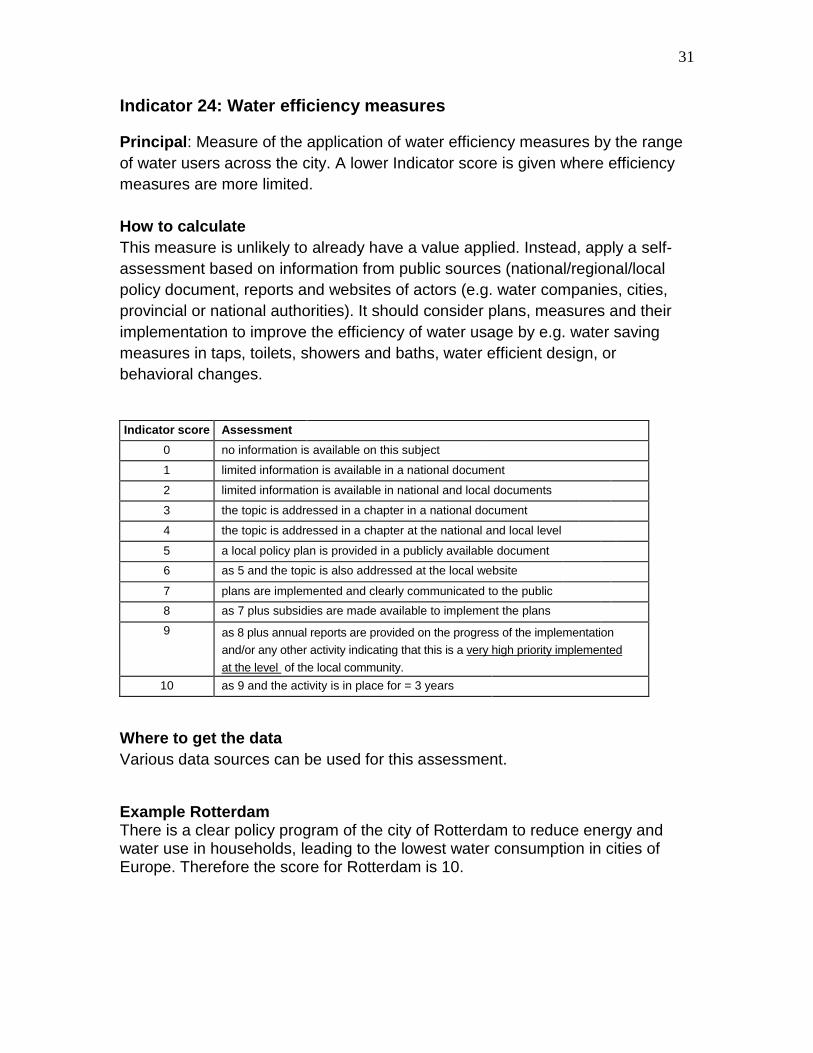
Indicator 24: Water efficiency measures
Principal: Measure of the application of water efficiency measures by the range
of water users across the city. A lower Indicator score is given where efficiency
measures are more limited.
How to calculate
This measure is unlikely to already have a value applied. Instead, apply a self-
assessment based on information from public sources (national/regional/local
policy document, reports and websites of actors (e.g. water companies, cities,
provincial or national authorities). It should consider plans, measures and their
implementation to improve the efficiency of water usage by e.g. water saving
measures in taps, toilets, showers and baths, water efficient design, or
behavioral changes.
Indicator score Assessment
0 no information is available on this subject
1 limited information is available in a national document
2 limited information is available in national and local documents
3 the topic is addressed in a chapter in a national document
4 the topic is addressed in a chapter at the national and local level
5 a local policy plan is provided in a publicly available document
6 as 5 and the topic is also addressed at the local website
7 plans are implemented and clearly communicated to the public
8 as 7 plus subsidies are made available to implement the plans
9 as 8 plus annual reports are provided on the progress of the implementation
and/or any other activity indicating that this is a very high priority implemented
at the level of the local community.
10 as 9 and the activity is in place for = 3 years
Where to get the data
Various data sources can be used for this assessment.
Example Rotterdam There is a clear policy program of the city of Rotterdam to reduce energy and water use in households, leading to the lowest water consumption in cities of Europe. Therefore the score for Rotterdam is 10.
32
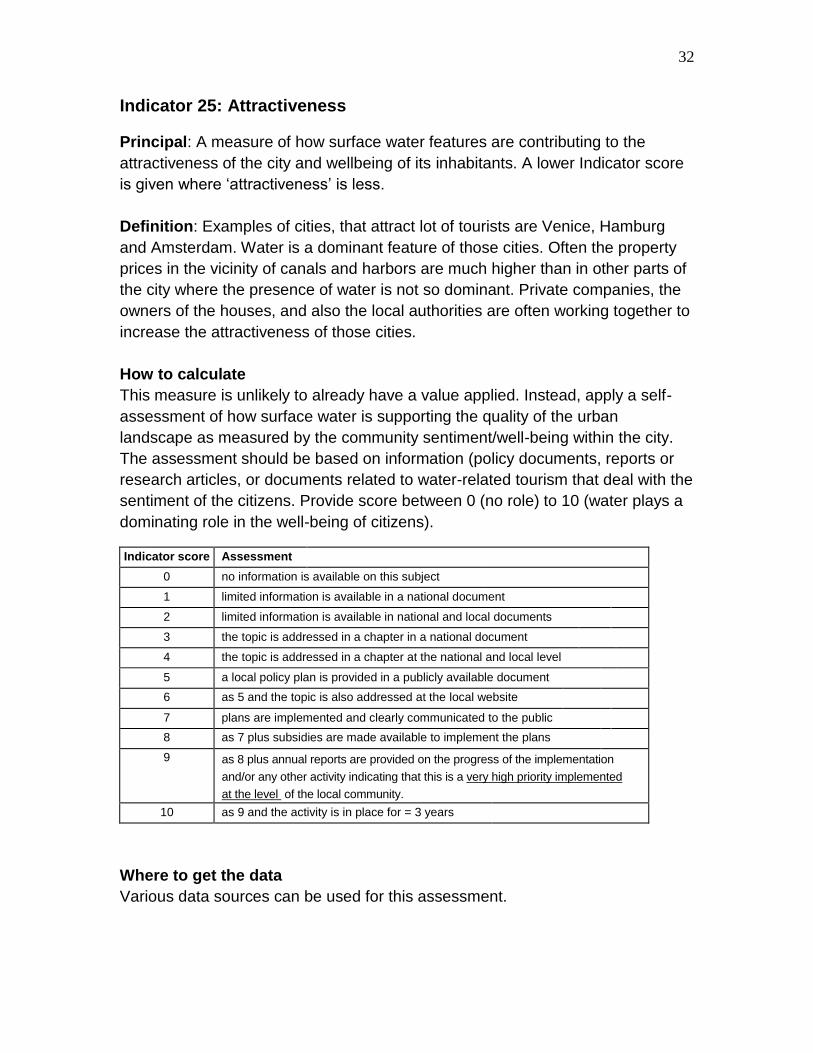
Indicator 25: Attractiveness
Principal: A measure of how surface water features are contributing to the
attractiveness of the city and wellbeing of its inhabitants. A lower Indicator score
is given where ‘attractiveness’ is less.
Definition: Examples of cities, that attract lot of tourists are Venice, Hamburg
and Amsterdam. Water is a dominant feature of those cities. Often the property
prices in the vicinity of canals and harbors are much higher than in other parts of
the city where the presence of water is not so dominant. Private companies, the
owners of the houses, and also the local authorities are often working together to
increase the attractiveness of those cities.
How to calculate
This measure is unlikely to already have a value applied. Instead, apply a self-
assessment of how surface water is supporting the quality of the urban
landscape as measured by the community sentiment/well-being within the city.
The assessment should be based on information (policy documents, reports or
research articles, or documents related to water-related tourism that deal with the
sentiment of the citizens. Provide score between 0 (no role) to 10 (water plays a
dominating role in the well-being of citizens).
Indicator score Assessment
0 no information is available on this subject
1 limited information is available in a national document
2 limited information is available in national and local documents
3 the topic is addressed in a chapter in a national document
4 the topic is addressed in a chapter at the national and local level
5 a local policy plan is provided in a publicly available document
6 as 5 and the topic is also addressed at the local website
7 plans are implemented and clearly communicated to the public
8 as 7 plus subsidies are made available to implement the plans
9 as 8 plus annual reports are provided on the progress of the implementation
and/or any other activity indicating that this is a very high priority implemented
at the level of the local community.
10 as 9 and the activity is in place for = 3 years
Where to get the data
Various data sources can be used for this assessment.