indicators of pension benefits of social security … indicators of pension benefits of social...
TRANSCRIPT
1
Indicators of Pension Benefits of Social Security State-plans in Mexico1
(October 2012)
Martha Miranda-Muñoz2 (Actuary, PhD) and Alejandra Feregrino-Ramirez, Inter American Conference on Social Security (CISS)
Abstract
Public sector pension plans tend to offer more generous pensions in comparison to those
provided by national systems; they also have lower funding and have higher liabilities. This
paper is aimed at examining pension benefits of public pension plans in Mexico. We review
the pension rules of the most representative state-plans in the 32 states to construct two
indicators of pension benefits across the distribution of salaries. The first indicator,
replacement rate, has the purpose of providing an idea of pension benefits’ adequacy. The
second indicator, pension wealth, has the purpose of informing about the approximate value
of the pension debt incurred by the state-plan. Both indicators are constructed using a
methodology inspired by OECD models. The results show that the average replacement
rate for public sector workers is 79%. Replacement rates are higher in defined benefit (DB)
state-plans than in defined contribution (DC) plans. Average pension wealth across states is
16.4 times the last annual salary. Women tend to have slightly lower replacement rates and
a higher pension wealth.
Keywords: pension benefits of state plans, replacement rate, pension wealth, Mexico
1 Paper presented at the Colloquia of the International Actuarial Association (ASTIN, AFIR/ERM and IAALS) in Mexico City, October 2012. 2 Corresponding author; contact address: San Ramón s/n, Col. San Jeronimo Lidice, Mexico DF, CP 10100. email: [email protected] and [email protected]. We would like to thank the comments by Gabriel Martinez and the research assistance provided by Genaro Cortez Aguilar, Cristian Hernandez Viveros, Alba Miranda Leyva, Ana Laura Mejia Ruiz and Diana Mendoza Gomez.
2
1 Introduction
In most countries, public sector workers (civil servants and other public sector employees
in the military, education, publicly owned enterprises, etc.) have separate pension schemes
which have not been as studied as national pension schemes (for private sector
employees).3 Among the reasons that have been identified to justify the separation of
pensions for both public and private sector workers are: making a career in the public sector
stable and attractive; shifting the cost of remunerating public servants into the future; and
retiring older civil servants in a politically and socially acceptable way. However, in
comparison to national pension plans, public sector pension plans tend to offer more
generous pensions, have lower funding and have higher liabilities. Public sector pensions in
a number of countries are becoming a large fiscal burden which may threaten the operation
of other public programs, especially in countries with a low tax base (Palacios and
Whitehouse 2006, OECD 2007).
This paper is aimed at examining pension benefits of state plans in Mexico. In this
country, there is concern about the financial situation of public sector pensions due to the
lack of information for properly assessing the magnitude of the incurred debt (Aguirre
2012, Vasquez Colmenares 2012, Santin Quiroz 2009). According to Farell (2009); most
social security public pension plans in Mexico are in actuarial deficit since their creation as
contributions (cuotas y aportaciones) that were stated by law were insufficient to face
obligations. This envisages an increasing level of unfunded liabilities due to population
aging, financial crisis and inadequate investment of reserves.
3 In some countries, national pension schemes may also include some groups of public sector workers, the self-employed, etc. (See Palacios 2006).
3
Pensions for public sector workers in Mexico mainly include heterogenous plans for
state owned enterprises (paraestatales) and local governments (estados and municipios).
Some public sector workers are entitled to pension benefits provided by Instituto Mexicano
del Seguro Social4 (IMSS), others receive benefits from Instituto de Seguridad Social para
los Trabajadores del Estado (the federal ISSSTE). In addition, pension provision for
employees of subnational governments is decentralized; the states (and some
municipalities) operate state-plans which can be managed either by “local ISSSTE’s”5 or
within the administrative structure of the local government (Martinez 2009, Vazquez-
Colmenares 2012). In Mexico, in contrast to what happens in other countries, these special
regimes for public sector workers are not linked with the general regime or national pension
scheme.6
Aguirre-Farias (2012) documented that inadequate eligibility requirements are
among the main causes for the financial disequilibria in public sector pension plans (in
most of them the key aspect is having contributed for a small number of years instead of
having reached a reasonable pensionable age), as well as the inexistence of capped
pensionable salaries and rules for the accumulation of reserves. The author shows an
actuarial deficit for accrued liabilities of all public sector pension plans equivalent to
around 120% of the GDP.
Given the need to further assess the situation of pension plans for public sector
workers in Mexico, in this paper we construct two indicators of pension benefits which
have been used in the literature for the purpose of monitoring with a perspective of fairness
and financial sustainability (OECD 2009 and 2011, CISS 2011). The first indicator,
4 Art. 123 of the Mexican Constitution, Apartados A, B. 5 For example: ISSSTESON in Sonora, ISSTEZAC in Zacatecas, ISSEG in Guanajuato, among others. 6 See Palacios and Whitehouse (2006).
4
replacement rate, shows the value of the pension in relation to an earnings measure, and
thus, says something about adequacy (do pensioners have acceptable standards of living,
measured with respect to an income of reference?). The second indicator, pension wealth,
shows the present value of expected pension benefits, and thus provides an indication of the
amount of debt incurred by public pension plans at the moment of retirement. Both
indicators are constructed based on the methodology used by the OECD.
The main questions that are addressed in this paper are: What is the indicator of
average pension benefits of state plans in Mexico? What is the variation of expected
pension benefits according to the level of salary, and type of pension plan (DB, DC or
mixed)? Which states have the highest and lowest replacement rates and pension wealth?
The results show that the average replacement rate across states in Mexico is 79.3%.
States with DB and mixed plans have higher average replacement rates (87 and 101,
respectively). Average pension wealth across the distribution of salaries in all states is 16.4
times the last annual salary. When looking at this indicator with respect to type of pension
plan, it is 16.9 in mixed, 15.1 in DC and 17.3 in DB plans.
The rest of the paper is organized as follows: Section 2 describes the methodology,
assumptions, and data used for modeling pension benefits. Section 3 presents the results of
our calculations of indicators of pension benefits, and Section 4 concludes.
2 Methodology and Assumptions
We look at prospective individual old-age pension entitlements for the most representative
state-plans in the 32 Mexican states.7 Once we obtain individual prospective old-age
pension benefits, we construct two main indicators of retirement income. The indicators are
7 If there is a non-contributive pension in operation in a state, for which public sector workers may be eligible, these benefits are not included in the analysis.
5
replacement rates, defined as the ratio of pension benefits to individual pre-retirement
salaries, and pension wealth, defined as the present value of pension benefits from the
moment the individual reaches the statutory pensionable age and for the remaining of his or
her life. Pension wealth is a more comprehensive measure of pension entitlements than a
replacement rate as it considers other variables such as pensionable age, life expectancy and
indexation of pensions. These indicators show how old-age pension entitlements vary
across the salary distribution in a range of 50% of the average salary to 5 times the average
salary.
In the baseline scenario, we make the assumption of having uninterrupted labor
market careers from the age of 20 until reaching the statutory pensionable age. This
assumption, which is used in OECD models, is not quite realistic for developing countries
with an informal labor market. We also construct a second scenario, in which state pension
plans are received when the eligibility condition of having a minimum number of
contributed years is met. By having these two scenarios, being retired either when statutory
retirement age is reached, or when the minimum number of contributed years is met, we
can have an idea of the maximum and the minimum values taken by the indicators.
Assumptions
The calculation of pension benefits focuses on a single worker that enters the labor market
in 2011 at the age of 20 and makes uninterrupted contributions to the state pension plan
until reaching the statutory pensionable age. This means that we consider a career length of
40 years if the pensionable age is 60, for example. We neither model benefits of dependants
nor invalidity or survivorship benefits.
6
A single set of economic variables is assumed for the projection of salaries and the
calculation of pension benefits. A standard set of assumptions allows controlling for
economic conditions and focusing on differences in pension policy for public sector
workers across states. The baseline assumptions are:
• Price inflation: 4% per year.
• Real salary growth: 1% per year
• Real minimum salary growth: 0.25% per year
• Real rate of return after administrative charges on funded, defined-contribution
pensions: 3.5% per year.
• Discount rate: 3% per year.
• Mortality rates: At the national level: United Nations. At the state level: own
calculations of life expectancy based on projections by CONAPO.
Data
Pension rules and background information for each state-plan as of 2010 can be found in
CONSAR (2012) and CESOP-Camara de Diputados (2010); we assume the pension rules
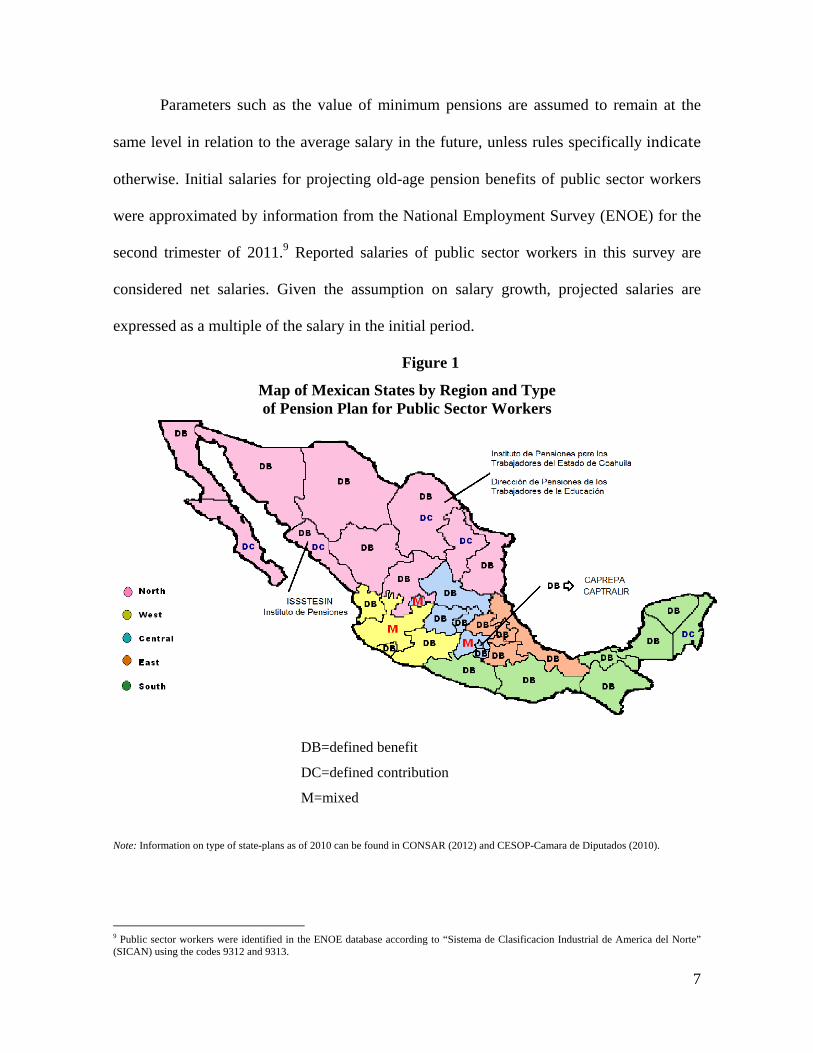
that prevailed in 2010 will be valid in the future. Figure 1 presents the map of Mexican
states by region8 and type of state pension plan. The states with DC plans are: Sinaloa,
Coahuila, Nuevo Leon, Baja California Sur, and Nuevo Leon. States with mixed pension
plans are Jalisco, Estado de Mexico and Aguascalientes. Most remaining states have DB
pension plans.
8 States were grouped into regions following classifications by Instituto Nacional de Estadistica e Informatica (INEGI) and Consejo Nacional de Ciencia y Tecnologia (CONACYT). CAPREPA=Caja de Prevision de la Policia Auxiliar; CAPTRALIR=Caja de Previsión de la Policia Preventiva.
7
Parameters such as the value of minimum pensions are assumed to remain at the
same level in relation to the average salary in the future, unless rules specifically indicate
otherwise. Initial salaries for projecting old-age pension benefits of public sector workers
were approximated by information from the National Employment Survey (ENOE) for the
second trimester of 2011.9 Reported salaries of public sector workers in this survey are
considered net salaries. Given the assumption on salary growth, projected salaries are
expressed as a multiple of the salary in the initial period.
Figure 1
Map of Mexican States by Region and Type of Pension Plan for Public Sector Workers
DB=defined benefit DC=defined contribution
M=mixed
Note: Information on type of state-plans as of 2010 can be found in CONSAR (2012) and CESOP-Camara de Diputados (2010).
9 Public sector workers were identified in the ENOE database according to “Sistema de Clasificacion Industrial de America del Norte” (SICAN) using the codes 9312 and 9313.
dfdf
dsfsdf
dfffg
dsfsdf
8
3 Results
In the baseline scenario, workers enter the public sector labor market at the age of 20 in
2011 and have uninterrupted labor careers. Future old-age pension benefits of today’s
workers who contribute to the main state plan with different levels of salaries are examined.
The first indicator is the replacement rate, defined as the individual pension benefit as a
proportion of individual pre-retirement salary when working. This indicator is useful when
looking at the extent to which a pension plan maintains the standard of living.
We also present calculations of pension wealth. As this indicator focuses in all
future pension benefits the individual will receive until death, it depends on the level of
benefits, the period during which these will be received, and the assumptions about the
discount rate. It is also affected by whether benefits are adjusted using the rate of growth of
prices or salaries. The payment period depends on the statutory age at which benefits are
received and on the life expectancy at that age. For DC pension regimes, the calculations
assume that when pension benefits are received at pensionable age they are paid in the form
of a standard annuity calculated from mortality data.
Replacement Rates
The average replacement rate (in net terms), calculated across states, gender and salaries, is
79%. On average women have lower rates (78) than men (80). States with DB and mixed
(DB and DC) pension plans have higher average replacement rates (87 and 101,
respectively) than states with DC regimes (50). For the average-salaried public sector
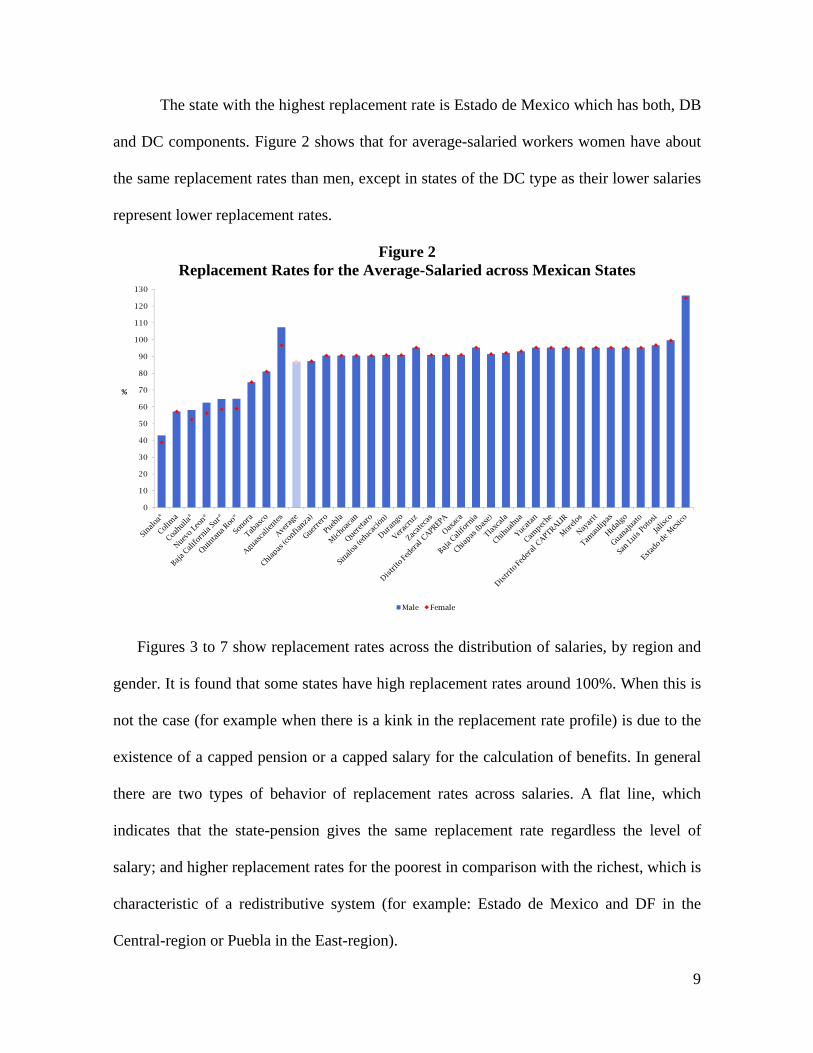
workers, Figure 2 compares replacement rates by gender across Mexican states. They
receive replacement rates averaging 86 (86.5 for males and 86.3 for females). In general,
replacement rates are lower in states of the DC type (which are identified by an asterisk).
9
The state with the highest replacement rate is Estado de Mexico which has both, DB
and DC components. Figure 2 shows that for average-salaried workers women have about
the same replacement rates than men, except in states of the DC type as their lower salaries
represent lower replacement rates.
Figure 2 Replacement Rates for the Average-Salaried across Mexican States
*
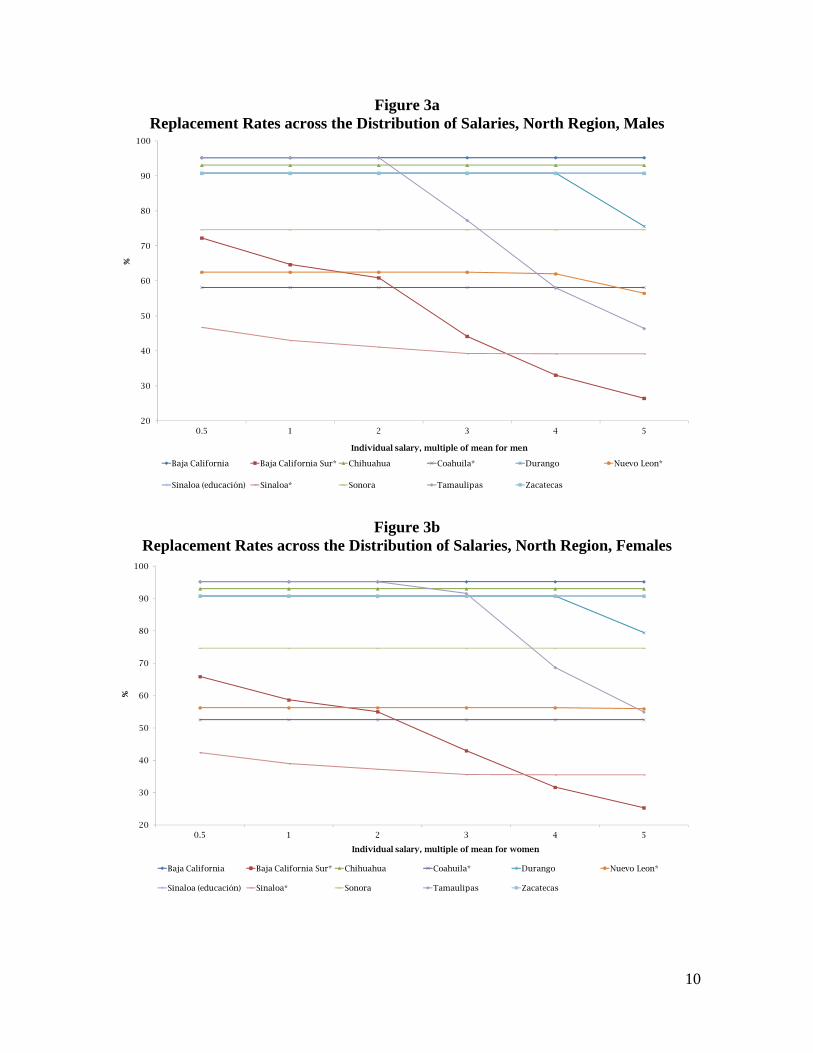
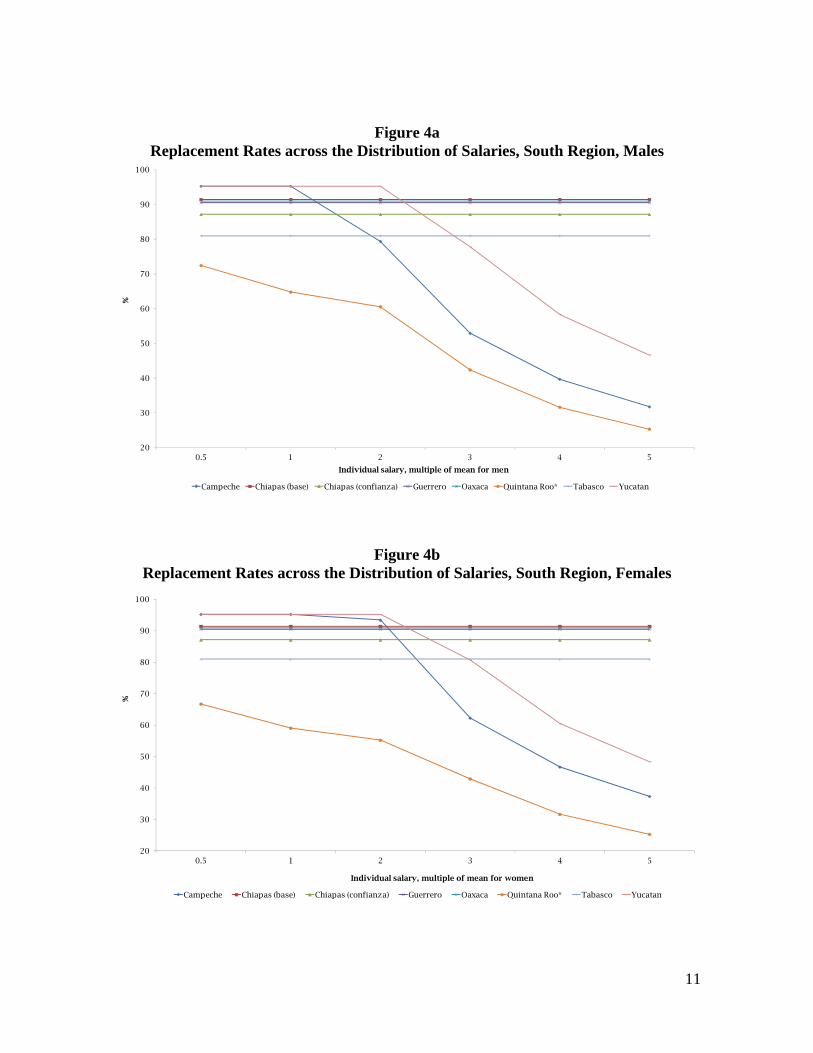
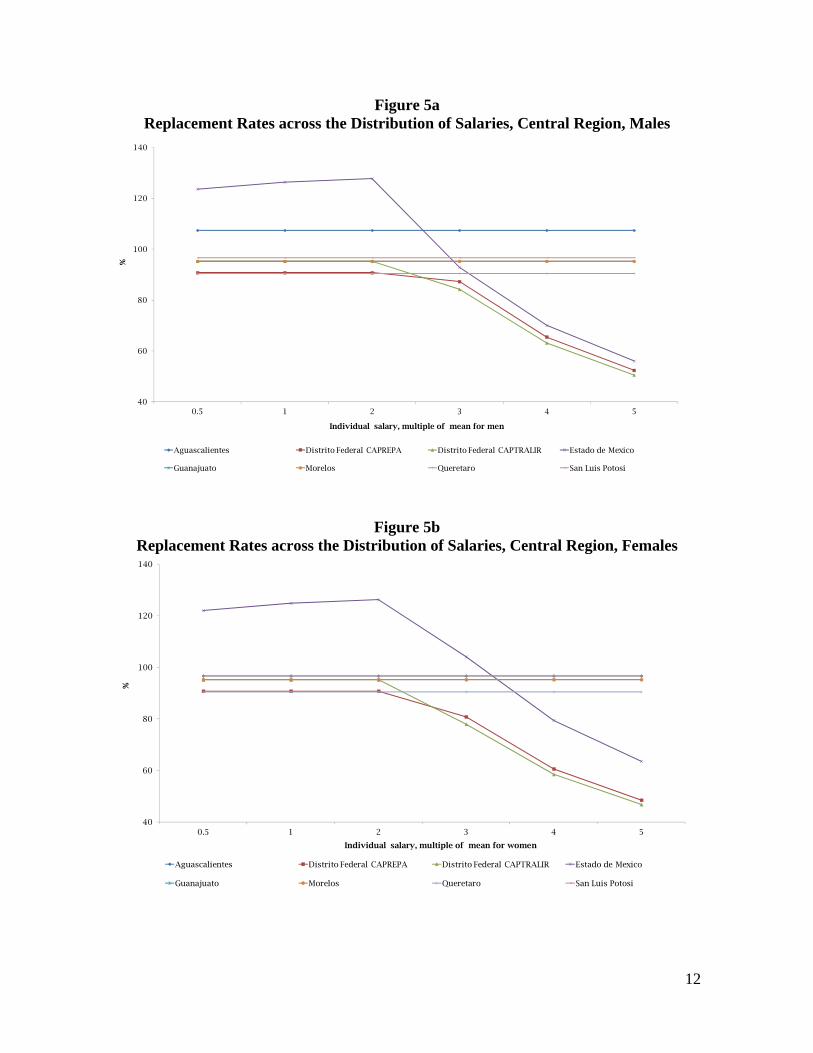
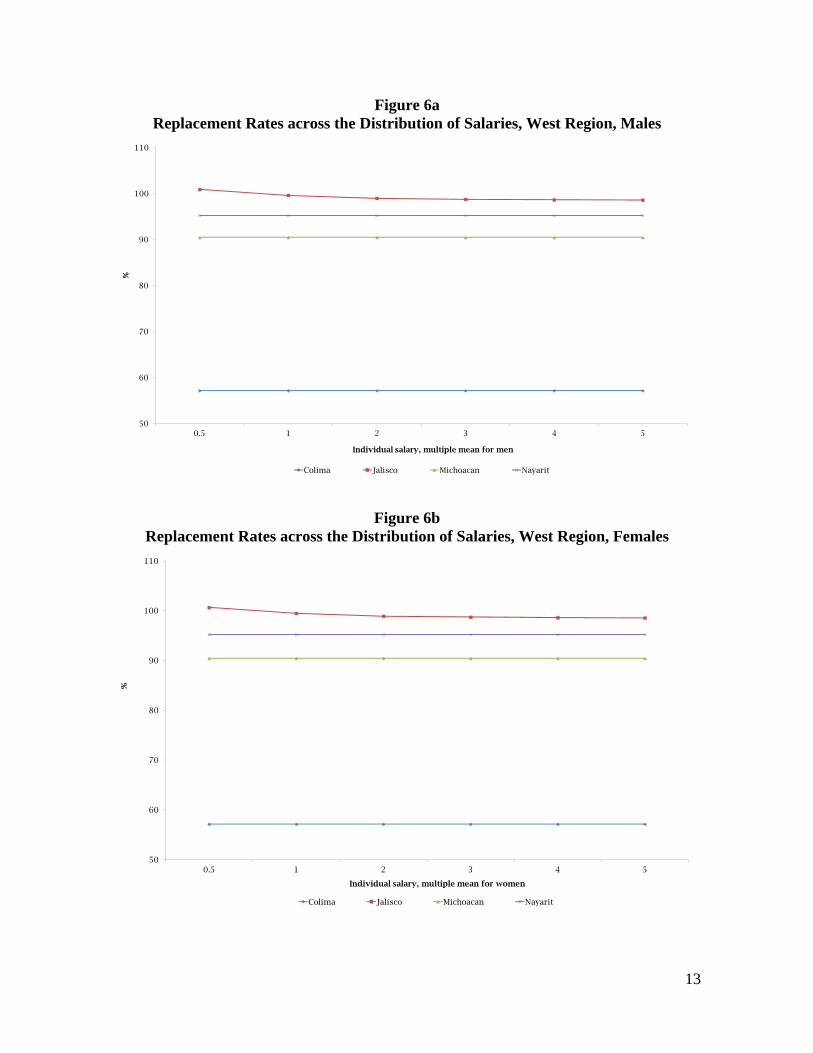
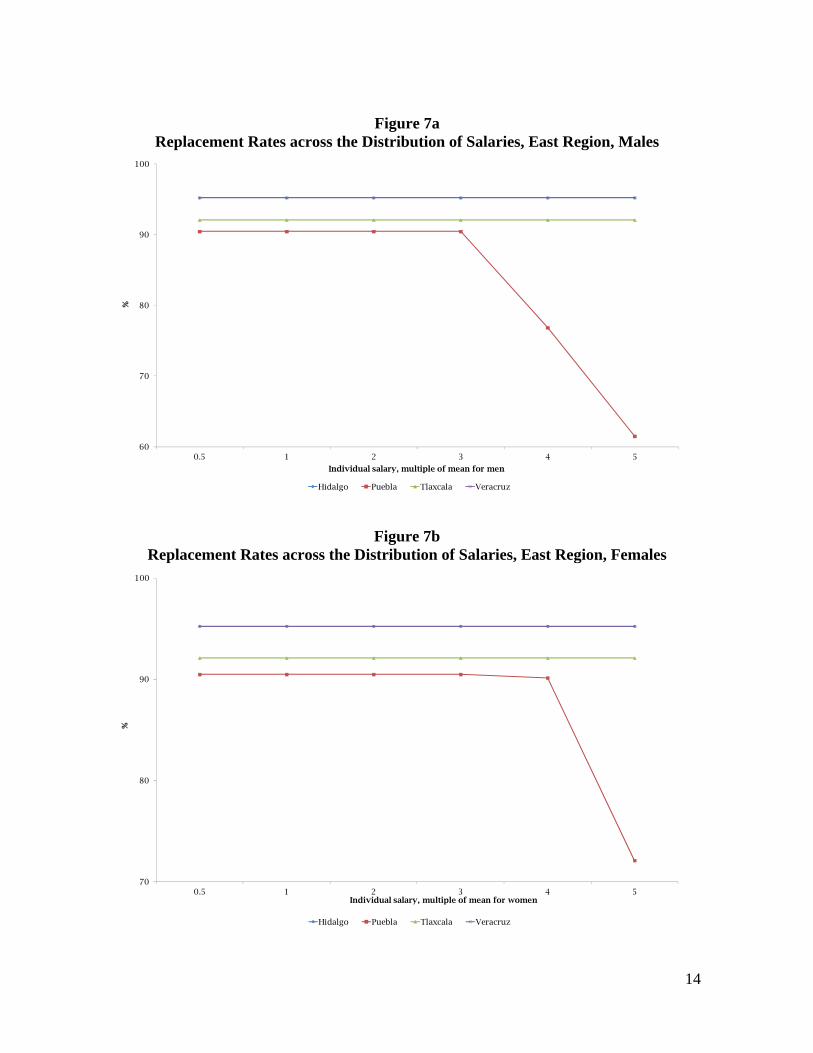
Figures 3 to 7 show replacement rates across the distribution of salaries, by region and
gender. It is found that some states have high replacement rates around 100%. When this is
not the case (for example when there is a kink in the replacement rate profile) is due to the
existence of a capped pension or a capped salary for the calculation of benefits. In general
there are two types of behavior of replacement rates across salaries. A flat line, which
indicates that the state-pension gives the same replacement rate regardless the level of
salary; and higher replacement rates for the poorest in comparison with the richest, which is
characteristic of a redistributive system (for example: Estado de Mexico and DF in the
Central-region or Puebla in the East-region).
0
10
20
30
40
50
60
70
80
90
100
110
120
130
%
Male Female
10
Figure 3a Replacement Rates across the Distribution of Salaries, North Region, Males
Figure 3b Replacement Rates across the Distribution of Salaries, North Region, Females
20
30
40
50
60
70
80
90
100
0.5 1 2 3 4 5
%
Individual salary, multiple of mean for men
Baja California Baja California Sur* Chihuahua Coahuila* Durango Nuevo Leon*
Sinaloa (educación) Sinaloa* Sonora Tamaulipas Zacatecas
20
30
40
50
60
70
80
90
100
0.5 1 2 3 4 5
%
Individual salary, multiple of mean for women
Baja California Baja California Sur* Chihuahua Coahuila* Durango Nuevo Leon*
Sinaloa (educación) Sinaloa* Sonora Tamaulipas Zacatecas
11
Figure 4a Replacement Rates across the Distribution of Salaries, South Region, Males
Figure 4b Replacement Rates across the Distribution of Salaries, South Region, Females
20
30
40
50
60
70
80
90
100
0.5 1 2 3 4 5
%
Individual salary, multiple of mean for men
Campeche Chiapas (base) Chiapas (confianza) Guerrero Oaxaca Quintana Roo* Tabasco Yucatan
20
30
40
50
60
70
80
90
100
0.5 1 2 3 4 5
%
Individual salary, multiple of mean for women
Campeche Chiapas (base) Chiapas (confianza) Guerrero Oaxaca Quintana Roo* Tabasco Yucatan
12
Figure 5a Replacement Rates across the Distribution of Salaries, Central Region, Males
Figure 5b Replacement Rates across the Distribution of Salaries, Central Region, Females
40
60
80
100
120
140
0.5 1 2 3 4 5
%
Individual salary, multiple of mean for men
Aguascalientes Distrito Federal CAPREPA Distrito Federal CAPTRALIR Estado de Mexico
Guanajuato Morelos Queretaro San Luis Potosi
40
60
80
100
120
140
0.5 1 2 3 4 5
%
Individual salary, multiple of mean for women
Aguascalientes Distrito Federal CAPREPA Distrito Federal CAPTRALIR Estado de Mexico
Guanajuato Morelos Queretaro San Luis Potosi
13
Figure 6a Replacement Rates across the Distribution of Salaries, West Region, Males
Figure 6b Replacement Rates across the Distribution of Salaries, West Region, Females
50
60
70
80
90
100
110
0.5 1 2 3 4 5
%
Individual salary, multiple mean for men
Colima Jalisco Michoacan Nayarit
50
60
70
80
90
100
110
0.5 1 2 3 4 5
%
Individual salary, multiple mean for women
Colima Jalisco Michoacan Nayarit
14
Figure 7a
Replacement Rates across the Distribution of Salaries, East Region, Males
Figure 7b Replacement Rates across the Distribution of Salaries, East Region, Females
70
80
90
100
0.5 1 2 3 4 5
%
Individual salary, multiple of mean for women
Hidalgo Puebla Tlaxcala Veracruz
60
70
80
90
100
0.5 1 2 3 4 5
%
Individual salary, multiple of mean for men
Hidalgo Puebla Tlaxcala Veracruz
15
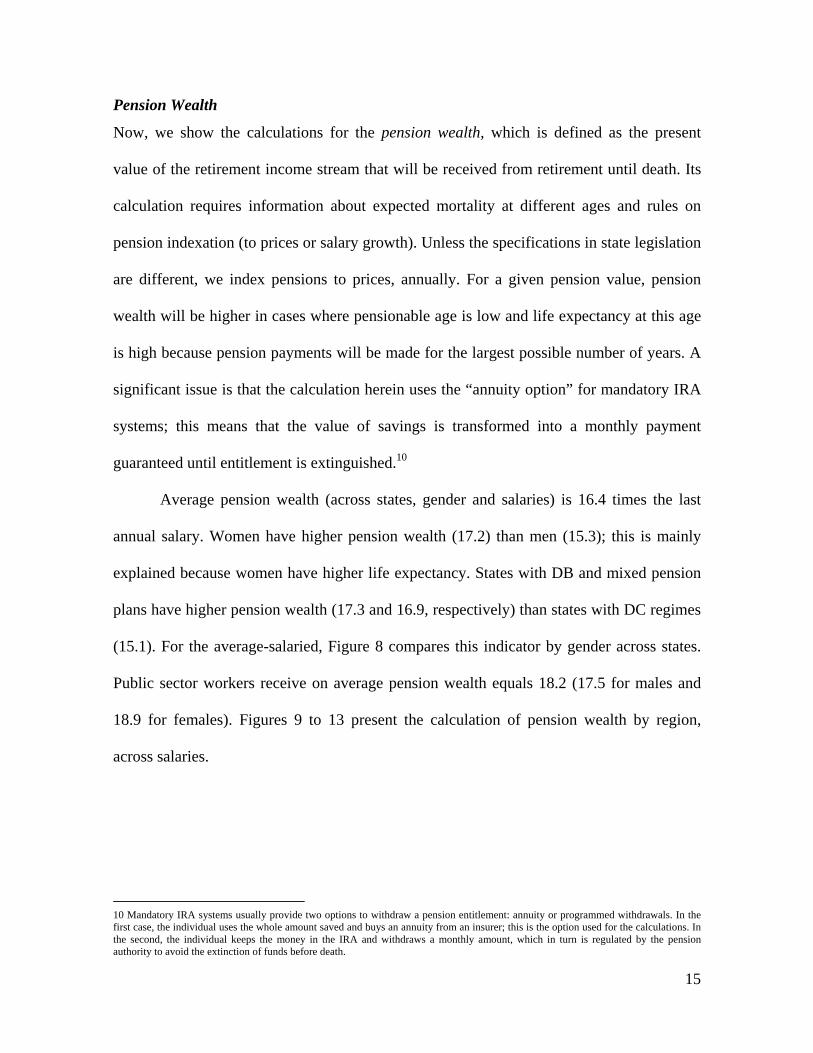
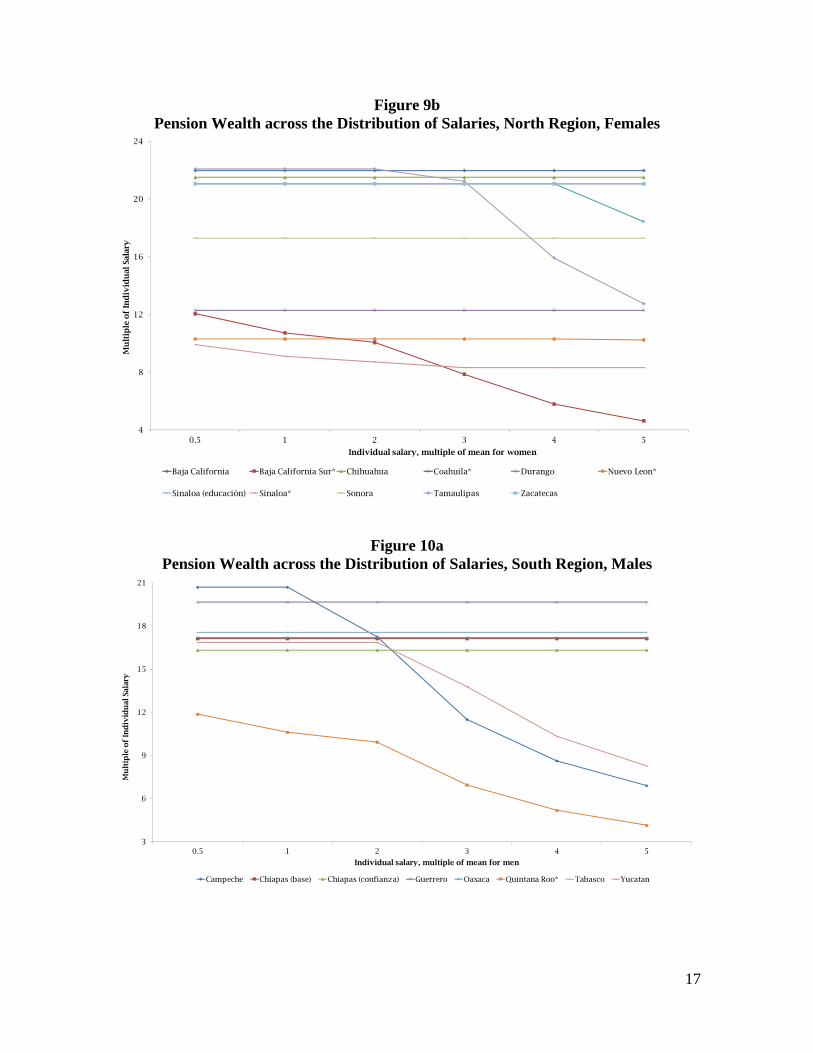
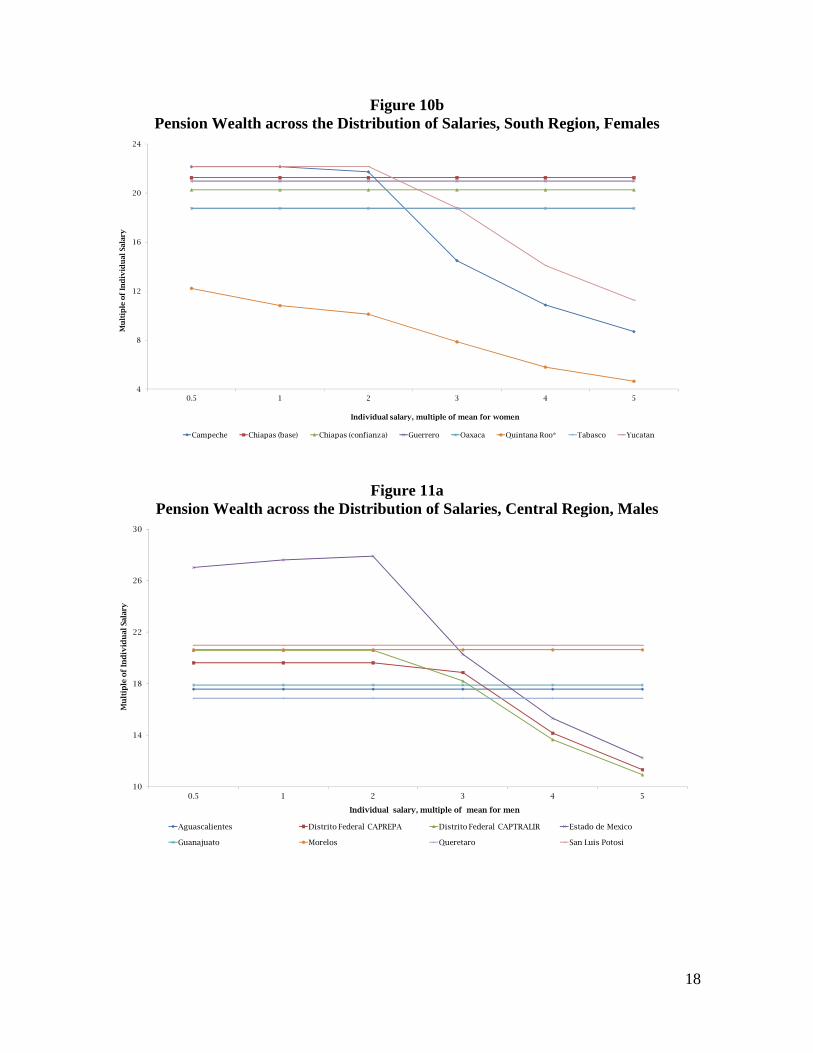
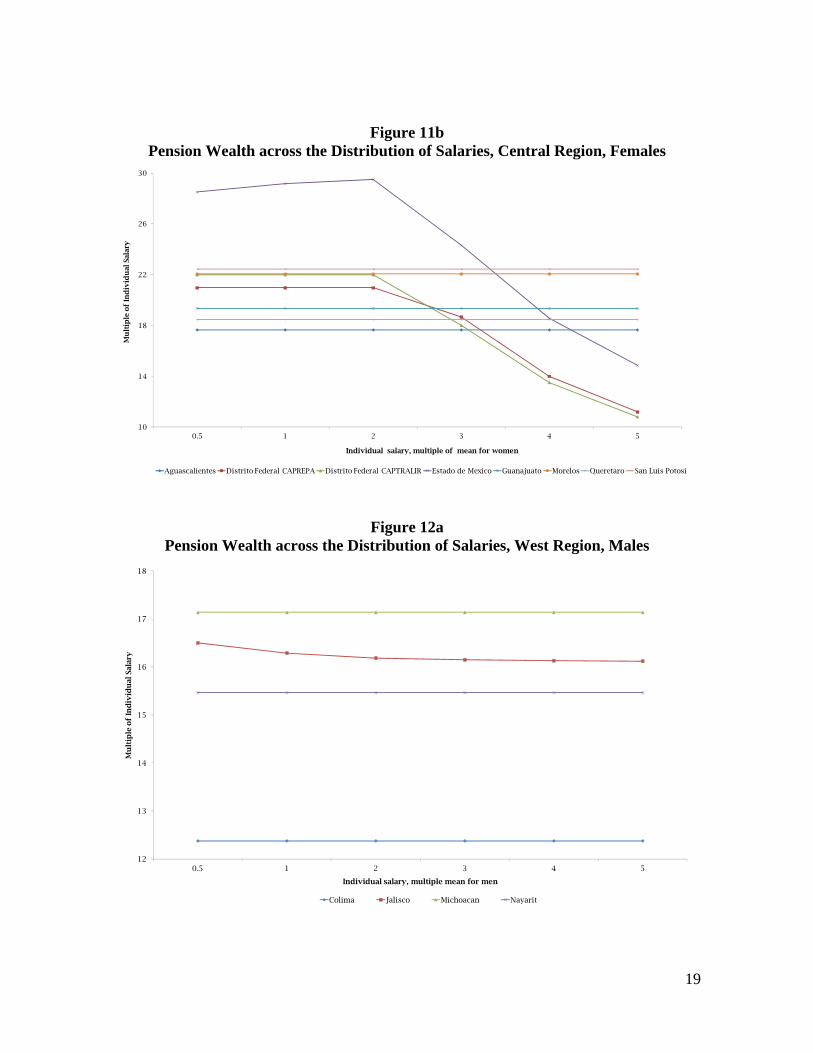
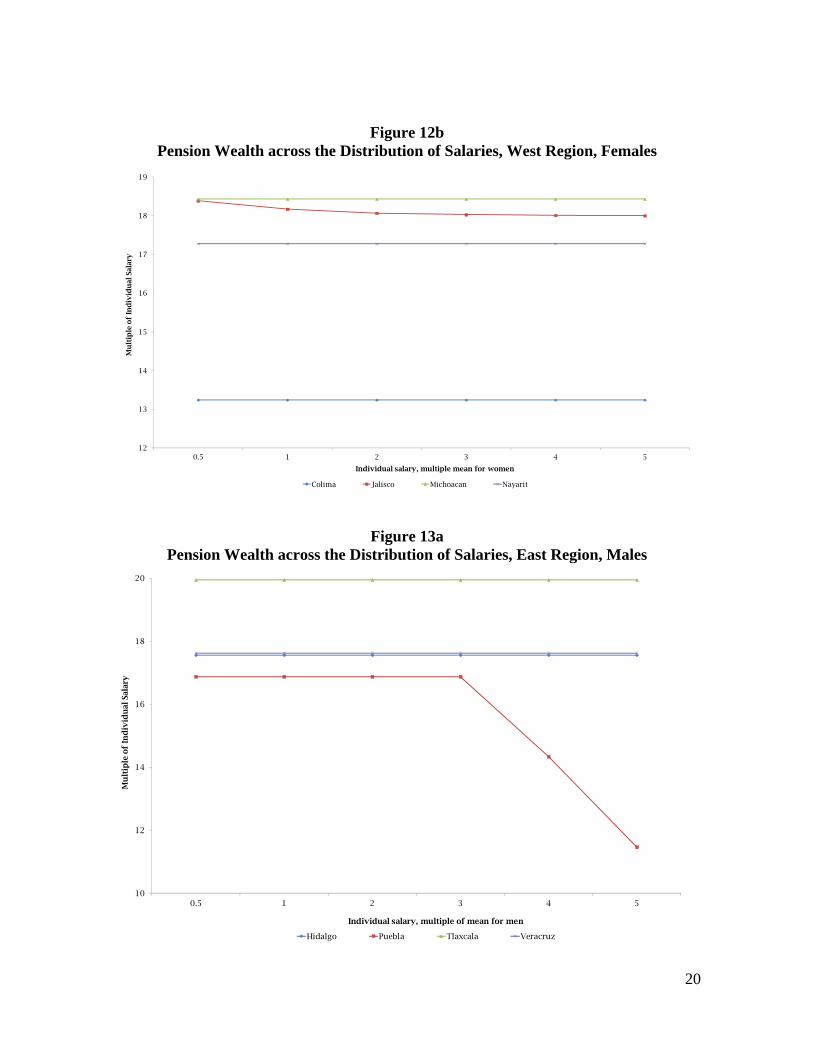
Pension Wealth
Now, we show the calculations for the pension wealth, which is defined as the present
value of the retirement income stream that will be received from retirement until death. Its
calculation requires information about expected mortality at different ages and rules on
pension indexation (to prices or salary growth). Unless the specifications in state legislation
are different, we index pensions to prices, annually. For a given pension value, pension
wealth will be higher in cases where pensionable age is low and life expectancy at this age
is high because pension payments will be made for the largest possible number of years. A
significant issue is that the calculation herein uses the “annuity option” for mandatory IRA
systems; this means that the value of savings is transformed into a monthly payment
guaranteed until entitlement is extinguished.10
Average pension wealth (across states, gender and salaries) is 16.4 times the last
annual salary. Women have higher pension wealth (17.2) than men (15.3); this is mainly
explained because women have higher life expectancy. States with DB and mixed pension
plans have higher pension wealth (17.3 and 16.9, respectively) than states with DC regimes
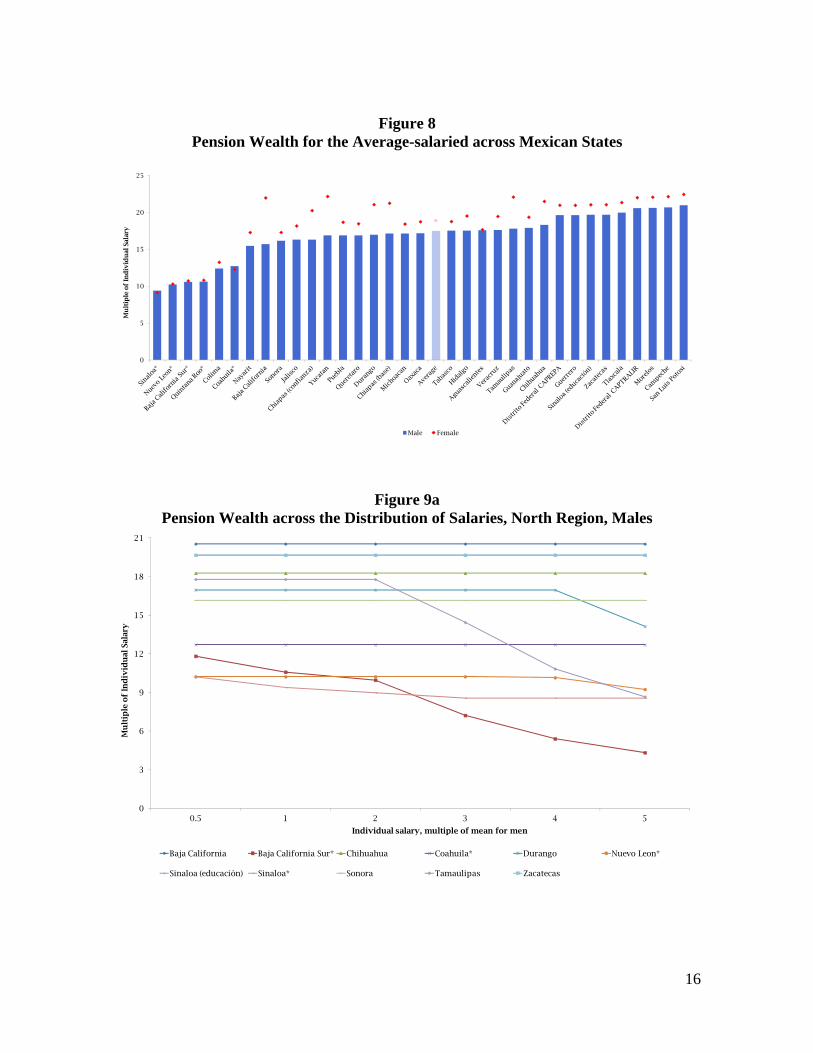
(15.1). For the average-salaried, Figure 8 compares this indicator by gender across states.
Public sector workers receive on average pension wealth equals 18.2 (17.5 for males and
18.9 for females). Figures 9 to 13 present the calculation of pension wealth by region,
across salaries.
10 Mandatory IRA systems usually provide two options to withdraw a pension entitlement: annuity or programmed withdrawals. In the first case, the individual uses the whole amount saved and buys an annuity from an insurer; this is the option used for the calculations. In the second, the individual keeps the money in the IRA and withdraws a monthly amount, which in turn is regulated by the pension authority to avoid the extinction of funds before death.
16
Figure 8
Pension Wealth for the Average-salaried across Mexican States
Figure 9a
Pension Wealth across the Distribution of Salaries, North Region, Males
0
5
10
15
20
25
Mu
ltip
le o
f In
div
idu
al S
alar
y
Male Female
0
3
6
9
12
15
18
21
0.5 1 2 3 4 5
Mu
ltip
le o
f In
div
idu
al S
alar
y
Individual salary, multiple of mean for men
Baja California Baja California Sur* Chihuahua Coahuila* Durango Nuevo Leon*
Sinaloa (educación) Sinaloa* Sonora Tamaulipas Zacatecas
17
Figure 9b Pension Wealth across the Distribution of Salaries, North Region, Females
Figure 10a Pension Wealth across the Distribution of Salaries, South Region, Males
3
6
9
12
15
18
21
0.5 1 2 3 4 5
Mu
ltip
le o
f In
div
idu
al S
alar
y
Individual salary, multiple of mean for men
Campeche Chiapas (base) Chiapas (confianza) Guerrero Oaxaca Quintana Roo* Tabasco Yucatan
4
8
12
16
20
24
0.5 1 2 3 4 5
Mu
ltip
le o
f In
div
idu
al S
alar
y
Individual salary, multiple of mean for women
Baja California Baja California Sur* Chihuahua Coahuila* Durango Nuevo Leon*
Sinaloa (educación) Sinaloa* Sonora Tamaulipas Zacatecas
18
Figure 10b Pension Wealth across the Distribution of Salaries, South Region, Females
Figure 11a
Pension Wealth across the Distribution of Salaries, Central Region, Males
10
14
18
22
26
30
0.5 1 2 3 4 5
Mu
ltip
le o
f In
div
idu
al S
alar
y
Individual salary, multiple of mean for men
Aguascalientes Distrito Federal CAPREPA Distrito Federal CAPTRALIR Estado de Mexico
Guanajuato Morelos Queretaro San Luis Potosi
4
8
12
16
20
24
0.5 1 2 3 4 5
Mu
ltip
le o
f In
div
idu
al S
alar
y
Individual salary, multiple of mean for women
Campeche Chiapas (base) Chiapas (confianza) Guerrero Oaxaca Quintana Roo* Tabasco Yucatan
19
Figure 11b Pension Wealth across the Distribution of Salaries, Central Region, Females
Figure 12a Pension Wealth across the Distribution of Salaries, West Region, Males
12
13
14
15
16
17
18
0.5 1 2 3 4 5
Mu
ltip
le o
f In
div
idu
al S
alar
y
Individual salary, multiple mean for men
Colima Jalisco Michoacan Nayarit
10
14
18
22
26
30
0.5 1 2 3 4 5
Mu
ltip
le o
f In
div
idu
al S
alar
y
Individual salary, multiple of mean for women
Aguascalientes Distrito Federal CAPREPA Distrito Federal CAPTRALIR Estado de Mexico Guanajuato Morelos Queretaro San Luis Potosi
20
Figure 12b Pension Wealth across the Distribution of Salaries, West Region, Females
Figure 13a Pension Wealth across the Distribution of Salaries, East Region, Males
10
12
14
16
18
20
0.5 1 2 3 4 5
Mu
ltip
le o
f In
div
idu
al S
alar
y
Individual salary, multiple of mean for men
Hidalgo Puebla Tlaxcala Veracruz
12
13
14
15
16
17
18
19
0.5 1 2 3 4 5
Mu
ltip
le o
f In
div
idu
al S
alar
y
Individual salary, multiple mean for women
Colima Jalisco Michoacan Nayarit
21
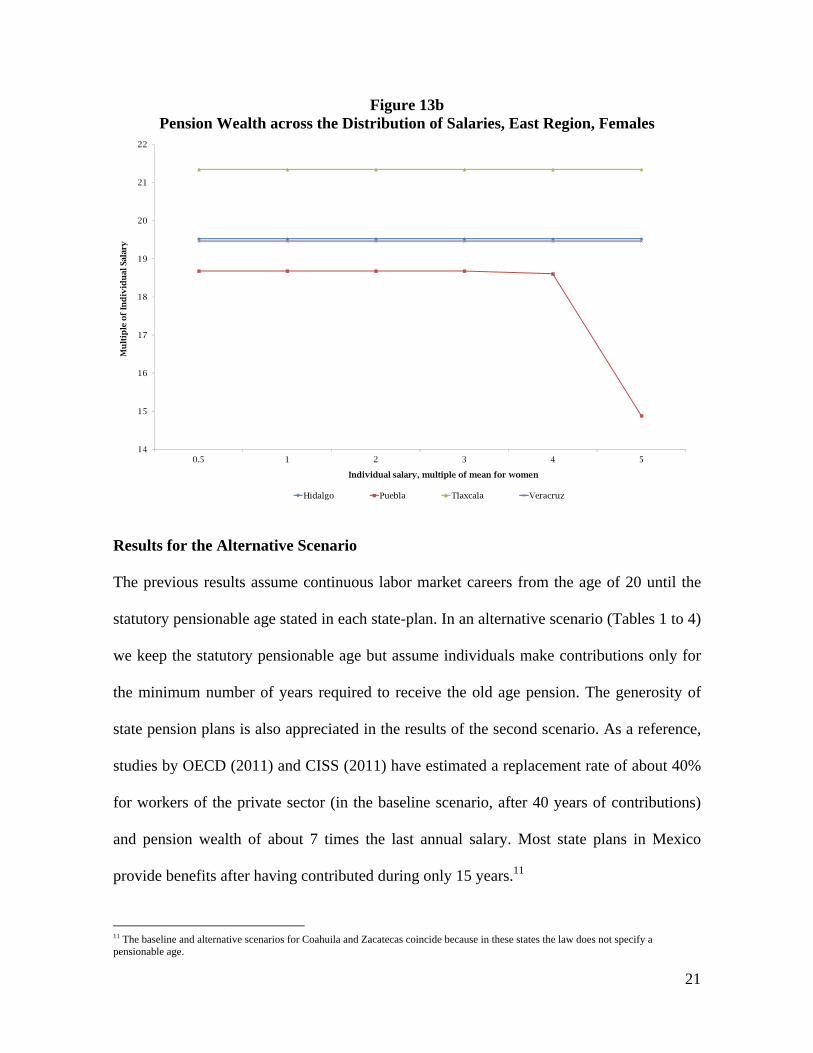
Figure 13b Pension Wealth across the Distribution of Salaries, East Region, Females
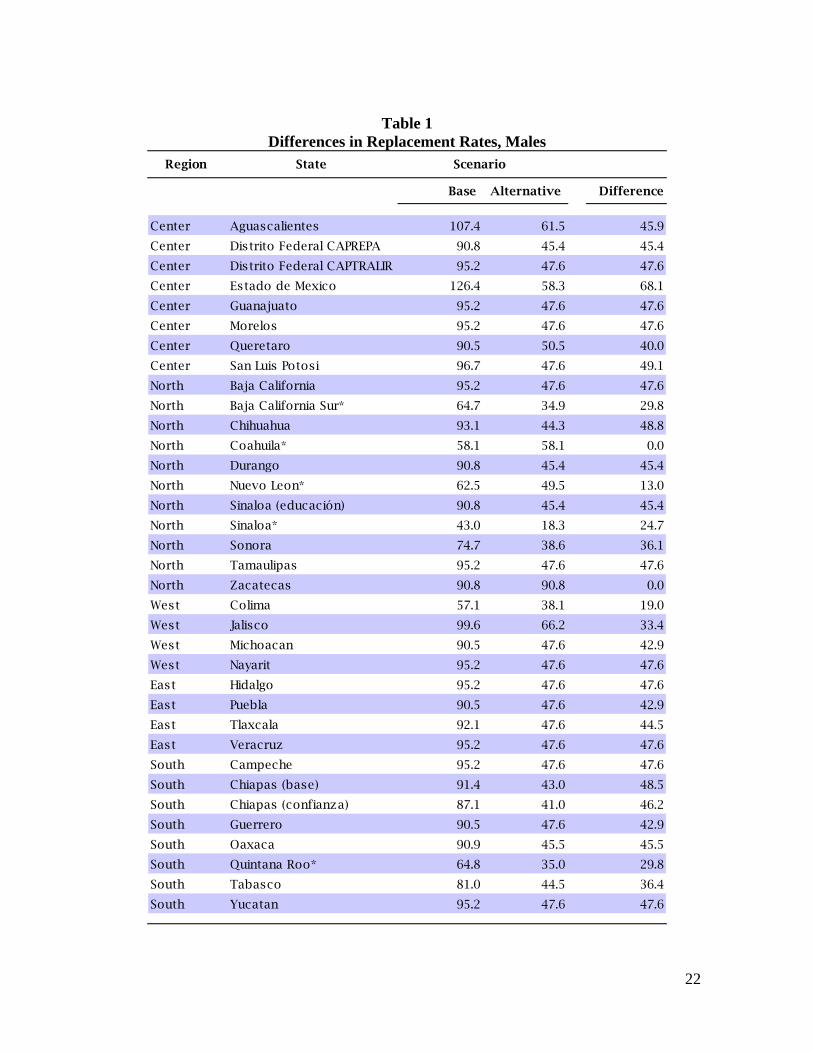
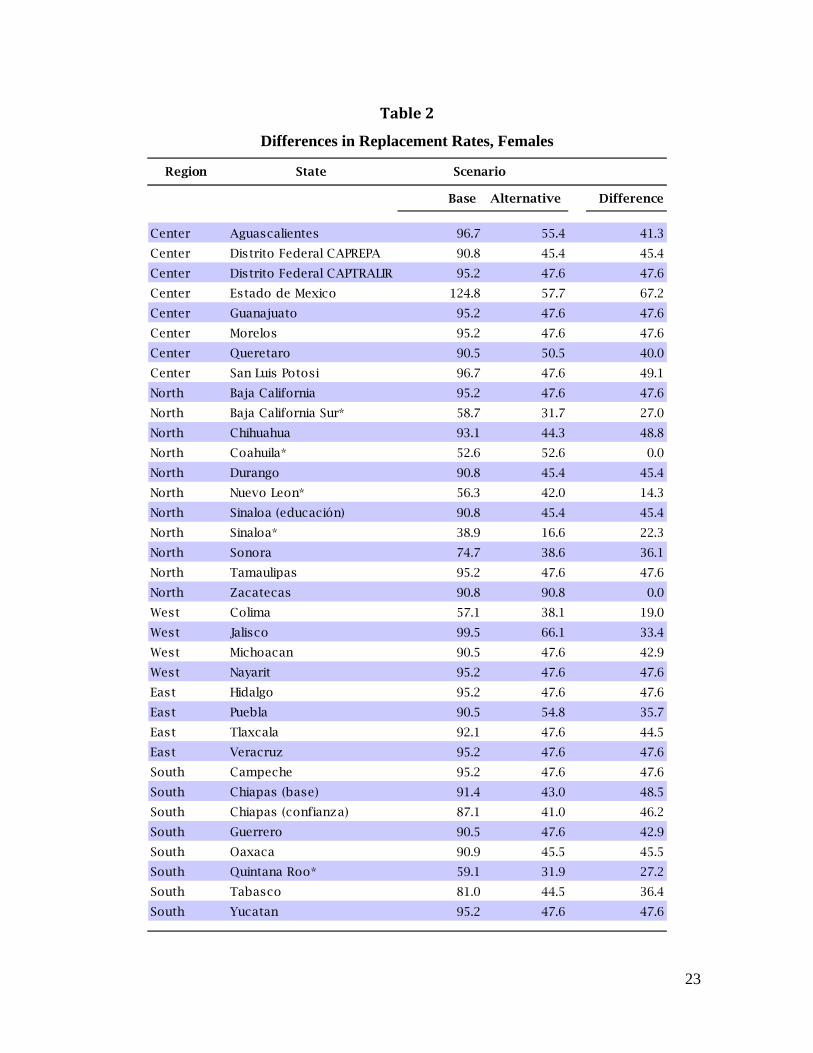
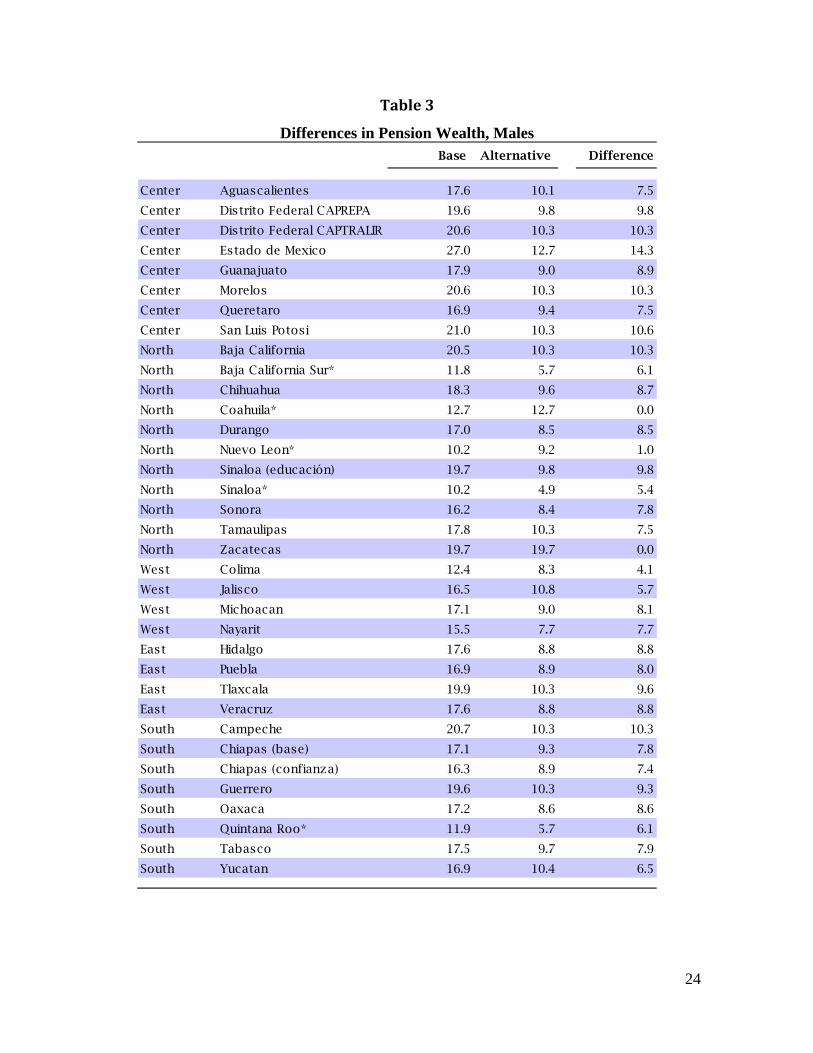
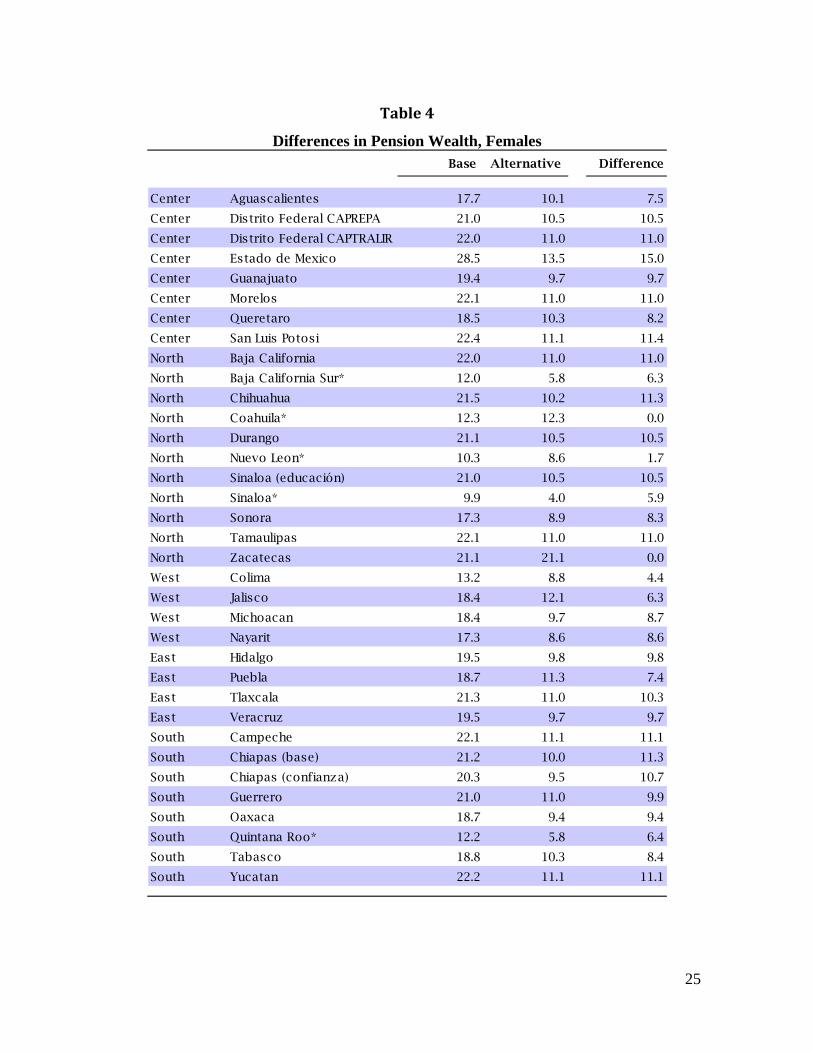
Results for the Alternative Scenario The previous results assume continuous labor market careers from the age of 20 until the
statutory pensionable age stated in each state-plan. In an alternative scenario (Tables 1 to 4)
we keep the statutory pensionable age but assume individuals make contributions only for
the minimum number of years required to receive the old age pension. The generosity of
state pension plans is also appreciated in the results of the second scenario. As a reference,
studies by OECD (2011) and CISS (2011) have estimated a replacement rate of about 40%
for workers of the private sector (in the baseline scenario, after 40 years of contributions)
and pension wealth of about 7 times the last annual salary. Most state plans in Mexico
provide benefits after having contributed during only 15 years.11
11 The baseline and alternative scenarios for Coahuila and Zacatecas coincide because in these states the law does not specify a pensionable age.
14
15
16
17
18
19
20
21
22
0.5 1 2 3 4 5
Mu
ltip
le o
f In
div
idu
al S
alar
y
Individual salary, multiple of mean for women
Hidalgo Puebla Tlaxcala Veracruz
22
Table 1
Differences in Replacement Rates, Males Region State
Base Alternative Difference
Center Aguascalientes 107.4 61.5 45.9
Center Distrito Federal CAPREPA 90.8 45.4 45.4
Center Distrito Federal CAPTRALIR 95.2 47.6 47.6
Center Estado de Mexico 126.4 58.3 68.1
Center Guanajuato 95.2 47.6 47.6
Center Morelos 95.2 47.6 47.6
Center Queretaro 90.5 50.5 40.0
Center San Luis Potosi 96.7 47.6 49.1
North Baja California 95.2 47.6 47.6
North Baja California Sur* 64.7 34.9 29.8
North Chihuahua 93.1 44.3 48.8
North Coahuila* 58.1 58.1 0.0
North Durango 90.8 45.4 45.4
North Nuevo Leon* 62.5 49.5 13.0
North Sinaloa (educación) 90.8 45.4 45.4
North Sinaloa* 43.0 18.3 24.7
North Sonora 74.7 38.6 36.1
North Tamaulipas 95.2 47.6 47.6
North Zacatecas 90.8 90.8 0.0
West Colima 57.1 38.1 19.0
West Jalisco 99.6 66.2 33.4
West Michoacan 90.5 47.6 42.9
West Nayarit 95.2 47.6 47.6
East Hidalgo 95.2 47.6 47.6
East Puebla 90.5 47.6 42.9
East Tlaxcala 92.1 47.6 44.5
East Veracruz 95.2 47.6 47.6
South Campeche 95.2 47.6 47.6
South Chiapas (base) 91.4 43.0 48.5
South Chiapas (confianza) 87.1 41.0 46.2
South Guerrero 90.5 47.6 42.9
South Oaxaca 90.9 45.5 45.5
South Quintana Roo* 64.8 35.0 29.8
South Tabasco 81.0 44.5 36.4
South Yucatan 95.2 47.6 47.6
Scenario
23
Table 2
Differences in Replacement Rates, Females
Region State
Base Alternative Difference
Center Aguascalientes 96.7 55.4 41.3
Center Distrito Federal CAPREPA 90.8 45.4 45.4
Center Distrito Federal CAPTRALIR 95.2 47.6 47.6
Center Estado de Mexico 124.8 57.7 67.2
Center Guanajuato 95.2 47.6 47.6
Center Morelos 95.2 47.6 47.6
Center Queretaro 90.5 50.5 40.0
Center San Luis Potosi 96.7 47.6 49.1
North Baja California 95.2 47.6 47.6
North Baja California Sur* 58.7 31.7 27.0
North Chihuahua 93.1 44.3 48.8
North Coahuila* 52.6 52.6 0.0
North Durango 90.8 45.4 45.4
North Nuevo Leon* 56.3 42.0 14.3
North Sinaloa (educación) 90.8 45.4 45.4
North Sinaloa* 38.9 16.6 22.3
North Sonora 74.7 38.6 36.1
North Tamaulipas 95.2 47.6 47.6
North Zacatecas 90.8 90.8 0.0
West Colima 57.1 38.1 19.0
West Jalisco 99.5 66.1 33.4
West Michoacan 90.5 47.6 42.9
West Nayarit 95.2 47.6 47.6
East Hidalgo 95.2 47.6 47.6
East Puebla 90.5 54.8 35.7
East Tlaxcala 92.1 47.6 44.5
East Veracruz 95.2 47.6 47.6
South Campeche 95.2 47.6 47.6
South Chiapas (base) 91.4 43.0 48.5
South Chiapas (confianza) 87.1 41.0 46.2
South Guerrero 90.5 47.6 42.9
South Oaxaca 90.9 45.5 45.5
South Quintana Roo* 59.1 31.9 27.2
South Tabasco 81.0 44.5 36.4
South Yucatan 95.2 47.6 47.6
Scenario
24
Table 3
Differences in Pension Wealth, Males Base Alternative Difference
Center Aguascalientes 17.6 10.1 7.5
Center Distrito Federal CAPREPA 19.6 9.8 9.8
Center Distrito Federal CAPTRALIR 20.6 10.3 10.3
Center Estado de Mexico 27.0 12.7 14.3
Center Guanajuato 17.9 9.0 8.9
Center Morelos 20.6 10.3 10.3
Center Queretaro 16.9 9.4 7.5
Center San Luis Potosi 21.0 10.3 10.6
North Baja California 20.5 10.3 10.3
North Baja California Sur* 11.8 5.7 6.1
North Chihuahua 18.3 9.6 8.7
North Coahuila* 12.7 12.7 0.0
North Durango 17.0 8.5 8.5
North Nuevo Leon* 10.2 9.2 1.0
North Sinaloa (educación) 19.7 9.8 9.8
North Sinaloa* 10.2 4.9 5.4
North Sonora 16.2 8.4 7.8
North Tamaulipas 17.8 10.3 7.5
North Zacatecas 19.7 19.7 0.0
West Colima 12.4 8.3 4.1
West Jalisco 16.5 10.8 5.7
West Michoacan 17.1 9.0 8.1
West Nayarit 15.5 7.7 7.7
East Hidalgo 17.6 8.8 8.8
East Puebla 16.9 8.9 8.0
East Tlaxcala 19.9 10.3 9.6
East Veracruz 17.6 8.8 8.8
South Campeche 20.7 10.3 10.3
South Chiapas (base) 17.1 9.3 7.8
South Chiapas (confianza) 16.3 8.9 7.4
South Guerrero 19.6 10.3 9.3
South Oaxaca 17.2 8.6 8.6
South Quintana Roo* 11.9 5.7 6.1
South Tabasco 17.5 9.7 7.9
South Yucatan 16.9 10.4 6.5
25
Table 4
Differences in Pension Wealth, Females Base Alternative Difference
Center Aguascalientes 17.7 10.1 7.5
Center Distrito Federal CAPREPA 21.0 10.5 10.5
Center Distrito Federal CAPTRALIR 22.0 11.0 11.0
Center Estado de Mexico 28.5 13.5 15.0
Center Guanajuato 19.4 9.7 9.7
Center Morelos 22.1 11.0 11.0
Center Queretaro 18.5 10.3 8.2
Center San Luis Potosi 22.4 11.1 11.4
North Baja California 22.0 11.0 11.0
North Baja California Sur* 12.0 5.8 6.3
North Chihuahua 21.5 10.2 11.3
North Coahuila* 12.3 12.3 0.0
North Durango 21.1 10.5 10.5
North Nuevo Leon* 10.3 8.6 1.7
North Sinaloa (educación) 21.0 10.5 10.5
North Sinaloa* 9.9 4.0 5.9
North Sonora 17.3 8.9 8.3
North Tamaulipas 22.1 11.0 11.0
North Zacatecas 21.1 21.1 0.0
West Colima 13.2 8.8 4.4
West Jalisco 18.4 12.1 6.3
West Michoacan 18.4 9.7 8.7
West Nayarit 17.3 8.6 8.6
East Hidalgo 19.5 9.8 9.8
East Puebla 18.7 11.3 7.4
East Tlaxcala 21.3 11.0 10.3
East Veracruz 19.5 9.7 9.7
South Campeche 22.1 11.1 11.1
South Chiapas (base) 21.2 10.0 11.3
South Chiapas (confianza) 20.3 9.5 10.7
South Guerrero 21.0 11.0 9.9
South Oaxaca 18.7 9.4 9.4
South Quintana Roo* 12.2 5.8 6.4
South Tabasco 18.8 10.3 8.4
South Yucatan 22.2 11.1 11.1
26
5 Conclusions
This paper provides indicators of replacement rates and pension wealth for the main state
plan for public sector workers across Mexican states. Replacement rates and pension wealth
are calculated with respect to individual salaries. We follow closely the assumptions used
by the OECD in a baseline scenario that simulates old-age pension benefits for workers
assumed to begin work at age 20 until they reach the statutory pensionable age. We also
construct an alternative scenario in which the eligibility condition of having a minimum
number of contributions made is met.
We found that the general average replacement rate across Mexican states is around
79%. The average pension wealth is 16.4 times the annual salary and gives an indication to
state pension plans of the average cost of paying the pension promise. This paper provides
evidence of the high costs faced by pensions for private sector workers when compared
with the results found for private sector workers (average replacement rate of about 40%
after 40 years of contributions, and pension wealth of about 7 times the last annual salary)
in Mexico.
There is some progress regarding accountability and governance of state pension
plans in Mexico. For example, the suggestion by Asociacion Nacional de Instituciones
Estatales de Seguridad Social (ANIESS) of applying standard actuarial criteria in the
elaboration of actuarial valuations of social security state-plans; and the creation of a
pension fund by Secretaria de Hacienda, Fondo de Apoyo para la Reestructura de
Pensiones FARP, for states that consider the option of diminishing pension liabilities by
implementing plans based on individual accounts.
27
However, more efforts are needed regarding efficient investment of pension funds’
reserves and transparency. Another important issue towards having a unified pension
system is the integration of state plans to a general regime, so that current fragmentation of
social protection is tackled and costs of providing such protection are fairly distributed.
References
-Aguirre Farias, Miguel Ángel. Pensiones...¿y con qué? México: Fineo, 2012.
- Centro de Estudios Sociales y de Opinión Pública (CESOP). Cámara de Diputados. LIX
Legislatura. Sistemas Estatales de Pensiones. Noviembre 2010. Disponible en:
http://www.google.com.mx/url?sa=t&rct=j&q=&esrc=s&source=web&cd=1&ved=0CB8Q
FjAA&url=http%3A%2F%2Fwww3.diputados.gob.mx%2Fcamara%2Fcontent%2Fdownlo
ad%2F246666%2F710445%2Ffile%2FPensiones_estatales_2010.pdf&ei=RL1kUMW7CM
X50gHOuYG4AQ&usg=AFQjCNH_NB6WWq9cjlS_fS5XB9-9pCd7aA (consultado el 22
de agosto de 2012).
-Comisión Nacional del Sistema de Ahorro para el Retiro (CONSAR). Sistemas Estatales
de Pensiones. Legislaciones Estatales. Disponible en: (consultado el 22 de Agosto de
2012). http://www.consar.gob.mx/normatividad/normatividad-sistemas_estatales-
legislacion_estatal.shtml.
-Conferencia Interamericana de Seguridad Social (CISS). Informe sobre la Seguridad
Social en América 2012: Justicia, Trabajo, Retiro y Protección Social. México: CISS,
2011. Disponible en: http://www.ciss.org.mx/index_es.php?mod=informe
-Organization for Economic Co-operation and Development (OECD). Pensions at a Glance
2011: Retirement-Income Systems in OECD and G20 Countries. París: OECD, 2011.
-Organization for Economic Co-operation and Development (OECD). Pension at a Glance
2009: Retirement-Income Systems in OECD Countries, Paris: OECD, 2009.
28
-Organization for Economic Co-operation and Development (OECD). Public Sector
Pensions and the Challenge of an Aging Public Service, OECD Working Papers on Public
Governance, 2007.
-Palacios, R. and Whitehouse, E. Civil-service Pension Schemes Around the World. World
Bank Social Protection Discussion Paper No. 0602, May 2006.
-Santín, Quiroz, Osvaldo y Alemán, Castilla, Benjamín (coordinadores). Seguro Social
Sustentable. Evaluación de Reformas Recientes a Sistemas de Pensiones en México y
América Latina. México: Gobierno del Estado de México, 2009.
-Vásquez, Colmenares G., Pedro. Pensiones en México. La próxima crisis. México: Siglo
XXI Editores, 2012.
-Martínez, González, Gabriel. “Seguridad social para trabajadores del sector público en
México.” Capítulo 3 en Seguro Social Sustentable. Evaluación de Reformas Recientes a
Sistemas de Pensiones en México y América Latina, Santín, Quiroz, Osvaldo y Alemán,
Castilla, Benjamín (coordinadores). México: Gobierno del Estado de México, 2009, pp. 62-
85.
-Farell, Campa, Rosa, María. “La reforma a los sistemas estatales de seguridad social:
reformas ocurridas en las entidades federativas en el periodo 1994-2008.” Capítulo 4 en
Seguro Social Sustentable. Evaluación de Reformas Recientes a Sistemas de Pensiones en
México y América Latina, Santín, Quiroz, Osvaldo y Alemán, Castilla, Benjamín
(coordinadores). México: Gobierno del Estado de México, 2009, pp. 86-105.