indicators of climate change in tanzania and likely impacts on social economic development
DESCRIPTION
Indicators of Climate Change in Tanzania and likely impacts on social economic development. Faustine Fidelis Tilya Tanzania Meteorological Agency P O Box 3056, Dar es Salaam [email protected]. TREND ANALYSIS OF SOME CLIMATIC VARIABLES POSSIBLE CAUSES IMPACTS. Data & Methods. - PowerPoint PPT PresentationTRANSCRIPT

INDICATORS OF CLIMATE CHANGE IN TANZANIA AND LIKELY IMPACTS ON SOCIAL ECONOMIC DEVELOPMENT
Faustine Fidelis TilyaTanzania Meteorological Agency
P O Box 3056,Dar es Salaam

TREND ANALYSIS OF SOME CLIMATIC VARIABLES
POSSIBLE CAUSES
IMPACTS

DATA & METHODS
Historical Climate data from TMA
Non-parametric Spearman rank correlation statistics to determine the direction and strength of existing relationship between variables (Lehmann and D’Abrera, 1998).

RAINFALL HOMOGENOUS ZONES OF TANZANIA
Bukoba
Mwanza
Musoma
Kigoma
Mpanda
Sumbawanga
Tabora
Loliondo
Engare
Lushoto
Same
TangaSingida
Dodoma
Iringa
Mbeya
SongeaTunduru Mtwara
Dar es Salaam
Mahenge
Ilonga
30 31 32 33 34 35 36 37 38 39 40 41
-10
-8
-6
-4
-2
1 2
34
567
89 10
11

OBSERVED SPEARMAN RANK CORRELATION VALUES FORMARCH – MAY RAINFALL SEASON
30 31 32 33 34 35 36 37 38 39 40 41
longitude (°E)
-10
-8
-6
-4
-2
lati
tud
e (°
S)
-0.3
-0.2
-0.1
0
0.1
0.2
0.3
0.4
0.5

REDUCED RAINFALL AMOUNTS DURING MARCH-MAY RAINFALL SEASON

Observed Frequency of Wet Spells Run during the March-May (MAM_wet) and October-December (OND_wet) Seasons at Lushoto
(slopes of Usambara Mountain)
0
50
100
150
200
250
300
350
400
450
number of spells
1 2 3 4 5 6 7 8 9 10 11 12 13 14 15 16 17
length of spells
MAM_wet OND_wet
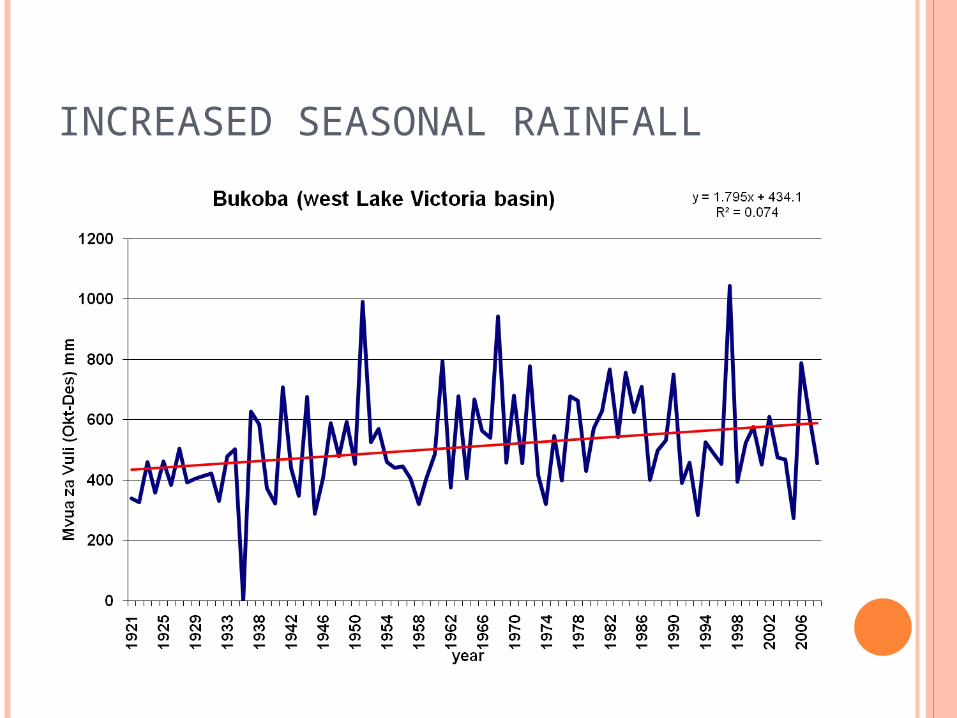
INCREASED SEASONAL RAINFALL

OBSERVED SPEARMAN RANK CORRELATION VALUES FOR THEOCTOBER – MAY RAINFALL SEASON
30 31 32 33 34 35 36 37 38 39 40 41
longitude (°E)
-10
-8
-6
-4
-2la
titu
de
(°S
)
-0.5
-0.4
-0.3
-0.2
-0.1
0
0.1
0.2
0.3
0.4
0.5
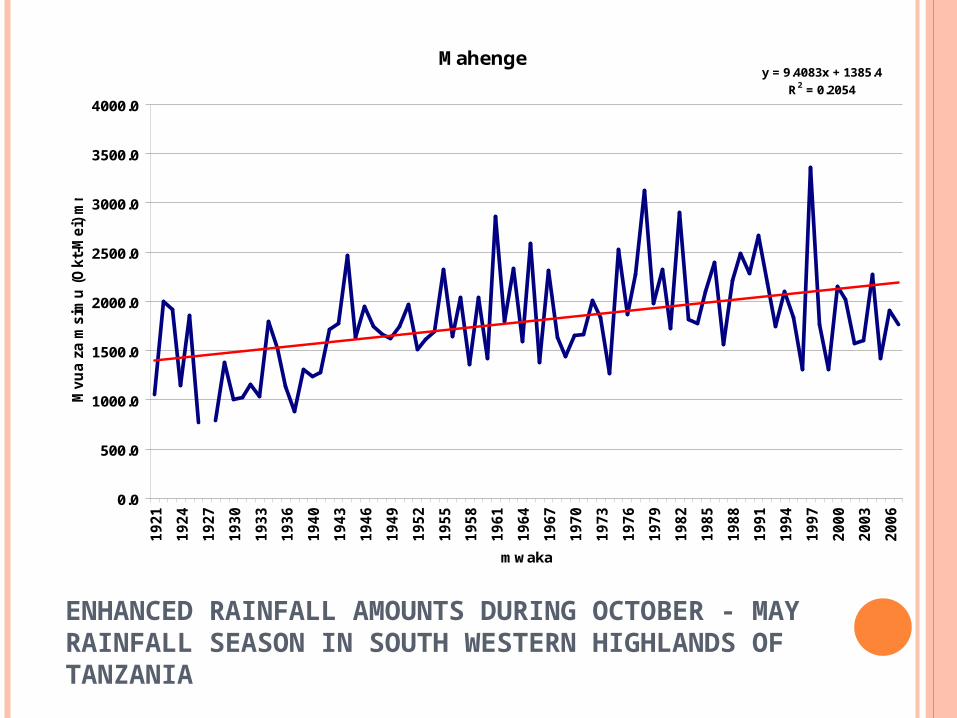
ENHANCED RAINFALL AMOUNTS DURING OCTOBER - MAY RAINFALL SEASON IN SOUTH WESTERN HIGHLANDS OF TANZANIA
Mahengey = 9.4083x + 1385.4
R2 = 0.2054
0.0
500.0
1000.0
1500.0
2000.0
2500.0
3000.0
3500.0
4000.0
19
21
19
24
19
27
19
30
19
33
19
36
19
40
19
43
19
46
19
49
19
52
19
55
19
58
19
61
19
64
19
67
19
70
19
73
19
76
19
79
19
82
19
85
19
88
19
91
19
94
19
97
20
00
20
03
20
06
mwaka
Mv
ua
za
ms
imu
(O
kt-
Me
i) m
m

REDUCED FREQUENCY OF DRY SPELLS RUN DURING THE
OCTOBER – MAY RAINFALL SEASON IN SOUTH WESTERN HIGHLANDS OF TANZANIA
0
200
400
600
800
1000
1200
1400n
um
ber o
f s
pells
1 2 3 4 5 6 7 8 9 10 11 12 13 14 15 16 17 18 19 20 21 22 23 24 25 26 27 28 29
length of spells
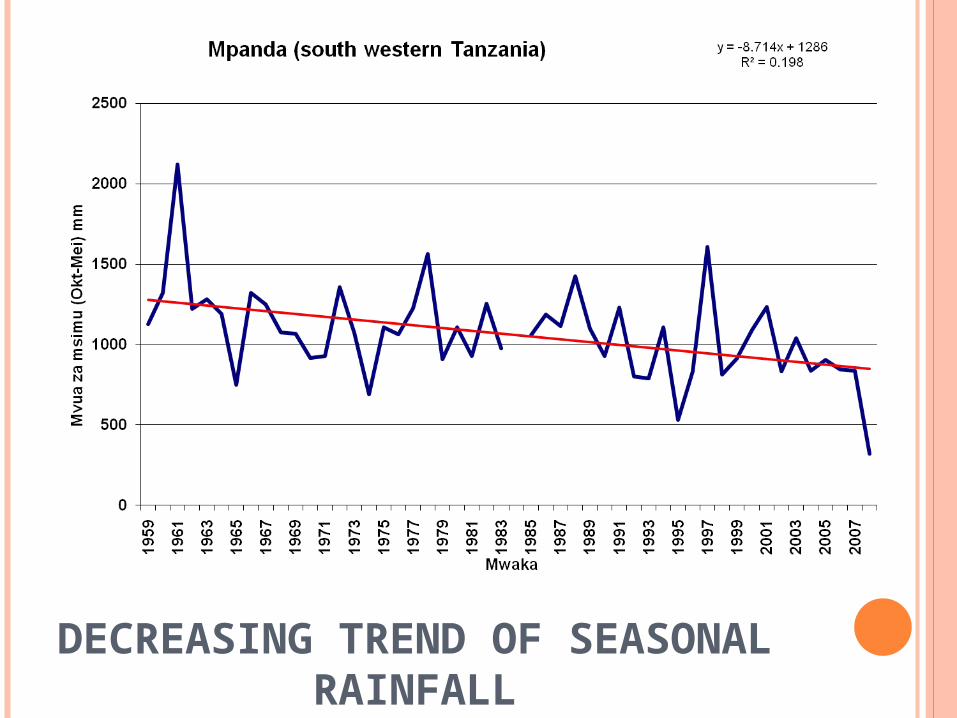
DECREASING TREND OF SEASONAL RAINFALL

Mpanda
0
0.1
0.2
0.3
0.4
0.5
0.6
0.7
0.8
0.9
1
1 10 19 28 37 46 55 64 73 82 91 100
109
118
127
136
145
154
163
172
181
190
199
208
217
226
Oct Nov Dec Jan Feb Mar Apr May
Day of the Season
Pro
babi
lity
of d
ry s
pell
of a
t lea
st 7
day
s
Pr>7(1959-1983) Pr>7(1984-2007)
Risk of dry spells of at least 7 days at Mpanda in western Tanzania

Mpanda
0
0.1
0.2
0.3
0.4
0.5
0.6
0.7
0.8
0.9
11
10 19 28 37 46 55 64 73 82 91
100
109
118
127
136
145
154
163
172
181
190
199
208
217
226
Oct Nov Dec Jan Feb Mar Apr May
Day of the season
Pro
babi
lity
of d
ry s
pells
of a
t lea
st 1
0 da
ys
Pr>10(1959-83) Pr>10(1984-2007)
Risk of dry spells of at least 10 days at Mpanda in western Tanzania
Mpanda
0
0.1
0.2
0.3
0.4
0.5
0.6
0.7
0.8
0.9
1
1
10 19 28 37 46 55 64 73 82 91
100
109
118
127
136
145
154
163
172
181
190
199
208
217
226
Oct Nov Dec Jan Feb Mar Apr May
Day of the season
Prob
abili
ty o
f at l
east
15
days
Pr>15(1959-1983) Pr>15(1984-2007)
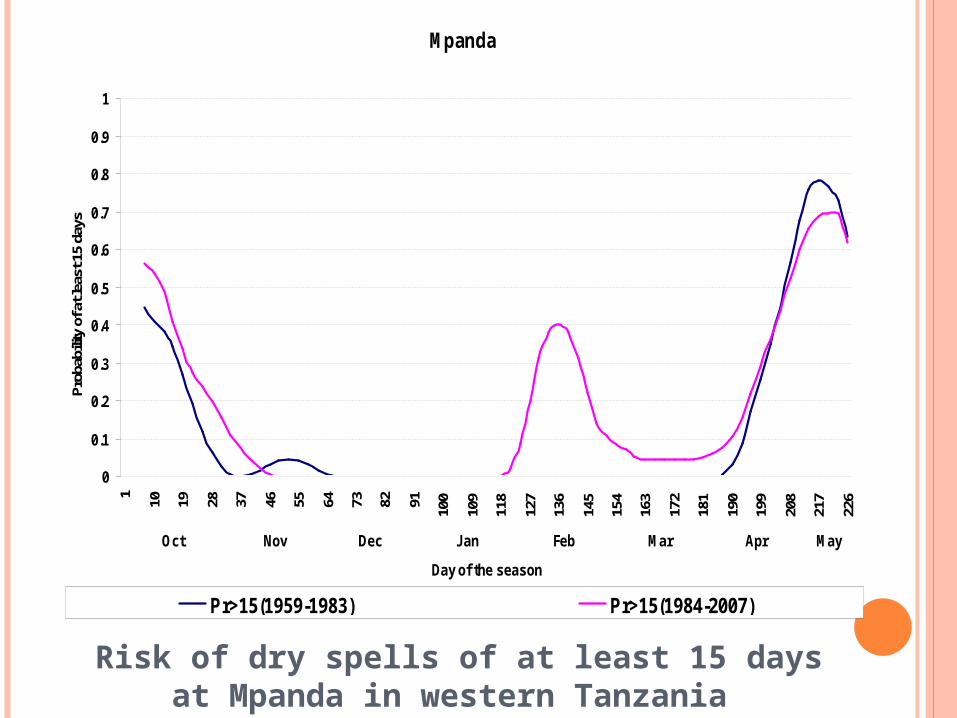
Risk of dry spells of at least 15 days at Mpanda in western Tanzania
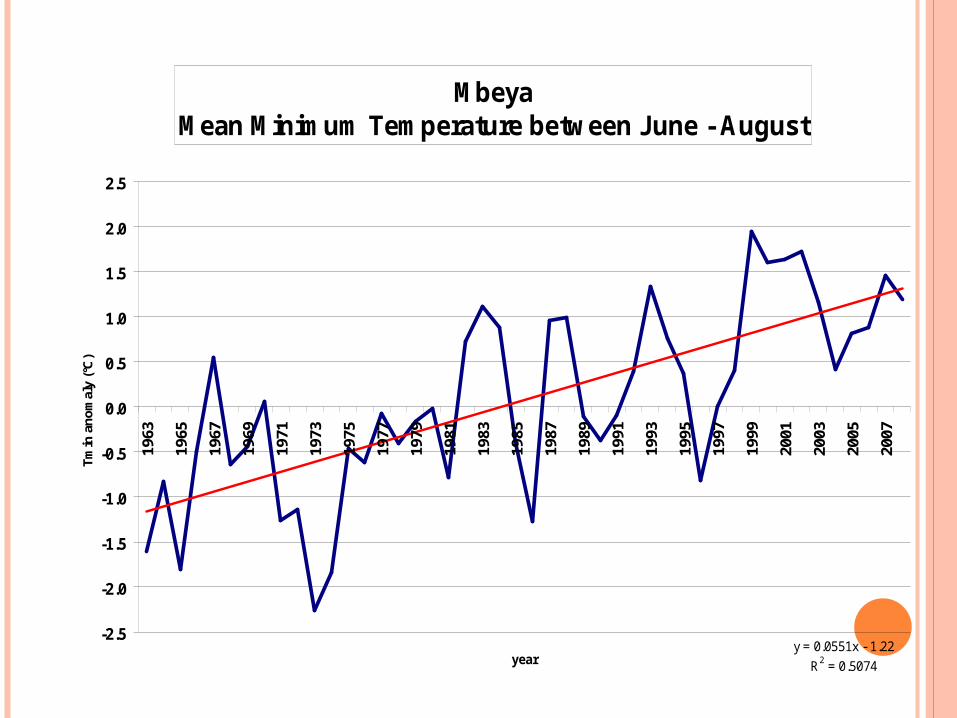
Mbeya Mean Minimum Temperature between June - August
y = 0.0551x - 1.22
R2 = 0.5074
-2.5
-2.0
-1.5
-1.0
-0.5
0.0
0.5
1.0
1.5
2.0
2.5
1963
1965
1967
1969
1971
1973
1975
1977
1979
1981
1983
1985
1987
1989
1991
1993
1995
1997
1999
2001
2003
2005
2007
year
Tm
in a
no
mal
y (°
C)

1975 1980 1985 1990 1995 2000 2005 2010
Da
ys
0
50
100
150
200
250
300
Mornings Evenings
INCREASED NUMBER OF DAYS ALONG TANZANIAN COAST (ZANZIBAR) WITH WINDS GREATER THAN 5
METERS PER SECOND

POSSIBLE CAUSES

DEFORESTATION PROCESSES
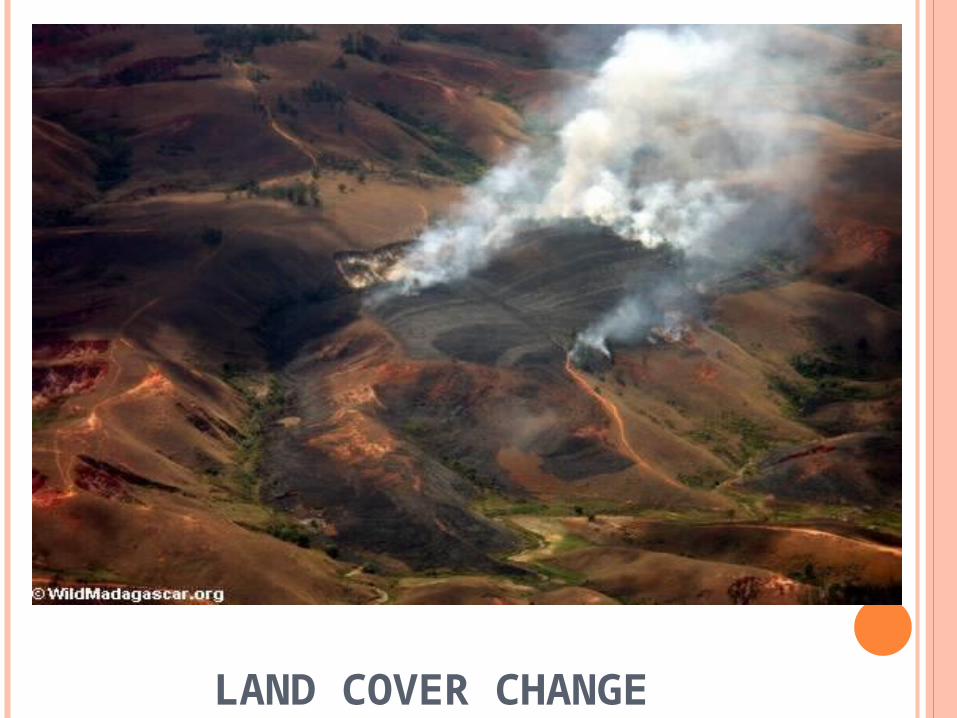
LAND COVER CHANGE

NATURAL CAUSES
January 18 2008 eruption at the Oldonyo Lengai , North Tanzania (Phil & Celeste Benham).
February 6, 2008 - eruptive phase of Oldonyo Lengai. Plume is estimated to rise to 12 kilometres above the ground (Gerrit Jan Plaisier and Rob Alakopsa of KLM Royal Dutch Airlines)

GREEN HOUSE GASES (IPCC REPORTS 1-4)
www.abcnews.com/sections/us/global106.html

IMPACTS

FOOD INSECURITY
AND EXACERBAT
ED MALNUTRITI
ON IN TANZANIA
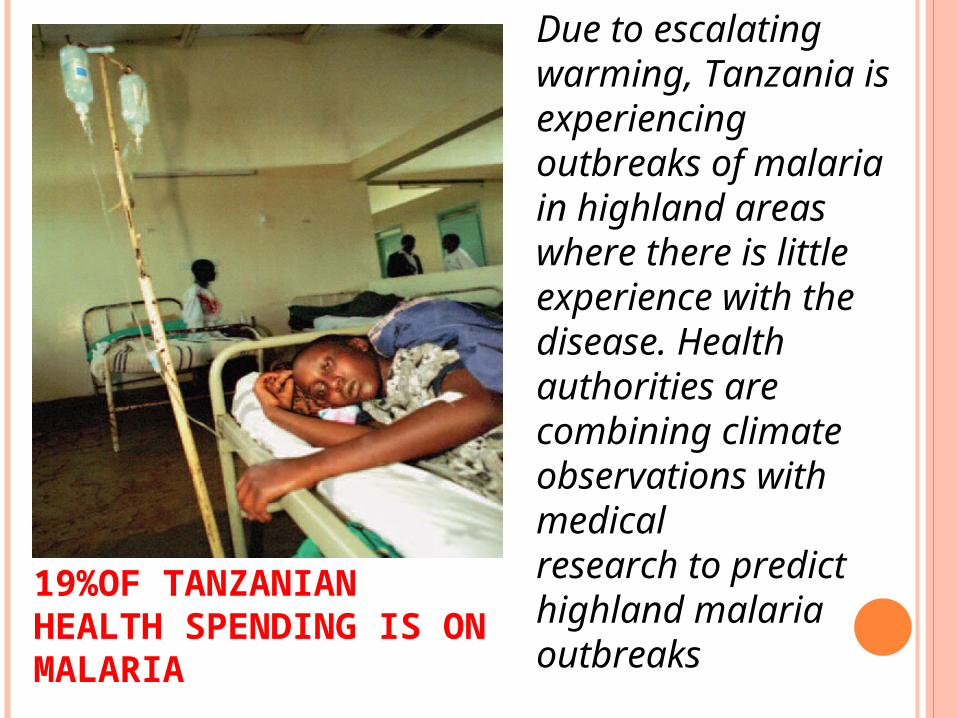
19%OF TANZANIAN HEALTH SPENDING IS ON MALARIA
Due to escalating warming, Tanzania is experiencing outbreaks of malaria in highland areas where there is littleexperience with the disease. Health authorities are combining climate observations with medicalresearch to predict highland malaria outbreaks

Afternoon winds are consistently stronger than morning winds which translate into enhanced
production of damaging erosion capability including tidal effects especially during the period between
September and December.
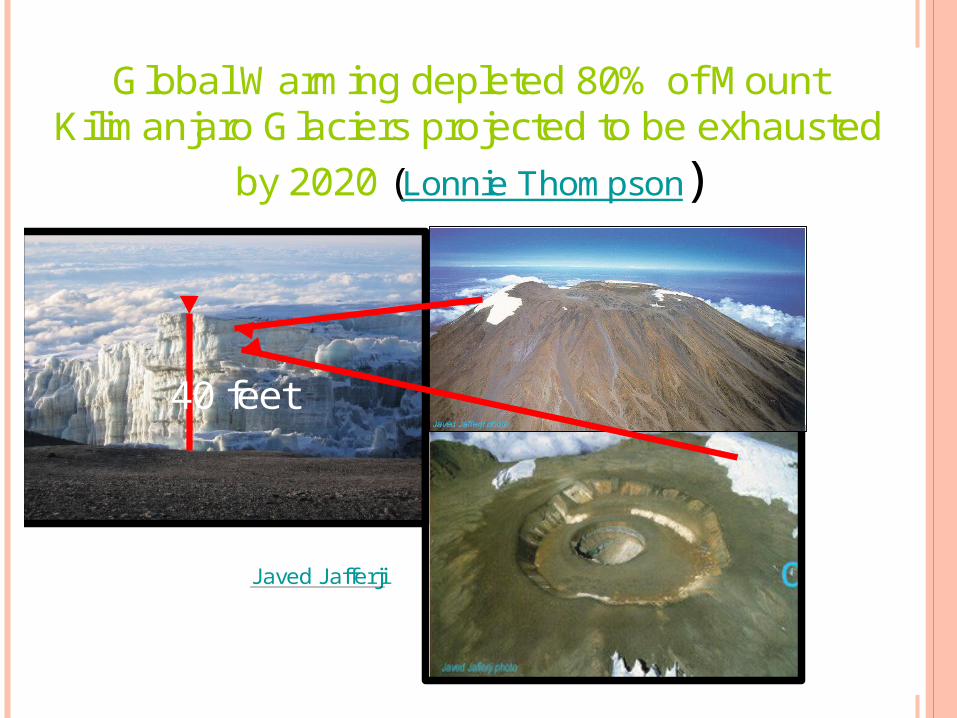
Global Warming depleted 80% of Mount Kilimanjaro Glaciers projected to be exhausted
by 2020 (Lonnie Thompson)
Javed Jafferji
40 feet

Gross Poverty

AHSANTE SANA