indicators of climate change in california: report · pdf fileindicators of climate change in...
TRANSCRIPT
Indicators of Climate Change
in California
Edmund G. Brown Jr. Governor
Matthew Rodriquez Secretary for
Environmental Protection
George Alexeeff, Ph.D. Director, Office of Environmental
Health Hazard Assessment
Report Summary
August 2013
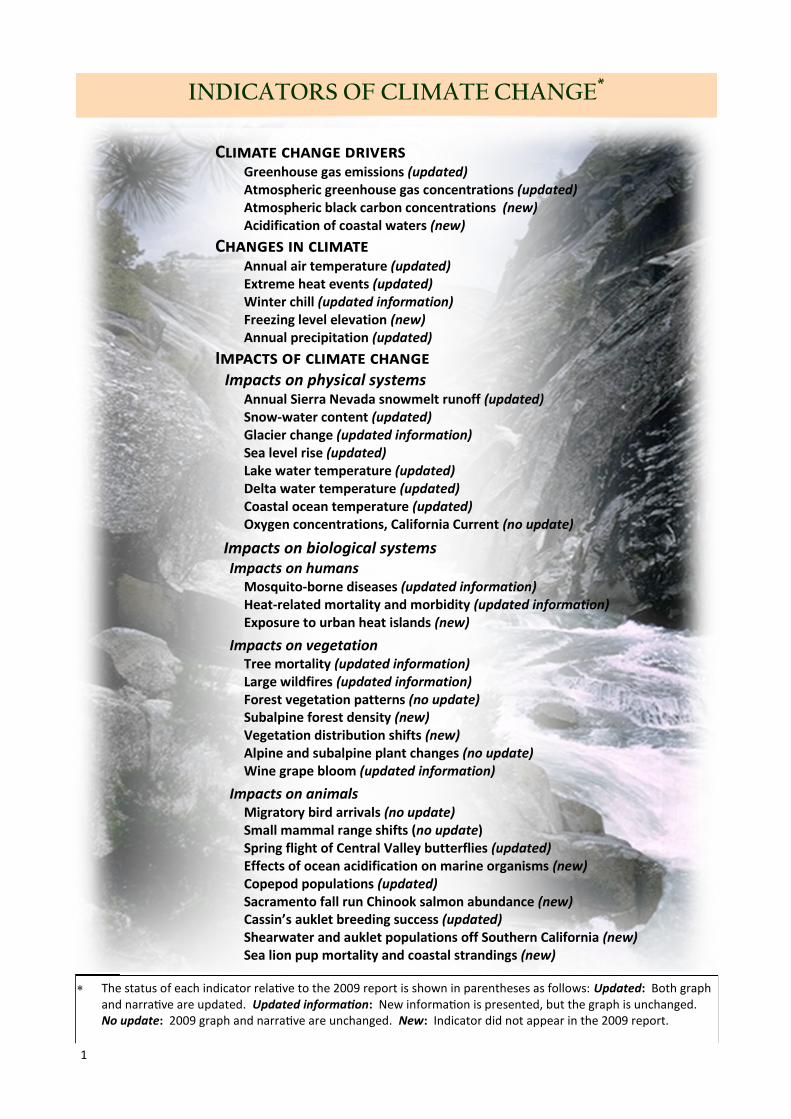
INDICATORS OF CLIMATE CHANGE*
1
Climate change drivers Greenhouse gas emissions (updated) Atmospheric greenhouse gas concentrations (updated) Atmospheric black carbon concentrations (new) Acidification of coastal waters (new)
Changes in climate Annual air temperature (updated) Extreme heat events (updated) Winter chill (updated information) Freezing level elevation (new) Annual precipitation (updated)
Impacts of climate change Impacts on physical systems
Annual Sierra Nevada snowmelt runoff (updated) Snow-water content (updated) Glacier change (updated information) Sea level rise (updated) Lake water temperature (updated) Delta water temperature (updated) Coastal ocean temperature (updated) Oxygen concentrations, California Current (no update)
Impacts on biological systems Impacts on humans
Mosquito-borne diseases (updated information) Heat-related mortality and morbidity (updated information) Exposure to urban heat islands (new)
Impacts on vegetation Tree mortality (updated information) Large wildfires (updated information) Forest vegetation patterns (no update) Subalpine forest density (new) Vegetation distribution shifts (new) Alpine and subalpine plant changes (no update) Wine grape bloom (updated information)
Impacts on animals Migratory bird arrivals (no update) Small mammal range shifts (no update) Spring flight of Central Valley butterflies (updated) Effects of ocean acidification on marine organisms (new) Copepod populations (updated) Sacramento fall run Chinook salmon abundance (new) Cassin’s auklet breeding success (updated) Shearwater and auklet populations off Southern California (new) Sea lion pup mortality and coastal strandings (new)
The status of each indicator relative to the 2009 report is shown in parentheses as follows: Updated: Both graph and narrative are updated. Updated information: New information is presented, but the graph is unchanged. No update: 2009 graph and narrative are unchanged. New: Indicator did not appear in the 2009 report.
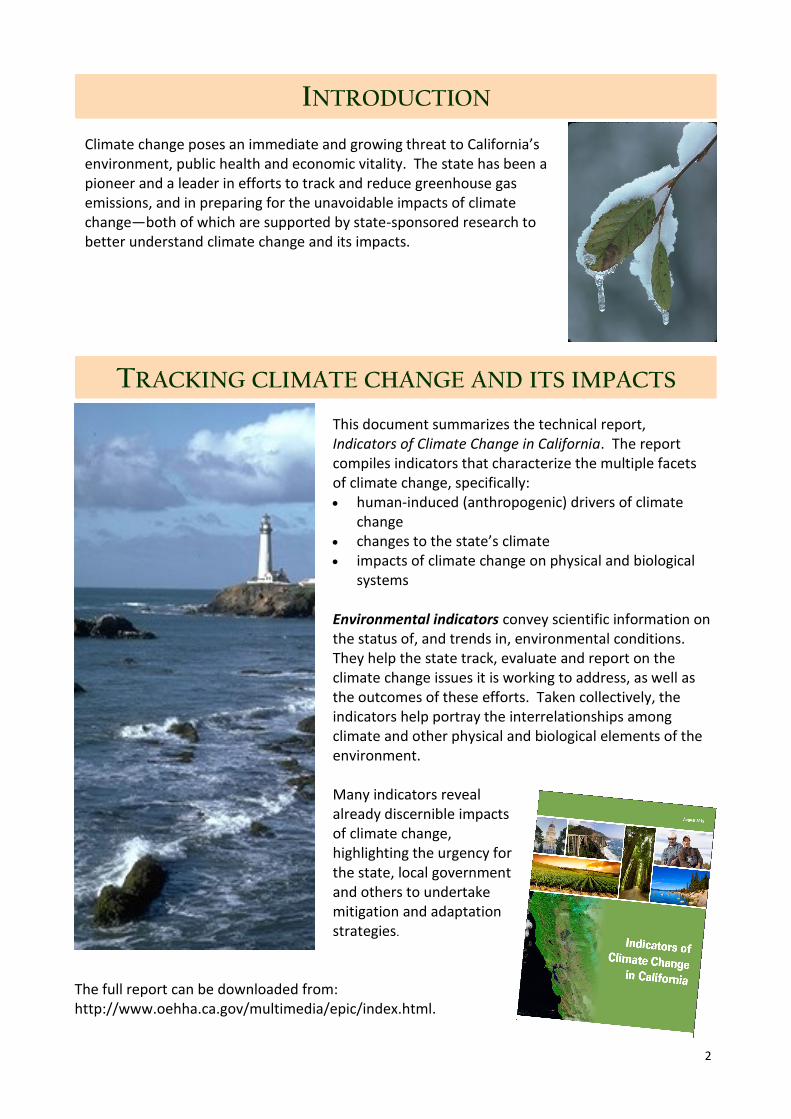
Climate change poses an immediate and growing threat to California’s environment, public health and economic vitality. The state has been a pioneer and a leader in efforts to track and reduce greenhouse gas emissions, and in preparing for the unavoidable impacts of climate change—both of which are supported by state-sponsored research to better understand climate change and its impacts.
INTRODUCTION
TRACKING CLIMATE CHANGE AND ITS IMPACTS
This document summarizes the technical report, Indicators of Climate Change in California. The report compiles indicators that characterize the multiple facets of climate change, specifically: human-induced (anthropogenic) drivers of climate
change changes to the state’s climate impacts of climate change on physical and biological
systems
Environmental indicators convey scientific information on the status of, and trends in, environmental conditions. They help the state track, evaluate and report on the climate change issues it is working to address, as well as the outcomes of these efforts. Taken collectively, the indicators help portray the interrelationships among climate and other physical and biological elements of the environment.
Many indicators reveal already discernible impacts of climate change, highlighting the urgency for the state, local government and others to undertake mitigation and adaptation strategies.
The full report can be downloaded from: http://www.oehha.ca.gov/multimedia/epic/index.html.
2
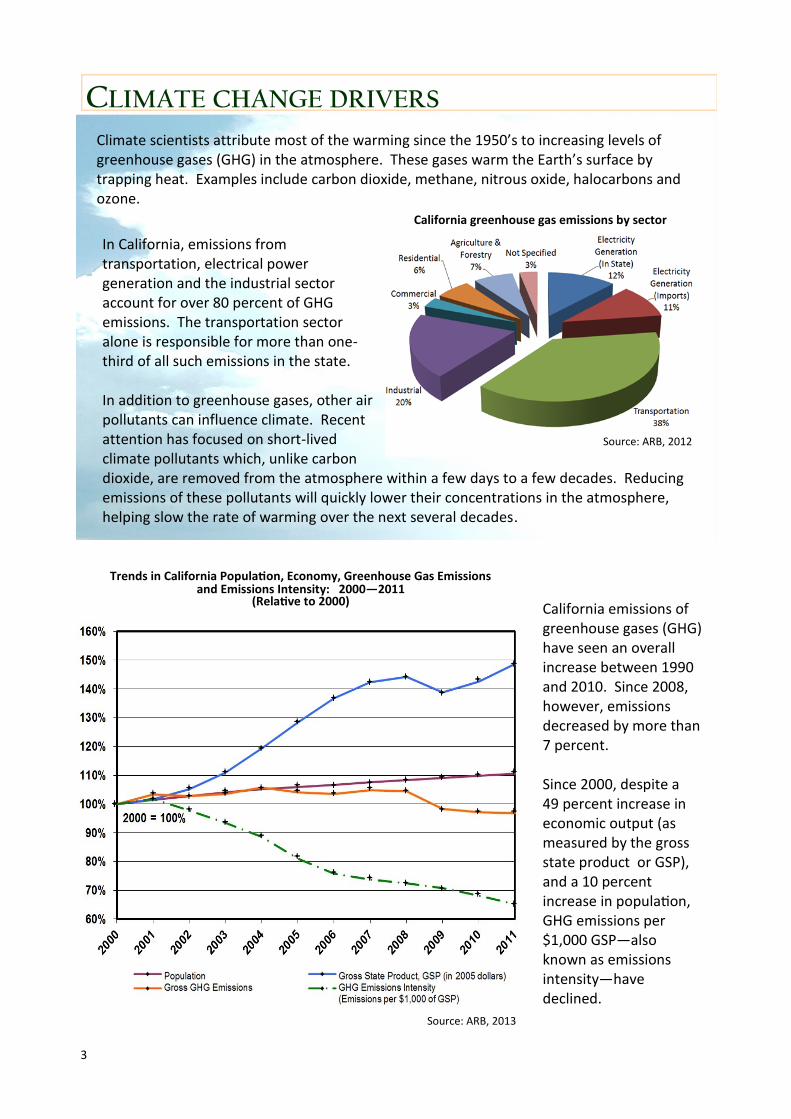
CLIMATE CHANGE DRIVERS
Climate scientists attribute most of the warming since the 1950’s to increasing levels of greenhouse gases (GHG) in the atmosphere. These gases warm the Earth’s surface by trapping heat. Examples include carbon dioxide, methane, nitrous oxide, halocarbons and ozone.
In California, emissions from transportation, electrical power generation and the industrial sector account for over 80 percent of GHG emissions. The transportation sector alone is responsible for more than one-third of all such emissions in the state.
In addition to greenhouse gases, other air pollutants can influence climate. Recent attention has focused on short-lived climate pollutants which, unlike carbon dioxide, are removed from the atmosphere within a few days to a few decades. Reducing emissions of these pollutants will quickly lower their concentrations in the atmosphere, helping slow the rate of warming over the next several decades.
California greenhouse gas emissions by sector
Source: ARB, 2012
Trends in California Population, Economy, Greenhouse Gas Emissions and Emissions Intensity: 2000—2011
(Relative to 2000) California emissions of greenhouse gases (GHG) have seen an overall increase between 1990 and 2010. Since 2008, however, emissions decreased by more than 7 percent.
Since 2000, despite a 49 percent increase in economic output (as measured by the gross state product or GSP), and a 10 percent increase in population, GHG emissions per $1,000 GSP—also known as emissions intensity—have declined.
Source: ARB, 2013
3
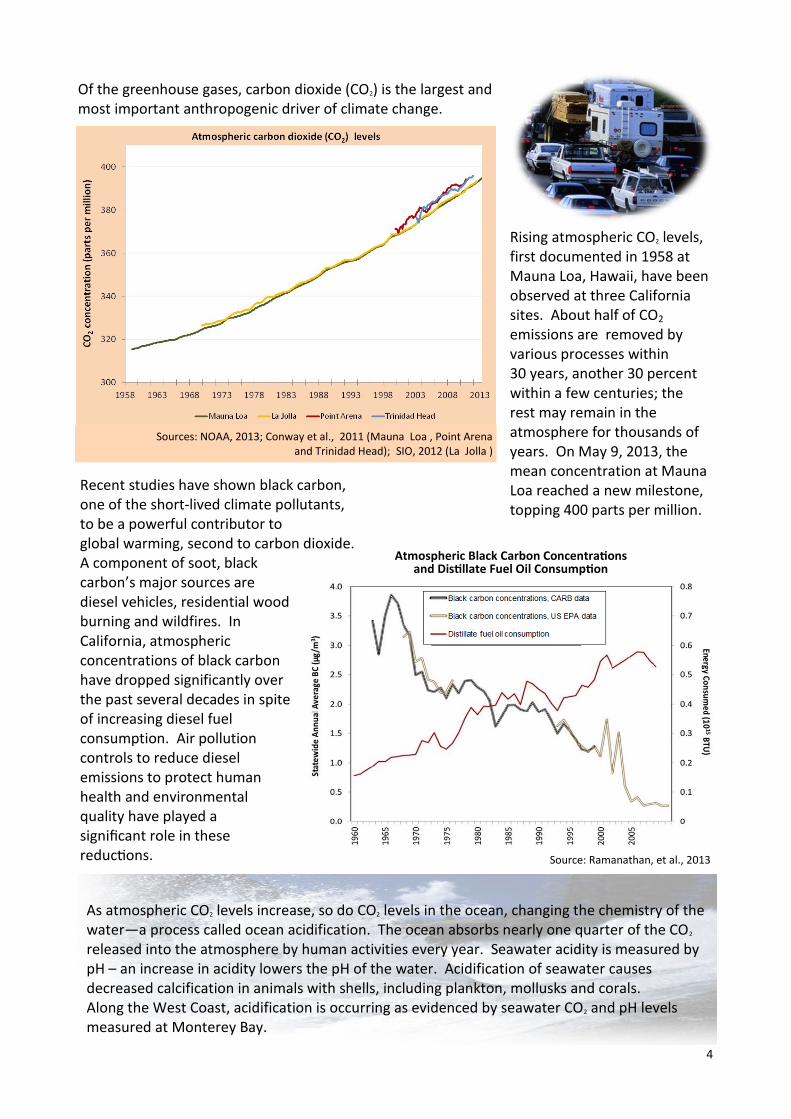
Of the greenhouse gases, carbon dioxide (CO2) is the largest andmost important anthropogenic driver of climate change.
4
Rising atmospheric CO2 levels, first documented in 1958 at Mauna Loa, Hawaii, have been observed at three California sites. About half of CO2 emissions are removed by various processes within 30 years, another 30 percent within a few centuries; the rest may remain in the atmosphere for thousands of years. On May 9, 2013, the mean concentration at Mauna Loa reached a new milestone, topping 400 parts per million.
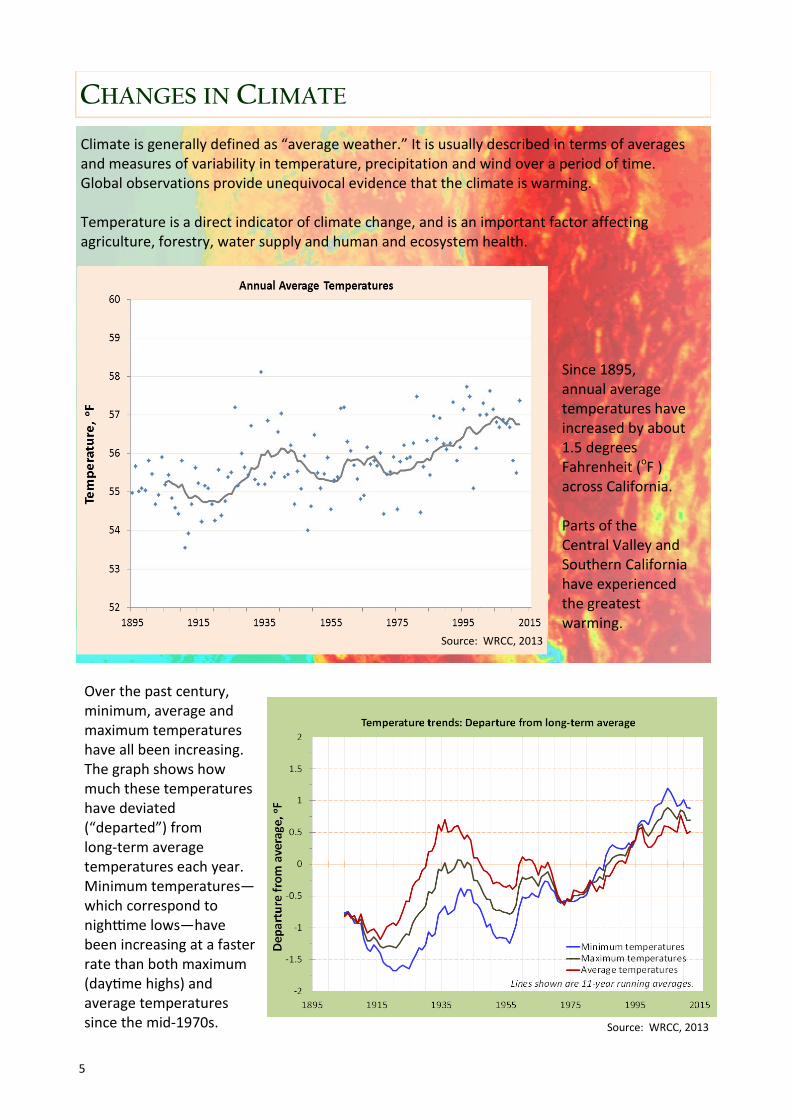
Recent studies have shown black carbon, one of the short-lived climate pollutants, to be a powerful contributor to global warming, second to carbon dioxide.A component of soot, black carbon’s major sources are diesel vehicles, residential wood burning and wildfires. In California, atmospheric concentrations of black carbon have dropped significantly over the past several decades in spite of increasing diesel fuel consumption. Air pollution controls to reduce diesel emissions to protect human health and environmental quality have played a significant role in these reductions.
As atmospheric CO2 levels increase, so do CO2 levels in the ocean, changing the chemistry of the water—a process called ocean acidification. The ocean absorbs nearly one quarter of the CO2 released into the atmosphere by human activities every year. Seawater acidity is measured by pH – an increase in acidity lowers the pH of the water. Acidification of seawater causes decreased calcification in animals with shells, including plankton, mollusks and corals. Along the West Coast, acidification is occurring as evidenced by seawater CO2 and pH levels measured at Monterey Bay.
Sources: NOAA, 2013; Conway et al., 2011 (Mauna Loa , Point Arena and Trinidad Head); SIO, 2012 (La Jolla )
Source: Ramanathan, et al., 2013
Atmospheric Black Carbon Concentrations and Distillate Fuel Oil Consumption
5
CHANGES IN CLIMATE
Climate is generally defined as “average weather.” It is usually described in terms of averages and measures of variability in temperature, precipitation and wind over a period of time. Global observations provide unequivocal evidence that the climate is warming.
Temperature is a direct indicator of climate change, and is an important factor affecting agriculture, forestry, water supply and human and ecosystem health.
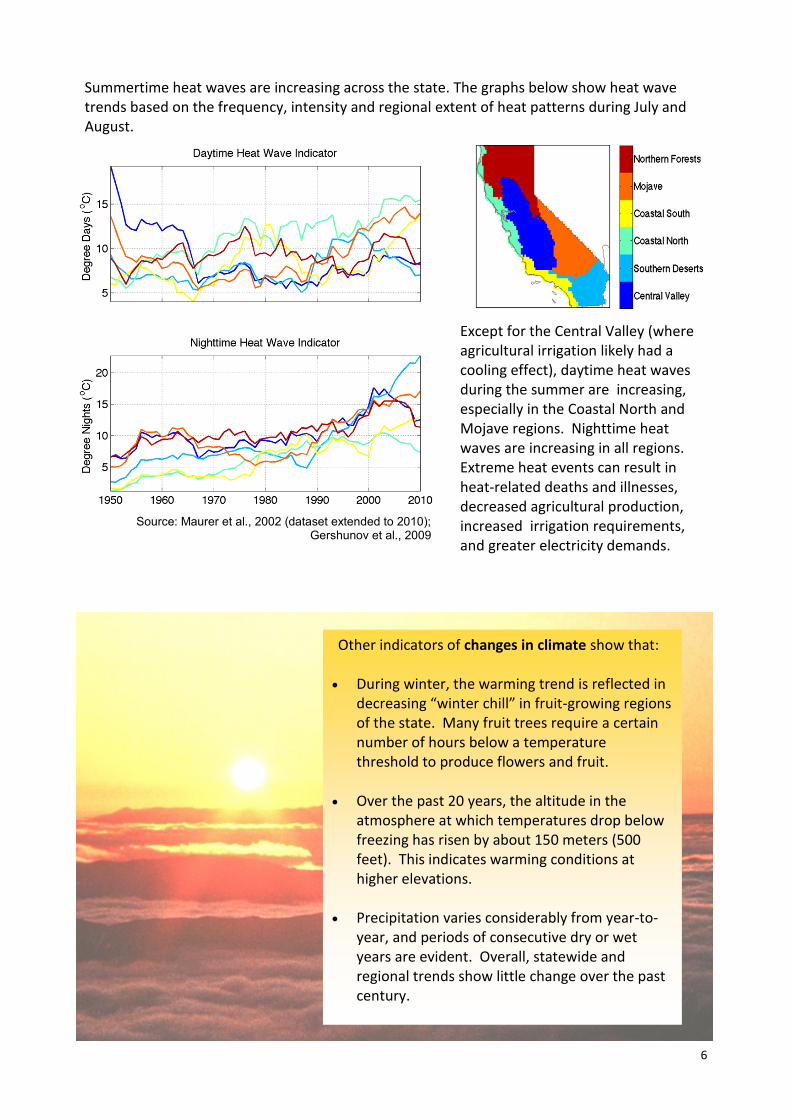
Since 1895, annual average temperatures have increased by about 1.5 degrees Fahrenheit (oF ) across California.
Parts of the Central Valley and Southern California have experienced the greatest warming.
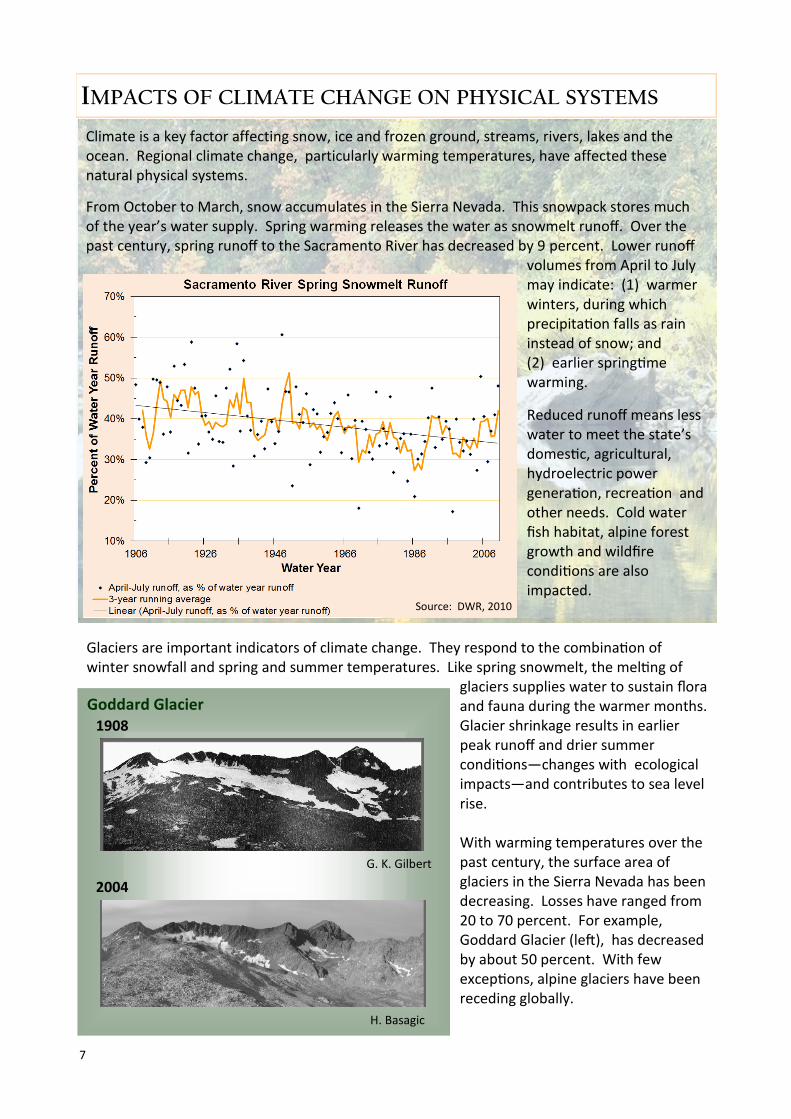
Over the past century, minimum, average and maximum temperatures have all been increasing. The graph shows how much these temperatures have deviated (“departed”) from long-term average temperatures each year. Minimum temperatures—which correspond to nighttime lows—have been increasing at a faster rate than both maximum (daytime highs) and average temperatures since the mid-1970s.
Source: WRCC, 2013
Source: WRCC, 2013
Summertime heat waves are increasing across the state. The graphs below show heat wave trends based on the frequency, intensity and regional extent of heat patterns during July and August.
Except for the Central Valley (where agricultural irrigation likely had a cooling effect), daytime heat waves during the summer are increasing, especially in the Coastal North and Mojave regions. Nighttime heat waves are increasing in all regions.Extreme heat events can result in heat-related deaths and illnesses, decreased agricultural production, increased irrigation requirements, and greater electricity demands.
Source: Maurer et al., 2002 (dataset extended to 2010); Gershunov et al., 2009
Other indicators of changes in climate show that:
During winter, the warming trend is reflected indecreasing “winter chill” in fruit-growing regionsof the state. Many fruit trees require a certainnumber of hours below a temperaturethreshold to produce flowers and fruit.
Over the past 20 years, the altitude in theatmosphere at which temperatures drop belowfreezing has risen by about 150 meters (500feet). This indicates warming conditions athigher elevations.
Precipitation varies considerably from year-to-year, and periods of consecutive dry or wetyears are evident. Overall, statewide andregional trends show little change over the pastcentury.
6
IMPACTS OF CLIMATE CHANGE ON PHYSICAL SYSTEMS
Glaciers are important indicators of climate change. They respond to the combination of winter snowfall and spring and summer temperatures. Like spring snowmelt, the melting of
glaciers supplies water to sustain flora and fauna during the warmer months. Glacier shrinkage results in earlier peak runoff and drier summer conditions—changes with ecological impacts—and contributes to sea level rise.
With warming temperatures over the past century, the surface area of glaciers in the Sierra Nevada has been decreasing. Losses have ranged from 20 to 70 percent. For example, Goddard Glacier (left), has decreased by about 50 percent. With few exceptions, alpine glaciers have been receding globally.
7
Goddard Glacier 1908
G. K. Gilbert
2004
H. Basagic
Climate is a key factor affecting snow, ice and frozen ground, streams, rivers, lakes and the ocean. Regional climate change, particularly warming temperatures, have affected these natural physical systems.
From October to March, snow accumulates in the Sierra Nevada. This snowpack stores much of the year’s water supply. Spring warming releases the water as snowmelt runoff. Over the past century, spring runoff to the Sacramento River has decreased by 9 percent. Lower runoff
volumes from April to July may indicate: (1) warmer winters, during which precipitation falls as rain instead of snow; and (2) earlier springtime warming.
Reduced runoff means less water to meet the state’s domestic, agricultural, hydroelectric power generation, recreation and other needs. Cold water fish habitat, alpine forest growth and wildfire conditions are also impacted.
Source: DWR, 2010
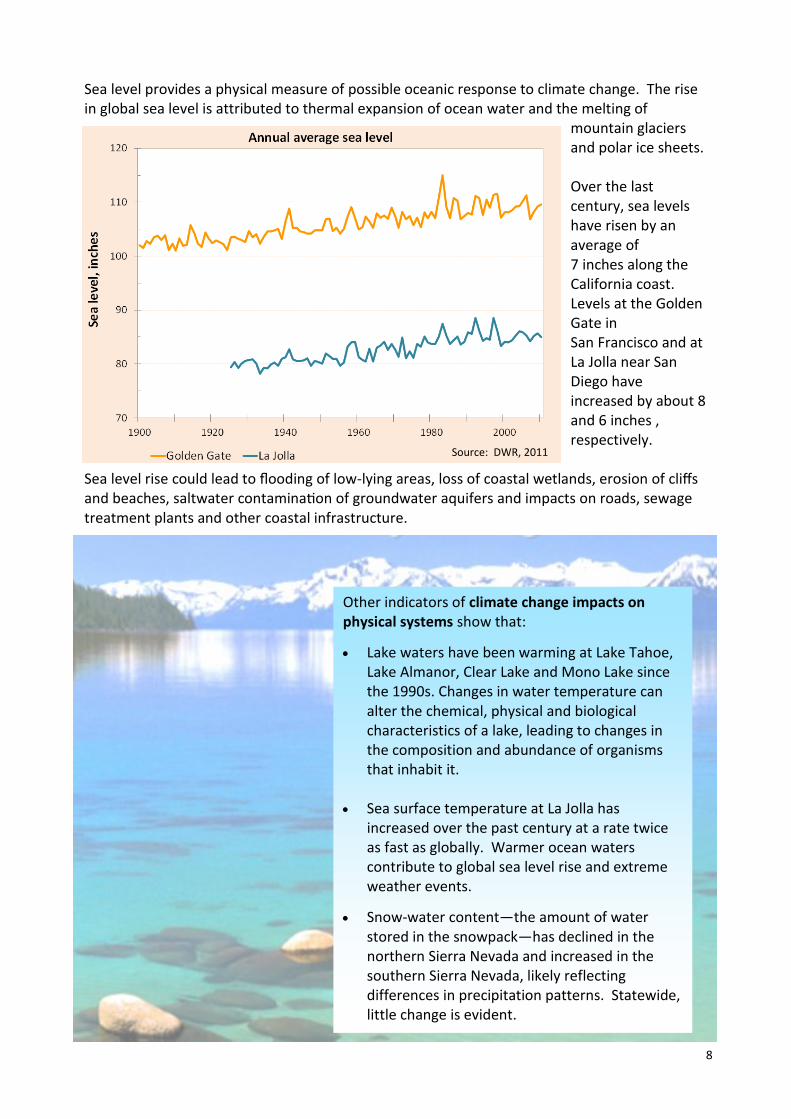
Sea level provides a physical measure of possible oceanic response to climate change. The rise in global sea level is attributed to thermal expansion of ocean water and the melting of
mountain glaciers and polar ice sheets.
Over the last century, sea levels have risen by an average of 7 inches along the California coast. Levels at the Golden Gate in San Francisco and at La Jolla near San Diego have increased by about 8 and 6 inches , respectively.
Sea level rise could lead to flooding of low-lying areas, loss of coastal wetlands, erosion of cliffs and beaches, saltwater contamination of groundwater aquifers and impacts on roads, sewage treatment plants and other coastal infrastructure.
8
Other indicators of climate change impacts on physical systems show that:
Lake waters have been warming at Lake Tahoe,Lake Almanor, Clear Lake and Mono Lake sincethe 1990s. Changes in water temperature canalter the chemical, physical and biologicalcharacteristics of a lake, leading to changes inthe composition and abundance of organismsthat inhabit it.
Sea surface temperature at La Jolla hasincreased over the past century at a rate twiceas fast as globally. Warmer ocean waterscontribute to global sea level rise and extremeweather events.
Snow-water content—the amount of waterstored in the snowpack—has declined in thenorthern Sierra Nevada and increased in thesouthern Sierra Nevada, likely reflectingdifferences in precipitation patterns. Statewide,little change is evident.
Source: DWR, 2011
Plants and animals reproduce, grow and survive within specific habitat ranges defined by climatic and environmental conditions. Changes in these conditions may threaten the ability of species to survive or thrive. Shifts in the habitat elevation or latitude, changes in the timing of growth stages, changes in abundance and community composition, and increased vulnerability to wildfires or pathogens are examples of biological responses that have been influenced by warming temperatures. In addition, warmer temperatures can affect human health in a number of direct and indirect ways.
IMPACTS OF CLIMATE CHANGE ON BIOLOGICAL SYSTEMS
9
Ocean conditions—including currents, winds and temperature—strongly influence marine populations. The following population changes may be related to ocean warming and changes in the distribution and abundance of prey:
A dramatic decline in fall-run Chinook salmonabundance in the Central California regionsince 2004.
More variable Cassin’s auklet breedingsuccess on the Southeast Farallon Islands offthe California coast, with unprecedentedreproductive failures in 2005 and 2006, andrecord high productivity in 2010.
Significant declines in sooty shearwater andCassin’s auklet populations at sea in SouthernCalifornia over the past 24 years.
Increased California sea lion pup mortalityand stranding of yearling pups.
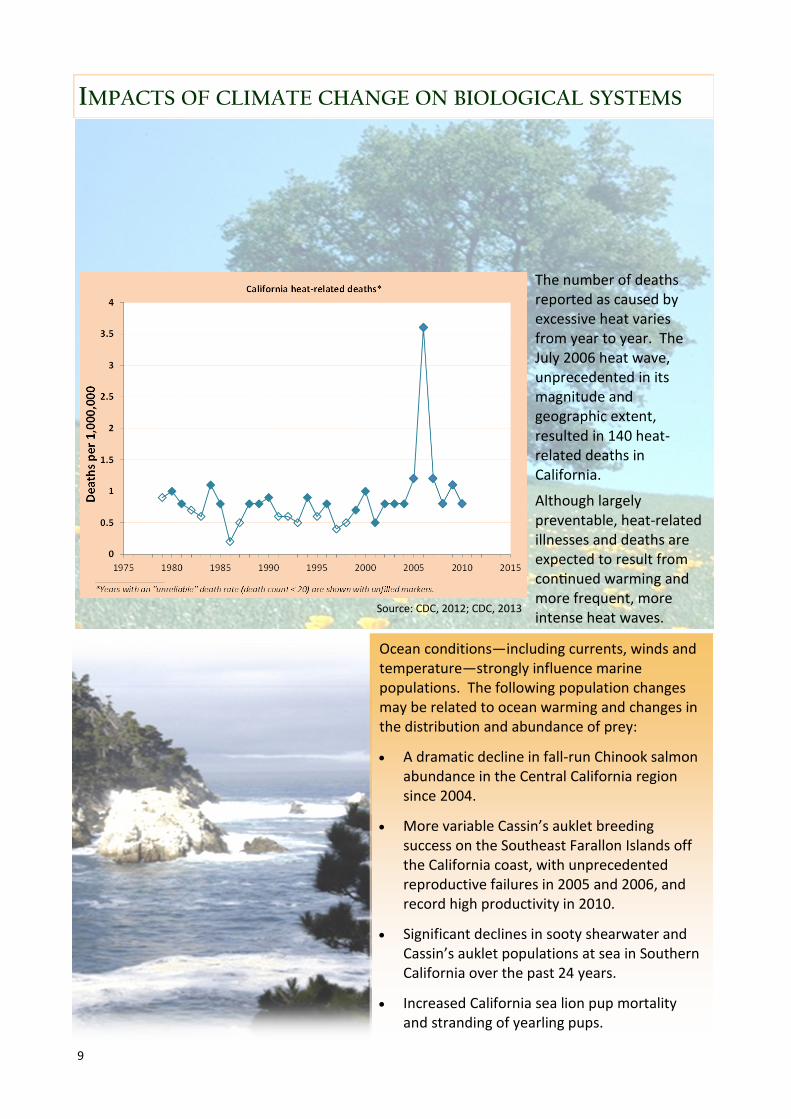
The number of deaths reported as caused by excessive heat varies from year to year. The July 2006 heat wave, unprecedented in its magnitude and geographic extent, resulted in 140 heat-related deaths in California.
Although largely preventable, heat-related illnesses and deaths are expected to result from continued warming and more frequent, more intense heat waves.
Source: CDC, 2012; CDC, 2013
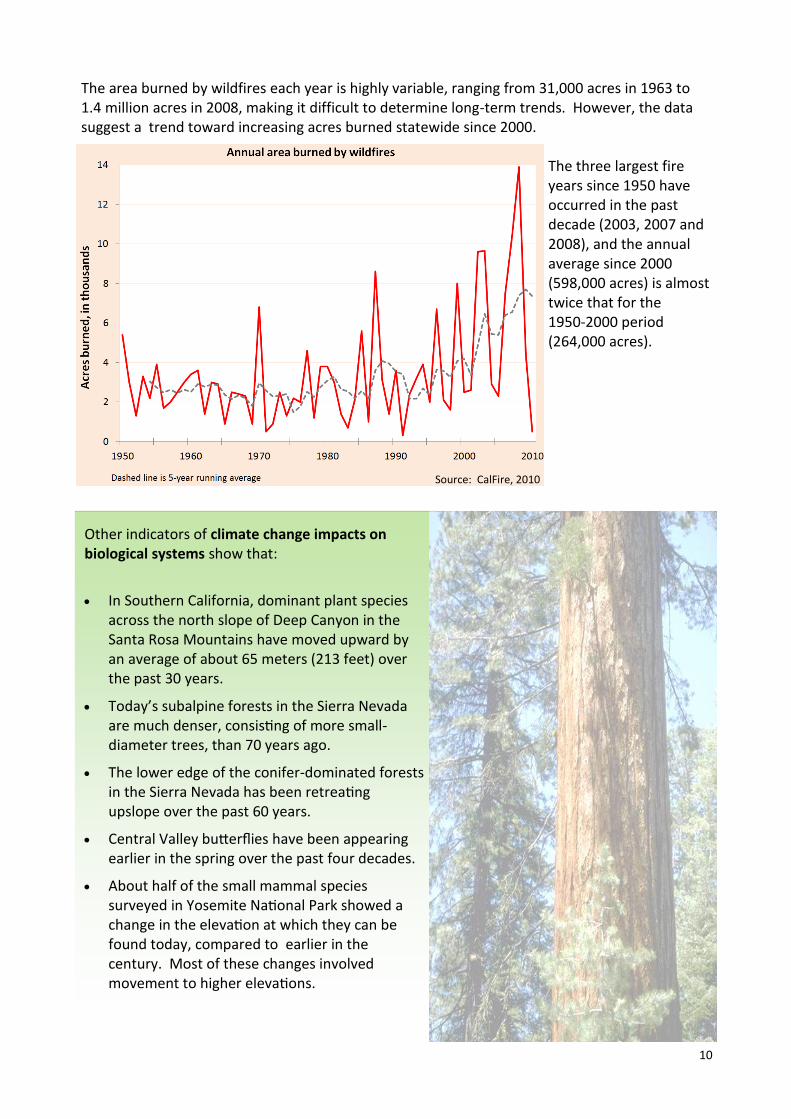
The area burned by wildfires each year is highly variable, ranging from 31,000 acres in 1963 to 1.4 million acres in 2008, making it difficult to determine long-term trends. However, the data suggest a trend toward increasing acres burned statewide since 2000.
The three largest fire years since 1950 have occurred in the past decade (2003, 2007 and 2008), and the annual average since 2000 (598,000 acres) is almost twice that for the 1950-2000 period (264,000 acres).
Other indicators of climate change impacts on biological systems show that:
In Southern California, dominant plant speciesacross the north slope of Deep Canyon in theSanta Rosa Mountains have moved upward byan average of about 65 meters (213 feet) overthe past 30 years.
Today’s subalpine forests in the Sierra Nevadaare much denser, consisting of more small-diameter trees, than 70 years ago.
The lower edge of the conifer-dominated forestsin the Sierra Nevada has been retreatingupslope over the past 60 years.
Central Valley butterflies have been appearingearlier in the spring over the past four decades.
About half of the small mammal speciessurveyed in Yosemite National Park showed achange in the elevation at which they can befound today, compared to earlier in thecentury. Most of these changes involvedmovement to higher elevations.
10
Source: CalFire, 2010
EMERGING ISSUES
11
The Office of Environmental Health Hazard Assessment is grateful to the Cal/EPA Office of the Secretary
and to the technical staff and researchers
who contributed their ideas, data, findings and other information for inclusion in
Indicators of Climate Change in California.
(A full list of these contributors can be found in the technical report.)
Cover design: California Air Resources Board Document Design: Angela De Palma-Dow and Carolyn Flowers, OEHHA Photo Credits: Page 1: Merced River Canyon—George G. Hawxhurst ©California Academy of Sciences; Page 2: Frost on leaf—Albert P. Bekker ©California Academy of Sciences; Pigeon Point Lighthouse, Jo-Ann Ordano ©California
Academy of Sciences; Page 5: Satellite image of springtime heat wave, May 2004—NASA; Page 6: Sunset over Mt. Whitney—©Roy Collett; Page 7: Yosemite fall colors—Sherry Ballard ©California Academy of Sciences; Page 8: Lake Tahoe—California Tahoe Conservancy, 2009; Page 9: Poppy field in Sutter Buttes—©Marc Hoshovsky; Pt. Lobos—©2005 Dee E. Warenycia; Page 10: Caribou Wilderness ©Marc Hoshovsky; Page 11: Mono Lake—Fritz Olenberger
Possible climate-related changes and impacts in California that are plausibly—but not yet established to be—influenced by climate change are referred to here as emerging issues. These may, in the future, be tracked as indicators of climate change once sufficient data become available. The following are examples of environmental changes that have been hypothesized to occur or to intensify due to climate change: · The growth, geographic distribution and toxicity of harmful algal blooms may be
impacted by warmer ocean temperatures, increases in carbon dioxide in seawater, and alteration of marine wind and water circulation patterns.
· Anecdotal evidence suggests that Central Valley winters are less foggy than they were
a few decades ago. Valley fog promotes colder temperatures during the winter—a critical factor for fruit production in agricultural regions.
· In recent decades, billions of coniferous trees have been killed by native bark beetles
in Western US forests, and several of the current outbreaks are among the largest and most severe in recorded history. Increasing temperature, precipitation shifts and extreme weather events appear to be factors driving at least some of the current bark beetle outbreaks.
· In the coming decades, it is likely that California will be faced with increased impacts
from extreme events including droughts and floods.
ACKNOWLEDGMENTS
REFERENCES ARB (2013). Air Resources Board, Planning and Technical Support Division, Emission Inventory Analysis Section. Cal/EPA. Sacramento, CA.
Basagic HJ (2008). "Quantifying Twentieth Century Glacier Change in the Sierra Nevada, California." Portland State University. Master of Science. http://www.glaciers.pdx.edu/Thesis/Basagic/basagic_thesis_2008.pdf
CDC (2012): Centers for Disease Control and Prevention, National Center for Health Statistics. "Compressed Mortality File 1979-1998. CDC WONDER On-line Database, compiled from Compressed Mortality File CMF 1958-1988, Series 20, No. 2A, 2000 and CMF 1989-1998, Series 20, No. 2E, 2003." Retrieved June 15, 2012, http://wonder.cdc.gov/cmf-icd9.html.
CDC (2013): Centers for Disease Control and Prevention, National Center for Health Statistics. "Compressed Mortality File 1999-2008. CDC WONDER On-line Database, compiled from Compressed Mortality File CMF 1999-2008, Series 20, No. 2N, 2011." Retrieved July 17, 2013, http://wonder.cdc.gov/cmf-icd10.html.
CalFire (2011). Chapter 4.2. Wildfire Trends. In: Administrative Draft Environmental Impact Report: California Department of Forestry and Fire Protection.
Conway TJ, Lang PM and Masarie KA (2011). "Atmospheric Carbon Dioxide Dry Air Mole Fractions from the NOAA ESRL Carbon Cycle Cooperative Sampling Network, 1968-2010, Version: 2011-10-14." ftp://ftp.cmdl.noaa.gov/ccg/co2/flask/event.
DWR (2011). California Cooperative Snow Surveys, 1929-present. California Department of Water Resources. http://cdec.water.ca.gov/snow/current/flow/index2.html
Dlugokencky EJ, Land PM and Masarie KA (2011). "Atmospheric Methane Dry Air Mole Fractions from the NOAA ESRL Carbon Cycle Cooperative Global Air Sampling Network, 1983-2010, Version: 2011-10-14." ftp://ftp.cmdl.noaa.gov/ccg/chr/flask/event
Gershunov A, Cayan DR and Iacobellis SF (2009). The Great 2006 Heat Wave over California and Nevada: Signal of an Increasing Trend. Journal of Climate 22(23): 6181–6203. http://dx.doi.org/10.1175/2009JCLI2465.1
Gilbert GK (1904). Variations of Sierra glaciers. Sierra Club Bulletin 5(1): 20-25
Maurer EP, Wood AW, Adam JC, Lettenmaier DP and Nijssen B (2002). A long-term hydrologically based dataset of land surface fluxes and states for the conterminous United States. Journal of Climate 15(22): 3237-3251. http://dx.doi.org/10.1175/1520-0442(2002)015<3237:ALTHBD>2.0.CO;2; data updated to 2010 at: http://www.engr.scu.edu/~emaurer/gridded_obs/index_gridded_obs.html
NOAA (2011). “Tides and Currents.” Center for Operational Oceanographic Products and Services, National Oceanic and Atmospheric Administration. "National Ocean Service. CO-OPS." www.co-ops.nos.noaa.gov.
NOAA (2013a). National Oceanic and Atmospheric Administration, Earth System Research Laboratory, Global Monitoring Division. Retrieved June 20, 2013. http://www.esrl.noaa.gov/gmd/
Ramanathan, V., R. Bahadur, T.W. Kirchstetter, K.A. Prather, et al. (2013) “Black Carbon and the Regional Climate of California: Report to the Air Resources Board, Contract 08-323,” http://www.arb.ca.gov/research/apr/past/08-323.pdf
SIO (2012). "Monthly atmospheric CO2 concentrations (ppm) derived from flask air samples. La Jolla Pier, California." Scripps Institution of Oceanography. Retrieved January 20, 2012, http://scrippsco2.ucsd.edu/data/ljo.html.
WRCC (2013). "California Climate Tracker." Western Regional Climate Center. Retrieved July 9, 2013, http://www.wrcc.dri.edu/monitor/cal-mon/index.html.
12

For more information, contact:Office of Environmental Health Hazard Assessment P.O. Box 4010, Mail Stop 12-B Sacramento, CA 95812-4010
(916) 324-2829 www.oehha.ca.gov
Printed on recycled paper