indicators for the evaluation of diet · pdf fileindicators for the evaluation of diet quality...
TRANSCRIPT

128
Nutr Hosp. 2015;31(Supl. 3):128-144ISSN 0212-1611 • CODEN NUHOEQ
S.V.R. 318
Indicators for the evaluation of diet qualityÁngel Gil1, Emilio Martinez de Victoria2 and Josune Olza1
1Department of Biochemistry and Molecular Biology II, School of Pharmacy, Institute of Nutrition and Food Technology, Centre for Biomedical Research, University of Granada, Granada. 2Department of Physiology, School of Pharmacy, Institute of Nutrition and Food Technology, Centre for Biomedical Research, University of Granada, Granada. Spain.
Abstract
The role of diet quality and physical activity in re-ducing the progression of chronic disease is becoming increasingly important. Dietary Quality Indices or In-dicators (DQIs) are algorithms aiming to evaluate the overall diet and categorize individuals according to the extent to which their eating behaviour is “healthy”. Pre-defined indexes assess dietary patterns based on current nutrition knowledge and they have been developed pri-marily for nutritional epidemiology to assess dietary risk factors for non-communicable diseases. There are many different types of DQIs. There are three major categories of DQIs: a) nutrient-based indicators; b) food/food group based indicators; and c) combination indexes, the vast majority of DQIs, which often include a measure of diet variety within and across food groups, a measure of adequacy i.e. nutrients (compared to re-quirements) or food groups (quantities or servings), a measure of nutrients/foods to consume in moderation, and an overall balance of macronutrients. The Healthy Eating Index (HEI), the Diet Quality Index (DQI), the Healthy Diet Indicator (HDI) and the Mediterranean Diet Score (MDS) are the four ‘original’ diet quality sco-res that have been referred to and validated most exten-sively. Several indexes have been adapted and modified from those originals. In particular, many variations on the MDS have been proposed, included different alter-nate MDS and Mediterranean Diet Adherence Screener (MEDAS). Primary data source of DQI’s are individual dietary data collection tools, namely 24 h quantitative intake recalls, dietary records and food frequency ques-tionnaires. Nutrients found in many scores are total fat, saturated fatty acids or the ratio of monounsaturated fatty acids to saturated fatty acids or the latter SFA to polyunsaturated fatty acids. Cholesterol, protein con-tent and quality, complex carbohydrates, mono- and disaccharides, dietary fibre and sodium are also found in various scores. All DQIs, except those that only con-tain nutrients, include the components fruits and vege-tables; additional attributes are legumes or pulses, nuts and seeds. Meat and meat products, namely red and processed meat, poultry, and milk and dairy products are also included in many scores. Other foods contained in some DQIs e.g. MDS are olive oil and fish. Nowadays,
INDICADORES DE EVALUACIÓN DE LA CALIDAD DE LA DIETA
Resumen
El papel de la calidad de la dieta y de la actividad física en la reducción de la progresión de las enfermedades cró-nicas es cada vez más importante. Los indicadores o índi-ces de calidad de la dieta (DQIs) son algoritmos destina-dos a evaluar la calidad global de la dieta y categorizar a los individuos en función de si su patrón de alimentación es más o menos saludable. Los índices predefinidos eva-lúan diferentes patrones dietéticos basados en los conoci-mientos actuales de la Nutrición y se han desarrollado bá-sicamente para la epidemiología nutricional con objeto de determinar factores de riesgo de enfermedades crónicas no transmisibles (ECNTs).Existen muchos tipos de DQIs. Se distinguen tres categorías principales: a) basados en nutrientes; b) basados en alimentos o grupos de alimen-tos; y c) índices combinados. A estos últimos pertenecen la mayoría de los DQIs, los cuales incluyen además una medida de adecuación de la dieta a las recomendaciones dietéticas, una medida del consumo moderado y un ba-lance general de ingesta de macronutrientes. El indicador de alimentación saludable (HEI), el índice de calidad de la dieta (DQI), el indicador de dieta saludable (HDI) y la puntuación de dieta mediterránea (MDS), son los cuatro indicadores originales que se han referenciado y validado más extensamente. Otros muchos índices se han adaptado a partir de ellos. En particular se han propuesto nume-rosas variaciones del MDS que incluyen varios índices alternativos y el recientemente denominado MEDAS que valora el grado de adherencia a la dieta y hábitos de vida mediterráneos. La fuente primaria de los DQIs son las herramientas para recoger datos individuales de ingesta tales como el recordatorio de ingesta cuantitativa de 24 h, los registros dietéticos y los cuestionarios de frecuencias de consumo de alimentos. Los nutrientes que se incluyen en numerosos DQIs son grasa total, ácidos grasos satu-rados o la proporción ácidos grasos monoinsaturados a ácidos grasos saturados o de estos últimos a ácidos grasos poliinsaturados, colesterol, contenido y calidad de las pro-teínas Los hidratos de carbono complejos, mono- y disa-cáridos, fibra dietética y sodio se incluyen también en al-gunos indicadores. Todos los DQIs, excepto aquellos en los que sólo se incluyen nutrientes, tienen como componentes el consumo de frutas y verduras; atributos adicionales son las legumbres, frutos secos y semillas. El consumo de carne y de productos cárnicos, especialmente carnes rojas y procesadas, carnes de ave y leche y productos lácteos se incluye también en varios índices Otros alimentos inclui-dos en algunos indicadores, p.e. en el MDS son el aceite
Correspondence: Prof. Angel Gil. Department of Biochemistry and Molecular Biology II, Institute of Nutrition and Food Technology, Centre of Biomedical Research, University of Granada. Avda. del Conocimiento s/n, 18016 Armilla, Granada, Spain. E-mail: [email protected]
016 Evaluacion de la calidad_Angel Gil.indd 128 12/02/15 14:05
Indicators for the evaluation of diet quality 129
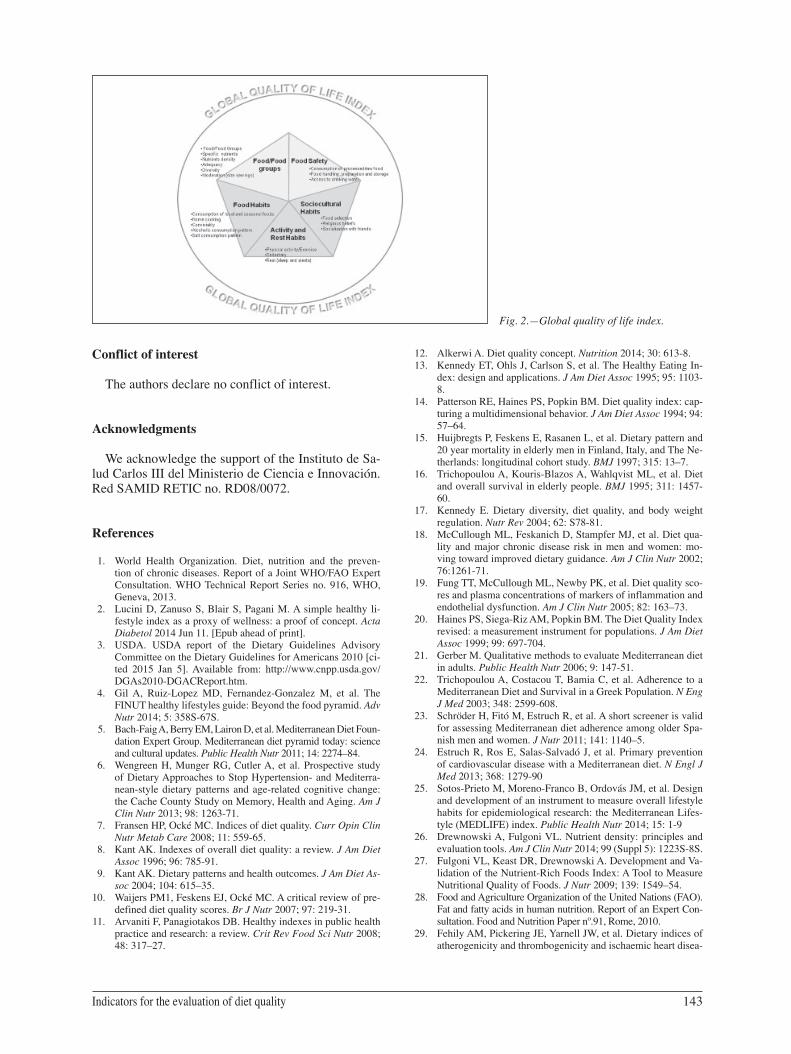
there is interest in defining more than DQIs, healthy life indices (HLIs), which give information on behaviours associated with specific patterns and beyond dietary habits they include physical activity, rest and selec-ted socio-cultural habits. The Mediterranean Lifestyle (MEDLIFE) index has been recently created based on the current Spanish Mediterranean food guide pyramid and it includes both the assessment of food consumption directly related to the Mediterranean diet, physical ac-tivity and rest and other relevant cultural information. However, a global HLI should consider, based on the Iberoamerican Nutrition Foundation (FINUT) Pyramid of Healthy Lifestyles, in addition to food groups and nu-trients, selected items on food safety e.g. consumption rate of proceed foods, food handling, preparation and storage and access to drinking water, selected food ha-bits, including alcoholic beverage and salt consumption patterns, purchase of seasonal and local foods, home cooking and conviviality, as well as patterns of physi-cal activity, sedentary and rest habits and some selected sociocultural habits, particularly those related to food selection, religious beliefs and socializing with friends.
(Nutr Hosp 2015;31(Supl. 3):128-144)
DOI:10.3305/nh.2015.31.sup3.8761Key words: Diet. Food. Food habits. Health. Lifestyles.
Nutrients.
de oliva y el pescado. Actualmente hay interés más que en definir nuevos DQIs en establecer índices de calidad de vida (HLIs), que suministren información, además de sobre nutrientes y alimentos consumidos, sobre patrones de comportamiento específicos asociados con los hábitos de alimentación, con la actividad física y el descanso y con ciertos hábitos de vida socio-culturales. El índice de ca-lidad de vida mediterránea (MEDLIFE), recientemente creado, está basado en la pirámide de alimentos de la die-ta mediterránea e incluye tnato la evaluación del consu-mo de alimentos relacionados con la dieta mediterránea como información en relación a la actividad física y el des-canso y otra información cultural relevante. Sin embargo, un índice global de estilos de vida saludable, basada en la pirámide de la Fundación Iberomericana de Nutrición (FINUT), además de grupos de alimentos y de nutrientes, debería incluir aspectos relacionados con la seguridad ali-mentaria p.e. consumo de alimentos procesados, manejo preparación y almacenamiento de los alimentos, y acceso al agua potable, hábitos alimentarios, incluyendo patro-nes de consumo de bebidas alcohólicas y de sal, compra de alimentos estacionales y locales, cocinado en el hogar y convivialidad, así como patrones de actividad física, se-dentarismo y descanso y algunos hábitos socioculturales, particularmente aquellos relacionados con la selección de alimentos, creencias religiosas y socialización con amigos.
(Nutr Hosp 2015;31(Supl. 3):128-144)
DOI:10.3305/nh.2015.31.sup3.8761Palabras clave: Alimentos. Dieta. Estilos de vida. Hábitos
alimenticios. Salud. Nutrientes.
Abbreviations
AA: amino acids.AHEI: alternative healthy eating index. AMDR: acceptable macronutrient distribution range.aMED: alternate Mediterranean diet index.BV: biological value.CHD: coronary heart disease. CQI: carbohydrate quality index.CVD: cardiovascular disease.DASH: Dietary Approaches to Stop Hypertension.DHA: docosahexaenoic acid.DIAAS: digestible indispensable amino acid score.DQI: diet quality index.DQIr: dietary quality index revised.DRI: dietary reference intake.E: energy.EPA: eicosapentaenoic acid.FBQI: food-based quality index.FCTs: food-nutrient conversion tables.FFQs: food frequency questionnaires.FINUT: Iberomerican Nutrition Foundation.FPI: food pyramid index.GI: glycaemic index.GL: glycaemic load.HDI: healthy diet indicator.HDL-C: high-density lipoprotein cholesterol.
HEI: healthy eating index.HFI: healthy food index.HI: healthy lifestyle index.HLIs: healthy lifestyle indicators.IEC: ionic exchange chromatography.IPAQ: international activity questionnaire.LA: linoleic acid.LCPUFA: long chain polyunsaturated fatty acids.LDL-C: low-density lipoproteins cholesterol.LNA: alfa-linolenic acid.MDS: Mediterranean diet score.MDS-a: adapted Mediterranean diet score.MEDAS: Mediterranean diet adherence screener.Med-DQI: Mediterranean dietary quality index.MEDLIFE: Mediterranean lifestyle index.MET: metabolic equivalents.MUFA: monounsaturated fatty acids.NCCDs: non-communicable chronic diseases.NPR: net protein retention.NPU: net protein utilization.NRF: nutrient rich food.P: S: polyunsaturated: saturated fatty acid ratio.PDCAAS: protein digestibility corrected amino
acid score.PER: protein efficiency ratio.PREDIMED: Prevención con Dieta Mediterránea.PUFA: polyunsaturated fatty acids.
016 Evaluacion de la calidad_Angel Gil.indd 129 12/02/15 14:05

130 DIETARY SURVEYS AND ENERGY BALANCE: METHODOLOGY, BIAS, ADJUSTMENT AND OTHER ISSUES
SFA: saturated fatty acids.TFA: trans fatty acids.USDA: United States Department of Agriculture.
Introduction
Despite the multiple nutritional recommendations and food guidelines, the pandemic of non-communicable chronic diseases (NCCDs) continues in both developed and developing countries1. The role of diet quality and physical activity in reducing the progression of chronic disease is becoming increasingly important. The evi-dence supporting the importance of a healthy lifestyle (healthy diet, physical activity, avoiding alcohol, not smoking, and effectively managing stress) as a part of wellness programs and of interventions for primary and secondary prevention of NCCDs is strong, compelling, and continuously growing2. Good health and optimal functionality across the lifespan are achievable goals but require a lifestyle approach including a total diet that is energy balanced and nutrient dense3, as well as regular physical activity and exercise, which contribute to coun-terbalance the energy intake and to the regulation of body weight and a number of physiological functions4.
Certain dietary patterns consumed around the world are associated with beneficial health outcomes. Patterns of eating that have been shown to be healthful include the Mediterranean-style dietary patterns5 and the Dietary Approaches to Stop Hypertension (DASH)-style dietary patterns6. However, the daunting public health challenge is to accomplish population-wide adoption of healthful dietary patterns within the context of powerful influen-ces that currently promote unhealthy consumer choices, behaviours, and lifestyles3. Indeed, there is a need to be able to simply and cheaply monitor diet quality in po-pulations world-wide. Dietary Quality Indices or Indi-cators (DQIs) aim to evaluate the overall diet and cate-gorize individuals according to the extent to which their eating behaviour is “healthy”. Predefined indexes assess dietary patterns based on current nutrition knowledge
and they have been developed primarily for nutritional epidemiology to assess dietary risk factors for NCCDs, but their use is expanding. Beyond the evaluation of the diet quality there is a need to evaluate global healthy lifestyles. Hence, the main goal of the present article is to summarize the relevance of the most important DQIs and Healthy Lifestyle Indicators (HLIs) used worldwide (Fig. 1), with particular emphasis on Mediterranean pat-terns and to discuss some methodological aspects for the evaluation of the quality of the main nutrients.
Diet quality indicators
In the past decade several researchers have attemp-ted to develop a measure of diet quality, indeed, there is a myriad of DQIs. The use of DQIs becomes more widespread and tailored to the specific purpose and populations. However, different approaches are main-ly due to arbitrary choices because of lacking knowle-dge on healthy diets and unsolved methodological is-sues. The ways of dealing with differences in energy intake, scoring each component, and combining the different components into one measure are aspects that still need further research7.
Kant (1996) was the first to review the indexes rela-ted to the overall diet quality and he expectedly found that the definition of diet quality depended on attribu-tes selected by the investigators8. This review was fo-llowed eight years later by a review of dietary patterns, both empirically derived and theoretically defined, and health outcome9. Later, Waijers et al. (2007) reviewed 20 distinct indexes of overall diet quality and they con-cluded that existing indexes do not predict disease or mortality significantly better than individual dietary factors, but they can be useful to measure the extent to which individuals adhere to dietary guidelines10. Thus, those DQIs need to be used and interpreted with care. Arvaniti and Panagiotakos (2008) also reviewed 23 commonly used dietary indices, which mostly overla-pped Waijers review11. Fransen et al. (2008) provided
Fig. 1.—Dietary Quality Indices.DQI: dietary quality index; DQIr: dietary quality index revised; HDI: healthy diet in-dicator; HEI: healthy eating index; AHEI: alternative healthy eating index; MDS: Me-diterranean diet score; Med-DQI: Medite-rranean dietary quality index; MDS: Me-diterranean diet score modified; MEDAS: Mediterranean diet adherence screener; MEDLIFE: Mediterranean Lifestyle Index and HI: Healthy Lifestyle Index.
016 Evaluacion de la calidad_Angel Gil.indd 130 12/02/15 14:05

Indicators for the evaluation of diet quality 131
an overview of the different dietary quality indices that had been developed for the general adult population and were based on the American dietary guidelines and the Mediterranean diet and, additionally, they in-cluded other DQIs indices for special populations with special attention to the makeup of the score and me-thodological issues7. More recently, Alkerwi (2014) has reviewed the concept of diet quality and discussed several debated key points to understand the reasons behind the confusion generated by multiple DQIs and addressed the complexity of how to define and quanti-fy this concept. This author concluded that an integra-ted approach that combines all the different characte-ristics of diet quality is needed to successfully measure the concept of overall diet quality and that apart from nutritional characteristics there is a need to score other facets of diet quality, including food safety, organolep-tic and sociocultural aspects, (which have currently no quantifiable thresholds or criteria)12.
The Healthy Eating Index (HEI)13, the Diet Quality Index (DQI)14, the Healthy Diet Indicator (HDI)15 and the Mediterranean Diet Score (MDS)16 are the four ‘ori-ginal’ diet quality scores that have been referred to and/or validated most extensively. Several indexes have been adapted and modified. In particular, many variations on the MDS have been proposed; four distinct adaptations are all referred to as adapted MDS (MDS-a)10.
There are many different types of DQIs. One major category is formed by nutrient-based indicators, which require the conversion from food weights to nutrient content using food-nutrient conversion tables (FCTs), comparison to requirements, adequacy ratios, etc., e.g. revised DQI. Food/food group based indicators form another category; they use dietary guidelines for re-commended portions and frequencies or simple food groups count. The Food-Based Quality Index (FBQI), the Healthy Food Index (HFI) and the Food Pyramid Index (FPI) consist solely of food groups or foods and the MDS mainly contain food groups, supplemented with a ratio reflecting the fatty acid composition of the diet and alcohol, whereas two adapted MDS contain foods only (revised by Waijers et al.)10.
The vast majority of DQIs e.g. original DQI, HEI and HDI, are included in a category of combination indexes, which often include a measure of diet variety within and across food groups, a measure of adequa-cy i.e. nutrients (compared to requirements) or food groups (quantities or servings), a measure of nutrients/foods to consume in moderation, and an overall balan-ce of macronutrients. Public health nutritionists have historically recommended variety or diversity in die-tary patterns as one means of fostering an optimal diet. The underlying concept was that no one food contained all of the necessary nutrients and that variety in dietary sources was needed to ensure a “balanced” diet17. Un-fortunately, there is no a standardized approach to con-tent and to scoring and scores are based on frequency, number of portions, assigned weights, etc. Indeed, different DQ scores are not comparable and are often
country-specific. Table I summarizes the most useful QDIs for the evaluation of the quality diet.
Primary data source of DQI’s are individual dietary data collection tools, namely 24 h quantitative intake recalls, dietary records and food frequency question-naires (FFQs). FFQs concentrate on foods/nutrients of special interest while 24h recalls collect information on complete intake – all food eaten and their quantities. The main purpose for collecting detailed quantitative food intake data was and is still to investigate associa-tions between nutrients, foods or other elements of the diet and health outcomes. DQIs have been repeatedly validated against outcomes. Dietary intake surveys are also undertaken to provide estimates of national nu-tritional status. More recent uses of individual dietary intake surveys include identification of vehicles for food fortification and evaluation of the risks related to possible hazards in food.
Kennedy et al. (1995) developed a single summary index of diet quality the HEI13. The HEI is an index ranging from zero to 100, which is based on ten indi-vidual components, the individual component scores can vary from zero to ten. The first five components of the HEI are based on the five major food groups of the US Food Guide Pyramid, whereas components six to ten are based on aspects of the US Dietary Guidelines. Variety is one of the 10 components of the HEI. The HEI has been shown to correlate positively and signi-ficantly with most nutrients in the diet, with the body mass index (BMI, kg/m2) of study subjects and with the individuals “self perception” of their diets.
In an attempt to improve the original HEI, McCullou-gh et al, (2002) created a 9-component Alternate Heal-thy Eating Index (AHEI)18. This index was designed to target food choices and macronutrient sources associa-ted with reduced chronic disease risk and was also de-veloped based on dietary guidelines and the food guide pyramid proposed by the US Department of Agricultu-re13 (USDA) and emphasizes the consumption of plant foods and unsaturated oils. Higher AHEI scores were associated with lower concentrations of biomarkers of inflammation and endothelial dysfunction and therefore may be useful as an useful tool for reducing the risk of diseases involving such biological pathways19.
The DQI14 later revised in 1999 and 2003, is based on similar guidelines than those of HEI and AHEI from the National Research Council of the USA, but also inclu-des iron and calcium20. It has two variety components overall food group and within food group diversity; ei-ght adequacy components (to increase in diet) i.e. 1) ve-getables, 2) fruits, 3) grains, 4) fibre, 5) protein, 6) iron, 7) calcium, and 8) Vitamin C; five moderation compo-nents (to decrease in diet) i.e. 1) total fat, 2) saturated fat, 3) cholesterol, 4) sodium, and 5) empty calories (foods with low nutrient density); and two overall balance com-ponents i.e. macronutrient ratio and fatty acid ratio. The original DQI was revised to reflect current dietary gui-dance, to incorporate improved methods of estimating food servings and to develop and incorporate measures
016 Evaluacion de la calidad_Angel Gil.indd 131 12/02/15 14:05

132 DIETARY SURVEYS AND ENERGY BALANCE: METHODOLOGY, BIAS, ADJUSTMENT AND OTHER ISSUES
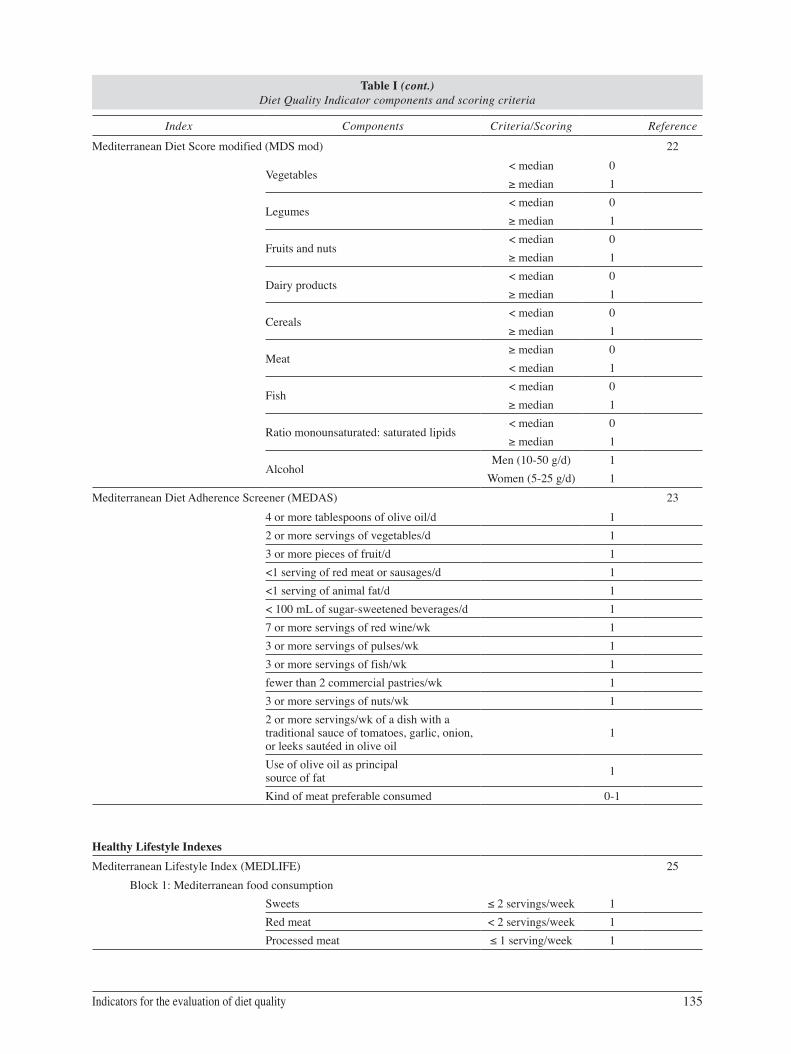
Table I Diet Quality Indicator components and scoring criteria
Index Components Criteria/Scoring Reference
Mixed Nutrient and Food Indexes
Diet Quality Index (DQI) 14
Total fat< 30 energy % 0
30–40 energy % 1> 40 energy % 2
Saturated fatty acids< 10 energy % 0
10–13 energy % 1>13 energy % 2
Cholesterol< 300 mg 0
300–400 mg 1> 400 mg 2
Fruit and vegetables5 + servings 03–4 servings 10–2 servings 2
Complex carbohydrates6 + servings 04–5 servings 10–3 servings 2
Protein≤ 100% RDA 0
100–150% RDA 1≥ 150% RDA 2
Sodium< 2400 mg 0
2400–3400 mg 1> 3400 mg 2
Calcium≥ RDA 0
2/3 RDA 1< 2/3 RDA 2
Diet Quality Index revised (DQIr) 20
Total fat ≤ 30% ≤ 30 energy % 10> 30 energy % 5> 40 energy % 0
Saturated fatty acids ≤ 10% energy intake
≤ 10 energy % 1010, ≤ 13 energy % 5
> 13 energy % 0
Cholesterol≤ 300 mg 10
> 300, ≤ 400 mg 5> 400 mg 0
2-4 servings fruits per day ≥ 100%
99%- 50%< 50%
0-10*
3-5 servings vegetables per day≥ 100%
99%- 50%< 50%
0-10*
6-11 servings grains per day≥ 100%
99%- 50%< 50%
0-10*
Calcium intake (based on 1989 RDA p/age)≥ 100%
99%- 50%< 50%
0-10*
016 Evaluacion de la calidad_Angel Gil.indd 132 12/02/15 14:05

Indicators for the evaluation of diet quality 133
Table I (cont.) Diet Quality Indicator components and scoring criteria
Index Components Criteria/Scoring Reference
Iron intake (based on 1989 RDA p/age)≥ 100%
99%- 50%< 50%
0-10*
Dietary diversity score≥ 6
≥ 3, < 6< 3
0-10
Dietary moderation score≥ 7
≥ 4, < 7< 4
0-10
*Depending on energy intake
Healthy Diet Indicator (HDI) 15
Saturated fatty acids 0-10 energy % 1
Polyunsaturated fatty acids 3-7 energy % 1
Protein 10-15 energy % 1
Complex carbohydrates 50-70 energy % 1
Dietary fibre (g) 27-40 energy % 1
Fruits and vegetables (g) > 400 g/d 1
Pulses, nuts, seeds (g) > 30 g/d 1
Mono- and disaccharides 0-10 energy % 1
Cholesterol (mg) 0-300 mg/d 1If % or quantities are not in the ranges, score = 0
Healthy Eating Index (HEI) 13
Grains 6-11 servings 0-10
Vegetables 3-5 servings 0-10
Fruits 2-4 servings 0-10
Milk 2-3 servings 0-10
Meat 2-3 servings 0-10
Total Fat < 30 energy % 0-10
Saturated fatty acids < 10 energy % 0-10
Cholesterol < 300 mg 0-10
Sodium < 2400 mg 0-10
Variety 16 different food items/3d 0-10
The criteria for scoring depend on the energy intake. 0 servings score=0.
Alternative Healthy Eating Index (AHEI) 18
Vegetables 0 servings 05 servings 10
Fruits0 servings 04 servings 10
Nuts and soy protein0 servings 01 servings 10
Ratio of white to red meat0 04 10
016 Evaluacion de la calidad_Angel Gil.indd 133 12/02/15 14:05

134 DIETARY SURVEYS AND ENERGY BALANCE: METHODOLOGY, BIAS, ADJUSTMENT AND OTHER ISSUES
Table I (cont.) Diet Quality Indicator components and scoring criteria
Index Components Criteria/Scoring Reference
Cereal fibre g/d0 015 10
Trans Fat≥ 4 energy % 0
≤ 0.5 energy % 10
Polyunsaturated: saturated fatty acids ratio≤ 0.1 0≥ 1 10
Duration of multivitamins use< 5 years 0≥ 5 years 10
Alcohol
Men: 0 or > 3.5Women: 0 or > 2.5 0
Men: 1.5-2.5Women: 0.5-1.5 10
Intermediate intakes are scored proportionately between 0-10
Mediterranean Diet Score (MDS) 16
Monounsaturated: Saturated fatty acid ratio < median 0> median 1
Legumes < median 0> median 1
Cereals < median 0> median 1
Fruits and nuts < median 0> median 1
Vegetables < median 0> median 1
Meat and meat products > median 0< median 1
Milk and dairy products > median 0< median 1
Alcohol > median 0< median 1
Mediterranean- Diet Quality Index (Med-DQI) 21
Saturated fatty acids< 10 energy % 0
10–13 energy % 1> 13 energy % 2
Cholesterol< 300 mg 0
300–400 mg 1 > 400 mg 2
Meats< 25 g 0
25-125 g 1> 125 g 2
Olive oil> 15 ml 015-5 ml 1< 5 ml 2
Fish> 60 g 0
60-30 g 1< 30 g 2
Cereals> 300 g 0
300-100 g 1< 100 g 2
Vegetables + fruits> 700 g 0
700-400 g 1< 400 g 2
016 Evaluacion de la calidad_Angel Gil.indd 134 12/02/15 14:05
Indicators for the evaluation of diet quality 135
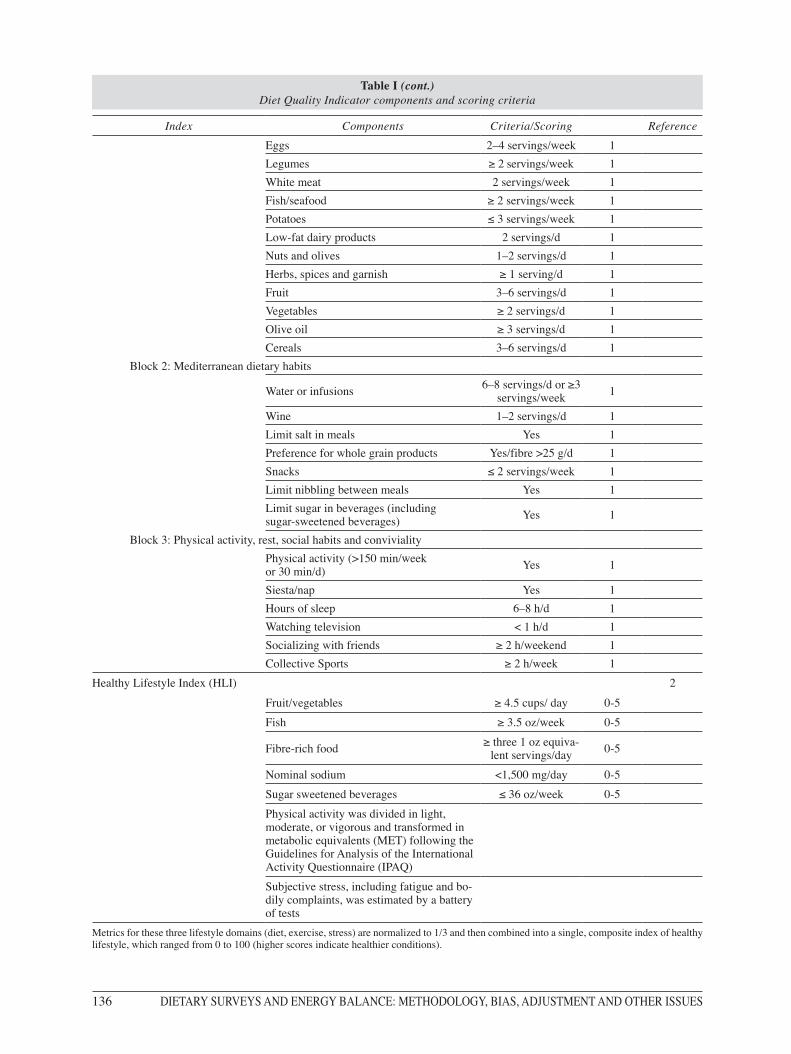
Table I (cont.) Diet Quality Indicator components and scoring criteria
Index Components Criteria/Scoring Reference
Mediterranean Diet Score modified (MDS mod) 22
Vegetables< median 0≥ median 1
Legumes< median 0≥ median 1
Fruits and nuts< median 0≥ median 1
Dairy products< median 0≥ median 1
Cereals< median 0≥ median 1
Meat≥ median 0< median 1
Fish< median 0≥ median 1
Ratio monounsaturated: saturated lipids< median 0≥ median 1
AlcoholMen (10-50 g/d) 1
Women (5-25 g/d) 1Mediterranean Diet Adherence Screener (MEDAS) 23
4 or more tablespoons of olive oil/d 12 or more servings of vegetables/d 13 or more pieces of fruit/d 1<1 serving of red meat or sausages/d 1<1 serving of animal fat/d 1< 100 mL of sugar-sweetened beverages/d 17 or more servings of red wine/wk 13 or more servings of pulses/wk 13 or more servings of fish/wk 1fewer than 2 commercial pastries/wk 13 or more servings of nuts/wk 12 or more servings/wk of a dish with a traditional sauce of tomatoes, garlic, onion, or leeks sautéed in olive oil
1
Use of olive oil as principal source of fat 1
Kind of meat preferable consumed 0-1
Healthy Lifestyle IndexesMediterranean Lifestyle Index (MEDLIFE) 25
Block 1: Mediterranean food consumptionSweets ≤ 2 servings/week 1Red meat < 2 servings/week 1Processed meat ≤ 1 serving/week 1
016 Evaluacion de la calidad_Angel Gil.indd 135 12/02/15 14:05
136 DIETARY SURVEYS AND ENERGY BALANCE: METHODOLOGY, BIAS, ADJUSTMENT AND OTHER ISSUES
Table I (cont.) Diet Quality Indicator components and scoring criteria
Index Components Criteria/Scoring ReferenceEggs 2–4 servings/week 1Legumes ≥ 2 servings/week 1White meat 2 servings/week 1Fish/seafood ≥ 2 servings/week 1Potatoes ≤ 3 servings/week 1Low-fat dairy products 2 servings/d 1Nuts and olives 1–2 servings/d 1Herbs, spices and garnish ≥ 1 serving/d 1Fruit 3–6 servings/d 1Vegetables ≥ 2 servings/d 1Olive oil ≥ 3 servings/d 1Cereals 3–6 servings/d 1
Block 2: Mediterranean dietary habits
Water or infusions 6–8 servings/d or ≥3 servings/week 1
Wine 1–2 servings/d 1Limit salt in meals Yes 1Preference for whole grain products Yes/fibre >25 g/d 1Snacks ≤ 2 servings/week 1Limit nibbling between meals Yes 1Limit sugar in beverages (including sugar-sweetened beverages) Yes 1
Block 3: Physical activity, rest, social habits and convivialityPhysical activity (>150 min/week or 30 min/d) Yes 1
Siesta/nap Yes 1Hours of sleep 6–8 h/d 1Watching television < 1 h/d 1Socializing with friends ≥ 2 h/weekend 1Collective Sports ≥ 2 h/week 1
Healthy Lifestyle Index (HLI) 2
Fruit/vegetables ≥ 4.5 cups/ day 0-5Fish ≥ 3.5 oz/week 0-5
Fibre-rich food ≥ three 1 oz equiva-lent servings/day 0-5
Nominal sodium <1,500 mg/day 0-5Sugar sweetened beverages ≤ 36 oz/week 0-5Physical activity was divided in light, moderate, or vigorous and transformed in metabolic equivalents (MET) following the Guidelines for Analysis of the International Activity Questionnaire (IPAQ) Subjective stress, including fatigue and bo-dily complaints, was estimated by a battery of tests
Metrics for these three lifestyle domains (diet, exercise, stress) are normalized to 1/3 and then combined into a single, composite index of healthy lifestyle, which ranged from 0 to 100 (higher scores indicate healthier conditions).
016 Evaluacion de la calidad_Angel Gil.indd 136 12/02/15 14:05

Indicators for the evaluation of diet quality 137
of dietary variety and moderation. The scoring of the original scale was reversed in direction and expanded to a 100-point scale to improve interpretability20.
A specific Mediterranean-DQI (Med-DQI) has been devised21. Olive oil was added with a score increasing with a lower intake. Protein was replaced by meat, be-cause fish was added with an opposite gradient. Each nutrient or food group was assigned three scores (0, 1 and 2) on the basis of recommended guidelines where these exist (cholesterol, SFA), or by dividing the popu-lation’s consumption into tertiles where there was no specific recommendation for the food.
The HDI was calculated for the dietary pattern, using the World Health Organisation’s guidelines for the prevention of chronic diseases. A dichotomous va-riable was generated for each food group or nutrient that was included in these guidelines. If a person’s in-take was within the recommended range this variable was coded as 1; otherwise it was coded as 0.The HDI was the sum of all these dichotomous variables, inclu-ding saturated fatty acids, polyunsaturated fatty acids, cholesterol, protein, complex carbohydrates, mono-saccharides and disaccharides, dietary fibre, fruits and vegetables, pulses, nuts and seeds15.
The traditional Mediterranean diet has been defined and reasonably scored in terms of eight component characteristics (MDS): high monounsaturated to sa-turated fat ratio, moderate ethanol consumption, high consumption of legumes, high consumption of cereals (including bread and potatoes), high consumption of fruits, high consumption of vegetables, low consump-tion of meat and meat products, and low consumption of milk and dairy products16. Later, a revised scale in-dicating the degree of adherence to the traditional Me-diterranean diet included fish intake22. A value of 0 or 1 was assigned to each of nine components with the use of the sex-specific median as the cut-off. For benefi-cial components (vegetables, legumes, fruits and nuts, cereal, and fish), persons whose consumption was be-low the median were assigned a value of 0, and per-sons whose consumption was at or above the median were assigned a value of 1. For components presumed to be detrimental (meat, poultry, and dairy products, which are rarely non-fat or low-fat in Greece), persons whose consumption was below the median were assig-ned a value of 1, and persons whose consumption was at or above the median were assigned a value of 0. For ethanol, a value of 1 was assigned to men who consu-med between 10 and 50 g per day and to women who consumed between 5 and 25 g per day. Finally, for fat intake, they used the ratio of monounsaturated lipids to saturated lipids, rather than the ratio of polyunsatura-ted to saturated lipids, because in Greece, monounsa-turated lipids are used in much higher quantities than polyunsaturated lipids. Thus, the total Mediterranean- diet score ranged from 0 (minimal adherence to the tra-ditional Mediterranean diet) to 9 (maximal adherence).
The Alternate Mediterranean Diet Index (aMED) was adapted by Fung et al. (2005) from the original
MDS to use with a food-frequency questionnaire (FFQ) developed in the United States, by introdu-cing some modifications such as eliminating the dairy group, separating nuts and fruits into two groups, and assigning a score to a moderate alcohol intake. As for the AHEI, aMED scores were associated with lower concentrations of biomarkers of inflammation and en-dothelial dysfunction19.
More recently, a 14-point Mediterranean Diet Ad-herence Screener (MEDAS)23 questionnaire was used in the “Prevención con Dieta Mediterránea” (PREDI-MED) study, a primary prevention nutrition-interven-tion trial24. The MEDAS consists of 12 questions on food consumption frequency and 2 questions on food intake habits considered characteristic of the Spanish Mediterranean diet. Each question was scored 0 or 1. One point was given for using olive oil as the principal source of fat for cooking, preferring white meat over red meat, or for consuming: 1) 4 or more tablespoons (1 tablespoon = 13.5 g) of olive oil/d (including that used in frying, salads, meals eaten away from home, etc.); 2) 2 or more servings of vegetables/d; 3) 3 or more pieces of fruit/d; 4) <1 serving of red meat or sausages/d; 5) <1 serving of animal fat/d; 6) <1 cup (1 cup = 100 mL) of sugar-sweetened beverages/d; 7) 7 or more servings of red wine/wk; 8) 3 or more servings of pulses/wk; 9) 3 or more servings of fish/wk; 10) fewer than 2 commercial pastries/wk; 11) 3 or more servings of nuts/wk; or 12) 2 or more servings/wk of a dish with a traditional sauce of tomatoes, garlic, onion, or leeks sautéed in olive oil. If the condition was not met, 0 points were recorded for the category. The final PREDIMED score ranged from 0 to 1423.
Healthy lifestyles Indicators
The Mediterranean Lifestyle (MEDLIFE) index has been created based on the current Spanish Mediterra-nean food guide pyramid. MEDLIFE is a twenty-eigh-teen derived index consisting of questions about food consumption (fifteen items), traditional Mediterranean dietary habits (seven items) and physical activity, rest and social interaction habits (six items); each item sco-red 0 or 1, and the final MEDLIFE index ranged from 0 (worst) to 28 (Table I). Indeed, MEDLIFE includes both the assessment of food consumption directly rela-ted to the Mediterranean diet and information on beha-viours associated with the Mediterranean lifestyle be-yond dietary habits, to include physical activity, rest, social habits and conviviality. This, it is expected to be a more holistic tool to measure adherence to the Medi-terranean lifestyle in epidemiological studies25.
Recently, Lucini et al. (2014) have tested whether a simple web-based healthy lifestyle index, using self-re-ports, could be related to indices of cardiovascular health and metabolic syndrome and could be employed in large wellness programs intended to promote healthy lifestyle2. Healthy diet score was graded from 0 to 5
016 Evaluacion de la calidad_Angel Gil.indd 137 12/02/15 14:05
138 DIETARY SURVEYS AND ENERGY BALANCE: METHODOLOGY, BIAS, ADJUSTMENT AND OTHER ISSUES
(best value), focusing rather on alimentary style than of specific food elements; one point was added whene-ver each of the following elements was present: fruit/vegetables 4.5 cups/day, fish 3.5 oz/week, fibre-rich food three 1 oz equivalent servings/day, nominal so-dium \1,500 mg/day (operationally, it was considered as threshold the habit of adding salt without prior tas-ting food or eating processed meats, or snacks and po-tato chips daily), and sugar sweetened beverages 36 oz/week; the following thresholds were used for poor, in-termediate, and ideal healthy diet: <2 and >3). Exercise was estimated from self-reported weekly minutes of activity. Physical activity was divided in light, mode-rate, or vigorous and transformed in metabolic equiva-lents (MET) following the Guidelines for Analysis of the International Activity Questionnaire (IPAQ)2. Sub-jective stress, including fatigue and bodily complaints, was estimated by a battery of tests. Metrics for these three lifestyle domains (diet, exercise, stress) were nor-malized to 1/3 and then combined into a single, com-posite index of healthy lifestyle, which ranged from 0 to 100 (higher scores indicating healthier conditions). The authors consider that the simplicity of obtaining and using this index and the statistically significant link with traditional clinical indicators of risk, particularly with cardiovascular risk factors, might support its use as a tool to help manage behaviour in health promotion and prevention strategies to apply to large populations2.
Food and food groups and diet quality
Fruits and vegetables as well as whole grains are known to have a role in the prevention on NCCDs1. Therefore, all DQIs, except those that only contain nu-trients, include the components fruits and vegetables, either grouped together (DQI, MDQI, MDS-a I, HDI) or separately (all other indexes). The MDS contain an additional attribute ‘legumes’. The HDI contains an item ‘pulses, nuts and seeds’. If not considered indivi-dually, nuts are added to the fruit group (MDS, some MDS-a) or to the legumes (revised by Waijers et al.)10. However, the DQI, HEI, MDS and HDI do not distin-guish between whole and refined cereals.
Meat and meat products, namely red and processed meat, poultry, and milk and dairy products are also in-cluded in many scores. The inclusion of meat in mode-rate amounts is considered healthy; however, high con-sumption of red meat and processed meats is associated to increased prevalence of some NCCDs (USDA Re-port, 2010). Likewise, the inclusion of dairy products in DQIs is complex as skimmed and half-skimmed dairy products and fermented milk products have been associated with the protection of some NCCDs, but other dairy products, namely creams, butter and some cheeses are very rich in SFA. Other foods contained in some DQIs e.g. MDS are olive oil, fish and nuts16, 25.
The association of alcohol consumption with health can be described as U-shaped. An average daily intake
of one to two alcoholic beverages is associated with the lowest all-cause mortality and a low risk of dia-betes and coronary heart disease among middle-aged and older adults. However, there is strong evidence that heavy consumption of four or more drinks a day for women and five or more drinks a day for men has harmful health effects3. Indeed, alcohol has been in-cluded in the Mediterranean indexes as moderate wine consumption.
As commented earlier, some DQIs have included a variable representing dietary variety in their indices, in addition to foods or nutrients13,14,20.
Nutrient density and diet quality
The concept of nutrient density was used as the cornerstone of the USDA dietary guidelines 2005 (MyPyramid). Diet quality indices assess the overall nutritional quality of the total diet; in contrast, food quality indices, like nutrient density, measure the qua-lity of individual foods based on their content in nu-trients according to the nutrient profile. These nutrient profiling techniques can also be applied to meal, me-nus and total diet26.
Fulgoni et al. (2010) have developed and validated a Nutrient Rich Food (NRF) index, the NRF9.3, using the algorithms with the best predictive relationship with the HEI27. The NRF9.3 index is based in nine po-sitive or encouraged nutrients (protein, fibre, vitamins A, C and E, calcium, iron, potassium and magnesium) and three nutrients to limit (saturated fat, added or total sugars and sodium). The sum of percentages of daily values for the nine positive nutrients minus the sum of the percentages of maximum recommended values for three nutrients to limit with all the daily values cal-culated for 100 kcal or reference amount customarily consumed and capped at 100%.
The NRF index has been analyzed with the NHA-NES data and an association between the consumption of nutrient dense foods, lower energy intakes, higher diet quality overall and improved health outcomes was found. Diet awarded higher NRF scores were associa-ted with higher HEI values27
Nutrients and diet quality
Nutrients found in many scores are total fat, SFA or the ratio of monounsaturated fatty acids (MUFA) to SFA, cholesterol. Protein content and protein quality, complex carbohydrates, mono- and disaccharides, dietary fibre and sodium are also found in various scores7,10,25.
Fat and fatty acids
The acceptable macronutrient distribution range for total fat intake ranges between 20% and 35% of ener-
016 Evaluacion de la calidad_Angel Gil.indd 138 12/02/15 14:05

Indicators for the evaluation of diet quality 139
gy (E). Total fat intake should be greater than 15%E to ensure an adequate intake of essential fatty acids and energy and to facilitate the absorption of lipid soluble vitamins. While for most individuals engaged in mo-derate physical activity 30%E is recommended, for those associated with a high physical activity level it can amount to 35%E. The upper value of acceptable macronutrient distribution range should consider ener-gy balance and diet quality. However, high fat intakes are habitually accompanied by increased saturated fat, cholesterol and energy density28.
The fatty acid composition of the diet is considered to be an important health determinant. Intakes of die-tary fatty acids and cholesterol are major determinants of cardiovascular disease (CVD) and type 2 diabetes, two major causes of morbidity and mortality in both developed and developing countries1
Intake of SFA is generally recognized to be delete-rious, and is included as a single item in the DQI, HEI, Med-DQI, HDI and DGI (Waijers et al, 2007). Higher consumption of MUFA and PUFA has been reported to be associated with reduced CVD risk28. There is con-vincing evidence that replacing SFA (C12:0–C16:0) with MUFA reduces low-density lipoprotein cholesterol (LDL-C) concentration and total/high-density lipipro-tein cholesterol (HDL-C)28. Hence, the MDS contain ‘the ratio MUFA:PUFA’ as an index item, whereas the Alternative Healthy Eating Index (AHEI) contains ‘the ratio of PUFA:SFA’, P:S criterium for minimum score of 0, P:S ≤0.1; criterium for maximum score of 10, P:S ≥1.
There is convincing evidence that trans fatty acids (TFA) from commercial partially hydrogenated vege-table oils increase coronary heart disease (CHD) risk factors and CHD events – more so than had been thou-ght in the past1,28. There also is probable evidence of an increased risk of fatal CHD and sudden cardiac death in addition to an increased risk of metabolic syndro-me components and diabetes. The TFA intake from all sources should be no more than 1%E. Indeed, the TFA content has been considered in a number of DQIs e.g. AHEI and aMED.
There is also convincing evidence that linoleic acid (LA) and alfa-linolenic acid (LNA) are indispensable since they cannot be synthesized by humans and ac-ceptable intakes have been defined for both fatty acids. The minimum intake levels for essential fatty acids to prevent deficiency symptoms are estimated at a con-vincing level to be 2.5%E LA plus 0.5%E ALA.
Replacing SFA with PUFA decreases the risk of CHD. Based on epidemiological studies and rando-mized controlled trials of CHD events, the minimum recommended level of total PUFA consumption for lowering LDL-C and total cholesterol concentrations, increasing HDL-C concentrations and decreasing the risk of CHD events is 6%E. Based on experimental studies, risk of lipid peroxidation may increase with high (>11%E) PUFA consumption28.
The available evidence indicates that 0.5–0.6%E ALA per day corresponds with prevention of deficien-
cy symptoms. The total n-3 fatty acid intake (ALA, eicosapentaenoic acid (EPA) and docosahexaenoic acid (DHA)) can range between 0.5–2%E, whereas the minimum dietary requirement for ALA (>0.5%E) pre-vents deficiency symptoms in adults. The higher value of 2%E includes the recommendation for ALA and n-3 long chain (LC)-PUFA (Acceptable Macronutrient Dis-tribution Range (AMDR) for EPA and DHA 0.250 g–2.0 g) can be part of a healthy diet. While ALA may have specific properties, there is evidence that the n-3 LCPU-FA can contribute to the prevention of CHD and possi-bly other degenerative diseases associated with aging. For adult males and non-pregnant/non-lactating adult females 0.250 g/day of EPA plus DHA is recommended.
While the total intake of PUFA has been included in some DQIs, the specific intakes of LA, LNA and n-3 LC-PUFA are not specifically considered but some new DQIs have included fish as an important food group as it is a source of n-3 fatty acids
Two processes contribute to the development of ischaemic heart disease: atherosclerosis and thrombo-sis. The type of dietary fat consumed may contribute to both of these processes, some fatty acids having a greater role in atherogenesis while others have a grea-ter role in thrombogenesis. Of the SFA, only those with a chain length of 12, 14 or 16 C atoms have a cholesterol-raising effect and are thus atherogenic. SFA with a chain length of 14, 16 or 18 C atoms have been suggested to be thrombogenic. Both MUFA and n-6 PUFA have been shown to reduce plasma total cholesterol and LDL-C concentrations and n-3 LC PUFA have minimal effect on plasma cholesterol le-vel but reduce plasma triacylglycerols thromboxane B, and platelet activity and prolong bleeding time and clotting time1,27,29. In an attempt to take into account the different effects of the various fatty acids, Ulbricht & Southgate (1991) proposed two indices which might better characterize the atherogenic and thrombogenic potential of the diet than simple approaches such as total SFA or P: S ratio30.
Atherogenicity index= (l2:0+(4 x l4:0)+ 16:O) / (n-6 PUFA +n-3 PUFA + MUFA)
Thrombogenic index= (14:0+ 16:0+18:0) / [(0.5 MUFA) + (0.5 n-6 PUFA) + (3 n-3 PUFA) + (n-3 PUFA/n-6 PUFA)]
Finally, dietary cholesterol intake has been included in the composition of predefined indices of diet quality e.g. DQI, HEI, HDI.
Protein
The world’s population increases rapidly in spite of the constraints of limiting land, water and food resour-ces. Indeed, it is more important than ever to be able to define accurately the amount and quality of protein required to meet human nutritional needs and describe appropriately the protein supplied by food ingredients, whole foods, sole-source foods and mixed diets. The
016 Evaluacion de la calidad_Angel Gil.indd 139 12/02/15 14:05

140 DIETARY SURVEYS AND ENERGY BALANCE: METHODOLOGY, BIAS, ADJUSTMENT AND OTHER ISSUES
match between dietary supply and human protein needs is vital to support the health and well-being of human populations.
Proteins play an essential role as structural and func-tional components of the body. Proteins in food provi-de amino acids (AA) which are the precursors of nu-cleic acids, hormones, coenzymes and other essential molecules (DRI, IOM, USA). The human body is not capable of accumulate proteins, and for that reason it is important to have a continual supply to maintain its physiological functions. If this supply is not provided according to the individuals’ requirements, the body’s development and functions can be compromised31.
The dietary reference intake for total protein is about 0.8 g/ kg body weight for adults aged more than 19 yr, about 12% of energy intake32. Animal sources of pro-tein, including meat, poultry, seafood, milk, and eggs, are the highest quality proteins. Plant proteins can be combined to form complete proteins if combinations of legumes and grains are consumed. Plant-based diets are able to meet protein requirements for essential AA through planning and offer other potential benefits, such as sources of fibre and nutrients important in a health-promoting diet.
The protein quality evaluation aims to determine the capacity of food protein sources and diets to satisfy the metabolic demand for AA and nitrogen. Thus any measure of the overall quality of dietary protein, if co-rrectly determined, should predict the overall efficien-cy of protein utilization. Safe or recommended intakes can then be adjusted according to the quality measure, so that demands can be met33. The protein quality of a mixed diet should have a biological value > 0.7. It is calculated as animal protein + vegetal protein divided by total protein.
There are different methods to determine the protein quality that can be used individually or combined. Al-though the most important aspect of a protein from a nutritional point of view is its AA composition, the di-gestibility can influence the bioavailability of AA, and that is why this aspect needs to be taken into account to determine the protein quality.
In order to evaluate the quality of the protein in the diet, it is essential that the AA compositions be accura-tely determined. In recent years, there have been seve-ral advances in this respect and nowadays the methods are very good and standardized34.
The methods for AA determination consist in two main steps
– Hydrolysis of AA
There are different kinds of hydrolysis according to the AA. a) Hydrolysis for the non-oxidized protein to determine all AA, except for tryptophan, methionine and cysteine; b) Acidic hydrolysis for the non-oxidized protein to determine methionine and cysteine; and c) Basic hydrolysis for the non-oxidized protein to deter-mine tryptophan.
– Separation detection and quantification of AA
After the hydrolysis, separations of the AA need to be done. For this step, an ionic exchange chromatogra-phy (IEC) is performed using either a cation exchange resin with a post-column derivatisation [with an AA analyser or a high-performance liquid chromatography (HPLC)] or a pre-column derivatisation followed by a reversed phase-LC.
To be able to detect small differences in protein qua-lity, a strict standardization of the experimental proce-dures is needed35. The biological assays, is a group of standardized methods that are designed in growing ani-mals. Among the most common are the protein efficien-cy ratio (PER), the net protein retention (NPR), the net protein utilization (NPU) and the biological value (BV).
PER: Osborne et al. developed it in 1919 as a mea-sure of the nutritive value of dietary protein in rats36. This method consists on the gain in body weight per gram of the animal according to the protein consumed. This assay requires that the protein in the diet repre-sent the 10% of the macronutrients. The advantages are that PER does not need to do a nitrogen balance experiment and it is easy to carry on36. The disadvan-tages are that the weight gain is in function of the food consumption, it may not be necessary influenced by the dietary protein36, and it does not make allowance for protein used for maintenance35.
PER= weight gain of animal (g)/protein consumed by animal (g).
NPR: It was developed by Bender and Doell in 1957 to improve the PER, taking into account the require-ment for the maintenance of the animal; as the PER, the protein represents the 10% of the macronutrients in the diet. This method includes a group with a protein-free diet35,36.
NPR =
weight gain of test animal (g) + weight loss of non-protein group (g)
Protein consumed by test animal (g)
NPU: Bender and Miller developed this method in 1953 to estimate the nitrogen retention in animals36. It represents the percentage of ingested nitrogen that is retained in the body and is determined by measuring digestive, metabolic (urinary) and miscellaneous nitro-gen losses. NPU values are true or apparent depending on whether the loss of endogenous nitrogen is taken into account or not and this is critical to precisely de-termine the efficiency of dietary protein utilization and the quality of the different dietary protein sources37.
NPU=
Ingested N-(Faecal N-Metabolic faecal N) – (Urine N- Metabolic urine N) x 100
Ingested N
BV: K. Thomas Mitchell defined it in 1909 as the fraction of absorbed N retained in the body for main-tenance and growth of the animal36. It was modified
016 Evaluacion de la calidad_Angel Gil.indd 140 12/02/15 14:05

Indicators for the evaluation of diet quality 141
by HH. Mitchell in 192437 and even though it does not take into account the digestibility, it has been wi-dely used. This method as the NPU and NPR includes a protein-free diet group35,38. This method might un-derestimate the metabolic faeces N and urine N, as a free-protein diet is not a normal diet for the animal, and the body has mechanisms to save N.
BV=
Ingested N-(Faecal N-Metabolic faecal N) – (Urine N- Metabolic urine N) x 100
Ingested N-(Faecal N-Metabolic faecal N)
In 1989 the joint FAO/WHO Expert Consultation on Protein Quality Evaluation recommended the use of the Protein Digestibility Corrected Amino Acid Score (PDCAAS) method for evaluating protein quality that included digestibility39. In calculating PDCAAS, the limiting AA score (i.e. the ratio of the first-limiting AA in a gram of target food protein to that in a reference protein or requirement value) is multiplied by protein digestibility with the intention of assessing how well dietary protein can match the demand for AA, and allowing the prediction of dietary protein utilisation. The PDCAAS method has now been in use for some 20 years and has proved to be of considerable value in practice. Nevertheless, limitations of PDCAAS have been recognised and debated, and new research findings have accumulated, whereby it has become timely to review the adequacy of PDCAAS and its application vis-à-vis other methods of estimating die-tary protein quality.
It was in this context that an FAO Expert Consulta-tion on Protein Quality Evaluation in Human Nutrition was held in Auckland, New Zealand, from March 31 to April 2, 201140. As in previous reports, the primary task of this Consultation was to provide FAO with tools for addressing practical questions on matters such as the adequacy of food supplies, targets for food and nutri-tion policy and the norms to be applied in labelling and regulation of protein quality for normal populations; as well as providing a perspective on the potential role for protein with respect to health, well-being and clinical conditions at various stages of th e life course.
The key findings and most relevant conclusions of the report are:
• In dietary protein quality evaluation, dietary AA should be treated as individual nutrients and wherever possible data for digestible or bioavailable AA should be given in food tables on an individual AA basis.
• A new protein quality measure (digestible in-dispensable AA score; DIAAS) is recommen-ded to replace PDCAAS. DIAAS is defined as:
• DIAAS % = 100 x [(mg of digestible dietary indispensable AA in 1 g of the dietary protein) / (mg of the same dietary indispensable AA in 1g of the reference protein)].
• Both ileal and faecal AA digestibility approa-ches can be subject to important limitations,
but it is concluded that on balance ileal protein or AA digestibility, i.e. determined at the ter-minal ileum at the end of the small intestine, is considered to better reflect the amounts of AA absorbed and should be used in calculating DIAAS. Digestibility should be based on the true ileal digestibility of each AA preferably determined in humans, but if this is not possi-ble, in growing pigs or in growing rats in that order.
• It is recommended that for foods susceptible to damage from processing, ‘reactive’ rather than ‘total’ lysine contents and the true ileal diges-tibility of reactive lysine (lysine availability) rather than of total lysine, be determined and used in the calculation of DIAAS.
• Recommended AA scoring patterns (i.e. AA pa-ttern of the reference protein) to be used for cal-culating DIAAS are as follows: a) Infants (birth to 6 months), pattern of breast milk; b) Young children (6 months to 3 y), pattern for the 0.5 y old infant; c) Older children, adolescents and adults, pattern for the 3 to 10 y old child, can be found in different Tables of the FAO nº 92 Report45. For regulatory purposes two scoring patterns are recommended: the AA composition of human milk for infant formulas, and for all other foods and population groups the pattern for young children (6 months to 3 y)
• In calculating DIAAS the ratio should be calcu-lated for each dietary indispensable AA and the lowest value designated as the DIAAS. DIAAS can have values below or in some circumstan-ces above 100%. Values above 100% should not be truncated except where calculating DIAAS for protein or AA intakes for mixed diets or sole source foods.
• After assessment of the ileal AA digestibility dataset it was concluded that currently, availa-ble data are insufficient to support the applica-tion in practice (though its use in principle is supported) of true ileal AA digestibility in the calculation of DIAAS. More data on the true ileal AA digestibility of human foods are ur-gently needed, determined in humans and ani-mal models. More inter-species (human, pig, rat) true ileal AA digestibility comparisons are needed. The report makes recommendations for further research in the area.
Carbohydrates and diet quality
WHO/FAO Expert Consultation1,41 recommended that total carbohydrate in diet should provide 55–75 % of total energy. In a later update in 200642, WHO/FAO Experts recommended the revision of the lower limit suggesting 50 % total energy. In Europe, the European Food Safety Authority43 proposes a dietary reference
016 Evaluacion de la calidad_Angel Gil.indd 141 12/02/15 14:05

142 DIETARY SURVEYS AND ENERGY BALANCE: METHODOLOGY, BIAS, ADJUSTMENT AND OTHER ISSUES
values for total carbohydrates of 45-60 % total energy and in Spain the Spanish Society of Community Nutri-tion (SENC) recommend 50-60 % total energy44.
The dietary carbohydrates are a diverse group of substances with a range of chemical, physical and physiological properties. These properties have impli-cations for our overall health; contributing particularly to the control of body weight, diabetes, cardiovascular disease, large bowel cancer, constipation and resis-tance to gut infection, caries and low micronutrients density. However, the classification of carbohydrates is very complex and need to be discussed. A chemi-cal approach divides carbohydrates into three main groups, sugars (monosaccharides, disaccharides and sugar alcohol), oligosaccharides (malto-oligosacchari-des, etc.) and polysaccharides (starch and non-starch). According to a functional approach, carbohydrates can be classified based in physiological or nutritional properties like resistant starch, prebiotics, sugars or dietary fibre. Regarding dietary fibre, now there is a consensus in its definition that must be limited to poly-saccharides that are intrinsic to the plant cell wall and not the indigestibility in the small intestine.
To judge the quality of the diet in relation to the con-tent of carbohydrates, it is of vital importance to dis-tinguish between the different types, mainly according to the content of sugars (natural or added) and fibre; glycaemic index and load (GI, GL); refined vs. whole grains; fruits and vegetables; and liquids vs. solids car-bohydrates. Assessment of carbohydrate quality would have been helpful in drawing meaningful conclusions about the relationship between dietary carbohydrates and health and disease.45.
Evidence of associations between carbohydrates and diseases comes from epidemiological and clinical stu-dies. Carbohydrates are among the macronutrients that provide energy and can thus contribute to weight gain, overweight and obesity when consumed in excess of energy requirements. On the other hand, a diet with a high content of dietary fibre is associated with relati-vely low energy density, promotion of satiety and, in observational studies with lesser degree of weight gain than those with lower intakes. There are also eviden-ces about the relationship between dietary carbohy-drate and CVD, metabolic syndrome and cancer 46, 47. Whole-grain cereals, vegetables, legumes and fruits are the most appropriate sources of dietary carbohy-drate because they have a high content in dietary fibre and less content in calories.
Recent scientific publications have defined a quality index based on carbohydrates for diet53,54. The authors define de Carbohydrate Quality Index (CQI) using the following criteria: Intake of dietary fibre in g/d, gly-caemic index, whole grains to total grains ratio and solids carbohydrates to total carbohydrates ratio. Each of the criteria was scored between 1 and 5 according to the quintile categorization. The CQI result from the sum of the four values (ranging between 4 and 20) and categorized in quintiles.
Using this CQI in the SUN cohort48 the incidence of overweight and obesity showed an inverse association with CQI. These results highlight the importance of the quality and not only de quantity or the percentage of total energy of dietary carbohydrates in the main-tenance of body weight. In another study in the same cohort, Zazpe et al. (2014)49 observed that there is a strong relationship between the CQI and the intake of nineteen micronutrients with relevance in public heal-th. The better micronutrient intake adequacy was ob-served in the individuals with higher CQI49.
Other nutrients
At present, many developed and affluent countries consume excessive amounts of sodium and insufficient amounts of potassium. The health consequences of ex-cessive sodium and insufficient potassium are substan-tial and include increased levels of blood pressure and its consequences (heart disease and stroke). In 2005, the DGAC of the USDA (2010) recommended a daily sodium intake of less than 2300 milligrams for the ge-neral adult population and stated that hypertensive indi-viduals3. Several specific populations e.g. middle-aged and older adults would benefit from reducing their so-dium intake even further to 1500 milligrams per day. Hence, some DQIs have include sodium in their compo-site score e.g. HEI and DQI
Other minerals like calcium and iron have been con-sidered in some DQIs. Although trace elements and vi-tamins play essential roles in health, any of the current DQIs have included these substances in their compo-sition. However, it is assumed that consumption of a variety of food groups would results into acceptable intake of these essential compounds
Conclusions and future trends
DQIs are important tools to evaluate the quality of the diet for specific populations not only in terms of intake of nutrients but also in terms of food diversity and moderation. The FINUT pyramid of healthy lifes-tyles has been recently designed as a new strategy for promoting adequate nutrition and active healthy lifes-tyles in a sustainable way. Indeed, based on the FINUT pyramid, a global HLI should consider, beyond food groups and nutrients, selected items on food safety e.g. consumption rate of proceed foods, food handling, preparation and storage and access to drinking water, selected food habits, including alcoholic beverage and salt consumption patterns, purchase of seasonal and local foods, home cooking, and conviviality, physical activity, sedentary and rest habits and some selected sociocultural habits, particularly those related to food selection, religious beliefs and socializing with friends, should be included. Figure 2 depicts the items included in this global HLI.
016 Evaluacion de la calidad_Angel Gil.indd 142 12/02/15 14:05
Indicators for the evaluation of diet quality 143
Conflict of interest
The authors declare no conflict of interest.
Acknowledgments
We acknowledge the support of the Instituto de Sa-lud Carlos III del Ministerio de Ciencia e Innovación. Red SAMID RETIC no. RD08/0072.
References
1. World Health Organization. Diet, nutrition and the preven-tion of chronic diseases. Report of a Joint WHO/FAO Expert Consultation. WHO Technical Report Series no. 916, WHO, Geneva, 2013.
2. Lucini D, Zanuso S, Blair S, Pagani M. A simple healthy li-festyle index as a proxy of wellness: a proof of concept. Acta Diabetol 2014 Jun 11. [Epub ahead of print].
3. USDA. USDA report of the Dietary Guidelines Advisory Committee on the Dietary Guidelines for Americans 2010 [ci-ted 2015 Jan 5]. Available from: http://www.cnpp.usda.gov/DGAs2010-DGACReport.htm.
4. Gil A, Ruiz-Lopez MD, Fernandez-Gonzalez M, et al. The FINUT healthy lifestyles guide: Beyond the food pyramid. Adv Nutr 2014; 5: 358S-67S.
5. Bach-Faig A, Berry EM, Lairon D, et al. Mediterranean Diet Foun-dation Expert Group. Mediterranean diet pyramid today: science and cultural updates. Public Health Nutr 2011; 14: 2274–84.
6. Wengreen H, Munger RG, Cutler A, et al. Prospective study of Dietary Approaches to Stop Hypertension- and Mediterra-nean-style dietary patterns and age-related cognitive change: the Cache County Study on Memory, Health and Aging. Am J Clin Nutr 2013; 98: 1263-71.
7. Fransen HP, Ocké MC. Indices of diet quality. Curr Opin Clin Nutr Metab Care 2008; 11: 559-65.
8. Kant AK. Indexes of overall diet quality: a review. J Am Diet Assoc 1996; 96: 785-91.
9. Kant AK. Dietary patterns and health outcomes. J Am Diet As-soc 2004; 104: 615–35.
10. Waijers PM1, Feskens EJ, Ocké MC. A critical review of pre-defined diet quality scores. Br J Nutr 2007; 97: 219-31.
11. Arvaniti F, Panagiotakos DB. Healthy indexes in public health practice and research: a review. Crit Rev Food Sci Nutr 2008; 48: 317–27.
12. Alkerwi A. Diet quality concept. Nutrition 2014; 30: 613-8.13. Kennedy ET, Ohls J, Carlson S, et al. The Healthy Eating In-
dex: design and applications. J Am Diet Assoc 1995; 95: 1103-8.
14. Patterson RE, Haines PS, Popkin BM. Diet quality index: cap-turing a multidimensional behavior. J Am Diet Assoc 1994; 94: 57–64.
15. Huijbregts P, Feskens E, Rasanen L, et al. Dietary pattern and 20 year mortality in elderly men in Finland, Italy, and The Ne-therlands: longitudinal cohort study. BMJ 1997; 315: 13–7.
16. Trichopoulou A, Kouris-Blazos A, Wahlqvist ML, et al. Diet and overall survival in elderly people. BMJ 1995; 311: 1457-60.
17. Kennedy E. Dietary diversity, diet quality, and body weight regulation. Nutr Rev 2004; 62: S78-81.
18. McCullough ML, Feskanich D, Stampfer MJ, et al. Diet qua-lity and major chronic disease risk in men and women: mo-ving toward improved dietary guidance. Am J Clin Nutr 2002; 76:1261-71.
19. Fung TT, McCullough ML, Newby PK, et al. Diet quality sco-res and plasma concentrations of markers of inflammation and endothelial dysfunction. Am J Clin Nutr 2005; 82: 163–73.
20. Haines PS, Siega-Riz AM, Popkin BM. The Diet Quality Index revised: a measurement instrument for populations. J Am Diet Assoc 1999; 99: 697-704.
21. Gerber M. Qualitative methods to evaluate Mediterranean diet in adults. Public Health Nutr 2006; 9: 147-51.
22. Trichopoulou A, Costacou T, Bamia C, et al. Adherence to a Mediterranean Diet and Survival in a Greek Population. N Eng J Med 2003; 348: 2599-608.
23. Schröder H, Fitó M, Estruch R, et al. A short screener is valid for assessing Mediterranean diet adherence among older Spa-nish men and women. J Nutr 2011; 141: 1140–5.
24. Estruch R, Ros E, Salas-Salvadó J, et al. Primary prevention of cardiovascular disease with a Mediterranean diet. N Engl J Med 2013; 368: 1279-90
25. Sotos-Prieto M, Moreno-Franco B, Ordovás JM, et al. Design and development of an instrument to measure overall lifestyle habits for epidemiological research: the Mediterranean Lifes-tyle (MEDLIFE) index. Public Health Nutr 2014; 15: 1-9
26. Drewnowski A, Fulgoni VL. Nutrient density: principles and evaluation tools. Am J Clin Nutr 2014; 99 (Suppl 5): 1223S-8S.
27. Fulgoni VL, Keast DR, Drewnowski A. Development and Va-lidation of the Nutrient-Rich Foods Index: A Tool to Measure Nutritional Quality of Foods. J Nutr 2009; 139: 1549–54.
28. Food and Agriculture Organization of the United Nations (FAO). Fat and fatty acids in human nutrition. Report of an Expert Con-sultation. Food and Nutrition Paper nº.91, Rome, 2010.
29. Fehily AM, Pickering JE, Yarnell JW, et al. Dietary indices of atherogenicity and thrombogenicity and ischaemic heart disea-
Fig. 2.—Global quality of life index.
016 Evaluacion de la calidad_Angel Gil.indd 143 12/02/15 14:05
144 DIETARY SURVEYS AND ENERGY BALANCE: METHODOLOGY, BIAS, ADJUSTMENT AND OTHER ISSUES
se risk: the Caerphilly Prospective Study. Br J Nutr 1994; 71: 249-57.
30. Ulbricht LV, Southgate DAT. Coronary heart disease: seven dietary factors. Lancet 1991; 338: 985-92
31. Boye J, Wijesinha-Bettoni R, Burlingame B. Protein quality evaluation twenty years after the introduction of the protein di-gestibility corrected amino acid score method. Br J Nutr 2012; 108 (Suppl 2): S183-211.
32. Institute of Medicine (IOM). Dietary Reference Intakes for Energy, Carbohydrate, Fiber, Fat, Fatty Acids, Cholesterol, Protein, and Amino Acids (Macronutrients). National Aca-demy Press. 589-611, Washington, 2005.
33. FAO/WHO-UNU. Energy and Protein Requirements: Report of a Joint FAO/WHO/UNU Expert Consultation, WHO Tech-nical Report Series no.724, Geneva: WHO, 1985.
34. Otter DE. Standardised methods for amino acid analysis of food. Br J Nutr 2012; 108 Suppl 2: S230-37.
35. AOAC Official Methods of Analysis of the Association of Official Analytical Chemists International 17th edition. Sec-tion 45.3.04 (AOAC Official Method 960.48, Protein Efficien-cy Ratio), section 45.3.05 (AOAC Official Method 982.30, protein Efficiency Ratio, Calculation Method) section 45.3.06 (AOAC Official Method 991.29; True Protein Digestibility of Foods and Food Ingredients, Rat Bioassay), section 45.4.04 (AOAC Official Method 988.15, Tryptophan in Foods and Food and Feed Ingredients), section 45.4.05 (AOAC Official Method 985.28, Sulfur Amino Acids in Food and Feed Ingre-dients, Ion-Exchange Chromatographic method: Extension to Processed Foods). Gaithersburg, Maryland: Association of Official Analytical Chemists International, 2000
36. Wu, G. Amino acids: biochemistry and nutrition. Taylor & Francis Group. Pp. 452-454, Boca Raton, Fl, 2013.
37. Tome D. Criteria and markers for protein quality assessment - a review. Br J Nutr 2012; 108 (Suppl 2): S222-9.
38. Bender, David A. Amino Acid Metabolism. Third edition. John Wiley and Sons Ltd. pp.417, Hoboken, NJ, 2012.
39. FAO/WHO Protein Quality Evaluation: Report of the Joint FAO/WHO Expert Consultation, FAO Food and Nutrition Pa-per 51. Rome: FAO, 1991.
40. Food and Agriculture Organization of the United Nations (FAO). Dietary protein quality evaluation in human nutrition. Report of an Expert Consultation Series nº 92. FAO, Rome, 2013
41. Food and Agriculture Organization of the United Nations (FAO). Carbohydrates in Human Nutrition. Report of a Joint FAO/WHO Expert Consultation. (FAO Food and Nutrition Pa-per – 66). Rome, 1988.
42. Mann J, Cummings JH, Englyst HN, et al. FAO/WHO scien-tific update on carbohydrates in human nutrition: conclusions. Eur J Clin Nutr 2007; 61 Suppl 1: S132-7.
43. European Food and Safety Authority (EFSA). Panel on Die-tetic Products, Nutrition, and Allergies (NDA); Scientific Opinion on Dietary Reference Values for carbohydrates and dietary fibre. EFSA Journal 2010; 8:1462 [77 pp.].
44. SENC. Objetivos nutricionales para la población española. Consenso de la Sociedad Española de Nutrición Comunitaria 2011. Rev Esp Nutr Com 2011; 17: 178-9.
45. Roberts CK, Liu S. Carbohydrate intake and obesity: an as-sociation that needs “refining”. J Am Diet Assoc 2009; 109: 1163-4.
46. Schulze MB, Hu FB. Dietary Approaches to Prevent the Meta-bolic Syndrome. Diabetes Care 2004; 27: 613–4.
47. Gaesser, GA. Carbohydrate quantity and quality in relation to body mass index. J Am Diet Assoc 2007; 107: 1768–80.
48. Santiago S, Zazpe I, Bes-Rastrollo M, et al. Carbohydrate qua-lity, weight change and incident obesity in a Mediterranean cohort: the SUN Project. Eur J Clin Nutr 2014; doi: 10.1038/ejcn.2014.187
49. Zazpe I, Sánchez-Taínta A, Santiago S, et al. Association be-tween dietary carbohydrate intake quality and micronutrient intake adequacy in a Mediterranean cohort: the SUN (Segui-miento Universidad de Navarra) Project. Br J Nutr 2014; 111: 2000–9.
016 Evaluacion de la calidad_Angel Gil.indd 144 12/02/15 14:05