india's - ultratech cement confer… · indian cement industry gdp growth v/s cement demand...
TRANSCRIPT


INDIA'S LARGEST CEMENT
COMPANY
CORPORATE DOSSIER
Stock code: BSE: 532538 NSE: ULTRACEMCO Reuters: UTCL.NS Bloomberg: UTCEM IS / UTCEM LX

Contents
2
ADITYA BIRLAGROUP-
OVERVIEW
ECONOMIC ENVIRONENT
INDIAN CEMENT SECTOR
Note 1: The financial figures in this presentation have been rounded off to the nearest ` 1 cr, 1 US$ = ` 66.25
GLOSSARY
Mnt – Million Metric tons Lmt – Lakhs Metric tons MTPA – Million Tons Per Annum Q3 – October-December Q4 – January- March Full Year – April-MarchLY – Corresponding Period last Year FY – Financial Year (April-March) ROCE – Return on Average Capital Employed MW – Mega WattsICU – Integrated Unit GU – Grinding Unit BT – Bulk Terminal
OPERATIONAL AND FINANCIALPERFORMANCE
ULTRATECH LANDSCAPE
ADITYA BIRLA GROUP - OVERVIEW

A global metal powerhouse – 3rd biggest producers of primary aluminum in Asia.No. 1 in viscose staple fibre in the world.No. 1 in carbon black in the world. Amongst the top global cement players.Globally 4th largest producer of insulators and acrylic fibre.Positioning in India:
Largest capacity in cement.Top fashion and lifestyle player.2nd largest player in viscose filament yarn.Among the top 3 mobile telephone companies.A leading player in life insurance and asset management.
Among the top 2 supermarket chains in retail.
US$ ~41 billion CorporationIn the League of Fortune 500Operating in 36 countries with over 50% Group revenues from overseasAnchored by about 120,000 employees from 42 nationalitiesRanked 4th in global top companies for leaders and 1st in Asia Pacific
(Source: Aon Hewitt, Fortune & RBL - 2011)
Aditya Birla GroupPremium global conglomerate
4
Our Values Integrity Commitment Passion Seamlessness Speed
Indi
an L
iste
d En
titie
s

UltraTech CementIndia’s largest cement company
5
India’s Largest Cement Selling Brand
No. 1 RMC player in India with ~ 100 plants
Different Products to provide complete Building Solutions
> 1200 stores
No.1 Player of White Cement & Cement
based Putty
Market Cap of ~US$ 13.5 Bn
FY16 Consolidated Revenue ~US$ 3.8 Bn
About 1,000 million bags every year
~ 43,000 Direct & Indirect Employment

UltraTech CementBuilding Products Portfolio
6
Complete Building Solutions under one Umbrella

UltraTech Journey
7
Acquisition ofL&T Cement
Business
- Focus on Cost Leadership between 2005-2009
- Synergy of Cement Business of ABG under one roof;
- Investments in TPPs –80% power self-sufficient
- Organic Capacity
addition:15 mtpa
- Group Cement business
under one roof
- Became India’s Largest
Cement Company
- Acquisition of Star
Cement: 3 MTPA
- Acquisition in progress: 21.20 MTPA
- Acquisition completed:
4.8 MTPA
- Commissioned brownfield projects - 7.9 MTPA
- Commissioned greenfield projects- 4.8 MTPA
- Capacity under commissioning – 0.6 MTPA
2004Mkt Cap –US$ :1 Bn
2008Mkt Cap –US$ :2 Bn
2011Mkt Cap –US$ :7 Bn
Current Mkt Cap –US$: 13.5 Bn
UTCLInception
31 MTPA
42 MTPA
52 MTPA
69 MTPA
Aug'04 Mar'08 Mar'11 Mar'14 Current
UTCL Share Price Trend BSE Sensex Trend 12x
5x

Governance
8
Non-Executive Chairman
Independent Directors
Executive / Non- Executive Directors
Mr. K M Birla
Board of Directors
Mr. RC Bhargava Mrs. Rajashree Birla
Mr. K K Maheshwari- MDMr. GM Dave
Mr. SB Mathur Mr. Rajiv Dube
Mr. Arun Adhikari
Mrs. Renuka Ramnath
Mr. D D Rathi
Mrs. Sukanya Kripalu
Mr. O P Puranmalka
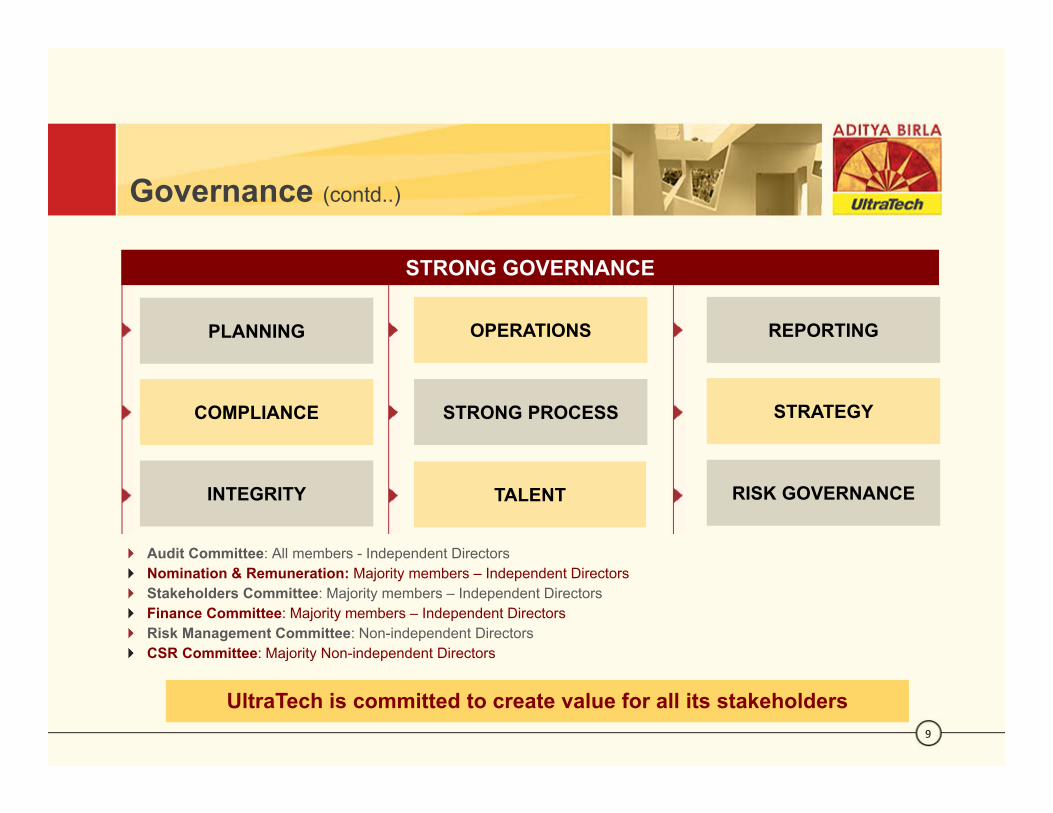
Governance (contd..)
9
UltraTech is committed to create value for all its stakeholders
PLANNING
COMPLIANCE
INTEGRITY
OPERATIONS
STRONG PROCESS
TALENT
REPORTING
STRATEGY
RISK GOVERNANCE
STRONG GOVERNANCE
Audit Committee: All members - Independent Directors Nomination & Remuneration: Majority members – Independent DirectorsStakeholders Committee: Majority members – Independent DirectorsFinance Committee: Majority members – Independent DirectorsRisk Management Committee: Non-independent DirectorsCSR Committee: Majority Non-independent Directors

Management Team
10
Mr. KK Maheshwari- Managing Director- He is a Fellow Chartered Accountant with over 38 years of experience. Held a variety of roles in Group having exposure in multi-
business, multi-geography and multi-culture. - He has brought in strong execution rigor to his work, and has considerably strengthened both innovation and new products
development. He scripted the growth of the Group’s VSF Business towards a more competitive and sustainable model.
Mr. KC Jhanwar Chief Manufacturing Office- A Fellow Chartered Accountant and has over 35 years of experience in Group. Has worked across finance, operations
and general management roles in the Cement and Chemicals business of the Group. Carries deep expertise in project management and commercial skills, as well as significant experience in acquisitions and integration.
- Prior to moving current role, was heading Chlor Alkali Chemicals Business of the Group.
Mr. Atul Daga – Chief Financial Officer- Mr. Atul Daga is a Chartered Accountant by profession and has over 27 years of experience. Started his journey in group as an
Executive Assistant to Late Mr. Aditya Vikram Birla. Has gained experience different roles like Financial Planning, TreasuryManagement, Business Strategy, Merger & Acquisition, Investor Relations.
Mr. Vivek Agarwal- Chief Marketing Officer- A bachelor of Engineering (Mechanical) and an MBA from FMS, Delhi, Mr Vivek has experience of over 30 years and with Group
about 22 years. A veteran with the Cement business of the Group, brings with him a vast experience in marketing. Played key role ingrowing Ready Mix Concrete Business of the Company.
- Prior to moving into current role, was CEO our subsidiary Star Cement.
Mr. Gautam Chainani – Chief Human Resource Officer- A post graduate in PM and IR, Mr. Chainani brings with him over 27 yrs of experience, with organizations like WNS Global Services
Ltd., Bharati Cellular Ltd., Wipro Consumer & Hindustan Lever Ltd. in different roles of human resources management.- Joined UltraTech in 2013 after spending more than six years in Financial Services Business of the Group

Shareholding Pattern
11
As on 31st Mar,2016
Promoter Group, 61.5%Foreign Portfolio Investors, 19.0%
Mutual Fund, Insititutions, 7.0%
Other Public Holding, 10.7%
GDRs, 1.7%
Name Holding %
Grasim Industries Limited 60.25%
Turquoise Investments and Finance Pvt Ltd 0.51%
Hindalco Industries Limited 0.46%
Trapti Trading & Investments Pvt Ltd 0.25%
Others 0.00%
Promoter Group Non-promoter Shareholding > 1%
Name Holding %
Aberdeen 3.21%
LIC of India 2.50%
Oppenheimer Developing Markets Fund 1.41%

Economic Environment

Macro Indicators … taking towards good growth cycle
13
Government- Continuous Focus on improving business sentiments
Proposal for GST - simplification of tax structuresRelaxation in FDI policies, GAAR prospective from 2017“Make In India” “Skill India” and “Digital India” a boost to GDP
Identified 98 Smart Cities for development plan has been finalized for first 20 cities with total expenditure of USD 7.5 bn in next 5 years
Improving Macro Indicators
GDP for 9M 16: 7.5% and likely for FY16 7.4% World Bank forecast FY17 – 7.8% and likely grow fastest in world for next 3 yearsIIP for Apr-Feb’16 : 2.6%Inflation under control - Interest rate correction

Indian Cement Sector

15
Indian cement industryOverview
Second largest market Globally with capacity of ~ 405 mtpa after China (~ 2400 MTPA).
2nd fastest-growing cement market globally: Compounded Average Growth: 8% (Last decade)
GLOBAL CEMENT CONSUMPTION
Source: Cement Consumption Cembureau, Company Estimates
Market Composition:North - 35%, East - 16%, West - 13%, South - 36%
7%
17%
8%
5%
2%5%
57%
India
Asia (Excl. China, India)
Europe & Others
America (Excl. USA)
USA
Africa
China

Indian cement industryOverview (contd…)
16
Consolidation in industry at regular intervals
Entry of new players (non-cement)
PER CAPITA CEMENT COSNUMPTION (KG)
Fragmented Market:No of plants ~ 195, owned by ~ 50 playersTop 6 players holds ~ 50% of capacity
Per Capita Cement Consumption at 200 kg lowest among the developing countries; World average ~ 580 Kg 1780
830
660 580470
355280 200
China
Turkey
Vietnam
World
Russia
Brazil
USA
India
Source: Cement Consumption Cembureau, Company Estimates Population IMF

Indian cement industryGDP growth v/s cement demand growth
17
Cement volume growth has been weak in past 3-4 years, led by a slowdown in infra, commercial and housing
However, …sustained cement consumption growth ~ 8% in last 14 years (2001 onwards)
Demand likely to reach it’s normal level with improved focus on infrastructure and housing
Long-term average cement demand growth: 1.2x of GDP
0
2
4
6
8
10
12
14
FY02 FY03 FY04 FY05 FY06 FY07 FY08 FY09 FY10 FY11 FY12 FY13 FY14 FY15 FY16
Despatches Growth GDP Growth
(‐) veco‐relation
+ve co‐relation

Indian cement industryDemand-supply trend
18
Source: Company estimates & DIPP data.
FY ’08 ‘09 ‘10 ‘11 ’12 ’13 ‘14 ’15 ’16 ’17 ‘18 ‘19 ‘20
Gr. 9.8 8.5 12.1 5.7 7.1 5.2 2.6 3.5 4.5 7.0 7.4 7.6 7.8
Util. 83 82 74 70 72 68 67 65 66 68 73 76 82
In MnT
Around 70 million tonnes capacity added in last 3 years
Though demand remained low in last 3 years
Surplus capacity in the sector c 138 million tonnes
Industry capacity doubled in last decade
Demand – supply balance to improve gradually in next 3 years with slower pace of capacity addition and likely improvement in demand
FY 08 FY 09 FY 10 FY 11 FY 12 FY 13 FY 14 FY 15 FY 16 FY 17 FY 18 FY 19 FY20
198 216
276304 319
357 368392 405 420 422 436 436
164 178203 214 229 241 247 255 267 286
307 330 356
Capacity Demand
Incremental Supply - 188 mnt > Demand - 92 mnt S - 32 mnt < D - 50 mnt138
80
In %

Demand growth drivers
19
Source: 1.Mckinsey Urbanisation Report 2.Working Group Report, Govt. of India m 3. Consultation paper , Planning Commission of India
Rapid Urbanisation (28.7% in 2005 to 40% in 2030)Number of Cities(population of 1Mn.+) to grow from 33(2005) to 68(2030)Five year plan, housing requirement of 74 Million unitsRural demand rising, additional boost from urban housing on softening of interest rates
Strong demand from IT / ITES, historically south – like Chennai, Bangalore & HyderabadEmerging Growth from Resource Based Industries from Eastern India Likely large corporate capex driven by higher Infrastructure spending and future potential growth
Infrastructure investment of USD 1 Trillion the XIIth Plan(GOI) periodInvestment projected across sectors with power, roads, railways, irrigation and telecom constituting the major component Recent renewed focus of new govt. on infrastructure – E.g. New state formation like Andhra Pradesh and Telangana
Housing (~60- ~65%)
Commercial & Industrial Investments (~20%)
Infrastructure ( ~15-20%)

Sector guidance
20
Demand to improve with government focusing on investment & infrastructure revival and various reforms:
Government Housing Plan –
Housing for all: 20 ml Houses for urban areas and 40 ml in Rural areas
Pradhan Mantri Awas Yozana – Gramin : To construct 10 ml units (FY17-19)
Roads (concrete) - another 1,00,000 kms in addition to 1,00,000 kms road which is already in process (Road Execution target for FY17 – 15000 kms)
Western and Eastern dedicated freight corridor (~$ 13 bln)
100 smart cities, Identified first 20 smart cities (Expenditure plan USD 7.5 bn in next 5 years)
Swatchh Bharat Mission – government intent to construct 110 mln toilets in next 5 years (~ $ 32 bln)
Metro rail project coming up in tier-II cities like Lucknow, Kochi, Jaipur, Ahmedabad, Chandigarh, Nagpur, Kanpur, Patna, Surat and Pune (~ $ 17Bn)
5 new Mega Power Projects each of 4000 MW in the Plug-and-Play mode ( ~ $ 16 bln)
Target of 175,000 MW renewable energy by 2022.
Port Development – Handling capacity to increase more than double 3000 ml tonnes by 2025 (~ 15 bn)
Industry expected to grow 7-8% for FY17

Sector guidance … (contd…)
21
Capacity addition pace slowing down…. Leading towards improvement in utilization
Expected capacity addition: FY17 – FY19 ~ 30 million tonnes Incremental demand: FY17- FY19 ~ 55 million tonnes
Setting up new Cement Capacity becoming more challenging due to :
Tougher land acquisition process Increased gestation period Availability of new limestone mines (through auction)
Surplus capacity to reduce around 106 million tones by FY19, with south region continue to having 50% share in surplus capacity

UltraTech Landscape

UltraTech - A snapshot
23
GrowthDomestic Capacity increased > 10 fold since FY98 to 66.3 Mtpa. Total Capacity 69.3 MtpaProven Capabilities to Grow Organically 41 Mtpaand Inorganically 25 Mtpa.
Market Leadership“UltraTech” -Premium national brand
Leadership in key consuming markets
Strong nationwide distribution network
Cost Leadership Large Size kiln – Economy of scale
Latest Technology Plant
> 85% Power Self Sufficiency thru TPP & WHRS
Hub and Spoke Model through Split GUs/ Terminals near market & Efficient Logistics
Particulars UOM Current
Capacity
Grey Cement - Domestic Mtpa 66.3
- Overseas Mtpa 3.0
White Cement Mtpa 0.7
Wall Care Putty Mtpa 0.8
RMC Mn. Cub. Mtr 12.5
Captive Power Plants In MW 717
WHRS + Wind Mill + Solar In MW 63
Plants & Terminals
Grey Cement (Composite Plant) Nos. 12
Clinkerisation Plant (Overseas) Nos. 1
Grinding Units (Overseas- 4) Nos. 19
White Cement & Putty Nos. 2
RMC Plants Nos. 99
Bulk Terminals Nos. 7

UltraTech - India Footprint
24
12 Integrated Units
15 Grinding Units
6 Bulk Packaging Terminals (Sea+Rail)
2 White Cement & Putty Units
5 Jetties
6 ICU & 5 GU Under Acquisition
1 GU & 1 BT In-Progress
Zones Zonal Capacity (mtpa)
Current UT Cap. Sharein Industry
Post Acquisition
UT Capacity Mix
North 19.0 13% 23.8 27%
Satna Cl. - - 11.4 13%
East 10.4 16% 11.4 13%
West 20.4 38% 20.4 23%
South 15.5 11% 20.5 23%
All India 66.3 16% 87.5 100%
Overseas 3.0 3.6
Total 69.3 91.1
White Cement & Putty UnitsJetty
UTCL Grinding UnitUTCL Integrated UnitGU Under AcquisitionICU Under Acquisition
UTCL Bulk Terminals

Operational and Financial Performance
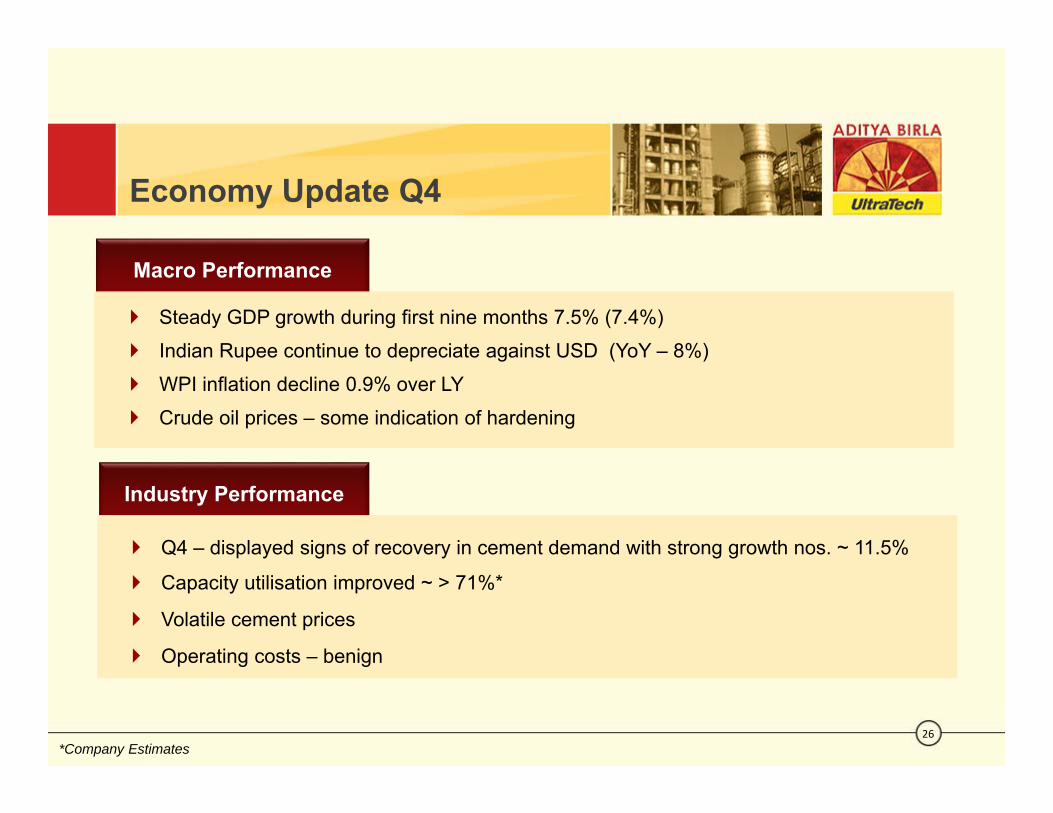
Economy Update Q4
26
Macro Performance
Steady GDP growth during first nine months 7.5% (7.4%) Indian Rupee continue to depreciate against USD (YoY – 8%) WPI inflation decline 0.9% over LY Crude oil prices – some indication of hardening
Industry Performance
Q4 – displayed signs of recovery in cement demand with strong growth nos. ~ 11.5%
Capacity utilisation improved ~ > 71%*
Volatile cement prices
Operating costs – benign
*Company Estimates

Zone / Region Volume Infra Comm. Housing Rural
Infrastructure growth from UP and Punjab
Housing Sector – Marginal growth
Robust growth from infrastructure spending in all major states –Roads & other developments (Urban as well as rural)
Sustained housing growth “Housing for all” & “Biju Patnaik Housing Scheme” Consistent demand from IHB segment Bihar demand – impacted due to sand availability
Industry (405 mtpa)Regional Update
27
North ( ~ 80% cu )**
East ( ~ 85% cu)**
35%*
16%*
*Estimated Industry Capacity share **Company estimates on capacity utilization (cu) for Q4

28
Zone / Region Volume Infra Comm. Housing Rural
Maharashtra – Momentum in Infrastructure segment - Concrete roads in ruralareas, Subdued demand from IHB segment, Mumbai demand - muted
Gujarat – Marginal demand uptick from Infrastructure
Demand started from AP, Telangana and Karnataka
Tamil Nadu and Kerala – No recovery
West ( ~ 70% cu)**
South ( ~ 55% cu)**
Increased Infrastructure activities and demand from AP/Telangana development lead the overall industry demand improvement in Q4
13%*
36%*
*Estimated capacity mix of Industry
Industry (405 mtpa)Regional Update
**Company estimates on capacity utilization (cu) for Q4

Performance Q4 2015-16

UltraTech Update
30
Projects Update Commissioned 1.6 mtpa Grinding unit in Bihar (6.1 mtpa green field capacity added since Apr’15)
Grinding unit in Maharashtra at final stage of commissioning
Total Capacity- 66.25 MTPA in India North
29%
East17%
West 31%
South23%
WHRS Update Commissioned another 6 MW Waste Hear Recovery System
Total WHRS Capacity- 59 MW TPP: 717 WHRS: 59 Others: 4
Total Captive Power Capacity
UltraTech Building Solution
Added ~ 100 stores more during this quarter. Total stores 1200

31
Q4 – Highlights
Domestic Cement Sales Volume Domestic Cement Sales Volume 13.20 Mnt13.20 Mnt + 15%
YoY Change
RMC volume RMC volume 13.31 LM313.31 LM3 + 18%
Blended Sales Blended Sales 64%64%
Average Realisation (Indian Operations) Average Realisation (Indian Operations) ` 4,609/t` 4,609/t (-) 9%
+ 2%
32
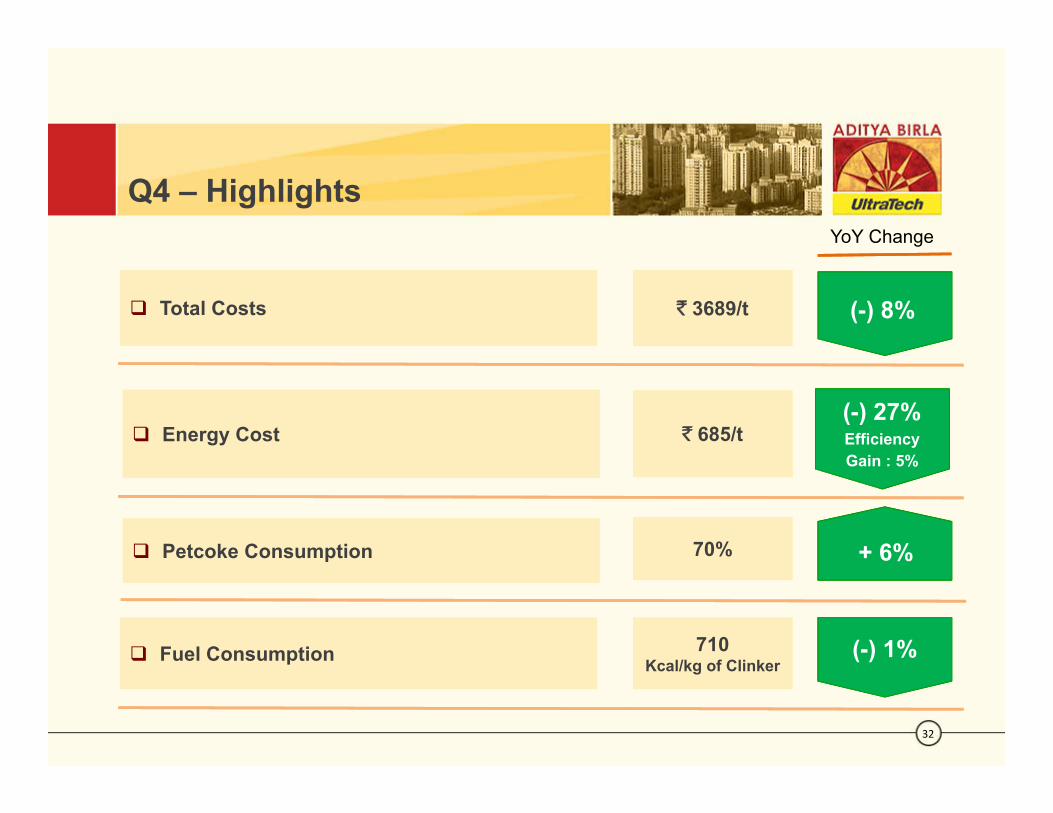
Q4 – Highlights
Total Costs Total Costs ` 3689/t` 3689/t (-) 8%
YoY Change
Petcoke Consumption Petcoke Consumption 70%70% + 6%
Fuel Consumption Fuel Consumption 710 Kcal/kg of Clinker
710 Kcal/kg of Clinker
(-) 1%
Energy Cost Energy Cost ` 685/t` 685/t(-) 27% Efficiency Gain : 5%
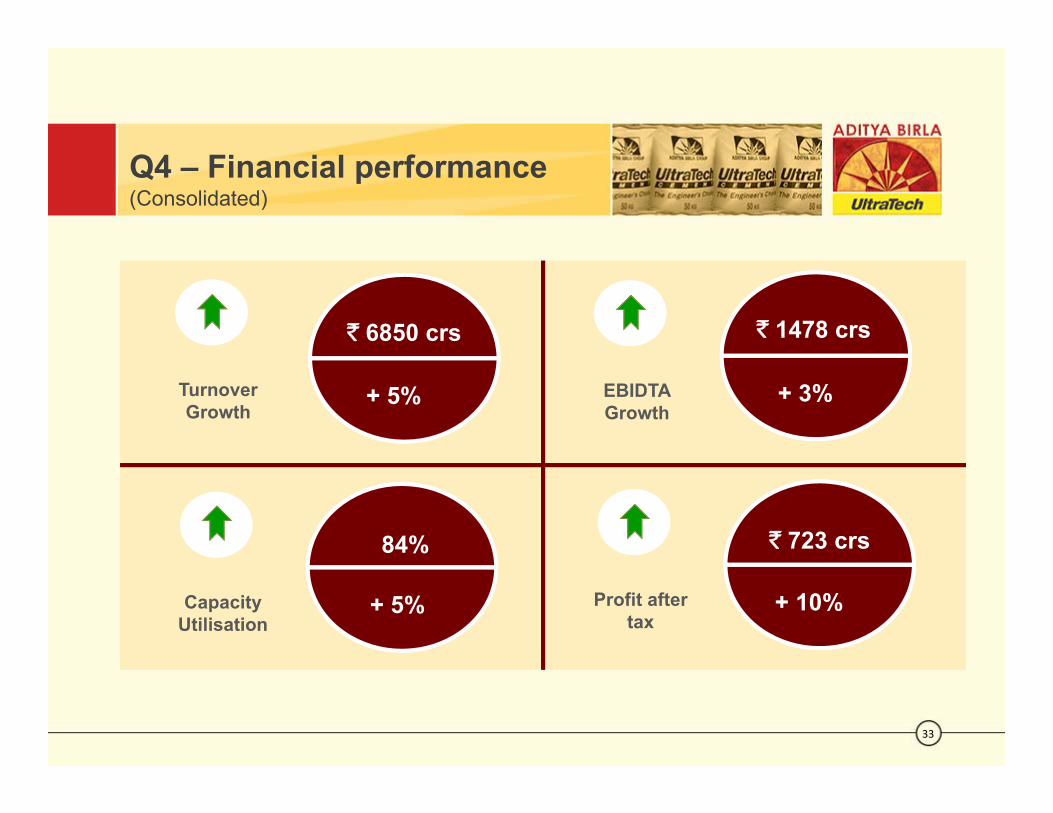
Q4 – Financial performance(Consolidated)
33
` 6850 crs
Turnover Growth
+ 5% EBIDTA Growth
` 1478 crs
+ 3%
CapacityUtilisation
84%
+ 5% Profit aftertax
` 723 crs
+ 10%

FY16 - Financial performance(Consolidated)
34
` 25281 crs
Turnover Growth + 5%
EBIDTAGrowth
` 5109 crs
+ 7%
` 2287 crs
PAT + 9%
Operating Margin
19%
+ 100 bps
` 83.33
+ 9%
` 9.5/share
+ 5%
Consolidated Net Debt reduced by ` 1569 crs
Net Debt: EBIDTA = 0.71 Net Debt/Equity = 0.17
EPS
Dividend
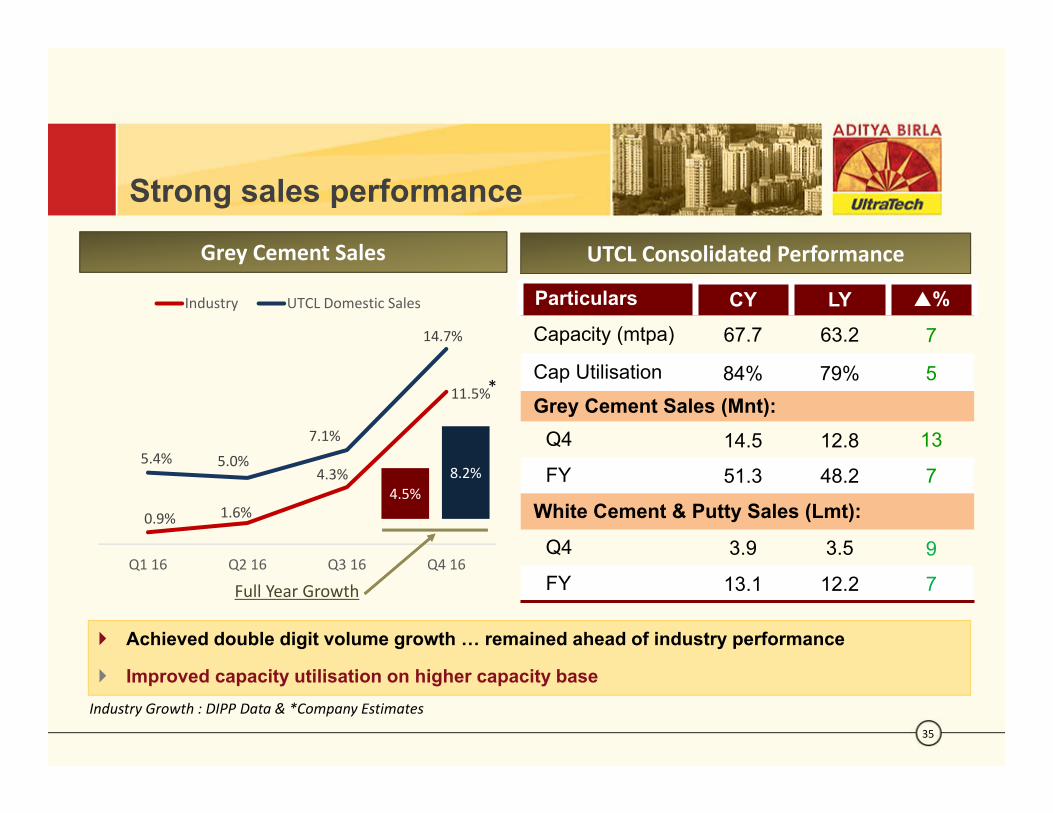
Achieved double digit volume growth … remained ahead of industry performance
Improved capacity utilisation on higher capacity base
35
Strong sales performance
Grey Cement Sales
Particulars CY LY %Capacity (mtpa) 67.7 63.2 7
Cap Utilisation 84% 79% 5Grey Cement Sales (Mnt):
Q4 14.5 12.8 13
FY 51.3 48.2 7
White Cement & Putty Sales (Lmt):
Q4 3.9 3.5 9
FY 13.1 12.2 7
UTCL Consolidated Performance
Industry Growth : DIPP Data & *Company Estimates
0.9% 1.6%
4.3%
11.5%
5.4% 5.0%
7.1%
14.7%
Q1 16 Q2 16 Q3 16 Q4 16
Industry UTCL Domestic Sales
*
4.5%8.2%
Full Year Growth

Operational Performance Operational Costs (Grey Cement)
36
Logistics cost marginally lower YoY : ` 1088/t
Advantage of lower fuel prices
Increase in rail freight arrested overall gain
3297
2956
Total Operational Costs incl. Logisitcs &Packing (Pmt)
Q415 Q416
10%
37%*
Further improvement in energy cost: 27% YoY
Coal/ petcoke prices continued to remain soft
Consistent improvement in efficiencies
23%*
YoY Marginal increase in Raw Materials Cost
Full impact of MMDR Act levy15%*
*% share in total operational costs including logistics.
Decline in overall costs partially negated impact of volatile cement prices

Logistics cost trends(Indian Operations)
37
YoY Logistics cost – declined marginally
Benefit of lower diesel prices (` 15/t)
Rail freight hike 2.7% in April’15 (` 10/t)
Marginal benefit from plant / market alignment
Road share in overall mix: 70% (LY - 68%)
QoQ cost remained range bound
Diesel prices started showing upward trend from Mar’16 …. Impacting road freightOct'14 Jan'15 Apr'15 Jul'15 Oct'15 Jan'16Mar'16
Diesel Prices Road Freight Rates
Road freight rates v/s Diesel prices trend
Note 1: Every 1% reduction in diesel price corresponds to 0.4% reduction in road freight
1095 1089
1078
10
Q4 15 Q3 16 Q4 16
Logistics Cost `/t
1088 Rail freight hike
Note 2: Above prices index trend is on base prices/rates of Oct’14
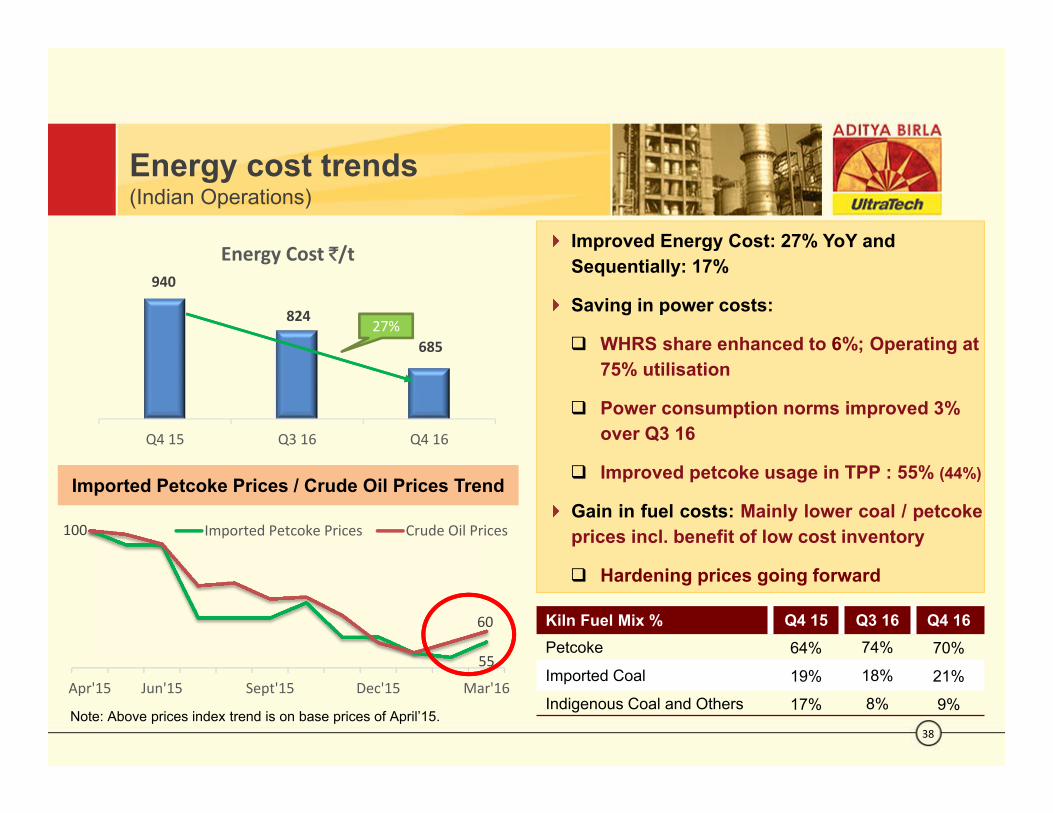
Energy cost trends(Indian Operations)
38
940
824
685
Q4 15 Q3 16 Q4 16
Energy Cost `/t
27%
Kiln Fuel Mix % Q4 15 Q3 16 Q4 16Petcoke 64% 74% 70%
Imported Coal 19% 18% 21%
Indigenous Coal and Others 17% 8% 9%
Improved Energy Cost: 27% YoY and Sequentially: 17%
Saving in power costs:
WHRS share enhanced to 6%; Operating at 75% utilisation
Power consumption norms improved 3% over Q3 16
Improved petcoke usage in TPP : 55% (44%)
Gain in fuel costs: Mainly lower coal / petcokeprices incl. benefit of low cost inventory
Hardening prices going forward
Imported Petcoke Prices / Crude Oil Prices Trend
100
55
60
Apr'15 Jun'15 Sept'15 Dec'15 Mar'16
Imported Petcoke Prices Crude Oil Prices
Note: Above prices index trend is on base prices of April’15.

Raw Materials cost trends(Indian Operations)
39
425438
420
18
28
28
Q4 15 Q3 16 Q4 16
Raw Materials Cost `/t Sequentially cost declined 4%
Softening prices of additives and Improved blending ratio
YoY marginal increase in costs:
Full impact of DMF levy under MMDR Act (` 11/t)
Benefit from lower additives prices
4%
DMF Levy
466449
443

Income statement(Standalone)
40
` crsQ4 Particulars Annual
CY LY % CY LY %13.20 11.51 15 Domestic Cement Sales Volume 46.93 43.37 86436 6133 5 Revenue 23841 22648 5
38 52 (27) Other Income 235 372 (37)1390 1362 2 EBIDTA 4851 4567 622% 22% - Margin (%) 20% 20% -111 150 26 Finance Costs 505 547 8349 288 (21) Depreciation 1289 1133 (14)930 924 1 PBT 3,057 2,886 6249 309 20 Tax Expenses 882 872 (1)681 615 11 PAT 2,175 2,015 824.8 22.4 11 EPS (`) 79.2 73.4 8
Q4 EBIDTA – marginally higher; benefit of higher sales volume and low costs set-off with weak cement prices
PAT improved 11% during Q4 and 8% for full year
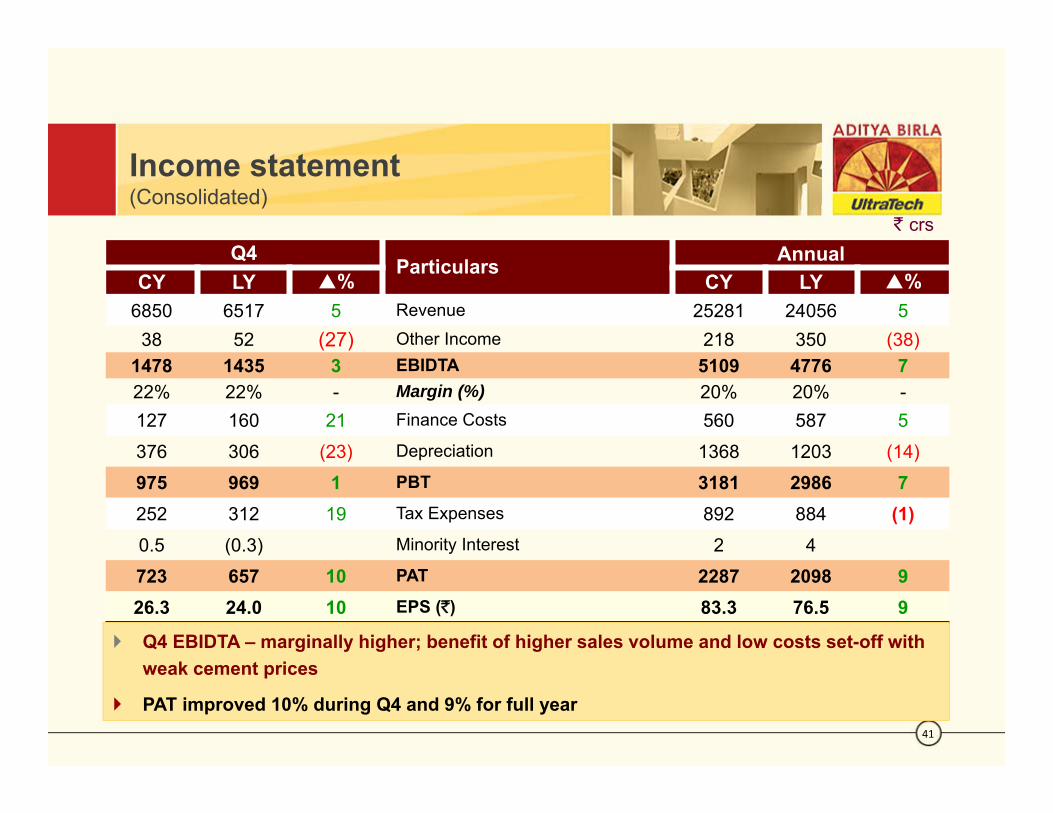
Income statement(Consolidated)
41
` crsQ4 Particulars Annual
CY LY % CY LY %6850 6517 5 Revenue 25281 24056 5
38 52 (27) Other Income 218 350 (38)1478 1435 3 EBIDTA 5109 4776 722% 22% - Margin (%) 20% 20% -127 160 21 Finance Costs 560 587 5376 306 (23) Depreciation 1368 1203 (14)975 969 1 PBT 3181 2986 7252 312 19 Tax Expenses 892 884 (1)0.5 (0.3) Minority Interest 2 4723 657 10 PAT 2287 2098 926.3 24.0 10 EPS (`) 83.3 76.5 9
Q4 EBIDTA – marginally higher; benefit of higher sales volume and low costs set-off with weak cement prices
PAT improved 10% during Q4 and 9% for full year

Financial Position
42
` crs
StandaloneParticulars
Consolidated31.03.16 31.03.15 31.03.16 31.03.1520736 18858 Shareholders Funds 21058 19041
- - Minority Interest 15 187661 7414 Loans (Incl. Current Maturities) 10027 98293227 2792 Deferred Tax Liabilities 3222 2786
31624 29064 Sources of Fund 34322 31674
24344 23632 Net Block (Incl. Capital Advances) 25964 25186- - Goodwill on Consolidation 1106 1053
Investments:6377 4479 Liquid Investments & Bank FD 6401 4634732 730 Long-term Investments 21 21172 223 Net Working Capital 830 780
31624 29064 Total Application of Funds 34322 31674
1284 2935 Net Debt 3626 5195
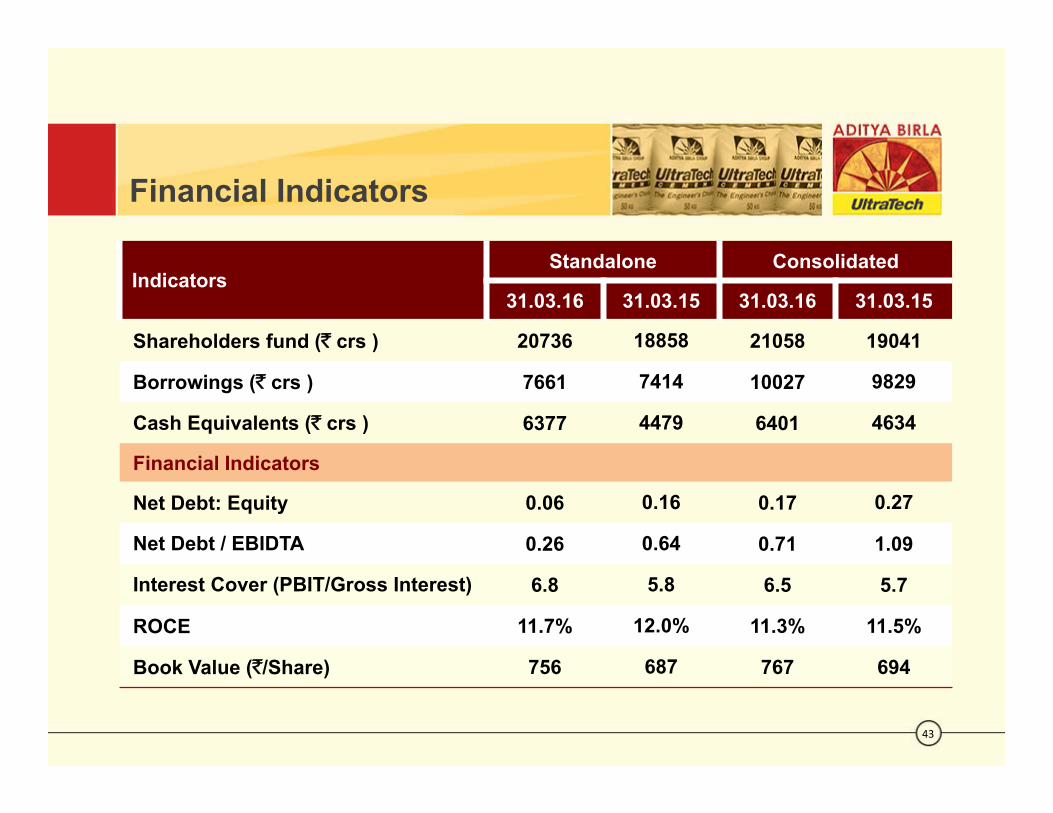
Financial Indicators
43
IndicatorsStandalone Consolidated
31.03.16 31.03.15 31.03.16 31.03.15
Shareholders fund (` crs ) 20736 18858 21058 19041
Borrowings (` crs ) 7661 7414 10027 9829
Cash Equivalents (` crs ) 6377 4479 6401 4634
Financial Indicators
Net Debt: Equity 0.06 0.16 0.17 0.27
Net Debt / EBIDTA 0.26 0.64 0.71 1.09
Interest Cover (PBIT/Gross Interest) 6.8 5.8 6.5 5.7
ROCE 11.7% 12.0% 11.3% 11.5%
Book Value (`/Share) 756 687 767 694

Cement production (Million tonnes)Clinker production (Million tonnes)
44
Key performance trends(Consolidated)
FY 12 FY 13 FY 14 FY 15 FY 16
33.69 34.17 34.01
38.31 39.75
FY 12 FY 13 FY 14 FY 15 FY 16
42.11 42.59 43.6046.71
50.57
4% 8%
Revenue (` Cr)
FY 12 FY 13 FY 14 FY 15 FY 16
1907721161 21443
2405625281
5%
FY 12 FY 13 FY 14 FY 15 FY 16
45655143
43584776
5109
7%EBIDTA (` Cr)

45
Grey Cement Costs trends(Standalone)
Raw Material Cost (`/Mt)
FY 12 FY 13 FY 14 FY 15 FY 16
348
399419
444464
Logistics Cost (`/Mt)
FY 12 FY 13 FY 14 FY 15 FY16
819
925976
1075 1099
Mix\ FY12 FY13 FY14 FY15 FY 16
Rail 36% 34% 34% 29% 28%
Road 61% 63% 62% 67% 69%Sea 3% 3% 3% 4% 3%
Increasing Government levies
Energy Cost (`/Mt)
FY 12 FY 13 FY 14 FY 15 FY16
1006 989951
979
824
Fuel Mix FY12 FY13 FY14 FY15 FY16Imported Coal 44% 35% 26% 26% 20%Petcoke 26% 38% 48% 52% 70%Ind. Coal & Others 30% 27% 26% 22% 10%
Comparative Cost Trend TPP / WHRS
FY 12 FY 13 FY 14 FY 15 FY16
TPP Rate WHRS Rate
Power Mix FY12 FY13 FY14 FY15 FY16
TPP 78% 79% 81% 82% 82%WHRS 0.4% 0.3% 0.3% 2% 5%Others 22% 21% 19% 16% 13%

a ULTRA READYWE ARE
ALL GEARED UP TO FACE THE FUTURE!
Statements in this “Presentation” describing the Company’s objectives, estimates, expectationsor predictions may be “forward looking statements” within the meaning of applicable securitieslaws and regulations. Actual results could differ materially from those expressed or implied.Important factors that could make a difference to the Company’s operations include global andIndian demand supply conditions, finished goods prices, feedstock availability and prices,cyclical demand and pricing in the Company’s principal markets, changes in Governmentregulations, tax regimes, economic developments within India and the countries within which theCompany conducts business and other factors such as litigation and labour negotiations. TheCompany assumes no responsibility to publicly amend, modify or revise any forward lookingstatement, on the basis of any subsequent development, information or events, or otherwise.
UltraTech Cement LimitedRegd. Office: 2nd Floor, ‘B’ Wing, Ahura Centre, MIDC, Andheri (E), Mumbai – 400 093
[Corporate Identity Number L26940MH2000PLC128420]91‐22 66917800 www.ultratechcement.com or www.adityabirla.com
Disclaimer
47

Historical Performance Trend
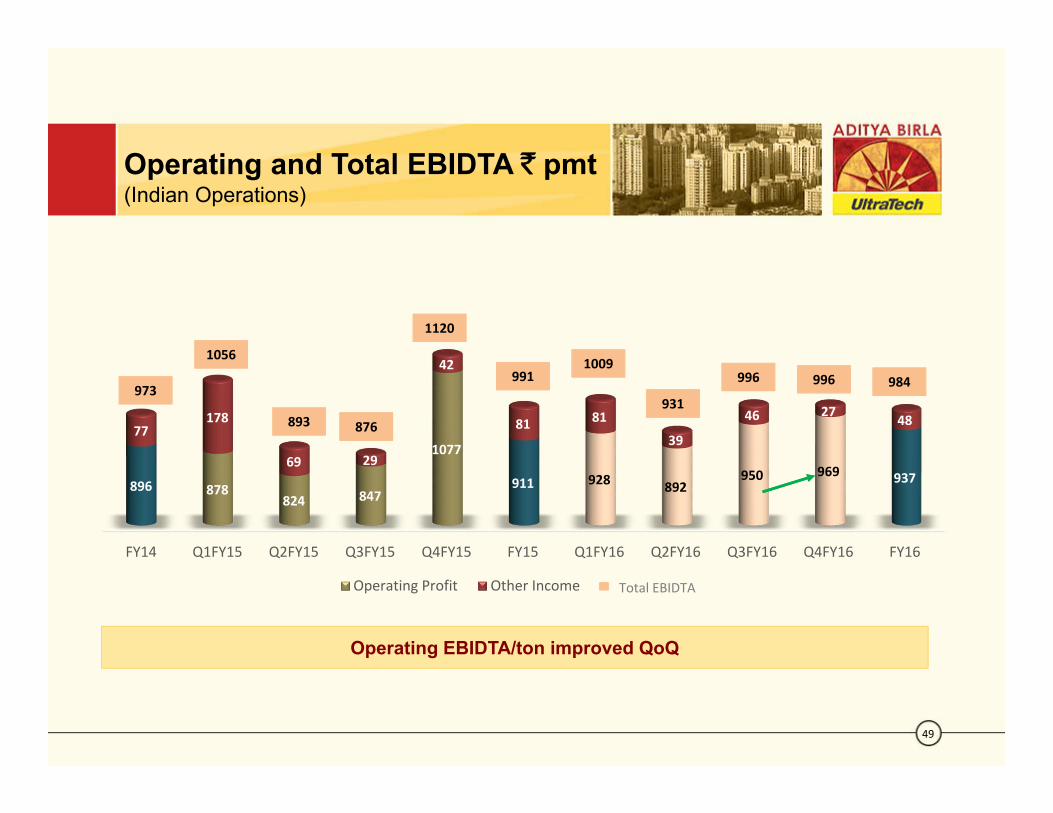
49
Operating and Total EBIDTA ` pmt(Indian Operations)
Operating EBIDTA/ton improved QoQ
FY14 Q1FY15 Q2FY15 Q3FY15 Q4FY15 FY15 Q1FY16 Q2FY16 Q3FY16 Q4FY16 FY16
896 878824 847
1077
911 928 892950 969 937
77178
69 29
42
81 81
39
46 27 48
Operating Profit Other Income Total EBIDTA
1056
973
893 876
1120
9911009
931
996 996 984

Quarterly Performance Trends(Standalone)
50
` Crs
Particulars Q4FY16 Q3FY16 Q2FY16 Q1FY16 Q4FY15 Q3FY15 Q2FY15 Q1FY15 Q4FY14 Q3FY14Total Sales Volume (MnT) 13.58 11.47 10.77 12.14 11.81 10.98 10.35 11.70 12.18 9.98
Net Sales 6436 5747 5621 6037 6133 5488 5379 5648 5832 4783
Operating Expenses 5083 4625 4632 4885 4823 4530 4502 4598 4561 3988
Operating Profit 1353 1122 989 1152 1310 957 877 1051 1271 796
Other Income 38 53 44 100 52 33 74 213 58 68
EBITDA 1390 1176 1033 1252 1362 990 951 1264 1329 864
EBITDA Margin 22% 20% 18% 21% 22% 18% 18% 22% 23% 18%
EBIDTA (`/mt) 996 996 931 1009 1120 876 893 1056 1062 841
Depreciation / Amortisation 349 324 333 283 288 278 302 265 278 264
EBIT 1041 852 700 969 1074 712 649 999 1050 599
Interest 111 126 130 138 150 154 143 100 74 90
Profit Before Tax 930 726 570 831 924 558 505 899 976 509
Tax Expenses 249 218 176 240 309 193 95 273 138 139
Net Earnings 681 509 394 591 615 364 410 626 838 370
Cash Earnings 1087 917 782 936 1125 719 702 975 1059 679

Quarterly Performance Trends(Standalone) …Contd.
51
` Crs
Particulars Mar’16 Dec’15 Sep’15 Jun’15 Mar’15 Dec’14 Sep’14 Jun’14 Mar’14 Dec’13
BALANCE SHEET
Net Fixed Assets incl. CWIP 24344 24315 24237 23969 23632 23265 22811 22384 18650 18277
Investments 7108 5002 4698 5212 5209 5151 4935 5138 5392 4983
Net Working Capital 172 296 788 59 223 678 632 (5) 551 600
Capital Employed 31624 29614 29723 29240 29064 29095 28377 27516 24593 23861
Shareholders Fund 20736 20364 19843 19453 18858 18531 18165 17742 17098 16547
Total Debt 7661 6110 6899 6842 7414 8084 7920 7641 5199 5131
Deferred Tax Liabilities 3227 3140 2981 2944 2792 2480 2292 2133 2296 2183
Capital Employed 31624 29614 29723 29240 29064 29095 28377 27516 24593 23861
RATIOS & STATISTICS
EPS (`/Share) 24.83 18.53 14.35 21.53 22.41 13.28 14.95 22.81 30.56 13.49
Book Value per share (`/Share) 756 742 723 709 687 675 662 647 623 603

Historical Performance Trends(Standalone)
52
Particulars FY16 FY15 FY14 FY13 FY12 FY11 FY10 FY09 FY08 FY07 FY06Total Sales Volume (MnT) 48.0 44.8 41.5 40.7 40.7 34.8 20.2 18.2 17.1 17.7 15.6
Net Sales 23841 22648 20078 20023 18158 13206 7050 6383 5509 4911 3299
Operating Expenses 19225 18452 16260 15347 14011 10540 5012 4618 3720 3461 2715
Operating Profit 4616 4195 3818 4675 4147 2666 2038 1765 1789 1449 584
Other Income 235 372 329 305 372 155 56 45 37 30 7
EBITDA 4851 4567 4147 4980 4519 2822 2094 1810 1827 1479 591
EBITDA Margin 20% 20% 21% 25% 25% 21% 30% 28% 33% 30% 18%
EBIDTA (`/mt) 984 992 973 1195 1085 796 1036 997 1068 837 380
Depreciation / Amortisation 1289 1133 1052 945 903 766 388 323 237 226 216
EBIT 3562 3434 3095 4035 3617 2056 1706 1487 1589 1253 375
Interest 505 547 319 210 224 273 118 126 82 87 90
Profit Before Tax 3057 2886 2776 3825 3393 1783 1588 1361 1507 1166 286
Tax Expenses 882 872 631 1170 947 379 495 384 499 384 56
Net Earnings 2175 2015 2144 2655 2446 1404 1093 977 1008 782 230
Cash Earnings 3723 3521 3269 3765 3356 2167 1589 1481 1228 992 441
` Crs

Historical Performance Trends(Standalone) …Contd.
53
Particulars Mar’16 Mar’15 Mar’14 Mar’13 Mar’12 Mar’11 Mar’10 Mar’09 Mar’08 Mar’07 Mar’06BALANCE SHEET
Net Fixed Assets incl. CWIP 24344 23632 18650 17415 14798 12506 5201 5313 4784 3214 2678
Investments 7108 5209 5392 5109 3789 3730 1670 1035 171 483 172Net Working Capital 172 223 551 25 164 305 173 119 25 205 216Capital Employed 31624 29064 24593 22549 18750 16541 7044 6467 4980 3903 3067Shareholders Fund 20736 18858 17098 15235 12860 10666 4609 3602 2697 1764 1038Total Debt 7661 7414 5199 5409 4153 4145 1605 2142 1741 1579 1452Net Debt 1284 2935 359 720 625 662 -12 1152 1594 1119 1304
Deferred Tax Liabilities 3227 2792 2296 1906 1738 1730 831 723 542 560 577
Capital Employed 31624 29064 24593 22549 18750 16541 7044 6467 4980 3903 3067RATIOS & STATISTICSROCE (PBIT/Avg. CE) 12% 12% 13% 20% 20% 16% 25% 26% 36% 36% 12%
Net Debt: Equity (Times) 0.06 0.16 0.02 0.05 0.05 0.06 0.00 0.32 0.59 0.63 1.26
Net Debt /EBIDTA (Times) 0.26 0.64 0.09 0.14 0.14 0.19 -0.01 0.64 0.88 0.76 2.21
Return on Equity 11% 11% 13% 17% 19% 13% 24% 27% 37% 44% 22%
Dividend Payout on Net Profit 14.4% 14.8% 13.5% 10.9% 10.4% 13.6% 8.0% 7.5% 7.2% 7.3% 10.8%
EPS (`/Share) 79.25 73.44 78.21 96.87 89.26 62.74 87.82 78.48 80.94 62.84 18.46
Book Value per share (`/Share) 756 687 623 556 469 389 370 289 217 142 83
` Crs

5454
Quarterly Performance Trends(Consolidated)
` Crs
Particulars Q4FY16 Q3FY16 Q2FY16 Q1FY16 Q4FY15 Q3FY15 Q2FY15 Q1FY15 Q4FY14 Q3FY14Total Sales Volume (MnT) 14.5 12.4 11.5 13.0 12.8 11.8 11.2 12.4 13.0 10.8Net Sales 6850 6108 5951 6371 6517 5832 5721 5987 6186 5137
Operating Expenses 5411 4916 4893 5170 5134 4808 4782 4906 4858 4277
Operating Profit 1440 1192 1058 1201 1382 1024 938 1081 1328 860
Other Income 38 53 45 82 52 34 49 215 61 69
EBITDA 1478 1245 1103 1282 1435 1058 987 1296 1389 928
EBITDA Margin 22% 20% 19% 20% 22% 18% 17% 22% 22% 18%
Depreciation / Amortisation 376 339 352 301 306 296 319 282 301 287
EBIT 1101 906 752 981 1129 762 668 1014 1088 642
Interest 127 139 146 148 160 164 153 110 85 100
Profit Before Tax 975 767 606 833 969 598 515 904 1002 542
Tax Expenses 252 220 179 242 312 196 99 276 140 143
Net Earnings 723 547 427 591 657 401 416 628 862 399
Minority Interest 0.5 1.1 0.2 -0.2 -0.3 1.3 1.6 1.2 -2.9 4.0Net Earnings after MinorityInterest 723 546 427 591 657 400 414 627 865 395
Cash Earnings 1156 971 834 955 1185 774 725 995 1105 731
55
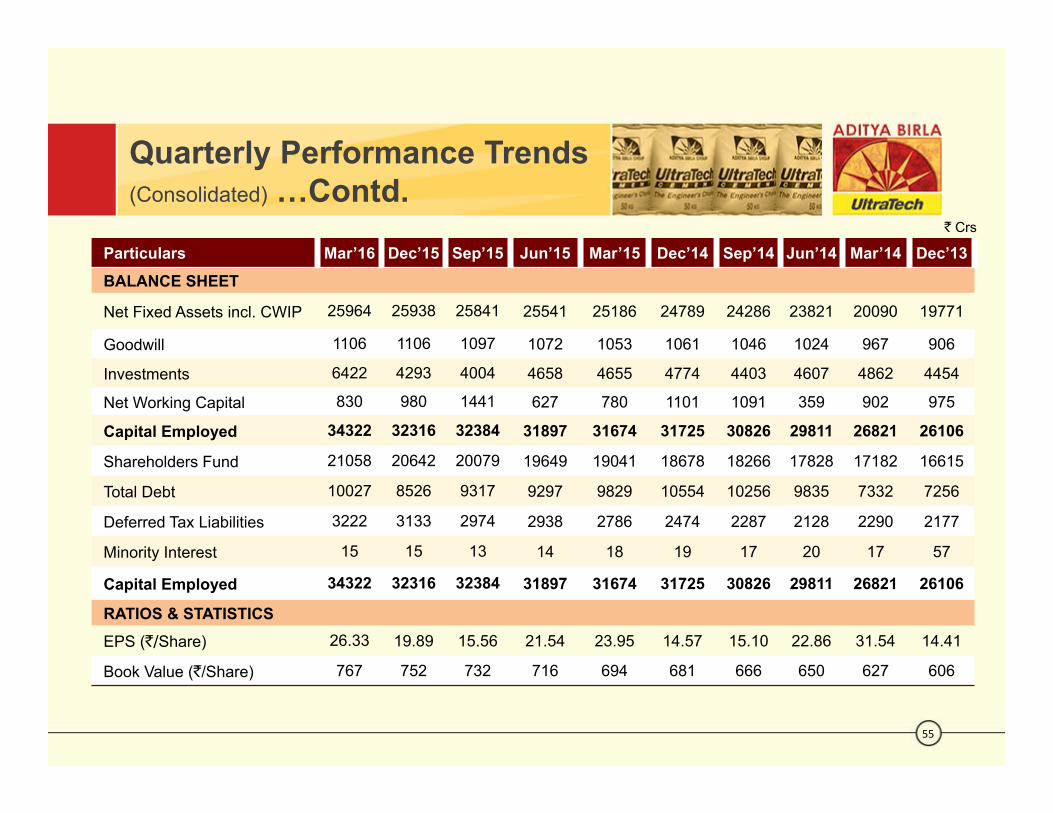
Quarterly Performance Trends(Consolidated) …Contd.
` Crs
Particulars Mar’16 Dec’15 Sep’15 Jun’15 Mar’15 Dec’14 Sep’14 Jun’14 Mar’14 Dec’13BALANCE SHEET
Net Fixed Assets incl. CWIP 25964 25938 25841 25541 25186 24789 24286 23821 20090 19771
Goodwill 1106 1106 1097 1072 1053 1061 1046 1024 967 906
Investments 6422 4293 4004 4658 4655 4774 4403 4607 4862 4454
Net Working Capital 830 980 1441 627 780 1101 1091 359 902 975
Capital Employed 34322 32316 32384 31897 31674 31725 30826 29811 26821 26106
Shareholders Fund 21058 20642 20079 19649 19041 18678 18266 17828 17182 16615
Total Debt 10027 8526 9317 9297 9829 10554 10256 9835 7332 7256
Deferred Tax Liabilities 3222 3133 2974 2938 2786 2474 2287 2128 2290 2177
Minority Interest 15 15 13 14 18 19 17 20 17 57
Capital Employed 34322 32316 32384 31897 31674 31725 30826 29811 26821 26106
RATIOS & STATISTICSEPS (`/Share) 26.33 19.89 15.56 21.54 23.95 14.57 15.10 22.86 31.54 14.41
Book Value (`/Share) 767 752 732 716 694 681 666 650 627 606

Historical Performance Trends(Consolidated)
56
` Crs
Particulars FY16 FY15 FY14 FY13 FY12 FY11 FY10 FY09 FY08 FY07Total Sales Volume (MnT) 51.3 48.2 44.7 43.6 44.0 36.9 20.3 18.5 17.3 17.7Net Sales 25281 24056 21443 21161 19077 13687 7175 6564 5623 4968
Operating Expenses 20390 19630 17408 16322 14884 10992 5124 4786 3822 3505
Operating Profit 4891 4425 4035 4839 4194 2696 2051 1778 1801 1464
Other Income 218 350 322 304 371 154 55 41 36 27
EBITDA 5109 4776 4358 5143 4565 2850 2107 1819 1837 1491
EBITDA Margin 20% 20% 20% 24% 24% 21% 29% 28% 33% 30%
Depreciation / Amortisation 1368 1203 1139 1023 963 813 391 326 240 229
EBIT 3741 3572 3219 4120 3602 2037 1715 1493 1598 1262
Interest 560 587 361 252 256 292 118 126 82 87
Profit Before Tax 3181 2986 2858 3867 3345 1745 1598 1368 1515 1175
Tax Expenses 892 884 645 1179 948 384 501 388 504 389
Net Earnings 2288 2102 2213 2688 2397 1361 1097 980 1012 787
Minority Interest 2 4 7 10 -6 -6 2 2 1 2Net Earnings after MinorityInterest 2287 2098 2206 2678 2403 1367 1095 978 1010 785
Cash Earnings 3915 3678 3424 3869 3370 2172 1595 1485 1234 998

Historical Performance Trends(Consolidated) …Contd.
57
` CrsParticulars Mar’16 Mar’15 Mar’14 Mar’13 Mar’12 Mar’11 Mar’10 Mar’09 Mar’08 Mar’07BALANCE SHEETNet Fixed Assets incl. CWIP 25964 25186 20090 18733 15999 13505 5218 5334 4801 3234Goodwill 1106 1053 967 734 544 471 6 6 8 9Investments 6422 4655 4862 4709 3547 3514 1637 1009 147 459Net Working Capital 830 780 902 376 420 493 208 139 39 212Capital Employed 34322 31674 26821 24551 20511 17983 7070 6489 4994 3914Shareholders Fund 21058 19041 17182 15230 12824 10647 4620 3611 2703 1768Total Debt 10027 9829 7332 7342 5891 5541 1607 2143 1741 1579Net Debt 3626 5195 2491 2654 2353 2047 -10 1153 1614 1119
Deferred Tax Liabilities 3222 2786 2290 1901 1734 1730 836 728 545 562Minority Interest 15 18 17 78 62 66 8 7 6 5Capital Employed 34322 31674 26821 24551 20511 17983 7070 6489 4994 3914RATIOS & STATISTICSROCE (PBIT/Avg. CE) 11% 11% 13% 18% 19% 15% 25% 26% 36% 36%
Net Debt: Equity 0.17 0.27 0.14 0.17 0.18 0.19 0.00 0.32 0.60 0.63
Net Debt /EBIDTA 0.71 1.09 0.57 0.52 0.52 0.59 0.00 0.63 0.88 0.75
Return on Equity 11% 11% 13% 18% 19% 13% 24% 27% 37% 44%
EPS (`/Share) 83.33 76.48 80.45 97.69 87.69 61.39 87.98 78.57 81.14 63.05
Book Value (`/Share) 767 694 627 555 468 389 371 290 217 142
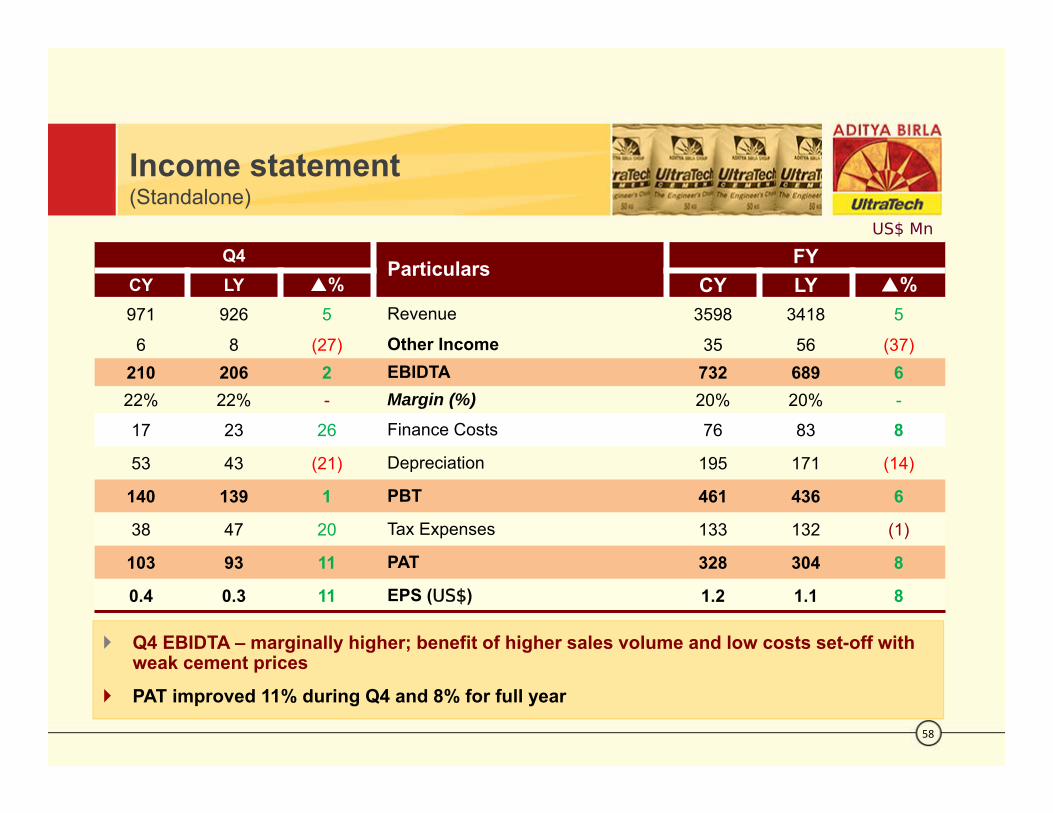
Income statement(Standalone)
58
US$ Mn
Q4 Particulars FYCY LY % CY LY %971 926 5 Revenue 3598 3418 5
6 8 (27) Other Income 35 56 (37)210 206 2 EBIDTA 732 689 622% 22% - Margin (%) 20% 20% -
17 23 26 Finance Costs 76 83 8
53 43 (21) Depreciation 195 171 (14)
140 139 1 PBT 461 436 6
38 47 20 Tax Expenses 133 132 (1)
103 93 11 PAT 328 304 8
0.4 0.3 11 EPS (US$) 1.2 1.1 8
Q4 EBIDTA – marginally higher; benefit of higher sales volume and low costs set-off with weak cement prices
PAT improved 11% during Q4 and 8% for full year
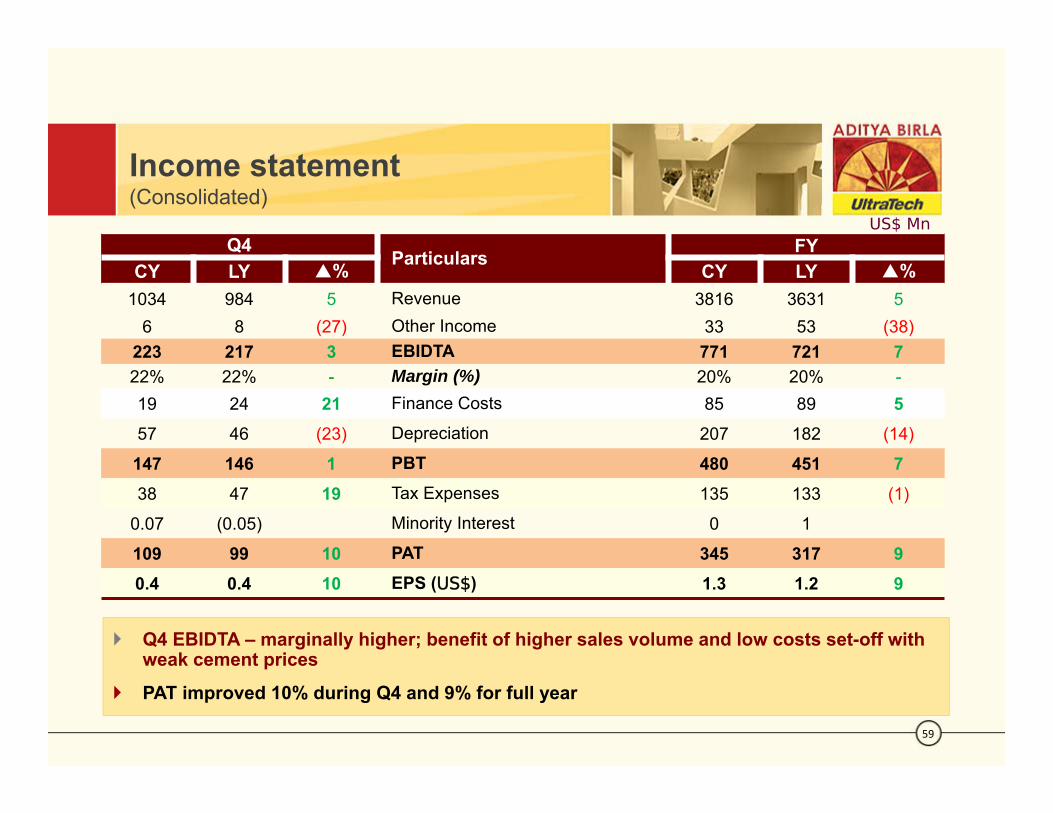
Income statement(Consolidated)
59
US$ MnQ4 Particulars FY
CY LY % CY LY %1034 984 5 Revenue 3816 3631 5
6 8 (27) Other Income 33 53 (38)223 217 3 EBIDTA 771 721 722% 22% - Margin (%) 20% 20% -19 24 21 Finance Costs 85 89 557 46 (23) Depreciation 207 182 (14)
147 146 1 PBT 480 451 738 47 19 Tax Expenses 135 133 (1)
0.07 (0.05) Minority Interest 0 1
109 99 10 PAT 345 317 90.4 0.4 10 EPS (US$) 1.3 1.2 9
Q4 EBIDTA – marginally higher; benefit of higher sales volume and low costs set-off with weak cement prices
PAT improved 10% during Q4 and 9% for full year

Financial Position
60
US$ Mn
194 443 Net Debt 547 784
StandaloneParticulars
Consolidated
31.03.16 31.03.15 31.03.16 31.03.153130 2846 Shareholders Funds 3178 2874
- - Minority Interest 2 31156 1119 Loans (Incl. Current Maturities) 1513 1484487 421 Deferred Tax Liabilities 486 420
4773 4387 Sources of Fund 5180 4781
3674 3567 Net Block (Incl. Capital Advances) 3919 3801- - Goodwill on Consolidation 167 159
Investments:962 676 Liquid Investments 966 699110 110 Long-term Investments 3 326 34 Net Working Capital 125 118
4773 4387 Total Application of Funds 5180 4781

Historical Performance Trends(Standalone)
61
Particulars FY16 FY15 FY14 FY13 FY12 FY11 FY10 FY09 FY08 FY07 FY06Total Sales Volume (MnT) 48.0 44.8 41.5 40.7 40.7 34.8 20.2 18.2 17.1 17.7 15.6
Net Sales 3599 3418 3031 3022 2741 1993 1064 963 832 741 498
Operating Expenses 2902 2785 2454 2317 2115 1591 757 697 562 522 410
Operating Profit 697 633 576 706 626 402 308 266 270 219 88
Other Income 35 56 50 46 56 23 8 7 6 5 1
EBITDA 732 689 626 752 682 426 316 273 276 223 89
EBITDA Margin 20% 20% 21% 25% 25% 21% 30% 28% 33% 30% 18%
EBIDTA (US$/mt) 149 150 147 180 164 120 156 150 161 126 57
Depreciation / Amortisation 195 171 159 143 136 116 59 49 36 34 33
EBIT 538 518 467 609 546 310 258 224 240 189 57
Interest 76 83 48 32 34 41 18 19 12 13 14
Profit Before Tax 461 436 419 577 512 269 240 205 227 176 43
Tax Expenses 133 132 95 177 143 57 75 58 75 58 8
Net Earnings 328 304 324 401 369 212 165 147 152 118 35
Cash Earnings 562 531 493 568 507 327 240 224 185 150 67
US$ Mn

Historical Performance Trends(Standalone) …Contd.
62
Particulars Mar’16 Mar’15 Mar’14 Mar’13 Mar’12 Mar’11 Mar’10 Mar’09 Mar’08 Mar’07 Mar’06BALANCE SHEET
Net Fixed Assets incl. CWIP 3675 3567 2815 2629 2234 1888 785 802 722 485 404
Investments 1073 786 814 771 572 563 252 156 26 73 26Net Working Capital 26 34 83 4 25 46 26 18 4 31 33
Capital Employed 4773 4387 3712 3404 2830 2497 1063 976 752 589 463Shareholders Fund 3130 2846 2581 2300 1941 1610 696 544 407 266 157
Total Debt 1156 1119 785 816 627 626 242 323 263 238 219Net Debt 194 443 54 109 94 100 -2 174 241 169 197
Deferred Tax Liabilities 487 421 347 288 262 261 125 109 82 85 87
Capital Employed 4773 4387 3712 3404 2830 2497 1063 976 752 589 463
RATIOS & STATISTICS
ROCE (PBIT/Avg. CE) 12% 12% 13% 20% 20% 16% 25% 26% 36% 36% 12%
Net Debt: Equity 0.06 0.16 0.02 0.05 0.05 0.06 0.00 0.32 0.59 0.63 1.26
Net Debt /EBIDTA 0.26 0.64 0.09 0.14 0.14 0.19 -0.01 0.64 0.88 0.76 2.21
Return on Equity 11% 11% 13% 17% 19% 13% 24% 27% 37% 44% 22%
Dividend Payout on Net Profit 14.4% 14.80% 13.50% 10.90% 10.40% 13.60% 8.00% 7.50% 7.20% 7.30% 10.80%
EPS ($/Share) 1.2 1.1 1.2 1.5 1.4 1.0 1.3 1.2 1.2 1.0 0.3
Book Value ($/Share) 11.4 10.4 9.4 8.4 7.1 5.9 5.6 4.4 3.3 2.2 1.3
US$ Mn
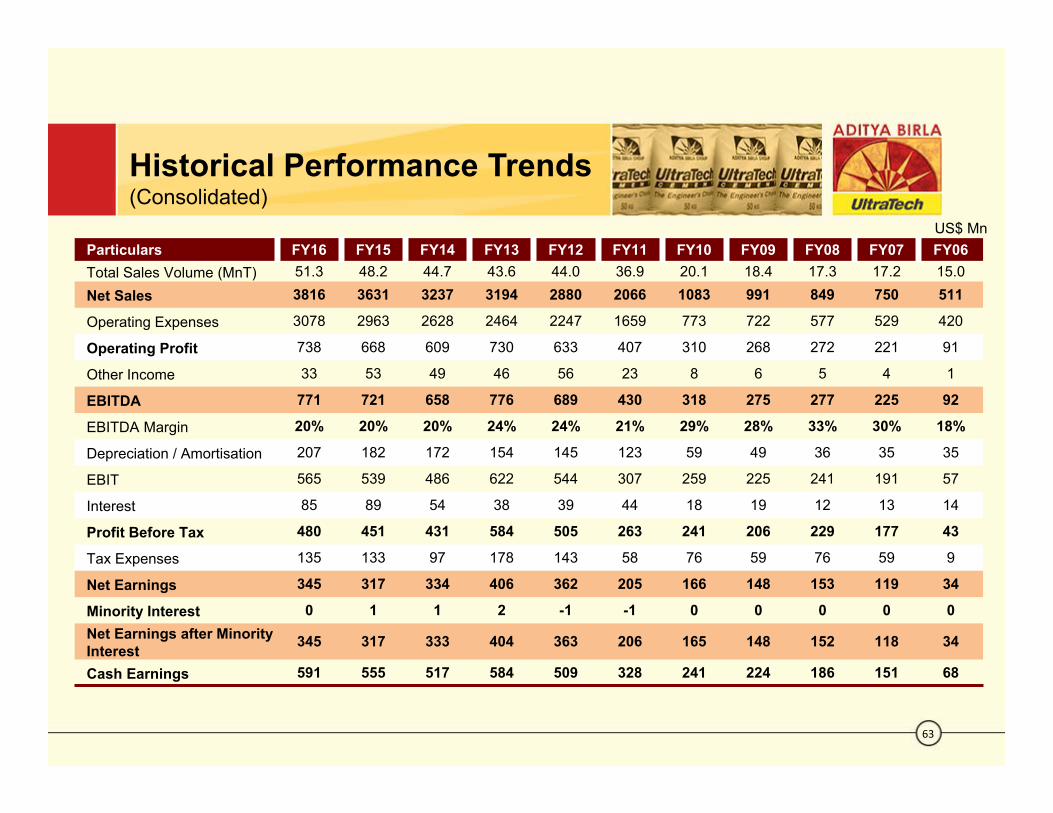
Historical Performance Trends(Consolidated)
63
Particulars FY16 FY15 FY14 FY13 FY12 FY11 FY10 FY09 FY08 FY07 FY06Total Sales Volume (MnT) 51.3 48.2 44.7 43.6 44.0 36.9 20.1 18.4 17.3 17.2 15.0Net Sales 3816 3631 3237 3194 2880 2066 1083 991 849 750 511
Operating Expenses 3078 2963 2628 2464 2247 1659 773 722 577 529 420
Operating Profit 738 668 609 730 633 407 310 268 272 221 91
Other Income 33 53 49 46 56 23 8 6 5 4 1
EBITDA 771 721 658 776 689 430 318 275 277 225 92
EBITDA Margin 20% 20% 20% 24% 24% 21% 29% 28% 33% 30% 18%
Depreciation / Amortisation 207 182 172 154 145 123 59 49 36 35 35
EBIT 565 539 486 622 544 307 259 225 241 191 57
Interest 85 89 54 38 39 44 18 19 12 13 14
Profit Before Tax 480 451 431 584 505 263 241 206 229 177 43
Tax Expenses 135 133 97 178 143 58 76 59 76 59 9
Net Earnings 345 317 334 406 362 205 166 148 153 119 34
Minority Interest 0 1 1 2 -1 -1 0 0 0 0 0Net Earnings after MinorityInterest 345 317 333 404 363 206 165 148 152 118 34
Cash Earnings 591 555 517 584 509 328 241 224 186 151 68
US$ Mn

Historical Performance Trends(Consolidated) …Contd.
64
Particulars Mar’16 Mar’15 Mar’14 Mar’13 Mar’12 Mar’11 Mar’10 Mar’09 Mar’08 Mar’07 Mar’06BALANCE SHEETNet Fixed Assets incl. CWIP 3919 3802 3032 2828 2415 2039 788 805 725 488 408
Goodwill 167 159 146 111 82 71 1 1 1 1 2Investments 969 703 734 711 535 530 247 152 22 69 22Net Working Capital 125 118 136 57 63 74 31 21 6 32 33Capital Employed 5181 4781 4048 3706 3096 2714 1067 979 754 591 464Shareholders Fund 3179 2874 2593 2299 1936 1607 697 545 408 267 157Total Debt 1514 1484 1107 1108 889 836 243 323 263 238 219Net Debt 547 784 376 401 355 309 -1 174 244 169 197Deferred Tax Liabilities 486 421 346 287 262 261 126 110 82 85 87Minority Interest 2 3 3 12 9 10 1 1 1 1 1
Capital Employed 5181 4781 4048 3706 3096 2714 1067 979 754 591 464RATIOS & STATISTICSROCE (PBIT/Avg. CE) 11% 11% 13% 18% 19% 15% 25% 26% 36% 36% 12%
Net Debt: Equity 0.17 0.27 0.14 0.17 0.18 0.19 0.00 0.32 0.60 0.63 1.39
Net Debt /EBIDTA 0.71 1.09 0.57 0.52 0.52 0.59 0.00 0.63 0.88 0.75 2.15
Return on Equity 0.11 0.11 0.13 0.18 0.19 0.13 0.24 0.27 0.37 0.44 0.22
EPS ($/Share) 1.3 1.2 1.2 1.5 1.3 0.9 1.3 1.2 1.2 1.0 0.3
Book Value ($/Share) 11.6 10.5 9.5 8.4 7.1 5.9 5.6 4.4 3.3 2.1 1.3
US$ Mn