india’s international trade of cotton in the recent past
TRANSCRIPT

India’s International Trade of Cotton in the Recent Past – Some
Insights
Preface
The study uses trade indicators to analyze merchandise export and import data in a way that should be
useful for the purpose of formulation of policy. The indicators provide a glimpse of the trade patterns of
the world and the performance of India in comparison to various other countries. They have been used
in the case of India’s exports of cotton, to indicate the possible directions policy may take. This study
focuses on cotton, because India is one of the largest growers of this commodity and has very high export
potential, to generate substantial revenue earnings. Therefore, it is important to investigate the prospects
of expansion of trade and of increasing the gains achieved from trade for cotton.
The data used in this study has been sourced from the United Nations Comtrade Database, the Cotton
Corporation of India, Export Import Data Bank, Department of Commerce and the FAOSTAT database.
Computations are primarily based on data at the ITC-HS two-digit level (HS-52) and the latest finalized
data available on the UN Comtrade Database up to year 2019. In several cases, trends from 2015 to 2019
have been shown.
The layout of the study is as follows:
Section 1: An introduction of the Commodity Cotton
Section 2: An overview of the cotton industry in India and some important institutions
Section 3: Socio-Economic Scenario of Cotton Industry Production in India
Section 4: An overview of agricultural production value of cotton in India as well as its trends in Area,
Production and Consumption.
Section 5: International Trends in the imports and exports of the Cotton (HS-52) worldwide
Section 6: Deals with India’s Export Intensity of the commodity with respect to various countries.
Countries where market-specific policies can be implemented to boost exports are identified and the
complete list is presented in Appendix A.
Section 7: Analysis using the Revealed Comparative Advantage and the Revealed Comparative Import
Inclinations indices.
Section 8: Using the Competitiveness Index, this section discusses the dominating patterns of the major
exporters of cotton in the international markets as well as Intra-Industry Trade Values between India and
major cotton traders.
Section 9: Discusses India’s export of the cotton to the ASEAN, the BRICS, and the EU.
Section 10: Provides relevant data for India’s export of cotton and YoY changes, country wise at the
ITC-HS 2-digit level.
Section 11: Summary.
Appendix A: List of countries deserving market-specific export promotion policies.
Appendix B: The formulae of the trade indicators used.

Section 1: Introduction
Cotton is a soft, fluffy staple fiber that grows in a boll, or protective case, around the seeds of the cotton
plants of the genus Gossypium in the mallow family Malvaceae. The fiber is almost pure cellulose. The
plant is a shrub native to tropical and subtropical regions around the world, including the Americas, Africa,
Egypt and India. The fiber is most often spun into yarn or thread and used to make a soft, breathable textile.
Although cultivated since time immemorial, it was the invention of the cotton gin that lowered the cost of
production that led to its widespread use, dissemination and it is the most widely used natural fiber cloth
in clothing today.
Current estimates for world production are about 25 million tonnes or 110 million bales annually,
accounting for 2.5% of the world's arable land. In the United States, cotton is usually measured in bales,
which measure approximately 0.48 cubic meters (17 cubic feet) and weigh 226.8 kilograms (500 pounds).
Section 2: Cotton Industry in India and some important institutions
In India, cotton is one of the most important cash crops and accounts for around 25% of the total global
fiber production. In the raw material consumption basket of the Indian textile industry, the proportion of
cotton is around 60%. The consumption of cotton is more than 300 lakh bales (170 kg each) per year.
India occupies first position in the world in cotton acreage with around 125.84 lakh hectares under cotton
cultivation which is around 36% of the world area. Approximately 62% of India’s Cotton is produced on
rain-fed areas and 38% on irrigated lands. During 2019-20, India’s productivity was 486.33 kg/ha. India
has emerged one of the largest producers, consumers and exporters of cotton in the world.
Cotton is one of the principal crops of India and is the major raw material for domestic textile industry.
It provides sustenance to millions of farmers as also the workers involved in cotton industry, right from
processing to trading of cotton. In the raw material consumption of the textile industry in India, the ratio
of the use of the cotton to man-made fibres and filament yarn is 59:41.
The ‘Cotton Advisory Board’ (CAB) is a representative body of Government agencies, growers, industry
& trade. It advises the Government generally on matters pertaining to production, consumption and
marketing of cotton, and also provides a forum for liaison among the cotton textile mill industry, the
cotton growers, the cotton trade and the government. The tenure of the CAB is two years. Present CAB
and Consultative Committee of CAB were constituted Vide Resolution dated 28.1.2015 under the
Chairpersonship of Textile Commissioner w.e.f. 1.1.2015 for a period of two years, which has been
further extended till the re-constitution of new Board vide Order dated 25.04.2017.The Cotton Advisory
Board draws up the Cotton Balance Sheet. The Board operates on a two tier mechanism i.e., through a
Consultative Committee which seeks inputs from the cotton growers, cotton trade and cotton mills. The
Consultative Committee meets prior to the formal meeting of the Cotton Advisory Board. The inputs of
the Consultative Committee recommendations are considered by the CAB.
The Cotton Corporation of India (CCI) was set up in 1970 by the Government of India, as an only Public
Sector Organization in the field of cotton marketing. Ever-since its inception, the Corporation has been
operating in competition with private cotton traders and other institutional buyers, its market share
varying from 5% to 8% except in some years under MSP operations when it has gone up to 31%.With
the changing cotton scenario, the role and functions of the Corporation were reviewed and revised from
time to time. As per the 20 policy directives announced Ministry of Textiles in 1985, the CCI is the sole
agency of the Government for undertaking Minimum Support Price (MSP) Operations, whenever the
prices of Kapas (seed cotton) fall below the MSP level. Besides MSP operations, to fulfill the raw

material requirement of the domestic textile industry, particularly during lean season, the Corporation
undertakes commercial purchase operations at its own risk. Broad objectives of the Corporation are as
under:-
To undertake price support operations, whenever the market prices of kapas falls below the
minimum support prices (MSP) announced by Govt. of India, without any quantitative limit.
To undertake commercial operations only at CCI’s own risk
Section 3: Socio-Economic Scenario
Cotton industry in India plays a major role in sustaining the livelihood of an estimated 5.8 million cotton
farmers and 40- 50 million people engaged in related activities such as cotton processing and trade. To
support the cotton industry, Government of India announces Minimum Support Price (MSP) for two basic
staples groups viz., medium staple and long staple cotton. Cotton Corporation of India (CCI), a Public
Sector Undertaking under the Ministry of Textiles, is the nodal agency of Government of India for
undertaking MSP operations in the event of prevailing seed cotton (kapas) price touching the MSP level.
The procurement of kapas by CCI during the cotton year 2018-19 under MSP was 10.70 lakh bales.
In this report, we will see various analyses and aspects of India’s export trade of Cotton. However, before
that, we need to understand the classification of data structures available for international comparison and
analysis. According to the ITC HS system, the code 52 is assigned to indicate the trade of “Cotton” in
India. We work with the ITC-HS two-digit level code (HS-52) and the latest finalized data available on
the UN Comtrade Database up to year 2019. Table 1 outlines the relevant categories along with their
description. Henceforth, we will use mostly the 2-digit code for our analysis.
Table 1: ITCHS Classification of Cotton
ITC HS Code
Name/Description
52 Cotton
5201 Cotton, not carded or combed
5202 Cotton waste, including yarn waste and garnetted stock
5203 Cotton, carded, combed
5204 Cotton sewing thread
5205 Cotton yarn not sewing thread >85% cotton, not retail
5206 Cotton yarn (except sewing) < 85% cotton, not retail
5207 Cotton yarn (except sewing thread) retail
5208 Woven cotton fabric, >85% cotton, < 200g/m2
5209 Woven cotton nes, >85% cotton, >200g/m2
5210 Woven cotton, <85% cotton with manmade fibre,<200g/m2
5211 Woven fabric, <85% cotton with manmade fibre,>200g/m2
5212 Woven cotton fabric, nes

Section 4: Trends in Production and Consumption of Cotton
Table 2 shows the largest producers of Cotton Lint (quantity in tonnes) in the world for the years 2014
to 2018 wherein China, China-mainland, India, USA and Pakistan are ranked in descending order of
magnitude.
Table 2: Countries with largest Gross Production of Cotton Lint (Quantity in tonnes) from 2014-2018
Country
2014 2015 2016 2017 2018 Grand
Total
Share in
Production(%)
China 6178318 5610000 5343000 5653000 6102800 28887118 19.21
China,
mainland
6178318 5610000 5343000 5653000 6102800
28887118 19.21
India 5916850 5100850 5542000 5576850 4767140 26903690 17.90
United States
of America
3553130 2806030 3738310 4555340 4003950
18656760 12.41
Pakistan 2374481 1686922 1815038 2031909 1677287 9585637 6.38
Brazil 1412227 1626716 1420282 1498720 1932889 7890834 5.25
Uzbekistan 1106700 1109000 976500 941800 756700 4890700 3.25
Turkey 846000 738000 756000 882000 976600 4198600 2.79
Australia 886858 421564 550895 774488 950395 3584200 2.38
Greece 308000 307000 278000 304000 314000 1511000 1.01
Others 3269287 2908522 2922455 3073033 3169923 15343220 10.21
Total 32030169 27924604 28685480 30944140 30754484 150338877 100
Source: Computed from FAOSTAT database
Table 3: Countries with largest Gross Production of Cotton Seed (Quantity in tonnes) from 2014-2018
Country
2014 2015 2016 2017 2018
Grand
Total
Share in
Production
(%)
India 12017000 10363000 11250000 11848000 9889000 55367000 20.60
China 12320000 11220000 10686000 9900000 10100000 54226000 20.18
China,
mainland
12320000 11220000 10686000 9900000 10100000
54226000 20.18
United States
of America
4649320 3667750 4870670 5825940 5108360
24122040 8.98
Pakistan 4442697 3184816 3422124 3823116 3151152 18023905 6.71
Brazil 2669161 2524615 2182385 2421009 3122359 12919529 4.81
Uzbekistan 1870000 1850000 1800000 1595000 1300000 8415000 3.13
Turkey 1391200 1213600 1260000 1470000 1542000 6876800 2.56
Australia 1251600 746000 889590 1260000 1496792 5643982 2.10
Greece 470000 408800 370000 405000 843700 2497500 0.93
Others 5466550 4789535 4860493 5535857 5795101 26447536 9.84
Total 58867528 51188116 52277262 53983922 52448464 268765292 100
Source: Computed from FAOSTAT database
Table 3 above shows the largest producers of Cotton Seed (quantity in tonnes) in the world for the years
2014 to 2018 wherein India, China, China-mainland, USA and Pakistan are ranked in descending order
of magnitude.

In India, cotton is cultivated in three diverse agro-ecological zones, Northern zone comprising the States
of Punjab, Haryana and Rajasthan, Central zone comprising the States of Madhya Pradesh, Gujarat,
Maharashtra & Orissa and Southern zone comprising the States of Telangana, Andhra Pradesh,
Karnataka and Tamil Nadu. Cotton is also cultivated in small areas of non- traditional states such as Uttar
Pradesh, West Bengal and Tripura. India has brought about a quantitative and qualitative transformation
in the production of cotton since independence. Production and productivity of cotton in India have
improved significantly during the past decades. India has become one of the largest producers, consumers
and exporters of cotton in the World. The details of production and consumption of cotton during the last
5 years is given below:
Table 4: Production and Consumption of cotton in India from 2014-15 to 2019-20 (in lakh bales of 170
Kg Each)
Year Production Consumption
2014-15 386 309.44
2015-16 332 315.28
2016-17 345 310.41
2017-18 370 319.06
2018-19 330 315.5
2019-20 (P) 360 331
Source: Cotton Advisory Board Meeting dated 28/11/19
*P-Provisional
Acreage/Productivity: India has the largest acreage with 125.84 lakh hectares under cotton cultivation i.e.
around 36% of the world area. Approximately 62% of India’s Cotton is produced on rain-fed areas and
38% on irrigated lands. The acreage and productivity of cotton in India for the last 5 years are as follows:-
Table 5: Acreage (in Lakh Hectares) and Productivity (in Kg/Hectares) of cotton in India from 2014-
15 to 2019-20
Year Acreage (lakh ha) Yield
(kg/ha)
2014-15 128.46 511
2015-16 122.92 459
2016-17 108.26 542
2017-18 124.44 500
2018-19 126.58 443.2
2019-20 (P) 125.84 486.33
Source: Cotton Advisory Board Meeting dated 28/11/19 P-Provisional
Presently, Cotton is a freely exportable commodity from India. India exports cotton mainly to Bangladesh,
China, Vietnam, Pakistan, Indonesia, Taiwan, Thailand etc, out of which Bangladesh & China are the
largest importer of Indian cotton. Although India is a major producer and exporter of cotton, some quantity
of extra-long staple variety of cotton, which is not available in the country, is imported. The following table
gives the import and export figures for the last 5 years:-

Table 6: India’s Import and Export of Cotton from 2014-15 to 2019-20 (in lakh bales of 170 Kg each )
Year Import Export
2014-15 14.39 57.72
2015-16 22.79 69.07
2016-17 30.94 58.21
2017-18 15.8 67.59
2018-19 31 44
2019-20 (P) 25 50
Source: Cotton Advisory Board Meeting dated 28/11/19
*P-Provisional
Section 5: Trends in International Trade i.e. Exports and Imports of Cotton
A glimpse of the top twenty exporters of Cotton (ITCHS 52) in the world is given in 7 below.
Table 7: Exports of Cotton (ITCHS 52) in billion US dollars
Country 2015 2016 2017 2018 2019
Grand
Total
China 15.80 14.97 15.13 15.39 14.14 75.43
USA 5.87 5.69 7.64 8.38 7.91 35.49
India 7.47 6.26 6.92 8.09 6.00 34.75
Pakistan 4.04 3.50 3.50 3.50 3.24 17.78
Viet Nam 1.71 2.10 2.64 2.84 3.06 12.34
Brazil 1.45 1.39 1.50 1.73 2.79 8.85
Turkey 1.70 1.79 1.72 1.83 1.73 8.77
China, Hong Kong
SAR 2.35 1.87 1.60 1.45 1.11 8.38
Italy 1.46 1.42 1.44 1.42 1.27 7.00
Australia 0.82 1.22 1.33 0.98 1.10 5.45
Germany 0.99 0.95 0.96 0.95 0.82 4.68
Indonesia 0.82 0.78 0.82 0.81 0.77 4.00
Uzbekistan 0.00 0.00 1.18 1.03 1.29 3.50
Spain 0.65 0.73 0.69 0.64 0.66 3.38
Rep. of Korea 0.64 0.53 0.52 0.45 0.40 2.55
Thailand 0.55 0.48 0.48 0.49 0.44 2.45
Japan 0.56 0.51 0.49 0.45 0.43 2.43
Egypt 0.48 0.47 0.47 0.48 0.47 2.37
Greece 0.38 0.40 0.45 0.46 0.64 2.33
Other Asia, nes 0.48 0.44 0.43 0.46 0.39 2.21
Others 5.72 5.68 5.90 6.22 5.70 29.22
Total Export Value 53.94 51.18 55.80 58.07 54.35 273.34
Source: Computed from UN Comtrade database
Tables 7 and 8 show the top twenty exporters of cotton and their percentage shares. China, USA, India,
Pakistan and Vietnam are the top five exporters of cotton from 2015 to 2019. Together, these five countries

cover around 64 per cent of exports. India is the third largest cotton exporter accounting for about 13%
per cent of the global exports of cotton from 2015 to 2019.
Table 8: Shares of countries in % in world exports of Cotton (ITCHS 52)
Country 2015 2016 2017 2018 2019
China 29.29 29.24 27.11 26.51 26.02
USA 10.89 11.13 13.68 14.43 14.55
India 13.85 12.24 12.40 13.94 11.04
Pakistan 7.49 6.83 6.27 6.03 5.97
Viet Nam 3.16 4.10 4.73 4.90 5.62
Brazil 2.69 2.71 2.68 2.98 5.12
Turkey 3.16 3.49 3.08 3.15 3.19
China, Hong Kong
SAR 4.35 3.65 2.88 2.49 2.04
Italy 2.71 2.77 2.57 2.44 2.33
Australia 1.52 2.37 2.39 1.70 2.01
Germany 1.83 1.86 1.73 1.64 1.50
Indonesia 1.53 1.53 1.47 1.40 1.41
Uzbekistan 0.00 0.00 2.11 1.77 2.38
Spain 1.21 1.43 1.24 1.10 1.21
Rep. of Korea 1.20 1.04 0.93 0.78 0.74
Thailand 1.02 0.94 0.86 0.85 0.82
Japan 1.03 1.01 0.87 0.77 0.79
Egypt 0.88 0.92 0.85 0.83 0.87
Greece 0.71 0.78 0.81 0.79 1.17
Other Asia, nes 0.90 0.85 0.78 0.80 0.72
Others 10.60 11.11 10.57 10.71 10.50
Total 100 100 100 100 100
Source: Computed from UN Comtrade database
We compute similar tables for the top importers of cotton in the world. Tables 9 and 10 below show the
total import values of cotton by the top twenty countries and their percentage shares respectively. The
top five importers in the list consist of China, Vietnam, Turkey, Indonesia and Hongkong. In fact, 45%
of the world import value of cotton from 2015 to 2019 comes from these five countries only.
Table 9: Imports of Cotton (ITCHS 52) in billion US dollars
Country 2015 2016 2017 2018 2019
Grand
Total
China 10.25 7.74 8.61 9.89 9.23 45.73
Viet Nam 3.40 3.38 4.06 4.77 4.37 19.97
Turkey 2.26 2.36 3.00 2.51 2.63 12.76
Indonesia 2.12 2.10 2.26 2.40 1.97 10.85
China, Hong Kong
SAR 2.15 1.72 1.50 1.35 1.03 7.74
Bangladesh 7.15 0.00 0.00 0.00 0.00 7.15
Italy 1.28 1.24 1.27 1.17 1.03 6.00

Rep. of Korea 1.34 1.19 1.16 1.28 1.00 5.97
India 0.60 1.07 1.16 0.84 1.55 5.22
Mexico 1.04 0.96 1.02 1.04 0.86 4.91
Germany 1.01 0.97 1.05 1.03 0.85 4.91
USA 1.10 0.97 0.94 0.96 0.86 4.84
Pakistan 0.66 0.72 0.97 1.24 0.83 4.43
Egypt 0.69 0.63 0.73 0.91 0.89 3.85
Thailand 0.81 0.74 0.77 0.86 0.67 3.84
Portugal 0.57 0.58 0.66 0.73 0.59 3.13
Tunisia 0.61 0.60 0.62 0.64 0.60 3.08
Japan 0.64 0.62 0.60 0.61 0.54 3.01
Cambodia 0.38 0.45 0.51 0.58 0.65 2.57
Russian Federation 0.42 0.47 0.52 0.59 0.55 2.56
Others 10.96 10.63 11.11 10.82 8.93 52.45
Total Import Value 49.46 39.13 42.51 44.23 39.65 214.98
Source: Computed from UN Comtrade database
Table 10: Shares of countries in % in world imports of Cotton (ITCHS 52)
Country 2015 2016 2017 2018 2019
China 20.73 19.79 20.26 22.36 23.28
Viet Nam 6.87 8.63 9.54 10.77 11.03
Turkey 4.58 6.03 7.04 5.67 6.63
Indonesia 4.30 5.36 5.32 5.42 4.98
China, Hong Kong
SAR 4.34 4.40 3.52 3.06 2.59
Bangladesh 14.46 0.00 0.00 0.00 0.00
Italy 2.59 3.17 2.99 2.64 2.61
Rep. of Korea 2.72 3.04 2.73 2.89 2.53
India 1.22 2.74 2.72 1.90 3.91
Mexico 2.11 2.44 2.39 2.35 2.16
Germany 2.03 2.49 2.47 2.32 2.16
USA 2.23 2.49 2.21 2.17 2.18
Pakistan 1.34 1.84 2.29 2.81 2.10
Egypt 1.40 1.62 1.71 2.06 2.24
Thailand 1.63 1.89 1.81 1.95 1.68
Portugal 1.14 1.49 1.56 1.65 1.49
Tunisia 1.23 1.54 1.47 1.46 1.52
Japan 1.30 1.58 1.40 1.38 1.37
Cambodia 0.77 1.14 1.20 1.32 1.63
Russian Federation 0.84 1.20 1.23 1.34 1.40
Others 22.16 27.16 26.13 24.47 22.52
Total 100 100 100 100 100
Source: Computed from UN Comtrade database

Tables 11 and 12 below show the top twenty destinations for Indian exports of cotton, denoting the values
and percentage shares respectively. Bangladesh, China, Pakistan, Vietnam and Sri Lanka are the
countries which constituted the largest markets for India’s cotton exports in 2019 with export-value
shares of 26%, 17%, 3%, 4% and 4% approx. respectively.
Table 11: India’s exports of Cotton (ITCHS 52) to various countries (in billion US dollars)
Partner Country 2015 2016 2017 2018 2019
Total
Export
Value
Bangladesh 1.59 1.45 1.74 2.02 1.55 8.35
China 1.99 1.26 1.15 1.47 1.04 6.91
Pakistan 0.62 0.46 0.52 0.76 0.16 2.51
Viet Nam 0.29 0.25 0.39 0.51 0.23 1.67
Sri Lanka 0.23 0.24 0.22 0.24 0.24 1.17
Rep. of Korea 0.21 0.18 0.18 0.26 0.19 1.03
Egypt 0.19 0.16 0.18 0.21 0.22 0.97
Portugal 0.12 0.13 0.16 0.16 0.15 0.72
Indonesia 0.11 0.13 0.16 0.14 0.08 0.61
Peru 0.10 0.10 0.13 0.13 0.13 0.59
Italy 0.10 0.10 0.11 0.10 0.08 0.48
Thailand 0.07 0.07 0.10 0.13 0.11 0.47
Colombia 0.09 0.09 0.08 0.11 0.10 0.47
Turkey 0.06 0.09 0.13 0.09 0.07 0.45
USA 0.09 0.08 0.08 0.10 0.10 0.44
Germany 0.08 0.09 0.10 0.09 0.08 0.43
United Arab
Emirates 0.12 0.10 0.08 0.06 0.06 0.42
Senegal 0.07 0.08 0.08 0.08 0.10 0.41
Malaysia 0.05 0.04 0.04 0.13 0.05 0.32
Japan 0.06 0.05 0.05 0.06 0.06 0.29
Others 1.24 1.11 1.23 1.26 1.21 6.05
Total 7.47 6.26 6.92 8.09 6.00 34.75
Source: Computed from UN Comtrade database
Table 12: Various countries’ share (in %) in Indian exports of Cotton (ITCHS 52)
Partner Country 2015 2016 2017 2018 2019
Bangladesh 21.29 23.10 25.16 24.99 25.80
China 26.58 20.17 16.68 18.11 17.38
Pakistan 8.30 7.33 7.47 9.36 2.67
Viet Nam 3.88 4.02 5.68 6.25 3.86
Sri Lanka 3.02 3.89 3.20 2.93 4.05
Rep. of Korea 2.85 2.94 2.67 3.16 3.14

Egypt 2.61 2.56 2.64 2.63 3.60
Portugal 1.58 2.10 2.31 2.03 2.48
Indonesia 1.47 2.02 2.27 1.68 1.29
Peru 1.32 1.61 1.81 1.64 2.19
Italy 1.33 1.57 1.53 1.19 1.27
Thailand 0.88 1.18 1.40 1.59 1.78
Colombia 1.22 1.44 1.15 1.32 1.66
Turkey 0.87 1.46 1.95 1.06 1.21
USA 1.19 1.24 1.16 1.22 1.61
Germany 1.06 1.37 1.44 1.09 1.28
United Arab
Emirates 1.64 1.55 1.14 0.76 1.03
Senegal 0.88 1.23 1.21 1.01 1.72
Malaysia 0.64 0.70 0.60 1.65 0.88
Japan 0.75 0.88 0.79 0.80 0.93
Others 16.66 17.66 17.72 15.53 20.18
Total 100 100 100 100 100
Source: Computed from UN Comtrade database
In similar vein, tables 13 and 14 show the top twenty sources for Indian imports of cotton, denoting the
values and percentage shares respectively. USA, China, Australia, Egypt and Mali are the countries from
which India imported cotton, in descending order of magnitude of import-values, from 2015-2019 with
import-value shares of 40%, 8%, 2%, 6% and 1% respectively in 2019. Thus, Indian cotton imports of
value around 57% were sourced from these five countries in 2019.
Table 13: India’s imports of Cotton (ITCHS 52) from various countries (in billion US dollars)
Partner Country 2015 2016 2017 2018 2019
Total
Import
Value
USA 0.11 0.23 0.48 0.35 0.62 1.79
China 0.14 0.12 0.13 0.12 0.12 0.63
Australia 0.02 0.29 0.14 0.06 0.03 0.54
Egypt 0.03 0.05 0.05 0.07 0.10 0.30
Mali 0.07 0.06 0.07 0.01 0.02 0.23
Côte d'Ivoire 0.01 0.03 0.03 0.01 0.08 0.16
Cameroon 0.02 0.02 0.04 0.00 0.03 0.12
Pakistan 0.05 0.03 0.01 0.01 0.01 0.11
Benin 0.01 0.03 0.03 0.00 0.03 0.10
Bangladesh 0.02 0.01 0.02 0.02 0.04 0.10
Brazil 0.00 0.02 0.01 0.00 0.06 0.09
Burkina Faso 0.01 0.01 0.05 0.00 0.02 0.08
Switzerland 0.00 0.00 0.00 0.01 0.06 0.07
Singapore 0.00 0.00 0.00 0.01 0.05 0.07

United Rep. of
Tanzania 0.00 0.02 0.01 0.02 0.01 0.06
Greece 0.00 0.02 0.00 0.01 0.01 0.06
Togo 0.01 0.01 0.00 0.00 0.03 0.05
China, Hong Kong
SAR 0.01 0.01 0.01 0.01 0.01 0.05
Viet Nam 0.00 0.00 0.00 0.01 0.02 0.04
Italy 0.01 0.01 0.01 0.01 0.01 0.04
Others 0.07 0.11 0.08 0.07 0.19 0.52
Total 0.60 1.07 1.16 0.84 1.55 5.22
Source: Computed from UN Comtrade database
Table 14: Various countries’ share in % in Indian imports of Cotton (ITCHS 52)
Partner Country 2015 2016 2017 2018 2019
USA 18.25 21.74 41.33 41.94 39.83
China 22.59 11.37 11.06 14.68 8.01
Australia 4.01 26.70 12.08 6.97 2.15
Egypt 5.14 4.56 4.13 8.77 6.30
Mali 11.48 5.64 5.72 1.38 1.46
Côte d'Ivoire 2.37 2.83 2.41 1.23 5.29
Cameroon 4.00 2.04 3.69 0.31 1.93
Pakistan 8.41 2.34 0.94 1.76 0.67
Benin 2.07 2.59 2.48 0.23 1.96
Bangladesh 2.59 0.92 1.46 2.47 2.37
Brazil 0.71 1.56 0.97 0.58 3.67
Burkina Faso 0.84 1.02 4.34 0.28 1.03
Switzerland 0.19 0.07 0.05 1.29 3.60
Singapore 0.04 0.03 0.07 1.51 3.37
United Rep. of
Tanzania 0.35 1.66 0.54 2.72 0.59
Greece 0.64 1.97 0.41 1.63 0.79
Togo 2.05 0.53 0.06 0.29 2.05
China, Hong Kong
SAR 1.40 1.13 0.79 0.89 0.60
Viet Nam 0.33 0.31 0.15 1.39 1.47
Italy 1.60 0.69 0.59 1.10 0.48
Others 10.92 10.31 6.72 8.58 12.38
Total 100 100 100 100 100
Source: Computed from UN Comtrade database
While the supply-side of cotton in the international market is strong, we need to assess the countries
which have a significant share of the commodity in their import basket but do not give enough importance
to India as a source country. To do this, we resort to the Export Intensity Index, explained in the following
section.
Section 6: Export Intensity Index
Export Trade Intensity Index (ETII) of a country with respect to an importing country is the share of the
exporting country’s merchandise going to that particular importing country divided by the share of world
exports going to that importing country. In other words, it is the importance of that importing country as
a destination for the exporting country’s merchandise outflow, as compared to the importance that
importing country enjoys as a destination of world exports. But algebraically, it is equal to the exporting
country’s share in the importer’s market as compared to the same country’s market share in the world
market. Table 15 below shows the indices of the countries with the highest imports of cotton from the
world and from India.
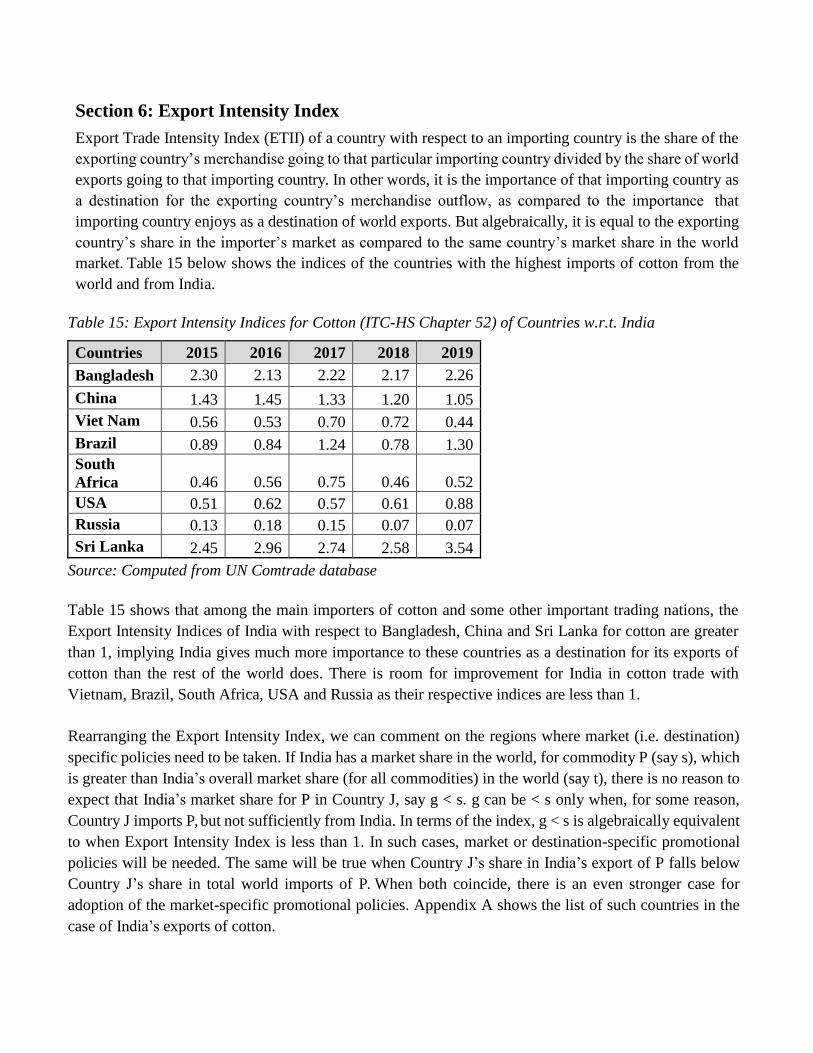
Table 15: Export Intensity Indices for Cotton (ITC-HS Chapter 52) of Countries w.r.t. India
Countries 2015 2016 2017 2018 2019
Bangladesh 2.30 2.13 2.22 2.17 2.26
China 1.43 1.45 1.33 1.20 1.05
Viet Nam 0.56 0.53 0.70 0.72 0.44
Brazil 0.89 0.84 1.24 0.78 1.30
South
Africa 0.46 0.56 0.75 0.46 0.52
USA 0.51 0.62 0.57 0.61 0.88
Russia 0.13 0.18 0.15 0.07 0.07
Sri Lanka 2.45 2.96 2.74 2.58 3.54
Source: Computed from UN Comtrade database
Table 15 shows that among the main importers of cotton and some other important trading nations, the
Export Intensity Indices of India with respect to Bangladesh, China and Sri Lanka for cotton are greater
than 1, implying India gives much more importance to these countries as a destination for its exports of
cotton than the rest of the world does. There is room for improvement for India in cotton trade with
Vietnam, Brazil, South Africa, USA and Russia as their respective indices are less than 1.
Rearranging the Export Intensity Index, we can comment on the regions where market (i.e. destination)
specific policies need to be taken. If India has a market share in the world, for commodity P (say s), which
is greater than India’s overall market share (for all commodities) in the world (say t), there is no reason to
expect that India’s market share for P in Country J, say g < s. g can be < s only when, for some reason,
Country J imports P, but not sufficiently from India. In terms of the index, g < s is algebraically equivalent
to when Export Intensity Index is less than 1. In such cases, market or destination-specific promotional
policies will be needed. The same will be true when Country J’s share in India’s export of P falls below
Country J’s share in total world imports of P. When both coincide, there is an even stronger case for
adoption of the market-specific promotional policies. Appendix A shows the list of such countries in the
case of India’s exports of cotton.

Section 7: RCA and RCII
While looking at the Export Intensity Index is one approach, the other involves the use of information
regarding source countries which places high importance on its exports of cotton, in terms of value,
relative to the importance in world exports; and likewise, also enjoying similar relative importance in the
destination country’s imports. The first is known as Revealed Comparative Advantage (RCA) and the
second Revealed Comparative Import Inclination (RCII). RCA index for a commodity (or commodity
group) exported from the source country is higher than 1 if its importance is more in the source country’s
total exports than in world exports, and vice versa. Similarly, RCII index for the destination country’s
imports for a commodity (or commodity group) is higher than 1 if its importance is more in the
destination country’s overall imports than in world imports, and vice versa.
To list countries with high RCA or RCII for cotton in a year, it is sufficient to find of the share of the
commodity in the country’s export or import basket respectively, since its share in the world exports or
imports remains constant in a given year. Using this for the year 2019, the RCA of various countries’
exports of Cotton (ITCHS 52) is given in table 16 below. India has a huge comparative advantage in
supply-side for exports of cotton to the world (since RCA >1) as seen from table 15 below.
Table 16: RCA of various countries’ exports of Cotton (ITC-HS Chapter 52)
Countries 2015 2016 2017 2018 2019
China 2.22 2.28 2.28 2.33 1.90
USA 1.11 1.09 1.48 1.66 1.43
Pakistan 58.00 53.99 53.67 55.15 47.36
Viet Nam 3.37 4.40 4.06
Brazil 2.43 2.39 2.35 2.72 4.54
India 9.04 7.68 8.03 8.91 6.45
Source: Computed from UN Comtrade database
Similarity, if the RCII in the destination country is greater than 1 then the country imports cotton to an
extent more than overall world trends warrant. Therefore, if India seeks to expand its exports, these
countries are the preliminary list of options. Table 17 hows the RCII indices of various countries’ imports
of Cotton (ITCHS 52).Table 17 below shows all the countries listed, viz., China, Vietnam, Turkey,
Indonesia and Bangladesh have RCII>1 indicating a higher than average appetite for imports of cotton
than the rest of the world and these countries should thus serve as potent destination markets for India’s
cotton exports.

Table 17: RCII of various countries’ imports of Cotton (ITC-HS Chapter 52)
Countries 2015 2016 2017 2018 2019
China 2.11 2.16 2.17 2.22 2.07
Viet Nam 7.02 9.78 8.03
Turkey 3.76 5.12 5.96 2.73 5.71
Indonesia 5.10 6.83 6.29 6.17 5.39
Bangladesh 51.15
India 0.53 1.33 1.21 0.76 1.48
Source: Computed from UN Comtrade database
However, India already exports to many of these countries with a RCII greater than 1. The question that
remains is, are the exports sufficiently high? If the RCA of India to these importing countries (not to the
world, as was being discussed earlier) is > 1, it may be said that the exports are sufficiently high. This is
applicable only because the importing countries’ RCII (for the world) for the product is also >1. On the
other hand, if the RCA is < 1, then export of cotton (in value terms) to those countries are not sufficiently
high and it needs closer examination. The policy measures, in this case, must be directed towards making
Indian exporters increase the share of cotton in their export basket to these countries.
By a similar logic as given above, it can be established that if for a particular commodity, RCA for India
and RCII for the importing country are both > 1, it can be expected that RCII for that commodity in that
country’s imports from India will be > 1. If this is not the case, the reasons thereof need to be investigated,
and appropriate policy measures need to be taken. Actually, it implies that the country is not importing
the particular commodity, here cotton, in sufficient amount (in value terms) while importing from India.
It is not necessarily that they are averse to buying from India in general, they may very well purchase other
commodities from India, but – for some reason – not this particular product. Policies designed to make
these products from India attractive to the importers of the destination country need to be adopted.

Section 8: Competitiveness Index and Intra-Industry Trade
The idea of market dominance can be viewed from a different perspective. The competitiveness index of
India’s export of cotton tells how important India’s product is (in terms of market value share) with respect
to its competitors in a destination country. While an index value greater than 1 is definitely good for India,
a value less than 1 shows that it has been overshadowed by the products of other exporters. Table 18 shows
the indices of Indian exports as well as other exporters of cotton (China, USA, Pakistan, Vietnam and
Brazil) for the top importing countries (China, Vietnam, Turkey, Indonesia and Hongkong). For Indian
exports, the index is high only for China (>1). It has index values < 1 for other countries, implying India
must step up its game in these importing countries to compete with other exporters of cotton.
Table 18: Competitiveness Indices (Product) of various exporter countries w.r.t Cotton (ITCHS 52)
Competitiveness Index (Product) of Exporter(Reporter) to Importer(Partner) in 2019
Partner
China Viet Nam Turkey Indonesia Hongkong
Reporter
China N/A 1.21 0.11 1.01 2.77
USA 0.55 2.5 1.69 1.52 0.01
India 1.19 0.52 0.26 0.32 0.18
Pakistan 0.64 0.17 1.11 0.2 0.34
Viet Nam 4.65 N/A 0.39 0.38 1.28
Brazil 1.98 1.73 1.73 3.61 0.01
Source: Computed from UN Comtrade database
Table 19: Competitiveness Indices (Market) of various exporter countries w.r.t Cotton (ITCHS 52)
Competitiveness Index (Market) of Exporter(Reporter) to Importer(Partner) in 2019
Partner
China Viet Nam Turkey Indonesia Hongkong
Reporter
China N/A 1.03 0.32 1.00 1.54
USA 1.34 6.56 4.45 4.16 0.04
India 16.22 3.44 0.88 1.51 1.09
Pakistan 46.22 17.07 45.26 5.95 131.26
Viet Nam 8.45 N/A 2.96 0.93 4.17
Brazil 2.70 8.15 7.85 15.95 1.07
Source: Computed from UN Comtrade database

Intra-industry trade is of importance as it can increase and expand markets. The standard indicator is the
Index of Intra-industry Trade (IIT). The index can be calculated within individual sectors as well. Intra-
industry trade is generally high in case of the manufacturing sector. An increase in IIT may signify a
maturing of this sector, and hence, a regular monitoring of this index may be useful. Intra-industry trade is
a common world-wide phenomenon – export and import of the commodities produced by the same industry
or sector. The degree to which this occurs is generally measured by the Grubel-Lloyd Index, which is the
difference between the exports of the particular sector to a partner country and imports of the products of
the same sector from the same partner, divided by the sum of these two, and whole thing obtained subtracted
from one.
The following table (Table 20) shows varying degrees of IIT between India and some major cotton
importers and other nations. The values are low (<0.3) between India and these countries, showing lesser
interdependence (exports and imports by the same sector) in international trade within the same industry.
The key factors that affecting intra-industry trade are product differentiation, human capital intensity and
economies of scale (Hu & Ma, 1999). The sources of gains from intra-industry trade between similar
economies—namely, the learning that comes from a high degree of specialization and splitting up the value
chain and from economies of scale—are not contradictory to the earlier theory of comparative advantage.
Table 20: Intra-Industry Trade in HS-52 (Cotton) between India and Some Major Cotton Importing
Countries in 2019
IIT between India and Partner Countries (Cotton
Importers)
Countries
Grubel-
Lloyd
Index
in 2019
Bangladesh 0.05
China 0.21
Viet Nam 0.18
Sri Lanka 0.03
USA 0.27
Australia 0.25
Source: Computed from UN Comtrade database

Section 9: India’s exports to Trading Blocs and associations
This section discusses India’s export of Cotton (ITCHS 52) to the trading blocs, namely the EU and the
ASEAN, and the members of BRICS. Table 21 shows India’s export, in terms of trade value, to the
aforementioned trading blocs and associations.
Table 21: India's export of Cotton (ITCHS 52) to ASEAN, BRICS and EU (in million US $)
(Export Values in US Million $)
2015-16 2016-17 2017-18 2018-19 2019-20
ASEAN 601.73 625.58 869.17 875.11 538.68
BRICS 2022.27 1299.06 1220.26 1511.38 1078.50
EU Countries 476.00 503.31 558.02 477.30 414.52
Data is sourced from Export Import Data Bank, Department of Commerce.
Section 10: Indian Exports of Cotton
This section analyses the data on Indian exports of Cotton at the ITCHS 2-digit level showing YoY
growth rate in value in Million US$.
Table 22: Indian exports of Commodity: ITC HS Code 52 (Cotton) showing YoY growth rate (%) and
value in Million US$
Sl.No. Country Values in US$ Million
2018-2019 2019-2020 %Growth
1 AFGHANISTAN 2.38 1.56 -34.64
2 ALBANIA 0.02 0.1 367.43
3 ALGERIA 8.24 4.24 -48.53
4 ANDORRA 0
5 ANGOLA 12.64 6.51 -48.47
6 ANTIGUA 0.01
7 ARGENTINA 3.06 5.71 86.52
8 AUSTRALIA 6.34 4.75 -25.17
9 AUSTRIA 3.81 3.63 -4.67
10 ARUBA 0
11 AZERBAIJAN 0.05
12 BAHAMAS 0 0.02 9,150.00
13 BAHARAIN IS 8.79 4.12 -53.08
14 BANGLADESH PR 1,878.04 1,649.99 -12.14
15 BARBADOS 0.26 0.02 -90.51
16 BELIZE 0.01
17 BELGIUM 33.94 18.5 -45.49

18 MAYOTTE 0.39 0.44 12.01
19 BENIN 22.57 24.64 9.18
20 BERMUDA 0
21 BHUTAN 0.17 0.27 60.73
22 BOLIVIA 0.17 0.05 -68.34
23 BOSNIA-HRZGOVIN
24 BOTSWANA 0.04 0.01 -63.4
25 BRAZIL 20.49 17.29 -15.61
26 BRUNEI 0.04 0.03 -24.94
27 BULGARIA 6.28 2.4 -61.74
28 BURKINA FASO 7.43 12.23 64.6
29 BURUNDI 3.71 2.96 -20.21
30 BELARUS 0.07 0 -98.89
31 CAMBODIA 7.59 4.61 -39.2
32 CAMEROON 1.05 2.8 166.57
33 CANADA 6.5 6.51 0.17
34 C AFRI REP 0.36
35 CHAD 0.1 0.48 395.57
36 CHILE 19.68 17.99 -8.59
37 TAIWAN 54.16 40.77 -24.72
38 CHINA P RP 1,786.77 777.96 -56.46
39 COLOMBIA 105 109.88 4.64
40 COMOROS 2.53 2.8 11.05
41 CONGO P REP 4.42 4.21 -4.62
42 COOK IS 0 0.01 79.49
43 COSTA RICA 0.23 0.07 -70.94
44 CROATIA 3.99 3.77 -5.36
45 CUBA 0.3
46 CYPRUS 0.12 0.14 24.2
47 CZECH REPUBLIC 8.14 5.89 -27.65
48 DENMARK 4.75 5.12 7.69
49 DJIBOUTI 4.22 1.4 -66.76
50 DOMINIC REP 15.76 14.39 -8.69
51 DOMINICA 0.04 0.18 334.65
52 ECUADOR 9.9 6.84 -30.98
53 EGYPT A RP 221.08 217.64 -1.56
54 EL SALVADOR 0.62 0.63 2.19
55 ESTONIA 1.1 1.46 32.04
56 ETHIOPIA 4.2 3.57 -15.02
57 EQUTL GUINEA 0.3 0.01 -96.34
58 FINLAND 0.51 0.44 -14.02
59 FIJI IS 1.03 0.83 -19.67
60 FRANCE 9.13 8.38 -8.24

61 FR GUIANA 0.05 0.04 -23.27
62 FR POLYNESIA 0.06
63 GABON 2.13 1.9 -10.64
64 GAMBIA 34.28 49.83 45.36
65 GEORGIA 0 0.07 4,018.75
66 GERMANY 84.29 76.29 -9.49
67 GHANA 9.54 8.06 -15.52
68 GREECE 5.64 5.53 -1.94
69 GUADELOUPE 0.15 0.16 4.03
70 GUATEMALA 52.68 36.38 -30.95
71 GUINEA 13.68 16.83 22.98
72 GUYANA 0.04 0.01 -80.29
73 HAITI 0.09 0.06 -30.73
74 HONDURAS 2.44 1.84 -24.38
75 HONG KONG 33.59 13.19 -60.73
76 HUNGARY 0.65 0.54 -17.95
77 INDONESIA 104.21 105.99 1.71
78 IRAN 12.08 55.27 357.61
79 IRAQ 0.07 0.09 40.64
80 IRELAND 0.18 0.43 138.87
81 ISRAEL 16.98 19.13 12.68
82 ITALY 93.61 68.89 -26.4
83 COTE D' IVOIRE 9.34 7.49 -19.87
84 JAMAICA 0.14 0.13 -10.25
85 JAPAN 65.61 51.83 -21.01
86 JORDAN 9.15 10.73 17.23
87 KAZAKHSTAN 0.13 0.11 -13.85
88 KENYA 11.57 9.13 -21.07
89 KOREA DP RP 1.72 0.13 -92.56
90 KYRGHYZSTAN 0.03 0.05 80.2
91 KOREA RP 237.03 189.19 -20.18
92 KUWAIT 4.98 5.16 3.55
93 LAO PD RP 0
94 LATVIA 0.32 0.55 71.99
95 LEBANON 4.16 3.17 -23.89
96 LESOTHO 10.88 9.43 -13.29
97 LIBERIA 0.04
98 LIBYA 0
99 LITHUANIA 1.28 0.9 -29.49
100 LUXEMBOURG 0
101 MACAO 0 0 -9.38
102 MACEDONIA 0.85 0.11 -87.31
103 MADAGASCAR 16.62 19.23 15.72

104 MALAWI 0.58 0.06 -88.86
105 MALAYSIA 97.56 41.6 -57.36
106 MALDIVES 0.32 0.36 13.18
107 MALI 12.3 21.93 78.28
108 MALTA 0.02 0 -87.34
109 MARTINIQUE 0.06 0.06 2.48
110 MAURITANIA 19.77 21.4 8.27
111 MAURITIUS 45.36 36.14 -20.32
112 MYANMAR 46.49 47.99 3.25
113 MEXICO 22.34 21.6 -3.3
114 MONGOLIA 0.01 0.02 130.77
115 MONTSERRAT 0
116 MOROCCO 29.26 27.61 -5.65
117 MOZAMBIQUE 22.35 26 16.35
118 NAMIBIA 0 0.01 1,316.67
119 NEPAL 70.04 66.19 -5.49
120 NETHERLAND 10 4.82 -51.8
121 NETHERLANDANTIL 0.11 0.01 -89.98
122 NEW CALEDONIA 0 0.05 2,366.67
123 NEW ZEALAND 0.51 0.53 4.7
124 NICARAGUA 0.26 0.17 -36.29
125 NIGER 14.59 11.42 -21.75
126 NIGERIA 24.57 44.57 81.43
127 NORWAY 0.69 0.67 -2.61
128 OMAN 6.55 24.33 271.15
129 PAKISTAN IR 550.33 64.25 -88.33
130 PALAU 0.01 0.01 -52.67
131 PANAMA REPUBLIC 0.75 0.75 1.13
132 PAPUA N GNA 0.19 0.09 -55.34
133 PARAGUAY 3.42 1.87 -45.2
134 PERU 128.55 137.2 6.74
135 PITCAIRN IS. 0
136 PHILIPPINES 33.95 28.91 -14.85
137 POLAND 33.08 27.69 -16.29
138 PORTUGAL 142.44 156.69 10
139 TIMOR LESTE 0
140 PUERTO RICO 0.09 0 -95.2
141 QATAR 1.7 1.31 -22.67
142 REUNION 0.11 0.12 5.46
143 ROMANIA 1.53 1.34 -12.46
144 RUSSIA 4.99 3.45 -30.79
145 RWANDA 0.01 0.12 891.2
146 SAN MARINO 0

147 SAUDI ARAB 15.08 17.48 15.91
148 SERBIA 0.44 0.24 -44.65
149 SENEGAL 84.7 97.51 15.13
150 SEYCHELLES 0.08 0.07 -6.34
151 MONTENEGRO 1.85 2.51 35.22
152 SIERRA LEONE 1.84 0.4 -78.02
153 SLOVAK REP 0.01 0.13 1,627.27
154 SINGAPORE 3.29 1.98 -39.67
155 SLOVENIA 2.96 2.43 -18.04
156 SOMALIA 0.11 0.02 -82.82
157 SOUTH AFRICA 17.16 13.26 -22.77
158 SPAIN 27.6 17.41 -36.93
159 SRI LANKA DSR 239.89 236.01 -1.62
160 ST VINCENT 0.02 0.02 10.95
161 SUDAN 47 80.41 71.09
162 SOUTH SUDAN 0 0 82.61
163 SURINAME 0.13 0.16 19.71
164 SWAZILAND 0.04 0.01 -72.7
165 SWEDEN 1.93 1.16 -40.23
166 SWITZERLAND 3.52 4.42 25.45
167 SYRIA 10.92 9.13 -16.38
168 TAJIKISTAN 0 0.01 2,066.67
169 TANZANIA REP 27.64 19.01 -31.21
170 THAILAND 126.87 101.49 -20.01
171 TOGO 51.2 40.4 -21.09
172 TONGA 0.02
173 TRINIDAD 0.66 0.4 -39.27
174 TUNISIA 18.43 13.95 -24.27
175 TURKEY 75.4 81.81 8.5
176 UGANDA 2.63 4.4 67.04
177 U ARAB EMTS 62.65 61.6 -1.67
178 U K 24.61 19.76 -19.71
179 UKRAINE 6.13 2.44 -60.28
180 U S A 101.39 93.22 -8.05
181 US MINOR OUTLYING ISLANDS
0.01
182 URUGUAY 0.1 0.04 -61.4
183 UZBEKISTAN 0.35 0.54 53.35
184 VANUATU REP 0
185 VENEZUELA 2.46 6.42 160.82
186 VIETNAM SOC REP 455.12 206.06 -54.72
187 SAMOA 0.01
188 YEMEN REPUBLC 4.43 4.99 12.52

189 CONGO D. REP. 6.08 2.03 -66.63
190 ZAMBIA 4.78 5.22 9.32
191 ZIMBABWE 0.15 0.03 -80.19
192 UNSPECIFIED 0.71 0.15 -79.32
Total 7,887.95 5,736.40 -27.28
India's Total 3,30,078.09 3,13,361.04 -5.06
%Share 2.3897 1.8306
Source: Export Import Data Bank, Department of Commerce
Section 11: Summary
In India, cotton is one of the most important cash crops and accounts for around 25% of the total global
fiber production. Cotton industry in India plays a major role in sustaining the livelihood of an estimated
5.8 million cotton farmers and 40- 50 million people engaged in related activities such as cotton processing
and trade.
India remains the third largest exporter of cotton in the world, accounting for about 13% per cent of the
global export value of cotton from 2015 to 2019. China, USA, India, Pakistan and Vietnam are the top
five exporters of cotton from 2015 to 2019. Together, these five countries cover around 64 per cent of
exports. In terms of imports of cotton, India’s world ranking is ninth , accounting for 2.43% of the total
import value of cotton from 2015-19. The top five importers in the list consist of China, Vietnam, Turkey,
Indonesia and Hongkong. In fact, 45% of the world import value of cotton from 2015 to 2019 comes from
these five countries only.
Bangladesh, China, Pakistan, Vietnam and Sri Lanka are the countries which constituted the largest
markets for India’s cotton exports in 2019 with export-value shares of 26%, 17%, 3%, 4% and 4%
respectively. USA, China, Australia, Egypt and Mali are the countries from which India imported cotton,
in descending order of magnitude of import-values, from 2015-2019 with import-value shares of 40%,
8%, 2%, 6% and 1% respectively in 2019. Thus, Indian cotton imports of value around 57% were sourced
from these five countries in 2019.
The market indicators for India in terms of cotton trade can be improved with respect to other major
importers. The Export Intensity Indices of India with respect to Bangladesh, China and Sri Lanka for
cotton are greater than 1, however there is room for maneuvering India’s cotton trade with Vietnam, Brazil,
South Africa, USA and Russia as their respective Export Intensity Indices are less than 1.
Lower values of the Competitiveness index between India and the major importing countries of cotton,
namely Vietnam, Turkey, Indonesia and Hongkong are also a testament to the untapped possibility of
Indian exports of cotton in these territories.
***

Appendix A
Countries requiring market-specific export-promotion policies. This list of destination countries for India
with respect to export of cotton items (at the 6-digit ITC- HS level) is based on the UN Comtrade data
for year 2019.
To Destination Country Source Country Commodity Code 6
AUSTRALIA INDIA 521225
BELGIUM INDIA 520822
520911
521159
CHINA P RP INDIA 520526
520528
520542
520544
520623
520624
520912
521215
FRANCE INDIA 520851
520951
GERMANY INDIA 520911
520919
GREECE INDIA 520522
HONG KONG INDIA 520931
520942
520959
521142
INDONESIA INDIA 520623
520831
520851
520921
ITALY INDIA 520531
520813
520821
520822
520831
520911
520929
520942
JAPAN INDIA 520912

521214
KOREA RP INDIA 520931
MALAYSIA INDIA 520932
PAKISTAN IR INDIA 520812
520852
520859
PORTUGAL INDIA 520411
520822
SRI LANKA DSR INDIA 520959
SWITZERLAND INDIA 520822
THAILAND INDIA 520832
TURKEY INDIA 520299
520511
520512
520513
520524
520841
520859
521031
521142
521213
521214
U K INDIA 520299
520851
520951
VIETNAM SOC REP INDIA 520526
520528
520544
520547
520622
520623
520624
520822
520942

Appendix B
1. Revealed Comparative Advantage Index (RCA): RCA for a commodity exported from a country
means the importance of this commodity in the export trade of the country in comparison with the
importance of the commodity in world exports. Mathematically,
RCAij = (xij/Xit)/( xwj/Xwt)
where xij = country i’s exports of commodity j
Xit = country i’s total exports
xwj= world exports of commodity j
Xwt= total world exports.
When RCAij > 1, i.e. when j’s weight in i’s exports (xij/Xit) is more than j’s weight in world exports
(xwj/Xwt), country i is said to have a revealed comparative advantage in commodity j. There is a
revealed comparative disadvantage if RCAij < 1. When RCAij = 1, there is neither comparative
advantage or disadvantage.
By studying the RCA for a commodity exported from a country over time, it can be seen whether the
country in question is gaining in comparative advantage regarding a particular commodity. If RCA is
falling, the reasons require investigation. (xij/Xit) may have risen less or fallen more than proportionately
than (xwj/Xwt).
2. One way of checking the reasons for a fall in RCA for a particular commodity is seeing which
markets are responsible for this fall. This can be seen from another, slightly different, indicator called
Export Specialization Index (ESI).
ESI = (xij/Xit)/(mkj/Mkt), where
mkj = import of commodity j to market k
Mkt= world imports of commodity k.
(mkj/Mkt) gives the weight of j in market k. So, if RCAij is seen to fall, then it can be found out for
which markets ESI has fallen. Special attention may then be given to those markets regarding the
commodity in question.
3. Like RCA, the revealed comparative import intensity (RCII) can also be measured.
RCII = (mij/Mit)/( mwj/Mwt)
where mij = country i’s imports of commodity j
Mit = country i’s total imports
mwj= world imports of commodity j
Mwt= total world imports.
This gives an idea whether the proportion of imports of any commodity is more than expected, in terms
of the share of that commodity in world imports.
4. Bilateral trade between countries is an important area of trade policy in that bilateral trade agreements

are signed to increase trade. However, some points require to be examined before entering into these
agreements. Firstly, it is necessary to see whether there is trade complementarity between the two
countries. That is, whether the exports of one country match with the imports of the other, and vice versa.
Naturally, when trade complementarity is high between two countries, it is beneficial to enter into a trade
agreement. If a partner country does not import what India generally exports, there is little point in
entering into a trade agreement with that country. The Trade Complementarity Index (TCI) is given as
follows:
TCI = 1 – ∑ (│mik - xij │/2) , where
mik= share of commodity i in the imports of market k
xij = share of commodity i in the exports of country j.
It is evident that TCI can have values between 0 and 1. When these shares, are mik and xij are close to
each other, (i.e. when trade complementarity increases) TCI is close to 1. As their difference increases,
TCI falls.
TCIW = TCI between a country and the World.
RTCI (Relative Trade Complementarity Index) between country k and country j = (TCI between
country k and country j) / (TCI between country k and the world)
RTCI gives a measure of the complementarity between two countries as compared to the
complementarity between the first country and the world.
5. But another fact may be checked while proceeding to enter into a trade agreement. The trade
between the two countries may already be quite high. This can be measured by the Export Intensity
Index (EII).
TII = (xij/Xit)/(xwj/Xwt)
where xij = country i’s exports to country j
Xit = country i’s exports to the world
xwj = world exports to country j
Xwt = total world exports.
This essentially measures the relative importance of country j in country I’s export trade, in comparison
with country j’s importance as world export destination. EII < 1 or >1 implies less than or more than
expected bilateral trade, respectively. If EII is already high, there is little scope of further increasing
bilateral trade between i and j. But if is low, and if TCI is high, bilateral trade can very well be increased
through trade agreements.
6. A related indicator is the Export Similarity Index (XSI), which helps us identify a country’s
competitors.
XSI = ∑ [ min (Xij, Xik)*100]
where Xij= share of commodity i in exports of country j
Xik= share of commodity i in exports of country k
XSI can vary between 0 and 100. It will be seen that when Xij= Xik for all i’s, XSI = 100, which means
complete export similarity between countries j and k. As Xij and Xik start to differ, XSI falls. Countries
exporting the same commodities are competitors in the world market, and export strategies, taking in to
account such competition, have to be designed accordingly.

7. It is necessary to know whether the exports of a country are concentrated in a few products. A high
concentration, while enabling a country to reap the benefits of specialization and economies of scale,
also exposes a country to the risks arising from the vicissitudes of global trade. The Hirschman Index
(HI), used by UNCTAD, is a handy measure for monitoring export concentration.
HI = √[∑Sq(xi/Xt)]
where xi is the country’s exports of commodity i
Xt is the country’s total exports.
HI ranges from (1/n) to 1. The higher the value of HI, the higher the concentration of exports.
8. Intraindustry trade is of importance as it can increase and expand markets. The standard indicator is
the Index of Intraindustry Trade (IIT).
IITjk = 1 – [∑│Xijk – Mijk│/ (Xijk + Mijk)]
where Xijk = exports of products of industry i from country j to country k
Mijk = imports of products of industry i from country k to country j.
IIT can take values from 1 (extremely high intra-industry trade, exports equaling imports) to 0 (no
interindustry trade at all).
*****************************