india’s growth paradigm report... · kota jaipur ludhiana amritsar jalandhar ... bhopal bhop...
TRANSCRIPT
How markets beyond metros have transformedMarch 2017
India’s growth paradigm

ContentsForeword .........................................................................................04Executive highlights ..........................................................061. Urbanization ........................................................................102. Time to re-strategize: 50 not 8 .....................12 Jaipur and Surat .......................................................................... 14
The 11th-20th high-potential markets ............................. 16
Growth opportunities in 30 additional cities ............ 18
Market-wise rankings ............................................................... 20
3. Untapped potential ..................................................... 22 FMCG .................................................................................................. 24
Retail, fashion and durables ................................................ 26
Auto .................................................................................................... 28
Telecom and DTH ........................................................................ 30
E-commerce ................................................................................... 32
Education ......................................................................................... 34
BFSI ..................................................................................................... 36
Real estate ...................................................................................... 37
4. Optimizing reach ............................................................38 TV ......................................................................................................... 40
Print .................................................................................................... 41
Digital .................................................................................................. 42
Radio .................................................................................................. 43
Out of home ................................................................................... 44
Glossary ...........................................................................................46
Farokh Balsara Media & Entertainment Leader, EY India
Bharat Rajamani Solution Leader, Marketing and Advertising Risk Services (MARS), EY India
Ashish Pherwani Media & Entertainment, Advisory Leader, EY India
Nripendra Singh Director, Media and Entertainment, EY India
India is forging ahead as the world’s fastest growing major economy. Urban clusters are driving this growth, and more consumers and more purchasing power is emerging beyond the metros, particularly in Tier II/III cities. Media consumption has also matured in these markets, and penetration of mediums like print, DTH and radio can even be higher than in metros. As the country’s economic and media landscape continues to flatten, sizable opportunities have arisen in this new set of cities.
However, many companies today continue to define their market, marketing and investment plans through a narrow lens focused on just the top handful of cities. But to fully realize its growth potential, India Inc. would be well-served to evaluate these emerging markets. Through our report, we aim to understand this opportunity across India’s fifty largest consumption hubs, and map how companies today are approaching individual hotspots.
We hope you find this report helpful in exploring the opportunities this new wave of high-potential urban markets has in store for businesses, marketers and the industry at large.
Foreword
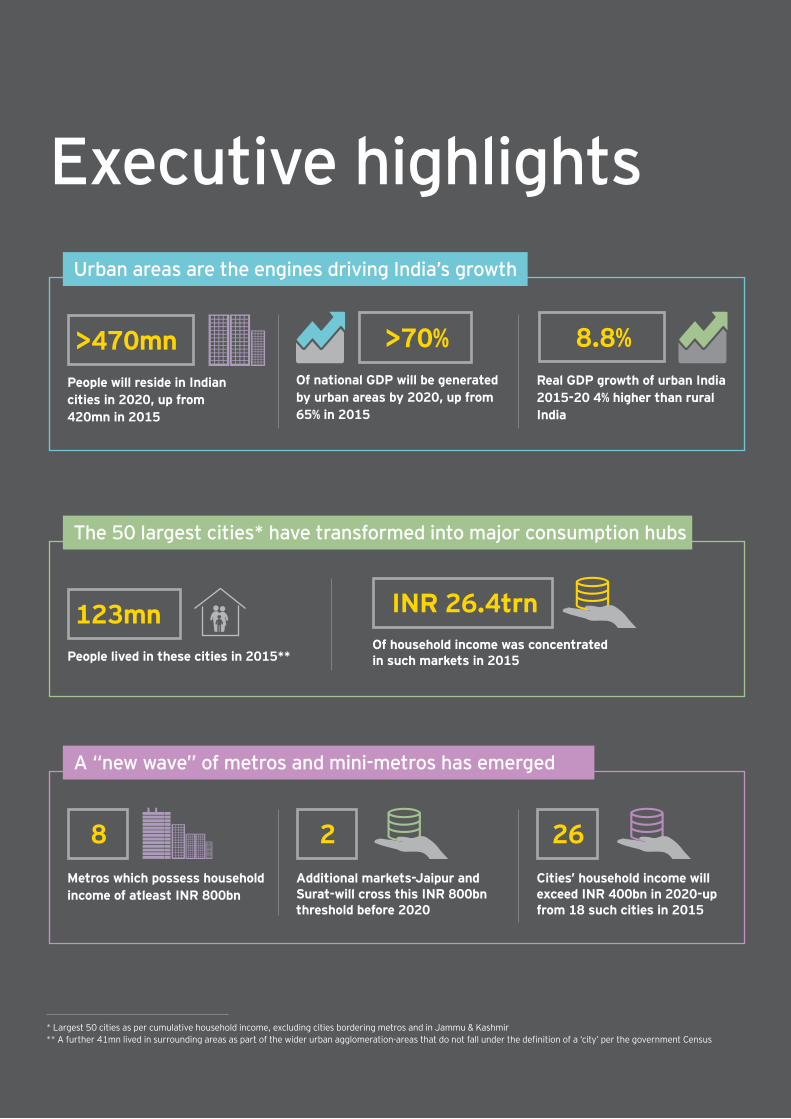
* Largest 50 cities as per cumulative household income, excluding cities bordering metros and in Jammu & Kashmir ** A further 41mn lived in surrounding areas as part of the wider urban agglomeration-areas that do not fall under the definition of a ‘city’ per the government Census
Executive highlights
People will reside in Indian cities in 2020, up from 420mn in 2015
>470mnReal GDP growth of urban India 2015-20 4% higher than rural India
8.8%Of national GDP will be generated by urban areas by 2020, up from 65% in 2015
>70%
Urban areas are the engines driving India’s growth
Of household income was concentrated in such markets in 2015
INR 26.4trn
People lived in these cities in 2015**
123mn
The 50 largest cities* have transformed into major consumption hubs
A “new wave” of metros and mini-metros has emerged
Metros which possess household income of atleast INR 800bn
8Additional markets-Jaipur and Surat-will cross this INR 800bn threshold before 2020
2Cities’ household income will exceed INR 400bn in 2020-up from 18 such cities in 2015
26
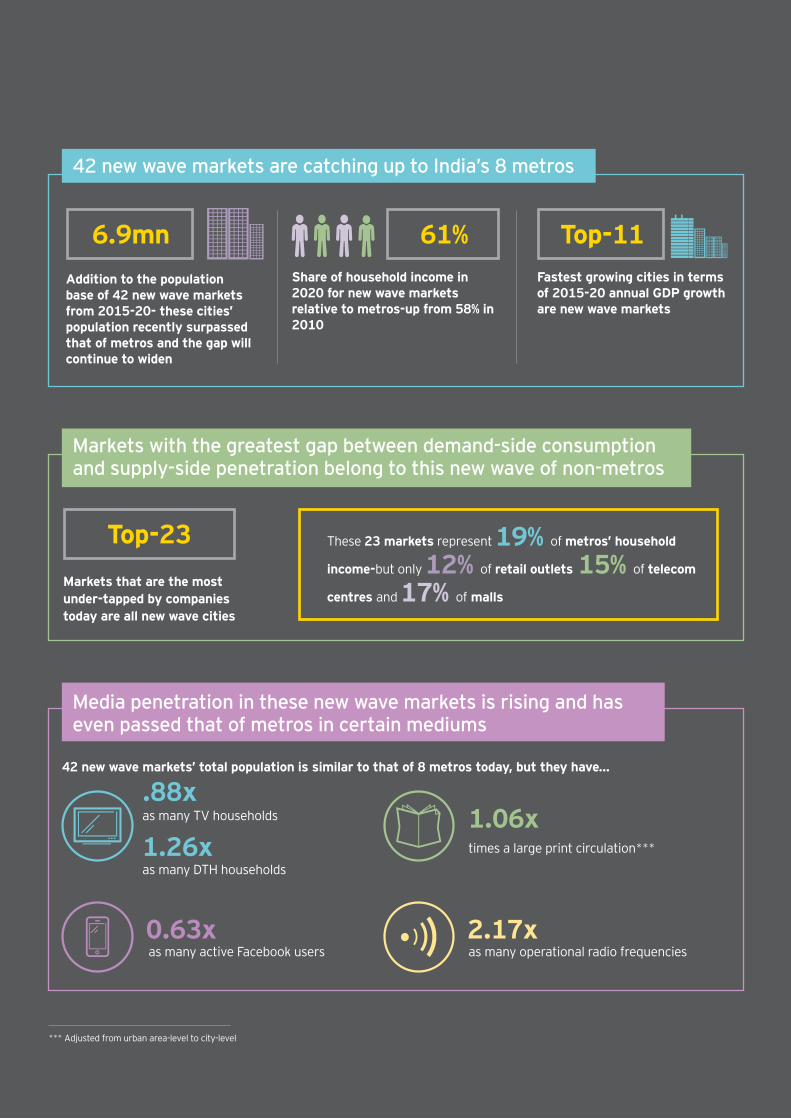
*** Adjusted from urban area-level to city-level
Addition to the population base of 42 new wave markets from 2015-20- these cities’ population recently surpassed that of metros and the gap will continue to widen
6.9mnShare of household income in 2020 for new wave markets relative to metros-up from 58% in 2010
Fastest growing cities in terms of 2015-20 annual GDP growth are new wave markets
Top-1161%
42 new wave markets are catching up to India’s 8 metros
42 new wave markets’ total population is similar to that of 8 metros today, but they have…
as many TV households
as many DTH households
.88x
1.26x times a large print circulation***
1.06x
as many active Facebook users0.63x
as many operational radio frequencies2.17x
Media penetration in these new wave markets is rising and has even passed that of metros in certain mediums
Markets with the greatest gap between demand-side consumption and supply-side penetration belong to this new wave of non-metros
Markets that are the most under-tapped by companies today are all new wave cities
Top-23 These 23 markets represent 19% of metros’ household
income-but only 12% of retail outlets 15% of telecom
centres and 17% of malls
Mumbai
Ahmedabad
Jodhpur
RajkotSurat
Vadodara
Kota
Jaipur
Ludhiana
AmritsarJalandhar
Chandigarh
BhubaneshwarNashik
Jamshedpur
Varanasi PatnaAllahabad
Aurangabad
Nagpur
Bhopal
Gwalior
Kanpur
Indore
Hyderabad
Warangal Vizag
Vijaywada
Hubli-Dharwad
Mysore
Coimbatore
Madurai
TrichyKochi
Trivandrum
Kozhikode
Dehradun
Jabalpur
Pune
Bangalore Chennai
Kolkata
Delhi
AgraLucknow
Meerut
Ranchi
Dhanbad
Raipur
Guwahati
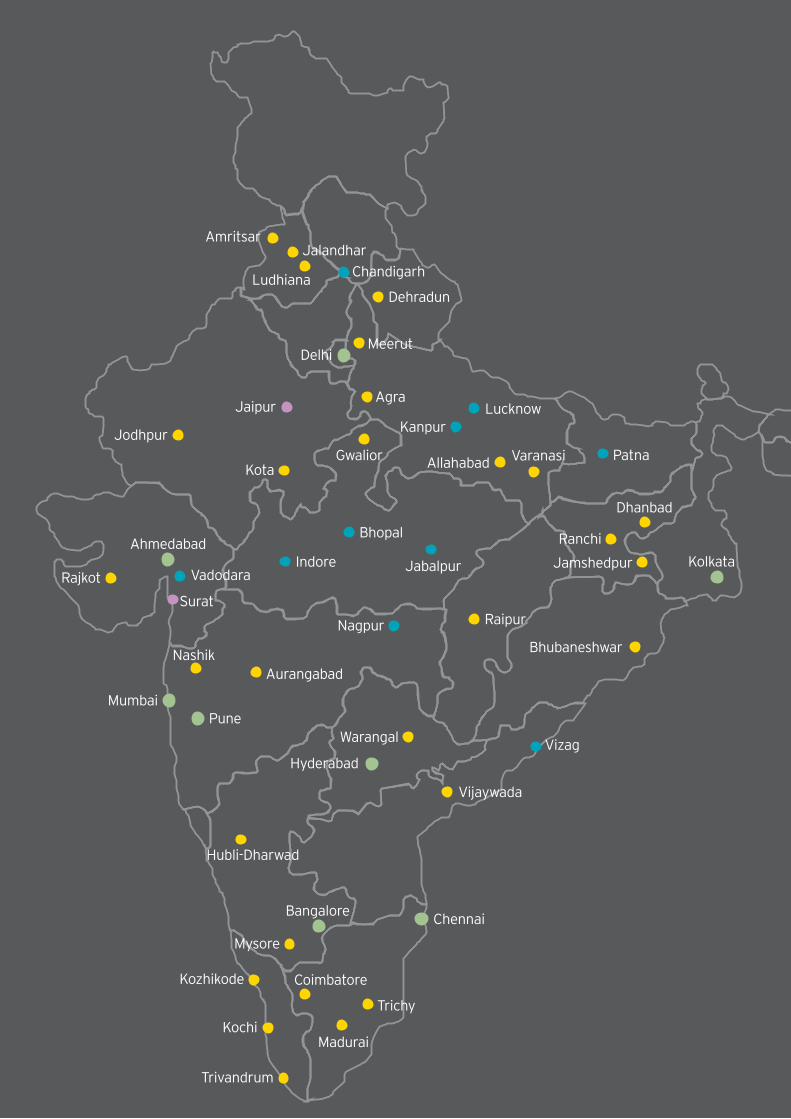
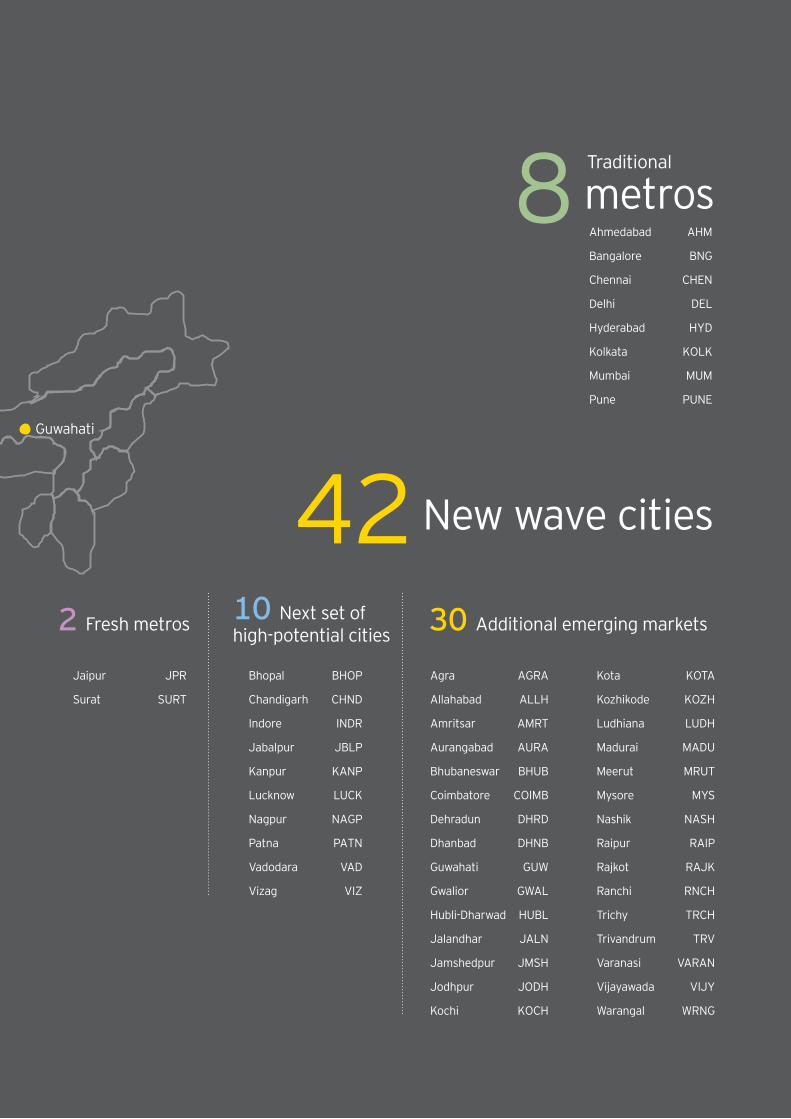
42 New wave cities
Agra AGRA
Allahabad ALLH
Amritsar AMRT
Aurangabad AURA
Bhubaneswar BHUB
Coimbatore COIMB
Dehradun DHRD
Dhanbad DHNB
Guwahati GUW
Gwalior GWAL
Hubli-Dharwad HUBL
Jalandhar JALN
Jamshedpur JMSH
Jodhpur JODH
Kochi KOCH
Kota KOTA
Kozhikode KOZH
Ludhiana LUDH
Madurai MADU
Meerut MRUT
Mysore MYS
Nashik NASH
Raipur RAIP
Rajkot RAJK
Ranchi RNCH
Trichy TRCH
Trivandrum TRV
Varanasi VARAN
Vijayawada VIJY
Warangal WRNG
2 Fresh metros 10 Next set of high-potential cities 30 Additional emerging markets
Bhopal BHOP
Chandigarh CHND
Indore INDR
Jabalpur JBLP
Kanpur KANP
Lucknow LUCK
Nagpur NAGP
Patna PATN
Vadodara VAD
Vizag VIZ
Jaipur JPR
Surat SURT
Ahmedabad AHM
Bangalore BNG
Chennai CHEN
Delhi DEL
Hyderabad HYD
Kolkata KOLK
Mumbai MUM
Pune PUNE
8 metrosTraditional
Urbanization1
55
61
67
55
62
69
50
55
60
65
70
2010 2015 2020
Cit
y po
pula
tion
(m
n) 4,
5,6
8 metros
203
272
371
117158
217
0
100
200
300
400
2010 2015 2020
Per
cap
ita
inco
me
(IN
R 0
00s)
4,6
42 new wave cities
2015-20 CAGR% of real GDP6
8.3%
8.9%
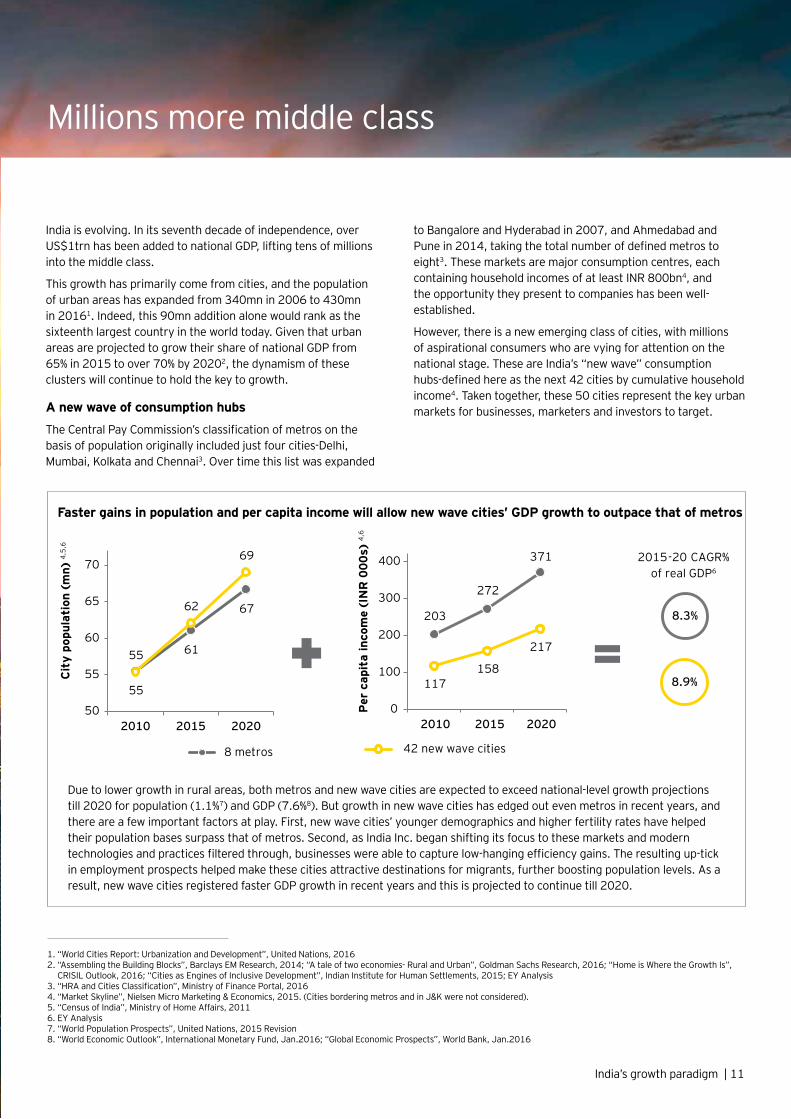
Due to lower growth in rural areas, both metros and new wave cities are expected to exceed national-level growth projections till 2020 for population (1.1%7) and GDP (7.6%8). But growth in new wave cities has edged out even metros in recent years, and there are a few important factors at play. First, new wave cities’ younger demographics and higher fertility rates have helped their population bases surpass that of metros. Second, as India Inc. began shifting its focus to these markets and modern technologies and practices filtered through, businesses were able to capture low-hanging efficiency gains. The resulting up-tick in employment prospects helped make these cities attractive destinations for migrants, further boosting population levels. As a result, new wave cities registered faster GDP growth in recent years and this is projected to continue till 2020.
India’s growth paradigm | 11
Faster gains in population and per capita income will allow new wave cities’ GDP growth to outpace that of metros
India is evolving. In its seventh decade of independence, over US$1trn has been added to national GDP, lifting tens of millions into the middle class.
This growth has primarily come from cities, and the population of urban areas has expanded from 340mn in 2006 to 430mn in 20161. Indeed, this 90mn addition alone would rank as the sixteenth largest country in the world today. Given that urban areas are projected to grow their share of national GDP from 65% in 2015 to over 70% by 20202, the dynamism of these clusters will continue to hold the key to growth.
A new wave of consumption hubs
The Central Pay Commission’s classification of metros on the basis of population originally included just four cities-Delhi, Mumbai, Kolkata and Chennai3. Over time this list was expanded
to Bangalore and Hyderabad in 2007, and Ahmedabad and Pune in 2014, taking the total number of defined metros to eight3. These markets are major consumption centres, each containing household incomes of at least INR 800bn4, and the opportunity they present to companies has been well-established.
However, there is a new emerging class of cities, with millions of aspirational consumers who are vying for attention on the national stage. These are India’s “new wave” consumption hubs-defined here as the next 42 cities by cumulative household income4. Taken together, these 50 cities represent the key urban markets for businesses, marketers and investors to target.
1. “World Cities Report: Urbanization and Development”, United Nations, 20162. “Assembling the Building Blocks”, Barclays EM Research, 2014; “A tale of two economies- Rural and Urban”, Goldman Sachs Research, 2016; “Home is Where the Growth Is”,
CRISIL Outlook, 2016; “Cities as Engines of Inclusive Development”, Indian Institute for Human Settlements, 2015; EY Analysis3. “HRA and Cities Classification”, Ministry of Finance Portal, 20164. “Market Skyline”, Nielsen Micro Marketing & Economics, 2015. (Cities bordering metros and in J&K were not considered).5. “Census of India”, Ministry of Home Affairs, 20116. EY Analysis7. “World Population Prospects”, United Nations, 2015 Revision8. “World Economic Outlook”, International Monetary Fund, Jan.2016; “Global Economic Prospects”, World Bank, Jan.2016
Millions more middle class
Time to re-strategize: 50 not 8
2
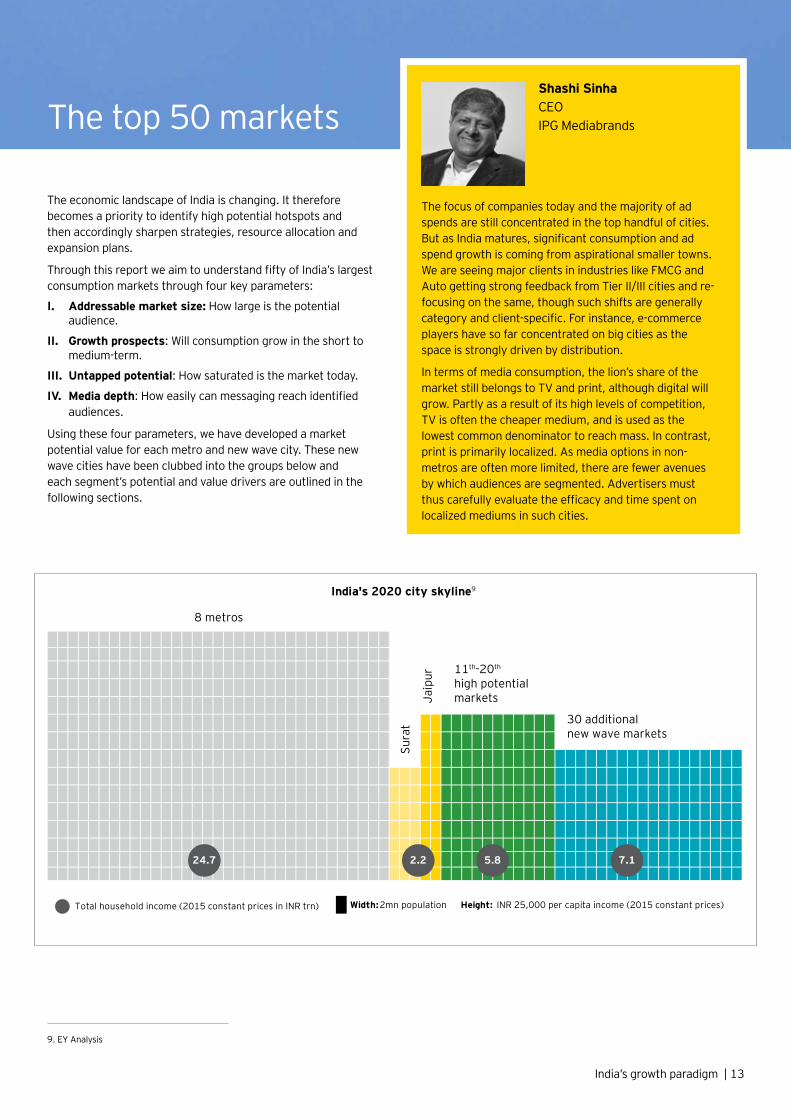
The economic landscape of India is changing. It therefore becomes a priority to identify high potential hotspots and then accordingly sharpen strategies, resource allocation and expansion plans.
Through this report we aim to understand fifty of India’s largest consumption markets through four key parameters:
I. Addressable market size: How large is the potential audience.
II. Growth prospects: Will consumption grow in the short to medium-term.
III. Untapped potential: How saturated is the market today.
IV. Media depth: How easily can messaging reach identified audiences.
Using these four parameters, we have developed a market potential value for each metro and new wave city. These new wave cities have been clubbed into the groups below and each segment’s potential and value drivers are outlined in the following sections.
Total household income (2015 constant prices in INR trn) Width: 2mn population Height: INR 25,000 per capita income (2015 constant prices)
8 metros
India's 2020 city skyline9
30 additional new wave markets
11th-20th high potential marketsJa
ipur
Sura
t
24.7 2.2 5.8 7.1
The focus of companies today and the majority of ad spends are still concentrated in the top handful of cities. But as India matures, significant consumption and ad spend growth is coming from aspirational smaller towns. We are seeing major clients in industries like FMCG and Auto getting strong feedback from Tier II/III cities and re-focusing on the same, though such shifts are generally category and client-specific. For instance, e-commerce players have so far concentrated on big cities as the space is strongly driven by distribution.
In terms of media consumption, the lion’s share of the market still belongs to TV and print, although digital will grow. Partly as a result of its high levels of competition, TV is often the cheaper medium, and is used as the lowest common denominator to reach mass. In contrast, print is primarily localized. As media options in non-metros are often more limited, there are fewer avenues by which audiences are segmented. Advertisers must thus carefully evaluate the efficacy and time spent on localized mediums in such cities.
Shashi Sinha CEO IPG Mediabrands
India’s growth paradigm | 13
The top 50 markets
9. EY Analysis
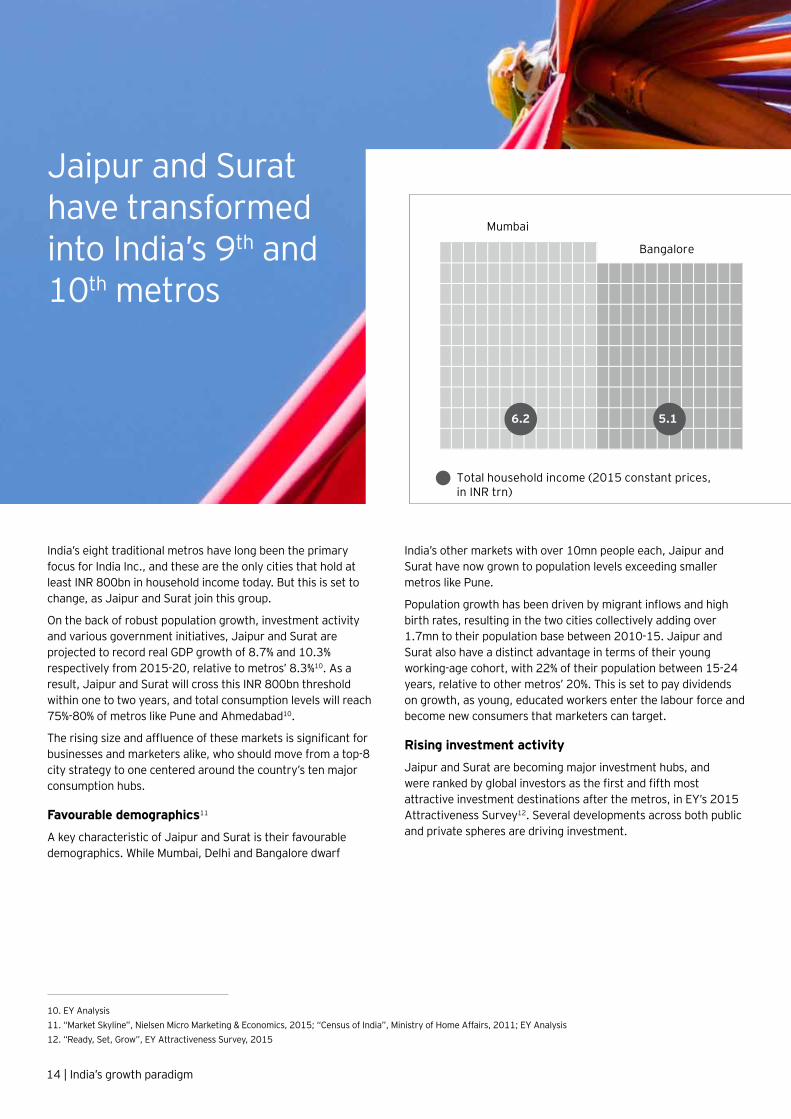
India’s eight traditional metros have long been the primary focus for India Inc., and these are the only cities that hold at least INR 800bn in household income today. But this is set to change, as Jaipur and Surat join this group.
On the back of robust population growth, investment activity and various government initiatives, Jaipur and Surat are projected to record real GDP growth of 8.7% and 10.3% respectively from 2015-20, relative to metros’ 8.3%10. As a result, Jaipur and Surat will cross this INR 800bn threshold within one to two years, and total consumption levels will reach 75%-80% of metros like Pune and Ahmedabad10.
The rising size and affluence of these markets is significant for businesses and marketers alike, who should move from a top-8 city strategy to one centered around the country’s ten major consumption hubs.
Favourable demographics11
A key characteristic of Jaipur and Surat is their favourable demographics. While Mumbai, Delhi and Bangalore dwarf
India’s other markets with over 10mn people each, Jaipur and Surat have now grown to population levels exceeding smaller metros like Pune.
Population growth has been driven by migrant inflows and high birth rates, resulting in the two cities collectively adding over 1.7mn to their population base between 2010-15. Jaipur and Surat also have a distinct advantage in terms of their young working-age cohort, with 22% of their population between 15-24 years, relative to other metros’ 20%. This is set to pay dividends on growth, as young, educated workers enter the labour force and become new consumers that marketers can target.
Rising investment activity
Jaipur and Surat are becoming major investment hubs, and were ranked by global investors as the first and fifth most attractive investment destinations after the metros, in EY’s 2015 Attractiveness Survey12. Several developments across both public and private spheres are driving investment.
14 | India’s growth paradigm
10. EY Analysis11. “Market Skyline”, Nielsen Micro Marketing & Economics, 2015; “Census of India”, Ministry of Home Affairs, 2011; EY Analysis12. “Ready, Set, Grow”, EY Attractiveness Survey, 2015
Jaipur and Surat have transformed into India’s 9th and 10th metros
Width: 1mn population Height: INR 50,000 per capita income (2015 constant prices)
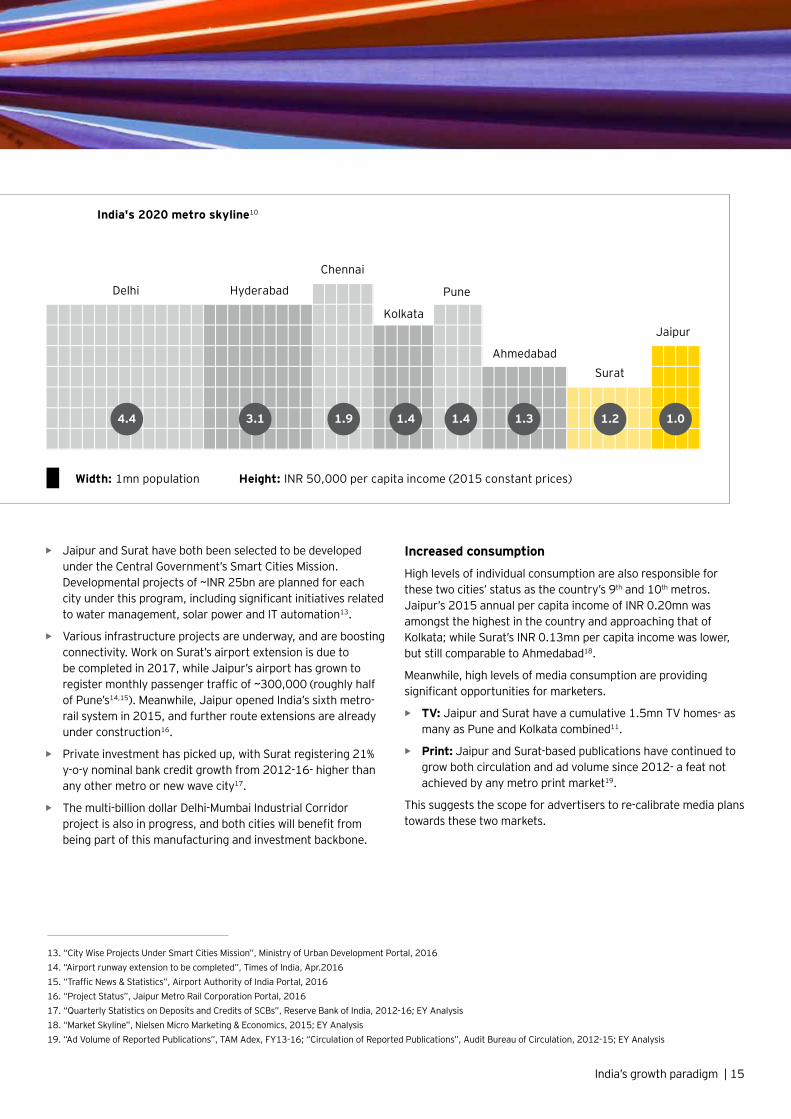
India's 2020 metro skyline10
6.2 5.1 4.4 3.1 1.9 1.4 1.4 1.3 1.2 1.0
Total household income (2015 constant prices, in INR trn)
Surat
JaipurKolkata
Ahmedabad
Mumbai
PuneDelhi
Bangalore
Hyderabad
Chennai
India’s growth paradigm | 15
• Jaipur and Surat have both been selected to be developed under the Central Government’s Smart Cities Mission. Developmental projects of ~INR 25bn are planned for each city under this program, including significant initiatives related to water management, solar power and IT automation13.
• Various infrastructure projects are underway, and are boosting connectivity. Work on Surat’s airport extension is due to be completed in 2017, while Jaipur’s airport has grown to register monthly passenger traffic of ~300,000 (roughly half of Pune’s14,15). Meanwhile, Jaipur opened India’s sixth metro-rail system in 2015, and further route extensions are already under construction16.
• Private investment has picked up, with Surat registering 21% y-o-y nominal bank credit growth from 2012-16- higher than any other metro or new wave city17.
• The multi-billion dollar Delhi-Mumbai Industrial Corridor project is also in progress, and both cities will benefit from being part of this manufacturing and investment backbone.
Increased consumption
High levels of individual consumption are also responsible for these two cities’ status as the country’s 9th and 10th metros. Jaipur’s 2015 annual per capita income of INR 0.20mn was amongst the highest in the country and approaching that of Kolkata; while Surat’s INR 0.13mn per capita income was lower, but still comparable to Ahmedabad18.
Meanwhile, high levels of media consumption are providing significant opportunities for marketers.
• TV: Jaipur and Surat have a cumulative 1.5mn TV homes- as many as Pune and Kolkata combined11.
• Print: Jaipur and Surat-based publications have continued to grow both circulation and ad volume since 2012- a feat not achieved by any metro print market19.
This suggests the scope for advertisers to re-calibrate media plans towards these two markets.
Width: 1mn population Height: INR 50,000 per capita income (2015 constant prices)
India's 2020 metro skyline10
6.2 5.1 4.4 3.1 1.9 1.4 1.4 1.3 1.2 1.0
Total household income (2015 constant prices, in INR trn)
Surat
JaipurKolkata
Ahmedabad
Mumbai
PuneDelhi
Bangalore
Hyderabad
Chennai
13. “City Wise Projects Under Smart Cities Mission”, Ministry of Urban Development Portal, 201614. “Airport runway extension to be completed”, Times of India, Apr.201615. “Traffic News & Statistics”, Airport Authority of India Portal, 201616. “Project Status”, Jaipur Metro Rail Corporation Portal, 201617. “Quarterly Statistics on Deposits and Credits of SCBs”, Reserve Bank of India, 2012-16; EY Analysis18. “Market Skyline”, Nielsen Micro Marketing & Economics, 2015; EY Analysis19. “Ad Volume of Reported Publications”, TAM Adex, FY13-16; “Circulation of Reported Publications”, Audit Bureau of Circulation, 2012-15; EY Analysis
20. “Market Skyline”, Nielsen Micro Marketing & Economics, 2015; “Census of India”, Ministry of Home Affairs, 2011; EY Analysis
21. “City Wise Projects Under Smart Cities Mission”, Ministry of Urban Development Portal, 2016
22. “Traffic News & Statistics”, Airport Authority of India Portal, 2016
23. “Quarterly Statistics on Deposits and Credits of SCBs”, Reserve Bank of India, 2012-16; EY Analysis
24. “Ready, Set, Grow”, EY Attractiveness Survey, 201525. “Ad Volume of Reported Publications”, TAM Adex, FY13-1626. “Circulation of Reported Publications”, Audit Bureau of
Circulation, 2012-1527. EY Analysis
16 | India’s growth paradigm
The 11th-20th high-potential cities have become major consumption hubs in their own right-cumulatively equivalent to four metros today
The affluence and size of India’s top-10 cities make them markets that simply cannot be ignored by firms looking to grow top-lines. But tapping the next ten high-potential new wave markets can deliver an incremental reach equivalent to Chennai, Kolkata, Pune and Ahmedabad combined.
Sizable economies20
When population and per capita incomes are considered together, the purchasing power of these ten cities is nearly INR 4trn which is on par with four metros.
• Cities like Lucknow, Kanpur, Nagpur, Indore and Bhopal have crossed 2mn in population, and present sizable opportunities to grow volumes.
• At the other end of the spectrum, consumers in Chandigarh, Vizag and Vadodara are amongst the most affluent in the country, with per capita incomes over INR 0.2mn.
Growth clusters
There are a few common factors driving GDP growth in these cities- projected to be a robust 8.9% annually from 2015-20.
• All cities (except Patna) have already won funding from the Smart Cities Mission. At INR 40bn-60bn each, the planned projects of Chandigarh, Indore and Jabalpur are particularly notable and are set to boost development21.
• Leaps in connectivity are taking place, and air passenger traffic in these cities has jumped 57% from 2012-16, relative to metros’ 35%22.
• Investment activity is strong and Patna, Vizag, Jabalpur and Bhopal each registered over 15% y-o-y growth of nominal bank credit during 2012-16- higher than every metro except Ahmedabad23.
• These cities have also become attractive destinations for FDI. Vadodara, Chandigarh, Vizag and Nagpur were all ranked amongst the top eight non-metro investment destinations by global investors in EY’s 2015 Attractiveness Survey24.
Media depth
The media markets of these ten new wave cities are different to that of metros, in that they skew more towards print and radio relative to TV. This means marketers cannot take a one-size-fits-all approach and must select appropriate media vehicles to target audiences.
For instance, Chandigarh, despite having a population of just over 1mn, serves as a major print hub in the North and has the country’s seventh largest print ad volume25. Meanwhile, markets like Lucknow and Patna have seen rising print penetration, recording over 8% annual circulation growth in recent years26. Not coincidentally, these three literate, print-centric markets are also amongst the top-ranked non-metros in terms of digital consumption.27
28. Ministry of Information & Broadcasting; EY Analysis
India’s growth paradigm | 17
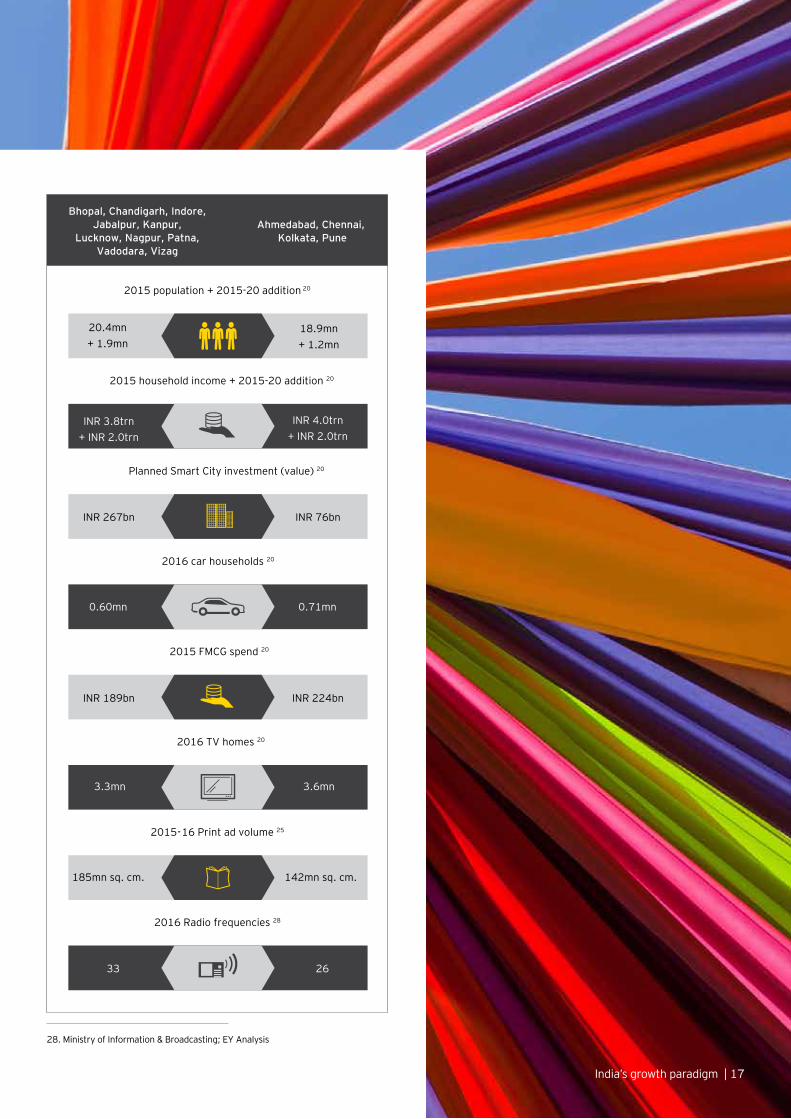
Bhopal, Chandigarh, Indore, Jabalpur, Kanpur,
Lucknow, Nagpur, Patna, Vadodara, Vizag
2015 population + 2015-20 addition 20
Ahmedabad, Chennai, Kolkata, Pune
2015 household income + 2015-20 addition 20
Planned Smart City investment (value) 20
2016 TV homes 20
2015-16 Print ad volume 25
2016 Radio frequencies 28
2015 FMCG spend 20
2016 car households 20
20.4mn + 1.9mn
18.9mn + 1.2mn
INR 4.0trn+ INR 2.0trn
INR 3.8trn+ INR 2.0trn
INR 267bn INR 76bn
0.60mn 0.71mn
INR 189bn INR 224bn
3.3mn 3.6mn
185mn sq. cm. 142mn sq. cm.
33 26
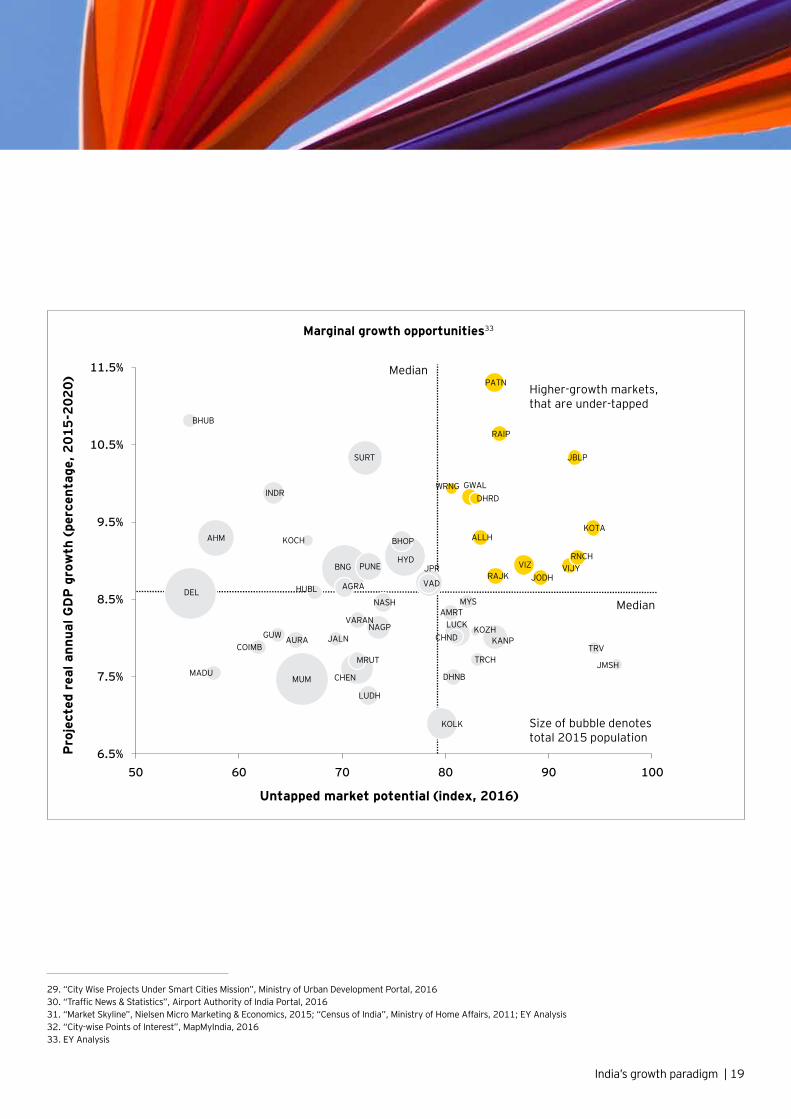
While the next thirty new wave cities by market value are typically smaller in size, they tend to also have the highest growth potential. To evaluate this potential, two elements have been assessed for each city- its GDP growth in the medium-term, and its untapped potential today (i.e. gap between demand-side consumption and supply-side penetration).
Cities highlighted in the top-right quadrant of the chart represent markets with the highest growth potential. Nearly all highlighted cities (Allahabad, Dehradun, Gwalior, Jodhpur, Kota, Raipur, Rajkot, Ranchi, Vijaywada and Warangal) belong to this group of thirty additional new wave markets.
Economic growth
The economic outlook in these ten cities is bright.
• Five cities have already secured funding from the Smart Cities Mission, with the value of planned projects in Raipur and Warangal particularly significant at INR 37bn and 29bn respectively29.
• Connectivity projects are also underway and are boosting economic linkages, with new airports in Allahabad and Dehradun becoming operationalized in recent years30.
• These markets also have favourable demographics. Over a fifth of each city is made up of 15-24 year olds, with Allahabad, Gwalior and Kota leading the way at ~23%31. The entry of this large youth demographic into the workforce promises a growing consumer base and further opportunities for businesses and marketers.
Untapped potential
These ten markets are also under-saturated, and there appear to be large gaps between local demand and supply across a range of sectors.
For instance, the high growth and potential of state capitals like Raipur, Ranchi and Dehradun have been singled out by industry experts in the BFSI and Education sectors. In addition, when compared to the overall universe of fifty cities in 2015, these ten markets held:
• 6.6% of expenditure on FMCG, but only 3.8% of retail outlets31,32
• 7.8% of expenditure on fashion & durables, but 6.1% of malls31,32
• 6.4% of total expenditure, but only 5.6% of telecom centres31,32
These gaps suggest significant scope for India Inc. to reach consumers that have been heretofore untapped.
18 | India’s growth paradigm
The greatest opportunities for marginal revenue growth lie in the 30 additional new wave cities
29. “City Wise Projects Under Smart Cities Mission”, Ministry of Urban Development Portal, 201630. “Traffic News & Statistics”, Airport Authority of India Portal, 201631. “Market Skyline”, Nielsen Micro Marketing & Economics, 2015; “Census of India”, Ministry of Home Affairs, 2011; EY Analysis32. “City-wise Points of Interest”, MapMyIndia, 201633. EY Analysis
DEL
BNG
MUM
HYD
CHEN
KOLK
JPRPUNE
SURT
AHM
VIZ
LUCKCHND
VAD
KANP
INDR
NAGP
PATN
BHOP
TRV
JBLP
VIJY
KOTA
RAIP
AMRT
LUDH
RAJK
RNCH
JODH
NASH
KOCH ALLH
GWALDHRD
MYS
JMSH
JALN
AGRA
BHUB
GUW AURACOIMB
VARAN
TRCHMRUT
DHNB
KOZH
MADU
HUBL
WRNG
6.5%
7.5%
8.5%
9.5%
10.5%
11.5%
50 60 70 80 90 100
Pro
ject
ed r
eal a
nnua
l GD
P g
row
th (
perc
enta
ge, 2
015-
2020
)
Untapped market potential (index, 2016)
Marginal growth opportunities33
Size of bubble denotes total 2015 population
Higher-growth markets, that are under-tapped
Median
Median
India’s growth paradigm | 19
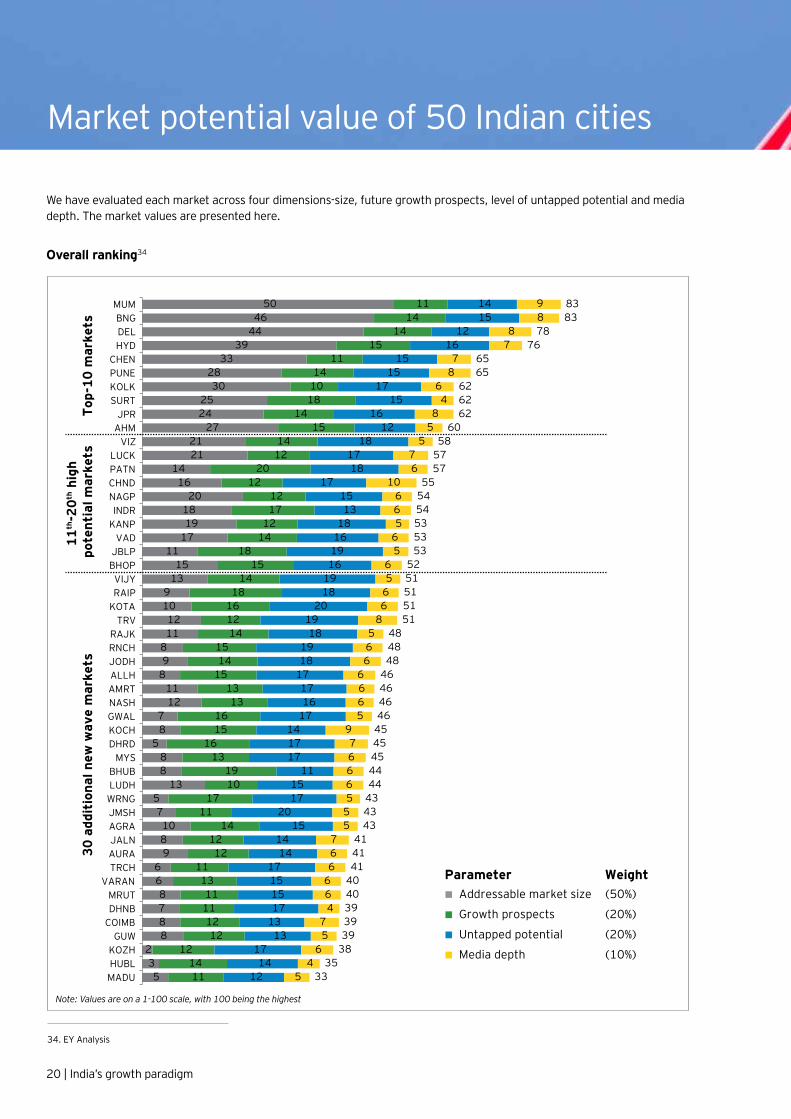
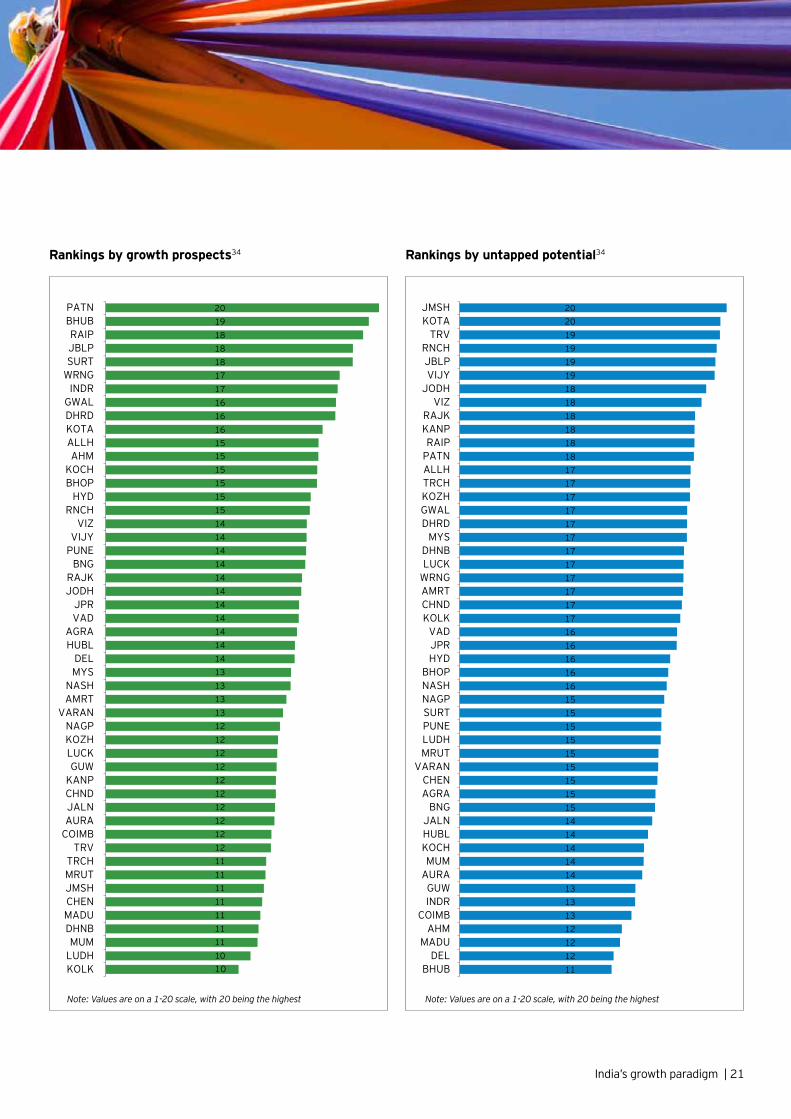
We have evaluated each market across four dimensions-size, future growth prospects, level of untapped potential and media depth. The market values are presented here.
Overall ranking34
Market potential value of 50 Indian cities
Parameter WeightAddressable market size (50%)
Growth prospects (20%)
Untapped potential (20%)
Media depth (10%)
11th
-20th
hig
h po
tent
ial m
arke
ts30
add
itio
nal n
ew w
ave
mar
kets
Top-
10 m
arke
ts
53
28878
66
9810
75
1388
587
1211
8981112
109
1315
11171918
2016
142121
272425
3028
3339
4446
50
1114
1212
121111
1311
1212
1411
171019
1316
1516
1313
1514
1514121618
1415
181412
1712
1220
1214
1514
181014
1115
1414
11
1214
1713
1317151517
1414
1520
1715
11171714
171617
171819
1819
20181916191618
1315
1718
1718
1216
1517
1515
1612
1514
54
657
466667
5556667
95666
665
86656
56566
1067
558
46
87
78
89
3335
383939394040414141
434343444445454546464646
484848
5151515152
535353545455
575758
60626262
6565
7678
8383
MADUHUBLKOZHGUW
COIMBDHNBMRUT
VARANTRCHAURAJALNAGRAJMSHWRNGLUDHBHUB
MYSDHRDKOCHGWALNASHAMRTALLHJODHRNCHRAJK
TRVKOTARAIPVIJY
BHOPJBLPVAD
KANPINDR
NAGPCHNDPATNLUCK
VIZAHMJPR
SURTKOLKPUNECHEN
HYDDELBNG
MUM
20 | India’s growth paradigm
34. EY Analysis
Note: Values are on a 1-100 scale, with 100 being the highest
Rankings by growth prospects34 Rankings by untapped potential34
India’s growth paradigm | 21
1112121213131314141414141515151515151515151616161616171717171717171717171717181818181818191919192020
BHUBDEL
MADUAHM
COIMBINDRGUW
AURAMUM
KOCHHUBLJALN
BNGAGRACHEN
VARANMRUTLUDHPUNESURTNAGPNASHBHOP
HYDJPRVAD
KOLKCHNDAMRTWRNGLUCKDHNB
MYSDHRDGWALKOZHTRCHALLHPATNRAIP
KANPRAJK
VIZJODHVIJYJBLPRNCH
TRVKOTAJMSH
1010111111111111111212121212121212121213131313141414141414141414141415151515151516161617171818181920
KOLKLUDHMUM
DHNBMADUCHENJMSHMRUTTRCH
TRVCOIMBAURAJALNCHNDKANPGUW
LUCKKOZHNAGP
VARANAMRTNASH
MYSDEL
HUBLAGRA
VADJPR
JODHRAJK
BNGPUNEVIJY
VIZRNCH
HYDBHOPKOCHAHM
ALLHKOTADHRDGWALINDR
WRNGSURTJBLPRAIP
BHUBPATN
Note: Values are on a 1-20 scale, with 20 being the highest Note: Values are on a 1-20 scale, with 20 being the highest

Untapped potential
3
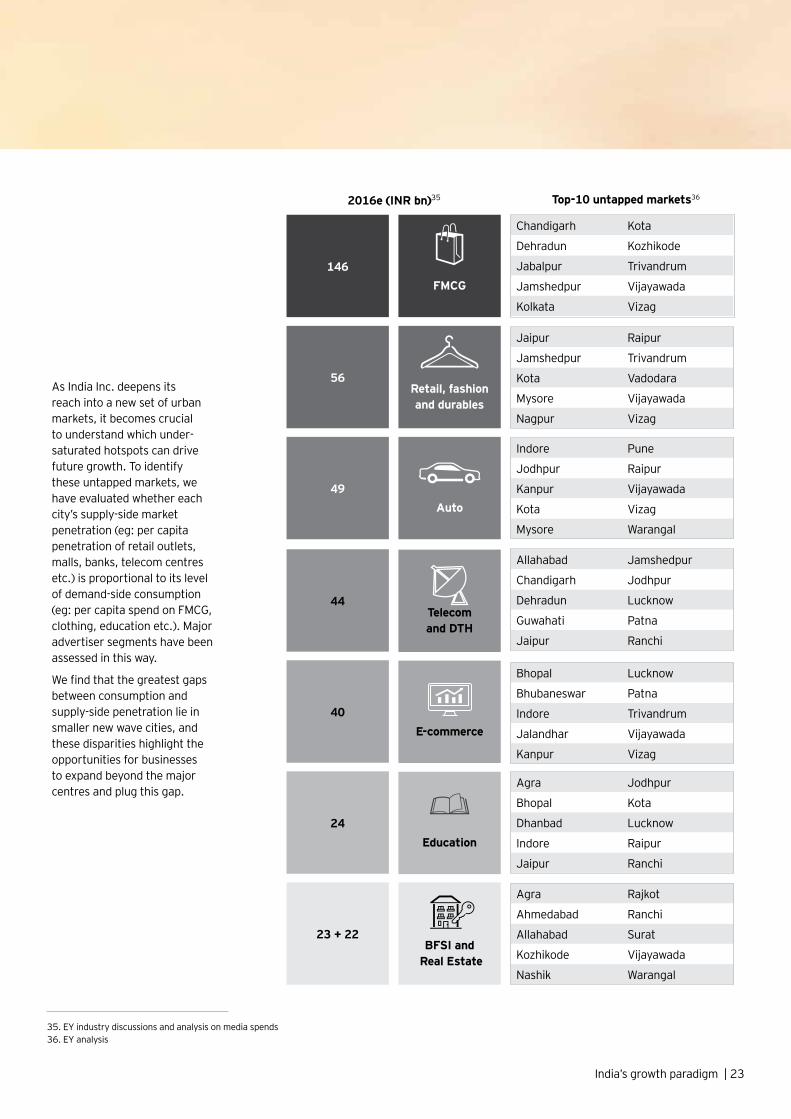
As India Inc. deepens its reach into a new set of urban markets, it becomes crucial to understand which under-saturated hotspots can drive future growth. To identify these untapped markets, we have evaluated whether each city’s supply-side market penetration (eg: per capita penetration of retail outlets, malls, banks, telecom centres etc.) is proportional to its level of demand-side consumption (eg: per capita spend on FMCG, clothing, education etc.). Major advertiser segments have been assessed in this way.
We find that the greatest gaps between consumption and supply-side penetration lie in smaller new wave cities, and these disparities highlight the opportunities for businesses to expand beyond the major centres and plug this gap.
India’s growth paradigm | 23
Retail, fashion and durables
Chandigarh Kota
Dehradun Kozhikode
Jabalpur Trivandrum
Jamshedpur Vijayawada
Kolkata Vizag
Allahabad Jamshedpur
Chandigarh Jodhpur
Dehradun Lucknow
Guwahati Patna
Jaipur Ranchi
Jaipur Raipur
Jamshedpur Trivandrum
Kota Vadodara
Mysore Vijayawada
Nagpur Vizag
Bhopal Lucknow
Bhubaneswar Patna
Indore Trivandrum
Jalandhar Vijayawada
Kanpur Vizag
Indore Pune
Jodhpur Raipur
Kanpur Vijayawada
Kota Vizag
Mysore Warangal
Agra Jodhpur
Bhopal Kota
Dhanbad Lucknow
Indore Raipur
Jaipur Ranchi
Agra Rajkot
Ahmedabad Ranchi
Allahabad Surat
Kozhikode Vijayawada
Nashik Warangal
BFSI and Real Estate
Telecom and DTH
E-commerce
Education
2016e (INR bn)35 Top-10 untapped markets36
FMCG146
49
40
56
44
24
23 + 22
Auto
35. EY industry discussions and analysis on media spends36. EY analysis
MUM
DEL
BNG
HYD
AHMSURT
CHEN
JPR
PUNE
KOLKVIZ
VIJY
KOTA
JBLP
CHND
TRV
JMSH
DHRD
KOZH
Size of bubble denotes total 2015 population
4
6
8
10
12
14
16
18
20
0 10 20 30 40 50 60 70 80
Ann
ual e
xpen
ditu
re p
er c
apit
a on
FM
CG
(IN
R 0
00s,
201
5)
Penetration of retail outlets (index, 2016)
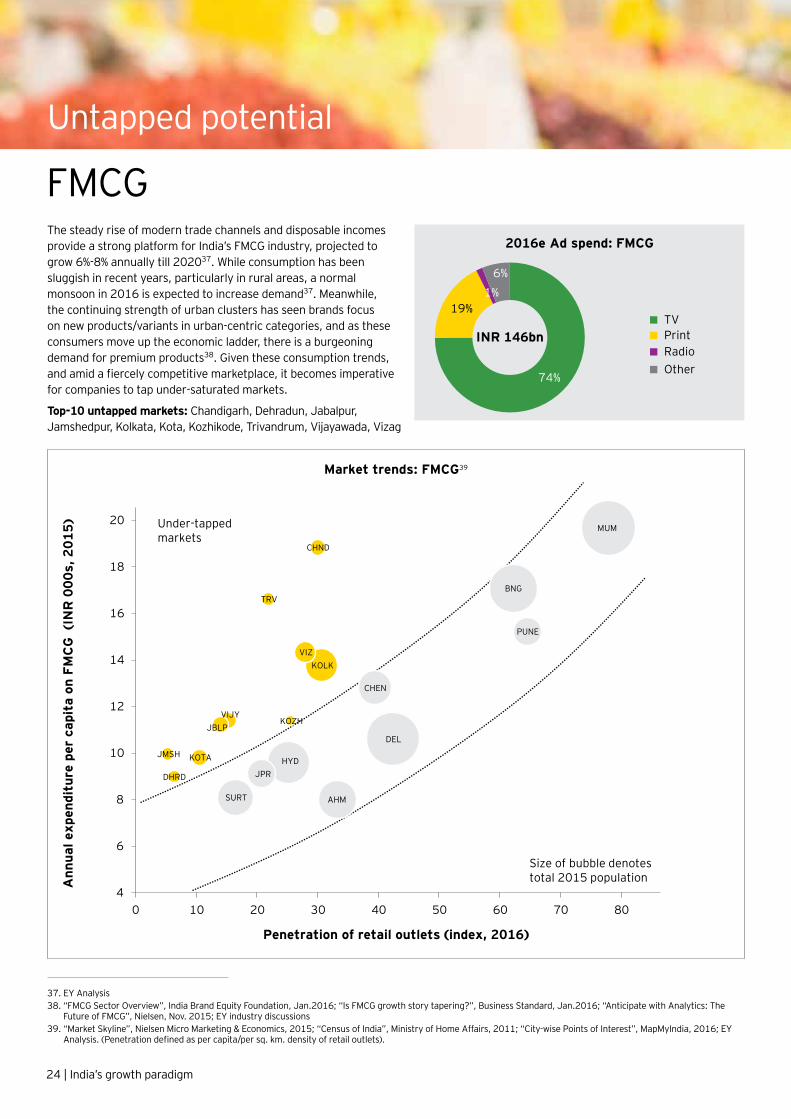
Market trends: FMCG39
Under-tapped markets
2016e Ad spend: FMCG
74%
19%1%
6%
INR 146bnTVPrintRadioOther
Untapped potential
The steady rise of modern trade channels and disposable incomes provide a strong platform for India’s FMCG industry, projected to grow 6%-8% annually till 202037. While consumption has been sluggish in recent years, particularly in rural areas, a normal monsoon in 2016 is expected to increase demand37. Meanwhile, the continuing strength of urban clusters has seen brands focus on new products/variants in urban-centric categories, and as these consumers move up the economic ladder, there is a burgeoning demand for premium products38. Given these consumption trends, and amid a fiercely competitive marketplace, it becomes imperative for companies to tap under-saturated markets.
Top-10 untapped markets: Chandigarh, Dehradun, Jabalpur, Jamshedpur, Kolkata, Kota, Kozhikode, Trivandrum, Vijayawada, Vizag
37. EY Analysis38. “FMCG Sector Overview”, India Brand Equity Foundation, Jan.2016; “Is FMCG growth story tapering?”, Business Standard, Jan.2016; “Anticipate with Analytics: The
Future of FMCG”, Nielsen, Nov. 2015; EY industry discussions39. “Market Skyline”, Nielsen Micro Marketing & Economics, 2015; “Census of India”, Ministry of Home Affairs, 2011; “City-wise Points of Interest”, MapMyIndia, 2016; EY
Analysis. (Penetration defined as per capita/per sq. km. density of retail outlets).
FMCG
24 | India’s growth paradigm
40. “Sales of Water, Soft Drinks, Non-Carbonated Drinks”, Nielsen Database, 2016
“The growing consumption power of urban India has led to two key trends in the industry-eating out and healthy foods. These have driven growth for us in categories like branded Basmati rice. Similarly, brown rice was unheard of 10 years ago, but as consumers became more health conscious, sales for this premium product rose ten-fold in just a few years. As consumers keep moving up the value chain and experimenting, alternative and higher-end categories will continue to drive growth.
While consumption patterns are similar across metros and Tier II/III markets, there is a stark gap on the supply-side. Given the strong footprint of modern retail in metros, and with new entrants typically focused on these cities, Tier II/III markets are under-saturated. With scope to expand, the share of shops covered by LT Foods’ distribution network in Tier II/III cities rose 2-3 times over the past five years. Given these trends, 42 Tier II/III markets’ share of our sales rose from 37% to 40% over a five-year period-with markets registering 3% higher annual growth relative to metros.”
“Various companies, finding metros and mini-metros saturated, have targeted rural areas at the bottom of the pyramid. In the process, many Tier II/III markets have been under-tapped. In fact, a recent study conducted by us showed continuing Tier II/III outlets had 10% higher growth y-o-y relative to metros. These cities are brimming with aspirational consumers, and the marketing of products centres around brand awareness and ‘consumer-pull’, relative to the ‘product-push’ approach in metros.
A similar market gap has emerged in distribution. Organized retail, which only contributes ~10% of the market, has faced issues with throughput, costly real estate and distribution for thousands of SKUs. This reality is not likely to change in the short to medium-term. However, there are opportunities to expand in smaller stores with monthly sales of INR 5-10 lakh. But this requires a shift in mindset-to move from the traditional focus on distribution costs to a focus on throughput and overall profit and loss.“
Vivek Chandra CEO, Global Brands Business
Abhinav Jain Founder and Director
LT Foods Ltd. Beacon Analytics
Coca-Cola Ltd.
Prashant Parameswaran Director, Marketing Strategy and Insights India
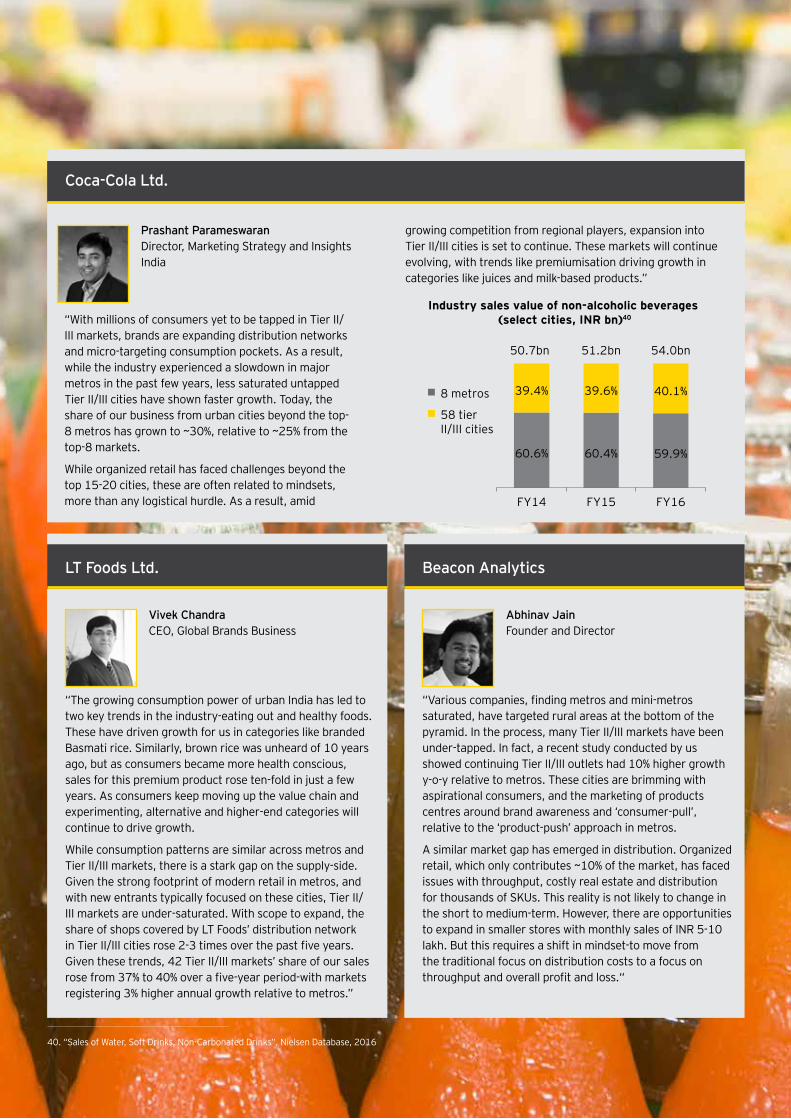
“With millions of consumers yet to be tapped in Tier II/III markets, brands are expanding distribution networks and micro-targeting consumption pockets. As a result, while the industry experienced a slowdown in major metros in the past few years, less saturated untapped Tier II/III cities have shown faster growth. Today, the share of our business from urban cities beyond the top-8 metros has grown to ~30%, relative to ~25% from the top-8 markets.
While organized retail has faced challenges beyond the top 15-20 cities, these are often related to mindsets, more than any logistical hurdle. As a result, amid
growing competition from regional players, expansion into Tier II/III cities is set to continue. These markets will continue evolving, with trends like premiumisation driving growth in categories like juices and milk-based products.”
8 metros
58 tier II/III cities
Industry sales value of non-alcoholic beverages (select cities, INR bn)40
60.6% 60.4% 59.9%
39.4% 39.6% 40.1%
FY14 FY15 FY16
50.7bn 54.0bn51.2bn
Untapped potential
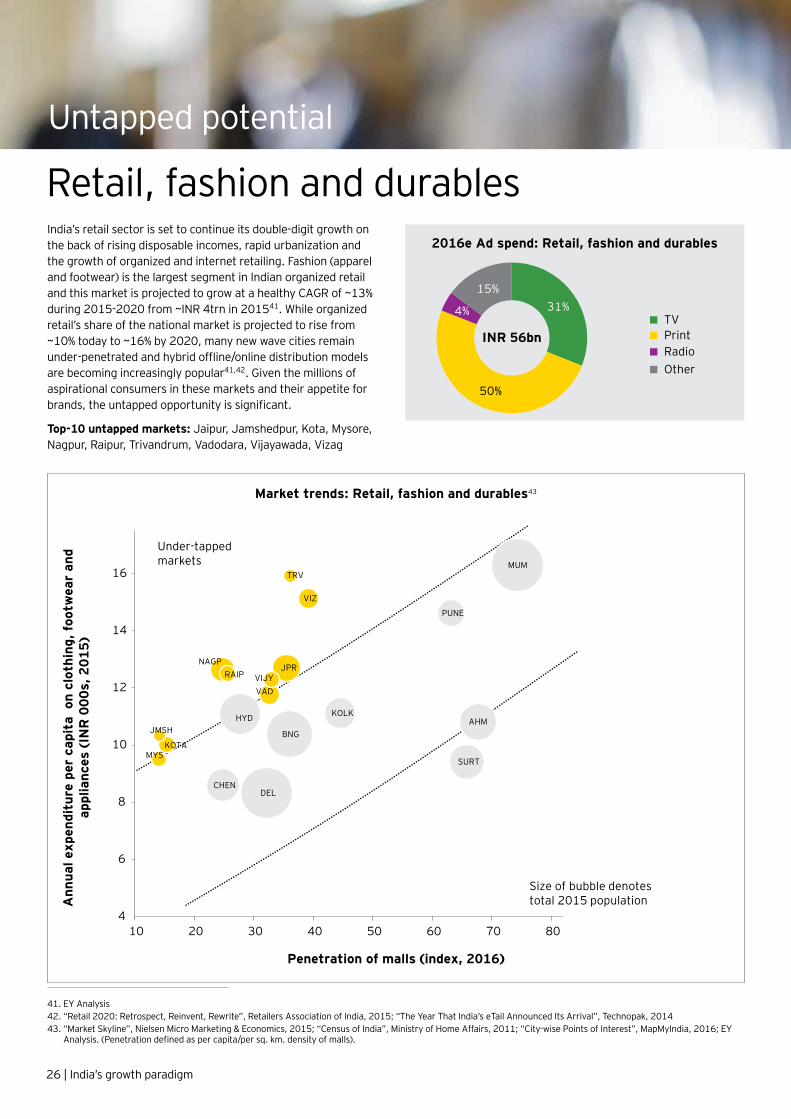
India’s retail sector is set to continue its double-digit growth on the back of rising disposable incomes, rapid urbanization and the growth of organized and internet retailing. Fashion (apparel and footwear) is the largest segment in Indian organized retail and this market is projected to grow at a healthy CAGR of ~13% during 2015-2020 from ~INR 4trn in 201541. While organized retail’s share of the national market is projected to rise from ~10% today to ~16% by 2020, many new wave cities remain under-penetrated and hybrid offline/online distribution models are becoming increasingly popular41,42. Given the millions of aspirational consumers in these markets and their appetite for brands, the untapped opportunity is significant.
Top-10 untapped markets: Jaipur, Jamshedpur, Kota, Mysore, Nagpur, Raipur, Trivandrum, Vadodara, Vijayawada, Vizag
Under-tapped markets MUM
DEL
BNG
HYD AHM
SURT
CHEN
KOLK
PUNE
JPRNAGP
VIZ
VADVIJYRAIP
KOTAMYS
TRV
JMSH
-
4
6
8
10
12
14
16
10 20 30 40 50 60 70 80
Size of bubble denotes total 2015 populationA
nnua
l exp
endi
ture
per
cap
ita
on
clot
hing
, foo
twea
r an
dap
plia
nces
(IN
R 0
00s,
201
5)
Penetration of malls (index, 2016)
Market trends: Retail, fashion and durables43
41. EY Analysis42. “Retail 2020: Retrospect, Reinvent, Rewrite”, Retailers Association of India, 2015; “The Year That India’s eTail Announced Its Arrival”, Technopak, 201443. “Market Skyline”, Nielsen Micro Marketing & Economics, 2015; “Census of India”, Ministry of Home Affairs, 2011; “City-wise Points of Interest”, MapMyIndia, 2016; EY
Analysis. (Penetration defined as per capita/per sq. km. density of malls).
2016e Ad spend: Retail, fashion and durables
31%
50%
4%
15%
INR 56bnTVPrintRadioOther
Retail, fashion and durables
26 | India’s growth paradigm
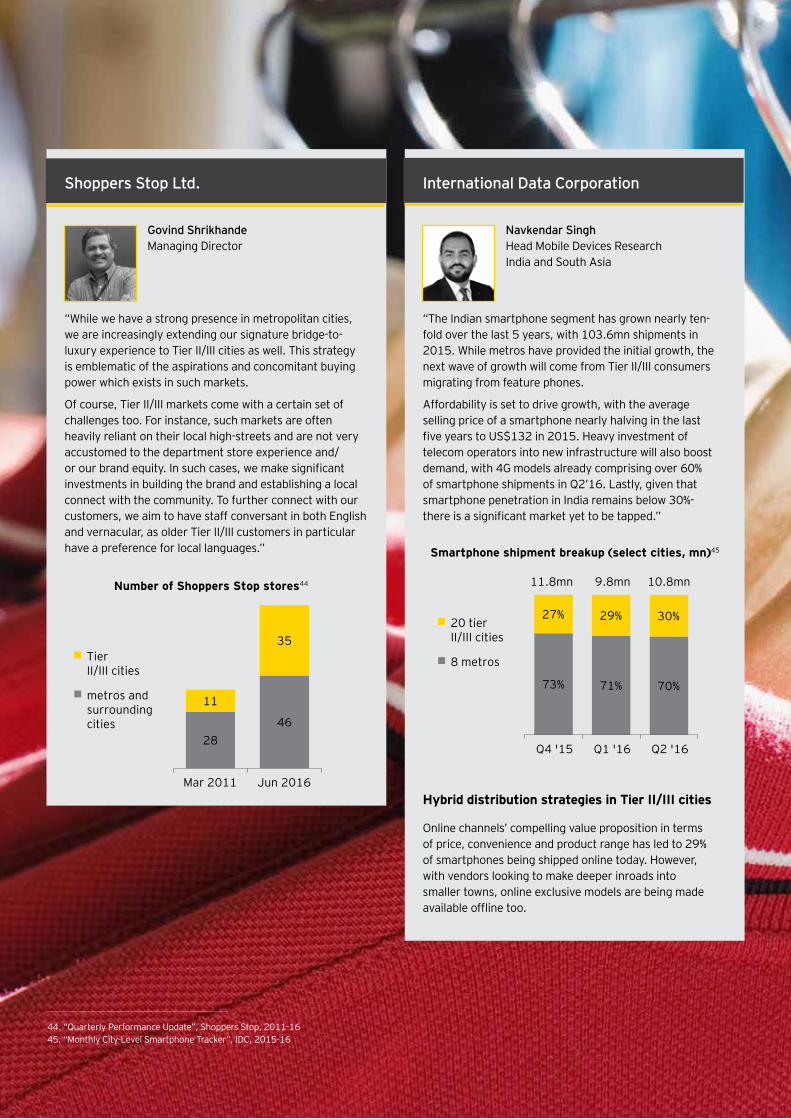
“The Indian smartphone segment has grown nearly ten-fold over the last 5 years, with 103.6mn shipments in 2015. While metros have provided the initial growth, the next wave of growth will come from Tier II/III consumers migrating from feature phones.
Affordability is set to drive growth, with the average selling price of a smartphone nearly halving in the last five years to US$132 in 2015. Heavy investment of telecom operators into new infrastructure will also boost demand, with 4G models already comprising over 60% of smartphone shipments in Q2’16. Lastly, given that smartphone penetration in India remains below 30%- there is a significant market yet to be tapped.”
“While we have a strong presence in metropolitan cities, we are increasingly extending our signature bridge-to-luxury experience to Tier II/III cities as well. This strategy is emblematic of the aspirations and concomitant buying power which exists in such markets.
Of course, Tier II/III markets come with a certain set of challenges too. For instance, such markets are often heavily reliant on their local high-streets and are not very accustomed to the department store experience and/or our brand equity. In such cases, we make significant investments in building the brand and establishing a local connect with the community. To further connect with our customers, we aim to have staff conversant in both English and vernacular, as older Tier II/III customers in particular have a preference for local languages.”
Govind Shrikhande Managing Director
Navkendar Singh Head Mobile Devices Research India and South Asia
Hybrid distribution strategies in Tier II/III cities
Online channels’ compelling value proposition in terms of price, convenience and product range has led to 29% of smartphones being shipped online today. However, with vendors looking to make deeper inroads into smaller towns, online exclusive models are being made available offline too.
International Data CorporationShoppers Stop Ltd.
Tier II/III cities
metros and surrounding cities
Number of Shoppers Stop stores44
2846
11
35
Mar 2011 Jun 2016
20 tier II/III cities
8 metros
Smartphone shipment breakup (select cities, mn)45
73% 71% 70%
27% 29% 30%
11.8mn 9.8mn 10.8mn
Q4 '15 Q1 '16 Q2 '16
44. “Quarterly Performance Update”, Shoppers Stop, 2011-1645. “Monthly City-Level Smartphone Tracker”, IDC, 2015-16
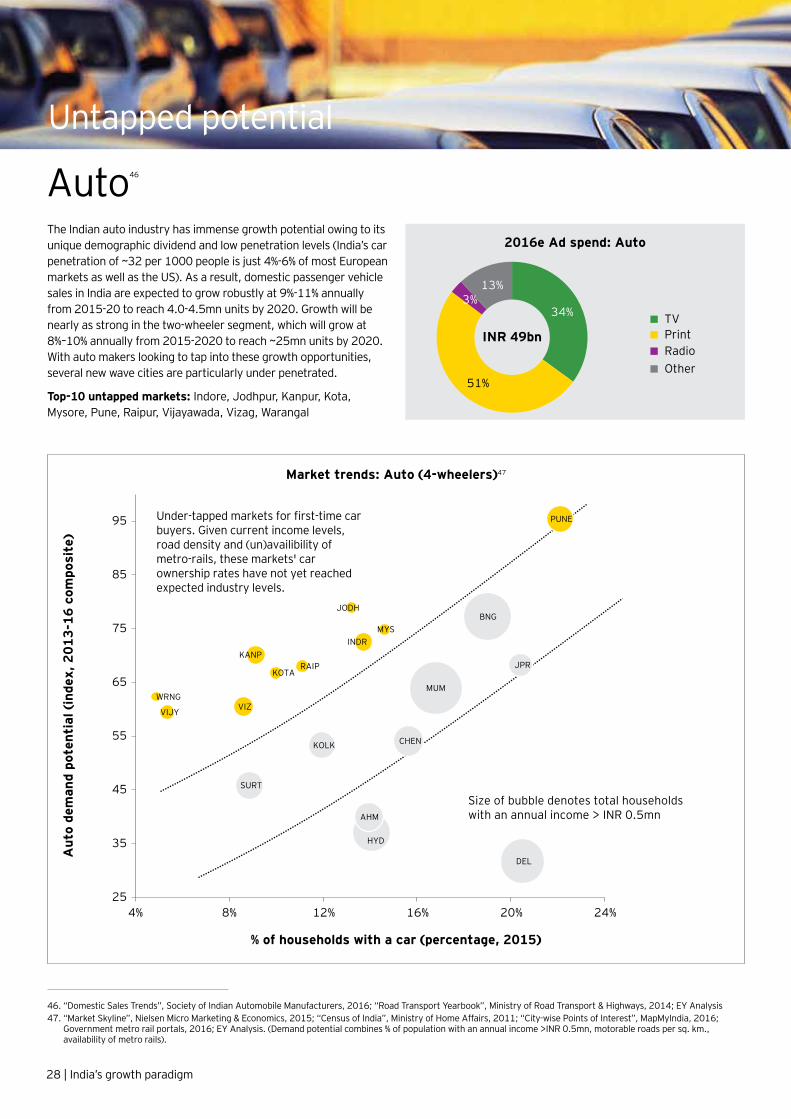
Untapped potential
The Indian auto industry has immense growth potential owing to its unique demographic dividend and low penetration levels (India’s car penetration of ~32 per 1000 people is just 4%-6% of most European markets as well as the US). As a result, domestic passenger vehicle sales in India are expected to grow robustly at 9%-11% annually from 2015-20 to reach 4.0-4.5mn units by 2020. Growth will be nearly as strong in the two-wheeler segment, which will grow at 8%–10% annually from 2015-2020 to reach ~25mn units by 2020. With auto makers looking to tap into these growth opportunities, several new wave cities are particularly under penetrated.
Top-10 untapped markets: Indore, Jodhpur, Kanpur, Kota, Mysore, Pune, Raipur, Vijayawada, Vizag, Warangal
MUM
BNG
DEL
HYD
CHEN
AHM
SURT
KOLK
JPR
PUNE
VIZ
KANPINDR
VIJY
RAIPKOTA
JODH
MYS
WRNG
Size of bubble denotes total households with an annual income > INR 0.5mn
Aut
o de
man
d po
tent
ial (
inde
x, 2
013-
16 c
ompo
site
)
% of households with a car (percentage, 2015)
Market trends: Auto (4-wheelers)47
Under-tapped markets for first-time car buyers. Given current income levels, road density and (un)availibility of metro-rails, these markets' car ownership rates have not yet reached expected industry levels.
25
35
45
55
65
75
85
95
4% 8% 12% 16% 20% 24%
46. “Domestic Sales Trends”, Society of Indian Automobile Manufacturers, 2016; “Road Transport Yearbook”, Ministry of Road Transport & Highways, 2014; EY Analysis47. “Market Skyline”, Nielsen Micro Marketing & Economics, 2015; “Census of India”, Ministry of Home Affairs, 2011; “City-wise Points of Interest”, MapMyIndia, 2016;
Government metro rail portals, 2016; EY Analysis. (Demand potential combines % of population with an annual income >INR 0.5mn, motorable roads per sq. km., availability of metro rails).
2016e Ad spend: Auto
34%
51%
3%13%
INR 49bnTVPrintRadioOther
Auto46
28 | India’s growth paradigm
48. “Luxury car sales to double by 2020- IHS Automotive”, Business Standard, Feb.2016; “Audi targets Tier II/III cities to spur growth”, ET, Jun.2016; “Luxury carmakers drive down new retail ways”, Business Standard, Aug.2016; EY industry discussions 49. “Market Skyline”, Nielsen Micro Marketing & Economics, 2015; EY Analysis
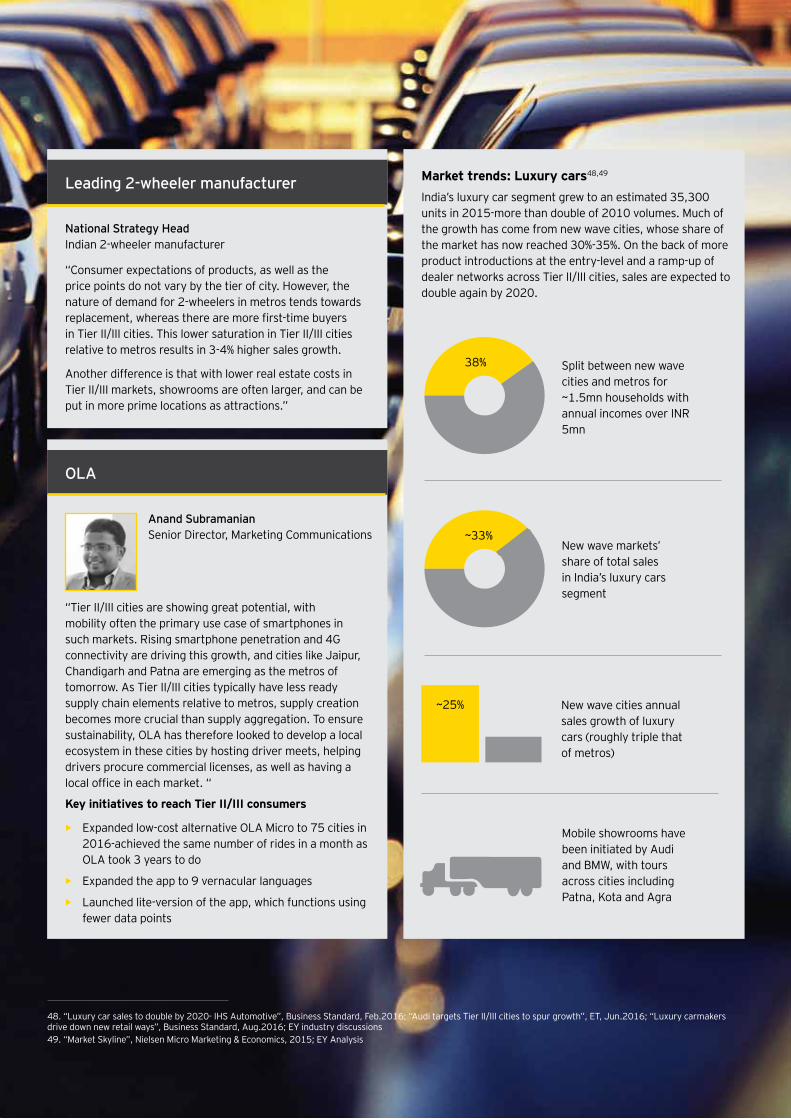
Leading 2-wheeler manufacturer
“Consumer expectations of products, as well as the price points do not vary by the tier of city. However, the nature of demand for 2-wheelers in metros tends towards replacement, whereas there are more first-time buyers in Tier II/III cities. This lower saturation in Tier II/III cities relative to metros results in 3-4% higher sales growth.
Another difference is that with lower real estate costs in Tier II/III markets, showrooms are often larger, and can be put in more prime locations as attractions.”
National Strategy Head Indian 2-wheeler manufacturer
“Tier II/III cities are showing great potential, with mobility often the primary use case of smartphones in such markets. Rising smartphone penetration and 4G connectivity are driving this growth, and cities like Jaipur, Chandigarh and Patna are emerging as the metros of tomorrow. As Tier II/III cities typically have less ready supply chain elements relative to metros, supply creation becomes more crucial than supply aggregation. To ensure sustainability, OLA has therefore looked to develop a local ecosystem in these cities by hosting driver meets, helping drivers procure commercial licenses, as well as having a local office in each market. “
OLA
Key initiatives to reach Tier II/III consumers
• Expanded low-cost alternative OLA Micro to 75 cities in 2016-achieved the same number of rides in a month as OLA took 3 years to do
• Expanded the app to 9 vernacular languages
• Launched lite-version of the app, which functions using fewer data points
Anand Subramanian Senior Director, Marketing Communications
Market trends: Luxury cars48,49
India’s luxury car segment grew to an estimated 35,300 units in 2015-more than double of 2010 volumes. Much of the growth has come from new wave cities, whose share of the market has now reached 30%-35%. On the back of more product introductions at the entry-level and a ramp-up of dealer networks across Tier II/III cities, sales are expected to double again by 2020.
Mobile showrooms have been initiated by Audi and BMW, with tours across cities including Patna, Kota and Agra
New wave markets’ share of total sales in India’s luxury cars segment
~33%
New wave cities annual sales growth of luxury cars (roughly triple that of metros)
~25%
Split between new wave cities and metros for ~1.5mn households with annual incomes over INR 5mn
38%
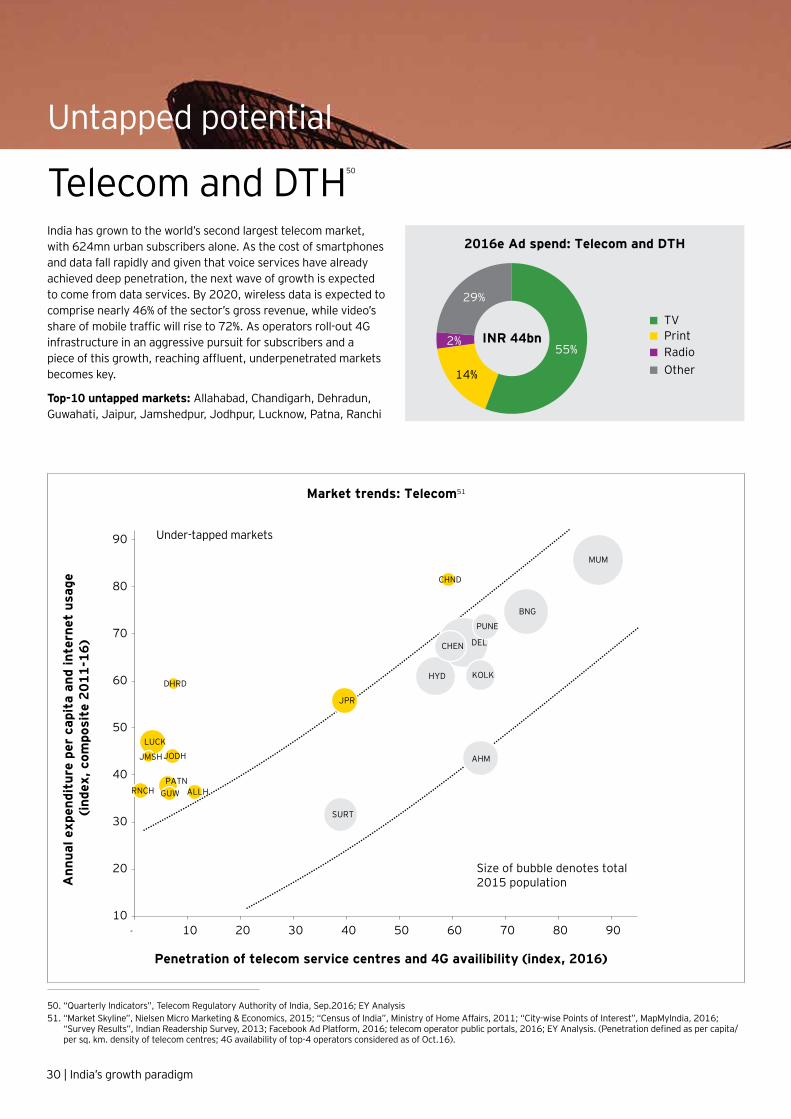
Untapped potential
India has grown to the world’s second largest telecom market, with 624mn urban subscribers alone. As the cost of smartphones and data fall rapidly and given that voice services have already achieved deep penetration, the next wave of growth is expected to come from data services. By 2020, wireless data is expected to comprise nearly 46% of the sector’s gross revenue, while video’s share of mobile traffic will rise to 72%. As operators roll-out 4G infrastructure in an aggressive pursuit for subscribers and a piece of this growth, reaching affluent, underpenetrated markets becomes key.
Top-10 untapped markets: Allahabad, Chandigarh, Dehradun, Guwahati, Jaipur, Jamshedpur, Jodhpur, Lucknow, Patna, Ranchi
MUM
DEL
BNG
HYD
AHM
SURT
CHEN
KOLK
PUNE
JPR
LUCK
PATNALLHRNCH
JODH
GUW
CHND
JMSH
DHRD
-
Size of bubble denotes total 2015 populationA
nnua
l exp
endi
ture
per
cap
ita
and
inte
rnet
usa
ge
(inde
x, c
ompo
site
201
1-16
)
Penetration of telecom service centres and 4G availibility (index, 2016)
Market trends: Telecom51
Under-tapped markets
10
20
30
40
50
60
70
80
90
10 20 30 40 50 60 70 80 90
50. “Quarterly Indicators”, Telecom Regulatory Authority of India, Sep.2016; EY Analysis51. “Market Skyline”, Nielsen Micro Marketing & Economics, 2015; “Census of India”, Ministry of Home Affairs, 2011; “City-wise Points of Interest”, MapMyIndia, 2016;
“Survey Results”, Indian Readership Survey, 2013; Facebook Ad Platform, 2016; telecom operator public portals, 2016; EY Analysis. (Penetration defined as per capita/per sq. km. density of telecom centres; 4G availability of top-4 operators considered as of Oct.16).
2016e Ad spend: Telecom and DTH
55%
14%
2%
29%
INR 44bnTVPrintRadioOther
Telecom and DTH50
30 | India’s growth paradigm
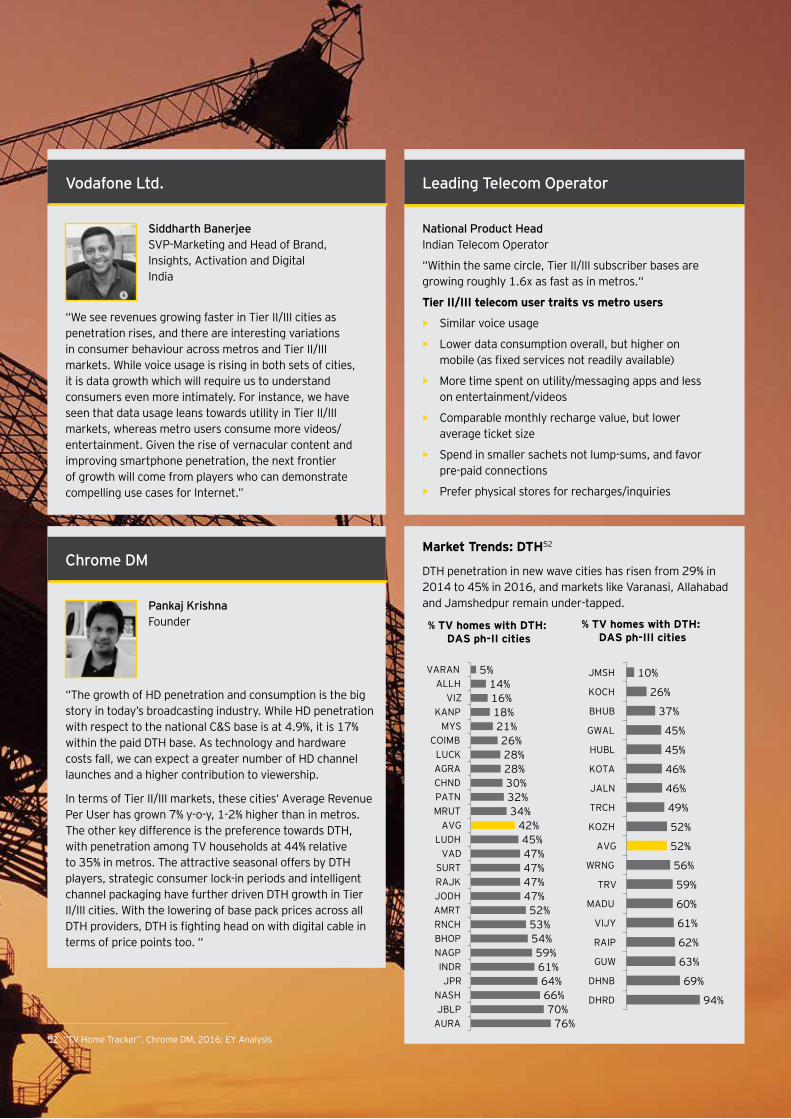
“Within the same circle, Tier II/III subscriber bases are growing roughly 1.6x as fast as in metros.“
Tier II/III telecom user traits vs metro users
• Similar voice usage
• Lower data consumption overall, but higher on mobile (as fixed services not readily available)
• More time spent on utility/messaging apps and less on entertainment/videos
• Comparable monthly recharge value, but lower average ticket size
• Spend in smaller sachets not lump-sums, and favor pre-paid connections
• Prefer physical stores for recharges/inquiries
Leading Telecom Operator
National Product Head Indian Telecom Operator
“We see revenues growing faster in Tier II/III cities as penetration rises, and there are interesting variations in consumer behaviour across metros and Tier II/III markets. While voice usage is rising in both sets of cities, it is data growth which will require us to understand consumers even more intimately. For instance, we have seen that data usage leans towards utility in Tier II/III markets, whereas metro users consume more videos/ entertainment. Given the rise of vernacular content and improving smartphone penetration, the next frontier of growth will come from players who can demonstrate compelling use cases for Internet.”
Vodafone Ltd.
Siddharth Banerjee SVP-Marketing and Head of Brand, Insights, Activation and Digital India
“The growth of HD penetration and consumption is the big story in today’s broadcasting industry. While HD penetration with respect to the national C&S base is at 4.9%, it is 17% within the paid DTH base. As technology and hardware costs fall, we can expect a greater number of HD channel launches and a higher contribution to viewership.
In terms of Tier II/III markets, these cities‘ Average Revenue Per User has grown 7% y-o-y, 1-2% higher than in metros. The other key difference is the preference towards DTH, with penetration among TV households at 44% relative to 35% in metros. The attractive seasonal offers by DTH players, strategic consumer lock-in periods and intelligent channel packaging have further driven DTH growth in Tier II/III cities. With the lowering of base pack prices across all DTH providers, DTH is fighting head on with digital cable in terms of price points too. “
Chrome DM
Pankaj Krishna Founder
Market Trends: DTH52
DTH penetration in new wave cities has risen from 29% in 2014 to 45% in 2016, and markets like Varanasi, Allahabad and Jamshedpur remain under-tapped.
94%
69%
63%
62%
61%
60%
59%
56%
52%
52%
49%
46%
46%
45%
45%
37%
26%
10%
DHRD
DHNB
GUW
RAIP
VIJY
MADU
TRV
WRNG
AVG
KOZH
TRCH
JALN
KOTA
HUBL
GWAL
BHUB
KOCH
JMSH
% TV homes with DTH: DAS ph-III cities
76%70%
66%64%
61%59%
54%53%52%
47%47%47%47%45%
42%34%32%30%28%28%26%
21%18%16%14%
5%
AURAJBLP
NASHJPR
INDRNAGPBHOPRNCHAMRTJODHRAJKSURT
VADLUDH
AVGMRUTPATNCHNDAGRALUCK
COIMBMYS
KANPVIZ
ALLHVARAN
% TV homes with DTH: DAS ph-II cities
52. “TV Home Tracker”, Chrome DM, 2016; EY Analysis
Untapped potential
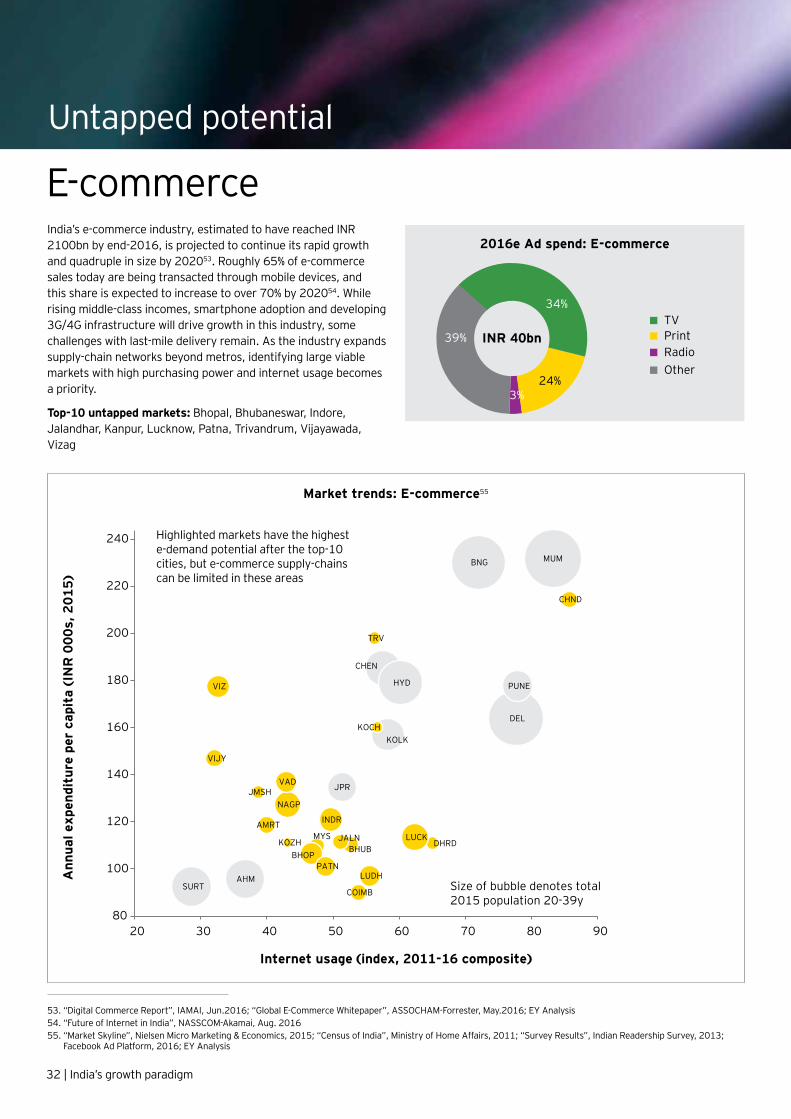
India’s e-commerce industry, estimated to have reached INR 2100bn by end-2016, is projected to continue its rapid growth and quadruple in size by 202053. Roughly 65% of e-commerce sales today are being transacted through mobile devices, and this share is expected to increase to over 70% by 202054. While rising middle-class incomes, smartphone adoption and developing 3G/4G infrastructure will drive growth in this industry, some challenges with last-mile delivery remain. As the industry expands supply-chain networks beyond metros, identifying large viable markets with high purchasing power and internet usage becomes a priority.
Top-10 untapped markets: Bhopal, Bhubaneswar, Indore, Jalandhar, Kanpur, Lucknow, Patna, Trivandrum, Vijayawada, Vizag
AHM
BNG
CHEN
DEL
HYD
JPR
KOLK
MUM
PUNE
SURT
AMRT
CHND
DHRD
LUDH
MYS
NAGP
VAD
COIMB
KOZHBHOP
BHUB
INDR
JALN
JMSH
KOCH
LUCK
PATN
TRV
VIJY
VIZ
80
100
120
140
160
180
200
220
240
20 30 40 50 60 70 80 90
Size of bubble denotes total 2015 population 20-39y
Ann
ual e
xpen
ditu
re p
er c
apit
a (I
NR
000
s, 2
015)
Internet usage (index, 2011-16 composite)
Market trends: E-commerce55
Highlighted markets have the highest e-demand potential after the top-10 cities, but e-commerce supply-chains can be limited in these areas
53. “Digital Commerce Report”, IAMAI, Jun.2016; “Global E-Commerce Whitepaper”, ASSOCHAM-Forrester, May.2016; EY Analysis54. “Future of Internet in India”, NASSCOM-Akamai, Aug. 201655. “Market Skyline”, Nielsen Micro Marketing & Economics, 2015; “Census of India”, Ministry of Home Affairs, 2011; “Survey Results”, Indian Readership Survey, 2013;
Facebook Ad Platform, 2016; EY Analysis
2016e Ad spend: E-commerce
24%3%
39% INR 40bnTVPrintRadioOther
34%
E-commerce
32 | India’s growth paradigm
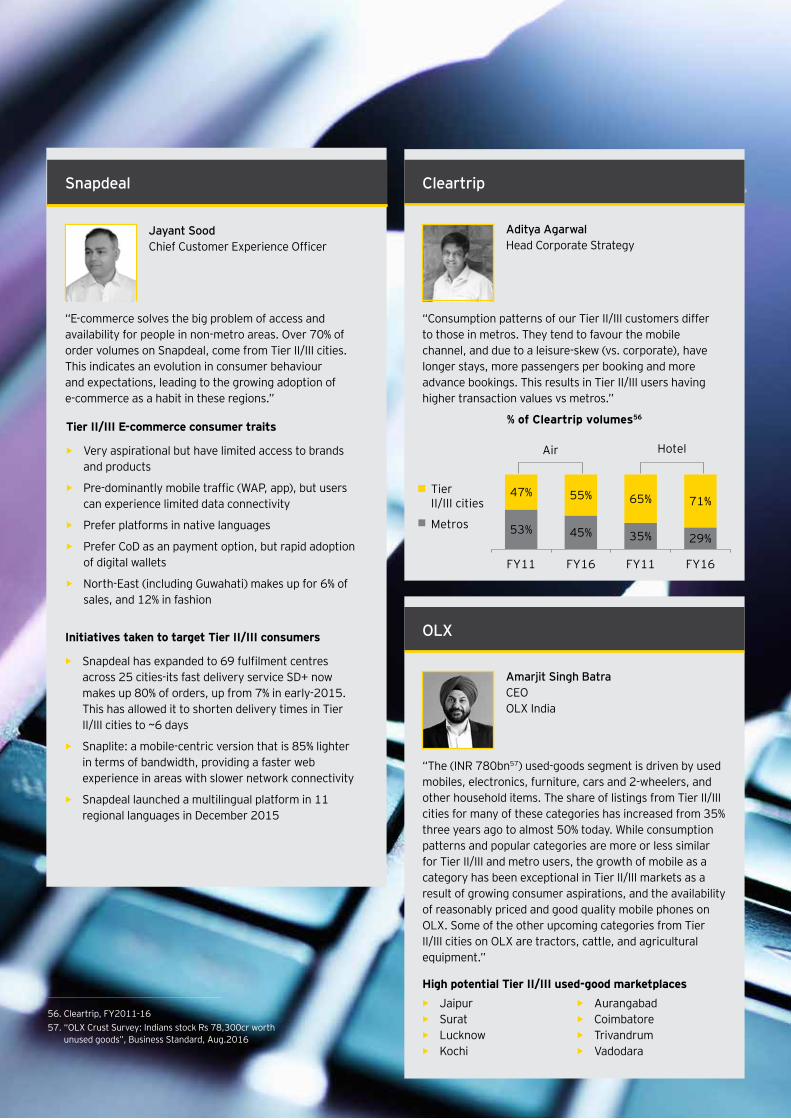
“E-commerce solves the big problem of access and availability for people in non-metro areas. Over 70% of order volumes on Snapdeal, come from Tier II/III cities. This indicates an evolution in consumer behaviour and expectations, leading to the growing adoption of e-commerce as a habit in these regions.”
Initiatives taken to target Tier II/III consumers
• Snapdeal has expanded to 69 fulfilment centres across 25 cities-its fast delivery service SD+ now makes up 80% of orders, up from 7% in early-2015. This has allowed it to shorten delivery times in Tier II/III cities to ~6 days
• Snaplite: a mobile-centric version that is 85% lighter in terms of bandwidth, providing a faster web experience in areas with slower network connectivity
• Snapdeal launched a multilingual platform in 11 regional languages in December 2015
Tier II/III E-commerce consumer traits
• Very aspirational but have limited access to brands and products
• Pre-dominantly mobile traffic (WAP, app), but users can experience limited data connectivity
• Prefer platforms in native languages
• Prefer CoD as an payment option, but rapid adoption of digital wallets
• North-East (including Guwahati) makes up for 6% of sales, and 12% in fashion
“Consumption patterns of our Tier II/III customers differ to those in metros. They tend to favour the mobile channel, and due to a leisure-skew (vs. corporate), have longer stays, more passengers per booking and more advance bookings. This results in Tier II/III users having higher transaction values vs metros.”
Snapdeal Cleartrip
Jayant Sood Chief Customer Experience Officer
Aditya Agarwal Head Corporate Strategy
“The (INR 780bn57) used-goods segment is driven by used mobiles, electronics, furniture, cars and 2-wheelers, and other household items. The share of listings from Tier II/III cities for many of these categories has increased from 35% three years ago to almost 50% today. While consumption patterns and popular categories are more or less similar for Tier II/III and metro users, the growth of mobile as a category has been exceptional in Tier II/III markets as a result of growing consumer aspirations, and the availability of reasonably priced and good quality mobile phones on OLX. Some of the other upcoming categories from Tier II/III cities on OLX are tractors, cattle, and agricultural equipment.”
OLX
Amarjit Singh Batra CEO OLX India
High potential Tier II/III used-good marketplaces
• Jaipur• Surat• Lucknow• Kochi
• Aurangabad• Coimbatore • Trivandrum• Vadodara
56. Cleartrip, FY2011-1657. “OLX Crust Survey: Indians stock Rs 78,300cr worth
unused goods”, Business Standard, Aug.2016
Metros
Tier II/III cities
% of Cleartrip volumes56
53% 45%
47% 55% 65% 71%
Air Hotel
35% 29%
FY11 FY16 FY11 FY16
Untapped potential
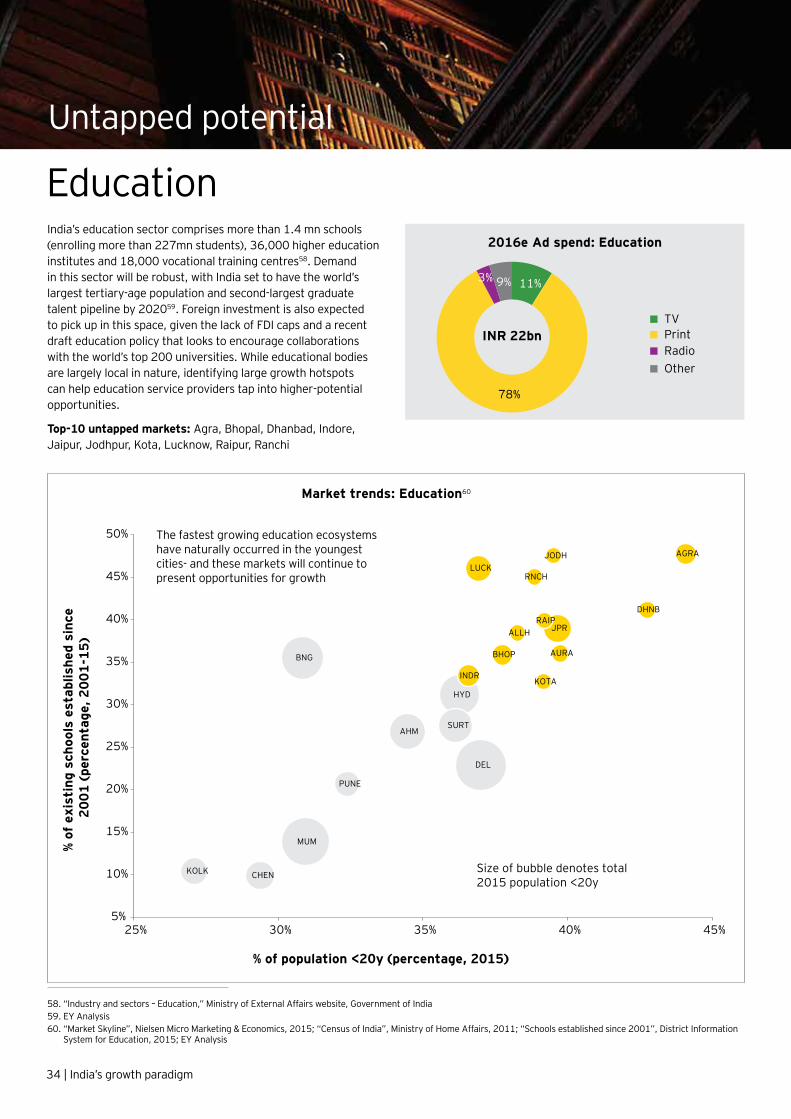
India’s education sector comprises more than 1.4 mn schools (enrolling more than 227mn students), 36,000 higher education institutes and 18,000 vocational training centres58. Demand in this sector will be robust, with India set to have the world’s largest tertiary-age population and second-largest graduate talent pipeline by 202059. Foreign investment is also expected to pick up in this space, given the lack of FDI caps and a recent draft education policy that looks to encourage collaborations with the world’s top 200 universities. While educational bodies are largely local in nature, identifying large growth hotspots can help education service providers tap into higher-potential opportunities.
Top-10 untapped markets: Agra, Bhopal, Dhanbad, Indore, Jaipur, Jodhpur, Kota, Lucknow, Raipur, Ranchi
DEL
MUM
BNG
HYD
AHMSURT
CHEN
JPR
KOLK
PUNE
LUCK
INDR
AGRA
BHOP AURA
DHNB
RNCH
RAIPALLH
KOTA
JODH
Size of bubble denotes total 2015 population <20y
% of
exi
stin
g sc
hool
s es
tabl
ishe
d si
nce
2001
(pe
rcen
tage
, 200
1-15
)
% of population <20y (percentage, 2015)
Market trends: Education60
The fastest growing education ecosystems have naturally occurred in the youngest cities- and these markets will continue to present opportunities for growth
5%
10%
15%
20%
25%
30%
35%
40%
45%
50%
25% 30% 35% 40% 45%
58. “Industry and sectors – Education,” Ministry of External Affairs website, Government of India59. EY Analysis60. “Market Skyline”, Nielsen Micro Marketing & Economics, 2015; “Census of India”, Ministry of Home Affairs, 2011; “Schools established since 2001”, District Information
System for Education, 2015; EY Analysis
2016e Ad spend: Education
11%
78%
3% 9%
INR 22bnTVPrintRadioOther
Education
34 | India’s growth paradigm
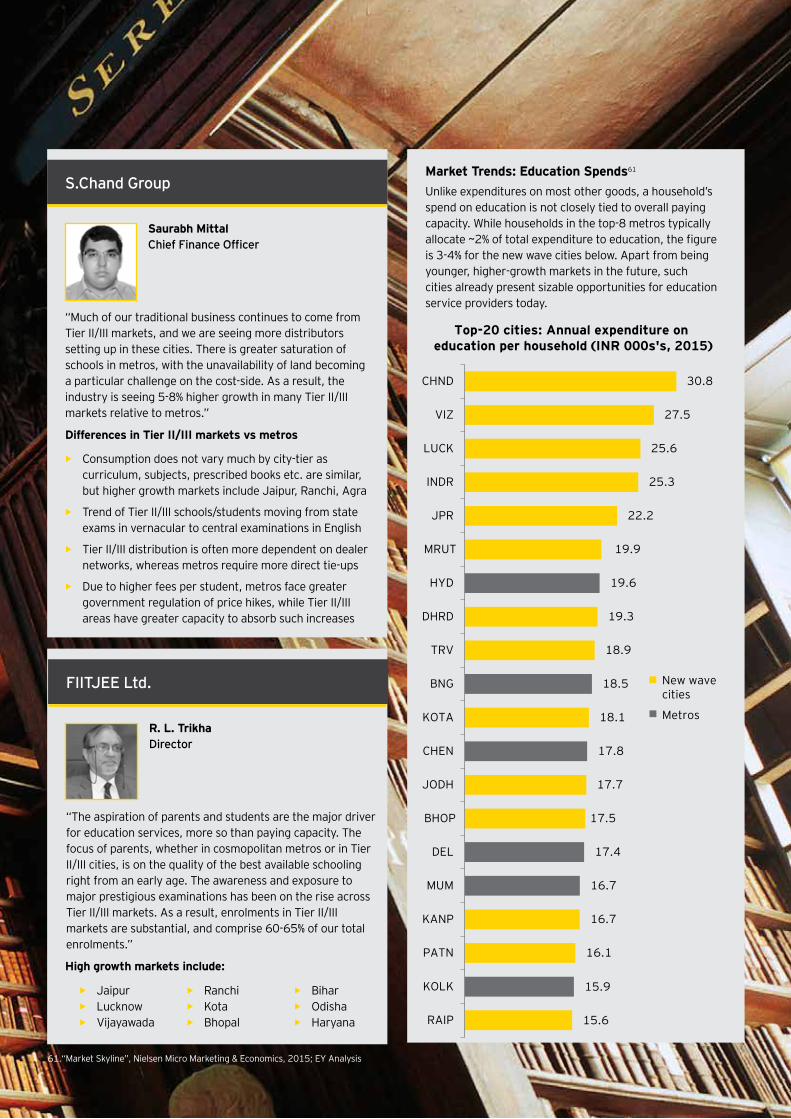
“Much of our traditional business continues to come from Tier II/III markets, and we are seeing more distributors setting up in these cities. There is greater saturation of schools in metros, with the unavailability of land becoming a particular challenge on the cost-side. As a result, the industry is seeing 5-8% higher growth in many Tier II/III markets relative to metros.”
S.Chand Group
Saurabh Mittal Chief Finance Officer
Differences in Tier II/III markets vs metros
• Consumption does not vary much by city-tier as curriculum, subjects, prescribed books etc. are similar, but higher growth markets include Jaipur, Ranchi, Agra
• Trend of Tier II/III schools/students moving from state exams in vernacular to central examinations in English
• Tier II/III distribution is often more dependent on dealer networks, whereas metros require more direct tie-ups
• Due to higher fees per student, metros face greater government regulation of price hikes, while Tier II/III areas have greater capacity to absorb such increases
“The aspiration of parents and students are the major driver for education services, more so than paying capacity. The focus of parents, whether in cosmopolitan metros or in Tier II/III cities, is on the quality of the best available schooling right from an early age. The awareness and exposure to major prestigious examinations has been on the rise across Tier II/III markets. As a result, enrolments in Tier II/III markets are substantial, and comprise 60-65% of our total enrolments.”
FIITJEE Ltd.
R. L. Trikha Director
High growth markets include:
Market Trends: Education Spends61
Unlike expenditures on most other goods, a household’s spend on education is not closely tied to overall paying capacity. While households in the top-8 metros typically allocate ~2% of total expenditure to education, the figure is 3-4% for the new wave cities below. Apart from being younger, higher-growth markets in the future, such cities already present sizable opportunities for education service providers today.
Top-20 cities: Annual expenditure on education per household (INR 000s's, 2015)
30.8
27.5
25.6
25.3
22.2
19.9
19.6
19.3
18.9
18.5
18.1
17.8
17.7
17.5
17.4
16.7
16.7
16.1
15.9
15.6
CHND
VIZ
LUCK
INDR
JPR
MRUT
HYD
DHRD
TRV
BNG
KOTA
CHEN
JODH
BHOP
DEL
MUM
KANP
PATN
KOLK
RAIP
Metros
New wavecities
• Jaipur• Lucknow• Vijayawada
• Ranchi • Kota• Bhopal
• Bihar• Odisha • Haryana
61.“Market Skyline”, Nielsen Micro Marketing & Economics, 2015; EY Analysis
Untapped potential
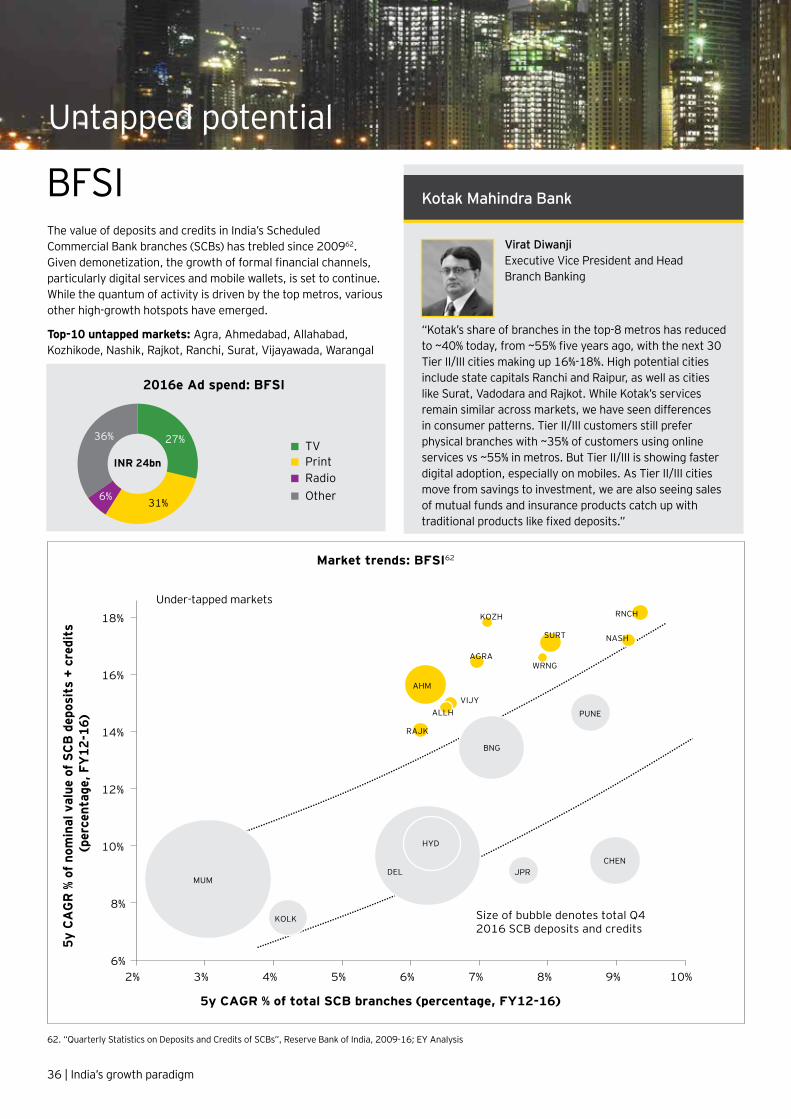
The value of deposits and credits in India’s Scheduled Commercial Bank branches (SCBs) has trebled since 200962. Given demonetization, the growth of formal financial channels, particularly digital services and mobile wallets, is set to continue. While the quantum of activity is driven by the top metros, various other high-growth hotspots have emerged.
Top-10 untapped markets: Agra, Ahmedabad, Allahabad, Kozhikode, Nashik, Rajkot, Ranchi, Surat, Vijayawada, Warangal
MUMDEL
BNG
HYD
CHEN
PUNE
KOLK
JPR
AHM
SURT
RNCH
RAJK
AGRA
VIJY
NASH
ALLH
KOZH
WRNG
Size of bubble denotes total Q4 2016 SCB deposits and credits
5y C
AG
R %
of n
omin
al v
alue
of S
CB d
epos
its
+ cr
edit
s
(per
cent
age,
FY
12-1
6)
5y CAGR % of total SCB branches (percentage, FY12-16)
Market trends: BFSI62
Under-tapped markets
6%
8%
10%
12%
14%
16%
18%
2% 3% 4% 5% 6% 7% 8% 9% 10%
“Kotak’s share of branches in the top-8 metros has reduced to ~40% today, from ~55% five years ago, with the next 30 Tier II/III cities making up 16%-18%. High potential cities include state capitals Ranchi and Raipur, as well as cities like Surat, Vadodara and Rajkot. While Kotak’s services remain similar across markets, we have seen differences in consumer patterns. Tier II/III customers still prefer physical branches with ~35% of customers using online services vs ~55% in metros. But Tier II/III is showing faster digital adoption, especially on mobiles. As Tier II/III cities move from savings to investment, we are also seeing sales of mutual funds and insurance products catch up with traditional products like fixed deposits.”
Virat Diwanji Executive Vice President and Head Branch Banking
Kotak Mahindra BankBFSI
36 | India’s growth paradigm
62. “Quarterly Statistics on Deposits and Credits of SCBs”, Reserve Bank of India, 2009-16; EY Analysis
2016e Ad spend: BFSI
31%6%
36%
INR 24bnTVPrintRadioOther
27%
Untapped potential
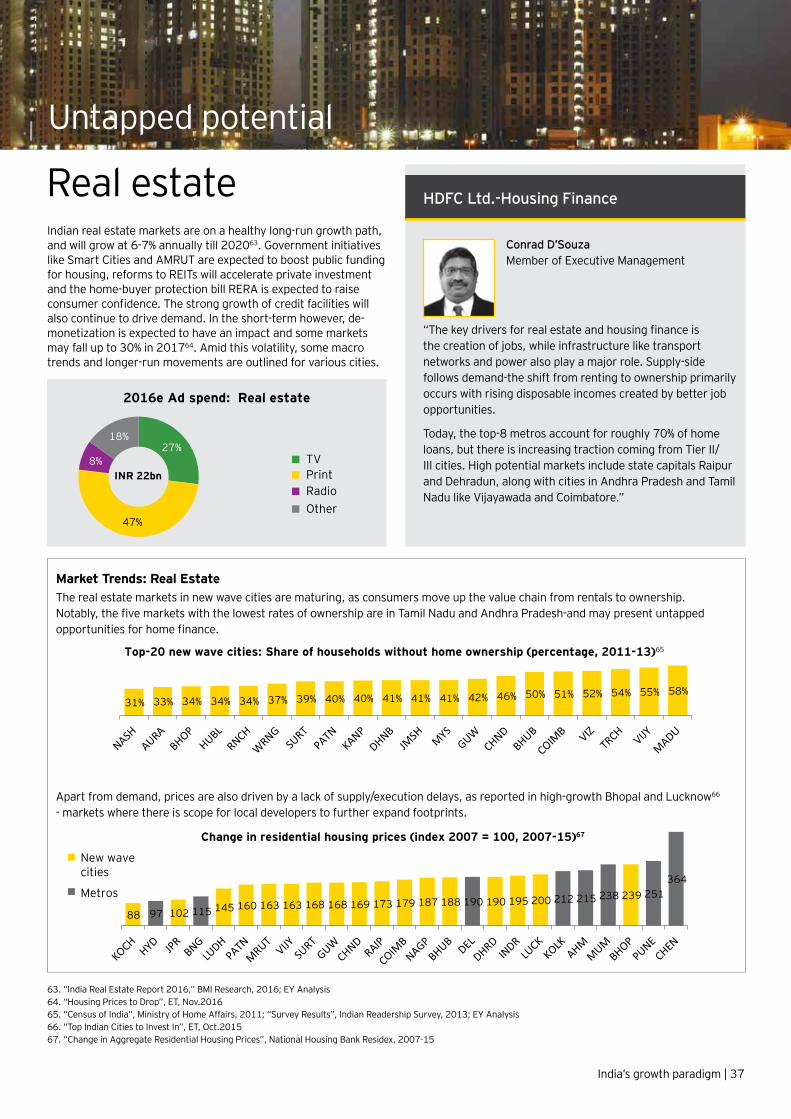
31% 33% 34% 34% 34% 37% 39% 40% 40% 41% 41% 41% 42% 46% 50% 51% 52% 54% 55% 58%
Top-20 new wave cities: Share of households without home ownership (percentage, 2011-13)65
Change in residential housing prices (index 2007 = 100, 2007-15)67
88 97 102 115 145 160 163 163 168 168 169 173 179 187 188 190 190 195 200 212 215 238 239 251 364
Metros
New wavecities
Market Trends: Real EstateThe real estate markets in new wave cities are maturing, as consumers move up the value chain from rentals to ownership. Notably, the five markets with the lowest rates of ownership are in Tamil Nadu and Andhra Pradesh-and may present untapped opportunities for home finance.
Apart from demand, prices are also driven by a lack of supply/execution delays, as reported in high-growth Bhopal and Lucknow66 - markets where there is scope for local developers to further expand footprints.
Indian real estate markets are on a healthy long-run growth path, and will grow at 6-7% annually till 202063. Government initiatives like Smart Cities and AMRUT are expected to boost public funding for housing, reforms to REITs will accelerate private investment and the home-buyer protection bill RERA is expected to raise consumer confidence. The strong growth of credit facilities will also continue to drive demand. In the short-term however, de-monetization is expected to have an impact and some markets may fall up to 30% in 201764. Amid this volatility, some macro trends and longer-run movements are outlined for various cities.
63. “India Real Estate Report 2016,” BMI Research, 2016; EY Analysis64. “Housing Prices to Drop”, ET, Nov.201665. “Census of India”, Ministry of Home Affairs, 2011; “Survey Results”, Indian Readership Survey, 2013; EY Analysis66. “Top Indian Cities to Invest In”, ET, Oct.201567. “Change in Aggregate Residential Housing Prices”, National Housing Bank Residex, 2007-15
“The key drivers for real estate and housing finance is the creation of jobs, while infrastructure like transport networks and power also play a major role. Supply-side follows demand-the shift from renting to ownership primarily occurs with rising disposable incomes created by better job opportunities.
Today, the top-8 metros account for roughly 70% of home loans, but there is increasing traction coming from Tier II/III cities. High potential markets include state capitals Raipur and Dehradun, along with cities in Andhra Pradesh and Tamil Nadu like Vijayawada and Coimbatore.”
Conrad D’Souza Member of Executive Management
HDFC Ltd.-Housing FinanceReal estate
India’s growth paradigm | 37
2016e Ad spend: Real estate
27%
47%
8%
18%
INR 22bnTVPrintRadioOther
Optimizing reach
4
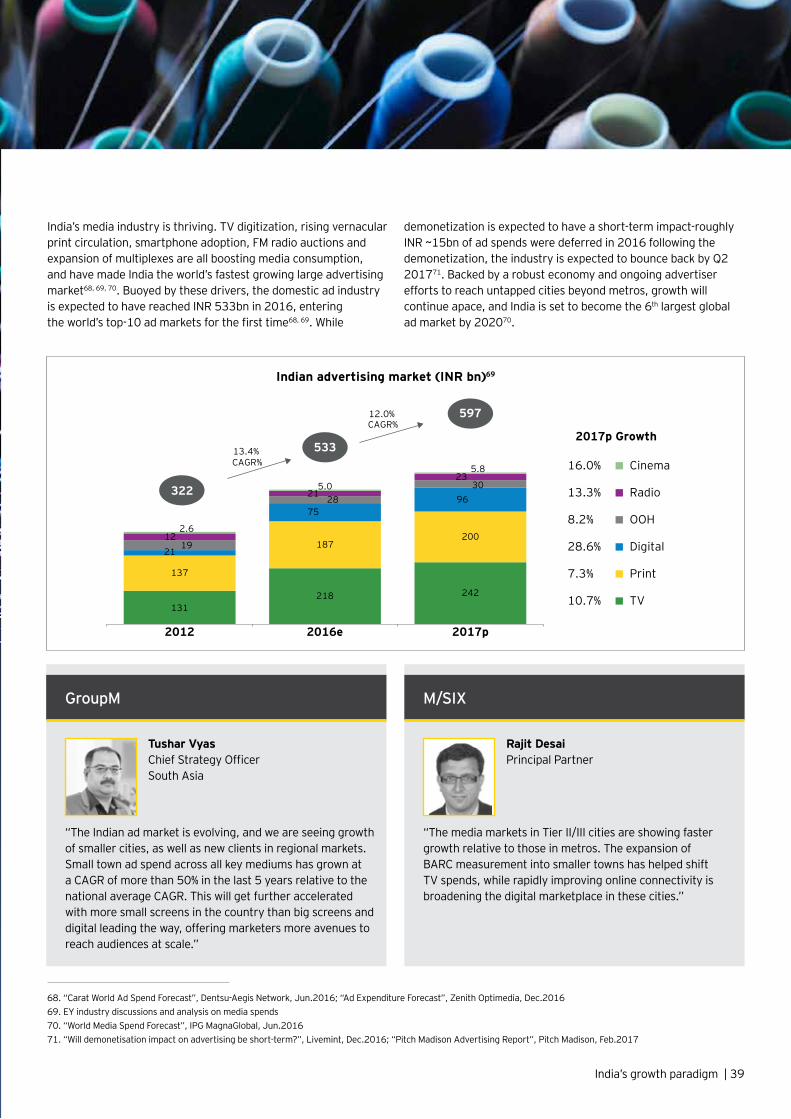
India’s media industry is thriving. TV digitization, rising vernacular print circulation, smartphone adoption, FM radio auctions and expansion of multiplexes are all boosting media consumption, and have made India the world’s fastest growing large advertising market68, 69, 70. Buoyed by these drivers, the domestic ad industry is expected to have reached INR 533bn in 2016, entering the world’s top-10 ad markets for the first time68, 69. While
demonetization is expected to have a short-term impact-roughly INR ~15bn of ad spends were deferred in 2016 following the demonetization, the industry is expected to bounce back by Q2 201771. Backed by a robust economy and ongoing advertiser efforts to reach untapped cities beyond metros, growth will continue apace, and India is set to become the 6th largest global ad market by 202070.
Indian advertising market (INR bn)69
131218 242
187200
137
2119
122.6
7528
215.0
9630
235.8
322
533
597
2012 2016e 2017p
2017p Growth
10.7% TV
7.3% Print
13.3% Radio
16.0% Cinema
28.6% Digital
8.2% OOH
13.4% CAGR%
12.0% CAGR%
“The Indian ad market is evolving, and we are seeing growth of smaller cities, as well as new clients in regional markets. Small town ad spend across all key mediums has grown at a CAGR of more than 50% in the last 5 years relative to the national average CAGR. This will get further accelerated with more small screens in the country than big screens and digital leading the way, offering marketers more avenues to reach audiences at scale.”
GroupM
Tushar Vyas Chief Strategy Officer South Asia
“The media markets in Tier II/III cities are showing faster growth relative to those in metros. The expansion of BARC measurement into smaller towns has helped shift TV spends, while rapidly improving online connectivity is broadening the digital marketplace in these cities.”
M/SIX
Rajit Desai Principal Partner
68. “Carat World Ad Spend Forecast”, Dentsu-Aegis Network, Jun.2016; “Ad Expenditure Forecast”, Zenith Optimedia, Dec.201669. EY industry discussions and analysis on media spends70. “World Media Spend Forecast”, IPG MagnaGlobal, Jun.201671. “Will demonetisation impact on advertising be short-term?”, Livemint, Dec.2016; “Pitch Madison Advertising Report”, Pitch Madison, Feb.2017
India’s growth paradigm | 39
40 | India’s growth paradigm
“While TV has traditionally been a mass medium, various trends are increasingly making it a local one:
• Market selection: Platforms like ours are for the first time giving advertisers the option to target specific locales. These geo-targeting solutions have seen significant uptake not only from national brands with diverse customer bases, but regional SMEs/brands looking to foray into TV ads.
• Niche content: Digitization is reducing analog constraints, and broadcasters are leveraging this by launching more niche channels and creating programming for specific segments.
• Language: metros and Tier II/III markets are largely homogenous in terms of content preferences, but differences are more pronounced at a regional level. Vernacular content is strongest in the South, with over 90% of viewership on regional channels. Marathi and Bengali also have sizable audiences, garnering 30-50% of local viewership. After this there is a drop-off, and other vernacular content has less than 10% share of local markets.
When advertisers segment audiences like this-selecting the right markets, right programming and right languages for their messaging-they are often able to realize a 2-3% rise in market share.”
Amagi Media Labs
Baskar Subramanian Co-Founder
72. “TV Home Tracker”, Chrome DM, 201673. “Genre-Wise Viewership”, Broadcast Audience Research Council, Week 41 2015-Week 38 2016
As digitization continues to roll out across India’s 175mn TV households, the process has been largely completed in metros and new wave cities (barring a few markets in Tamil Nadu like Coimbatore, Trichy and Madurai)72. This has bolstered both the quantum of content (as more channels and packages become available) as well as its quality, with the rising proliferation of
HD channels. This digital conversion is also allowing marketers the opportunity to break up a national TV audience into smaller target audiences for the first time. As geo-targeting platforms emerge, it is now becoming possible to deliver messages tailored to specific audiences at a regional, state and even city-level.
TV
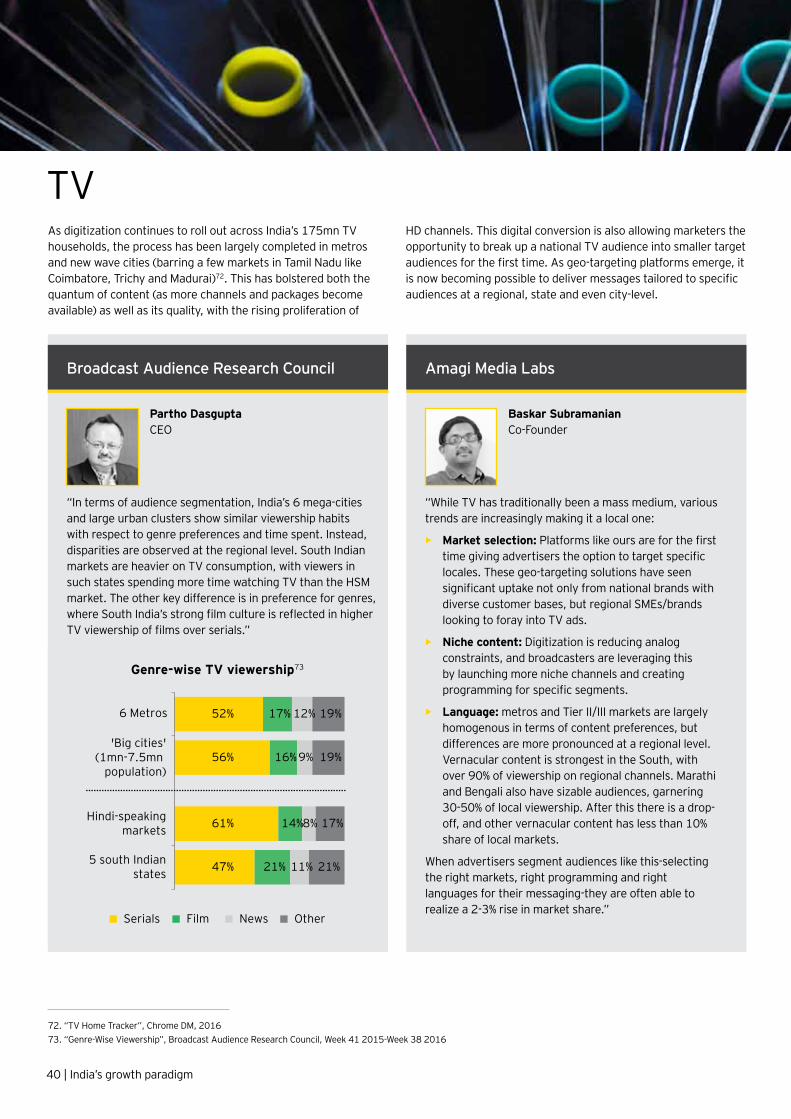
“In terms of audience segmentation, India’s 6 mega-cities and large urban clusters show similar viewership habits with respect to genre preferences and time spent. Instead, disparities are observed at the regional level. South Indian markets are heavier on TV consumption, with viewers in such states spending more time watching TV than the HSM market. The other key difference is in preference for genres, where South India’s strong film culture is reflected in higher TV viewership of films over serials.”
Broadcast Audience Research Council
Partho Dasgupta CEO
Genre-wise TV viewership73
FilmSerials News Other
47%
61%
56%
52%
21%
14%
16%
17%
11%
8%
9%
12%
21%
17%
19%
19%
5 south Indianstates
Hindi-speakingmarkets
'Big cities'(1mn-7.5mn
population)
6 Metros
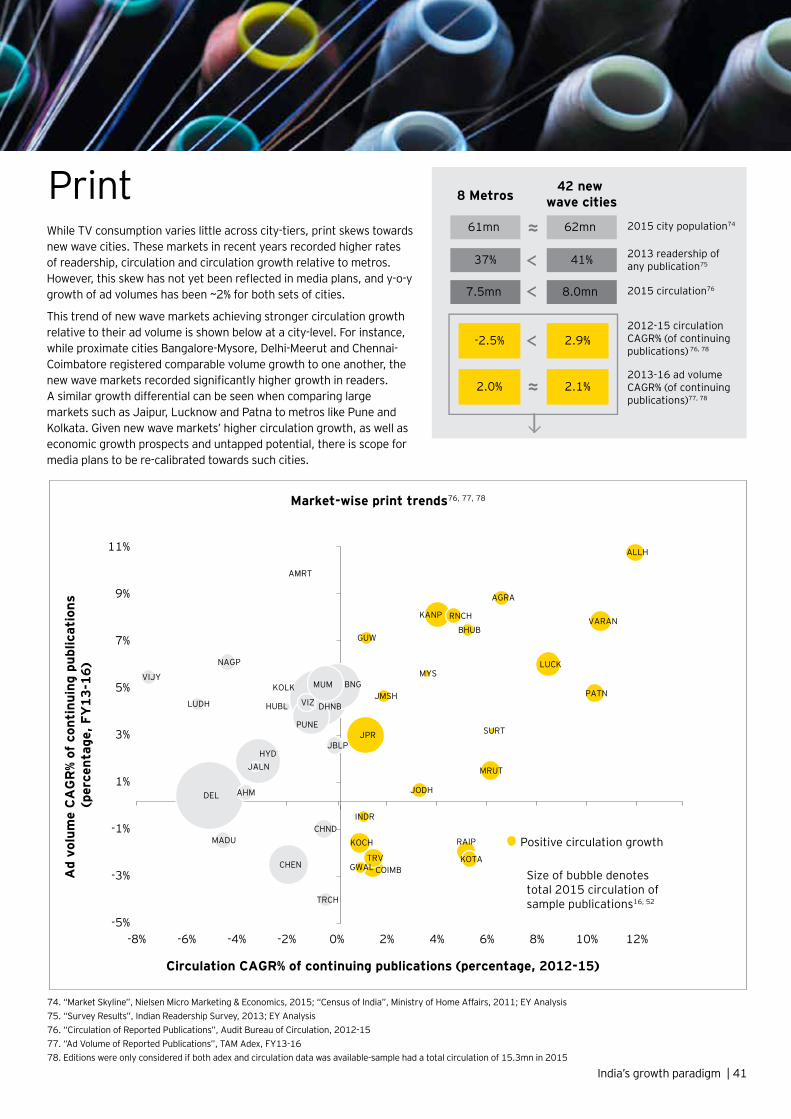
While TV consumption varies little across city-tiers, print skews towards new wave cities. These markets in recent years recorded higher rates of readership, circulation and circulation growth relative to metros. However, this skew has not yet been reflected in media plans, and y-o-y growth of ad volumes has been ~2% for both sets of cities.
This trend of new wave markets achieving stronger circulation growth relative to their ad volume is shown below at a city-level. For instance, while proximate cities Bangalore-Mysore, Delhi-Meerut and Chennai-Coimbatore registered comparable volume growth to one another, the new wave markets recorded significantly higher growth in readers. A similar growth differential can be seen when comparing large markets such as Jaipur, Lucknow and Patna to metros like Pune and Kolkata. Given new wave markets’ higher circulation growth, as well as economic growth prospects and untapped potential, there is scope for media plans to be re-calibrated towards such cities.
DEL
KOLK BNG
HYD
CHEN
PUNE
MUM
CHND
VIZ
JBLP
NAGP
MADU
AHM
TRCH
VIJY
LUDH
JALN
AMRT
HUBL DHNB
JPR
KANP
LUCK
VARAN
COIMB
KOCH
MRUT
TRV
RAIP
PATN
ALLH
KOTA
RNCH
JODH
AGRA
GUW
JMSH
BHUB
GWAL
INDR
MYS
SURT
Size of bubble denotes total 2015 circulation of sample publications16, 52
Ad
volu
me
CA
GR
% of
con
tinu
ing
publ
icat
ions
(p
erce
ntag
e, F
Y13
-16)
Circulation CAGR% of continuing publications (percentage, 2012-15)
Market-wise print trends76, 77, 78
-5%
-3%
-1%
1%
3%
5%
7%
9%
11%
-8% -6% -4% -2% 0% 2% 4% 6% 8% 10% 12%
Positive circulation growth
61mn 62mn
8 Metros42 new
wave cities
2015 city population74
37% 41% 2013 readership of any publication75
7.5mn 8.0mn 2015 circulation76
-2.5% 2.9%
2.0% 2.1%
2012-15 circulation CAGR% (of continuing publications) 76, 78
2013-16 ad volume CAGR% (of continuing publications)77, 78
74. “Market Skyline”, Nielsen Micro Marketing & Economics, 2015; “Census of India”, Ministry of Home Affairs, 2011; EY Analysis75. “Survey Results”, Indian Readership Survey, 2013; EY Analysis76. “Circulation of Reported Publications”, Audit Bureau of Circulation, 2012-1577. “Ad Volume of Reported Publications”, TAM Adex, FY13-1678. Editions were only considered if both adex and circulation data was available-sample had a total circulation of 15.3mn in 2015
India’s growth paradigm | 41
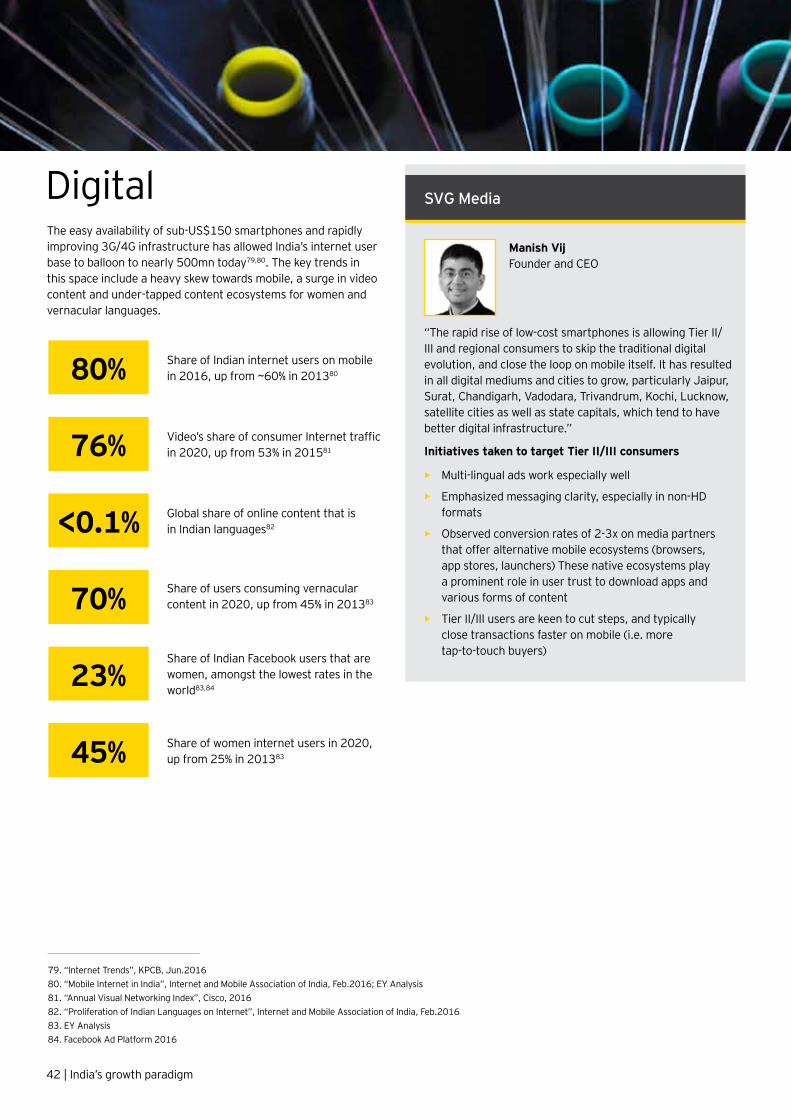
Manish Vij Founder and CEO SVG Media
The easy availability of sub-US$150 smartphones and rapidly improving 3G/4G infrastructure has allowed India’s internet user base to balloon to nearly 500mn today79,80. The key trends in this space include a heavy skew towards mobile, a surge in video content and under-tapped content ecosystems for women and vernacular languages.
Digital
“The rapid rise of low-cost smartphones is allowing Tier II/III and regional consumers to skip the traditional digital evolution, and close the loop on mobile itself. It has resulted in all digital mediums and cities to grow, particularly Jaipur, Surat, Chandigarh, Vadodara, Trivandrum, Kochi, Lucknow, satellite cities as well as state capitals, which tend to have better digital infrastructure.”
SVG Media
Initiatives taken to target Tier II/III consumers
• Multi-lingual ads work especially well
• Emphasized messaging clarity, especially in non-HD formats
• Observed conversion rates of 2-3x on media partners that offer alternative mobile ecosystems (browsers, app stores, launchers) These native ecosystems play a prominent role in user trust to download apps and various forms of content
• Tier II/III users are keen to cut steps, and typically close transactions faster on mobile (i.e. more tap-to-touch buyers)
Share of Indian internet users on mobile in 2016, up from ~60% in 20138080%
Video’s share of consumer Internet traffic in 2020, up from 53% in 20158176%
Global share of online content that is in Indian languages82<0.1%
Share of women internet users in 2020, up from 25% in 20138345%
70% Share of users consuming vernacular content in 2020, up from 45% in 201383
23%Share of Indian Facebook users that are women, amongst the lowest rates in the world83,84
79. “Internet Trends”, KPCB, Jun.201680. “Mobile Internet in India”, Internet and Mobile Association of India, Feb.2016; EY Analysis81. “Annual Visual Networking Index”, Cisco, 201682. “Proliferation of Indian Languages on Internet”, Internet and Mobile Association of India, Feb.201683. EY Analysis84. Facebook Ad Platform 2016
42 | India’s growth paradigm
Manish Vij Founder and CEO
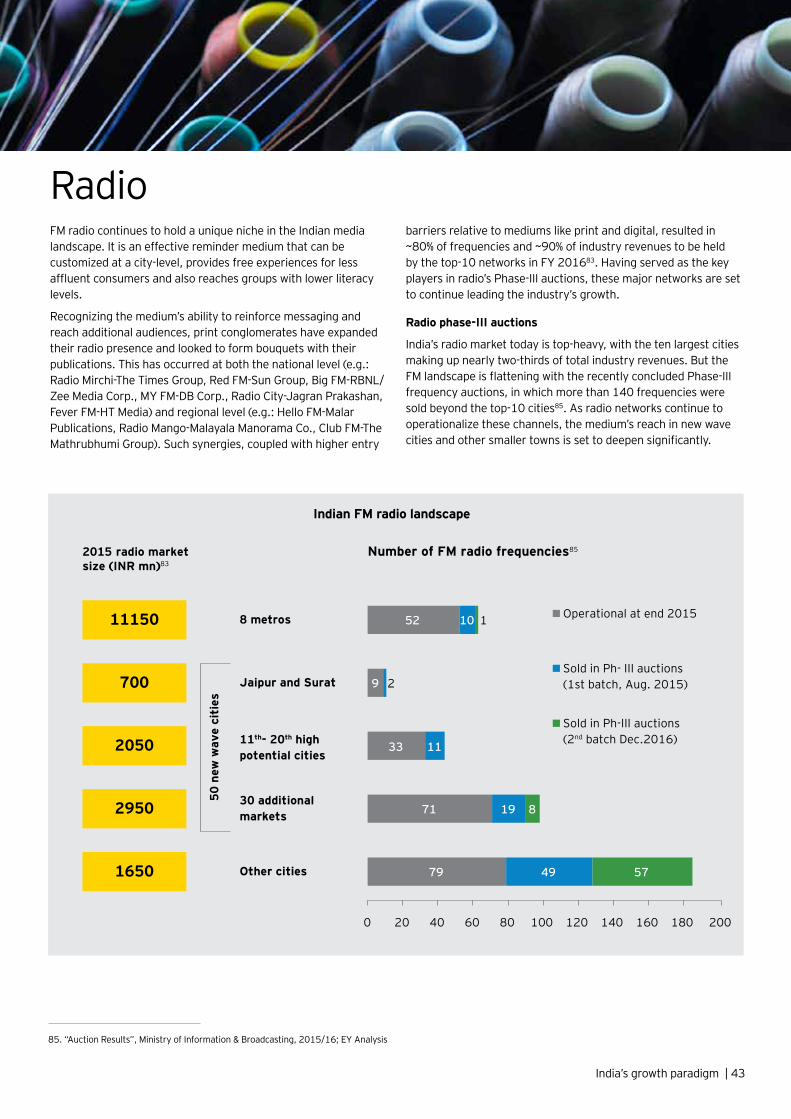
0 20 40 60 80 100 120 140 160 180 200
11th- 20th highpotential cities
50 n
ew w
ave
citi
es
33 11
Jaipur and Surat 9 2
Other cities 79 49 57
30 additionalmarkets 71 19 8
2050
700
1650
2950
11150 8 metros 52 10 1
Number of FM radio frequencies85
Operational at end 2015
Sold in Ph- III auctions(1st batch, Aug. 2015)
Sold in Ph-III auctions(2nd batch Dec.2016)
2015 radio market size (INR mn)83
85. “Auction Results”, Ministry of Information & Broadcasting, 2015/16; EY Analysis
FM radio continues to hold a unique niche in the Indian media landscape. It is an effective reminder medium that can be customized at a city-level, provides free experiences for less affluent consumers and also reaches groups with lower literacy levels.
Recognizing the medium’s ability to reinforce messaging and reach additional audiences, print conglomerates have expanded their radio presence and looked to form bouquets with their publications. This has occurred at both the national level (e.g.: Radio Mirchi-The Times Group, Red FM-Sun Group, Big FM-RBNL/Zee Media Corp., MY FM-DB Corp., Radio City-Jagran Prakashan, Fever FM-HT Media) and regional level (e.g.: Hello FM-Malar Publications, Radio Mango-Malayala Manorama Co., Club FM-The Mathrubhumi Group). Such synergies, coupled with higher entry
barriers relative to mediums like print and digital, resulted in ~80% of frequencies and ~90% of industry revenues to be held by the top-10 networks in FY 201683. Having served as the key players in radio’s Phase-III auctions, these major networks are set to continue leading the industry’s growth.
Radio phase-III auctions
India’s radio market today is top-heavy, with the ten largest cities making up nearly two-thirds of total industry revenues. But the FM landscape is flattening with the recently concluded Phase-III frequency auctions, in which more than 140 frequencies were sold beyond the top-10 cities85. As radio networks continue to operationalize these channels, the medium’s reach in new wave cities and other smaller towns is set to deepen significantly.
Radio
India’s growth paradigm | 43
Indian FM radio landscape
Railways
Mr Ranjan Thakur Executive Director, Non-Fare Revenue, Ministry of Railways, Government of India.
On the back of a large increase in working-age population, infrastructure development and digital signage, India’s OOH industry has recorded double-digit growth in recent years. While demonetization impacted this sector in 2016-17, new wave markets will help growth return to longer-term norms. Various outdoor infrastructure initiatives are driving OOH and transit media opportunities in these cities, including:
• Operationalization of 50 new airports from 2015-25 by the Airport Authority of India86
• Development of new metro rail systems in markets like Jaipur, Kochi, Lucknow, Ludhiana and Nagpur87
• Road and highway construction through national industrial corridors (e.g.: Delhi-Mumbai, Mumbai-Bangalore, Bangalore-Chennai, Chennai-Vizag and Amritsar-Delhi-Kolkata corridors)88
While the industry is currently concentrated in the top metros (over a third of revenues accrue to Delhi, Mumbai and Bangalore89) - such infrastructure initiatives will cause this mix to change as more OOH opportunities arise in new wave cities.
OOH serves as a healthy and effective reminder medium to TV and print advertisements, and this efficacy is improving further with the rise of digital OOH. Marketers are being drawn to this medium as it allows them to interact with consumers in real-time, target users at a granular area-level and also receive superior measurement feedback. As a result, although digital OOH only comprises ~10% of the industry today, the segment is expected to grow ~25% annually from 2016-1990.
Out of home
“Out of home advertising provides last mile connectivity with the consumer, creating a strong chance of top-of-mind recall. It adds significant value to the media plan as it acts as a reminder medium that has low cost per contact and high visibility.
As India’s metros and major urban cities near saturation levels, especially in terms of economic growth, companies across a range of sectors are moving towards Tier II/III cities. Indeed, this next tier of cities has already been delivering successful economic growth for the past decade.
In terms of transit media, this medium focuses on marketing to consumers when they are “on-the-go” in public places, in transit, in specific commercial locations or waiting (such as in a railway waiting room). As brands better understand transit media’s reach in smaller towns and the innovation techniques possible in this medium, they will be able to more effectively target consumers in Tier II/III cities.”
Ministry of Railways, Government of India
Ranjan Thakur Executive Director, Non-fare Revenue
44 | India’s growth paradigm 44 | India’s growth paradigm
86. “Airports Authority of India to revive 50 airports”, ET, Nov.201587. Government Metro Rail Portals, 201688. MakeInIndia Government Portal, 2016; Individual Industrial Corridor NIC Portals, 201689. “Pitch Madison Advertising Report”, Pitch Madison, Feb.201790. “Digital OOH will take the industry by storm (6w Research)”, All About Outdoor, Jun.2016


Glossary

India’s growth paradigm | 47
Term Definition
Bn Billion
CAGR Compound Annual Growth Rate
City We consider cities to only comprise their distinct urban areas, per the Census of India- this does not include adjoining outgrowths/suburbs that make up the wider urban
agglomeration
De-monetization The Government of India's initiatives around reforming money supply since November 2016, including the removal of existing INR 500 and INR 1000 banknotes from circulation
DTH Direct-to-Home
FDI Foreign Direct Investment
GDP Gross Domestic Product
Household income Value of combined gross income of a household
INR Indian rupee
Metros 8 Indian cities classified as such by the Central Pay Commission-by cumulative household income, these are the top-ranked cities in India
Mn Million
New wave cities 42 Indian cities with the greatest cumulative household income, after the 8 metros
Real GDP Gross Domestic Product adjusted for inflation
Tier II/III cities A generic term used by featured industry professionals in referring to the next set of 30-50 cities after the metros
Trn Trillion
TV digitization/DAS conversion Conversion of analog cable TV services into Digital Addressable Systems
Untapped potential A calculated index measuring the gap between consumer demand and business supply
USD US Dollar
Y-o-Y Year-on-Year

Notes:
48 | India’s growth paradigm

Notes:
India’s growth paradigm | 49

50 | India’s growth paradigm
EY India has a dedicated marketing and advertising practice of more than 350 professionals across 15 key segments of the industry. We provide services to the top global brands including the largest advertisers, aggregating over 40% of total Indian advertising spends. We identify potential areas of savings by analyzing and recommending strategic, process driven and compliance related gaps/ practices which can help client achieve overall efficiency and effectiveness in their marketing initiatives. We are also the leading provider of event risk management solutions in India since 1999. EY has been the process advisor to more than 300 awards.
Our Marketing and Advertising Practice
Farokh T. BalsaraMedia & Entertainment Leader, EY India
Through his 30 year career, Farokh has served clients in the media and entertainment industries and has assisted them in identifying process related risks and in developing controls to mitigate risks and in improving the efficiency and effectiveness of key business processes.
Nripendra Singh, Director Radhika Pradhan, Senior ManagerAditya Lahiri, Senior ConsultantHarleen Chawla, Consultant
Acknowledgements:
For further information, please contact
Karandeep Singh Manager, EY India
Karandeep has over 9 years of experience in the media and marketing industry. He has led multiple engagements in India and other SEA countries.
Bharat RajamaniSolution Leader, Marketing and Advertising Risk Services (MARS), EY India
Bharat has over 20 years of work experience in EY specialising in MARS reviews for over 16 years. He has conducted media plan optimization reviews, marketing spend reviews/agency compensation and performance reviews, below the line spend reviews, and digital media assessments for leading advertisers in India and Pan Asia cutting across various industries: FMCG, oil and gas, telecom, consumer durables, services, etc.
Amiya SwarupDirector, Event Risk Management
Amiya has been involved in conceptualisation, design and implementation of over 300 awards, contests, game shows and events across India
For any comments or queries, please contact: Radhika Pradhan T: 022 6192 3386; E: [email protected]
Creative Team: Yashaswita Gawade, Kushal Lele, Vinitha Nair
Our offices
Ahmedabad
2nd floor, Shivalik IshaanNear C.N. VidhyalayaAmbawadiAhmedabad-380 015Tel: + 91 79 6608 3800Fax: + 91 79 6608 3900
Bengaluru
6th, 12th & 13th floor“UB City”, Canberra BlockNo.24 Vittal Mallya RoadBengaluru-560 001Tel: + 91 80 4027 5000 + 91 80 6727 5000 + 91 80 2224 0696Fax: + 91 80 2210 6000
Ground Floor, ‘A’ wingDivyasree Chambers# 11, O’Shaughnessy RoadLangford GardensBengaluru-560 025Tel: +91 80 6727 5000Fax: +91 80 2222 9914
Chandigarh
1st Floor, SCO: 166-167Sector 9-C, Madhya MargChandigarh-160 009 Tel. +91 172 331 7800Fax: +91 172 331 7888
Chennai
Tidel Park, 6th & 7th Floor A Block (Module 601,701-702)No.4, Rajiv Gandhi Salai Taramani, Chennai-600 113Tel: + 91 44 6654 8100 Fax: + 91 44 2254 0120
Delhi NCR
Golf View Corporate Tower BSector 42, Sector RoadGurgaon-122 002Tel: + 91 124 464 4000Fax: + 91 124 464 4050
3rd & 6th Floor, Worldmark-1IGI Airport Hospitality DistrictAerocity, New Delhi-110 037Tel: + 91 11 6671 8000Fax + 91 11 6671 9999
4th & 5th Floor, Plot No 2B Tower 2, Sector 126 NOIDA-201 304Gautam Budh Nagar, U.P.Tel: + 91 120 671 7000Fax: + 91 120 671 7171
Hyderabad
Oval Office, 18, iLabs CentreHitech City, MadhapurHyderabad-500 081Tel: + 91 40 6736 2000Fax: + 91 40 6736 2200
Jamshedpur
1st Floor, Shantiniketan BuildingHolding No. 1, SB Shop AreaBistupur, Jamshedpur – 831 001Tel: +91 657 663 1000BSNL: +91 657 223 0441
Kochi
9th Floor, ABAD NucleusNH-49, Maradu POKochi-682 304Tel: + 91 484 304 4000Fax: + 91 484 270 5393
Kolkata
22 Camac Street3rd Floor, Block ‘C’Kolkata-700 016Tel: + 91 33 6615 3400Fax: + 91 33 2281 7750
Mumbai
14th Floor, The Ruby29 Senapati Bapat MargDadar (W), Mumbai-400 028Tel: + 91 22 6192 0000Fax: + 91 22 6192 1000
5th Floor, Block B-2Nirlon Knowledge ParkOff. Western Express HighwayGoregaon (E)Mumbai-400 063Tel: + 91 22 6192 0000Fax: + 91 22 6192 3000
Pune
C-401, 4th floorPanchshil Tech ParkYerwada (Near Don Bosco School)Pune-411 006Tel: + 91 20 6603 6000Fax: + 91 20 6601 5900
About EYEY is a global leader in assurance, tax, transaction and advisory services. The insights and quality services we deliver help build trust and confidence in the capital markets and in economies the world over. We develop outstanding leaders who team to deliver on our promises to all of our stakeholders. In so doing, we play a critical role in building a better working world for our people, for our clients and for our communities.
EY refers to the global organization, and may refer to one or more, of the member firms of Ernst & Young Global Limited, each of which is a separate legal entity. Ernst & Young Global Limited, a UK company limited by guarantee, does not provide services to clients. For more information about our organization, please visit ey.com.
Ernst & Young LLP is one of the Indian client serving member firms of EYGM Limited. For more information about our organization, please visit www.ey.com/in.
Ernst & Young LLP is a Limited Liability Partnership, registered under the Limited Liability Partnership Act, 2008 in India, having its registered office at 22 Camac Street, 3rd Floor, Block C, Kolkata - 700016
© 2017 Ernst & Young LLP. Published in India. All Rights Reserved.
EYINXXXXXXXXX ED None
This publication contains information in summary form and is therefore intended for general guidance only. It is not intended to be a substitute for detailed research or the exercise of professional judgment. Neither Ernst & Young LLP nor any other member of the global Ernst & Young organization can accept any responsibility for loss occasioned to any person acting or refraining from action as a result of any material in this publication. On any specific matter, reference should be made to the appropriate advisor.
VN
Ernst & Young LLPEY | Assurance | Tax | Transactions | Advisory
ey.com/in
@EY_India EY|LinkedIn EY India EY India careers
EY refers to the global organization, and/or one or more of the independent member firms of Ernst & Young Global Limited