india’s dairy sector: structure, performance, and prospects
TRANSCRIPT

United StatesDepartmentof Agriculture
www.ers.usda.gov
A Report from the Economic Research Service
Abstract
India is the world’s largest producer and consumer of milk and has the world’s largest dairy herd, comprised of water buffalo and indigenous and crossbred cattle. Annual growth in milk production and consumption has been a robust 4.2 percent since 2000, and India has also emerged as a small net exporter of dairy products. Water buffalo and crossbred cattle account for all of the growth in the dairy herd and milk produc-tion, but average milk yields remain well below both international standards and those achieved under domestic best practices. Future production prospects depend heavily on productivity gains, primarily through improved breeding and feeding practices, and demand for feeds and improved genetics may offer opportunities for increased trade. India’s dairy cooperatives have played a key role in expanding milk and milk-product marketing, and private-sector processors may play an increasingly important role in catalyzing more production of both milk and milk products. India’s future role as a trader in dairy products is uncertain because there is significant scope for future growth in both production and consumption. Recent trade behavior indicates that domestic dairy price stability is a key priority, with policy facilitating either imports or exports depending on domestic market conditions. Most dairy products imported into India are currently subject to certification that source animals have never been fed materials of ruminant origin, effectively prohibiting access for most U.S. dairy products.
Acknowledgments
The authors thank peer reviewers Paul Kiendl of USDA’s Foreign Agricultural Service (FAS), Pratap S. Birthal of India’s National Institute of Agricultural Economics and Policy Research, and Donald P. Blayney of New Mexico State University for valuable comments. We also greatly appreciate the editorial and design support provided by Mark Farrell, Dale Simms, and Lori A. Fields of ERS.
LDPM-272-01
March 2017
Maurice Landes, Jerry Cessna, Lindsay Kuberka (USDA/FAS), and Keithly Jones
India’s Dairy Sector: Structure, Performance, and Prospects
Approved by USDA’s World Agricultural
Outlook Board

ii India’s Dairy Sector: Structure, Performance, and Prospects, LDPM-272-01
Economic Research Service/USDA
In accordance with Federal civil rights law and U.S. Department of Agriculture (USDA) civil rights regulations and
policies, the USDA, its Agencies, offices, and employees, and institutions participating in or administering USDA
programs are prohibited from discriminating based on race, color, national origin, religion, sex, gender identity
(including gender expression), sexual orientation, disability, age, marital status, family/parental status, income derived
from a public assistance program, political beliefs, or reprisal or retaliation for prior civil rights activity, in any program
or activity conducted or funded by USDA (not all bases apply to all programs). Remedies and complaint filing dead-
lines vary by program or incident.
Persons with disabilities who require alternative means of communication for program information
(e.g., Braille, large print, audiotape, American Sign Language, etc.) should contact the responsible Agency or USDA's
TARGET Center at (202) 720-2600 (voice and TTY) or contact USDA through the Federal Relay Service at (800)
877-8339. Additionally, program information may be made available in languages other than English.
To file a program discrimination complaint, complete the USDA Program Discrimination Complaint Form, AD-3027,
found online at How to File a Program Discrimination Complaint and at any USDA office or write a letter addressed to
USDA and provide in the letter all of the information requested in the form. To request a copy of the complaint form,
call (866) 632-9992. Submit your completed form or letter to USDA by: (1) mail: U.S. Department of Agriculture,
Office of the Assistant Secretary for Civil Rights, 1400 Independence Avenue, SW, Washington, D.C. 20250-9410;
(2) fax: (202) 690-7442; or (3) email: [email protected].
USDA is an equal opportunity provider, employer, and lender.
ContentsAbstract . . . . . . . . . . . . . . . . . . . . . . . . . . . . . . . . . . . . . . . . . . . . . . . . . . . . . . . . . . . . . . . . . . . . . . . iAcknowledgments . . . . . . . . . . . . . . . . . . . . . . . . . . . . . . . . . . . . . . . . . . . . . . . . . . . . . . . . . . . . . . . iIntroduction . . . . . . . . . . . . . . . . . . . . . . . . . . . . . . . . . . . . . . . . . . . . . . . . . . . . . . . . . . . . . . . . . . . .1Milk Production . . . . . . . . . . . . . . . . . . . . . . . . . . . . . . . . . . . . . . . . . . . . . . . . . . . . . . . . . . . . . . . .2
The Dairy Cattle and Water Buffalo Herd . . . . . . . . . . . . . . . . . . . . . . . . . . . . . . . . . . . . . . . . . . .3
Structure of Cattle and Water Buffalo Holdings . . . . . . . . . . . . . . . . . . . . . . . . . . . . . . . . . . . . . .5
Regional Pattern of Milk Production . . . . . . . . . . . . . . . . . . . . . . . . . . . . . . . . . . . . . . . . . . . . . . .6
Feed Use . . . . . . . . . . . . . . . . . . . . . . . . . . . . . . . . . . . . . . . . . . . . . . . . . . . . . . . . . . . . . . . . . . . 11
Milk Demand and Processing . . . . . . . . . . . . . . . . . . . . . . . . . . . . . . . . . . . . . . . . . . . . . . . . . . . .16Milk Prices . . . . . . . . . . . . . . . . . . . . . . . . . . . . . . . . . . . . . . . . . . . . . . . . . . . . . . . . . . . . . . . . . . 18
Milk Marketing . . . . . . . . . . . . . . . . . . . . . . . . . . . . . . . . . . . . . . . . . . . . . . . . . . . . . . . . . . . . . .20
Processed Products. . . . . . . . . . . . . . . . . . . . . . . . . . . . . . . . . . . . . . . . . . . . . . . . . . . . . . . . . . . .23
Domestic Food Safety Issues . . . . . . . . . . . . . . . . . . . . . . . . . . . . . . . . . . . . . . . . . . . . . . . . . . . .26
Dairy Trade . . . . . . . . . . . . . . . . . . . . . . . . . . . . . . . . . . . . . . . . . . . . . . . . . . . . . . . . . . . . . . . . . . .27Exports . . . . . . . . . . . . . . . . . . . . . . . . . . . . . . . . . . . . . . . . . . . . . . . . . . . . . . . . . . . . . . . . . . . .27
Imports . . . . . . . . . . . . . . . . . . . . . . . . . . . . . . . . . . . . . . . . . . . . . . . . . . . . . . . . . . . . . . . . . . . .30
Dairy Policy . . . . . . . . . . . . . . . . . . . . . . . . . . . . . . . . . . . . . . . . . . . . . . . . . . . . . . . . . . . . . . . . . . .32Improving Animal Breeding . . . . . . . . . . . . . . . . . . . . . . . . . . . . . . . . . . . . . . . . . . . . . . . . . . . .32
Feed and Fodder Development . . . . . . . . . . . . . . . . . . . . . . . . . . . . . . . . . . . . . . . . . . . . . . . . . . .33
Animal Health . . . . . . . . . . . . . . . . . . . . . . . . . . . . . . . . . . . . . . . . . . . . . . . . . . . . . . . . . . . . . . .34
Investment in Dairy Development . . . . . . . . . . . . . . . . . . . . . . . . . . . . . . . . . . . . . . . . . . . . . . . .34
Trade Policy . . . . . . . . . . . . . . . . . . . . . . . . . . . . . . . . . . . . . . . . . . . . . . . . . . . . . . . . . . . . . . . . .35
Projections . . . . . . . . . . . . . . . . . . . . . . . . . . . . . . . . . . . . . . . . . . . . . . . . . . . . . . . . . . . . . . . . . . . .39Conclusions . . . . . . . . . . . . . . . . . . . . . . . . . . . . . . . . . . . . . . . . . . . . . . . . . . . . . . . . . . . . . . . . . . .42References . . . . . . . . . . . . . . . . . . . . . . . . . . . . . . . . . . . . . . . . . . . . . . . . . . . . . . . . . . . . . . . . . . . .44
1 India’s Dairy Sector: Structure, Performance, and Prospects, LDPM-272-01
Economic Research Service/USDA
Introduction
India is the world’s largest producer and consumer of milk and has, by far, the world’s largest milking herd. Available data indicate that milk production has been expanding at about 4.2 percent annually since 2000, matching growth in demand as higher incomes spur more consumption of fluid milk and dairy products. The dairy sector plays a prominent role in agricultural and food policy because it accounts for about a fifth of the value of India’s farm output, and dairy products are a traditional and nutritionally important component of average diets. So far, trade in dairy products has been small relative to production and consumption, with India transitioning from a net importer of milk powder and butter oil up until the early 1990s to a net exporter, primarily of milk powder and casein products, since the early 2000s. With a large but low-yielding milking herd and a large and expanding domestic market, India’s dairy sector has the potential for a more significant role as a dairy product exporter and importer.
Future prospects for India’s role in world dairy markets likely hinge on its ability to improve the low productivity of its milking herd, and on the growth and competitiveness of its emerging dairy product sectors. Key to productivity gains will be the continued expansion of India’s relatively high-yielding crossbred dairy herd, along with continued growth in buffalo milk production—now the largest share of milk output. In both cases, output gains are likely to be increasingly dependent on improving now-deficient supplies of feeds and enhancing genetics, both of which may provide opportunities for trade. India’s cooperative and private-sector dairy processors have, so far, been successful in meeting growing domestic demand for dairy products. But there is limited information with which to assess the future growth and competitiveness of India’s dairy processors, and particu-larly the relatively nascent private dairy sector. Other factors in the outlook will be the extent to which India’s expanding cooperative and private-sector milk-processing enterprises become active in facilitating changes in the current small-scale structure of dairy production, improved animal feeding practices, and gains in productivity and marketing.
This report provides a profile of India’s dairy sector using available secondary data and research to examine trends in supply, demand, and trade, and the factors affecting these trends. Based on the profile, this report attempts to identify the growth prospects for India’s dairy production and trade, accounting for the structural, technical, and policy factors likely to shape that growth. In addition to providing an analytical overview of the world’s largest dairy producer, a key objective is to identify the areas most in need of more indepth study in order to better assess the future implications for U.S. and global dairy trade.

2 India’s Dairy Sector: Structure, Performance, and Prospects, LDPM-272-01
Economic Research Service/USDA
Milk Production
India is the largest milk-producing country in the world by a wide margin over the United States, the second-largest producer. India is unique among the major milk producers because more than half of its production is from water buffalo, rather than cattle (table 1). India’s dairy herd, also the largest in the world, consists of the largest herds of both dairy cattle and water buffalo (table 2).
USDA, the Food and Agriculture Organization of the United Nations (FAO), and the Government of India (GOI) all provide similar, but different, estimates of total Indian milk production. The USDA data (fig. 1) indicate that production has grown consistently at an annual rate of about 4.2 percent. The official Indian production estimates for milk, on which the USDA data are based, are collected through the Integrated Sample Survey commissioned by India’s Department of Animal Husbandry, Dairying, and Fisheries (DAHDF) and conducted by State Governments. According to the data, although India’s water buffalo herd is smaller than the cattle herd, water buffalo milk is the largest and fastest-growing component of milk production. Water buffalo milk now accounts for about 53 percent of total milk output and production is growing at about 4.4 percent annually, compared with 4.1 percent annual growth in cattle milk.
Table 1
World’s largest milk producers1
Country Cow Buffalo Total
Million tons
India 59.4 67.7 127.1
United States 90.4 0.0 90.4
China 36.8 3.1 39.9
Brazil 32.9 0.0 32.9
Russian Fed. 31.1 0.0 31.1
Germany 30.7 0.0 30.7
Pakistan 13.4 16.3 29.7
France 24.0 0.0 24.0
New Zealand 18.5 0.0 18.5
Turkey 15.5 0.0 15.612011-2013 average.Source: USDA, Economic Research Service. Food and Agriculture Organization, FAOSTAT database.
Table 2
World’s largest dairy herds1
Country Cow Buffalo Total
Million head
India 44.2 38.6 82.8
Pakistan 10.9 12.2 23.1
Brazil 23.0 0.0 23.0
China 12.2 5.5 17.6
Sudan (former) 14.7 0.0 14.7
Ethiopia 10.7 0.0 10.7
United States 9.2 0.0 9.2
Russian Fed. 8.0 0.0 8.0
Tanzania 6.9 0.0 6.9
Kenya 5.7 0.0 5.712011-2013 average. Source: USDA, Economic Research Service. Food and Agriculture Organization, FAOSTAT database.

3 India’s Dairy Sector: Structure, Performance, and Prospects, LDPM-272-01
Economic Research Service/USDA
The Dairy Cattle and Water Buffalo Herd
Indian Livestock Census inventory data disaggregate the bovine herd into three categories: exotic/crossbred cattle, indigenous cattle, and water buffalo (table 3). Crossbreeding of imported exotic breeds—such as Holstein-Friesian, Jersey, and Brown Swiss—with indigenous breeds began in the late 1960s. By 2012, the crossbred herd had grown to 39.7 million head, or 21 percent of the cattle population. Between 1997 and 2012, crossbred cattle were the fastest-growing component of the total bovine herd, expanding by 4.6 percent annually compared with 1.3-percent growth in the water buffalo herd and a 1.1-percent annual decline in the indigenous cattle population. Crossbred cattle have also registered the strongest growth in the milking herd, with 5.8-percent annual growth during 1997-2012, compared with 1.2 percent for water buffalo and no growth for indigenous cattle. In the Indian data, the milking herd includes both dry and in-milk female water buffalo and indigenous cattle that have calved and are at least 3 years old. The crossbred milking herd includes females that have calved and are at least 2½ years old.
The pattern of growth in the milking herd is consistent with the productive attributes of the three types of animals. The crossbred/exotic herd consists of animals bred by crossing indigenous breeds with a foreign exotic breed, primarily by artificial insemination, through State and central Government programs begun in the late 1960s and early 1970s. While pure exotic breeds are not well suited to India’s climate and disease conditions, crossbred cattle carry the higher milk-yielding traits of the exotic breeds with the climatic adaptation and disease resistance traits of indigenous breeds. The relatively fast growth in the crossbred herd is consistent with their relatively high milk yields, even though crossbred animals are more management intensive than indigenous breeds.
India has an array of indigenous cattle breeds, some of which are productive milking breeds and others that are bred for draught (animal traction) purposes. Most of the indigenous herd is mixed-
Figure 1
Estimates of milk production in India
1980
1982
1984
1986
1988
1990
1992
1994
1996
1998
2000
2002
2004
2006
2008
2010
2012
2014
2016
0
20
40
60
80
100
120
140
160
180
Million tons
Total milk Cow milk Water buffalo milk
Source: USDA, Economic Research Service. USDA, Foreign Agricultural Service, PS&D Online.

4 India’s Dairy Sector: Structure, Performance, and Prospects, LDPM-272-01
Economic Research Service/USDA
breed animals with relatively low milk-yield potential. Although indigenous cattle still comprise the majority share of the overall bovine herd, their share of the herd is declining, consistent with their relatively low milk yields and, with the advent of farm mechanization, the diminishing utility of draught animals.
India also has an array of water buffalo breeds that combine the traits of high milk yield rela-tive to most indigenous cattle (but not crossbred cattle), a high level of adaptation to climatic and disease conditions in many regions of India, and the capability to efficiently convert many of the available low-quality indigenous grasses and feeds. Buffalo milk is also commonly preferred by Indian consumers and processors because of its unique characteristics, including higher skim-milk solids content (protein, lactose, and ash) than cattle or goat milk, and particularly its high butterfat content—typically 6-8 percent compared with 3-4 percent for cattle milk. The high milk solids content of buffalo milk increases its value in producing processed products. Alongside these attributes, however, water buffalo tend to have a higher age at first calving and longer dry periods and calving intervals than indigenous or crossbred cattle, all of which can lead to lower overall productivity and higher costs compared with dairy cattle (Babcock Institute for International Dairy Research, 2006; Chawla et al., 2009; NDRI, 2016).
Table 3
India’s cattle and buffalo inventory and growth rates
Animal type
Annual growth rate
1997 2003 2007 2012 1997-2012 2007-2012
1,000 Percent
Exotic/crossbred cattle
Male 5,344 4,945 6,844 5,971 0.7 -2.7
Female 14,755 19,741 26,216 33,760 5.7 5.2
Total 20,099 24,686 33,060 39,731 4.6 3.7
Milk animals 8,355 11,231 14,407 19,420 5.8 6.2
In milk 5,923 8,177 10,716 14,305 6.1 5.9
Dry 2,432 3,054 3,691 5,115 5.1 6.7
Indigenous cattle
Male 90,202 77,534 76,779 61,949 -2.5 -4.2
Female 88,580 82,961 89,236 89,224 0.0 0.0
Total 178,782 160,495 166,015 151,173 -1.1 -1.9
Milk animals 49,874 46,855 48,042 48,124 -0.2 0.0
In milk 27,361 27,626 30,687 29,649 0.5 -0.7
Dry 22,513 19,229 17,355 18,475 -1.3 1.3
Buffalo
Male 18,625 17,888 19,597 16,103 -1.0 -3.9
Female 71,294 80,034 85,745 92,599 1.8 1.5
Total 89,920 97,922 105,342 108,702 1.3 0.6
Milk animals 42,731 47,224 48,642 51,054 1.2 1.0
In milk 28,409 33,319 35,643 36,572 1.7 0.5
Dry 14,322 13,905 12,999 14,482 0.1 2.2
Source: USDA, Economic Research Service. Government of India, Ministry of Agriculture, Department of Animal Husbandry, Dairying and Fisheries; Basic Animal Husbandry Statistics, various issues.

5 India’s Dairy Sector: Structure, Performance, and Prospects, LDPM-272-01
Economic Research Service/USDA
Across the animal types, the animal inventory data indicate that large shares of females are not part of the milking herd. A portion of these nonmilking females are young animals prior to their first calving, but a large share are old or unproductive animals. In the case of indigenous and crossbred female cattle, unproductive animals remain in the herd because of religious and dietary strictures against cattle beef within the majority Hindu population, together with legal restrictions on cattle slaughter for either domestic or foreign consumption. The inability to cull both unpro-ductive females and males raises the costs of dairy enterprises based on cattle compared with those based on water buffalo.
In the buffalo herd, the share of females not in the milking herd also remains relatively high, but this may be changing as India’s expanding beef exports lead to increasing slaughter of culled females, as well as male calves (Landes et al.). Unlike cattle, water buffalo slaughter and meat consumption are legal throughout India. Traditionally, the domestic market for water buffalo meat has been limited, but India’s exports of water buffalo meat—also known as carabeef—are now expanding rapidly. As a result, there may be an increasing economic incentive to invest in dairy enterprises based on water buffalo because of the ability to cull and sell unproductive animals (Landes et al.).
Structure of Cattle and Water Buffalo Holdings
As with cropland, ownership of cattle and water buffalo in India is fragmented, with a large number of small farmers each raising a few animals for draught (animal traction) or milking purposes. Dairying is a secondary occupation for about 69 percent of India’s farming community (Planning Commission, 2007). It contributes about a third of the gross income of rural households and about half of the gross income of landless rural households. Women supply about 70 percent of the labor involved in livestock farming (Planning Commission, 2007). About 83 percent of India’s agricul-tural holdings are less than 2 hectares (1 hectare is 2.471 acres), and about 73 percent of cattle and 66 percent of water buffalo are on holdings of that size (table 4). While larger farmers have more animals per farm, the average number of cattle and water buffalo owned is small across all holding sizes. Across the farm size categories, average ownership of female cattle that might be used for dairying ranges from 0.6-2.0 animals per holding, and average ownership of female water buffalo ranges from 0.3-1.8 animals per holding. In contrast, the average milking herd size of a U.S. dairy
Table 4
Ownership of cattle and water buffalo by holding size in India
Holding size
Operational land holdings
Livestock ownership (2006/07)
(2005/06) Cattle Buffalo Females per holding
Avg size# of
holdingsMale Female Total Male Female Total Cattle Buffalo Total
Ha. Million Number
Marginal <1ha 0.38 83.7 33.5 47.0 80.5 12.9 27.9 40.7 0.6 0.3 0.9
Small, 1-1.99 ha 1.38 23.9 16.7 18.8 35.5 5.5 14.0 19.6 0.8 0.6 1.4
Semi-medium, 2-3.99 ha 2.68 14.1 12.2 13.5 25.6 4.3 12.4 16.6 1.0 0.9 1.8
Medium, 4-9.99 ha 5.74 6.4 6.6 8.0 14.6 2.8 8.7 11.4 1.3 1.4 2.6
Large, 10 ha & above 17.08 1.1 1.3 2.2 3.5 0.6 2.0 2.6 2.0 1.8 3.8
Sources: Government of India, Ministry of Agriculture, Directorate of Economics and Statistics, Agriculture at a Glance; Government of India, Ministry of Agriculture, Department of Animal Husbandry, Dairying and Fisheries; Basic Animal Husbandry and Fisheries Statistics.

6 India’s Dairy Sector: Structure, Performance, and Prospects, LDPM-272-01
Economic Research Service/USDA
farm was about 144 head in 2012; dairy farms with fewer than 30 cows accounted for less than 2 percent of the U.S. dairy herd and 1 percent of milk production (USDA, 2013; USDA, 2012).
The small-scale ownership pattern for cattle and water buffalo suggests the difficulty in providing specialized or intensive management to improve milk yields. India’s dairy cooperatives (see box 2, “Operation Flood and the ‘Anand Model’ of Cooperative Dairy Development,” p. 22) have been successful in organizing small farmers to improve milk production, marketing, and processing in a number of States since the 1960s. The central and State Governments have also implemented programs to improve breeding, nutrition, and management practices, but with limited impact.
More recently, and potentially significant for the future structure and productivity of dairy produc-tion, India’s private-sector dairy processors—reportedly the fastest-growing segment of the industry—favor the emergence of large-scale producers as a means of improving management and raising productivity to both increase milk quality and reduce the cost of collecting milk (Das, 2016). Informal surveys and anecdotal reporting indicate a trend toward development of larger, commer-cial dairy producers, especially around urban centers, in some cases with the assistance of private processors. There are no data available to document the extent to which this structural change is occurring, or the productivity of these operations, but this trend may provide an important catalyst to enhanced management practices and milk yields.
Regional Pattern of Milk Production
Milk production is dispersed across most of India, but the northern State of Uttar Pradesh—also the largest in terms of human population—is the largest single producing State by a wide margin (figs. 2 and 3). There is significant variation across the States in the shares of production from buffalo, crossbred cattle, and indigenous cattle, and in the pace of growth in milk production and yields. In most of the top producing States, water buffalo milk accounts for the majority of output. There are, however, a number of States where high-yielding crossbred animals account for a substantial share of output, including two—the southern States of Tamil Nadu and Kerala—where they account for the bulk of production.
Figure 2
Indian milk production by State, 2012
Source: USDA, Economic Research Service. Government of India, Ministry of Agriculture, Department of Animal Husbandry, Dairying, and Fisheries, Basic Animal Husbandry and Fisheries Statistics.
0
5
10
15
20
25
Million tons
Water buffalo Indigenous Crossbred
Uttar P
rade
sh
Andhr
a Pra
desh
Rajasth
an
Gujara
t
Punjab
Mah
aras
htra
Mad
hya
Prade
sh
Tamil N
adu
Harya
naBiha
r
Karna
taka
Wes
t Ben
gal
Kerala
Odisha
Jhar
khan
d
Jam
mu
& Kas
hmir
Uttara
khan
d
Himac
hal P
rade
sh
Chhat
tisga
rh
Other

7 India’s Dairy Sector: Structure, Performance, and Prospects, LDPM-272-01
Economic Research Service/USDA
The major buffalo-milk-producing areas include States in the north (Uttar Pradesh, Punjab, Haryana), west (Gujarat, Maharashtra, Rajasthan), south (Andhra Pradesh, Karnataka), east (Bihar), and center (Madhya Pradesh) of the country. The herd of milking buffalo is expanding in most States, but there is a wide range in average yields and in the rates of yield growth in the major producing States (table 5). The highest average yield, in the State of Punjab, is more than three times the average yield in Karnataka, and the yield growth rates also have a wide range. To some extent, the variations in performance likely reflect differences in the genetic potential of the particular buffalo breeds available in each region. Much of the water buffalo herd consists of nondescript, mixed-breed animals, although there are some pure breeds that have superior milk yields (see box 1, “India’s Dairy Breeds”). The variation in yields across States suggests the potential to raise average yields substantially through improved breeding practices in a number of major producing States over time.
Milk production from crossbred cattle is also dispersed across Indian regions, but most of the top-producing States are in the South, including the top producing State of Tamil Nadu (table 6). The expansion of the crossbred milking herd has been particularly rapid in the southern States of Karnataka and Andhra Pradesh, as well as Gujarat and West Bengal. Yield levels achieved are particularly noteworthy in Punjab, Kerala, and Gujarat, States with relatively large shares of milk production from crossbred animals. While the range of State average yields for the crossbred herd is not as wide as for the water buffalo herd, it is still indicative of significant scope for improving average yields in a number of States.
Figure 3
India’s top five dairy producing States, 2010-12 average
Source: USDA, Economic Research Service. Government of India, Ministry of Agriculture, Department of Animal Husbandry, Dairying and Fisheries, Basic Animal Husbandry and Fisheries Statistics.

8 India’s Dairy Sector: Structure, Performance, and Prospects, LDPM-272-01
Economic Research Service/USDA
Table 5
Animals in milk, yield, and production of buffalo milk in India’s top 10 producing States
State2011/12-2013/14 average 2007/08-2013/14 annual growth rate
Animals Yield/day Production Animals Yield/day Production
1,000 Kgs 1,000 tons Percent
Uttar Pradesh 9,968 4.6 16,179 4.1 0.4 4.4
Andhra Pradesh 5,539 4.6 8,993 1.8 3.8 5.7
Rajasthan 3,519 5.8 7,273 0.8 3.4 4.2
Punjab 2,088 8.9 6,612 -1.8 1.9 0.0
Gujarat 3,398 4.9 5,936 2.4 1.7 4.1
Haryana 2,221 7.5 5,950 2.3 3.0 5.3
Madhya Pradesh 3,134 3.9 4,343 2.2 2.3 4.6
Maharashtra 2,430 4.3 3,699 0.3 3.0 3.3
Bihar 2,015 4.1 2,906 1.8 0.6 2.3
Karnataka 1,792 2.7 1,737 3.1 1.6 4.6
All India 38,706 4.9 67,823 1.9 1.8 3.7
Source: USDA, Economic Research Service. Government of India, Ministry of Agriculture, Department of Animal Husbandry, Dairying and Fisheries; Basic Animal Husbandry Statistics, various issues.
Box 1
India’s Dairy Breeds
India’s size and diverse geography and climate support a similarly diverse array of cattle and water buffalo breeds that comprise the world’s largest dairy herd. While the average milk yield of India’s dairy herd is low compared with more advanced dairy economies, many indigenous breeds are capable of improved yields, and also carry beneficial traits in the form of disease resistance and the capacity to successfully convert available, relatively low-quality forages native to the region.
Buffalo: The river water buffalo common to India is well adapted to heat and humidity and, unlike other ruminants, thrives on a diet of green and dry fodders. Most water buffalo in India are categorized as nondescript or mixed, but there are 10 well-defined breeds, including
• Bhadawari: Uttar Pradesh; lactation yield of 800-1,200 kg with 6-12.5 percent milk fat.
• Murrah: Punjab and Haryana; lactation yield of 1,500-2,500 kg with 7.8 percent milk fat.
• Pandharpuri: Maharashtra; lactation yield of 1,500 kg with 7.0 percent milk fat.
• Mehsana: Gujarat; lactation yield of 1,200-1,500 kg with 7.2 percent milk fat.
Indigenous cattle: India has a large number of indigenous cattle breeds, including breeds favored for milk production, those favored for draught purposes, and multiple-purpose breeds. As with buffalo, most indigenous cattle are of mixed, nondescript breeds, but the most productive dairy breeds include
• Sahiwal: Punjab, Rajasthan; lactation yield of 1,400-2,500 kg with 4.9 percent milk fat.
• Red Sindhi: Odisha, Tamil Nadu, Kerala; lactation yield of 1,250-1,800 kg with 4.5 percent milk fat. continued—

9 India’s Dairy Sector: Structure, Performance, and Prospects, LDPM-272-01
Economic Research Service/USDA
Box 1
India’s Dairy Breeds—continued
• Tharparkar: Rajasthan, Gujarat; lactation yield of 1,800-2,600 kg with 5.0 percent milk fat.
• Gir: Gujarat; lactation yield of 1,200-1,800 kg with 4.4 percent milk fat.
Crossbred cattle: Programs to cross imported exotic dairy animals with domestic breeds through artificial insemination (AI) began in the late 1960s. Imported pure exotic breeds do not adapt well to India’s climate and disease conditions, but crossing with indigenous breeds can result in a beneficial combination of improved yields, along with adaptation to climate and disease conditions. India produces about 54 million doses of buffalo and cow semen annually, and there are 84,000 AI centers carrying out about 50 million inseminations annually. Overall, crossbred cows have double or triple the yields of indigenous breeds, depending on the breeds crossed. Exotic inheritance of around 50 percent is considered ideal for production, and the best exotic breeds tend to be Holstein, Brown Swiss, Red Dane, and Jersey, in that order (Taneja, 1999). The most prevalent crossbred combinations include
• Karan Swiss: American Brown Swiss with Sahiwal or Red Sindhi; lactation yield of 3,257 kg with 4.2-4.4 percent milk fat.
• Karan Fries: Holstein-Friesian with Tharparkar; lactation yield of 3,700 kg with 3.8-4.0 percent milk fat.
• Frieswal: Friesian (5/8) with Sahiwal (3/8); lactation yield of 2,630-2,730 kg with 3.5-4.5 percent milk fat.
Source: ICAR; FAO, Domestic Animal Diversity Information System; Taneja.
Table 6
Animals in milk, yield, and production of crossbred cattle milk in India’s top 10 producing States
State
2011/12-2013/14 average 2007/08-2013/14 annual growth rate
Animals Yield/day Production Animals Yield/day Production
1,000 Kgs 1,000 tons Percent
Tamil Nadu 2,291 6.9 5,605 1.1 1.6 2.7
Maharashtra 1,369 7.2 3,488 3.3 1.8 5.1
Punjab 692 11.3 2,780 0.6 3.4 4.0
Kerala 788 9.1 2,562 2.0 1.4 3.4
Karnataka 1,141 6.2 2,521 8.0 1.0 9.0
Andhra Pradesh 896 7.6 2,430 12.1 0.6 12.8
West Bengal 1,238 4.8 2,120 14.8 -6.9 6.8
Gujarat 630 9.0 2,028 14.2 1.4 15.7
Uttar Pradesh 668 7.3 1,729 3.0 0.2 3.2
Bihar 658 6.2 1,462 7.8 -0.1 7.6
All India 12,898 7.1 32,449 5.2 0.8 5.9
Source: USDA, Economic Research Service. Government of India, Ministry of Agriculture, Department of Animal Husbandry, Dairying and Fisheries; Basic Animal Husbandry Statistics, various issues.

10 India’s Dairy Sector: Structure, Performance, and Prospects, LDPM-272-01
Economic Research Service/USDA
The portion of the dairy herd made up of indigenous breeds tends to be located primarily across northern India (table 7). While the indigenous herd is growing more slowly than either the buffalo or crossbred herd and has substantially lower average daily yields, there is also considerable varia-tion in the average yields and growth rates achieved across the major producing States. Some of the variation in average yields is likely due to the innate potential of the breeds native to certain areas; Rajasthan and Gujarat, for example, are home to some of India’s most productive indigenous breeds (see box 1, “India’s Dairy Breeds”). However, as is the case with water buffalo and crossbred cattle, the range of yield growth rates achieved across States also suggests scope to improve the average yields of the indigenous milking herd. Upgrading of the indigenous herd through improved breeding with the superior domestic animals is also important in providing quality animals available for crossing with the exotic breeds.
The Indian data reveal a large gap between milk yields in India and more advanced dairy econo-mies. Even in the case of India’s relatively high-yielding crossbred herd, the average annual yield of about 2,531 kg (6,687 lb; 2010/11-2012/13 average) is only about 26 percent of the U.S. average annual yield of 9,980 kg (22,597 lb) during 2011-13.1 Analysis of the Indian data also suggests substantial gaps between actual and potential yields across the animal types within India. Birthal and Jha (2005) used survey data from major milk-producing States in each region to compare actual average yields with yields found to be achievable in each locality. They found average gaps of 49 percent for crossbred animals, 43 percent for indigenous breeds, and 34 percent for buffalo (fig. 4). The top factor constraining yields was determined to be use of feed and fodder, followed by breeding problems, diseases, and management issues. Further, their analysis of various cross-breeding experiments found the following impacts from crossbreeding:
1Unless otherwise specified, split year references are April/March Indian fiscal years.
Table 7
Animals in milk, yield, and production of indigenous cattle milk in India’s top 10 producing States
State2010/11-2012/13 average 2007/08-2012/13 annual growth rate
In milk Yield/day Production In milk Yield/day Production
1,000 Kgs 1,000 tons Percent
Rajasthan 3,036 3.8 4,078 1.8 2.9 4.7
Uttar Pradesh 4,509 2.6 4,243 4.1 0.5 4.6
Madhya Pradesh 3,940 2.4 3,361 2.5 5.9 8.4
West Bengal 3,020 2.2 2,314 -4.3 5.0 0.5
Bihar 2,215 3.0 2,341 3.8 0.1 3.9
Gujarat 1,524 4.1 2,203 1.6 2.6 4.2
Karnataka 1,653 2.4 1,404 1.9 1.0 2.9
Maharashtra 2,000 1.8 1,295 0.8 3.0 3.8
Andhra Pradesh 1,622 2.1 1,195 -0.6 2.7 2.1
Jharkhand 1,400 1.7 854 2.3 0.7 3.0
All India 31,596 2.4 27,474 0.8 2.9 3.7
Source: USDA, Economic Research Service. Government of India, Ministry of Agriculture, Department of Animal Husbandry, Dairying and Fisheries; Basic Animal Husbandry Statistics, various issues.

11 India’s Dairy Sector: Structure, Performance, and Prospects, LDPM-272-01
Economic Research Service/USDA
• Crossbreeds showed a significant reduction in age at first calving and calving interval, as well as a two- to three-fold increase in yield over indigenous breeds, depending on the breeds used, level of exotic inheritance, availability of inputs, and climatic conditions.
• Holstein crosses with “elite” indigenous breeds were superior to crosses with other native breeds or nondescript cattle, indicating the key role of the better indigenous breeds for crossbreeding.
• The rank order of exotic breeds in terms of milk output was Holstein, Brown Swiss, Red Dane, and Jersey.
• Exotic inheritance of about 50 percent was ideal for growth, production, and reproduction.
• Declines in milk production from the first cross between exotic and indigenous breeds (referred to as the F1 cross) to the second-generation cross between the crossbred animal and an indig-enous breed (F2) occurred because there was no quality control of the sires of the F2 animals; vigilance and records are needed for effective upgrading.
• Under free-choice feeding, crossbreeds gave 30 to 60 percent more milk than indigenous animals under general management.
Feed Use
Indian sources provide only sparse information on overall levels of feed use by cattle and water buffalo, with no available information specific to feed use or average feed rations by the dairy herd. USDA and FAO crop supply and use balances include estimates of feed use by crop commodity, but these data are not based on statistical surveys and also do not report feed use specifically by dairy animals. Government planning documents, in identifying feed availability and feeding practices as the most important constraint on milk production, provide snapshot estimates of the composition of total feed use by the animal herd (Planning Commission, 2007 and 2012). These sources indi-
Figure 4
Estimated milk yield gaps for India's dairy herd
0
10
20
30
40
50
60
East West North South
Crossbred Indigenous Buffalo
Yield gap as percent of attainable yield
Source: USDA, Economic Research Service. Birthal and Jha, 2005.

12 India’s Dairy Sector: Structure, Performance, and Prospects, LDPM-272-01
Economic Research Service/USDA
cate that the largest category of feed supply is crop residues (about 64 percent of total feed supply on a dry matter basis), followed by cultivated green fodder (18 percent), pasture and grazing (12 percent), and grain and oil cake concentrates (6 percent) (fig. 5). A different source reports that use of feed concentrates, or compound feeds, for dairy animals is rare throughout India, estimating that only 11 percent of dairy feed requirements are met through compound feeds, sharply below the 55- percent share estimated for India’s poultry sector (India Infoline News Service, 2014).
The shortfalls in actual feed use from recommended rations for cattle and water buffalo are esti-mated at about 11 percent for dry fodders, 33 percent for green fodders, and 35 percent for feed concentrates (Planning Commission, 2012). The estimated shortfalls are based on what is being supplied, not what could potentially be supplied with reallocation of land resources, application of improved technology, or feed imports. Improved feeding of the dairy herd is likely to be key to sustaining or enhancing growth in milk production and, particularly, achieving more of the rela-tively high yield potential of the crossbred herd. While the generally steady improvement in yields shown in the Department of Animal Husbandry, Dairying and Fisheries data is evidence of some gradual improvement in feeding practices, there appear to be both supply and demand factors behind the still-low levels of feed use reflected in the Planning Commission data.
The supply of crop residues—now the major component of feed—is a roughly constant ratio of the production of the cereal, pulse, oilseed, sugarcane, and other crops from which the residues are derived. Production of these crops is expanding at about 2.5 percent annually in volume terms, slower than milk output, and is likely to be primarily responsive to factors other than feed-demand pressures from the dairy sector. According to land use statistics, there has also been little change in land available for pasture and grazing, and sources report the degradation of these common property resources in some areas (Planning Commission, 2007 and 2012).
Figure 5
Composition of feed supply in India
Pasture/grazing 12%
Crop residues (straws of wheat, rice, pulses, sugarcane tops, etc.)64%
Cultivated green fodder (clover, sorghum, alfalfa, corn, millet, etc.)
18%
Concentrates (coarse grains,
oil cakes & meals)6%
Note: Percentages of total feed supply on a dry matter basis. Source: USDA, Economic Research Service. Government of India, Planning Commission, 2012.

13 India’s Dairy Sector: Structure, Performance, and Prospects, LDPM-272-01
Economic Research Service/USDA
Data on total and irrigated area under cultivated green fodder indicate that there has been little area response to the increased demand for fodder since the 1990s, and only a minor increase in the use of irrigated land to grow fodder (fig. 6). The primary factors limiting green fodder supply are identified as competition for land and the lack of quality seeds (Planning Commission, 2007 and 2012). However, green fodder production now accounts for only about 4.2 percent of India’s total cropped area and 2.7 percent of total irrigated area. This suggests that substantial increases in area planted to green fodders can occur with only marginal changes in current cropping patterns. Recent studies note the shifts in India’s land use and production patterns that are occur-ring as demand for staples, such as rice and wheat, slows relative to other foods, including fruits, vegetables, and animal products (Rada and Schimmelpfennig, 2015; Joshi et al., 2007). And while India’s seed industry remains underdeveloped in many respects, it has been largely effective in delivering quality seeds for wheat and rice, and, more recently, in supporting the expansion of hybrid cotton and corn production, in response to rising domestic and export demand.
At present, the use of concentrate feeds for dairy production is reported to be relatively small in India, with most concentrates fed to dairy animals consisting of mixes produced onfarm using locally available ingredients. India, however, also has a large and growing commercial feed industry that now primarily serves its rapidly expanding integrated broiler and egg industries in the private sector. Although consecutive droughts in 2014 and 2015 have tightened supplies of the key feed concentrate ingredients—coarse grains and oil cakes—India generally had exportable surpluses of both corn and soybean meal in recent years.
0
5
10
15
20
25
30
35
40
45
0
1
2
3
4
5
6
7
8
9
10
1990
1991
1992
1993
1994
1995
1996
1997
1998
1999
2000
2001
2002
2003
2004
2005
2006
2007
2008
2009
2010
2011
2012
Share irrigated (percent)Million hectares
Fodder area Percent irrigated
Figure 6
Fodder area and share irrigated in India
Source: USDA, Economic Research Service. Government of India, Ministry of Agriculture, Directorate of Economics and Statistics, Land use statistics.

14 India’s Dairy Sector: Structure, Performance, and Prospects, LDPM-272-01
Economic Research Service/USDA
Current low levels of feed use in the dairy sector may also be linked to demand factors rather than necessarily binding supply constraints. In particular, with a large share of milk produced for onfarm use and much of the milk that is marketed sold in only small amounts to local distributors, funds for feed purchases by the average producer—and particularly concentrate feed ingredients not produced on small holdings—are likely limited. The large number of smallholders likely also inhibits the spread of improved feeding practices. Increases in the scale of dairy animal operations, a change that is reported to be occurring with support from the expanding private dairy processing industry, is potentially a key factor supporting future gains in feeding and milk yields.
While supplies of crop residues and grazing area for dairy production are likely to be constrained, there would appear to be potential for the supply and use of green fodder and feed concentrates to accommodate increasing commercial demand for milk and dairy feeds. Trends in inflation-adjusted wholesale prices show rising real prices for fodder, corn, and oil cakes since the late 2000s, indi-cating tightening domestic markets and rising incentives to boost production of feeds (fig. 7). After droughts in 2014 and 2015, feed deficits led to some imports of corn and soymeal. In general, however, Indian domestic prices of corn and soymeal are competitive with world prices (fig. 8). At this point, it is difficult to accurately assess how quickly demand for dairy feeds will expand or how domestic supplies will respond to market incentives. The current long-term outlook is for Indian supplies of corn and soymeal to support India’s expanding demand for feeds (USDA/ERS, 2016), but a continuation of relatively high domestic feed prices may eventually lead to demand for more imports to support expansion of the poultry and dairy industries.
Figure 7
Inflation-adjusted wholesale price indices for feeds
1January-August average.Source: USDA, Economic Research Service. Government of India, Ministry of Commerce, Office of the Economic Advisor.
40
60
80
100
120
140
160
180
200
1994
1995
1996
1997
1998
1999
2000
2001
2002
2003
2004
2005
2006
2007
2008
2009
2010
2011
2012
2013
2014
2015
2016
1
2004/05 = 100
Corn Oil cake Fodder Milk

15 India’s Dairy Sector: Structure, Performance, and Prospects, LDPM-272-01
Economic Research Service/USDA
Figure 8
Indian and U.S. prices of corn and soymeal
Source: USDA, Economic Research Service. USDA, Foreign Agricultural Service (FAS) GAIN reports; USDA/FAS Oilseed Circular; USDA/ERS Feed Grains Database.
0
100
200
300
400
500
600
$/ton
U.S. corn (Gulf port)India corn; wholesale (national average)
U.S. soymeal (Decatur)India soymeal (Indore)
2000
2001
2002
2003
2004
2005
2006
2007
2008
2009
2010
2011
2012
2013
2014
2015

16 India’s Dairy Sector: Structure, Performance, and Prospects, LDPM-272-01
Economic Research Service/USDA
Milk Demand and Processing
The Government of India does not provide official statistical data on milk consumption, but USDA estimates show that, in the absence of significant dairy trade, India’s total milk disappearance has grown at about the same rate as milk production. According to USDA estimates, total disappear-ance grew about 4.2 percent annually between 2000 and 2015, slightly faster than during the 1990s. Estimated fluid (beverage) use grew about 4.0 percent annually during 2000-15, faster than the previous decade, while growth in processing (or manufacturing) milk–including both home and factory processing—slowed to about 4.4 percent (table 8). Overall, the USDA data indicate that about 40 percent of milk disappears in fluid (beverage) form, with about 60 percent transformed into other products either in the home or commercially.
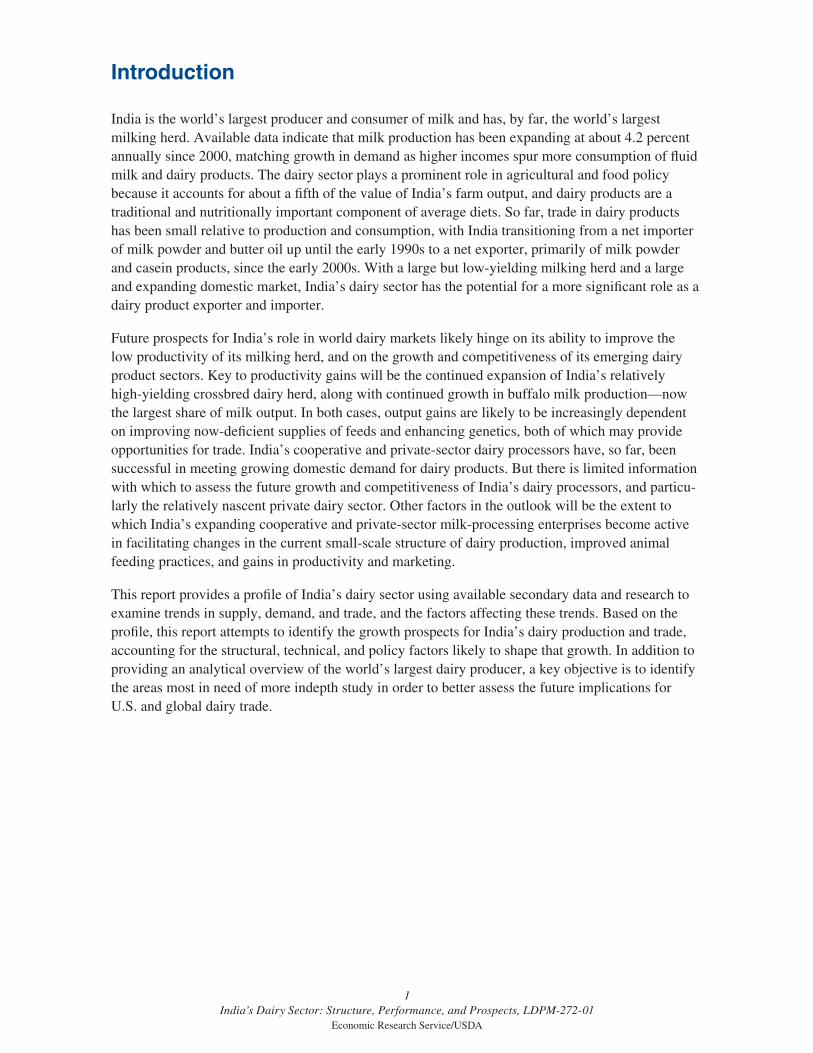
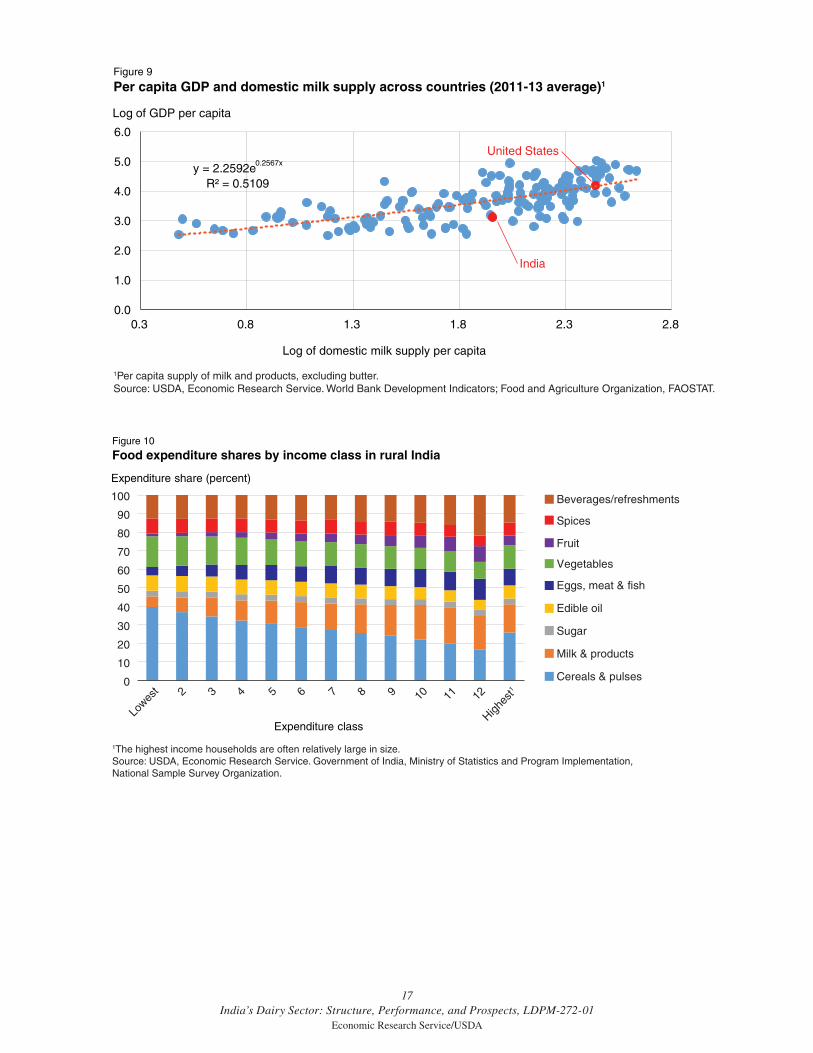
Per capita domestic supply of milk and products in India—a reasonable proxy for domestic consumption because only relatively small amounts of dairy products are traded internationally or stored—was about 81 kg during 2009-11, below the world average of 89 kg per capita based on FAO data. Per capita domestic supply is rising at about 2.5 percent per year, in concert with rising per capita incomes. As is the case globally, demand for milk and milk products in India is respon-sive to incomes and, with estimated Indian per capita consumption supply below the world average, demand is likely to continue to rise with incomes (fig. 9). The pattern of increased demand for dairy products in response to higher incomes is supported by Indian household survey data on shares of income allocated to various food categories across income classes. In rural areas, which account for about 70 percent of India’s population, expenditures on milk and milk products increase more than any other food group as incomes rise (fig. 10). In urban areas, milk and milk product expenditures expand more than any other food group except (nondairy) beverages and refreshments (fig. 11).
Table 8
Growth rates in production and consumption of dairy products in India1
Commodity
Annual growth rate
1990-2000 2000-15
Percent
Milk
Production 3.9 4.2
Consumption 3.9 4.2
Fluid use 2.3 4.0
Processing use 5.3 4.4
Butter
Production 7.6 6.4
Consumption 7.6 6.4
Skim milk powder
Production 7.2 8.7
Consumption 8.1 8.0
Whey
Production2 -- -25.8
Consumption 65.2 41.81Growth rates are between 3-year averages centered on the years indicated. 22006-13. Source: USDA, Economic Research Service. Computed from USDA, Foreign Agricultural Service, PS&D Online, and FAOSAT data.
17 India’s Dairy Sector: Structure, Performance, and Prospects, LDPM-272-01
Economic Research Service/USDA
Figure 10
Food expenditure shares by income class in rural India
1The highest income households are often relatively large in size.Source: USDA, Economic Research Service. Government of India, Ministry of Statistics and Program Implementation, National Sample Survey Organization.
0
10
20
30
40
50
60
70
80
90
100
Expenditure class
Beverages/refreshments
Spices
Fruit
Vegetables
Eggs, meat & fish
Edible oil
Sugar
Milk & products
Cereals & pulses
Expenditure share (percent)
Lowes
t 2 3 4 5 6 7 8 9 10 11 12
Highes
t1
Figure 9
Per capita GDP and domestic milk supply across countries (2011-13 average)1
1Per capita supply of milk and products, excluding butter.Source: USDA, Economic Research Service. World Bank Development Indicators; Food and Agriculture Organization, FAOSTAT.
y = 2.2592e0.2567x
R² = 0.5109
0.0
1.0
2.0
3.0
4.0
5.0
6.0
0.3 0.8 1.3 1.8 2.3 2.8
Log of domestic milk supply per capita
Log of GDP per capita
India
United States

18 India’s Dairy Sector: Structure, Performance, and Prospects, LDPM-272-01
Economic Research Service/USDA
Milk Prices
Inflation-adjusted wholesale prices indicate upward pressure on fluid milk prices since the late 2000s. At the wholesale level, fluid milk prices are now roughly 40 percent higher in inflation-adjusted terms since 2008, while those for dairy products are 5-10 percent higher over the same period (fig. 12). There has been less pronounced upward pressure on inflation-adjusted retail prices, with the average retail price for fluid milk in major markets increasing about 0.9 percent annually since 2009 (fig. 13). Pressures on retail prices of fluid milk have varied across regions, with the largest real price increases occurring in the major urban centers of Mumbai, Bangalore, and Chennai. In contrast to fluid milk, inflation-adjusted wholesale prices for dairy products have remained relatively stable (fig. 12). Retail price series for dairy products are not available.
Rising fluid milk prices are in keeping with higher prices for many food categories—including cereals, fruits and vegetables, and many animal products—since the mid-2000s. Rising food prices, driven largely by rising incomes, urbanization, and demand for more diversified diets, are a key concern of policymakers. The average Indian household spends nearly 50 percent of its income on food—and India’s substantial low-income population spends even a larger share—making house-hold welfare particularly vulnerable to higher food prices. Persistent pressures on domestic milk prices, and particularly those of tradeable milk products, could boost Government efforts to increase production and, if necessary, imports.
Figure 11
Food expenditure shares by income class in urban India
1The highest income households are often relatively large in size.Source: USDA, Economic Research Service. Government of India, Ministry of Statistics and Program Implementation, National Sample Survey Organization.
0
10
20
30
40
50
60
70
80
90
100
Expenditure class
Beverages/refreshments
Spices
Fruit
Vegetables
Eggs, meat & fish
Edible oil
Sugar
Milk & products
Cereals & pulses
Expenditure share (percent)
Lowes
t 2 3 4 5 6 7 8 9 10 11 12
Highes
t1

19 India’s Dairy Sector: Structure, Performance, and Prospects, LDPM-272-01
Economic Research Service/USDA
Figure 13
Inflation-adjusted retail prices of fluid milk in India
Source: USDA, Economic Research Service. Government of India, Ministry of Food, Civil Supplies, and Public Distribution, Department of Food.
8
9
10
11
12
13
14
15
16
17
18
2009 2010 2011 2012 2013 2014 2015 2016
Rs/liter
Ahmedabad
Mumbai
Hyderabad
Average
Delhi
Chennai
Kolkata
Banglaore
Figure 12
Inflation-adjusted wholesale prices for milk and products in India
1January-August average.Source: USDA, Economic Research Service. Government of India, Ministry of Commerce, Office of the Economic Advisor.
1994
1995
1996
1997
1998
1999
2000
2001
2002
2003
2004
2005
2006
2007
2008
2009
2010
2011
2012
2013
2014
2015
2016
1
50
60
70
80
90
100
110
120
130
140
150
160
2004/05 = 100
Milk Dairy products All food

20 India’s Dairy Sector: Structure, Performance, and Prospects, LDPM-272-01
Economic Research Service/USDA
Milk Marketing
According to GOI estimates, nearly half of India’s milk production is consumed by the household in which it is produced and is not marketed (fig. 14). Milk that is not marketed is either consumed in unprocessed fluid form or is converted in the home into traditional products like butter, ghee (clari-fied butter), paneer (a type of cottage cheese), and curd (yogurt).2
The bulk of the milk sold outside the household is marketed as either unprocessed (not homoge-nized or pasteurized) fluid milk or processed products manufactured by small-scale, private vendors. These traditional milk supply chains are prevalent throughout rural and urban India, and typically involve a chain of intermediaries who collect milk from producers for retail distribution within a small area. It is estimated that only about 15 percent of the milk produced is marketed, in roughly equal shares, through formal cooperatives or private firms, as either processed fluid milk or other processed products.
Dairy Cooperatives . India’s network of farmer-owned dairy cooperatives, organized using the “Anand model” that originated in the State of Gujarat prior to independence, has been one of the most successful cooperative movements in India and the key early driver of dairy development in India. In 2011, the dairy cooperative now included 22 State milk marketing federations, 183 district milk producer unions, and nearly 156,000 village-level cooperative societies with a total member-ship of about 15.1 million dairy farmers. Currently available data indicate that there were 263 coop-erative dairy plants with a total daily processing capacity of about 43 million liters of fluid milk (table 9), with the States of Gujarat, Maharashtra, Karnataka, and Tamil Nadu accounting for large shares of cooperative-owned processing capacity. The cooperative plants process fluid milk, and many also manufacture other value-added products (Planning Commission, 2012).
2The term “curd,” as commonly used in the United States and elsewhere refers to a substance obtained by milk coagulation usually used in the production of cheese. In India, the term ‘curd’ generally refers to “yogurt” and the two terms are used interchangeably.
Figure 14
Fluid milk marketing channels in India
Private organizedsector, 7%
Cooperativesector, 8%
Small-scale vendors, 36%
Consumed in household/not traded, 48%
Source: USDA, Economic Research Service. Government of India, Ministry of Agriculture, Department of Animal Husbandry, Dairying, and Fisheries, National Dairy Plan.
2007/08-2011/12 estimates

21 India’s Dairy Sector: Structure, Performance, and Prospects, LDPM-272-01
Economic Research Service/USDA
While broadly successful, the cooperatives are subject to differing State laws and management structures ranging from elected professional management to management by Government officials with limited technical or management expertise. (See box 2, “Operation Flood and the ‘Anand Model’ of Cooperative Dairy Development” for more details.)
Private Dairy Processing . Prior to 1991, investment in dairy marketing and processing facili-ties was, with a few exceptions, restricted to the cooperative sector. In 1991, dairy processing was delicensed (opened to private investment without prior approval), leading to the expansion of private investment in the sector. Private-sector capacity is now expanding faster than the coopera-tive sector. Official data indicate that there were about 765 private processing plants in 2011, with a daily capacity of about 73 million liters, about 70 percent more than cooperative capacity (table 9). Since the private and cooperative sectors now handle roughly equal shares of milk output (fig. 14), these data suggest a large amount of excess capacity has been developed by private investment. The largest concentrations of private capacity are in the northern State of Uttar Pradesh—also the largest milk producer—and the western State of Maharashtra, but with substantial capacity in the other major milk-producing States of Punjab, Andhra Pradesh, Madhya Pradesh, and Tamil Nadu.
Table 9
Number and capacity of dairy plants by State in India
State
Cooperative Private Government Total
Number Capacity Number Capacity Number Capacity Number Capacity
No. 1,000 ltrs/day No. 1,000 ltrs/day No. 1,000 ltrs/day No. 1,000 ltrs/day
Maharashtra 86 7,865 276 15,641 33 3,086 395 26,592
Uttar Pradesh 35 2,476 216 22,569 0 0 251 25,045
Gujarat 16 13,160 15 917 2 400 33 14,477
Tamil Nadu 11 4,030 26 5,289 0 0 37 9,319
Punjab 13 1,820 64 6,529 0 0 77 8,349
Andhra Pradesh
9 2,150 39 5,693 0 0 48 7,843
Rajasthan 18 2,420 20 3,361 0 0 38 5,781
Madhya Pradesh
5 1,000 35 4,013 0 0 40 5,013
Karnataka 16 4,323 8 485 0 0 24 4,808
Delhi 0 0 1 3,500 1 500 2 4,000
Harayana 5 470 31 2,417 1 60 37 2,947
West Bengal 3 816 12 1,145 0 0 15 1,961
Kerala 15 1,223 10 373 0 0 25 1,596
Bihar 10 700 2 400 0 0 12 1,100
Other 21 798 10 920 0 0 31 1,718
Total 263 43,251 765 73,252 37 4,046 1,065 120,548
Note: As of March 31, 2011. Includes central and State registered capacity. Data are based on reported plant capacity. Rates of capacity utilization are reportedly low, at least partially accounting for the discrepancy in implied private and cooperative market shares shown in figure 14. Source: USDA, Economic Research Service. Government of India, Ministry of Agriculture, Department of Animal Husbandry, Dairying, and Fisheries. Basic Animal Husbandry and Fisheries Statistics (various issues).

22 India’s Dairy Sector: Structure, Performance, and Prospects, LDPM-272-01
Economic Research Service/USDA
The expansion of private processors relative to cooperatives suggests their potential to play an increasingly important role in shaping the development of the sector. In contrast to India’s coop-eratives, which facilitate and enable small-scale production, the private processors are more likely to support development of larger-scale dairy operations, with the goal of improving productivity and sanitary handling practices, as well as reducing the cost of milk collection. While the available data indicate excess capacity within the private dairy-processing sector, excess capacity is common in Indian agro-processing and manufacturing industries and does not necessarily indicate limited demand or prospects for future growth.
Box 2
Operation Flood and the “Anand Model” of Cooperative Dairy Development
Introduction of the Anand model of cooperative dairy development through the Operation Flood program has been the key feature of India’s dairy development efforts. The first cooperative was established in Anand, Gujarat, in 1946 in reaction to the low prices farmers received from a private dairy for their milk. Producers formed a cooperative in order to sell directly to consum-ers, obtaining higher prices for their milk. The “Anand Model” is a three-tiered approach that includes (1) village-level dairy cooperative societies that collect milk with quality-based pay-ments to members; (2) District Cooperative Milk Producers’ Unions (DCMPUs) that process, market, and provide technical support for the village-level societies; and (3) State Cooperative Milk Marketing Federations that provide a range of marketing, feed manufacture, and admin-istrative functions. The village-level societies collect milk daily from members, with the milk chilled, aggregated, and transported to a cooperative plant owned by a DCMPU. Members receive an immediate payment based on the fat content of their milk, and a later payment based on the overall earnings of the district and State unions. Most district unions provide a range of inputs and services to village societies, including feed, veterinary care, and artificial insemina-tion services, and they provide training and advisory services to the village societies.
Operation Flood was introduced in 1970 with World Bank assistance with the goals of supporting self-sufficiency in milk production, improving nutrition, and boosting rural incomes. The first phase of Operation Flood expanded a system of cooperatives to collect, transport, and distribute milk from producers to consumers. The number of village cooperatives expanded rapidly during this period, and 18 milk sheds were established to link milk supplies from cooperatives with major population centers in Delhi, Mumbai, Calcutta, and Chennai. During Operation Flood II (1981-5), the number of milk sheds grew to 136, serving 290 urban markets, and the number of village cooperatives reached 43,000 (Rajendran and Mohanty, 2004). Operation Flood III (1985-96) focused on improving transport infrastructure and services to cooperative members, including a greater focus given to improving cattle health, as well as producer education.
According to the National Dairy Development Board (NDDB), in 2012/13, DCMPUs procured on average 31.75 million liters of milk per day and sold about 23.7 million liters of processed fluid milk per day. According to industry estimates, dairy cooperatives account for approximately 60 percent of processed fluid milk in India. Some of the district milk producer unions are now among the largest milk processors in India. Anand Milk Producers Union, Ltd. (AMUL), owned by the Gujarat Cooperative Milk Producer’s Union, Ltd. (GCMPU), is India’s largest national dairy processor and food brand, marketing a broad array of fluid and processed dairy products.

23 India’s Dairy Sector: Structure, Performance, and Prospects, LDPM-272-01
Economic Research Service/USDA
Processed Products
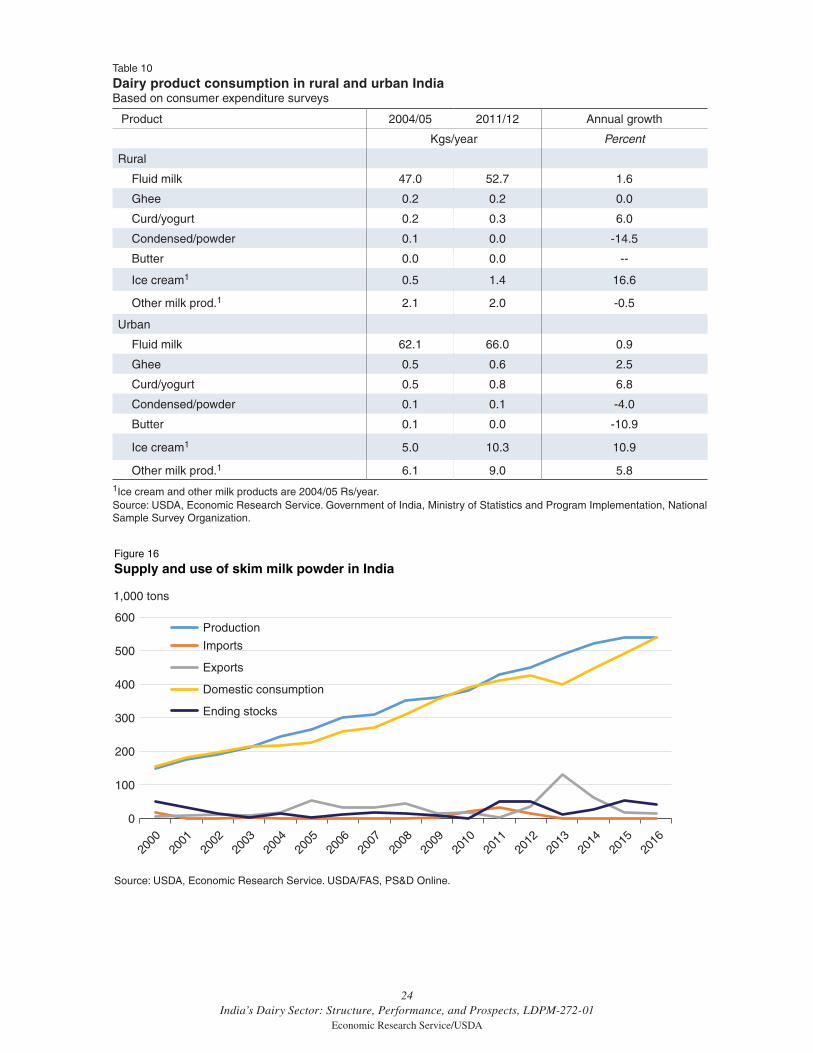
India produces and consumes an array of traditional and modern dairy products. Overall, demand for these products is growing faster than demand for fluid beverage milk, particularly in urban areas. Estimates of the composition of dairy product consumption by the National Dairy Development Board are shown in figure 15, and suggest the wide variety of traditional Indian dairy products that are produced and consumed. Consumer survey data from rural and urban households confirm that, although fluid milk is the dominant category of use, there is a general pattern of relatively slow growth in per capita consumption of fluid (beverage) milk compared with processed products (table 10). The exceptions to this pattern are butter and condensed and powdered milk, which both show no or negative growth in both rural and urban areas between 2004/05 and 2011/12. Growth in processed product demand was strongest in urban areas. Rural areas, in contrast, showed relatively strong gains in fluid milk consumption, and less robust growth in demand for some processed products.
Skim milk powder (SMP). USDA data imply substantially faster growth in per capita use of nonfat dry milk (here deemed to be essentially the same as SMP) of about 7.8 percent per year, than do the GOI consumer survey data in table 10. This difference is likely partially, and perhaps entirely, explained by the use of nonfat dry milk in products that cannot be observed in the consumer expen-diture data. Most of SMP (and butter oil) use in India is by dairies that produce reconstituted milk during the summer lean season when fresh milk supplies are relatively limited (Chawla et al., 2009). Retail sales of SMP are reported to be small. Historically, India has both imported and exported small amounts of SMP, depending on the demand for reconstituted milk, but with some growth in exportable surpluses since 2012 (fig. 16).
Figure 15
Indian dairy consumption by product, 2012
Note: Product shares are in value terms.Source: USDA, Economic Research Service. National Dairy Development Board.
Fluid (beverage)milk, 46%
Ghee (clarified butter), 28%
Butter, 7%
Curd (yogurt), 7%
Khoa (dried whole milkused in sweets), 7%
Nonfat dry milk powder, 4%
Paneer (type of cottage cheese), 2%
Other, including ice cream, 1%
24 India’s Dairy Sector: Structure, Performance, and Prospects, LDPM-272-01
Economic Research Service/USDA
Figure 16
Supply and use of skim milk powder in India
Source: USDA, Economic Research Service. USDA/FAS, PS&D Online.
0
100
200
300
400
500
600
1,000 tons
Production
Imports
Exports
Domestic consumption
Ending stocks
2000
2001
2002
2003
2004
2005
2006
2007
2008
2009
2010
2011
2012
2013
2014
2016
2015
Table 10
Dairy product consumption in rural and urban IndiaBased on consumer expenditure surveys
Product 2004/05 2011/12 Annual growth
Kgs/year Percent
Rural
Fluid milk 47.0 52.7 1.6
Ghee 0.2 0.2 0.0
Curd/yogurt 0.2 0.3 6.0
Condensed/powder 0.1 0.0 -14.5
Butter 0.0 0.0 --
Ice cream1 0.5 1.4 16.6
Other milk prod.1 2.1 2.0 -0.5
Urban
Fluid milk 62.1 66.0 0.9
Ghee 0.5 0.6 2.5
Curd/yogurt 0.5 0.8 6.8
Condensed/powder 0.1 0.1 -4.0
Butter 0.1 0.0 -10.9
Ice cream1 5.0 10.3 10.9
Other milk prod.1 6.1 9.0 5.81Ice cream and other milk products are 2004/05 Rs/year.Source: USDA, Economic Research Service. Government of India, Ministry of Statistics and Program Implementation, National Sample Survey Organization.
25 India’s Dairy Sector: Structure, Performance, and Prospects, LDPM-272-01
Economic Research Service/USDA
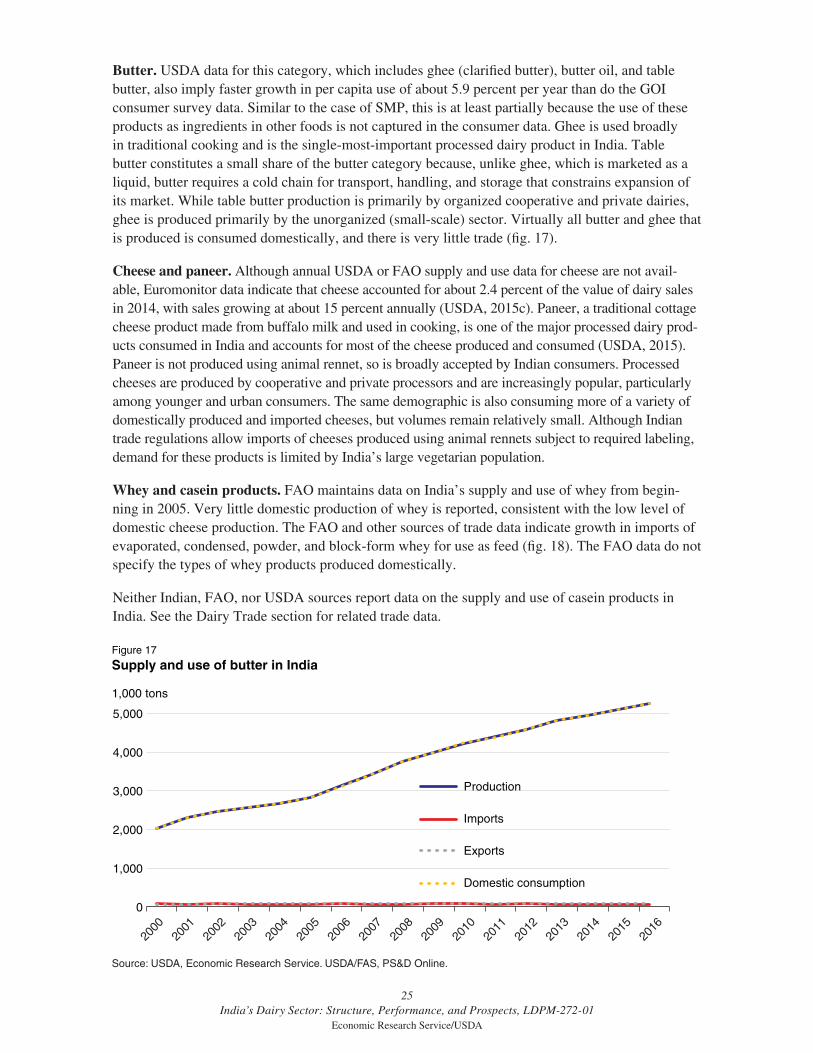
Butter . USDA data for this category, which includes ghee (clarified butter), butter oil, and table butter, also imply faster growth in per capita use of about 5.9 percent per year than do the GOI consumer survey data. Similar to the case of SMP, this is at least partially because the use of these products as ingredients in other foods is not captured in the consumer data. Ghee is used broadly in traditional cooking and is the single-most-important processed dairy product in India. Table butter constitutes a small share of the butter category because, unlike ghee, which is marketed as a liquid, butter requires a cold chain for transport, handling, and storage that constrains expansion of its market. While table butter production is primarily by organized cooperative and private dairies, ghee is produced primarily by the unorganized (small-scale) sector. Virtually all butter and ghee that is produced is consumed domestically, and there is very little trade (fig. 17).
Cheese and paneer . Although annual USDA or FAO supply and use data for cheese are not avail-able, Euromonitor data indicate that cheese accounted for about 2.4 percent of the value of dairy sales in 2014, with sales growing at about 15 percent annually (USDA, 2015c). Paneer, a traditional cottage cheese product made from buffalo milk and used in cooking, is one of the major processed dairy prod-ucts consumed in India and accounts for most of the cheese produced and consumed (USDA, 2015). Paneer is not produced using animal rennet, so is broadly accepted by Indian consumers. Processed cheeses are produced by cooperative and private processors and are increasingly popular, particularly among younger and urban consumers. The same demographic is also consuming more of a variety of domestically produced and imported cheeses, but volumes remain relatively small. Although Indian trade regulations allow imports of cheeses produced using animal rennets subject to required labeling, demand for these products is limited by India’s large vegetarian population.
Whey and casein products . FAO maintains data on India’s supply and use of whey from begin-ning in 2005. Very little domestic production of whey is reported, consistent with the low level of domestic cheese production. The FAO and other sources of trade data indicate growth in imports of evaporated, condensed, powder, and block-form whey for use as feed (fig. 18). The FAO data do not specify the types of whey products produced domestically.
Neither Indian, FAO, nor USDA sources report data on the supply and use of casein products in India. See the Dairy Trade section for related trade data.
Figure 17
Supply and use of butter in India
Source: USDA, Economic Research Service. USDA/FAS, PS&D Online.
2000
2001
2002
2003
2004
2005
2006
2007
2008
2009
2010
2011
2012
2013
2014
2016
2015
0
1,000
2,000
3,000
4,000
5,000
1,000 tons
Production
Imports
Exports
Domestic consumption

26 India’s Dairy Sector: Structure, Performance, and Prospects, LDPM-272-01
Economic Research Service/USDA
Domestic Food Safety Issues
The formulation and enforcement of food safety regulations in the dairy industry face particular challenges associated with the highly dispersed and small-scale nature of production and marketing. Under the Food Safety and Standards Regulations (FSSR) of 2011, the Food Safety and Standards Authority of India (FSSAI) is the regulatory agency tasked with setting and enforcing science-based food safety standards. The FSSR applies equally to both domestic and imported foods and requires all food processors, manufacturers, exporters, and importers to have their products certified according to FSSAI regulations.
A 2011 FSSAI survey found that nearly 70 percent of fluid milk samples tested nationally did not conform to standards (Center for Science and Environment, 2012). The most common problem was adulteration with water, which introduces health risks associated with frequently unsafe water supplies, as well as reducing nutritional value. Additional adulterants included SMP and glucose, added to increase the nonfat solids content of watered-down milk, and detergents. Frequency of contamination varied by region, ranging from 100 percent of samples showing adulteration in seven States and relatively low frequency of 7-12 percent in some other States. Concerns with food safety in India extend well beyond the dairy sector and led to the 2011 establishment of the FSSAI, which combines functions formerly dispersed among multiple agencies in order to strengthen food safety regulation and enforcement.
Consumer expectations of food quality and safety have risen, leading to the emergence of private “organic” dairies and branded “farm-to-home” delivery enterprises that claim higher product quality and safety. Although the “farm-to-home” market is estimated at only 1 percent of milk and dairy sales, companies like Pride of Cows and True Milk are expanding in urban areas (Bearak, 2014).
Figure 18
Supply and use of whey in India
Note: Includes dry, condensed, and preserved & concentrated whey productsSource: USDA, Economic Research Service. Food and Agriculture Organization, FAOSTAT.
0
20
40
60
80
100
120
140
160
2000 2001 2002 2003 2004 2005 2006 2007 2008 2009 2010 2011 2012 2013
1,000 tons
Production
Imports
Exports
Feed use

27 India’s Dairy Sector: Structure, Performance, and Prospects, LDPM-272-01
Economic Research Service/USDA
Dairy Trade
Despite India’s position as the world’s largest milk producer and consumer, it has, so far, played only a minor role in world and U.S. dairy trade. India’s trade policy toward its major historical dairy imports—skim milk powder (SMP) and butter oil—has recently vacillated between facilitating imports and exports depending on domestic market conditions. Recent trends, however, suggest that a structural surplus may be emerging. India has been a growing net exporter of dairy products since 2000, with annual exports averaging $428 million during 2013-15 and annual imports averaging $69 million. Exports consist primarily of milk powders and casein products, along with smaller amounts of butterfat products and infant formula. Imports have historically included milk powders and concentrates, but recently have consisted primarily of whey products. The United States does play a role as a supplier of India’s small imports of lactose, whey products, and casein products, as well as a market for Indian exports of casein, butterfat, and infant formula.
Exports
Although India’s dairy exports have expanded, annual exports still account for less than 1 percent of dairy exports by major exporters (FAO, FAOSTAT). SMP (HS code 040210) has accounted for much of the growth in dairy exports since 2000 (table 11). SMP exports dropped during 2009-12, a period of high domestic food price inflation that led the Government to restrict exports. Exports recovered to higher levels when restrictions were removed during 2012-14, but then fell again when world demand and prices dropped in 2015. SMP exports are shipped to a broad array of more than 120, mostly developing country, markets in Asia, the Middle East, and Africa. During 2015, the largest single market was Bangladesh, with Pakistan, Egypt, Algeria, and Yemen rounding out the top 5 SMP markets (table 12).
Casein products, primarily categorized as casein derivatives and glues (HS codes 350110 and 350190), have been India’s second-largest dairy export category since the early 2000s, expanding to average about $78 million annually during 2013-15. The United States was the major destination for Indian casein product exports, accounting for 53 percent of exports during 2013-15. Other signifi-cant markets were Poland, Germany, and Saudi Arabia (table 12).
Butter and butterfat products (HS code 0405), along with infant formula (HS code 190110), have been India’s other largest dairy export categories, with annual exports averaging $43.6 million and $36.3 million respectively during 2013-15. The United Arab Emirates is, by far, the top market for butter and butterfat, followed by Oman, Singapore, Morocco, and Saudi Arabia. Three markets, Bangladesh, the United States, and Nepal, account for the bulk of India’s exports of infant formula (table 12).
Comparisons of export unit values for dairy products for India and major dairy exporters indicate that Indian exports are price competitive with the other suppliers in the case of SMP and casein, but less so in the case of butter. Indian SMP and casein export unit values matched closely with the other suppliers during the 2000s and trended below the other suppliers during 2011-14, but became uncompetitive when world prices dropped in 2015 (figs. 19 & 20). For butter, Indian export unit values tend to be high compared with the other suppliers (fig. 21). The pattern of less competitive prices for butter compared with SMP and casein may reflect India’s large deficit in vegetable oils, along with a strong traditional consumer preference for butterfat in the form of ghee.

28 India’s Dairy Sector: Structure, Performance, and Prospects, LDPM-272-01
Economic Research Service/USDA
Tabl
e 11
Ind
ian
exp
ort
s o
f d
airy
pro
du
cts
Pro
duct
1999
2000
2001
2002
2003
2004
2005
2006
2007
2008
2009
2010
2011
2012
2013
2014
2015
Mill
ion
dolla
rs
Ski
m m
ilk p
owde
r3.
18.
526
.015
.614
.831
.299
.868
.910
4.3
156.
335
.450
.88.
910
6.2
420.
021
7.5
49.6
Who
le m
ilk p
owde
r0.
91.
36.
00.
91.
46.
323
.420
.13.
439
.34.
29.
53.
60.
120
.314
.54.
6
But
ter
& b
utte
rfat
3.9
4.8
5.0
4.8
5.5
8.2
15.4
13.8
21.9
66.4
22.0
40.7
46.1
35.2
39.7
46.4
44.6
Che
ese
0.1
0.1
0.3
0.5
0.9
0.5
2.1
2.1
4.9
12.5
7.2
8.7
8.1
13.4
12.7
19.4
18.5
Cas
ein
& m
ilk p
rote
in p
rodu
cts
18.1
22.9
30.6
26.9
16.1
37.9
65.8
40.9
116.
999
.042
.477
.827
.770
.810
0.2
96.9
35.6
Infa
nt fo
rmul
a4.
84.
59.
97.
77.
710
.311
.613
.913
.117
.020
.222
.235
.015
.429
.135
.943
.9
Oth
er d
airy
pro
duct
s0.
30.
91.
91.
22.
03.
33.
54.
119
.510
.75.
34.
07.
38.
710
.117
.07.
1
Tota
l31
.143
.079
.757
.648
.497
.822
1.7
163.
828
4.1
401.
213
6.7
213.
713
6.6
249.
963
2.2
447.
720
3.8
To
ns
Ski
m m
ilk p
owde
r2,
052
5,48
114
,980
11,0
299,
790
16,5
7253
,246
32,7
0031
,832
43,7
8015
,378
18,0
922,
923
37,1
2912
9,71
561
,301
17,1
11
Who
le m
ilk p
owde
r55
179
43,
472
583
720
2,11
310
,679
9,35
81,
217
9,98
51,
332
2,56
11,
267
445,
186
3,63
31,
060
But
ter
& b
utte
rfat
1,65
21,
724
1,66
81,
862
1,85
32,
793
6,18
45,
419
6,40
418
,879
5,75
99,
550
9,70
76,
898
8,46
78,
671
7,89
6
Che
ese
2857
120
212
592
220
953
807
1,45
82,
962
2,37
52,
749
2,18
93,
370
3,13
34,
695
4,38
8
Cas
ein
& m
ilk p
rote
in p
rodu
cts
3,87
05,
753
7,15
37,
442
4,50
37,
596
11,4
967,
395
15,4
9411
,043
6,94
710
,585
3,39
99,
515
11,8
2210
,553
5,97
1
Infa
nt fo
rmul
a2,
616
2,08
45,
425
4,19
63,
480
4,85
95,
563
5,28
54,
714
5,85
97,
924
5,99
012
,317
4,28
16,
840
7,29
99,
829
Sou
rce:
US
DA
, Eco
nom
ic R
esea
rch
Ser
vice
. Glo
bal T
rade
Info
rmat
ion
Ser
vice
s, In
c., W
orld
Tra
de A
tlas,
199
3-20
16.
Tabl
e 12
Ind
ia’s
to
p 5
mar
kets
fo
r it
s m
ajo
r d
airy
exp
ort
cat
ego
ries
Ski
m m
ilk p
owde
r1C
asei
n pr
oduc
ts2
But
ter
and
butte
rfat
3In
fant
form
ula4
Cou
ntry
2013
-15
expo
rts
Cou
ntry
2013
-15
expo
rts
Cou
ntry
2013
-15
expo
rts
Cou
ntry
2013
-15
expo
rts
$ m
illio
n$
mill
ion
$ m
illio
n$
mill
ion
Ban
glad
esh
56
.1U
nite
d S
tate
s
41.0
UA
E17
.2B
angl
ades
h
21
.2
Pak
ista
n
26.2
Pol
and
11.0
Om
an
3.4
Uni
ted
Sta
tes
4.
6
Egy
pt
22.2
Ger
man
y
6.
1S
inga
pore
3.
1N
epal
4.
4
Alg
eria
15.9
Sau
di A
rabi
a
5.
1M
oroc
co
2.
8B
huta
n
1.
5
Yem
en
14.5
Phi
lippi
nes
2.6
Sau
di A
rabi
a
2.
4Ye
men
1.
51 H
S c
ode
0402
10. 2 H
S c
odes
350
110
& 3
5019
0. 3 H
S c
ode
0405
. 4 HS
cod
e 19
0110
. S
ourc
e: U
SD
A, E
cono
mic
Res
earc
h S
ervi
ce. G
loba
l Tra
de In
form
atio
n S
ervi
ces,
Inc.
, Wor
ld T
rade
Atla
s, 1
993-
2016
.

29 India’s Dairy Sector: Structure, Performance, and Prospects, LDPM-272-01
Economic Research Service/USDA
Figure 19
India and competitor export unit values for skim milk powder1
1HS code 040210.Source: USDA, Economic Research Service. Global Trade Information Services, Inc., World Trade Atlas, 1993-2016.
1.00
1.50
2.00
2.50
3.00
3.50
4.00
4.50
$/kg
India
Australia
New Zealand
US
EU-27
2000
1999
2001
2002
2003
2004
2005
2006
2007
2008
2009
2010
2011
2012
2013
2014
2015
Figure 20
India and competitor export unit values for casein1
1HS code 350190.Source: USDA, Economic Research Service. Global Trade Information Services, Inc., World Trade Atlas, 1993-2016.
2000
1999
2001
2002
2003
2004
2005
2006
2007
2008
2009
2010
2011
2012
2013
2014
2015
2
4
6
8
10
12
14
$/kg
India
Australia
New Zealand
US
EU-27

30 India’s Dairy Sector: Structure, Performance, and Prospects, LDPM-272-01
Economic Research Service/USDA
Imports
During the 1970s and 1980s, India imported substantial amounts of SMP and butter oil, mostly as food aid supplied on concessional terms, for reconstitution into fluid milk to address local and seasonal shortfalls in domestic fluid milk production. Since 2000, however, Indian SMP and butter oil imports have been small and have shown little growth except during a period of high domestic food price inflation during 2009-12, when the Government relaxed quota restrictions on imports (table 13). Since 2000, SMP imports have been conducted commercially, with the EU-28, Australia, and New Zealand the major suppliers.
In recent years, lactose has comprised a large share of India’s dairy imports (43 percent for 2013-15). Lactose is the primary sugar found in milk and a byproduct in the production of whey protein products. It is a bland sugar used in confections, infant foods, chemicals/pharmaceuticals, dairy products, and many types of food preparations. It is sometimes used as a constituent in the manu-facture of milk powder to lower the protein percentage to a specified standard level. Germany, the Netherlands, and the United States have been India’s largest import suppliers of lactose in recent years (table 14).3
The United States and France have been leading suppliers of whey products (primarily dry whey, modified whey, and milk albumin—a product consisting of at least two highly concentrated whey proteins). The top five suppliers of cheese from 2013-15 have all been from the Europe, with Italy as the top supplier. The Netherlands and New Zealand have been top suppliers of casein products, with the United States as a distant third.
3The United States has not manufactured significant quantities of casein since mid-1960s (USDA, Economics and Statistics Service, 1981). Some U.S. manufacturers produce significant quantities of caseinate from imported casein, and some of it is exported to other countries.
Figure 21
India and competitor export unit values for butter1
1HS code 040510.Source: USDA, Economic Research Service. Global Trade Information Services, Inc., World Trade Atlas, 1993-2016.
2000
1999
2001
2002
2003
2004
2005
2006
2007
2008
2009
2010
2011
2012
2013
2014
2015
0.00
1.00
2.00
3.00
4.00
5.00
6.00
7.00
$/kg
India
Australia
New Zealand
US
EU-27

31 India’s Dairy Sector: Structure, Performance, and Prospects, LDPM-272-01
Economic Research Service/USDA
Tabl
e 13
Ind
ian
imp
ort
s o
f d
airy
pro
du
cts
Pro
duct
1999
2000
2001
2002
2003
2004
2005
2006
2007
2008
2009
2010
2011
2012
2013
2014
2015
Mill
ion
dolla
rs
Lact
ose
2.2
4.1
5.3
5.9
9.7
10.4
8.7
12.9
22.7
22.9
22.7
30.8
49.1
50.7
55.3
55.9
48.0
Whe
y pr
oduc
ts0.
00.
11.
00.
71.
61.
61.
83.
24.
34.
05.
112
.123
.921
.726
.337
.332
.0
Che
ese
0.6
0.6
1.0
1.7
1.9
2.0
2.3
2.9
4.1
5.0
4.5
6.9
7.5
8.0
8.0
8.7
7.2
Cas
ein
prod
ucts
0.3
0.5
0.6
0.7
0.9
1.4
0.8
1.0
1.3
1.0
0.7
1.3
1.0
1.6
1.2
11.4
7.9
Infa
nt fo
rmul
a0.
00.
10.
20.
51.
12.
01.
02.
10.
30.
30.
81.
42.
82.
62.
95.
810
.2
But
terf
at p
rodu
cts
13.8
10.9
2.0
9.6
7.6
6.3
2.0
13.8
2.4
2.0
44.3
74.3
2.4
26.5
2.3
3.1
12.4
Ice
crea
m0.
50.
30.
40.
20.
10.
10.
10.
20.
20.
40.
40.
80.
91.
42.
83.
65.
0
Ski
m m
ilk p
owde
r23
.01.
10.
00.
07.
90.
40.
40.
51.
51.
58.
056
.512
0.9
52.8
2.2
4.3
0.4
Who
le m
ilk p
owde
r1.
00.
70.
60.
17.
52.
10.
30.
30.
41.
60.
633
.021
.30.
51.
62.
12.
7
Oth
er d
airy
pro
duct
s0.
20.
80.
30.
80.
80.
60.
81.
01.
91.
81.
72.
34.
41.
10.
92.
22.
5
Tota
l41
.719
.311
.420
.439
.226
.718
.237
.939
.140
.588
.821
9.2
234.
316
7.0
103.
513
4.4
128.
3
To
ns
Lact
ose
3,21
66,
911
7,76
68,
221
14,2
0813
,895
9,20
111
,463
8,22
011
,621
23,2
4720
,082
25,3
4719
,982
21,6
2624
,650
28,8
79
Whe
y pr
oduc
ts46
2880
863
41,
370
1,70
31,
057
1,83
01,
328
944
2,57
75,
644
11,4
606,
165
6,41
79,
321
9,31
3
Che
ese
252
312
358
519
606
410
456
604
698
756
950
1,23
61,
185
1,23
61,
259
1,21
81,
267
Cas
ein
prod
ucts
8710
315
821
934
043
420
017
716
913
599
169
124
130
120
971
1,02
3
But
terf
at p
rodu
cts
8,66
48,
175
1,64
99,
094
5,59
43,
734
1,04
58,
525
1,30
579
222
,716
19,5
7964
16,
642
647
928
4,54
1
Infa
nt fo
rmul
a0
3351
279
778
1,16
034
384
416
618
114
729
932
930
848
284
31,
299
Ice
crea
m28
311
512
071
1315
828
4179
7216
026
638
876
11,
017
1,34
6
Ski
m m
ilk p
owde
r16
,973
757
4544
4,30
822
324
318
540
934
43,
298
19,6
8532
,445
14,2
7544
31,
149
212
Who
le m
ilk p
owde
r32
324
923
294
4,04
11,
118
139
6114
043
910
510
,105
4,58
214
035
936
335
7
Oth
er d
airy
pro
duct
s86
71,
057
170
325
387
530
412
461
679
1,15
21,
655
831
1,07
647
338
345
955
7
Sou
rce:
US
DA
, Eco
nom
ic R
esea
rch
Ser
vice
. Glo
bal T
rade
Info
rmat
ion
Ser
vice
s, In
c., W
orld
Tra
de A
tlas,
199
3-20
16.
Tabl
e 14
Ind
ia’s
to
p 5
su
pp
liers
fo
r it
s m
ajo
r d
airy
imp
ort
cat
ego
ries
(av
erag
es f
or
2013
-15)
Lact
ose1
Whe
y pr
oduc
ts2
Che
ese3
Cas
ein
prod
ucts
4
Cou
ntry
2013
-15
impo
rts
Cou
ntry
2013
-15
impo
rts
Cou
ntry
2013
-15
impo
rts
Cou
ntry
2013
-15
impo
rts
$ m
illio
n
$ m
illio
n
$ m
illio
n
$ m
illio
n
Ger
man
y17
.08
Uni
ted
Sta
tes
8.79
Italy
2.
40N
ethe
rland
s
3.49
Net
herla
nds
12.6
9Fr
ance
8.
49D
enm
ark
1.16
New
Zea
land
2.
36
Uni
ted
Sta
tes
11.5
1N
ew Z
eala
nd
4.60
Net
herla
nds
1.10
Uni
ted
Sta
tes
0.38
New
Zea
land
4.85
Net
herla
nds
2.
01Fr
ance
0.94
Den
mar
k
0.
23
Can
ada
2.75
Den
mar
k1.
75U
nite
d K
ingd
om
0.70
Sin
gapo
re0.
171 H
S c
odes
170
211
and
1702
19. 2 H
S c
odes
040
410
& 3
5022
0. 3 H
S c
ode
0406
. 4 HS
cod
e 35
0110
& 3
5019
0.
Sou
rce:
US
DA
Eco
nom
ic R
esea
rch
Ser
vice
. Glo
bal T
rade
Info
rmat
ion
Ser
vice
s, In
c. W
orld
Tra
de A
tlas,
199
3-20
16.

32 India’s Dairy Sector: Structure, Performance, and Prospects, LDPM-272-01
Economic Research Service/USDA
Dairy Policy
Domestic dairy policy has transitioned from the “Operation Flood” period covering 1970-96, to a “Perspective Plan” period between 1996 and 2010, to the current National Dairy Plan (NDP) period covering India fiscal years 2011/12-2018/19 (April/March). Under Operation Flood (I, II, and III), the National Dairy Development Board (NDDB)—which is primarily responsible for implementing national dairy policy—improved milk procurement, processing, and marketing, primarily by estab-lishing dairy cooperatives to link small rural producers and urban consumers (see box 2, “Operation Flood and the ‘Anand’ Model of Cooperative Dairy Development”). During the Perspective Plan period, NDDB further strengthened dairy cooperatives with a focus on cooperative businesses, dairy production, quality control, workforce development and training, and creating a national informa-tion network (USDA, 2012b, 2012c, 2015a, 2016; Planning Commission, 2012).
Currently, under the NDP, the priority has shifted to improving animal productivity. Efforts are to be concentrated on 14 major milk-producing States (Andhra Pradesh, Bihar, Gujarat, Haryana, Karnataka, Kerala, Madhya Pradesh, Maharashtra, Odisha, Punjab, Rajasthan, Tamil Nadu, Uttar Pradesh, and West Bengal) that account for about 90 percent of milk production. The emphasis will be on genetic improvement, improved animal nutrition, and strengthening village-based milk procurement systems. The current 6-year phase of the program is to involve a financial outlay of $315 million (USDA, 2015a). Targets under the plan include the following:
• Produce high genetic merit cattle and buffalo bulls by progeny testing and pedigree selection, and importing Jersey and Holstein-Friesian bulls, embryos, and semen.
• Increase high-quality semen production.
• Strengthen artificial-insemination delivery services.
• Improve dairy animal nutrition through various fodder development programs and increasing use of balanced rations.
• Strengthen village milk collection, including milk weighing, testing, collection, and cooling.
• Develop milk-producer companies as an alternative to the NDDB marketing system in order to expand and improve the business orientation of the milk procurement network.
The Ministry of Agriculture also supports several other dairy development programs implemented by State and District milk unions, including the Intensive Dairy Development Program (IDDP) aimed at developing dairy cattle and milk marketing; Strengthening Infrastructure for Quality and Clean Milk Production, focusing on milk marketing and quality infrastructure; and Assistance to Cooperatives, targeting management of underperforming dairy cooperatives.
Improving Animal Breeding
The National Project on Cattle and Buffalo Breeding (NPCBB), a component of the NDP with a 10-year budget of $255 million, began in 2000 with the objective of further developing the infra-structure needed to improve cattle and buffalo breeding through artificial insemination (AI). A new program covering 2012/13-2017/18, the National Program for Bovine Breeding and Dairy Development (NPBBDD), focuses on providing breeding services, infrastructure to improve milk quality, procurement, processing, and marketing, and providing inputs and training for farmers. The

33 India’s Dairy Sector: Structure, Performance, and Prospects, LDPM-272-01
Economic Research Service/USDA
Rashtriya Gokul Mission, part of the NPBBDD, targets improving the genetic potential of indig-enous cattle. The project envisages genetic improvements of indigenous cattle and buffalo, develop-ment and conservation of important indigenous breeds, and establishment of a sustainable breeding policy, with a focus on increasing milk production. Another national-level program is the Rashtriya Krishi Vikas Yojana, which provides financial assistance to State Governments to improve fodder development, cattle and water buffalo genetics, milk production, livestock health, and infrastructure.
Although the former NPCBB contributed to strengthening AI delivery, progress in bull produc-tion has been slow, in part because of lack of initiatives by State Governments. Many Government AI centers remain stationary despite availability of portable equipment because of limited workers and transport. Although production of high genetic merit cattle and buffalo bulls through progeny testing is critical to productivity, progeny-testing programs for buffalo, crossbred, and indigenous bulls have, in many cases, been ineffective because of limited technical skills and lack of interest by the States (Planning Commission, 2007).
To support the breed enhancement goals, the Government has also begun to permit imports of high-quality bovine genetics, but with strict quality norms. Revised guidelines issued in 2016 require multiple State and central Government clearances and establish standards for progeny and genomic testing of germplasm, as well as strict adherence to World Organization for Animal Health (OIE), Codex Alimentarius, and International Embryo Technology Society (IETS) standards. Semen imports totaled $0.5 million in 2013 and $0.2 million in 2014, with France, the United States, and Australia the major suppliers (World Trade Atlas).
Feed and Fodder Development
The Feed and Fodder Development Program (FFDP) begun in 2005/06, and the Accelerated Fodder Development Program (AFDP) begun in 2011/12, seek to improve feed supplies by providing quality seeds, promoting cultivation of fodder crops in part by planting on fallow and unutilized lands, promoting dual-purpose crops and non-traditional fodders, and adopting post-harvest tech-nologies for preservation of fodder. Specific strategies include
• Production of quality seeds: Supporting State agricultural universities to produce breeder and foundation seeds of improved varieties and hybrids.
• Production of fodder: Organizing fodder production based on a cluster approach using appro-priate and region-specific fodder varieties in selected/targeted clusters in dairy catchment areas.
• Post-harvest management: Adopting fodder block technology, chaff cutters for fodder processing, and silage making. The Ration Balancing Program (RBP), along with the Information Network for Animal Productivity and Health (INAPH), provide a software program to optimize dairy rations using locally available feeds for use by private and coop-erative dairies.
Despite these ongoing programs, Government documents concede that the centrally sponsored programs for fodder and feed development have been largely ineffective (Planning Commission, 2012).

34 India’s Dairy Sector: Structure, Performance, and Prospects, LDPM-272-01
Economic Research Service/USDA
Animal Health
Improving animal health has been an important policy goal, with outlays for improving veterinary services and animal health accounting for about 29 percent of livestock-sector spending during the late 2000s. Between 1997 and 2010, veterinary staffing was increased by 36 percent, but services are unevenly distributed in favor of higher-income States, such as Punjab and Haryana (Birthal and Negi, 2012). Despite these efforts, delivery of veterinary services is considered to be generally poor, with limited supplies of medicines, equipment, and requisite skills.
India’s Department of Animal Husbandry, Dairying, and Fisheries (DAHDF) continues to support a centrally sponsored program called Livestock Health and Disease Control begun under the 12th 5-Year Plan (2012-17), with a plan outlay of Rs31.1 billion ($502 million). Under the program, the central Government provides financial assistance to State Governments to support animal disease control through immunization and improve veterinary capacity and diagnostic laboratories for diseases such as foot-and-mouth disease, Rinderpest, peste des petits, and brucellosis. The central Government also administers the National Animal Disease Reporting System (NADRS), which is a web-based system that reports and monitors animal diseases across the country (USDA, 2015).
Investment in Dairy Development
Overall, Government investment in dairy development dropped off following the end of Operation Flood III in 1996, but has picked up since the implementation of the NDP in 2012 (fig. 22). But, even with the sharp increase in funding in 2012, dairy development funding under the various Government plans averaged just $32 million annually during 2000-14.
Figure 22
Indian government outlays for dairy development
Source: USDA, Economic Research Service. Government of India, Department of Animal Husbandry, Dairying, and Fisheries, Basic Animal Husbandry Statistics.
0
20
40
60
80
100
120
1970
1972
1974
1976
1978
1980
1982
1984
1986
1988
1990
1992
1994
1996
1998
2000
2002
2004
2006
2008
2010
2012
2014
$ million

35 India’s Dairy Sector: Structure, Performance, and Prospects, LDPM-272-01
Economic Research Service/USDA
Data on private investment in dairy development is not available. Although private funding picked up when investment in dairy processing was delicensed in the early 1990s, and appears to be growing faster than cooperative investment, reports indicate that such investment has not been as strong as hoped (Planning Commission, 2007, 2012). The GOI provides limited support for private-sector dairy development through programs such as the Dairy Entrepreneurship Development scheme, which provides partial subsidies for small-scale dairy and dairy advisory firms. The avail-ability of public and private bank credit to support livestock producers is also relatively small, accounting for only about 3 percent of total such credit for agriculture during the late 2000s (Birthal and Negi, 2012).
Trade Policy
India’s dairy product trade is regulated both through tariff and quantitative border measures and through nontariff measures, including food quality and safety standards. Tariff and quantitative restrictions on imports and exports are subject to change based on domestic and international market conditions, with a primary objective of moderating pressures on domestic food-price inflation. Food quality and safety standards applied by the agencies that regulate imports and exports are the same as those established for the domestic market by the Food Safety and Standards Authority of India (FSSAI, see Domestic Food Safety Issues) and the Indian Bureau of Standards.
Export Policy. Exports of dairy products are regulated under the Export (Quality Control and Inspection) Act of 1963, its Export (Quality Control and Inspection) Rules (1964), and the Export of Milk Products (Quality Control, Inspection, and Monitoring) Rules set in 2000. Manufacturers require two certifications for export: 1) a certificate from the Export Inspection Council of India approving the manufacturing unit, and 2) a health certificate by an Export Inspection Agency for the products processed in the approved plant. Exported dairy products must also meet all central and State Government statutory requirements with respect to commercial and environmental conserva-tion measures, including those pertaining to water and air pollution, food adulteration, and food safety standards.
There are no tariffs, taxes, levies, or quantitative restrictions on exports other than nominal fees for the above-noted certifications (Planning Commission, 2007). However, India makes ad hoc changes in export policy, most recently exemplified by a temporary ban on exports of SMP (and other dairy products included in HS code 0402) and casein products (HS code 3501) during 2011 and 2012, in an effort to curb inflation of milk prices. That export embargo was partially lifted in June 2012 and completely lifted in November 2012.
Import Policy . Most dairy products face a basic tariff of either 30 percent or 60 percent, and also require import permits and sanitary certificates. SMP and butter oil imports are regulated by tariff rate quotas (TRQs). The current TRQ for SMP is 10,000 tons at a tariff rate of 15 percent, with an above-quota tariff of 60 percent. A 15,000-ton TRQ for butter oil has an in-quota tariff of 0 percent and an above-quota tariff of 40 percent. As in the case of export policy, dairy import policy has been subject to change based on domestic market conditions. For SMP, the import quantity allowed under the TRQ has been raised, and the in-quota tariff reduced to zero when domestic supplies are tight. Designated public and private Indian organizations can apply to the Ministry of Commerce and Industry for TRQ allocations (Ministry of Commerce and Industry, 2002). Table 15 provides the detailed tariff structure for Indian dairy product imports

36 India’s Dairy Sector: Structure, Performance, and Prospects, LDPM-272-01
Economic Research Service/USDA
General and Sanitary and Standards. Although the FSSAI sets the standards, the sani-tary permits required for imports of dairy products are issued by the Ministry of Agriculture, Department of Animal Husbandry, Dairying, and Fisheries. The standards include quality norms set by the Bureau of Indian Standards as well as the food safety standards included in the Food Safety and Standards Regulation, 2011. In addition, imports of any food, feed, and food mate-rials that contain genetically modified material require the approval of the Genetic Engineering Approval Committee (GEAC).
India recently further extended a food-safety-related ban on imports of Chinese milk and dairy products first enacted in 2008. The ban includes chocolates and chocolate products, candies, confectionary, and food preparations made with fluid milk or dairy solids as an ingredient.
Exports of most U.S. dairy products to India have been effectively prohibited under India’s current dairy import protocols. India’s domestic regulations prohibit dairy feed ingredients of animal origin (GOI, 2009). This prohibition is due to religious and cultural sensitivities rather than scientific determinations regarding public health. Some ingredients of animal origin are, however, used in feeds for animals other than cattle (Vaidya, 2001 and Balakrishnan, 2004).
India’s sanitary protocols for dairy imports include the following requirements:
• Animal rennet has not been used in making the product or, if it is, the product is labeled accordingly.
Table 15
India’s tariffs for selected dairy products
HS code DescriptionDuty
Basic CVD1 Special CVD
Total2
percent, ad valorem
04011-04015 Milk and cream, not concentrated 30.0 0.0 0.0 30.90
04021010-04022100 Milk and cream, concentrated 60.0 0.0 4.0 68.27
0403 Buttermilk, curdled milk, yogurt 30.0 0.0 0.0 30.90
0404 Whey 30.0 0.0 4.0 36.14
0405 Butter, butter oil, ghee 40.0 0.0 4.0 46.85
04061000 Fresh cheese 20.0 0.0 0.0 30.00
04062000-04069000 Cheese, grated processed, veined & other 30.0 0.0 4.0 36.14
170211 Lactose, anhydrous 25.0 12.5 4.0 47.52
21050000 Ice cream 30.0 0.0 4.0 36.14
3501 Casein, caseinates, casein glues, etc. 20.0 12.5 4.0 41.491CVD = Countervailing duty. 2Total compounded duty, including a 3.0 percent Education Cess (tax).Source: USDA, Foreign Agricultural Service, 2016a.

37 India’s Dairy Sector: Structure, Performance, and Prospects, LDPM-272-01
Economic Research Service/USDA
• Source animals have never been fed with feeds produced from internal organs, blood meal, and tissues of ruminant origin.4
• Product has been processed to make it fit for human consumption.
• Milk used for making the product has been heat-treated to ensure destruction of pathogenic organisms.
• Source animals have not been administered bovine growth hormones (BGHs)/bovine somato-tropin or recombinant bovine somatotropin (BST/rBST) hormone.
• Source animals have not been treated with estrogen within 90 days of the milk being drawn.
• The product does not contain drug/pesticides/heavy metal residues and levels of mycotoxins above the limits prescribed by the Codex Alimentarius Commission.
• The product does not contain certain pre-formed bacterial toxins (GOI, Ministry of Agriculture; http://dahd.nic.in/sites/default/files/veterinary.pdf028_0.pdf).
The requirement that dairy cows not be fed with animal tissues is reported to be the most problem-atic for U.S. exporters. Lactose, casein products, and some whey products from the United States have not been included in the same prohibitive import protocols (GOI, 2013; USDA/FAS, 2016b).
Import policies for animals and genetics for the purpose of upgrading India’s bovine herd give pref-erence to import of semen and embryos, rather than live animals. Ministry of Agriculture regula-tions require strict health, progeny testing, and animal traceability standards for imports of bovine semen and embryos. Additional requirements are imposed by some Indian States.
Indicators of Trade Protection. India’s tariff and non-tariff trade policies for dairy products poten-tially afford protection to domestic milk producers and/or processors to the extent that they raise domestic prices above world market prices. While India’s imports of dairy products incur substan-tial tariffs, neither the tariffs nor the generally small volumes of imports that do occur necessarily mean that average domestic prices for milk or products are above world prices and, hence, uncom-petitive in world markets.
The most recent estimates of indicators of protection for India’s dairy sector are of Market Price Support for milk for the years 1985-2000 (Mullen, Orden and Gulati, 2005). When computed using proxy indicators of world market prices in a trade environment without export subsidies, these measures are generally substantially negative for Indian SMP, butter, ghee, and milk, indicating that domestic producer prices for these goods were below world prices during that period. For other countries, the most comprehensive estimates of a similar indicator are Nominal Protection
4In the United States, a significant proportion of dairy operations use animal-derived feed supplements. A survey by the USDA, Animal and Plant Health Inspection Service, reports that in 2013, 10.6 percent of dairy operations used blood meal (USDA/APHIS, 2016). Since milk from dairy operations using animal-derived feeds is comingled with milk from other operations, USDA is unable to certify the absence of ruminant-derived feed ingredients associated with dairy products to be exported to India. While many types of animal-derived feeds are permitted in the United States, some types are prohibited because they could pose a risk to public health. Certain mammal-derived protein materials are prohibited in ruminant feeds (21 CFR § 589.2000). In addition, some cattle-derived materials are prohibited in any animal feeds in order to prevent the spread of bovine spongiform encephalophathy (BSE) (21 CFR § 589.2001).
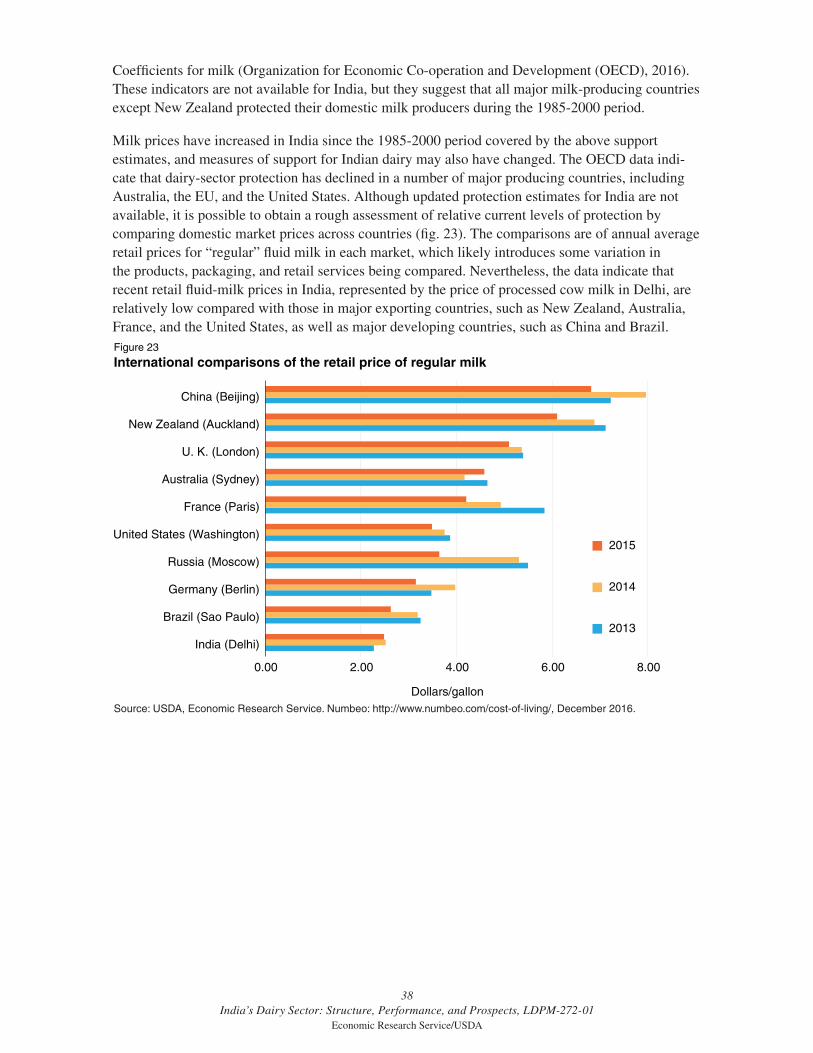
38 India’s Dairy Sector: Structure, Performance, and Prospects, LDPM-272-01
Economic Research Service/USDA
Coefficients for milk (Organization for Economic Co-operation and Development (OECD), 2016). These indicators are not available for India, but they suggest that all major milk-producing countries except New Zealand protected their domestic milk producers during the 1985-2000 period.
Milk prices have increased in India since the 1985-2000 period covered by the above support estimates, and measures of support for Indian dairy may also have changed. The OECD data indi-cate that dairy-sector protection has declined in a number of major producing countries, including Australia, the EU, and the United States. Although updated protection estimates for India are not available, it is possible to obtain a rough assessment of relative current levels of protection by comparing domestic market prices across countries (fig. 23). The comparisons are of annual average retail prices for “regular” fluid milk in each market, which likely introduces some variation in the products, packaging, and retail services being compared. Nevertheless, the data indicate that recent retail fluid-milk prices in India, represented by the price of processed cow milk in Delhi, are relatively low compared with those in major exporting countries, such as New Zealand, Australia, France, and the United States, as well as major developing countries, such as China and Brazil. Figure 23
International comparisons of the retail price of regular milk
Source: USDA, Economic Research Service. Numbeo: http://www.numbeo.com/cost-of-living/, December 2016.
0.00 2.00 4.00 6.00 8.00
India (Delhi)
Brazil (Sao Paulo)
Germany (Berlin)
Russia (Moscow)
United States (Washington)
France (Paris)
Australia (Sydney)
U. K. (London)
New Zealand (Auckland)
China (Beijing)
Dollars/gallon
2015
2014
2013

39 India’s Dairy Sector: Structure, Performance, and Prospects, LDPM-272-01
Economic Research Service/USDA
Projections
Developing reliable projections for Indian milk production is complicated by uncertainties inherent in assessing the pace of change in factors such as feed use, the size and composition of the dairy herd, the scale and efficiency of dairy operations, and milk yields. The USDA data provide esti-mates of numbers of cows in milk, cow milk production, and buffalo milk production, but not of the number of milk animals, average yield, and production for the three distinct animal types (cross-bred cattle, indigenous cattle, buffalo) that would be useful to break out in the projections. The Indian Livestock Census provides statistical estimates for animal numbers, including the three types of milk animals for 5-year intervals, the most recent in 2012. In addition, the DAHDF provides annual survey-based estimates of animal numbers, milk yields, and production by animal type for 2007/08-2012/13.
The projections assume alternative growth rates, based on rates observed in the historical data, for the number of animals in milk and daily milk yield for crossbred cattle, indigenous cattle, and buffalo. The historical animal number estimates from the Livestock Census provide the basis for projecting the size of the milking herd. The annual estimates of milk yields by animal type provided by the DAHDF for 2007/08-2012/13 provide the basis for projecting milk yields. The year 2012/13, the latest year the data by animal type are available, is the base year for the projections. The following scenarios are examined:
• Scenario 1: This scenario reflects the longer-term trends in milk animal numbers over the 1997-2012 period. Projections of animals in milk by animal type are based on the trends over the last 4 Livestock Census years (1997, 2003, 2007, and 2012). Projected milk yields are based on the trend over the available years of annual DAHDF data (2007/08-2012/13). To minimize the influence of outliers in the historical data on the projections, the growth rates are taken from trend lines estimated through the available data points.
• Scenario 2: This scenario reflects shorter-term trends in milk animal numbers between the two most recent census years of 2007 and 2012. Projections of animals in milk by animal type are based on the trends between the 2 most recent census years, 2007 and 2012, while projected milk yields are based on the same trends used in scenario 1. This scenario has the advantage of capturing the more recent trends in animal numbers, particularly any changes in the crossbred and buffalo herds, but, by relying on only two data points, may also be more subject to aberra-tions in the data that distort the trends.
The projections (table 16) highlight the increasingly important roles that milk production from both buffalo and crossbred cattle are likely to play in the growth of Indian milk output. Overall milk production grows by 4.4-4.6 percent per year, reaching 220-226 million tons by 2025. Production from crossbred animals expands by 7.0-7.5 percent annually, compared with 3.2-3.8 percent for buffalo milk and 1.3-2.2 percent for indigenous cattle milk. Over the projection period, the share of production from crossbred cattle increases from 29 percent in 2012/13 to 39-42 percent in 2025/26, while the share from indigenous cattle falls from 20 percent to 14-15 percent.
The scenario 1 projections, based on the longer-term 1997-2012 trends in milk animal numbers, meet the Government target for 180 million tons of milk production by 2020. The scenario 2 projec-tions, however, fall short of the target because the impact of slower growth in the indigenous cattle

40 India’s Dairy Sector: Structure, Performance, and Prospects, LDPM-272-01
Economic Research Service/USDA
and buffalo milking herds reflected in the 2007-12 data more than offsets the faster growth in the crossbred herd in the same period.
In addition to highlighting the increasing importance of the expanding crossbred dairy herd to overall milk production, the scenarios suggest that slowed growth in the buffalo milking herd, reflected in the most recent census data, may be a significant area of concern in sustaining output growth. In scenario 1, gains in buffalo milk production are supported by the trend growth in the size of the buffalo milking herd over the 4 census years during the 1997-2012 period, but, in scenario 2, the expansion of the buffalo milking herd slows significantly, consistent with what is observed between the 2 most recent census years. It is unclear if that slower growth is the result of the rise in export-oriented buffalo slaughter during this period, or some other factor. So far, the evidence is that beef export demand is being met by slaughter of culled females and young male buffalos that have decreasing value for animal traction, rather than increased breeding of meat animals. In the longer term, increased milk demand, coupled with profits stemming from the expanding buffalo meat export market, might actually support growth in the buffalo herd, but this
Table 16
Projections of Indian milk production by animal type
VariableBaseyear
2012/13
Projections
Scenario 1 Scenario 2
2020/21 2025/26Growth
rate2020/21 2025/26
Growth rate
Million Percent Million Percent
Total
Cows in milk (head) 80.5 91.8 101.0 1.8 74.9 96.5 1.4
Yield/day (kg) 4.3 5.4 6.1 2.8 5.9 6.2 2.9
Production (tons) 126.3 179.5 225.9 4.6 161.8 220.2 4.4
Crossbred cattle
Cows in milk (head) 14.3 21.9 28.6 5.5 22.7 30.3 5.9
Yield/day (kg) 7.0 7.9 8.4 1.4 7.9 8.4 1.4
Production (tons) 36.7 62.8 88.0 7.0 65.1 93.3 7.5
Indigenous cattle
Cows in milk (head) 29.6 30.0 30.2 0.2 14.0 27.1 -0.7
Yield/day (kg) 2.4 2.8 3.1 2.0 2.8 3.1 2.0
Production (tons) 25.5 30.3 33.7 2.2 14.2 30.2 1.3
Buffalo
Cows in milk (head) 36.6 39.9 42.2 1.1 38.1 39.1 0.5
Yield/day (kg) 4.8 5.9 6.8 2.7 5.9 6.8 2.7
Production (tons) 64.1 86.4 104.2 3.8 82.5 96.6 3.2
Notes: 2012/13 data are from Government of India, Ministry of Agriculture, Department of Animal Husbandry, Dairying, and Fisheries, Livestock Census and Basic Animal Husbandry Statistics.
Scenario 1: Cows in milk based on trendline growth rate over 1997, 2003, 2007, and 2012 Livestock Census years. Yields based on trendline growth rate over 2007-12 annual data reported by GOI, Ministry of Agriculture, Department of Animal Husbandry, Dairying, and Fisheries.
Scenario 2: Cows in milk based on trendline growth rate between the most recent 2007 and 2012 Livestock Census years. Yields are the same as in Scenario 1.
Source: USDA, Economic Research Service, ERS projections.

41 India’s Dairy Sector: Structure, Performance, and Prospects, LDPM-272-01
Economic Research Service/USDA
remains to be seen. If export-oriented buffalo slaughter does lead to a slowdown in the growth of the buffalo milking herd, there may be an emerging tradeoff between India’s expanding beef trade and meeting dairy production targets.
Both sets of projections are based on past trends in milk yields and, therefore, assume that any improvements in feeding, breeding, and management, as well as price incentives for dairy production, that contributed to higher yields during 2007-12 will continue. Shortages and higher prices for major feeds may slow gains and yields, while improved supplies could quicken growth. Similarly, a significant change in the pace at which the scale of dairy operations is expanding could also influence feeding, breeding, and management practices and potentially boost yield growth above the recent historical trends assumed in the projections.

42 India’s Dairy Sector: Structure, Performance, and Prospects, LDPM-272-01
Economic Research Service/USDA
Conclusions
Available data indicate that India’s large, and uniquely structured, dairy sector has been sustaining strong annual growth and appears to be satisfying robust demand for fluid milk and major milk products at generally stable real prices. Despite this expansion, the dairy sector is characterized by low yields across the crossbred, indigenous cattle, and buffalo components of the herd, which leaves broad potential for gains through improved breeding, nutrition, and management.
While India’s dairy cooperatives have achieved significant progress in organizing and enhancing primarily smallholder production and marketing, central Government policy intervention and invest-ment in dairy for breeding and fodder development programs appears small relative to the size of the sector. Cooperatives, led by GCMPU—India’s largest dairy processor—have been key drivers of Indian dairy development and, although data on the full range of their investments in dairy development are not available, they are likely to be substantial. Private firms are now playing an expanding role in the dairy processing sector since it was delicensed in the 1990s, but data on the full range of those investments are also not available. It appears that the private-sector dairies are now growing faster than the cooperative sector, and are likely to be increasingly influential in the direction of the industry. An important factor is likely to be the extent to which the private-sector processors catalyze increases in the scale of dairy production enterprises, along with improved management and productivity, a reported trend for which there is currently little data with which to assess future impacts.
When based on long-term trends in the size of the crossbred, indigenous, and buffalo dairy herds, projections suggest that India can sustain growth and meet targets for dairy production with its existing mix of domestic and trade policies. Key to this outcome is likely to be the continued expan-sion of the crossbred cattle herd, projected to remain the fastest-growing segment of production. There appears to be substantial potential for crossbred yields to improve through better breeding practices, and improved nutrition and management.
When based on more recent trends in dairy animal numbers, however, the projections indicate a shortfall from plan targets, primarily because of slowed growth in the buffalo milking herd, which generates the largest share of milk production. To the extent that this development is associated with the expansion of export-oriented buffalo slaughter, it could signal slower growth in buffalo milk production over time. Alternatively, if buffalo meat exports significantly increase the profitability of buffalo-based dairies relative to those based on cattle by increasing the value of culls and male calves, the longer-term result may be an expanding herd and/or improved productivity.
India dairy trade policies currently permit exports, but protect against imports of most dairy prod-ucts with TRQs and relatively high basic tariffs of 30-60 percent. Non-tariff barriers, particularly a current requirement that most imported dairy products come only from animals not fed with feeds of ruminant origin, further restrict imports from some countries, including the United States. However, recent history indicates that tariffs are flexible when imports are needed to address domestic supply shortfalls. Despite the import protection, export-unit value data indicate that Indian exports of SMP and casein products—the two-largest export categories—are generally competitive with other exporters. Data to directly compare India’s current milk and producer prices with other suppliers are not available, but comparisons of recent retail fluid-milk prices across countries indicate that Indian prices are relatively low at the retail level. Export unit-value data do, however, indicate that India is less competitive in milk-fat-based products such as butter and ghee, and these sectors may benefit

43 India’s Dairy Sector: Structure, Performance, and Prospects, LDPM-272-01
Economic Research Service/USDA
relatively more from the protections afforded by border measures. This finding is not surprising given traditional consumer preferences for use of milk fats in cooking and dairy-based foods and sweets, as well as India’s large structural deficit in vegetable oils.
India’s future role as a trader in dairy products seems likely to be variable in the medium term, but is not clear in the longer term. At present, India’s trade in dairy products—both import and export—is marginal compared with the size of the sector, and the significant scope for future growth in both production and consumption suggests a wide range of possible outcomes. India is currently a net exporter of dairy products with exports, primarily of SMP and casein products, expanding and generally price-competitive. So far, trade policy behavior indicates that domestic dairy-price stability is a higher priority than exports, suggesting that rapid export expansion is unlikely in the context of India’s current robust growth in domestic consumer demand. Imports, historically primarily of SMP for reconstitution into fluid milk, have declined and are likely to continue to be episodic, in response to occasional shortages and/or upswings in domestic milk prices. However, recent imports of lactose whey products and casein products, apparently for feed and industrial uses, may signal an expanding market.
India’s large dairy sector is understudied, and there is limited public data on aspects of the sector that are important in assessing progress, future developments, or policy options. There are significant gaps in data collection in the areas of feed availability and use, changes in the size and cost structure of dairy production enterprises, and on the supply and use of most dairy products. Important topics for ongoing analysis and research include the changing dynamics of the crossbred and buffalo dairy herds, changes in the supply and use of dairy animal feeds, the expansion and activities of private-sector processors, and changes in the land and animal hold-ings of milk producers.

44 India’s Dairy Sector: Structure, Performance, and Prospects, LDPM-272-01
Economic Research Service/USDA
References
Babcock Institute for International Dairy Research. 2006. The Dairy Sector of India: A Country Study. Babcock Institute Discussion Paper No. 2006-2, University of Wisconsin, Madison. http://ageconsearch.umn.edu/bitstream/37353/2/2006-02.en.pdf
Balakrishnan, V. 2004. “Developments in the Indian Feed and Poultry Industry and Formulation of Rations Based on Local Resources,” Protein Sources for the Animal Feed Industry. Food and Agricultural Organization of the United Nations, Animal and Production Health Proceedings. ftp://ftp.fao.org/docrep/fao/007/y5019e/y5019e00.pdf
Bearak, M. 2014. “Upscale Dairies Grow in India, Promising Safer Milk,” New York Times, June 3, http://www.nytimes.com/2014/06/04/business/international/dairy-industrys-reputation-in-india-opens-door-for-upscale-farms.html?_r=0
Birthal, P.S., and D.S. Negi. 2012. Livestock for Higher, Sustainable and Inclusive Agricultural Growth, Economic and Political Weekly (India), Vol XLVII, Nos 26 & 27, June, pp. 89-99.
Birthal, P.S., and A.K. Jha, 2005. Economic Losses Due to Various Constraints in Dairy Production in India, Indian Journal of Animal Sciences, 75 (12): 1470-1475, Dec.
Code of Federal Regulations. 2016. 21 CFR § 589.2000, Animal proteins prohibited in ruminant feed.
Code of Federal Regulations. 2016. 21 CFR § 589.2001, Cattle materials prohibited in animal food or feed to prevent the transmission of bovine spongiform encephalopathy.
Center for Science and Environment. 2012. Adulterated Milk Is What Indians Are Drinking. http://cseindia.org/content/adulterated-milk-what-indians-are-drinking
Chawla, A., H. Chawla, and Y. Pant. 2009. Milk and Dairy Products in India: Production, Consumption, and Exports, Hindustan Studies and Services, Ltd., Bhopal (India) and Infolitics, Gurgaon (India), September. http://www.hindustanstudies.com/files/dairysept09report.pdf
Das, S. 2016. “Dairy Sector to Milk Rs 10k-cr Investments in 5 Years,” Business Standard, April 9. http://www.business-standard.com/article/companies/dairy-sector-to-milk-rs-10k-cr-investments-in-5-years-116040900149_1.html
Dikshit, A.K., and P.S. Birthal. 2010. India’s Livestock Feed Demand: Estimates and Projections, Agricultural Economics Research Review, Vol. 23, January-June 2010, pp. 15-28.
Food and Agriculture Organization (FAO). FAOSTAT database: http://faostat3.fao.org/home/E
Food and Agriculture Organization (FAO). Domestic Animal Diversity Information System. Available at: http://dad.fao.org/
Government of India, Ministry of Agriculture, Department of Agriculture and Cooperation. Directorate of Economics and Statistics. Agricultural Statistics at a Glance (various years).
Government of India, Ministry of Agriculture, Department of Animal Husbandry, Dairying, and Fisheries, Basic Animal Husbandry Statistics (various years).

45 India’s Dairy Sector: Structure, Performance, and Prospects, LDPM-272-01
Economic Research Service/USDA
Government of India, Ministry of Agriculture, Department of Animal Husbandry, Dairying and Fisheries. 2009. Cattle Feed (Regulation of Manufacture and Sale) Order. http://www.dahd.nic.in/news/cattle-feed-regulation-manufacture-and-sale-order-2009
Government of India, Ministry of Agriculture, Department of Animal Husbandry, Dairying, and Fisheries, Livestock Census (various years).
Government of India, Ministry of Commerce & Industry, Department of Commerce. 2013. Notification No. 18 (RE–2013)/2009-2014. http://dgft.gov.in/Exim/2000/NOT/NOT13/not1813.htm
Government of India, Ministry of Commerce, Office of the Economic Advisor, Wholesale Price Indices. http://eaindustry.nic.in/home.asp
Government of India, Ministry of Commerce and Industry, Department of Commerce. 2002. Procedure for import of various items under Tariff Rate Quota (TRQ), May 27. http://dgft.gov.in/exim/2000/pn/pn05/pn1305.htm
Government of India, Ministry of Consumer Affairs, Food, and Public Distribution, Department of Consumer Affairs, Price Monitoring Cell. Daily (Retail & Wholesale) Prices. http://fcainfoweb.nic.in/pmsver2/reports/report_menu_web.aspx
Government of India, Ministry of Statistics and Program Implementation, National Sample Survey Organization. Consumer Expenditure Surveys.
Hemme, T., M.M. Uddin, and O. A. Ndambi. 2014. Benchmarking Cost of Milk Production in 46 Countries, Journal of Reviews on Global Economics, 2014, 3, 254-270. http://www.ifcndairy.org/media/pdf/publications2014/Benchmarking-Cost-of-Milk-Production-in-46-Countries.pdf
Hindu Business Line. 2016. Dairy Farms Seen Growing Bigger: Rabobank. April 6. http://www.thehindubusinessline.com/economy/agri-business/dairy-farms-seen-growing-bigger-rabobank/article8442345.ece#comments
India Infoline News Service. 2014. Indian Feed Industry Growing on Back of Animal Protein & Dairy Consumption Growth: Rabobank. http://www.indiainfoline.com/article/news-top-story/indian-feed-industry-growing-on-back-of-animal-protein-dairy-consumption-growth-rabo-bank-114061000093_1.html
Indian Council for Agricultural Research (ICAR), Expert System for Cattle and Buffalo, Directorate of Research on Women in Agriculture, Bhubaneshwar.
Joshi, P.K., A. Gulati, and P.S. Birthal. 2007. “Agricultural Diversification in India: Status, Nature, and Pattern,” in Agricultural Diversification and Smallholders in South Asia (P.K. Joshi, A. Gulati, and R. Cummings Jr. (eds)) Academic Foundation (Delhi), pp. 219-242.
Kumar, A., S. Parappurathu, and P.K. Joshi. 2013. Structural Transformation in Dairy Sector of India, Agricultural Economics Research Review, 26 (2), July-December 2013, pp 209-219. http://www.dairyknowledge.in/sites/default/files/structural_transformation_in_dairy_sector_of_india.pdf
Landes, M.R., A. Melton, and S. Edwards. 2016. From Where the Buffalo Roam: India’s Beef Exports, Livestock, Dairy, and Poultry Outlook No. (LDPM-264-01) 36 pp, June 2016.

46 India’s Dairy Sector: Structure, Performance, and Prospects, LDPM-272-01
Economic Research Service/USDA
Mullen, K., D. Orden, and A. Gulati. 2005. Agricultural Policies in India: Producer Support Estimates 1985-2002, International Food Policy Research Institute, MTID Discussion Paper No. 82, 135 pp., February.
National Dairy Development Board, India. http://www.nddb.org/
National Dairy Research Institute. 2016. Institute Cattle Yard. http://www.ndri.res.in/ndri/Design/livestock_farm.html.
Numbeo. http://www.numbeo.com/cost-of-living/.
Organization for Economic Cooperation and Development. 2016. Producer protection (NPC) data-base, https://data.oecd.org/agrpolicy/producer-protection-npc.htm
Planning Commission. 2007. Report of the Working Group on Animal Husbandry and Dairying for the 11th 5-Year Plan (2007-2012), Government of India. http://planningcommission.gov.in/aboutus/committee/wrkgrp11/wg11_rpanim.pdf
Planning Commission. 2012. Report of the Working Group on Animal Husbandry and Dairying for the 12th 5-Year Plan (2012-2017), Government of India. http://planningcommission.gov.in/aboutus/committee/wrkgrp12/agri/AHD_REPORT_Final_rev.pdf
Rada, N., and D. Schimmelpfennig. 2015. Propellers of Agricultural Productivity in India, ERR No. 203, USDA/ERS, December.
Rajeshwaran, S., G. Naik, and R.A.C. Das. 2014. Rising Milk Price: A Cause for Concern on Food Security, Working Paper No. 472, Indian Institute of Management, Bangalore, October. http://www.iimb.ernet.in/research/sites/default/files/WP%20No.%20472_1.pdf
Rakotoarisoa, M., and A. Gulati. 2006. Competitiveness and Trade Potential of India’s Dairy Industry, Food Policy, 31 (2006), pp. 216-227.
Sharma, V. P., and A. Gulati. 2003. Trade Liberalization, Market Reforms, and Competitiveness of Indian Dairy Sector, MTID Discussion Paper no. 61, International Food Policy Research Institute, Washington, DC, April.
Taneja, V. K. 1999. Dairy Breeds and Selection, in Smallholder Dairying in the Tropics, (L. Falvey and C. Chanatalakhana, eds.), International Livestock Research Institute, Nairobi.
United Nations, Food and Agriculture Organization. FAOSTAT database.
United Nations, Food and Agriculture Organization, India: Increasing Demand Challenges the Dairy Sector, Regional Office for Asia and the Pacific. http://www.fao.org/docrep/011/i0588e/I0588E05.htm
USDA, Animal and Plant Health Inspection Service. 2016. Dairy Cattle Management Practices in the United States, 2014. National Animal Health Monitoring System.
USDA, Economics and Statistics Service. 1981. U.S. Casein and Lactalbumin Imports, an Economic and Policy Perspective, National Economics Division, ESS Staff Report Number AGESS 810521.

47 India’s Dairy Sector: Structure, Performance, and Prospects, LDPM-272-01
Economic Research Service/USDA
USDA, Economic Research Service. 2016a. USDA Agricultural Projections to 2025, OCE-2016-1, February, 99 pp. https://www.ers.usda.gov/publications/pub-details/?pubid=37818
USDA, Economic Research Service. 2016b. International Baseline Data.
USDA, Foreign Agricultural Service. 2016a. Dairy and Products Annual, GAIN Report No. IN6126, September.
USDA, Foreign Agricultural Service. 2016b. India, Food and Agricultural Import Regulations and Standards – Certification, GAIN Report No. IN5166.
USDA, Foreign Agricultural Service. 2015a. Dairy and Products Annual, GAIN Report No. IN5131, October.
USDA, Foreign Agricultural Service. 2015b. India’s National Dairy Board Looks to Grow, GAIN Report No. IN5009, January.
USDA, Foreign Agricultural Service. 2015c. Cheese Demand Rising—New Market Opportunities. GAIN Report No. IN5125, September.
USDA, Foreign Agricultural Service. 2014. Dairy and Products Annual, GAIN Report No. IN4089, October.
USDA, Foreign Agricultural Service. 2013. Dairy and Products Annual, GAIN Report No. IN3119, October.
USDA, Foreign Agricultural Service. 2012a. Dairy Export Ban Lifted—SMP TRQ Revised, GAIN Report No. IN2154, November.
USDA, Foreign Agricultural Service. 2012b. Dairy and Products Annual, GAIN Report No. IN2132, October.
USDA, Foreign Agricultural Service. 2012c. India’s National Dairy Plan, GAIN Report No. IN2031, February.
USDA, Foreign Agricultural Service. 2011. Dairy and Products Annual, GAIN Report No. IN1197, October.
USDA, Foreign Agricultural Service. PS&D Online database.
USDA. 2013. National Agricultural Statistics Service, Farms, Land in Farms, and Livestock Operations 2012 Summary. Available: http://usda.mannlib.cornell.edu/usda/nass/FarmLandIn//2010s/2013/FarmLandIn-02-19-2013.pdf
USDA, National Agricultural Statistics Service. 2012. Census of Agriculture, Available: https://www.agcensus.usda.gov/Publications/2012/
Vaidya, S. V. 2001. The Indian Feed Industry, AGRIPPA. Food and Agricultural Organization of the United Nations. http://www.fao.org/docrep/ARTICLE/AGRIPPA/X9500E01.HTM
World Trade Atlas, Global Trade Information Services, Inc., 1993-2016.