india’s agricultural development under the new …ageconsearch.umn.edu/bitstream/204795/2/05-vijay...
TRANSCRIPT
Ind. Jn. of Agri.Econ. Vol.67, No.1, Jan.-March 2012
India’s Agricultural Development Under the New Economic Regime: Policy Perspective and Strategy for the 12th Five Year Plan* Vijay Paul Sharma† Agriculture sector is the mainstay of the Indian economy, contributing about 15 per cent of national Gross Domestic Product (GDP) and more importantly, about half of India’s population is wholly or significantly dependent on agriculture and allied activities for their livelihood (Government of India, 2011a). The contribution of agricultural sector to GDP has continued to decline over the years, while that of other sectors, particularly services, has increased. In 1970-71 agriculture contributed about 44 per cent of GDP, which declined to 31.4 per cent and 14.6 per cent in 1990-91 and 2009-10 (at 2004-05 prices), respectively (CSO, 2011). Nevertheless, agriculture remains a major source of employment, absorbing about 52 per cent of the total national workforce in 2004-05, down from about 70 per cent in 1971. The share of agricultural exports in total export value declined from about 18.5 per cent in 1990-91 to about 10.6 per cent in 2009-10, while the share of agricultural imports to total national imports increased from 2.8 per cent in 1990-91 and reached a high of 8.2 per cent in 1998-99 and declined to about 4.4 per cent in 2009-10 (Government of India, 2011b). The importance of agriculture in a country like India is not likely to decline due to concerns for food security, employment, rural poverty and availability of wage goods (Vyas, 2003). Successive Five Year Plans have stressed on self-sufficiency and self-reliance in foodgrains production and concerted efforts in this direction have resulted in substantial increase in agricultural production and productivity. This is clear from the fact that from a level of about 52 million tonnes in 1951-52, foodgrains production rose to above 241.5 million tonnes (4th advance estimates) in 2010-11 (Government of India, 2011c). However since the early 1990s, liberalisation and globalisation have become the core elements of development strategy of the government, which had indirect policy implications and impact on Indian agriculture. As a part of economic reforms agricultural markets were freed, external trade in agricultural commodities was liberalised and industry was de-protected to create more competition thereby reducing input prices and making terms of trade favourable to agriculture. “These measures would create a potentially more profitable agriculture, which would be able to bear the economic costs of technological modernisation and *Keynote paper presented at the 71st Annual Conference of the Indian Society of Agricultural Economics held at University of Agricultural Sciences, Dharwad – 580 005 (Karnataka) during November 3-5, 2011.
†Chairman, Centre for Management in Agriculture, Indian Institute of Management, Ahmedabad – 380 015.
INDIA’S AGRICULTURAL DEVELOPMENT UNDER THE NEW ECONOMIC REGIME 47
expansion” (Singh, 1995). The reforms have improved the terms of trade in favour of agriculture but growth in agricultural sector has fallen short of targets and has been well below that of the non-agricultural sectors and the gap between rural and urban incomes has been widening. Productivity gains from the Green Revolution technology have reached a plateau in many regions, causing per capita foodgrains production to decline, which has serious implications for food and nutritional security, poverty alleviation, rural development, farm incomes and rural-urban equity. One of the important strategy challenges for faster, sustainable and more inclusive growth (9.0-9.5 per cent growth rate) in the 12th Five Year Plan under structural changes and unfavourable global economic environment requires a significant acceleration in growth (4.0 to 4.5 per cent growth rate) in agriculture. Agricultural growth has always been an important component for inclusiveness, and the recent experience suggests that high GDP growth without high agricultural growth is likely to lead to acceleration in inflation in the country, which would adversely affect the larger growth process (Government of India, 2011a). The Eleventh Plan, which had attempted to reverse deceleration of agricultural growth during the Ninth and Tenth Plan, had some success in as foodgrains production has touched a new peak of 241.56 million tonnes in 2010-11 and growth in agriculture in the Eleventh Plan is likely to be about 3.3 per cent per year. However, to achieve between 4 and 4.5 per cent average growth in agricultural sector in the Twelfth Plan period adequate efforts on the part of the government are required. In view of importance of these issues, a critical examination of the recent trends in agriculture and the factors underlying the slow growth in agriculture is important to reorient programmes and policies in the 12th Plan. This paper is an attempt to address some of these issues. Section II provides a descriptive account of recent trends in Indian agriculture and identifies some key economic, institutional and technological policy issues that need to be addressed to accelerate growth in agriculture sector in the next plan. Concluding observations are presented in Section III.
II
REVIEW OF PERFORMANCE AND MAJOR CONCERNS IN AGRICULTURAL SECTOR The primary purpose of this section is to study the recent trends in agricultural sector. This is examined to highlight the differences rather than to search for their explanation. It also identifies some key technological, institutional and economic policy challenges that need to be addressed in the 12th Plan. 2.1 Deceleration and/or Lower Productivity-led Agricultural Growth The four main criteria considered for studying this are: (i) growth rate of real agriculture and non-agriculture GDP, (ii) trends in area and production of major
INDIAN JOURNAL OF AGRICULTURAL ECONOMICS 48
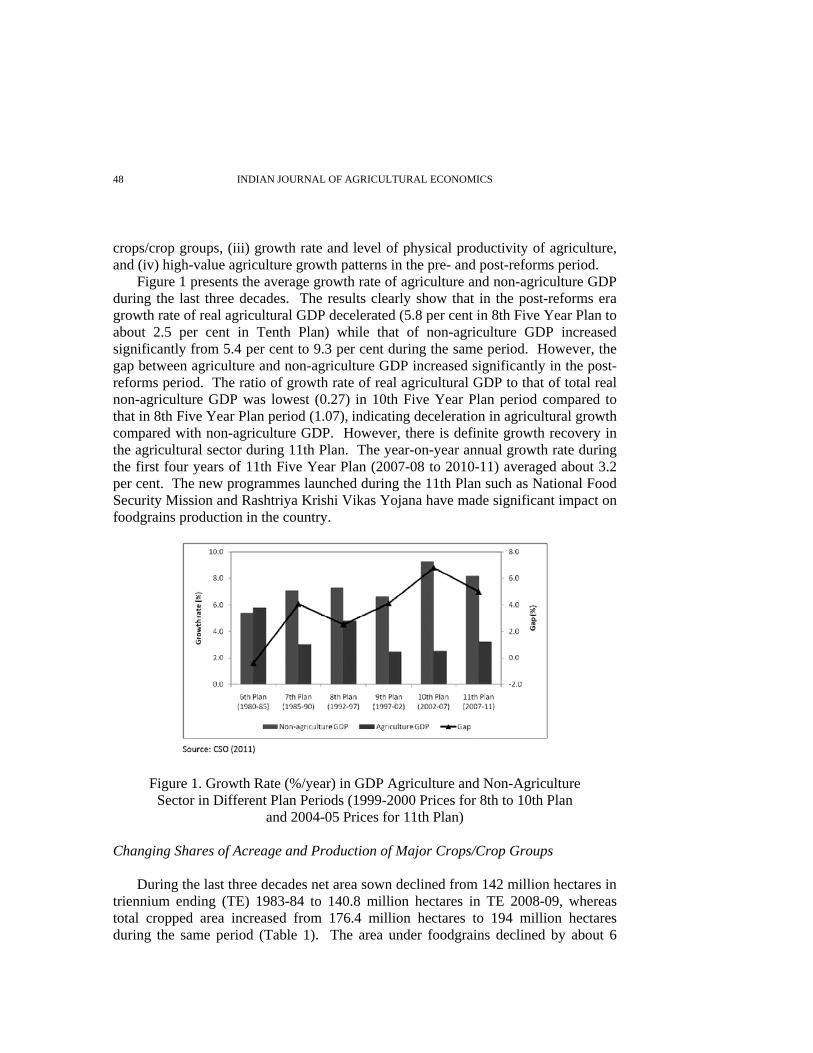
crops/crop groups, (iii) growth rate and level of physical productivity of agriculture, and (iv) high-value agriculture growth patterns in the pre- and post-reforms period. Figure 1 presents the average growth rate of agriculture and non-agriculture GDP during the last three decades. The results clearly show that in the post-reforms era growth rate of real agricultural GDP decelerated (5.8 per cent in 8th Five Year Plan to about 2.5 per cent in Tenth Plan) while that of non-agriculture GDP increased significantly from 5.4 per cent to 9.3 per cent during the same period. However, the gap between agriculture and non-agriculture GDP increased significantly in the post-reforms period. The ratio of growth rate of real agricultural GDP to that of total real non-agriculture GDP was lowest (0.27) in 10th Five Year Plan period compared to that in 8th Five Year Plan period (1.07), indicating deceleration in agricultural growth compared with non-agriculture GDP. However, there is definite growth recovery in the agricultural sector during 11th Plan. The year-on-year annual growth rate during the first four years of 11th Five Year Plan (2007-08 to 2010-11) averaged about 3.2 per cent. The new programmes launched during the 11th Plan such as National Food Security Mission and Rashtriya Krishi Vikas Yojana have made significant impact on foodgrains production in the country.
Figure 1. Growth Rate (%/year) in GDP Agriculture and Non-Agriculture Sector in Different Plan Periods (1999-2000 Prices for 8th to 10th Plan
and 2004-05 Prices for 11th Plan) Changing Shares of Acreage and Production of Major Crops/Crop Groups During the last three decades net area sown declined from 142 million hectares in triennium ending (TE) 1983-84 to 140.8 million hectares in TE 2008-09, whereas total cropped area increased from 176.4 million hectares to 194 million hectares during the same period (Table 1). The area under foodgrains declined by about 6

INDIA’S AGRICULTURAL DEVELOPMENT UNDER THE NEW ECONOMIC REGIME 49
million hectares between TE 1983-84 and TE 2008-09 and this decline in area under foodgrains reduced the share of foodgrains in total cropped area from about 73 per cent in TE 1983-84 to about 63.8 per cent in TE 2007-08 (Table 2). The area under pulses has remained almost stagnant at about 23 million hectares, while area under wheat has increased by 4.6 million hectares, and rice by 3.7 million hectares. The biggest loser has been coarse cereals where the area under cultivation has declined from 41.5 million hectares in TE 1983-84 to 33.6 million hectares in TE 1993-94 and 27.9 million hectares in TE 2008-09. The share of coarse cereals in total cropped area fell from 23.7 per cent in early 1980s to 14.8 per cent in TE 2007-08. During the last two decades, foodgrains production increased from 177.4 million tonnes in TE 1993-94 to 227.8 million tonnes in TE 2009-10, or by over 28 per cent (Table 1). However, the highest increase was observed in the case of cotton (>200 per cent increase), followed by fruits and vegetables (97 per cent), condiments and spices (66 per cent) and wheat (39 per cent). Pulses recorded the lowest increase in production, from 12.7 million tonnes in TE 1993-94 to 14.6 million tonnes in TE 2009-10. However, India is likely to have record pulses production estimated at about 18 million tonnes in 2010-11. The decline in area under foodgrains resulted in increase in area under other crops. The largest beneficiary of this decline were oilseeds during the decade of 1980s, when area under oilseeds increased from 18.5 million hectares in TE 1983-84 to 26 million hectares in TE 1993-94 but area under oilseeds remained stable between TE 1993-94 and TE 2008-09. The share of oilseeds in total cropped area increased significantly from less than 10 per cent in early eighties to 14.8 per cent in early
TABLE 1. TRENDS IN AREA AND PRODUCTION OF MAJOR CROPS/CROP GROUPS: TE 1983-84 TO TE 2008-09
Area (million ha) Production (million tonnes) Crops (1)
TE 1983-84 (2)
TE 1993-94 (3)
TE 2008-09 (4)
TE 1983-84 (5)
TE 1993-94 (6)
TE 2009-10 (7)
Rice 40.1 42.3 43.8 53.5 75.9 95.0 Wheat 23.5 24.3 28.1 41.9 57.6 80.0 Coarse cereals 41.5 33.6 27.9 30.9 31.1 38.2 Pulses 23.4 22.4 23.0 12.1 12.7 14.6 Foodgrains 128.5 122.6 122.8 138.4 177.4 227.8 Oilseeds 18.5 26.0 26.8 11.6 20.1 27.5 Sugarcane 3.2 3.6 4.6 183.3 237.2 303.7 Fruits and vegetables
5.1
8.3
13.6
-
95.6
188.7
Condiments and spices
2.2
2.3
2.6
- 2.5
4.15
Cotton* 7.9 7.5 9.7 7.3 10.6 24.1 Net area sown 142.0 142.2 140.8 - - - Total cropped area
176.4
184.8
194.0
-
-
-
Source: Government of India (2010a). Note: Cotton production is in million bales of 170 kg each.
INDIAN JOURNAL OF AGRICULTURAL ECONOMICS 50
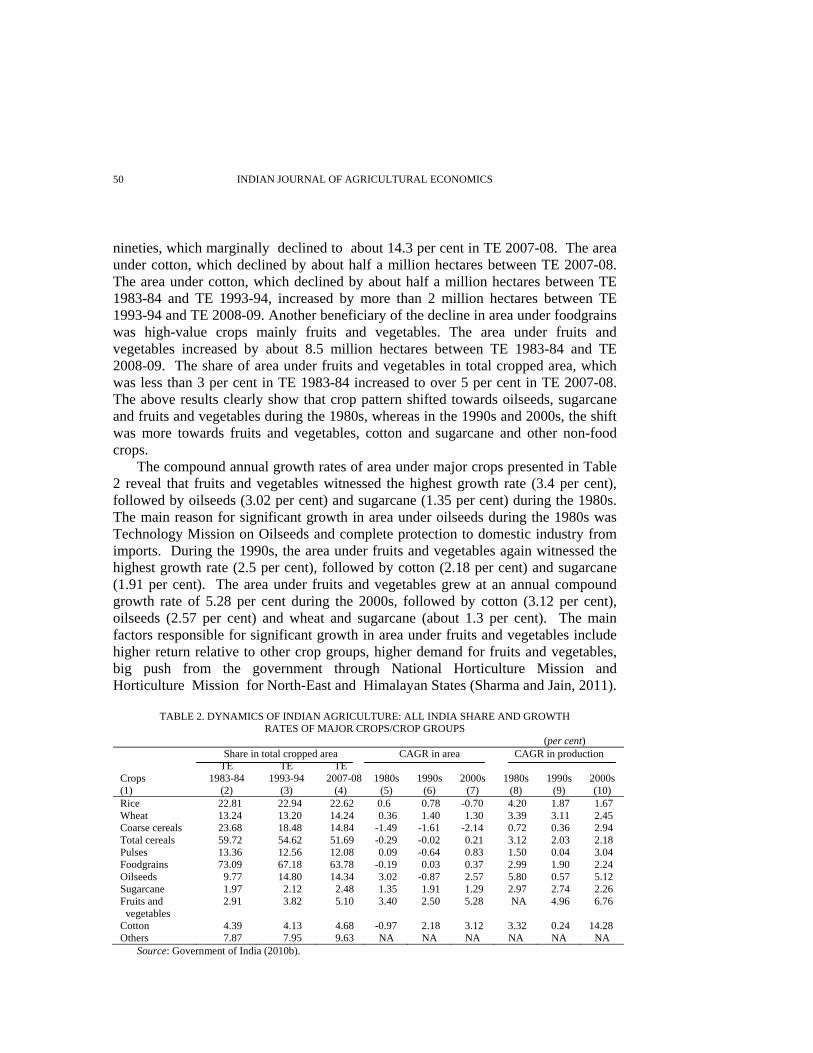
nineties, which marginally declined to about 14.3 per cent in TE 2007-08. The area under cotton, which declined by about half a million hectares between TE 2007-08. The area under cotton, which declined by about half a million hectares between TE 1983-84 and TE 1993-94, increased by more than 2 million hectares between TE 1993-94 and TE 2008-09. Another beneficiary of the decline in area under foodgrains was high-value crops mainly fruits and vegetables. The area under fruits and vegetables increased by about 8.5 million hectares between TE 1983-84 and TE 2008-09. The share of area under fruits and vegetables in total cropped area, which was less than 3 per cent in TE 1983-84 increased to over 5 per cent in TE 2007-08. The above results clearly show that crop pattern shifted towards oilseeds, sugarcane and fruits and vegetables during the 1980s, whereas in the 1990s and 2000s, the shift was more towards fruits and vegetables, cotton and sugarcane and other non-food crops. The compound annual growth rates of area under major crops presented in Table 2 reveal that fruits and vegetables witnessed the highest growth rate (3.4 per cent), followed by oilseeds (3.02 per cent) and sugarcane (1.35 per cent) during the 1980s. The main reason for significant growth in area under oilseeds during the 1980s was Technology Mission on Oilseeds and complete protection to domestic industry from imports. During the 1990s, the area under fruits and vegetables again witnessed the highest growth rate (2.5 per cent), followed by cotton (2.18 per cent) and sugarcane (1.91 per cent). The area under fruits and vegetables grew at an annual compound growth rate of 5.28 per cent during the 2000s, followed by cotton (3.12 per cent), oilseeds (2.57 per cent) and wheat and sugarcane (about 1.3 per cent). The main factors responsible for significant growth in area under fruits and vegetables include higher return relative to other crop groups, higher demand for fruits and vegetables, big push from the government through National Horticulture Mission and Horticulture Mission for North-East and Himalayan States (Sharma and Jain, 2011).
TABLE 2. DYNAMICS OF INDIAN AGRICULTURE: ALL INDIA SHARE AND GROWTH RATES OF MAJOR CROPS/CROP GROUPS
(per cent) Share in total cropped area CAGR in area CAGR in production Crops (1)
TE 1983-84
(2)
TE 1993-94
(3)
TE 2007-08
(4)
1980s
(5)
1990s
(6)
2000s
(7)
1980s
(8)
1990s
(9)
2000s (10)
Rice 22.81 22.94 22.62 0.6 0.78 -0.70 4.20 1.87 1.67 Wheat 13.24 13.20 14.24 0.36 1.40 1.30 3.39 3.11 2.45 Coarse cereals 23.68 18.48 14.84 -1.49 -1.61 -2.14 0.72 0.36 2.94 Total cereals 59.72 54.62 51.69 -0.29 -0.02 0.21 3.12 2.03 2.18 Pulses 13.36 12.56 12.08 0.09 -0.64 0.83 1.50 0.04 3.04 Foodgrains 73.09 67.18 63.78 -0.19 0.03 0.37 2.99 1.90 2.24 Oilseeds 9.77 14.80 14.34 3.02 -0.87 2.57 5.80 0.57 5.12 Sugarcane 1.97 2.12 2.48 1.35 1.91 1.29 2.97 2.74 2.26 Fruits and vegetables
2.91 3.82 5.10 3.40 2.50 5.28 NA 4.96 6.76
Cotton 4.39 4.13 4.68 -0.97 2.18 3.12 3.32 0.24 14.28 Others 7.87 7.95 9.63 NA NA NA NA NA NA
Source: Government of India (2010b).
INDIA’S AGRICULTURAL DEVELOPMENT UNDER THE NEW ECONOMIC REGIME 51
In case of cotton, the increase in area, production and productivity was mainly technology-driven (introduction of Bt cotton in 2002-03) as well as higher profitability compared with other competing crops.
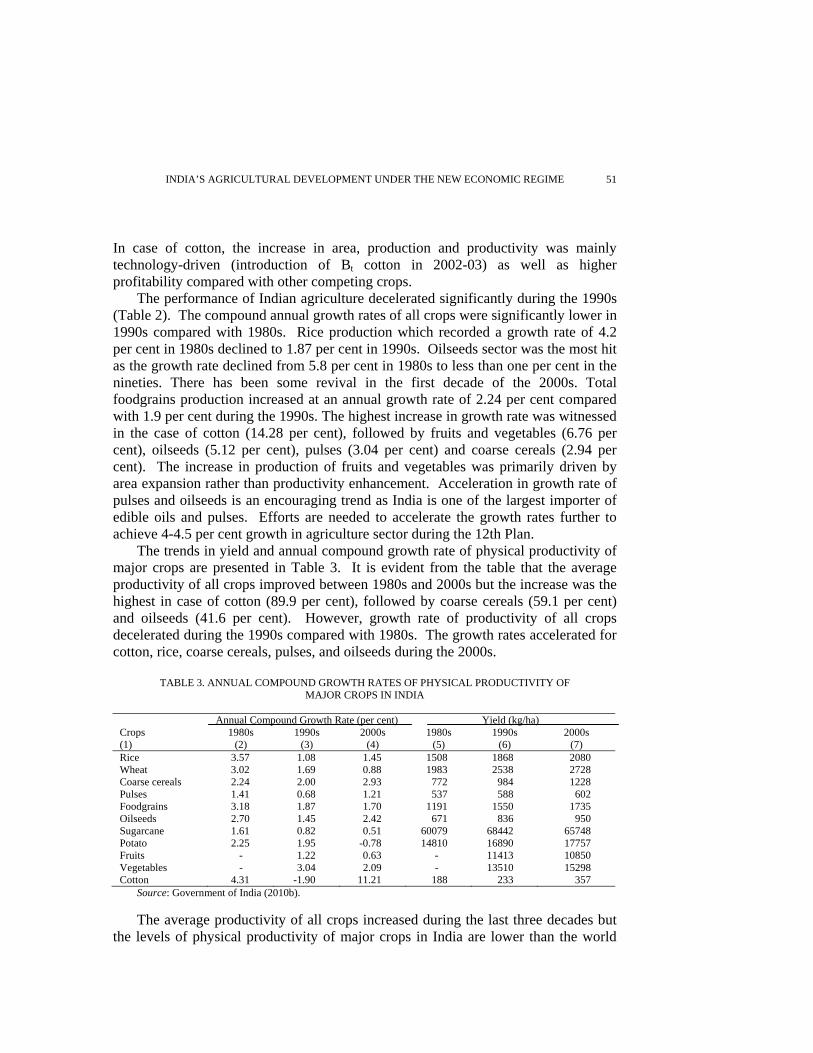
The performance of Indian agriculture decelerated significantly during the 1990s (Table 2). The compound annual growth rates of all crops were significantly lower in 1990s compared with 1980s. Rice production which recorded a growth rate of 4.2 per cent in 1980s declined to 1.87 per cent in 1990s. Oilseeds sector was the most hit as the growth rate declined from 5.8 per cent in 1980s to less than one per cent in the nineties. There has been some revival in the first decade of the 2000s. Total foodgrains production increased at an annual growth rate of 2.24 per cent compared with 1.9 per cent during the 1990s. The highest increase in growth rate was witnessed in the case of cotton (14.28 per cent), followed by fruits and vegetables (6.76 per cent), oilseeds (5.12 per cent), pulses (3.04 per cent) and coarse cereals (2.94 per cent). The increase in production of fruits and vegetables was primarily driven by area expansion rather than productivity enhancement. Acceleration in growth rate of pulses and oilseeds is an encouraging trend as India is one of the largest importer of edible oils and pulses. Efforts are needed to accelerate the growth rates further to achieve 4-4.5 per cent growth in agriculture sector during the 12th Plan. The trends in yield and annual compound growth rate of physical productivity of major crops are presented in Table 3. It is evident from the table that the average productivity of all crops improved between 1980s and 2000s but the increase was the highest in case of cotton (89.9 per cent), followed by coarse cereals (59.1 per cent) and oilseeds (41.6 per cent). However, growth rate of productivity of all crops decelerated during the 1990s compared with 1980s. The growth rates accelerated for cotton, rice, coarse cereals, pulses, and oilseeds during the 2000s.
TABLE 3. ANNUAL COMPOUND GROWTH RATES OF PHYSICAL PRODUCTIVITY OF MAJOR CROPS IN INDIA
Annual Compound Growth Rate (per cent) Yield (kg/ha) Crops (1)
1980s (2)
1990s (3)
2000s (4)
1980s (5)
1990s (6)
2000s (7)
Rice 3.57 1.08 1.45 1508 1868 2080 Wheat 3.02 1.69 0.88 1983 2538 2728 Coarse cereals 2.24 2.00 2.93 772 984 1228 Pulses 1.41 0.68 1.21 537 588 602 Foodgrains 3.18 1.87 1.70 1191 1550 1735 Oilseeds 2.70 1.45 2.42 671 836 950 Sugarcane 1.61 0.82 0.51 60079 68442 65748 Potato 2.25 1.95 -0.78 14810 16890 17757 Fruits - 1.22 0.63 - 11413 10850 Vegetables - 3.04 2.09 - 13510 15298 Cotton 4.31 -1.90 11.21 188 233 357
Source: Government of India (2010b). The average productivity of all crops increased during the last three decades but the levels of physical productivity of major crops in India are lower than the world
INDIAN JOURNAL OF AGRICULTURAL ECONOMICS 52
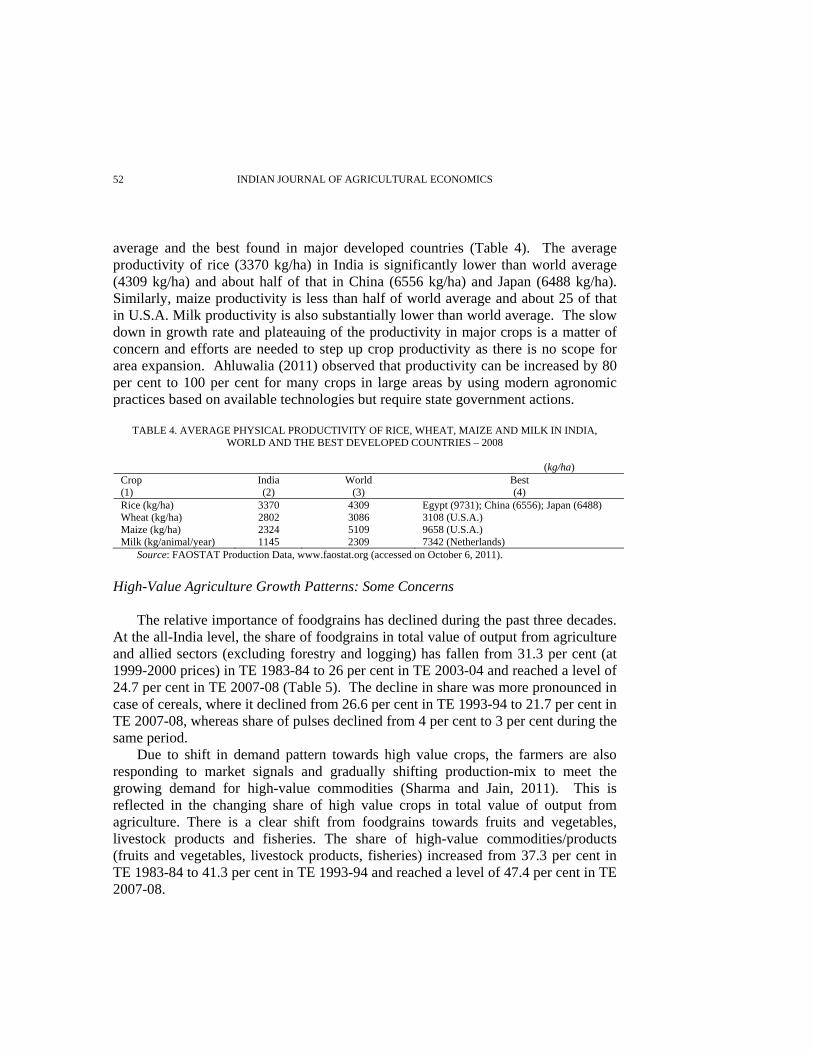
average and the best found in major developed countries (Table 4). The average productivity of rice (3370 kg/ha) in India is significantly lower than world average (4309 kg/ha) and about half of that in China (6556 kg/ha) and Japan (6488 kg/ha). Similarly, maize productivity is less than half of world average and about 25 of that in U.S.A. Milk productivity is also substantially lower than world average. The slow down in growth rate and plateauing of the productivity in major crops is a matter of concern and efforts are needed to step up crop productivity as there is no scope for area expansion. Ahluwalia (2011) observed that productivity can be increased by 80 per cent to 100 per cent for many crops in large areas by using modern agronomic practices based on available technologies but require state government actions.
TABLE 4. AVERAGE PHYSICAL PRODUCTIVITY OF RICE, WHEAT, MAIZE AND MILK IN INDIA, WORLD AND THE BEST DEVELOPED COUNTRIES – 2008
(kg/ha)
Crop (1)
India (2)
World (3)
Best (4)
Rice (kg/ha) 3370 4309 Egypt (9731); China (6556); Japan (6488) Wheat (kg/ha) 2802 3086 3108 (U.S.A.) Maize (kg/ha) 2324 5109 9658 (U.S.A.) Milk (kg/animal/year) 1145 2309 7342 (Netherlands)
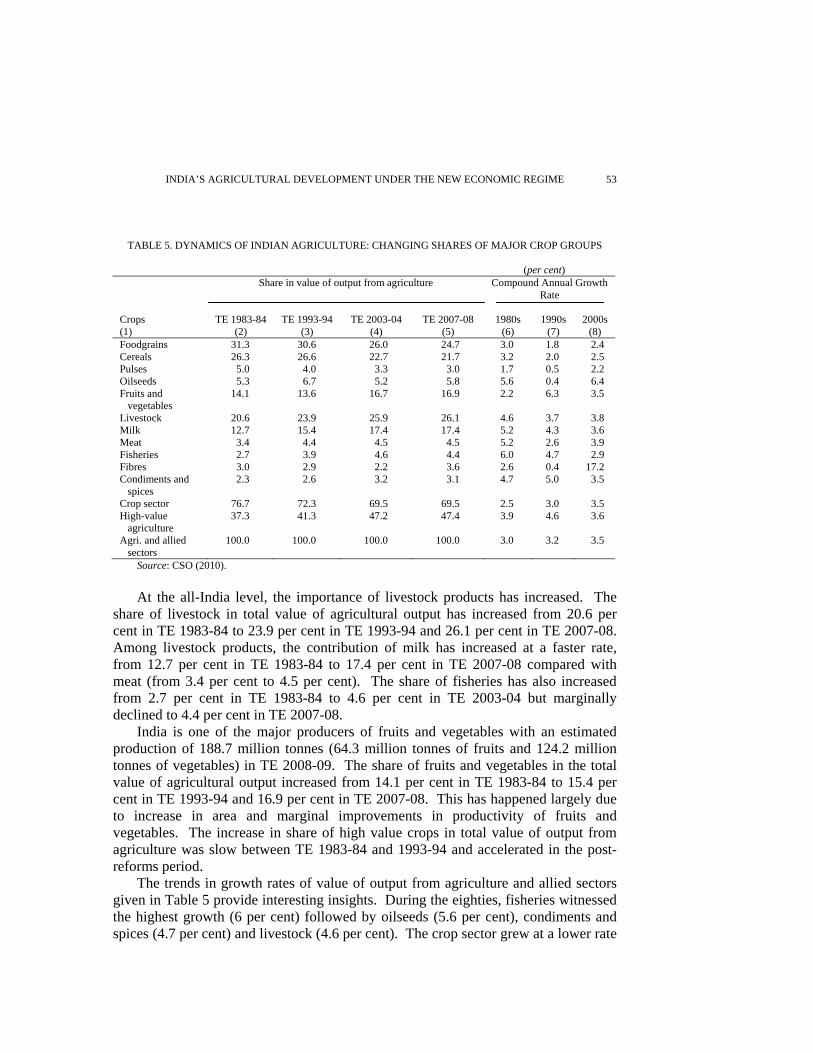
Source: FAOSTAT Production Data, www.faostat.org (accessed on October 6, 2011). High-Value Agriculture Growth Patterns: Some Concerns The relative importance of foodgrains has declined during the past three decades. At the all-India level, the share of foodgrains in total value of output from agriculture and allied sectors (excluding forestry and logging) has fallen from 31.3 per cent (at 1999-2000 prices) in TE 1983-84 to 26 per cent in TE 2003-04 and reached a level of 24.7 per cent in TE 2007-08 (Table 5). The decline in share was more pronounced in case of cereals, where it declined from 26.6 per cent in TE 1993-94 to 21.7 per cent in TE 2007-08, whereas share of pulses declined from 4 per cent to 3 per cent during the same period.
Due to shift in demand pattern towards high value crops, the farmers are also responding to market signals and gradually shifting production-mix to meet the growing demand for high-value commodities (Sharma and Jain, 2011). This is reflected in the changing share of high value crops in total value of output from agriculture. There is a clear shift from foodgrains towards fruits and vegetables, livestock products and fisheries. The share of high-value commodities/products (fruits and vegetables, livestock products, fisheries) increased from 37.3 per cent in TE 1983-84 to 41.3 per cent in TE 1993-94 and reached a level of 47.4 per cent in TE 2007-08.
INDIA’S AGRICULTURAL DEVELOPMENT UNDER THE NEW ECONOMIC REGIME 53
TABLE 5. DYNAMICS OF INDIAN AGRICULTURE: CHANGING SHARES OF MAJOR CROP GROUPS
(per cent) Share in value of output from agriculture Compound Annual Growth
Rate Crops (1)
TE 1983-84
(2)
TE 1993-94
(3)
TE 2003-04
(4)
TE 2007-08
(5)
1980s
(6)
1990s
(7)
2000s
(8) Foodgrains 31.3 30.6 26.0 24.7 3.0 1.8 2.4 Cereals 26.3 26.6 22.7 21.7 3.2 2.0 2.5 Pulses 5.0 4.0 3.3 3.0 1.7 0.5 2.2 Oilseeds 5.3 6.7 5.2 5.8 5.6 0.4 6.4 Fruits and vegetables
14.1 13.6 16.7 16.9 2.2 6.3 3.5
Livestock 20.6 23.9 25.9 26.1 4.6 3.7 3.8 Milk 12.7 15.4 17.4 17.4 5.2 4.3 3.6 Meat 3.4 4.4 4.5 4.5 5.2 2.6 3.9 Fisheries 2.7 3.9 4.6 4.4 6.0 4.7 2.9 Fibres 3.0 2.9 2.2 3.6 2.6 0.4 17.2 Condiments and spices
2.3 2.6 3.2 3.1 4.7 5.0 3.5
Crop sector 76.7 72.3 69.5 69.5 2.5 3.0 3.5 High-value agriculture
37.3 41.3 47.2 47.4 3.9 4.6 3.6
Agri. and allied sectors
100.0 100.0 100.0 100.0 3.0 3.2 3.5
Source: CSO (2010). At the all-India level, the importance of livestock products has increased. The share of livestock in total value of agricultural output has increased from 20.6 per cent in TE 1983-84 to 23.9 per cent in TE 1993-94 and 26.1 per cent in TE 2007-08. Among livestock products, the contribution of milk has increased at a faster rate, from 12.7 per cent in TE 1983-84 to 17.4 per cent in TE 2007-08 compared with meat (from 3.4 per cent to 4.5 per cent). The share of fisheries has also increased from 2.7 per cent in TE 1983-84 to 4.6 per cent in TE 2003-04 but marginally declined to 4.4 per cent in TE 2007-08. India is one of the major producers of fruits and vegetables with an estimated production of 188.7 million tonnes (64.3 million tonnes of fruits and 124.2 million tonnes of vegetables) in TE 2008-09. The share of fruits and vegetables in the total value of agricultural output increased from 14.1 per cent in TE 1983-84 to 15.4 per cent in TE 1993-94 and 16.9 per cent in TE 2007-08. This has happened largely due to increase in area and marginal improvements in productivity of fruits and vegetables. The increase in share of high value crops in total value of output from agriculture was slow between TE 1983-84 and 1993-94 and accelerated in the post-reforms period. The trends in growth rates of value of output from agriculture and allied sectors given in Table 5 provide interesting insights. During the eighties, fisheries witnessed the highest growth (6 per cent) followed by oilseeds (5.6 per cent), condiments and spices (4.7 per cent) and livestock (4.6 per cent). The crop sector grew at a lower rate

INDIAN JOURNAL OF AGRICULTURAL ECONOMICS 54
of 2.5 per cent, cereals recorded 3.2 per cent growth, and pulses grew at 1.7 per cent, lowest among all crops/sub-sectors. However, during the nineties almost all crops groups/sub-sectors except fruits and vegetables and condiments and spices, experienced deceleration in growth rates. The output of fruits and vegetables increased at much faster rate (6.3 per cent) during the nineties compared to growth rate (2.2 per cent) in the 1980s as well as other crop groups/sub-sectors. During the 1990s, condiments and spices also witnessed acceleration in rate of growth in output. The livestock sector grew at an annual compound growth rate of 3.7 per cent (milk 4.3 per cent and meat 2.6 per cent) compared with 4.6 per cent in the eighties. However, during the 2000s the performance of crop sector improved and growth rate increased from 1.8 per cent in 1990s to 2.4 per cent in 2000s. Growth rate in fibres was the highest (17.2 per cent), mainly because of Bt cotton effect, followed by oilseeds (6.4 per cent). Foodgrains output increased by about 2.4 per cent while rate of growth in livestock sector was almost same (3.8 per cent) as during the 1990s. There was slowdown in growth of fisheries (2.9 per cent) in 2000s compared with 4.7 per cent in 1990s), milk output (3.6 per cent) and condiments and spices (3.5 per cent). Growth rate of fruits and vegetables was also lower (3.5 per cent) in the 2000s compared to growth rate (6.3 per cent) in the 1990s. It is evident from the above analysis that high growth of high-value agriculture achieved during the 1990s could not be maintained in the 2000s mainly because of slow down in growth of fruits and vegetables and fisheries sector. However, the crop sector grew at about 3.5 per cent during the 2000s because of better performance of fibres, cereals, pulses and oilseeds in the recent years. However, as per Draft Approach Paper for the Twelfth Five Year Plan the annual output growth rate of about 1.8 to 2 per cent is envisaged for cereals with rice output likely to grow around 2 per cent, pulses output has to be stepped up to achieve about 2 per cent growth rate in foodgrains output (Government of India, 2011a). However, high-value agriculture segment, horticulture and animal husbandry are targeted to grow at 4.5 to 6 per cent. Oilseeds sector should grow at over 3 per cent. Overall, it would give an output growth of between 4 and 4.5 per cent in agriculture sector. In order to meet these targets, efforts are required to increase productivity of all crops in general but pulses, fruits and vegetables, livestock particularly dairy sector and fisheries sector in particular, which have witnessed deceleration in output growth during the last decade. 2.2 Rising Number of Small and Marginal Farmers and Fragmenting Farms Indian agriculture is characterised by small and fragmented land holdings. There are about 129 million operational holdings possessing about 158 million ha land with average farm size of only 1.23 hectares (Figure 2). Around 83 per cent of farmers have land holdings less than 2 ha and they cultivate nearly 41 per cent of the arable land. On the other hand, less than 1 per cent of the farmers have operational land

INDIA’S AGRICULTURAL DEVELOPMENT UNDER THE NEW ECONOMIC REGIME 55
holdings above 10 ha and account for 11.8 per cent of the total cultivated land. The share of small and marginal farmers has increased from 69.7 per cent in 1970-71 to about 83 per cent in 2005-06 while their share in total operational area has increased from 20.9 per cent to over 41 per cent during the same period. The average farm size in the country has declined from 2.3 ha in 1970-71 to 1.23 ha in 2005-06. This reduction in farm size has been higher in the case of medium and large farmers compared with small and marginal farmers.
Source: Government of India (2010a).
Figure 2. Changes in Composition of Different Categories of Farmers and Average Farm Size in India: 1970-71 to 2005-06
An inverse relationship between farm size and crop productivity has been well
established (Sen, 1962, 1964; Mazumdar, 1965; Hanumantha Rao, 1966; Saini, 1971; Bardhan, 1973; Berry, 1972; Chand et. al., 2011 a,b) but the participation of smallholder producers in markets remains low due to a range of constraints such as low volumes, high transaction costs, lack of markets and information access. Improved market access can have large impact on smallholder incomes but it requires both policy and institutional reforms. Chand et al., (2011a,b) observed that small farm in India is superior in terms of production performance but is weak in terms of generating adequate income and sustaining livelihoods. The study shows that small holdings below 0.8 hectare do not generate enough income to keep farm family out of poverty despite high productivity. Therefore, another area for policy intervention is land market reforms. As holdings are becoming small, fragmented and uneconomical, the marginal farmers may be better off by leasing out the land to other farmers and seek gainful employment outside the sector. However, leasing is not legal in some states, which prohibits land markets to operate. Therefore, there is a need to have more flexible laws related to leasing of land but with sufficient safeguards to protect the interest of small and marginal farmers leasing out land.

INDIAN JOURNAL OF AGRICULTURAL ECONOMICS 56
2.3 Degradation of Natural Resources Land and water are the two most important resources for sustainable growth of agriculture. It is well established that health and strength of these scarce resources is degrading at an accelerated pace and productive resources are being diverted from agricultural to other sectors. In this section we discuss the problems associated with groundwater over-exploitation and land degradation. Over-Exploitation of Groundwater Resources With nearly 59 per cent of irrigated agriculture and 85 per cent of drinking water supplies dependent on it, groundwater is a vital resource for rural areas in India. Through the construction of millions of private tubewells and wells, there has been a phenomenal growth in the exploitation of groundwater in the last five decades. The groundwater irrigation was a prime driver of green revolution technology in the mid-1960s and increasing cropping intensity in the country. However, this era of seemingly endless reliance on groundwater for both irrigation and drinking water purposes is now approaching its limit as an increasing number of wells reach unsustainable levels of exploitation. The over-exploitation of groundwater is emerging as an increasingly serious problem in certain agriculturally important districts of the country. The problem is more pronounced in rice-wheat based cropping systems in the Indo-Gangetic plains, and some sugarcane growing regions in the western and southern parts of the country. According to the 2004 nationwide assessment, 29 per cent of the groundwater blocks are in the semi-critical, critical, or over-exploited categories. For five states, Gujarat, Haryana, Punjab, Rajasthan, and Tamil Nadu taken together, about two-third of the groundwater blocks fall in these categories. A crisis situation now exists in a number of states. In Punjab, groundwater in 75 per cent of blocks is over-exploited; in Rajasthan the corresponding figure is 59 per cent; and for Karnataka and Tamil Nadu the figure is around 37 per cent (Table 6). The situation is deteriorating at a rapid pace. Between 1995 and 2004, the proportion of unsafe districts (semi-critical, critical and over-exploited) grew from 9 per cent to 31 per cent, the proportion of area affected increased from 5 per cent to 33 per cent and the population affected from 7 per cent to 35 per cent (Government of India, 2011d). A number of policy and institutional factors have been responsible for over-exploitation of groundwater in India. Easy availability of credit from financial institutions for installing tube wells and provision of highly subsidised or free electricity for pumping in many states has encouraged increased extraction. The potential socio-economic consequences of depletion of groundwater resources as well as overuse of surface irrigation water are serious.

INDIA’S AGRICULTURAL DEVELOPMENT UNDER THE NEW ECONOMIC REGIME 57
TABLE 6. CLASSIFICATION OF BLOCKS/MANDALS/TALUKAS IN TERMS OF GROUNDWATER EXPLOITATION
Semi-critical Critical Over-exploited States (1)
Total number of assessed units
(2)
Number
(3)
Per cent
(4)
Number
(5)
Per cent
(6)
Number
(7)
Per cent
(8) Andhra Pradesh 1231 175 14 77 6 219 18 Gujarat 223 69 31 12 5 31 14 Haryana 113 5 4 11 10 55 49 Karnataka 175 14 8 3 2 65 37 Kerala 151 30 20 15 10 5 3 Madhya Pradesh 312 19 6 5 2 24 8 Maharashtra 318 23 7 1 0 7 2 Punjab 137 4 3 5 4 103 75 Rajasthan 237 14 6 50 21 140 59 Tamil Nadu 385 57 15 33 9 142 37 Uttar Pradesh 803 88 11 13 2 37 5 West Bengal 269 37 14 1 0 0 0 India 5723 550 10 226 4 839 15
Source: Government of India (2010c). Attempts to regulate groundwater extraction by imposing credit restrictions have
not been successful because the well-off farmers have accessed private resources. More fundamentally, a well defined system of property rights to water that limits individual and collective withdrawals has been absent. The electricity for agricultural sector is highly subsidised in many states and free of cost in some states but low predictability of power supply. Therefore, there is a need for linking electricity tariffs with the actual consumption of power, but its implementation is more problematic in view of farmer’s resistance to pay more for inputs in general and electricity in particular. Depletion and Degradation of Land Resources Shifts in resource availability and resulting land use changes are adversely affecting growth of agricultural sector and national food security. A high degree of degradation of existing land resources has aggravated the problem. The per capita availability of cultivable land has declined from 0.27 ha. in 1982 to 0.18 ha. in 2003. This, in turn, is adversely affecting the livelihoods of the farming community in general and the small and marginal farmers in particular. The trends in agricultural land use in India during the last three decades are given in Table 7. Land not available for cultivation has witnessed a continuous increase over time while land available for cultivation has declined. For example, the net area sown has declined from about 142 million hectares in Triennium Ending (TE) 1983-84 to 140.76 million hectares in TE 2008-09, a reduction of about 1.3 million hectares. Land not available for cultivation has increased from about 40 million hectares in TE 1983-84 to 43.16 million hectares in TE 2008-09. Similarly, the area under fallow land has increased from 23.26 million hectares to 25.3 million hectares
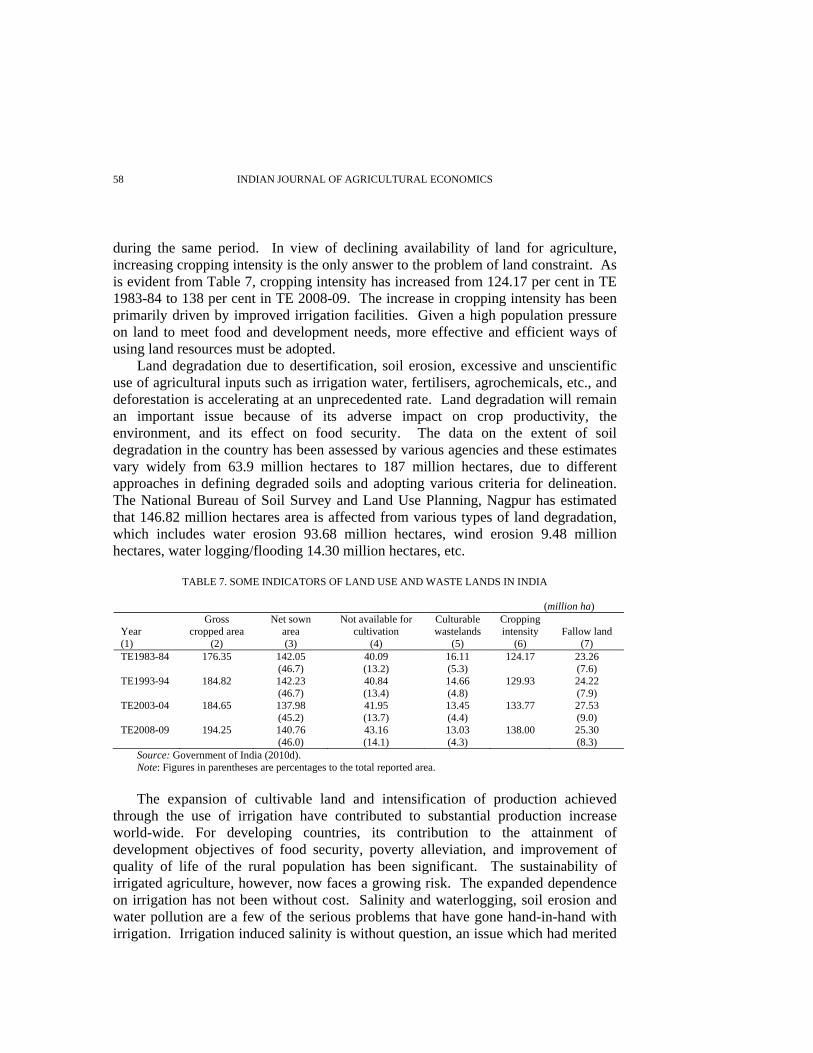
INDIAN JOURNAL OF AGRICULTURAL ECONOMICS 58
during the same period. In view of declining availability of land for agriculture, increasing cropping intensity is the only answer to the problem of land constraint. As is evident from Table 7, cropping intensity has increased from 124.17 per cent in TE 1983-84 to 138 per cent in TE 2008-09. The increase in cropping intensity has been primarily driven by improved irrigation facilities. Given a high population pressure on land to meet food and development needs, more effective and efficient ways of using land resources must be adopted. Land degradation due to desertification, soil erosion, excessive and unscientific use of agricultural inputs such as irrigation water, fertilisers, agrochemicals, etc., and deforestation is accelerating at an unprecedented rate. Land degradation will remain an important issue because of its adverse impact on crop productivity, the environment, and its effect on food security. The data on the extent of soil degradation in the country has been assessed by various agencies and these estimates vary widely from 63.9 million hectares to 187 million hectares, due to different approaches in defining degraded soils and adopting various criteria for delineation. The National Bureau of Soil Survey and Land Use Planning, Nagpur has estimated that 146.82 million hectares area is affected from various types of land degradation, which includes water erosion 93.68 million hectares, wind erosion 9.48 million hectares, water logging/flooding 14.30 million hectares, etc.
TABLE 7. SOME INDICATORS OF LAND USE AND WASTE LANDS IN INDIA (million ha)
Year (1)
Gross cropped area
(2)
Net sown area (3)
Not available for cultivation
(4)
Culturable wastelands
(5)
Cropping intensity
(6)
Fallow land
(7) TE1983-84 176.35 142.05
(46.7) 40.09 (13.2)
16.11 (5.3)
124.17
23.26 (7.6)
TE1993-94 184.82 142.23 (46.7)
40.84 (13.4)
14.66 (4.8)
129.93 24.22 (7.9)
TE2003-04 184.65 137.98 (45.2)
41.95 (13.7)
13.45 (4.4)
133.77 27.53 (9.0)
TE2008-09 194.25 140.76 (46.0)
43.16 (14.1)
13.03 (4.3)
138.00 25.30 (8.3)
Source: Government of India (2010d). Note: Figures in parentheses are percentages to the total reported area. The expansion of cultivable land and intensification of production achieved through the use of irrigation have contributed to substantial production increase world-wide. For developing countries, its contribution to the attainment of development objectives of food security, poverty alleviation, and improvement of quality of life of the rural population has been significant. The sustainability of irrigated agriculture, however, now faces a growing risk. The expanded dependence on irrigation has not been without cost. Salinity and waterlogging, soil erosion and water pollution are a few of the serious problems that have gone hand-in-hand with irrigation. Irrigation induced salinity is without question, an issue which had merited

INDIA’S AGRICULTURAL DEVELOPMENT UNDER THE NEW ECONOMIC REGIME 59
limited attention in the past. Amidst increasing demands for agricultural production to meet the growing demand of increasing population, the potential reduction in agricultural productivity due to salinity cannot be left unresolved. Although firm statistics on land areas affected by salinity and water logging are lacking but according to the CSSRI Report (2011), nearly 6.73 million hectares of agricultural land is affected by varying degrees of salt problems and represent a serious threat to food production to meet the needs of the country. The estimates indicate that by 2030 the country may have about 15.5 million hectares area under salt affected soils. 2.4 Public Expenditure on Agriculture A ‘big push’ for public expenditure in agriculture is required to bring about technical change in agriculture, and higher agricultural growth. It is evident that there has been a significant decline in the allocation of public outlay on agriculture as a per cent of total public outlay during the post-reforms period compared to what it was in pre-reforms period (Desai and Namboodiri, 1997). The share of gross capital formation in agriculture and allied sector in total gross capital formation (at current prices) has declined from about 11.7 per cent in 2001-02 to 6.89 per cent in 2006-07 and further to 6.6 per cent in 2007-08 (Figure 3). However, there has been a marked improvement in its share during the last couple of years and reached a level of 8.5 per cent in 2008-09 and marginally declined to 8.2 per cent in 2009-10. The GCF in agriculture and allied sectors as proportion to the GDP in agriculture which stagnated around 14 per cent during the first half of last decade, increased to over 20 per cent in 2009-10. However, the GCF in agriculture and allied sectors as percentage to total GDP has remained stagnant at around 2.5 to 3.0 per cent. In order to achieve over 4-4.5 per cent growth in agriculture sector, there is a need to step up investment in agriculture.
Figure 3. Trends in GCF in Agriculture and Allied Activities in India: 2001-02 to 2009-10
We have also analysed the trends in public sector expenditure under (i)
agriculture and allied sectors, (ii) irrigation, and flood control and (iii) rural

INDIAN JOURNAL OF AGRICULTURAL ECONOMICS 60
development during the last three decades. We have also examined the share of expenditure on agriculture research and education in total expenditure and trends in food and fertiliser subsidies. Table 8 presents the results for the pre-reforms (VI and VII FYPs) and post-reforms period (VIII to XI FYPs). The data presented in table shows that the share of public expenditure on agriculture and allied sectors declined from about 6 per cent in 6th Plan to about 4.5 per cent in Tenth Plan. During 11th Plan a higher allocation (124 per cent) of public sector resources was projected for agriculture and allied activities, from Tenth Plan realisation level of Rs. 60,702 crore, to Rs.1,36,381 crore (at 2006-07 prices) by the Centre, States and UTs with the share of Centre being Rs.50,924 crore (Government of India, 2011a). Rashtriya Krishi Vikas Yojana (RKVY), in the form of 100 per cent grant-in-aid, was launched in the 11th Five-Year Plan with a projected allocation of Rs.25,000 crore over and above the other on-going programmes to incentivise the States to make higher investment in agriculture. The RKVY has helped in increasing allocation to agricultural sector.
TABLE 8. PROFILE OF PUBLIC EXPENDITURE ON AGRICULTURE, IRRIGATION AND FLOOD CONTROL AND RURAL DEVELOPMENT SINCE SIXTH FIVE YEAR PLAN
(per cent to total public expenditure)
(1)
6th Plan (2)
7th Plan (3)
8th Plan (4)
9th Plan (5)
10th Plan (6)
11th Plan (7)
Agriculture and allied sector 6.1 5.8 5.1 4.5 4.5 4.4 Rural development 6.4 7.0 8.3 6.9 9.2 9.0 Irrigation and flood control 10.0 7.6 6.5 7.7 8.1 7.2 Agriculture, irrigation and flood control and rural development
23.9 22.0 20.9 19.9 23.0 21.8
Agriculture research and education (per cent of total agri and allied sector)
9.6 6.7 5.2 10.4 12.0 15.9
Food and fertiliser subsidy (per cent of total expenditure)
7.7 11.0 10.5 11.8 16.3 17.1
Source: Government of India, 2008, 2010b and 2011b. Irrigation, which is a leading input for agricultural growth, expenditure also witnessed a declining trend (10 per cent in Sixth plan to about 8 per cent in Tenth plan). However, the share of public sector expenditure under rural development in total expenditure increased from 6.4 per cent in the Sixth plan to 9.2 per cent in the Tenth plan. The expenditure on food and fertiliser subsidies has also increased significantly from 6.7 per cent in Seventh plan to about 16 per cent in Eleventh plan. The two main reasons for reduced share of public sector expenditure under agriculture and allied activities are: one, increased and larger public expenditure on rural development schemes like the Mahatma Gandhi National Rural Employment Guarantee Act (MNREGA), other rural development and poverty alleviation programmes, and two, increased and larger spending on food and fertiliser subsidy. It is interesting to note that public expenditure on agriculture research and education as a proportion of total expenditure on agriculture and allied sectors, which declined
INDIA’S AGRICULTURAL DEVELOPMENT UNDER THE NEW ECONOMIC REGIME 61
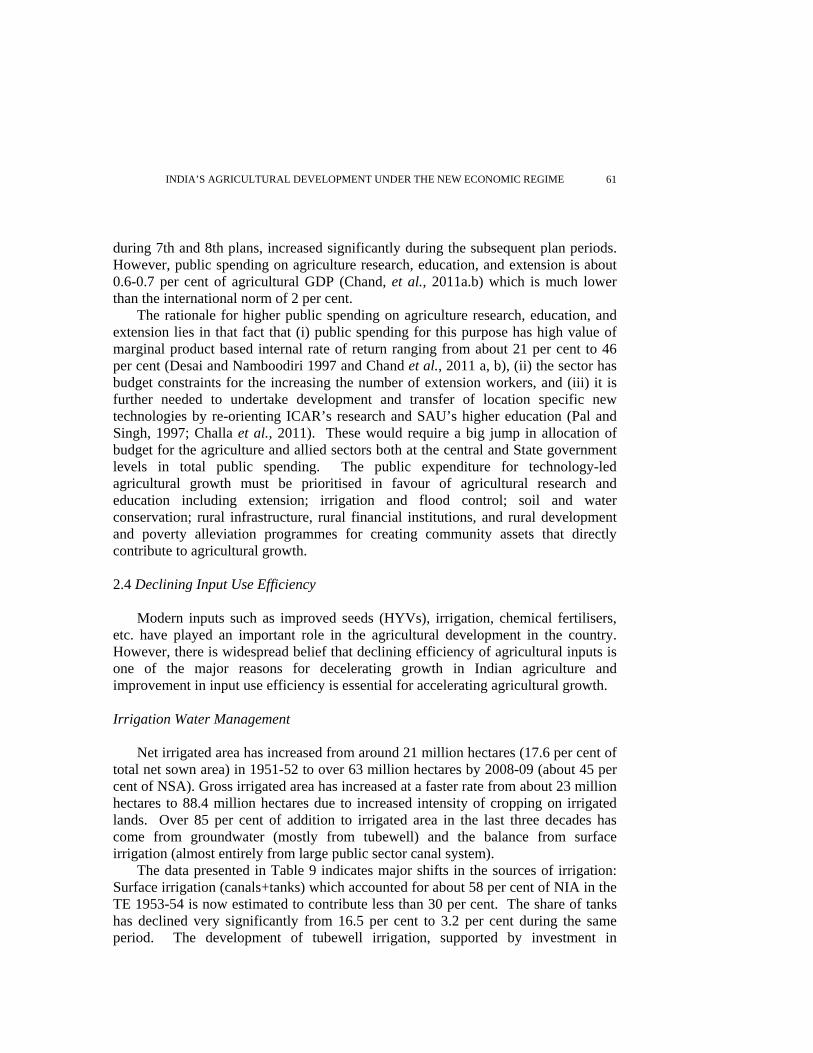
during 7th and 8th plans, increased significantly during the subsequent plan periods. However, public spending on agriculture research, education, and extension is about 0.6-0.7 per cent of agricultural GDP (Chand, et al., 2011a.b) which is much lower than the international norm of 2 per cent. The rationale for higher public spending on agriculture research, education, and extension lies in that fact that (i) public spending for this purpose has high value of marginal product based internal rate of return ranging from about 21 per cent to 46 per cent (Desai and Namboodiri 1997 and Chand et al., 2011 a, b), (ii) the sector has budget constraints for the increasing the number of extension workers, and (iii) it is further needed to undertake development and transfer of location specific new technologies by re-orienting ICAR’s research and SAU’s higher education (Pal and Singh, 1997; Challa et al., 2011). These would require a big jump in allocation of budget for the agriculture and allied sectors both at the central and State government levels in total public spending. The public expenditure for technology-led agricultural growth must be prioritised in favour of agricultural research and education including extension; irrigation and flood control; soil and water conservation; rural infrastructure, rural financial institutions, and rural development and poverty alleviation programmes for creating community assets that directly contribute to agricultural growth. 2.4 Declining Input Use Efficiency Modern inputs such as improved seeds (HYVs), irrigation, chemical fertilisers, etc. have played an important role in the agricultural development in the country. However, there is widespread belief that declining efficiency of agricultural inputs is one of the major reasons for decelerating growth in Indian agriculture and improvement in input use efficiency is essential for accelerating agricultural growth. Irrigation Water Management Net irrigated area has increased from around 21 million hectares (17.6 per cent of total net sown area) in 1951-52 to over 63 million hectares by 2008-09 (about 45 per cent of NSA). Gross irrigated area has increased at a faster rate from about 23 million hectares to 88.4 million hectares due to increased intensity of cropping on irrigated lands. Over 85 per cent of addition to irrigated area in the last three decades has come from groundwater (mostly from tubewell) and the balance from surface irrigation (almost entirely from large public sector canal system). The data presented in Table 9 indicates major shifts in the sources of irrigation: Surface irrigation (canals+tanks) which accounted for about 58 per cent of NIA in the TE 1953-54 is now estimated to contribute less than 30 per cent. The share of tanks has declined very significantly from 16.5 per cent to 3.2 per cent during the same period. The development of tubewell irrigation, supported by investment in
INDIAN JOURNAL OF AGRICULTURAL ECONOMICS 62
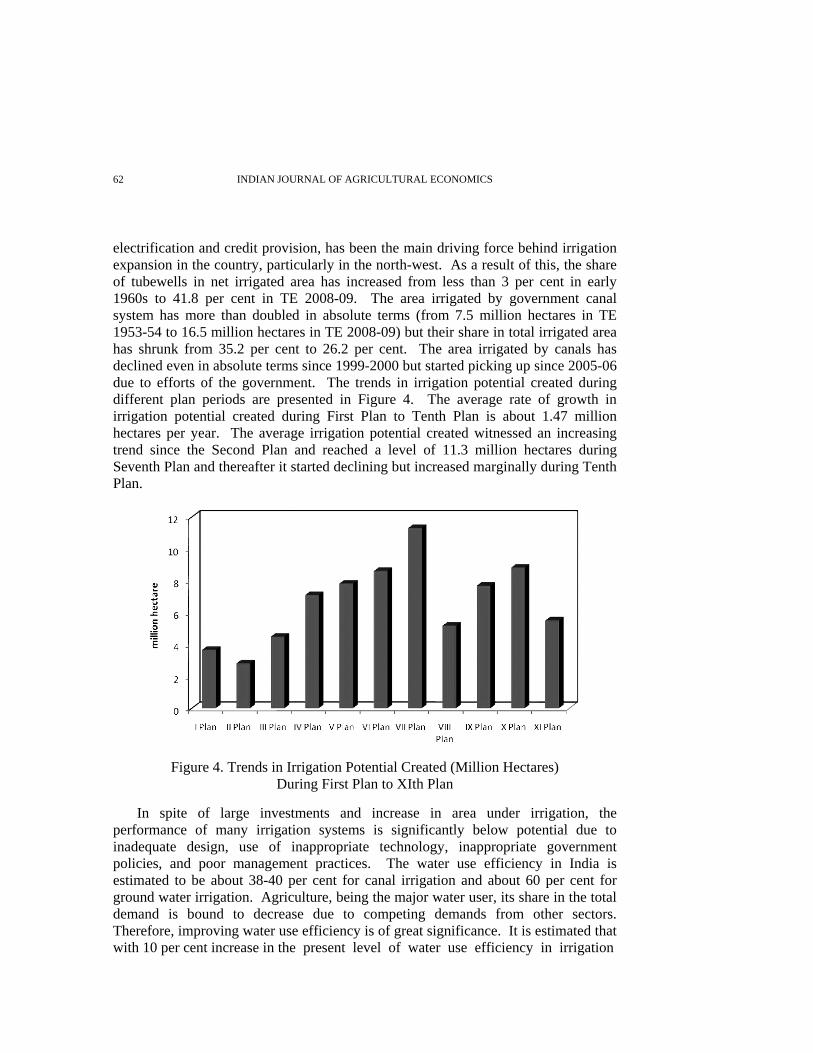
electrification and credit provision, has been the main driving force behind irrigation expansion in the country, particularly in the north-west. As a result of this, the share of tubewells in net irrigated area has increased from less than 3 per cent in early 1960s to 41.8 per cent in TE 2008-09. The area irrigated by government canal system has more than doubled in absolute terms (from 7.5 million hectares in TE 1953-54 to 16.5 million hectares in TE 2008-09) but their share in total irrigated area has shrunk from 35.2 per cent to 26.2 per cent. The area irrigated by canals has declined even in absolute terms since 1999-2000 but started picking up since 2005-06 due to efforts of the government. The trends in irrigation potential created during different plan periods are presented in Figure 4. The average rate of growth in irrigation potential created during First Plan to Tenth Plan is about 1.47 million hectares per year. The average irrigation potential created witnessed an increasing trend since the Second Plan and reached a level of 11.3 million hectares during Seventh Plan and thereafter it started declining but increased marginally during Tenth Plan.
Figure 4. Trends in Irrigation Potential Created (Million Hectares) During First Plan to XIth Plan
In spite of large investments and increase in area under irrigation, the
performance of many irrigation systems is significantly below potential due to inadequate design, use of inappropriate technology, inappropriate government policies, and poor management practices. The water use efficiency in India is estimated to be about 38-40 per cent for canal irrigation and about 60 per cent for ground water irrigation. Agriculture, being the major water user, its share in the total demand is bound to decrease due to competing demands from other sectors. Therefore, improving water use efficiency is of great significance. It is estimated that with 10 per cent increase in the present level of water use efficiency in irrigation

INDIA’S AGRICULTURAL DEVELOPMENT UNDER THE NEW ECONOMIC REGIME 63
TABLE 9. NET AREA IRRIGATED BY DIFFERENT SOURCES IN INDIA (million hectares)
Years (1)
Government canals
(2)
Private canals
(3)
Tank (4)
Tubewells
(5)
Other wells
(6)
Other sources
(7)
Total (8)
TE1953-54 7.30 (35.2)
1.23 (5.8)
3.47 (16.5)
0.0 (0.0)
6.34 (30.2)
2.59 (12.3)
21.01
TE1963-64 9.63 (37.8)
1.16 (4.5)
4.66 (18.3)
0.73 (2.9)
6.87 (26.9)
2.43 (9.6)
25.48
TE1973-74 12.12 (38.5)
0.87 (2.7)
3.82 (12.1)
4.87 (15.5)
7.51 (23.8)
2.31 (7.3)
31.50
TE1983-84 15.82 (38.5)
0.48 (1.2)
3.28 (8.0)
10.68 (26.0)
8.48 (20.7)
2.31 (5.6)
41.05
TE1993-94 16.83 (33.3)
0.48 (0.9)
3.11 (6.2)
15.79 (31.3)
11.06 (21.9)
3.23 (6.4)
50.50
TE2003-04 14.85 (26.9)
0.21 (0.4)
2.15 (3.9)
23.10 (41.8)
11.37 (20.6)
3.63 (6.6)
55.31
TE2008-09 16.53 (26.2)
0.21 (0.3)
2.01 (3.2)
25.70 (40.8)
12.50 (19.8)
6.04 (9.6)
63.00
Source: Computed from Government of India (2010d). Figures in parentheses are percentages to net irrigated area. projects, an additional 14 million hectares area can be brought under irrigation from the existing irrigation capacities which would involve a very moderate investment as compared to the investment that would be required for creating equivalent potential through new schemes (Government of India, 2006). Another problem associated with irrigation is uneven distribution of irrigated areas among different states. The extent of irrigation (both in absolute terms and relative to cultivated area) has increased in all states. The percentage share of net irrigated area to net sown area varied from 18.2 per cent in Maharashtra to 97.8 per cent in Punjab. Between TE 1973-74 and TE 2008-09, the increase in NIA as percentage of NSA varied from 6.7 percentage points in Bihar to 35.6 percentage points in Haryana, compared to 21.9 per cent in the national average. Out of 13 major states, seven states witnessed higher increase in overall irrigation ratio than national average; it is lower than national average in states like, Bihar, Maharashtra, Tamil Nadu, Andhra Pradesh, Karnataka and Uttar Pradesh. Irrigation plays an important role in increasing cropping intensity, changes in cropping patterns and enhancing crop yield due to its complementarity with improved varieties and fertiliser use. It is quite evident that the scope for expansion of net sown area is more or less exhausted, availability of irrigation is fast approaching the physical, ecological and economic limit, and depletion of groundwater resources due to over-exploitation is serious. Therefore it is important to focus on rainfed areas, where there is considerable scope for increasing productivity through soil and water conservation measures. It would also address the issue of growing disparities between irrigated and rainfed areas. Hence, the importance of integrated watershed management and convergence of various programmes related to soil and water conservation including the MNREGA. Improvement in water use efficiency in

INDIAN JOURNAL OF AGRICULTURAL ECONOMICS 64
irrigated areas through technological (micro-irrigation), institutional (water user associations, convergence of agencies involved in watershed management and rainfed agriculture) and economic (irrigation water and electricity pricing) factors is very critical and must get priority in the 12th Five Year Plan.
TABLE 10. CHANGES IN PERCENTAGE OF NET (NIA) AND GROSS IRRIGATED AREA (GIA) TO NET SOWN (NSA) AND GROSS CROPPED AREA (GCA) AND CROPPING INTENSITY IN MAJOR STATES
(per cent)
NIA to NSA GIA to GCA CI State (1)
TE1973-74
(2)
TE2008-09
(3)
TE1973-74
(4)
TE2008-09
(5)
TE2008-09
(6) Andhra Pradesh 27.2 43.8 30.1 47.5 126.6 Bihar 28.3 35.0 26.0 35.9 123.3 Gujarat 14.2 43.2 14.9 45.3 120.7 Haryana 47.3 82.9 42.6 85.6 180.3 Karnataka 12.3 30.4 13.5 30.1 122.8 Madhya Pradesh 9.0 35.7 8.3 29.4 129.6 Maharashtra 8.0 18.2 8.9 19.2 128.6 Orissa 15.2 37.9 17.2 35.8 160.2 Punjab 70.2 97.8 53.3 97.6 188.6 Rajasthan 14.8 37.3 15.3 36.0 129.4 Tamil Nadu 44.2 57.0 47.3 56.9 114.8 Uttar Pradesh 41.6 62.5 36.4 61.3 156.0 West Bengal 27.3 59.2 21.2 56.5 183.7 All India 22.9 44.8 23.7 45.2 138.0
Source: Government of India (2010d). Integrated Nutrient Management Chemical fertilisers are key element of modern technology and have played an important role in agricultural productivity growth in India. India is the second largest consumer of fertilisers in the world after China, consuming about 26.5 million tonnes. However, the average intensity of fertiliser use in India remains much lower than most countries in the world but there are many disparities in consumption patterns both between and within regions of India. Table 11 presents classification of districts according to range of fertiliser consumption per hectare of cropped area between TE 1986-87 and TE 2009-10. The data shows that during the TE 1986-87, only three districts were using more than 200 kg per hectare of fertiliser and another 12 districts were consuming between 100 to 150 kg/ha of fertiliser. In contrast about 60 per cent of the districts were using less than 50 kg fertiliser (N+P+K) per hectare. However, the number of districts in high-fertiliser use category (>200kg/ha) has increased significantly during the second-half of nineties and 2000s. In the TE 2002-03, out of 483 districts, 36 districts (7.5 per cent) were using more than 200 kg per hectare, while over one-third of the districts were consuming less than 50 kg. Between the TE 2002-03 and TE 2009-10, the number of districts consuming more than 200 kg/ha more than tripled from 36 to 112. In the TE 2009-10, 188 out of 538 districts (about

INDIA’S AGRICULTURAL DEVELOPMENT UNDER THE NEW ECONOMIC REGIME 65
35 per cent) consumed more than 150 kg/ha. About 22 per cent of the districts had less than 50 kg/ha fertiliser use, much lower than recommended levels. Further less than 20 per cent of the districts accounted for about half of the total fertiliser consumption in the country, indicating a high degree of concentration of fertiliser use (FAI, 2010). So, there are two extremes, (i) districts/areas having consistently high levels of fertiliser use and (ii) areas using less than recommended levels of fertilisers. The low level of fertiliser use is because of lack of awareness, non-availability of credit for buying fertilisers, timely and easy availability of fertilisers and other complementary inputs like irrigation, better seed, etc.
TABLE 11. CLASSIFICATION OF DISTRICTS ACCORDING TO RANGES OF FERTILISER CONSUMPTION (N+P+K)
Consumption (kg/ha) (1)
TE 1986-87 (2)
TE 1996-97 (3)
TE 2002-03 (4)
TE 2009-10 (5)
Above 200 3 (0.9) 13 (3.1) 36 (7.5) 112 (20.77) 150-200 12 (3.4) 36 (8.6) 47 (9.7) 76 (14.20) 100-150 32 (9.2) 60 (14.4) 92 (19.0) 105 (19.47) 75-100 34 (9.7) 59 (14.1) 61 (12.6) 64 (11.84) 50-75 55 (15.8) 73 (17.5) 79 (16.4) 63 (11.72) 25-50 92 (26.4) 93 (22.2) 97 (20.1) 66 (12.28) <25 121 (34.7) 84 (20.1) 71 (14.7) 52 (9.73) Total 349 (100.0) 418 (100.0) 483 (100.0) 538 (100.0)
Source: FAI (2010). Figures in parentheses show per cent to total number of districts. One of the major constraints to fertiliser use efficiency in India is imbalance of applied nutrients. Nitrogen (N) applications tend to be too high in relation to the amount of potassium (K) and phosphate (P) used. This is partly the result of a difference in the price of different nutrients, and partly due to the lack of knowledge among farmers about the need for balanced fertiliser applications. The NPK ratio shows wide inter-regional and inter-state disparity. While existing variation from the ideal ratio (4:2:1) was nominal in the South (2.6:1.3:1.0) and the Eastern region (3.0:1.3:1.0), it was very wide (16.9:15.4:1.0) in the North in 2008-09 (Sharma and Thaker, 2010). State-wise consumption ratio of N and P in relation to K shows that the greatest degree of N:P:K: imbalance is in case of Haryana (44.4:14.1:1.0) followed by Punjab (39.7:12.9:1.0) and Rajasthan (35.9:11.8:1.0) in 2008-09. However the ratio has improved over time, e.g., in 1993-94 (after decontrol of P and K fertilisers in 1992), the ratio was 70.4:15.7:1.0 in the northern region and 11.4:4.1:1.0 in the western region which improved to 21.3:7.0:1 in the north and 6.5:2.7:1.0 in the western region in 2007-08. Inefficient management of nutrients has led to multi-nutrient deficiency in Indian soils. In addition to macro-nutrient deficiency, there is growing deficiency of micro and secondary nutrients in soils. As per the Report on Optimisation of Fertiliser Usage, the nutrient deficiency at all-India level is of the order to 89, 80, 50, 41, 49, 33, 12, 12, 5 and 3 per cent for nitrogen, phosphorus, potassium, sulphur, zinc, boron,
INDIAN JOURNAL OF AGRICULTURAL ECONOMICS 66
molybdenum, iron, manganese and copper, respectively (Government of India, 2010c). Use of organic matter including organic fertlisers is an important instrument for improving crop productivity but there is anecdotal evidence which suggests that use of organic manures is declining in the country. As per Agricultural Input Survey 2001-02 average use of FYM varied from about 0.7 tonnes per hectare in case of large farms to 1.9 tonnes per ha on marginal farms, which is much lower than the required dose. With the limited arable land resources, and burden of increasing population, development of new technologies and efficient use of available technologies and inputs such as chemical fertilisers will continue to play an important role in sustaining food security in India. However, there is a need to optimise the use and efficiency of fertiliser use through appropriate interventions. In some areas excessive use of fertilisers is a cause of concern as it might lead to environmental degradation particularly land and water resources while in other areas, still about one-fourth of the districts use less than 50 kg/ha of fertilisers. Therefore, there is a need to have two pronged strategy, (i) to monitor districts with high intensity of consumption and take corrective actions to reduce environmental degradation and (ii) to promote fertiliser consumption in low-use districts to improve crop productivity. An appropriate policy that encourages balanced use of fertilisers (organic and inorganic) including micro- and secondary nutrients is a must. The recent policy change in subsidy regime to nutrient-based-subsidy (NBS) is an important step in this direction. However, partial deregulation of retail prices of P and K fertilisers (urea under control) would lead to imbalanced use of fertiliser nutrients. Deregulation of farmgate prices of fertilisers might help in cutting the subsidy burden of the government but the resulting increase in fertiliser prices would hurt the farming community in general and small and marginal farmers in particular. As per the recent report, the maximum retail price of DAP has increased to Rs. 18,180 per tonne in October 2011 compared with Rs.9,720 per tonne in the same period last year (The Times of India, October 15, 2011). There has been a considerable discussion on the role of fertiliser prices vis-à-vis output prices in fertiliser consumption and the evidence clearly indicates dominance of non-price factors such as irrigation and high-yielding varieties over price factors (Kumar and Desai, 1995, Namboodiri and Desai, 1995, Nagaraj, 1983; and Sharma and Thaker, 2011). Of the two price policy instruments, affordable fertiliser prices and higher agricultural commodity prices, the former is more powerful in influencing fertiliser consumption (Sharma and Thaker, 2011). The high product price support policy benefits the large farmers who have net marketed surplus while low input prices benefit all categories of farmers. It should also be recognised that fertiliser subsidy ultimately benefits the consumers of farm products and not only farmers. Therefore, in order to ensure self-sufficiency in foodgrains production in the country, availability of fertlisers at affordable prices to the producers is of utmost importance. The government should give due importance to non-price factors like better seeds, irrigation, credit, etc. to increase fertiliser use in the country. For this, more

INDIA’S AGRICULTURAL DEVELOPMENT UNDER THE NEW ECONOMIC REGIME 67
investment in irrigation, agricultural research and development, extension services and infrastructure are indispensable in the context of a country like India. 2.4 Rising Agricultural Subsidies Agricultural subsidies have become one of the most contentious issues of the economic policy. While the original goals of subsidising agriculture were to support small-scale producers for adopting modern technologies and inputs, facilitate the economic viability of farming, employment creation and to ensure national food security, the current rising outlays for agricultural inputs and food subsidies are of growing concern for policymakers. The Central and state governments subsidise major agricultural inputs such as canal irrigation water, fertilisers, power for groundwater pumping, credit, seeds, etc. This section provides a brief account of food and fertiliser subsidies. The Indian fertiliser industry, given its strategic importance in achieving self-sufficiency of foodgrains production in the country, has for decades, been under government control. With the objective of providing fertilisers to farmers at an affordable price and ensuring adequate returns on investments to entrepreneurs, a fertiliser policy was envisaged of providing fertilisers to farmers at subsidised prices to induce farmers to use fertiliser. In order to achieve this objective, the government introduced the Retention Price cum Subsidy Scheme (RPS), a cost-plus approach, for nitrogenous fertilisers in 1977 and extended to complex fertilisers in 1979. However, the mounting burden of subsidies compelled the policy planners to make a serious attempt to reform fertiliser price policy to rationalise the fertiliser subsidy. As part of the economic reforms initiated in early 1990s, the government decontrolled the import of complex fertilisers such as di-ammonium phosphate (DAP) and muriate of potash (MOP) in 1992, and extended a flat-rate concession on these fertilisers. But, urea imports continued to be restricted and canalised. Subsequently, several important committees including High Powered Fertiliser Pricing Policy Review Committee (HPC), Expenditure Reforms Commission (ERC), a New Pricing Scheme (NPS), Expert Group on P and K fertilisers, etc. were constituted to reform the Indian fertiliser sector and contain and target fertiliser subsidies. The estimates of fertiliser subsidy as per Central government budgets over the years in the post-reforms era show that fertiliser subsidy has increased significantly. Figure 5 presents the estimates of major subsidies including the food and fertiliser subsidies in the post-reforms period (1991-92 to 2010-11). It is evident from the figure that total subsidies have increased from Rs. 12,158 crore in 1990-91 to Rs.1641533 crore in 2010-11 (Rev. est.), an increase by 13.5 times. The fertiliser subsidy has increased from Rs.4389 crore in 1990-91 to RS.75,849 crore in 2008-09 representing an increase of over 17 times and then declined during 2009-10 (Rs.61624.29 crore) and 2010-11 (Rs.54876.68 crore). As a percentage of GDP from

INDIAN JOURNAL OF AGRICULTURAL ECONOMICS 68
agriculture and allied sectors, this represents an increase from 4.5 per cent in 1990-91 to 12.9 per cent in 2008-09 and then marginal decline to 11 per cent in 2009-10 and 8.3 per cent in 2010-11 (Figure 5). The fertiliser subsidy in India as percentage of the GDP from agriculture varied from 2 per cent in 1993-94 to 8.2 per cent in 2008-09. The total food subsidy has jumped to about Rs.60600 crore in 2008-09 from Rs. 2450 crores in 1990-91, about 24.7 fold increase in less than two decades in absolute terms. But if one looks at the percentage of GDP, then the burden of food subsidies in India is much less than that of many other developing countries. The food subsidy in India as percentage of the GDP has varied from 1.6 per cent in 1990-91 to 5.4 per cent in 2009-10, and on an average remained at about 3 per cent over the last 19 years.
Figure 5. Trends in Food and Fertiliser Subsidies in India in Post-Reforms Period
The above analysis shows that the volume of subsidies increased substantially
during the post-reforms period. The rate of increase, however, was higher for food subsidy (compound annual growth rate of 17.1 per cent per year) than for fertiliser (13.8 per cent). The rate of change in the amount of subsidies was uneven over time. Total subsidies and fertiliser subsidy increased at a much faster rate during the 2000s while growth rate in food subsidies was higher (16.6 per cent) during the 1990s compared with 2000s (13.4 per cent). During the 2000s, fertiliser subsidy growth has increased significantly (25.2 per cent) as against 13.6 per cent during the 1990s, because the international prices of fertilisers and raw materials, feedstocks and intermediates increased substantially and yet fertilisers and raw materials, feedstocks and intermediates increased substantially and yet fertiliser farm gate prices remained constant in the country between 1991 and 2001 and 2002 and 2009. The main reasons for ever increasing food subsidies are (i) significant increase in procurement prices of foodgrains, (ii) increased government procurement and storage costs, and (iii) no increase in issue price of foodgrains provided through public distribution system during the last decade. Therefore, in order to contain rising input subsidies, moderate and gradual increase in prices of inputs is necessary to reduce the burden on fiscal and more importantly, for inducing farmers to use these inputs more efficiently.

INDIA’S AGRICULTURAL DEVELOPMENT UNDER THE NEW ECONOMIC REGIME 69
Full decontrol of fertiliser prices may lead to very high increase in prices and adversely affect farm incomes and agricultural production. Sharma and Thaker (2010) have reported that fertiliser subsidy is more equitably distributed among farm sizes and small and marginal farmers have a larger share in fertiliser subsidy in comparison to their share in cultivated area. The benefits of fertiliser subsidy have spread to unirrigated areas in total fertiliser use has also increased. A reduction in fertiliser subsidy is, therefore, likely to have an adverse impact on farm production and income of small and marginal farmers and unirrigated areas as they do not benefit from higher output prices but do benefit from lower input prices. Therefore, there is a need to contain fertiliser subsidies but it should not affect production and productivity of small and marginal farmers, who might cut down the use of fertiliser if prices increase significantly. 2.5 Instrument of Price Support for Agriculture Agricultural price policy, which is considered integral to the strategy for agricultural development, played an important role in achieving self-sufficiency in food grains, consumer welfare, improvement in the economic access to food and, through affecting the domestic terms of trade, important influence on growth, employment and income distribution in the economy. However, the role of food prices and intersectoral terms of trade in stimulating agricultural growth and effecting changes in income has also been the subject of considerable controversy. The section provides an overview of trends in minimum support price (MSP)/Procurement Price (PP) and recent policy changes in price policy. The trends in MSP/PP show that increase in rice and wheat prices were higher during the decade of 1990s as compared to the 2000s (Figure 6). The paddy (common) prices increased from Rs.149 per quintal in the 1980s (1981-82 to 1990-91) to Rs. 375 in 1990s (1991-92 to 2000-01) and Rs. 702 in 2000s (2001-02 to 2010-11) while prices of wheat increased from Rs.173 in eighties to Rs. 443 in the 1990s
Figure 6. Trends in Average Minimum Support/Procurement Prices of Major Foodgrains in India: 1980s to 2000s
INDIAN JOURNAL OF AGRICULTURAL ECONOMICS 70
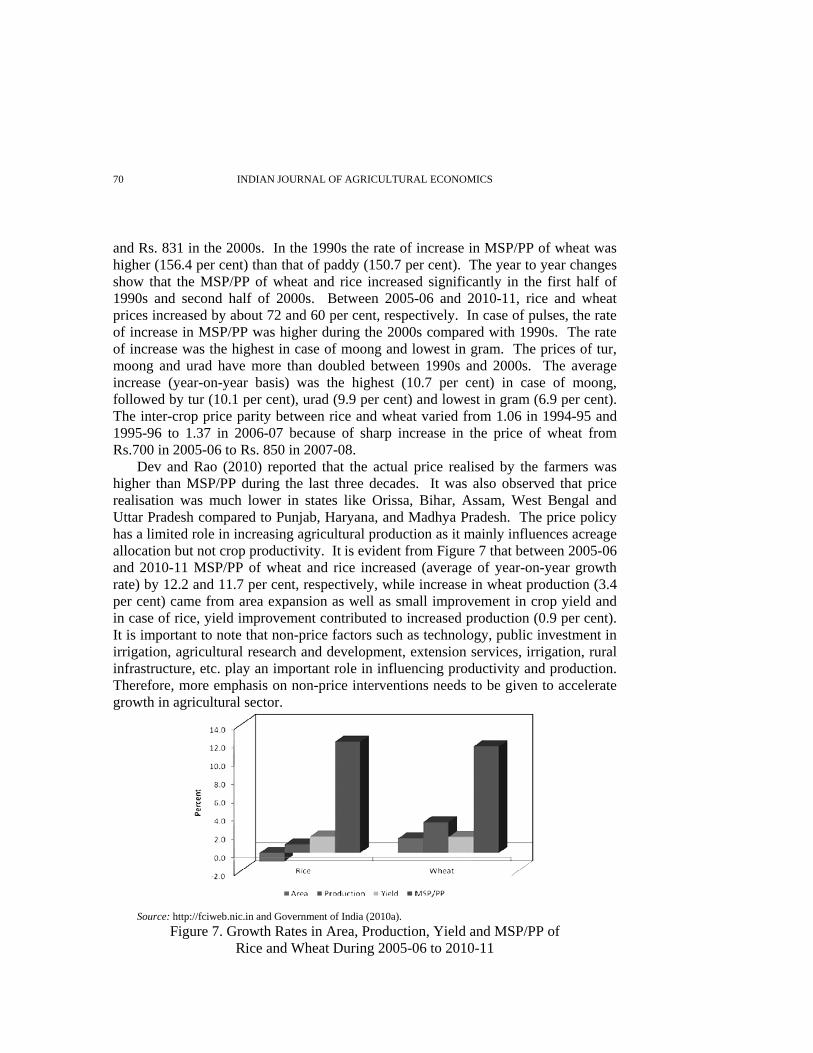
and Rs. 831 in the 2000s. In the 1990s the rate of increase in MSP/PP of wheat was higher (156.4 per cent) than that of paddy (150.7 per cent). The year to year changes show that the MSP/PP of wheat and rice increased significantly in the first half of 1990s and second half of 2000s. Between 2005-06 and 2010-11, rice and wheat prices increased by about 72 and 60 per cent, respectively. In case of pulses, the rate of increase in MSP/PP was higher during the 2000s compared with 1990s. The rate of increase was the highest in case of moong and lowest in gram. The prices of tur, moong and urad have more than doubled between 1990s and 2000s. The average increase (year-on-year basis) was the highest (10.7 per cent) in case of moong, followed by tur (10.1 per cent), urad (9.9 per cent) and lowest in gram (6.9 per cent). The inter-crop price parity between rice and wheat varied from 1.06 in 1994-95 and 1995-96 to 1.37 in 2006-07 because of sharp increase in the price of wheat from Rs.700 in 2005-06 to Rs. 850 in 2007-08. Dev and Rao (2010) reported that the actual price realised by the farmers was higher than MSP/PP during the last three decades. It was also observed that price realisation was much lower in states like Orissa, Bihar, Assam, West Bengal and Uttar Pradesh compared to Punjab, Haryana, and Madhya Pradesh. The price policy has a limited role in increasing agricultural production as it mainly influences acreage allocation but not crop productivity. It is evident from Figure 7 that between 2005-06 and 2010-11 MSP/PP of wheat and rice increased (average of year-on-year growth rate) by 12.2 and 11.7 per cent, respectively, while increase in wheat production (3.4 per cent) came from area expansion as well as small improvement in crop yield and in case of rice, yield improvement contributed to increased production (0.9 per cent). It is important to note that non-price factors such as technology, public investment in irrigation, agricultural research and development, extension services, irrigation, rural infrastructure, etc. play an important role in influencing productivity and production. Therefore, more emphasis on non-price interventions needs to be given to accelerate growth in agricultural sector.
Source: http://fciweb.nic.in and Government of India (2010a). Figure 7. Growth Rates in Area, Production, Yield and MSP/PP of
Rice and Wheat During 2005-06 to 2010-11

INDIA’S AGRICULTURAL DEVELOPMENT UNDER THE NEW ECONOMIC REGIME 71
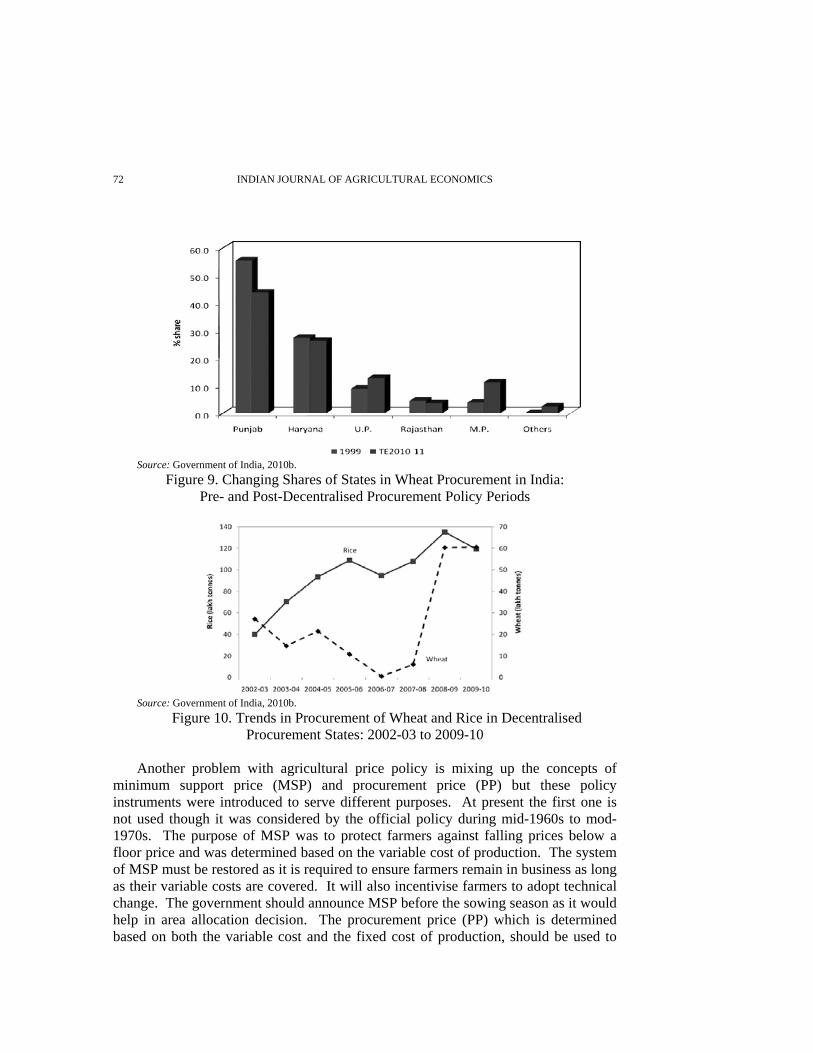
The decentralised procurement policy (DCP) under which foodgrains are procured and distributed by the State Governments was introduced in 1997. The main objective of decentralised system of procurement was to increase coverage of more farmers and crops under MSP operations, improve efficiency of the PDS, providing more variety of foodgrains suited to local tastes and preferences and reduce transportation costs. The data presented in Figure 8 shows that in the case of rice, States under DCP operations have witnessed a significant increase in their share in procurement. For example, the share of Orissa has increased from 4.5 per cent in 1997-98 to 7.9 per cent in TE 2009-10 while in case of West Bengal the share has increased from 1.3 per cent to 4.8 per cent during the same period. The share of traditional states like Punjab and Haryana has declined significantly in post-DCP period. During 2009-10, rice procurement in DCP States was about 11.9 million tonnes. However, in the case of wheat, procurement in DCP States has not increased except for Madhya Pradesh where it has increased from 3.8 per cent in 1999 to 11.2 per cent in TE 2010-11 (Figure 9). Under the decentralised system of procurement, the procurement of wheat has increased from less than 2 million tonnes in early 2000s to about 6.1 million tonnes in 2009-10. In 2010-11, the wheat procurement in DCP states has gone down primarily due to Uttar Pradesh withdrawing from the DCP scheme. The trends in procurement of rice and wheat in DCP states presented in Figure 10 show that there has been an increase in procurement by DCP states except in 2006-07 and 2007-08 for wheat mainly due to aggressive purchases by private companies on expectation of higher market prices and proximity to consumption markets. Therefore, there is a need to increase the scope and scale of DCP in high potential areas like Bihar, Orissa, Chhattisgarh, Assam, West Bengal, Madhya Pradesh, Rajasthan, eastern Uttar Pradesh, Gujarat, etc. However, most of these states have poor market infrastructure as well as less developed private sector trade. Efforts are required to create marketing infrastructure in these regions and also to expand the scope of coverage of crops like coarse cereals.
Source: Government of India, 2010b.
Figure 8. Changing Shares of States in Rice Procurement in India: Pre-and Post-Decentralised Procurement Periods
INDIAN JOURNAL OF AGRICULTURAL ECONOMICS 72
Source: Government of India, 2010b.
Figure 9. Changing Shares of States in Wheat Procurement in India: Pre- and Post-Decentralised Procurement Policy Periods
Source: Government of India, 2010b.
Figure 10. Trends in Procurement of Wheat and Rice in Decentralised Procurement States: 2002-03 to 2009-10
Another problem with agricultural price policy is mixing up the concepts of
minimum support price (MSP) and procurement price (PP) but these policy instruments were introduced to serve different purposes. At present the first one is not used though it was considered by the official policy during mid-1960s to mod-1970s. The purpose of MSP was to protect farmers against falling prices below a floor price and was determined based on the variable cost of production. The system of MSP must be restored as it is required to ensure farmers remain in business as long as their variable costs are covered. It will also incentivise farmers to adopt technical change. The government should announce MSP before the sowing season as it would help in area allocation decision. The procurement price (PP) which is determined based on both the variable cost and the fixed cost of production, should be used to

INDIA’S AGRICULTURAL DEVELOPMENT UNDER THE NEW ECONOMIC REGIME 73
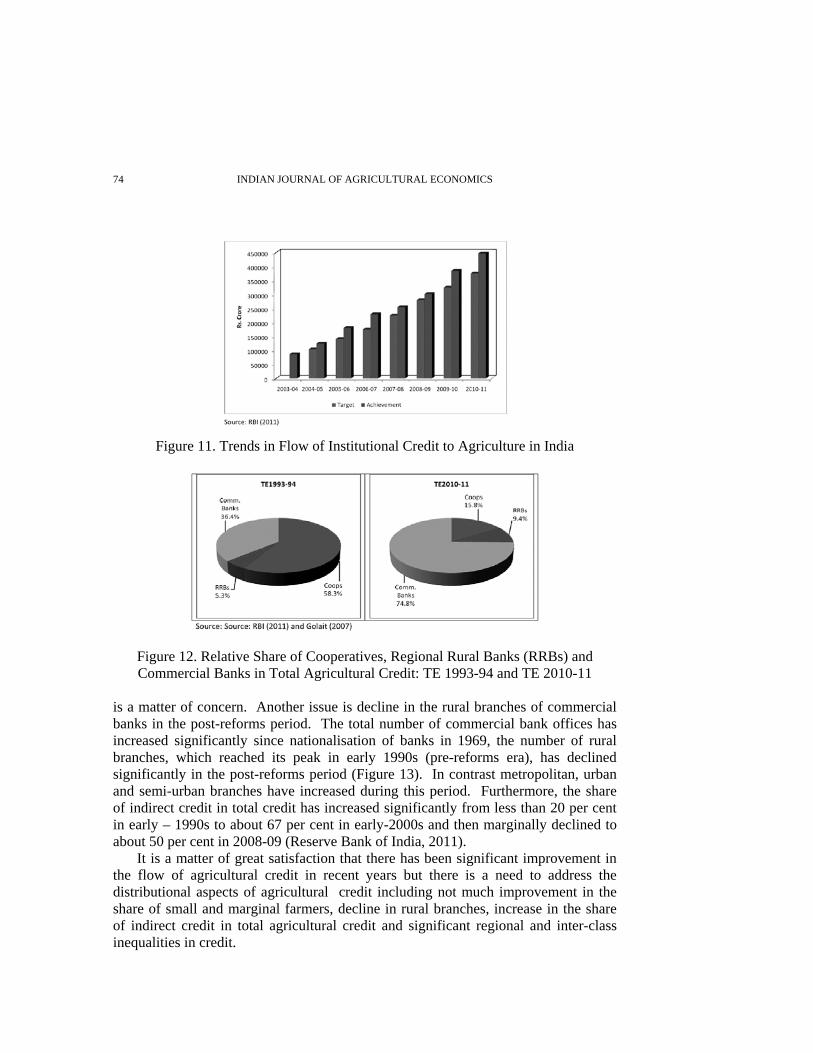
procure foodgrains needed for public distribution system (PDS), welfare schemes and buffer stocks required for food security purpose. 2.6 Agricultural Credit Issues Agricultural credit has played a pivotal role in increasing agricultural production in India. The Green Revolution characterised by a higher use of modern inputs like fertilisers, high-yielding variety seeds, irrigation and other inputs, increased credit requirements which were provided by the agricultural financial institutions. The flow of credit to agriculture has increased significantly in the recent period as the total institutional credit to agriculture increased from Rs.86,981 crore in 2003-04 to Rs. 446,779 crore in 2010-11, at an annual compound growth rate of about 25 per cent. The actual achievement in flow of credit has exceeded the targets during the period (Figure 11). In terms of total agency wise share, the commercial banks recorded a considerable growth (from around 36 per cent in TE 1993-94 to about 75 per cent in TE 2010-11), while co-operative banks despite their wide network lost their dominant position and their share declined from 58.3 per cent in TE 1993-94 to 15.8 per cent in TE 2010-11. The share of Regional Rural Banks (RRBs) has increased from about 5 per cent to 9.4 per cent during the above period (Figure 12). Since co-operatives have strong presence in rural areas, the co-operative credit institutions need revamping to improve the efficiency of the credit delivery system in rural areas. Though the amount of agricultural credit has increased during the last few years, several weaknesses have crept in which have affected the small and marginal farmers’ access to formal sources of credit. The Task Force on Credit Related Issues of Farmers observed that the small and marginal farmers especially tenant farmers, oral lessees, share-coppers, who constitute the bulk of farming community, do not have adequate access to formal sources of credit (Government of India, 2010d). Between TE 1993-94 and TE 2008-09, the share of small and marginal farmers in total operational holdings increased but their share in number of credit accounts decreased from 75.3 per cent to 69.2 per cent and the amount of credit disbursed decreased from 53.6 per cent to 48.6 per cent (Reserve Bank of India, 2011). On the other hand, for medium and large farmers the share of credit increased from 46.4 per cent in TE 1993-94 to 51.4 per cent in TE 2008-09 and the number of accounts increased from 24.7 per cent to 30.8 per cent during the period. Similarly, per account credit disbursed across farm sizes was increasingly skewed and the gap has widened between the small and marginal and large farmers. There are wide variations in the availability of institutional credit per hectare of gross cropped area in different States. The region-wise per account credit disbursed by commercial banks for different size-class farmers shows that the amounts are relatively higher in the northern and western region while in north-east and eastern regions credit disbursal is poor, which
INDIAN JOURNAL OF AGRICULTURAL ECONOMICS 74
Figure 11. Trends in Flow of Institutional Credit to Agriculture in India
Figure 12. Relative Share of Cooperatives, Regional Rural Banks (RRBs) and Commercial Banks in Total Agricultural Credit: TE 1993-94 and TE 2010-11
is a matter of concern. Another issue is decline in the rural branches of commercial banks in the post-reforms period. The total number of commercial bank offices has increased significantly since nationalisation of banks in 1969, the number of rural branches, which reached its peak in early 1990s (pre-reforms era), has declined significantly in the post-reforms period (Figure 13). In contrast metropolitan, urban and semi-urban branches have increased during this period. Furthermore, the share of indirect credit in total credit has increased significantly from less than 20 per cent in early – 1990s to about 67 per cent in early-2000s and then marginally declined to about 50 per cent in 2008-09 (Reserve Bank of India, 2011).
It is a matter of great satisfaction that there has been significant improvement in the flow of agricultural credit in recent years but there is a need to address the distributional aspects of agricultural credit including not much improvement in the share of small and marginal farmers, decline in rural branches, increase in the share of indirect credit in total agricultural credit and significant regional and inter-class inequalities in credit.

INDIA’S AGRICULTURAL DEVELOPMENT UNDER THE NEW ECONOMIC REGIME 75
Figure 13. Trends in Rural, Semi-Urban, Urban and Metropolitan Branches of Commercial Banks in India During Post-Reforms Period
III
CONCLUDING OBSERVATIONS Since more than half of the workforce is still engaged in agriculture for their livelihoods and employment, agriculture continues to be a predominant sector of the Indian economy, even though its share in national Gross Domestic Product has declined in recent years. Rapid growth of the non-agricultural sectors, particularly services, in post-reforms period has failed to accelerate agricultural growth or poverty reduction. During the last two decades Indian agriculture has been facing major challenges like deceleration in growth rate, degradation of natural resources, inter-sectoral, inter-regional equity, declining input efficiency, etc. However, the 11th Plan had some success in reversing the deceleration of agricultural growth witnessed during the 9th and 10th Plan. The growth in agriculture in the 11th Plan is likely to be around 3.2 per cent per year, which is higher than 10th Plan growth rate but lower than the target for 11th Plan. The 12th Plan target growth rate for agriculture is 4 per cent with foodgrains growth at about 2 per cent and non-foodgrains sector (horticulture, livestock and fisheries) growing at about 5-6 per cent. However, looking at the growth in agricultural sector in general and high-value agriculture, particularly, horticulture, fisheries, dairy and meat sector during the 11th Plan, there is a need to put additional efforts to achieve between 4 and 4.5 per cent growth in agriculture. The failure to achieve targeted growth in agriculture sector has resulted from the inadequacies in the provision of critical public goods on which agricultural growth thrives. There is a need to address some of these inadequacies which would also have large multiplier effect of the higher farm incomes on demand for employment-intensive rural non-farm sector and other sectors of the economy. The slowdown in
INDIAN JOURNAL OF AGRICULTURAL ECONOMICS 76
agriculture growth could be attributed to the supply side factors such as public investment, irrigation water management, rural credit, technology, land management, agricultural research and development including extension services, rural infrastructure like roads, electricity, marketing, post-harvest management and so on. Reforms are needed to address these issues in order to achieve 4 – 4.5 per cent growth in agriculture, equity in terms of higher growth in disadvantageous regions like rainfed and tribal areas, small and marginal farmers and women and sustainability. Realising potential of the sector would require substantial increase in public expenditure on agriculture, rural infrastructure, post-harvest and market infrastructure including storage and processing, reforms in laws related to land markets and marketing of agricultural products, promotion of farmers’ organisation/groups, Self Help Groups, etc. and appropriate agricultural price and food procurement and distribution policy. The instrument of pricing of agricultural inputs such as irrigation, power for pumping water, and fertiliser needs rationalisation. The price of surface irrigation water should cover operations and maintenance costs of various projects. Pricing for electricity should be based on its volumetric consumption but with assured timely supply of power to farmers. The pricing of fertilisers needs rationalisation so that it promotes balanced use of fertilisers including micro-and secondary nutrients and does not lead to exorbitant increase in prices which might hurt consumption mainly in the case of small and marginal farmers. Farm and food subsidies should be rationalised and better targeted to benefit the poor. These subsidies are justified as they benefit not only producers but the society at large. Agricultural price policy has played an important role in Indian agriculture but is facing some challenges. The price support policy should follow the strategy of technological change which requires more emphasis on non-price factors. The practice of determining minimum support price based on variable costs should be restored and must be announced before sowing season while procurement price based on total costs should be used to procure the foodgrains needed for public distribution system (PDS), welfare schemes and buffer stocks required for food security purpose. Although the flow of agricultural credit has increased significantly in recent years but we must address the distributional aspects of agricultural credit including better access to small and marginal farmers, decline in rural branches, increase in the share of indirect credit and significant regional and inter-class inequalities in credit. There is a need to follow multi-dimensional model of organisation and management, which requires integration of agri-input, agri-production and agro-processing and marketing segments of value chain, restructuring of the existing institutions to make them more responsive to the needs of users like farmers and industry, and demand driven, encourage involvement of private investment particularly in post harvest activities including storage, food processing and marketing.

INDIA’S AGRICULTURAL DEVELOPMENT UNDER THE NEW ECONOMIC REGIME 77
REFERENCES Ahluwalia, Montek S. (2011), "Prospects and Policy Challenges in the Twelfth Plan", Economic and
Political Weekly, Vol. 46, No. 21, May 21, pp. 88-104. Bardhan, P.K. (1973), "Size Productivity and Returns to Scale: An Analysis of Farm-level Data in
Indian Agriculture", Journal of Political Economy, Vol.81, No.6, pp. 1370-86. Berry, R.A. (1972), "Farm Size Distribution, Income Distribution and the Efficiency of Agricultural
Production: Colombia", American Economic Review, Vol.62, No.1, pp. 403-08. Challa, J., P.K. Joshi and Prabhakar Tamboli (2011), "Revitalising Higher Agricultural Education in
India: Issues and Challenges" Economic and Political Weekly, Vol. 46, Nos. 26 and 27, June 25. Chand, Ramesh, P.A. Lakshmi Prasanna and Aruna Singh (2011a), "Farm Size and Productivity:
Understanding the Strengths of Smallholders and Improving Their Livelihoods", Economic and Political Weekly, Vol. 46, No. 26 & 27, 25, pp. 5-11,
Chand, Ramesh, Praduman Kumar and Sant Kumar (2011b), Total Factor Productivity and Contribution of Research Investment to Agricultural 'Growth in India, Policy Paper 25, National Centre for Agricultural Economics and Policy Research, New Delhi, pp.xiii+74.
Central Statistical Organisation (2010), National Accounts Statistics, 2009-10 and earlier Issues, Central Statistics Office (CSO), Ministry of Statistics and Programme Implementation, Government of India, New Delhi.
Central Statistical Organisation (2011), Revised Estimates of Annual National Income 2010-11 and Quarterly Estimates of Gross Domestic Product, 2010-11, Central Statistics Office (CSO), Ministry of Statistics and Programme Implementation, Government of India, New Delhi.
CSSRI (2010), "CSSRI Vision 2030", Central Soil Salinity Research Institute, Indian Council of Agriculture Research, Karnal.
Desai, Bhupat M. and N.V. Namboodiri (1997), "Government Expenditure on Agriculture Under Planning Era", in Bhupat M. Desai (Ed.) (1997), Agricultural Paradigm for the Ninth Plan Under New Economic Environment, Oxford & IBH Publishing Co. Pvt. Ltd., New Delhi.
Dev, S. Mahendra (2009), Structural Reforms and Agriculture: Issues and Policies, Keynote paper at the 92nd Annual Conference of the Indian Economic Association, 27th-29th December, Bhubaneswar, Orissa.
Dev, S. Mahendra and N. Chandrasekhara Rao (2010), "Agricultural Price Policy, Farm Profitability and Food Security", Economic and Political Weekly, Vol. 45, Nos. 26 & 27, June 26, Pp.174-82.
Fertiliser Association of India (FAI) (2010), Fertiliser Statistics 2009-10, New Delhi. Food and Agricultural Organization, FAOSTAT database. Source: www.fao.org Golait, Ramesh (2007), Current Issues in Agriculture Credit in India: An Assessment, Reserve Bank of
India Occasional Papers Vol. 28, No.1, Summer 2007, Reserve Bank of India, Mumbai. Government of India (2006), Report of Sub-Committee on More Crop and Income per Drop of Water,
Ministry of Water Resources, Government of India, New Delhi. Government of India (2008), Eleventh Five Year Plan 2007-2012, Planning Commission, Government
of India, Oxford University Press, New Delhi, Pp. 428. Government of India (2010a), National Accounts Statistics 2010 and Earlier Issues, Central Statsitical
Organisation, Ministry of Statistics and Programme Implementation, New Delhi. Government of India (2010b), Agricultural Statistics at a Glance 2010 and Earlier Issues, Directorate of
Economics and Statistics, Department of Agriculture and Cooperation, Ministry of Agriculture, New Delhi.
Government of India (2010c), Ground Water Scenario of India 2009-10, Central Ground Water Board, Ministry of Water Resources, Fridabad.
Government of India (2010d), Land Use Statistics at a Glance: 1999-00 to 2008-09, Directorate of Economics and Statistics, Department of Agriculture & Cooperation, Ministry of Agriculture, New Delhi.
Government of India (2010e), Report of the Task Force on Credit Related Issues of Farmers, Ministry of Agriculture, New Delhi.
INDIAN JOURNAL OF AGRICULTURAL ECONOMICS 78
Government of India (2011a), Faster, Sustainable and More Inclusive Growth: An Approach to the 12th Five Year Plan (Draft), Planning Commission, New Delhi.
Government of India (2011b), Economic Survey 2010-11 and Earlier Issues, Economics Division, Department of Economic Affairs, Ministry of Finance, Oxford University Press, New Delhi.
Government of India (2011c), First Advance Estimates of Production of Foodgrains for 2011-12 (as on 14-09-2011), Directorate of Economics and Statistics, Department of Agriculture and Cooperation, Ministry of Agriculture, New Delhi.
Government of India (2011d), Mid-Term Appraisal Eleventh Five Year Plan 2007-2012, Planning Commission, Oxford University Press, New Delhi.
Government of India (2011e), Union Budget 2011-12 and Earlier Issues, Economics Division, Department of Economic Affairs, Ministry of Finance, Oxford University Press, New Delhi. Pp.A82-85.
Hanumantha, Rao C.H. (1966), "Alternative Explanations of the Inverse Relationship Between Farm Size and Output per Acre in India", Indian Economic Review, Vol. 1, No.2.
Kumar, Praduman and Gunvant M. Desai (1995), Fertiliser Use Patterns in India During the Mid 1980s, in Gunvant M. Desai and A. Vaidyanathan (Eds.) (1995), Strategic Issues in Future Growth of Fertiliser Use in India, Indian Council of Agricultural Research, New Delhi.
Mazumdar, Dipak (1965), "Size of Farm and Productivity: A Problem of Indian Peasant Agriculture", Economica, Vol.32, May, Pp. 161-73.
Nagaraj, R. (1983), "Determinants of Fertiliser Use in Indian Agriculture", Economic and Political Weekly, Vol. 18, No. 13.
Namboodiri, N.V. and Gunvant M. Desai (1995), "Demand vs Supply Factors in Growth of Fertiliser Use: The Gujarat Experience", in Gunvant M. Desai and A. Vaidyanathan (Eds.), Strategic Issues in Future Growth of Fertiliser Use in India, Indian Council of Agricultural Research, New Delhi.
Pal, Suresh and Alka Singh (1997), Agricultural Research and Extension in India: Institutional Structure and Investment, Policy Paper 7, National Centre for Agricultural Economics and Policy Research, New Delhi, pp. xxx + 63.
Reserve Bank of India (2011), Handbook Statistics on Indian Economy 2010-11 Mumbai, pp. 122-124. Saini, G.R. (1971), "Holding Size, Productivity and Some Related Aspects of Indian Agriculture",
Economic and Political Weekly, Review of Agriculture, Vol. 6, No. 26, pp. A79-A85. Sen, A.K. (1962), "An Aspect of Indian Agriculture”, The Economic Weekly, Vol.14, No. 4-6, pp. 243-
246. Sen, A.K. (1964), "Size of Holdings and Productivity”, The Economic Weekly, Vol.16, No. 5-7, pp. 323-
326. Sharma, Vijay Paul and Dinesh Jain (2011), High Value Agriculture in India: past Trends and Future
Prospects, W.P. No. 2011-07-02, Indian Institute of Management, Ahmedabad, July 2011. Sharma, Vijay Paul and Hrima Thaker (2010), Economic Policy Reforms and Indian FertiliserIndustry,
Allied Publishers Pvt. Ltd. New Delhi. Sharma, Vijay Paul and Hrima Thaker (2010), "Fertiliser Subsidy in India: Who are the Beneficiaries",
Economic and Political Weekly, Vol. 45, No. 12, March 20, pp. 68-76. Sharma, Vijay Paul and Hrima Thaker (2011), "Demand for Fertiliser in India: Determinants and
Outlook for 2020", W.P. No 2011-04-01, Indian Institute of Management, Ahmedabad, April 2011. Singh, Manmohan (1995), "Inaugural Address" Indian Journal of Agricultural Economics, Vo. 50, No.1,
January-March, pp. 1-8. Vaidyanathan, A. (2010), Agriculture Growth in India: Role of Technology, Incentives and Institutions,
Oxford University Press, New Delhi. Vyas, V.S. (2003), India's Agrarian Structure, Economic Policies and Sustainable Development:
Variations on a Theme, Academic Foundation, New Delhi.