indianabusinessreview - indiana business … and which improved on this measure. from the editor...
TRANSCRIPT

Fall 2012 Volume 87, No. 3
INDIANABUSINESSREVIEW
Income Inequality
demographic and economic perspectives, insights, and analysis since 1926
Is IndianaExporting Enough?
Income Inequality

Kelley School of Business
Idalene KesnerInterim Dean
Ash SoniAssociate Dean of Information Technology
Munirpallam VenkataramananAssociate Dean of Academic Programs
Philip L. CochranAssociate Dean of Indianapolis Operations
Anne D. AuerDirector of Marketing
Indiana Business Research Center
Jerry N. ConoverDirector and Publisher
Indiana Business Review
Carol O. RogersExecutive Editor
Rachel M. StrangeManaging Editor
Diane ProbstGraphic Designer
Flora A. LewisQuality Control
Table of Contents
Fall 2012 Volume 87, No. 3
w w w. i b r c . i n d i a n a . e d u
5 Is Indiana Exporting Enough?Timothy F. Slaper and Ryan A. Krause analyze Indiana’s industries to determine whether Indiana is exporting to its full potential. Results indicate that lack of diversification in destination countries may be limiting exports for some key industries.
1Income InequalityMichael F. Thompson looks back to the last period of economic expansion to see which states experienced growing income inequality and which improved on this measure.
From the EditorIncome inequality—at least as shown in the media or shouted by protesters—is the 1 percent versus the 99 percent. Happily, our author has more sense than to apply such broad strokes to an important issue. In tracking the distance between the poorly paid and the well paid among us, Michael Thompson charts a six-year period running up to the Great Recession, looking at which states had the most or least income inequality and whether the disparities grew or shrank. Many people reading this article may have already formed a conclusion about where Indiana shows up among the 50 states—and I bet they’re wrong (you’ll have to read the article to find out).
Speaking of income, there is at least one way for Hoosier businesses to boost their income: export more grain, glass, metal and auto parts! Tim Slaper and Ryan Krause tackle the flip side of Indiana’s export statistics, honing in on the industries that aren’t exporting enough.

Indiana Business Review Fall 2012 1
Income InequalityMichael F. ThoMpson, Ph.D.: Assistant Professor of Sociology, Grinnell College
Income inequality is a growing problem across the United States, and this article considers
differences among states between 2002 and 2007—the last period of economic expansion. Specifically, this research focuses on the 90/10 income inequality ratio—the wage or salary income earned by individuals at the 90th percentile (those earning more than 90 percent of other workers) compared to the earnings of workers at the 10th percentile (those earning higher than the bottom 10 percent).
Morris and Western document that U.S. income inequality rose tremendously between the early 1970s and the close of the 20th century as income for people earning at the 70th percentile or lower declined while earnings near the top of the income distribution grew substantially in real value.1 This trend is problematic since researchers find that increasing levels of inequality can reduce economic mobility as well as civic engagement and life satisfaction.2
As the United States currently regains economic strength after the 2008 recession, it is useful to look back to the last growth period to see which states had worsening income inequality and which were able to reduce this problem. This article measures disparities in income from the 2001 recession through 2007 using wage data from the Current Population Survey.3 It considers differences between women and men across the U.S. who were employed full-time. While income inequality ratios fluctuate widely from year to year, these analyses depend on regression-based coefficients that estimate whether there is a statistically significant trend over the complete six-year period.
Overall Income Inequality TrendsThe first step in understanding inequality trends is to consider changes at the bottom and top of the income distribution. Figure 1 demonstrates that, across the United States, workers at the 10th percentile saw their incomes largely stagnate at roughly $16,500 per year between 2001 and 2007. This nearly flat income level is observed despite a noticeable bump in 2007 that may be due to the first stage of the three-part federal increase in the minimum wage. However, on average, states saw a significant decrease in their 10th percentile income levels—a drop from $17,100 in real value in 2005 to $16,750 by 2007. This strongly suggests that while most states had constant wages for this low-wage bracket, some experienced sharp decreases.
Meanwhile, near the top of the income distribution, workers at the 90th percentile experienced significant improvements in their
n Figure 1: U.S. and Average State 10th Percentile Trends, 2001 to 2007
16,0
0016
,500
17,0
0017
,500
10th
Per
cent
ile In
com
e (C
ons
tant
200
5 D
olla
rs)
2001 2002 2003 2004 2005 2006 2007
U.S. Trend
Average State Trend
U.S. Level
Average State Level
Note: The U.S. trend is not statistically significant at the p<0.1 level.Source: Author’s calculations, using data from the Integrated Public Use Microdata Series of the Current Population Survey (IPUMS-CPS)
As the United States currently regains economic strength
after the 2008 recession, it is useful
to look back to the last growth period to see which states had worsening income
inequality and which were able to reduce
this problem.

2 Indiana University Kelley School of Business, Indiana Business Research Center
wage levels (see Figure 2). Across the U.S., 90th percentile earners started this period earning $82,800 per year and ended near $84,500. Despite substantially lower wage levels in some states, this trend of increasing income is also true among states since their average 90th percentile level also increased noticeably between 2001 and 2007—from $77,900 to $79,700.
Dividing the income of workers at the 90th percentile with those of workers at the 10th percentile creates the 90/10 income inequality ratio to demonstrate inequality trends from 2001 to 2007. Despite the noted increase in wages for workers at the 90th percentile across the U.S., their income stayed at roughly five times the amount earned by workers at the 10th percentile throughout this period (see Figure 3). However, owing to the significantly different
income trends of workers at the 90th and 10th percentile among several individual states, there is a significant increase in the average state’s income inequality. States started this period with an average 90/10 income inequality ratio of 4.56 which grew to 4.76.
Differences between States for Women and MenWhile Indiana did not show a significant change in overall income inequality during this relatively short six-year period, four states demonstrated significant increases: Alabama, Delaware, New Jersey and
n Figure 2: U.S. and Average State 90th Percentile Trends, 2001 to 2007
76,0
0078
,000
80,0
0082
,000
84,0
00
90th
Per
cent
ile In
com
e (C
ons
tant
200
5 D
olla
rs)
2001 2002 2003 2004 2005 2006 2007
U.S. Trend
Average State Trend
U.S. Level
Average State Level
Note: The U.S. trend is not statistically significant at the p<0.1 level.Source: Author’s calculations, using data from the Integrated Public Use Microdata Series of the Current Population Survey (IPUMS-CPS)
4.50
4.75
5.00
5.25
90/1
0 In
com
e In
equa
lity
Rat
io
2001 2002 2003 2004 2005 2006 2007
U.S. Trend
Average State Trend
U.S. Level
Average State Level
n Figure 3: U.S. and State Income Inequality Trends by Sex, 2001 to 2007
Source: Author’s calculations, using data from the Integrated Public Use Microdata Series of the Current Population Survey (IPUMS-CPS)
While Indiana did not show a
significant change in overall
income inequality during this
relatively short six-year period,
four states demonstrated
significant increases.

Indiana Business Review Fall 2012 3
Wyoming (see Figure 4). Income disparities grew the most in Delaware where earners at the 90th percentile earned an estimated 4.29 times more than workers at the 10th percentile in 2001 but this ratio increased to over 5 by 2007. Among states with larger workforces, New Jersey’s already high 5.36 income inequality ratio grew to 5.78. Considering differences among women and among men, four states had worsening inequality for female workers (California, Illinois, Mississippi and New York), while Georgia had growing levels of inequality among men.
The only state that had a significant decrease in overall income inequality was Tennessee, which had a low 4.65 income inequality ratio in 2001 and reduced this ratio even further to 4.25 by 2007. This trend of lowering inequality, however, is largely due to the lack of income growth for Tennessee’s 90th percentile earners. Montana showed improvement in income inequality but only among male workers such that men at the 90th percentile initially earned 4.13 times the income of their counterparts at the 10th percentile but this ratio decreased to 3.62 at the end of this period.
Worsening inequality primarily occurred for female workers over
this period of economic expansion, exemplified by California. Nationally, women earning at the 90th percentile during the 2001 recession made
4.26 times the income of their counterparts at the 10th percentile nationally but this ratio grew to 4.59 by 2007 (see Figure 5). California’s
n Figure 4: Inequality Trends by State among All Workers, 2001 to 2007
Source: Author’s calculations, using data from the Integrated Public Use Microdata Series of the Current Population Survey (IPUMS-CPS)
n Figure 5: U.S. versus State Inequality Trends, Female Workers, 2001 to 2007
Men Only (1 state)
Increases
Overall (4 states)
Women Only (4 states)
Declines
Overall (1 state)
Men Only (1 state)
VT
NH
MA
CT
RI
NJ
DE
MD
DC
SD
GA
AK
NV
MN
AR
CO
WY
SCTN
ND
HI
MS
NE
AZ
KS
ME
OH
MI
KYMO
NY
UT
NM
IA
NC
ID WI
AL
WVIN
FL
VAIL
ORMT
OK
PA
WA
TX
CA
LA
Note: The Indiana trend is not statistically significant at the p<0.1 level.Source: Author’s calculations, using data from the Integrated Public Use Microdata Series of the Current Population Survey (IPUMS-CPS)
3.0
3.5
4.0
4.5
5.0
5.5
90/1
0 In
com
e In
equa
lity
Rat
io
2001 2002 2003 2004 2005 2006 2007
U.S. Trend
Indiana Trend
California Trend
Illinois Trend
U.S. Level
Indiana Level
California Level
Illinois Level
Worsening inequality primarily occurred for female workers over this period of
economic expansion, exemplified
by California.
4 Indiana University Kelley School of Business, Indiana Business Research Center
income inequality ratio grew from an already high 4.72 all the way to 5.51 by 2007. Also notable is that Illinois’ relatively low inequality level of 4.05 grew to 4.51 in these six years. Indiana bucked the overall pattern by staying at a relatively low income inequality ratio (around 3.64) so that wages among women in the state were among the most equitable in the nation by the end of the period.
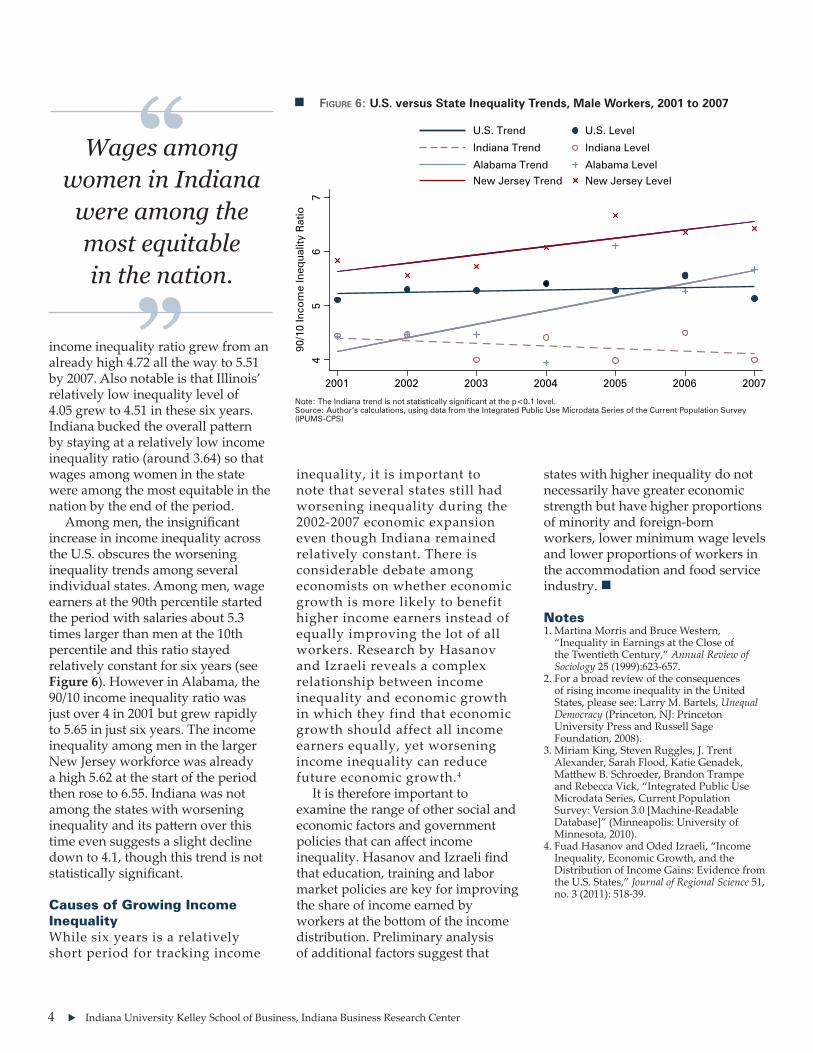
Among men, the insignificant increase in income inequality across the U.S. obscures the worsening inequality trends among several individual states. Among men, wage earners at the 90th percentile started the period with salaries about 5.3 times larger than men at the 10th percentile and this ratio stayed relatively constant for six years (see Figure 6). However in Alabama, the 90/10 income inequality ratio was just over 4 in 2001 but grew rapidly to 5.65 in just six years. The income inequality among men in the larger New Jersey workforce was already a high 5.62 at the start of the period then rose to 6.55. Indiana was not among the states with worsening inequality and its pattern over this time even suggests a slight decline down to 4.1, though this trend is not statistically significant.
Causes of Growing Income InequalityWhile six years is a relatively short period for tracking income
inequality, it is important to note that several states still had worsening inequality during the 2002-2007 economic expansion even though Indiana remained relatively constant. There is considerable debate among economists on whether economic growth is more likely to benefit higher income earners instead of equally improving the lot of all workers. Research by Hasanov and Izraeli reveals a complex relationship between income inequality and economic growth in which they find that economic growth should affect all income earners equally, yet worsening income inequality can reduce future economic growth.4
It is therefore important to examine the range of other social and economic factors and government policies that can affect income inequality. Hasanov and Izraeli find that education, training and labor market policies are key for improving the share of income earned by workers at the bottom of the income distribution. Preliminary analysis of additional factors suggest that
states with higher inequality do not necessarily have greater economic strength but have higher proportions of minority and foreign-born workers, lower minimum wage levels and lower proportions of workers in the accommodation and food service industry. n
Notes1. Martina Morris and Bruce Western,
“Inequality in Earnings at the Close of the Twentieth Century,” Annual Review of Sociology 25 (1999):623-657.
2. For a broad review of the consequences of rising income inequality in the United States, please see: Larry M. Bartels, Unequal Democracy (Princeton, NJ: Princeton University Press and Russell Sage Foundation, 2008).
3. Miriam King, Steven Ruggles, J. Trent Alexander, Sarah Flood, Katie Genadek, Matthew B. Schroeder, Brandon Trampe and Rebecca Vick, “Integrated Public Use Microdata Series, Current Population Survey: Version 3.0 [Machine-Readable Database]” (Minneapolis: University of Minnesota, 2010).
4. Fuad Hasanov and Oded Izraeli, “Income Inequality, Economic Growth, and the Distribution of Income Gains: Evidence from the U.S. States,” Journal of Regional Science 51, no. 3 (2011): 518-39.
Wages among women in Indiana
were among the most equitable in the nation.
n Figure 6: U.S. versus State Inequality Trends, Male Workers, 2001 to 2007
45
67
90/1
0 In
com
e In
equa
lity
Rat
io
2001 2002 2003 2004 2005 2006 2007
U.S. Trend
Indiana Trend
New Jersey Trend
Alabama Trend
U.S. Level
Indiana Level
New Jersey Level
Alabama Level
Note: The Indiana trend is not statistically significant at the p<0.1 level.Source: Author’s calculations, using data from the Integrated Public Use Microdata Series of the Current Population Survey (IPUMS-CPS)

Indiana Business Review Fall 2012 5
I f there is one thing that politicians on both sides of the aisle can agree on, it is
that exports are good. Economic developers routinely look for new ways to spur export activity, as it is commonly thought to promote economic growth with very little downside. In general, Indiana has a fairly strong export profile. In 2011, Indiana’s exports totaled 11.6 percent of its GDP—higher than the national ratio of 9.9 percent.1 In addition, Indiana exports have been growing at a faster rate than the nation as a whole. This should not be too surprising given Indiana’s strength in manufacturing—particularly in transportation equipment manufacturing, which accounts for 14.7 percent of all U.S. exports.
It remains unclear, however, to what degree Indiana is exporting to its full potential given the prominence of high-export industries in the state. To address this question, the Indiana Business Research Center investigated which industries may be under-exporting and identified at least 10 industries that may benefit from policies and programs to encourage companies to export.
What Is an Export Gap?Industries are not evenly distributed across the U.S. economy. They tend to be concentrated in certain geographic areas and, more often than not, in specific states. For instance, Michigan is known for motor vehicle manufacturers, California is known for tech firms, and New York is known for its concentration of financial services firms. Indiana is no different in this respect. Certain industries represent a larger share of Indiana’s employment relative to total U.S. employment, whereas other industries represent a smaller share. While particular industries might
dominate a state’s workforce, it is far from certain that those industries will also dominate the state’s exports. Concentration of employment is only one factor that affects how much a particular industry exports from a particular state.
In order to assess whether an industry (or a set of industries) were under-exporting, we needed a rough measure of an export gap. Theoretically, if an industry represents a large share of Indiana’s employment, but does not represent as much of the state’s total exports, then Indiana may be missing potential foreign markets for its products. We define an export gap as the discrepancy between a state’s concentration of employment in a given industry relative to the national
average and the state’s concentration of exports in that industry relative to the national average.2 In other words, we measure the export gap as the difference between the state’s location quotient (LQ) and its export quotient (EQ).
The LQ is a commonly used measure of local employment concentration. It is the ratio of an industry’s share of a region’s (Indiana) employment to the industry’s share of U.S. employment. An industry LQ above 1 indicates a higher-than-average concentration of employment for that industry in a particular state.
The EQ is a ratio that we developed to assess export concentration. It is the ratio of an industry’s share of a region’s exports (Indiana is the region in this case) to the industry’s share of total U.S. exports.
To assess the export gap of any particular industry, we subtract the industry’s Indiana EQ from its Indiana LQ, and if this difference is positive, we identify the industry as “under-exporting.” We label it as such because the higher concentration of employment in the state suggests the industry may be missing an opportunity to export more from Indiana than it currently is.
Key Under-Exporting IndustriesTable 1 shows the top 10 under-exporting industries in Indiana, as determined by the export gap measure calculated from the most recently available employment and export data.3 We excluded industries whose nationwide exports were below $3 billion (since Indiana companies’ opportunities for export expansion in these industries would necessarily be limited) and industries with no export activity in Indiana.
Is Indiana Exporting Enough?TiMoThy F. slaper, Ph.D.: Director of Economic Analysis, Indiana Business Research Center, Indiana University Kelley School of Business
ryan a. Krause: Economic Research Analyst, Indiana Business Research Center, Indiana University Kelley School of Business
If an industry represents a large share of Indiana’s employment, but
does not represent as much of the
state’s total exports, then Indiana is
missing potential foreign markets for
its products.

6 Indiana University Kelley School of Business, Indiana Business Research Center
The top-10 list consists entirely of industries whose employment concentration in Indiana exceeds their employment concentration in the nation as a whole. Interestingly, the list also includes a number of industries whose export concentration in Indiana does exceed their overall export concentration in the nation. The positive export gap, however, suggests that these industries are not realizing their full export potential.
The iron and steel and ferroalloy industry tops the list. This industry’s share of Indiana employment is more than 20 times its share of U.S. employment, and yet its share of Indiana’s exports is only 2.7 times its share of U.S. exports. A number of other industries related to motor vehicle manufacturing also adorn the top-10 list: engines, turbines, and power transmission equipment; alumina and aluminum and processing; motor vehicle parts; and, of course, motor vehicles. These industries also exhibit greater export concentration in Indiana than in the United States as a whole. However, as with the iron and steel and ferroalloy industry, this figure is dwarfed by these industries’ immense
concentration of employment in Indiana.
This evidence raises the question: How can Indiana lead the nation in employing people in these industries and yet lag the nation in exporting from them?
Before postulating an explanation for these findings, it is important to review changes over time to see whether the discrepancies are growing or shrinking. The evidence suggests a somewhat permanent and systematic export deficiency in the under-exporting
industries in Indiana. As Table 2 shows, seven of the top 10 under-exporting industries saw an EQ decline between 2002 and 2011.
Despite a weak trend toward smaller EQs, these data reveal no monumental shifts in either direction. Only one industry (engines, turbines, and power transmission equipment) exhibited a magnitude EQ change greater than 1.
Where Are the Products Going?In order to generate hypotheses about what could be driving the export gaps, we examined the destinations
n Table 2: Top 10 Under-Exporting Industries, 2002 and 2011
Source: Indiana Business Research Center
Share of U.S. Exports
Share of Indiana Exports EQ
NAICS Industry 2002 2011 2002 2011 2002 2011
3336 Engines, Turbines, and Power Transmission Equipment 1.8% 1.9% 9.6% 7.2% 5.2 3.8
3272 Glass and Glass Products 0.5% 0.3% 0.8% 0.2% 1.5 0.7
3363 Motor Vehicle Parts 6.1% 3.6% 22.6% 11.4% 3.7 3.2
3313 Alumina and Aluminum and Processing 0.5% 0.5% 1.2% 1.0% 2.4 2.0
3253 Pesticides, Fertilizers and Other Agricultural Chemicals 0.6% 0.7% 0.5% 0.3% 0.9 0.4
3314 Nonferrous Metal (Except Aluminum) and Processing 1.1% 2.9% 0.8% 1.5% 0.7 0.5
3342 Communications Equipment 2.2% 2.2% 0.4% 0.4% 0.2 0.2
3112 Grain and Oilseed Milling Products 0.8% 0.9% 0.6% 1.0% 0.7 1.1
3311 Iron and Steel and Ferroalloy 0.7% 1.2% 1.4% 3.3% 2.0 2.7
3361 Motor Vehicles 4.0% 4.3% 4.8% 8.9% 1.2 2.1
n Table 1: Top 10 Under-Exporting Industries
NAICS IndustryIndiana
LQIndiana
EQExport
Gap
3311 Iron and Steel and Ferroalloy 20.8 2.7 18.14
3336 Engines, Turbines, and Power Transmission Equipment 10.8 3.8 6.96
3253 Pesticides, Fertilizers and Other Agricultural Chemicals 6.7 0.4 6.30
3361 Motor Vehicles 7.9 2.1 5.80
3313 Alumina and Aluminum and Processing 6.7 2.0 4.73
3314 Nonferrous Metal (Except Aluminum) and Processing 4.6 0.5 4.09
3363 Motor Vehicle Parts 7.2 3.2 4.02
3342 Communications Equipment 3.0 0.2 2.79
3112 Grain and Oilseed Milling Products 3.6 1.1 2.43
3272 Glass and Glass Products 2.8 0.7 2.03
Source: Indiana Business Research Center

Indiana Business Review Fall 2012 7
for exports from these industries. It is important to understand which countries are purchasing products from Indiana and whether the distribution of destination countries differs between Indiana and the United States as a whole. Perhaps these export gaps can be explained by a lack of market diversity—that is, exporting to too small a set of destinations.
To assess the concentration of destination countries, we calculated a five-country concentration ratio for each industry at both the U.S. and Indiana levels. This is the share of total exports from a given industry going to the top five destination countries for that industry (see Table 3).
Indiana’s markets for the under-exporting industries are less diverse. In every one of the top 10 under-exporting Indiana
industries, Indiana’s exports are more concentrated in the top five export destinations than are the U.S. exports. In 8 of the 10 industries, Indiana’s five-country concentration ratio exceeds the United States’ by double-digits. This certainly suggests that lack of diversification among destination countries may be contributing to these industries’ export gaps—that is, Indiana may not be taking advantage of potential markets—although this evidence by itself is not definitive.
In order to assess this hypothesis—that under-exporting industries are overly dependent on a handful of countries—we wanted to determine if all of Indiana’s exports were more concentrated among a few destination countries. Turning the attention to those Indiana industries that were “over-exporting,” or that
had a negative export gap, one sees a more diverse portfolio of destination countries, as shown in Table 4.
There were five manufacturing-related industries in which Indiana out-exported the broader United States: motor vehicle bodies and trailers; transportation equipment; printed matter and related product; computer equipment; and electrical equipment and components. With the exception of motor vehicle bodies and trailers, Indiana exports from these industries are far more dispersed among destination countries than are U.S. exports. While this does not conclusively prove that concentration of export destinations contributes to the export gap, it certainly provides support for the hypothesis.
n Table 3: Five-Country Concentration Ratios in the Top 10 Under-Exporting Industries
Source: Indiana Business Research Center
NAICS IndustryU.S.
ConcentrationIndiana
ConcentrationPercentage Point
Difference
3311 Iron and Steel and Ferroalloy 74% 97% 23
3336 Engines, Turbines, and Power Transmission Equipment 46% 68% 22
3253 Pesticides, Fertilizers and Other Agricultural Chemicals 65% 78% 13
3361 Motor Vehicles 67% 95% 28
3313 Alumina and Aluminum and Processing 74% 76% 2
3314 Nonferrous Metal (Except Aluminum) and Processing 66% 76% 10
3363 Motor Vehicle Parts 84% 92% 8
3342 Communications Equipment 49% 66% 17
3112 Grain and Oilseed Milling Products 48% 69% 21
3272 Glass and Glass Products 61% 95% 33
n Table 4: Five-Country Concentration Ratios in the Negative Export Gap Industries
Note: Nesoi stands for “not elsewhere specified or indicated.”Source: Indiana Business Research Center
NAICS Industry Export GapU.S. Five-Country
ConcentrationIndiana Five-Country
ConcentrationPercentage Point
Difference
3311 Motor Vehicle Bodies and Trailers -3.7 82% 99% 17
3336 Transportation Equipment, Nesoi -0.8 48% 5% -43
3253 Printed Matter and Related Product, Nesoi -0.5 72% 18% -54
3361 Computer Equipment -0.3 58% 29% -29
3313 Electrical Equipment and Components, Nesoi -0.2 58% 22% -36

8 Indiana University Kelley School of Business, Indiana Business Research Center
How Shall We Then Expand Exports?Given these findings, what can economic development practitioners do to spur more exporting from Indiana businesses? Much of the academic research on firms’ decisions to export has been conducted on non-U.S. firms. One study of Columbian firms showed that sunk costs strongly influenced the decision to continue exporting.4 In other words, prior exporting breeds future exporting. A study of Mexican firms showed that the presence of multinational exporters increased the probability of exporting by other firms in the same industry and region.5 A more recent study of Columbian firms produced similar results: entry costs, exchange rate expectations and prior export experience influenced the decision to export.6 The authors of that study also report finding that “export revenue subsidies are far more effective at stimulating exports than policies that subsidize entry costs.” Entry costs are the costs associated with choosing to start exporting to a particular country, such as the time and money it requires to build knowledge about, and develop an infrastructure in, a foreign country. Across all three studies, firm-level characteristics, such as profitability and size, appeared to play a large role in determining the export decision.
One notable study examined U.S. firms’ decision to export and found some very interesting results. Examining data from all the manufacturing plants that responded to the Census Bureau’s Annual Survey of Manufactures, the authors of this study examined firms’ choice to begin or stop exporting.7 They found results generally consistent with the aforementioned studies conducted in other countries, although they note that spillovers from other plants’ export activities are negligible in determining whether a given plant will export. Also, state export promotion expenditures have
little impact on firms’ decision to export. This is important because previous research also showed that direct expenditures to lower the costs of exporting have little effect, while programs that bolster exporting revenues have a more pronounced effect. Given that factors outside the government’s control play such a large role in determining export decisions (e.g., firm profitability, exchange rates), subsidy programs that are linked to export revenues seem to be the best policy option if governments intend to do something to promote exports.
ConclusionThe evidence presented in this report suggests that Indiana is not reaching its exporting potential in some of its most important industries. Companies producing iron and steel, engines and turbines, motor vehicles and parts, as well as many other products could potentially constitute a much greater share of Indiana’s exports than they currently do based on their share of Indiana’s employment. A lack of diversification in export destination countries may be to blame. In going forward and advising companies on how to expand export activity, we would advise economic development practitioners to study companies’ current export destinations and encourage a broader range of potential partner nations.
To learn more, read the full report at www.ibrc.indiana.edu/studies/ExportGapReport.pdf. n
Notes:1. Data are sourced from WiserTrade and the
Bureau of Economic Analysis.2. The measure is not perfect because it treats
all employment the same in terms of value added. Value-added, or gross domestic product, per worker differs across industries. GDP per worker in the production of medical devices, for example, will be greater than GDP per worker in food processing. That said, GDP per worker in a particular industry would not be expected to differ greatly across geographic boundaries.
3. The most recently available employment data are from 2010, and the most recently available export data are from 2011.
4. Mark Roberts and James Tybout, “An Empirical Model of Sunk Costs and the Decision to Export,” American Economic Review 87:4 (1997): 545-564.
5. Brian Aitken, Gordon Hanson and Ann Harrison, “Spillovers, Foreign Investment, and Export Behavior,” Journal of International Economics 43:1-2 (1997): 103-132.
6. Sanghamitra Das, Mark Roberts and James Tybout, “Market Entry Costs, Producer Heterogeneity, and Export Dynamics,” Econometrica 75:3 (2007): 837-873.
7. Andrew Bernard and J. Bradford Jensen, “Why Some Firms Export,” The Review of Economics and Statistics 86:2 (2004): 561-569.