indiana equine industry economic impact and … indiana equine industry economic impact and health...
TRANSCRIPT
1
Indiana Equine Industry Economic Impact and Health Study
September 2011
Susan E. Conners, Ph.D., Purdue University Calumet
Laurent Couetil, DVM, Ph.D., Purdue University
Jonathan M. Furdek, Ph.D., Purdue University Calumet
Mark A. Russell, Ph.D., Purdue University
Contributors
Providing expertise in Entrepreneurship
Arifin Angriawan, Ph.D., Purdue University Calumet
Derek Ruth, Ph.D., Purdue University Calumet
Providing Technical Expertise
Jian Ying Tu, Technology Specialist, Purdue University Calumet
Purdue University is an equal access/equal opportunity/affirmative action university. If you have trouble accessing this document because of a disability, please contact PVM Web Communications at [email protected].
2
Table of Contents Section I Introduction ................................................................................................................................... 4
Background ................................................................................................................................................... 4
Timeline......................................................................................................................................................... 5
Supply Chain .................................................................................................................................................. 5
Equine by Breed ............................................................................................................................................ 7
Section II Economic Results.......................................................................................................................... 9
Race Horse Breeding in Indiana .................................................................................................................... 9
Economic Impact of Race Horse Breeding ......................................................................................... 15
Equine Businesses in Indiana ...................................................................................................................... 16
Economic Impact of Equine Businesses ............................................................................................. 22
Indiana Equine Owners ............................................................................................................................... 24
Equine Related Income ....................................................................................................................... 24
Equine Related Expenses .................................................................................................................... 25
Owners of Recreational Horses .......................................................................................................... 25
Owners of Horses for Competition ..................................................................................................... 28
Owners of Horses for Racing .............................................................................................................. 30
Owners of Horses for Work ................................................................................................................ 31
Economic Impact of Equine Owners ................................................................................................... 32
Indiana Horse Show Industry ...................................................................................................................... 33
Economic Impact of the Horse Show Industry.................................................................................... 37
Indiana Horse Racing Industry .................................................................................................................... 38
Economic Impact of the Horse Racing ................................................................................................ 40
Section III Entrepreneurship Results ......................................................................................................... 42
The Entrepreneurship Survey ..................................................................................................................... 42
Actions Taken to Start and Run an Equine Business ................................................................................... 43
Attitudes Toward Being an Equine Entrepreneur ...................................................................................... 43
Perceived Approval for Starting an Equine Business ................................................................................. 46
Perceived Ability to be a Successful Equine Business Owner .................................................................... 48
Intention to Become an Equine Business Owner ....................................................................................... 50
Section IV Health Survey Results ............................................................................................................... 54
Purdue University is an equal access/equal opportunity/affirmative action university. If you have trouble accessing this document because of a disability, please contact PVM Web Communications at [email protected].
3
Equine Health Study .................................................................................................................................... 54
Foal Mortality and Morbidity ...................................................................................................................... 55
Mortality and Morbidity in Horses Older than 30 Days .............................................................................. 56
Loss of Use .................................................................................................................................................. 57
Cost Due to Loss of Use............................................................................................................................... 59
Respondent Interest in Future Research .................................................................................................... 60
Equine Deaths By Cause .............................................................................................................................. 60
Deaths Caused and Horses Affected by Colic ..................................................................................... 60
Deaths Caused and Horses Affected by Digestive Diseases other than Colic ..................................... 61
Deaths Caused and Horses Afflicted with Respiratory Diseases ........................................................ 62
Horses Affected by Heaves or Strangles ............................................................................................. 63
Deaths Caused by or Horses Affected with Neurological Conditions ............................................... 64
Deaths Caused by or Horses Affected with Laminitis/Founder ......................................................... 65
Deaths Caused by Limb Fracture & Horses that have Fractured Limbs ............................................. 66
Horses Affected with Other Lameness Issues .................................................................................... 67
Deaths Caused by and Horses Affected with Other Injuries .............................................................. 68
Deaths Caused by or Horses Affected with Leg/Hoof Problems ....................................................... 69
Death Caused by Old Age ................................................................................................................... 70
Deaths Caused by or Horses Afflicted with Other Causes ................................................................. 70
Horses Afflicted with Other Conditions ............................................................................................. 71
Deaths Caused by and Horses Affected with Unknown Causes ........................................................ 72
Summary Information Concerning Mortality and Morbidity by Age Group .............................................. 73
Section V Conclusions and Recommendations ......................................................................................... 83
Conclusions ................................................................................................................................................. 83
Dissemination of Findings ........................................................................................................................... 86
Recommendations ...................................................................................................................................... 87
Purdue University is an equal access/equal opportunity/affirmative action university. If you have trouble accessing this document because of a disability, please contact PVM Web Communications at [email protected].
4
Indiana Equine Industry Economic Impact and Health Study
This report summarizes the preliminary findings from the several surveys conducted in the
Spring, 2011 regarding the 2010 economic activity and health issues in the various segments of
the equine industry. The study focuses on several economic issues and equine health issues. The
economic issues are: (1) a profile of the equine industry in Indiana; (2) revenue and expenditure
aspects of the equine industry; (3) employment aspects of the equine industry; and (4) the
economic impact of the industry at the state, regional and planning level. The equine health
issues are: (1) characterization of morbidity and mortality in the equine population; (2) a
description of days of lost use and related costs due to ill or injured equine; and (3) the
economic impact of the related equine health issues.
Section I Introduction
Background
The first comprehensive survey of the Equine industry in Indiana was a collaborative effort
conducted in 2001. The focus of this comprehensive study was a census by breed and use of the
equine population in Indiana along with the relevant revenues and related costs. This study
found an estimated 160,000 equine in the state on approximately 34,000 operations. These
equine were valued at over $580 million in 2002 dollars. Of those 160,000 horses, it was
estimated that 43,200 were Quarter Horses, 22,300 were grade horses, and 15,300 were
Standardbreds. The Quarter Horses were valued at $183 million and Standardbreds at $89
million, while annual expenses were approximately $549 million and annual income was $92
million, again in 2002 dollars.
In 2005, the American Horse Council commissioned a study conducted by Deloitte to examine
the economic impact of the equine industry. That study generated a national reports as well as a
breakdown for each of the major 15 “breakout States”. Indiana was one of those states. That
study indicated that the U.S. equine industry had a large and positive economic impact on other
segments of the U.S. economy, manifested in direct effects from the economic activity of the
equine industry itself, the indirect effects derived from the economic activity of the equine
industry, and the induced effects when incomes are generated and spent in various ways
throughout the economy. For example, when a saddle is purchased, not only is the
manufacturing of saddles supported, but also the suppliers of raw materials for the saddles, the
saddle-making equipment industry, and the support services to deliver, distribute, and market the
saddles. All of these other affected industries stimulate demand for their suppliers. Incomes are
generated at each stage in each related industry, which in turn stimulate economic activity
throughout the economy.
Purdue University is an equal access/equal opportunity/affirmative action university. If you have trouble accessing this document because of a disability, please contact PVM Web Communications at [email protected].
5
This study estimated the horse population In Indiana at 202,986, placing Indiana ninth among the
states in horse population. This study estimated the economic impact on the state GDP at $1.316
billion (10th
in the nation), with an estimated 89,977 individuals age 18 or over participating (11th
in the nation) and an equivalent of 22,556 full time employees in the industry (12th
in the nation).
A study in 2010 focused on the economic impact of the racing industry and the breeding
industry, two of the major components of the overall equine industry.
This report focuses on the Indiana equine industry and its two fold purpose is to report on the
equine industry’s economic impact and equine health issues. The survey instruments were kept
as close as possible to the other two surveys for comparison purposes.
Timeline
This broad study is based on three on-line surveys that were conducted simultaneously in the
Spring of 2011. Those surveys were disseminated at public venues such as the Hoosier Horse
Fair but primarily through the network of horse organizations in the State. The focus of the data
collection was on specific and important final markets as well as on the economic activity that
leads up to those markets. The surveys were a Horse Show Survey, an Indiana Race Track
Survey, and an Indiana Equine Business and Owners Survey. The Indiana Equine Business and
Owners Survey was broken down into several segments: an Equine Business Survey, an Equine
Owners Survey, an Equine Entrepreneur Survey, and an Equine Health Survey. The results
reported here are based on those various surveys integrated with information from the previous
surveys.
Estimation of economic impacts was determined utilizing state specific IMPLAN multipliers to
estimate the overall economic impact of the industry on the state GDP and on employment. The
IMPLAN modeling system has been in use since 1979 and is currently used by over 500 private
consulting firms, university research centers, and government agencies. The IMPLAN system
combines the U.S. Bureau of Economic Analysis Input-Output Benchmarks with other data to
construct quantitative models at the state level. The effects of a change in one or several
economic activities can be analyzed within the framework of the model to estimate or predict the
effect on a state, regional or local economy (impact analysis) all the way down to the county
level. The economic impacts of the equine industry are estimated using the most current 2009
IMPLAN multipliers for the State of Indiana.
Supply Chain
The equine industry is far more complex when compared to other large animal industries. The
cattle and hog industries, for comparison, are singular in purpose. Basically, there is a specific
motivation for raising cattle and hogs, so the economic and health issues are homogeneous and
the primary economic issues relate to the scale of operation and the total number of animals.
Purdue University is an equal access/equal opportunity/affirmative action university. If you have trouble accessing this document because of a disability, please contact PVM Web Communications at [email protected].
6
The equine industry, however, involves a variety of animal types intended for many different
purposes. Consequently, the types of facilities, the types of resources employed, the skills
required, the types of markets and intended uses as well as health issues are varied and contribute
to the complexity of the industry.
A supply chain involves all the enterprises and economic activities from the securing of raw
materials and basic resources, through the various activities involved in the continuing processes,
to the ultimate end results and consumers involved in the industry. Although every enterprise in
the industry views itself independently with its own source of resources, work efforts, and
customers, the performance of the larger industry depends upon the interactions between all
these competing enterprises. The first step is the realization that each enterprise is part of a
larger industry and that ultimately, success or failure depends upon adding value to the final
consumer. For example, the long term success of the horse racing industry depends not only on
the race track operations, but on the quality of horses and athletes involved. The quality of
horses depends not only on breeding but also upon a variety of other enterprises that provide
boarding, training, medical care, feed and other necessary products and services.
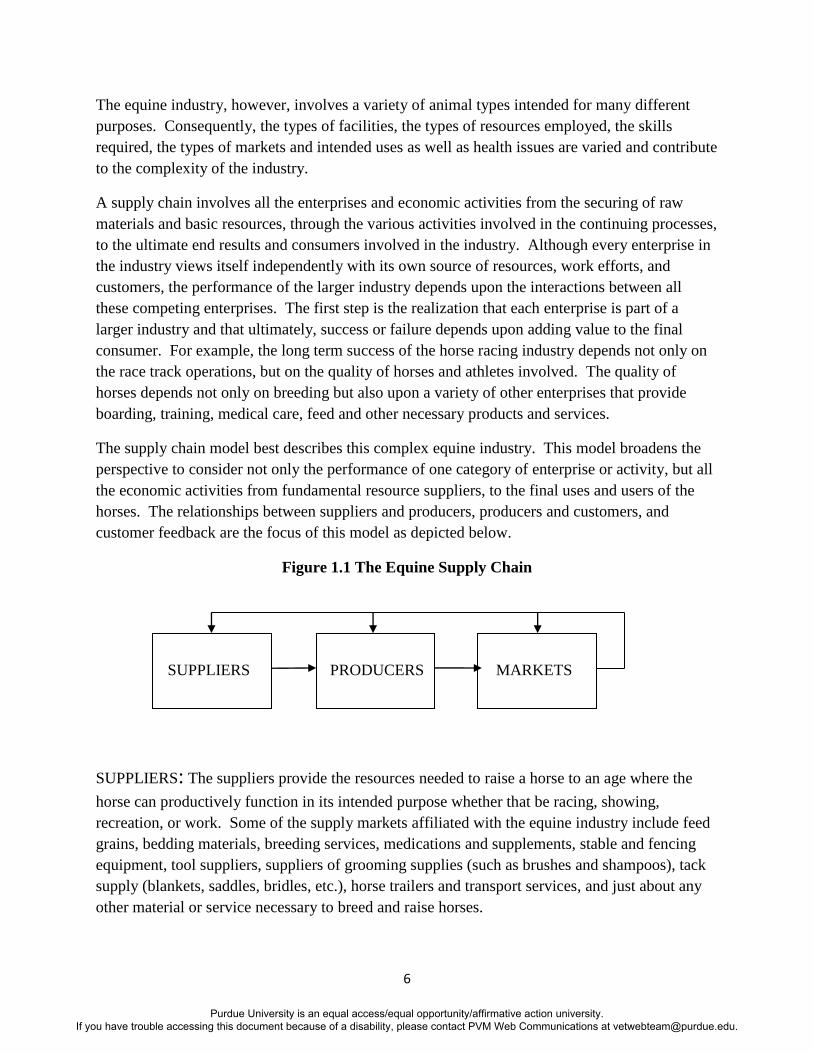
The supply chain model best describes this complex equine industry. This model broadens the
perspective to consider not only the performance of one category of enterprise or activity, but all
the economic activities from fundamental resource suppliers, to the final uses and users of the
horses. The relationships between suppliers and producers, producers and customers, and
customer feedback are the focus of this model as depicted below.
Figure 1.1 The Equine Supply Chain
SUPPLIERS PRODUCERS MARKETS
SUPPLIERS: The suppliers provide the resources needed to raise a horse to an age where the
horse can productively function in its intended purpose whether that be racing, showing,
recreation, or work. Some of the supply markets affiliated with the equine industry include feed
grains, bedding materials, breeding services, medications and supplements, stable and fencing
equipment, tool suppliers, suppliers of grooming supplies (such as brushes and shampoos), tack
supply (blankets, saddles, bridles, etc.), horse trailers and transport services, and just about any
other material or service necessary to breed and raise horses.
Purdue University is an equal access/equal opportunity/affirmative action university. If you have trouble accessing this document because of a disability, please contact PVM Web Communications at [email protected].
7
PRODUCERS: Specifically, the producers would breed and raise horses to a specific use such as
racing, showing, work or recreation. Prior to the birth of a foal, breeding services are needed as
well as veterinarian and farrier services for the care of the mare. After the birth of the foal, the
services required include farrier service, veterinarian services, boarding, medical care, feeding,
exercise and training, grooming, and a variety of activities necessary to raise that horse to its
intended purpose. If an equine business, there may be a need for a sales agent, an attorney, an
accountant, and marketing.
MARKETS: These are the activities related to the purposes of the horses. Whether it be racing,
showing, recreation, or work, there are facilities, personnel, equipment, and other resources
involved in order to enable the various ways that horses may be used. Equine markets vary by
breed and by performance discipline. Horses that are not considered suitable for the purpose
intended for the breed are frequently sold in the recreational and work horse markets.
There are two important aspects of a modern supply chain. One aspect addresses the issue of the
degree to which an enterprise engages in the productive activities or relies on an outside
contractor. A horse farm, for example, must determine if it would provide its own farrier
services with a farrier employed on sight or rely on a farrier to provide services as needed on a
contract basis. The other aspect is the information that returns along the supply chain and the
relationships between the enterprises in the supply chain that facilitate the information flow. For
example, breeders need a communication link with farms in order to efficiently produce foals.
When viewing the industry as a series of connected business activities, a deeper understanding of
the industry will evolve.
Equine by Breed in Indiana
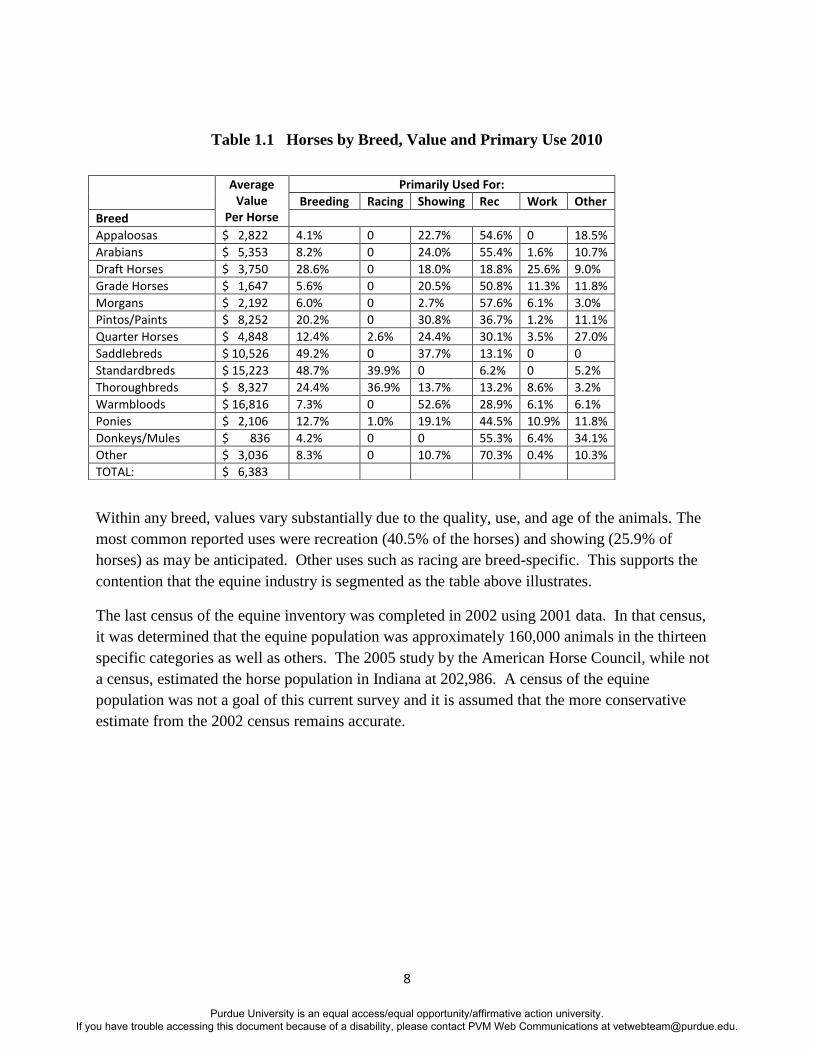
Thirteen general categories by breed are identified as well as the various uses for these breeds.
This information is detailed in Table 5.1. The average value per horse is estimated to be $6,383
in 2010, based on self-reported values by owners in the survey. But these values range from an
average for donkeys and mules of $836 to the higher valued Warmbloods with an average value
of $16,816.
Purdue University is an equal access/equal opportunity/affirmative action university. If you have trouble accessing this document because of a disability, please contact PVM Web Communications at [email protected].
8
Table 1.1 Horses by Breed, Value and Primary Use 2010
Within any breed, values vary substantially due to the quality, use, and age of the animals. The
most common reported uses were recreation (40.5% of the horses) and showing (25.9% of
horses) as may be anticipated. Other uses such as racing are breed-specific. This supports the
contention that the equine industry is segmented as the table above illustrates.
The last census of the equine inventory was completed in 2002 using 2001 data. In that census,
it was determined that the equine population was approximately 160,000 animals in the thirteen
specific categories as well as others. The 2005 study by the American Horse Council, while not
a census, estimated the horse population in Indiana at 202,986. A census of the equine
population was not a goal of this current survey and it is assumed that the more conservative
estimate from the 2002 census remains accurate.
Average Value
Per Horse
Primarily Used For:
Breeding Racing Showing Rec Work Other
Breed
Appaloosas $ 2,822 4.1% 0 22.7% 54.6% 0 18.5%
Arabians $ 5,353 8.2% 0 24.0% 55.4% 1.6% 10.7%
Draft Horses $ 3,750 28.6% 0 18.0% 18.8% 25.6% 9.0%
Grade Horses $ 1,647 5.6% 0 20.5% 50.8% 11.3% 11.8%
Morgans $ 2,192 6.0% 0 2.7% 57.6% 6.1% 3.0%
Pintos/Paints $ 8,252 20.2% 0 30.8% 36.7% 1.2% 11.1%
Quarter Horses $ 4,848 12.4% 2.6% 24.4% 30.1% 3.5% 27.0%
Saddlebreds $ 10,526 49.2% 0 37.7% 13.1% 0 0
Standardbreds $ 15,223 48.7% 39.9% 0 6.2% 0 5.2%
Thoroughbreds $ 8,327 24.4% 36.9% 13.7% 13.2% 8.6% 3.2%
Warmbloods $ 16,816 7.3% 0 52.6% 28.9% 6.1% 6.1%
Ponies $ 2,106 12.7% 1.0% 19.1% 44.5% 10.9% 11.8%
Donkeys/Mules $ 836 4.2% 0 0 55.3% 6.4% 34.1%
Other $ 3,036 8.3% 0 10.7% 70.3% 0.4% 10.3%
TOTAL: $ 6,383
Purdue University is an equal access/equal opportunity/affirmative action university. If you have trouble accessing this document because of a disability, please contact PVM Web Communications at [email protected].
9
Section II Economic Results
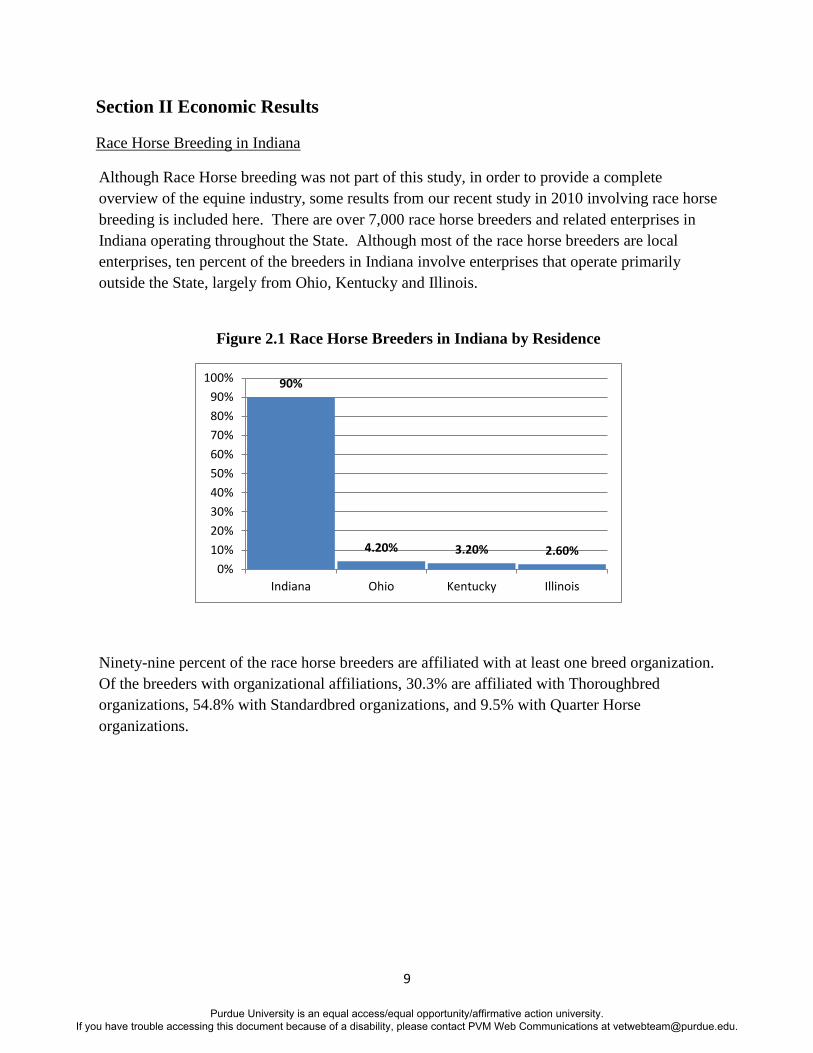
Race Horse Breeding in Indiana
Although Race Horse breeding was not part of this study, in order to provide a complete
overview of the equine industry, some results from our recent study in 2010 involving race horse
breeding is included here. There are over 7,000 race horse breeders and related enterprises in
Indiana operating throughout the State. Although most of the race horse breeders are local
enterprises, ten percent of the breeders in Indiana involve enterprises that operate primarily
outside the State, largely from Ohio, Kentucky and Illinois.
Figure 2.1 Race Horse Breeders in Indiana by Residence
Ninety-nine percent of the race horse breeders are affiliated with at least one breed organization.
Of the breeders with organizational affiliations, 30.3% are affiliated with Thoroughbred
organizations, 54.8% with Standardbred organizations, and 9.5% with Quarter Horse
organizations.
90%
4.20% 3.20% 2.60%
0%
10%
20%
30%
40%
50%
60%
70%
80%
90%
100%
Indiana Ohio Kentucky Illinois
Purdue University is an equal access/equal opportunity/affirmative action university. If you have trouble accessing this document because of a disability, please contact PVM Web Communications at [email protected].
10
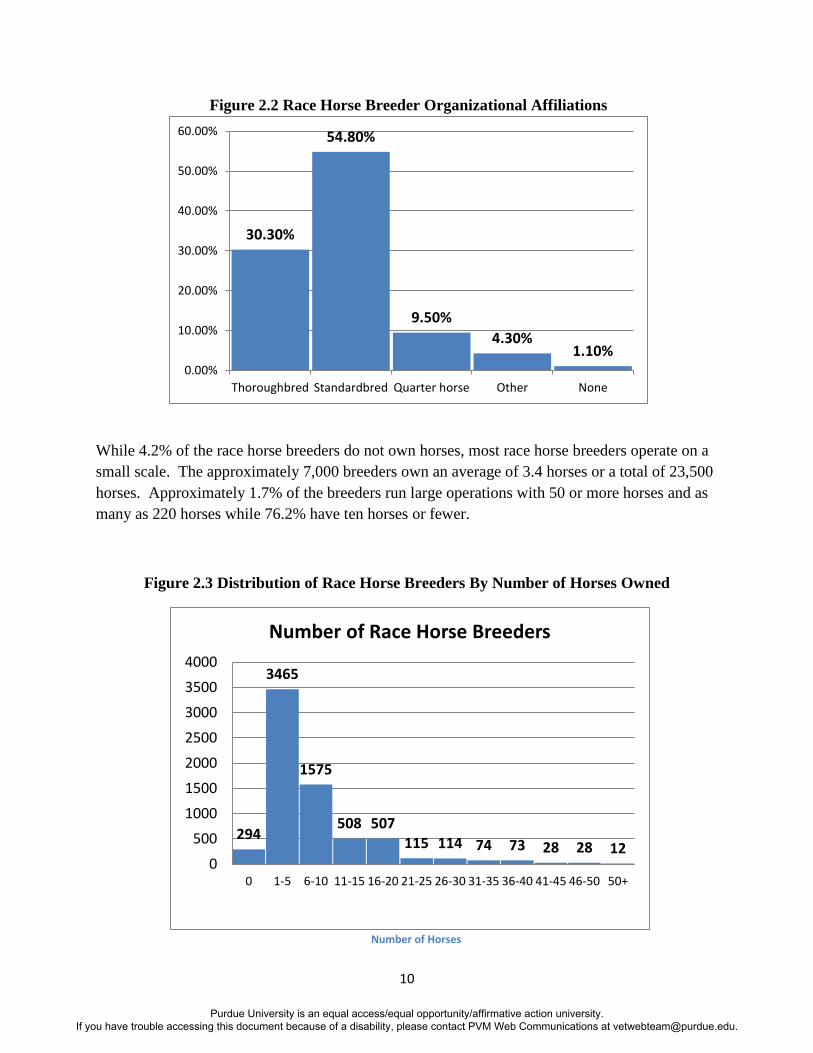
Figure 2.2 Race Horse Breeder Organizational Affiliations
While 4.2% of the race horse breeders do not own horses, most race horse breeders operate on a
small scale. The approximately 7,000 breeders own an average of 3.4 horses or a total of 23,500
horses. Approximately 1.7% of the breeders run large operations with 50 or more horses and as
many as 220 horses while 76.2% have ten horses or fewer.
Figure 2.3 Distribution of Race Horse Breeders By Number of Horses Owned
30.30%
54.80%
9.50%
4.30% 1.10%
0.00%
10.00%
20.00%
30.00%
40.00%
50.00%
60.00%
Thoroughbred Standardbred Quarter horse Other None
294
3465
1575
508 507 115 114 74 73 28 28 12
0
500
1000
1500
2000
2500
3000
3500
4000
0 1-5 6-10 11-15 16-20 21-25 26-30 31-35 36-40 41-45 46-50 50+
Number of Race Horse Breeders
Number of Horses
Purdue University is an equal access/equal opportunity/affirmative action university. If you have trouble accessing this document because of a disability, please contact PVM Web Communications at [email protected].

11
Most race horse breeders kept horses at their own facilities (68%), while 7% keep horses at
training facilities and 25% at a variety of other facilities. These other facilities include race
tracks (38.4%), other farms (20.5%), fairgrounds (11%), breeding farms (8%) and out of state
facilities (15.5%).
A significant source of race horse breeder income is derived from purses and awards with
approximately $107,800,581 in purses and $10,985,093 in awards. Race Horse Breeders also
generate substantial revenues from sale of horses ($81,383,127), Boarding ($58,396,037) and
Training ($46,118,415). Race Horse Breeder revenues come from a variety of other sources as
illustrated in Table 2.4. These other sources of revenue project an additional $35,877,030 in the
other categories of revenue.
Figure 2.4 Race Horse Breeder Revenues – Percentages by Source
34.9%
23.9% 17.1%
13.5% 10.5%
0.0%
10.0%
20.0%
30.0%
40.0%
Purses &Awards
Sale ofHorses
Boarding Training Other
Percentage of Race Horse Breeder Revenues by Category
Purdue University is an equal access/equal opportunity/affirmative action university. If you have trouble accessing this document because of a disability, please contact PVM Web Communications at [email protected].
12
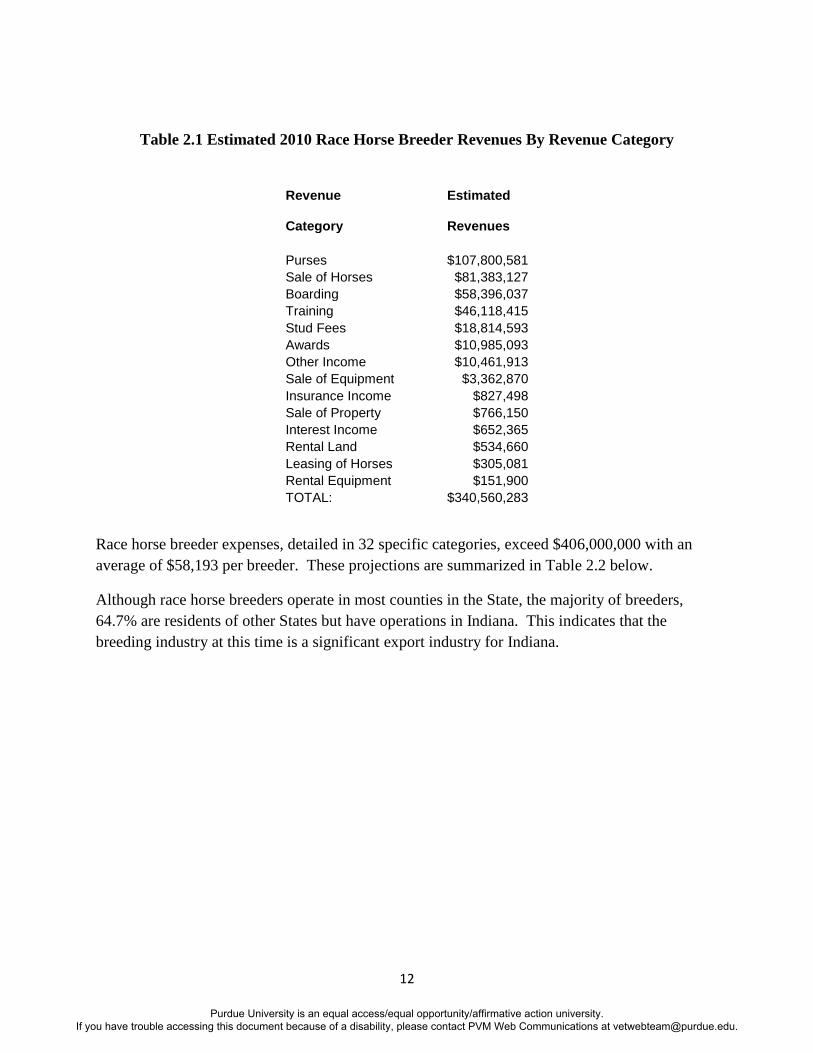
Table 2.1 Estimated 2010 Race Horse Breeder Revenues By Revenue Category
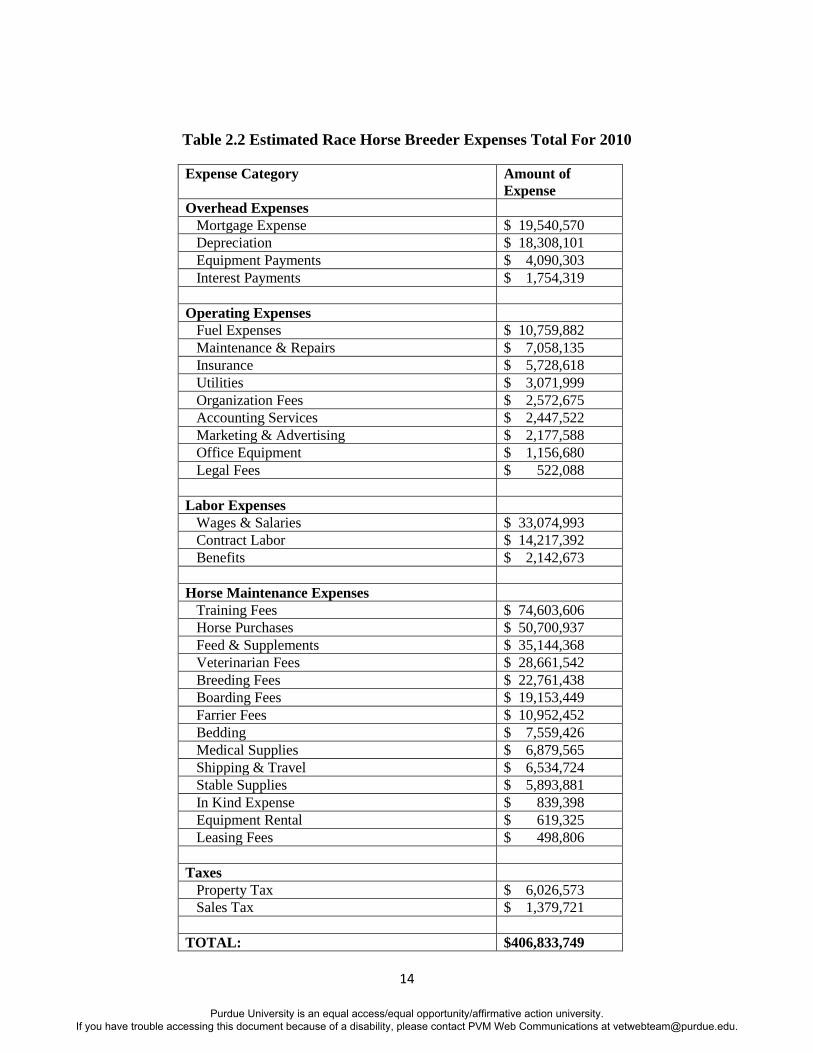
Race horse breeder expenses, detailed in 32 specific categories, exceed $406,000,000 with an
average of $58,193 per breeder. These projections are summarized in Table 2.2 below.
Although race horse breeders operate in most counties in the State, the majority of breeders,
64.7% are residents of other States but have operations in Indiana. This indicates that the
breeding industry at this time is a significant export industry for Indiana.
Revenue Estimated
Category Revenues
Purses $107,800,581
Sale of Horses $81,383,127
Boarding $58,396,037
Training $46,118,415
Stud Fees $18,814,593
Awards $10,985,093
Other Income $10,461,913
Sale of Equipment $3,362,870
Insurance Income $827,498
Sale of Property $766,150
Interest Income $652,365
Rental Land $534,660
Leasing of Horses $305,081
Rental Equipment $151,900
TOTAL: $340,560,283
Purdue University is an equal access/equal opportunity/affirmative action university. If you have trouble accessing this document because of a disability, please contact PVM Web Communications at [email protected].
13
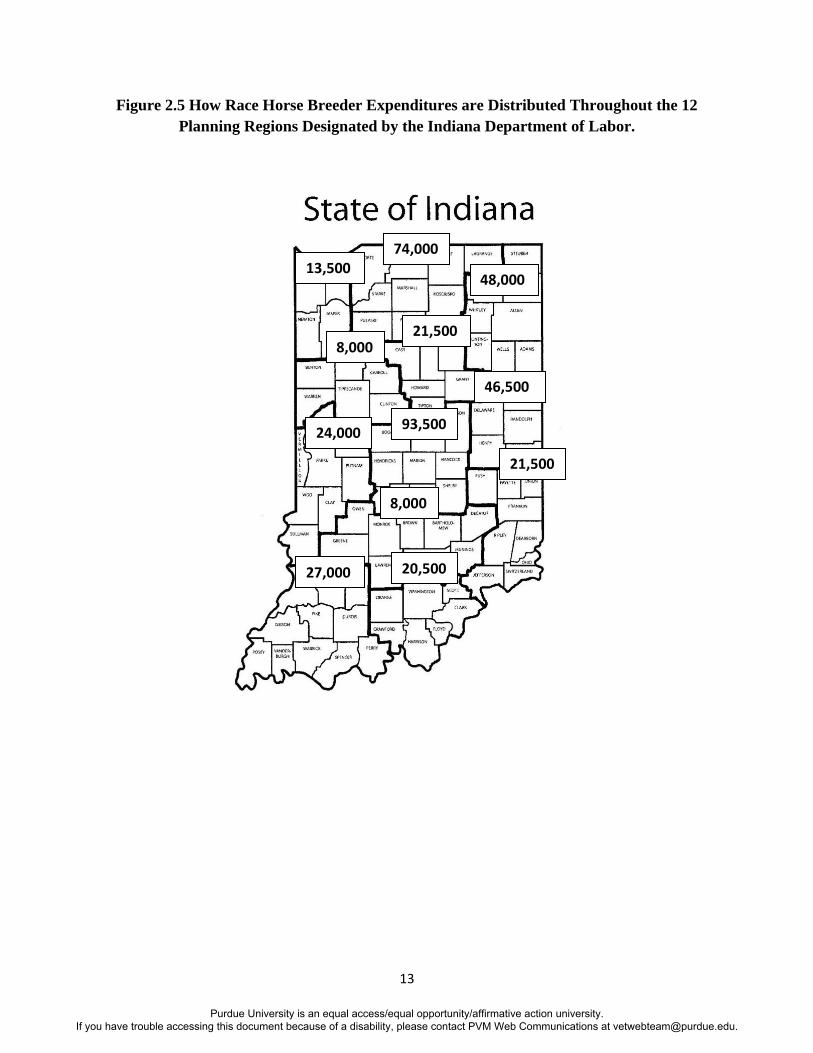
Figure 2.5 How Race Horse Breeder Expenditures are Distributed Throughout the 12
Planning Regions Designated by the Indiana Department of Labor.
13,500
21,500
48,000
8,000
46,500
74,000
93,500 24,000
8,000
21,500
27,000 20,500
Purdue University is an equal access/equal opportunity/affirmative action university. If you have trouble accessing this document because of a disability, please contact PVM Web Communications at [email protected].
14
Table 2.2 Estimated Race Horse Breeder Expenses Total For 2010
Expense Category Amount of
Expense
Overhead Expenses
Mortgage Expense $ 19,540,570
Depreciation $ 18,308,101
Equipment Payments $ 4,090,303
Interest Payments $ 1,754,319
Operating Expenses
Fuel Expenses $ 10,759,882
Maintenance & Repairs $ 7,058,135
Insurance $ 5,728,618
Utilities $ 3,071,999
Organization Fees $ 2,572,675
Accounting Services $ 2,447,522
Marketing & Advertising $ 2,177,588
Office Equipment $ 1,156,680
Legal Fees $ 522,088
Labor Expenses
Wages & Salaries $ 33,074,993
Contract Labor $ 14,217,392
Benefits $ 2,142,673
Horse Maintenance Expenses
Training Fees $ 74,603,606
Horse Purchases $ 50,700,937
Feed & Supplements $ 35,144,368
Veterinarian Fees $ 28,661,542
Breeding Fees $ 22,761,438
Boarding Fees $ 19,153,449
Farrier Fees $ 10,952,452
Bedding $ 7,559,426
Medical Supplies $ 6,879,565
Shipping & Travel $ 6,534,724
Stable Supplies $ 5,893,881
In Kind Expense $ 839,398
Equipment Rental $ 619,325
Leasing Fees $ 498,806
Taxes
Property Tax $ 6,026,573
Sales Tax $ 1,379,721
TOTAL: $406,833,749
Purdue University is an equal access/equal opportunity/affirmative action university. If you have trouble accessing this document because of a disability, please contact PVM Web Communications at [email protected].
15
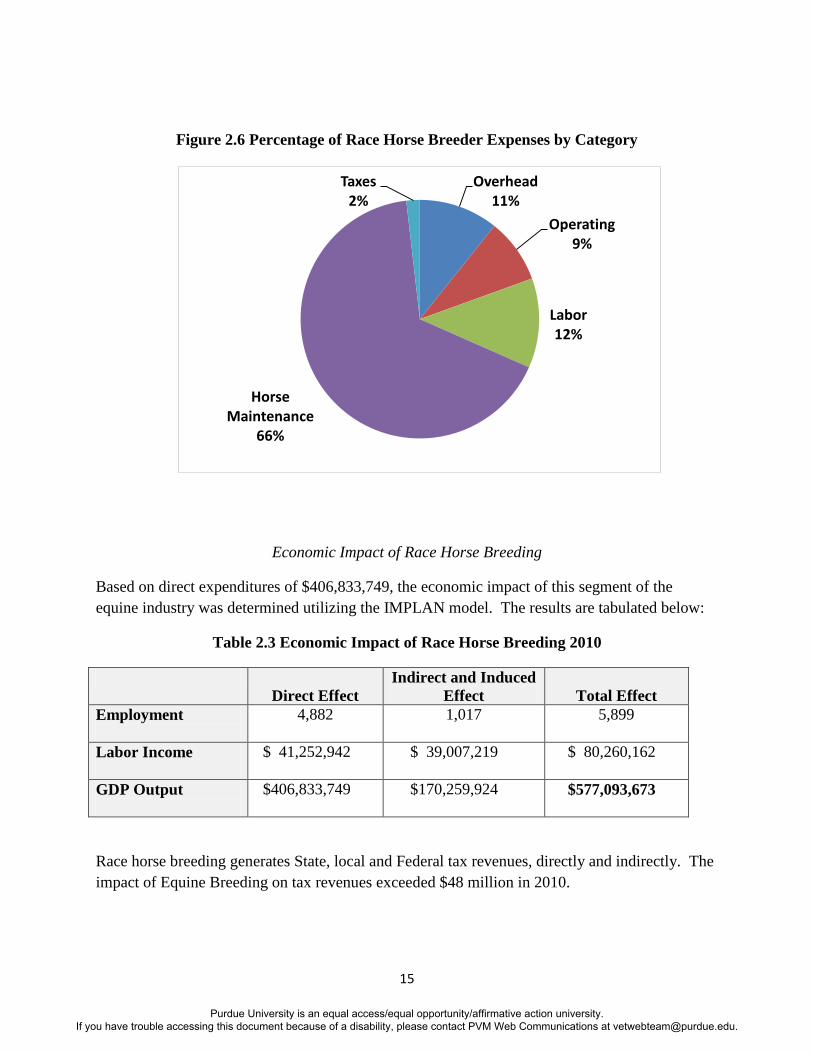
Figure 2.6 Percentage of Race Horse Breeder Expenses by Category
Economic Impact of Race Horse Breeding
Based on direct expenditures of $406,833,749, the economic impact of this segment of the
equine industry was determined utilizing the IMPLAN model. The results are tabulated below:
Table 2.3 Economic Impact of Race Horse Breeding 2010
Direct Effect
Indirect and Induced
Effect
Total Effect
Employment
4,882 1,017 5,899
Labor Income
$ 41,252,942 $ 39,007,219 $ 80,260,162
GDP Output
$406,833,749 $170,259,924 $577,093,673
Race horse breeding generates State, local and Federal tax revenues, directly and indirectly. The
impact of Equine Breeding on tax revenues exceeded $48 million in 2010.
Overhead 11%
Operating 9%
Labor 12%
Horse Maintenance
66%
Taxes 2%
Purdue University is an equal access/equal opportunity/affirmative action university. If you have trouble accessing this document because of a disability, please contact PVM Web Communications at [email protected].
16
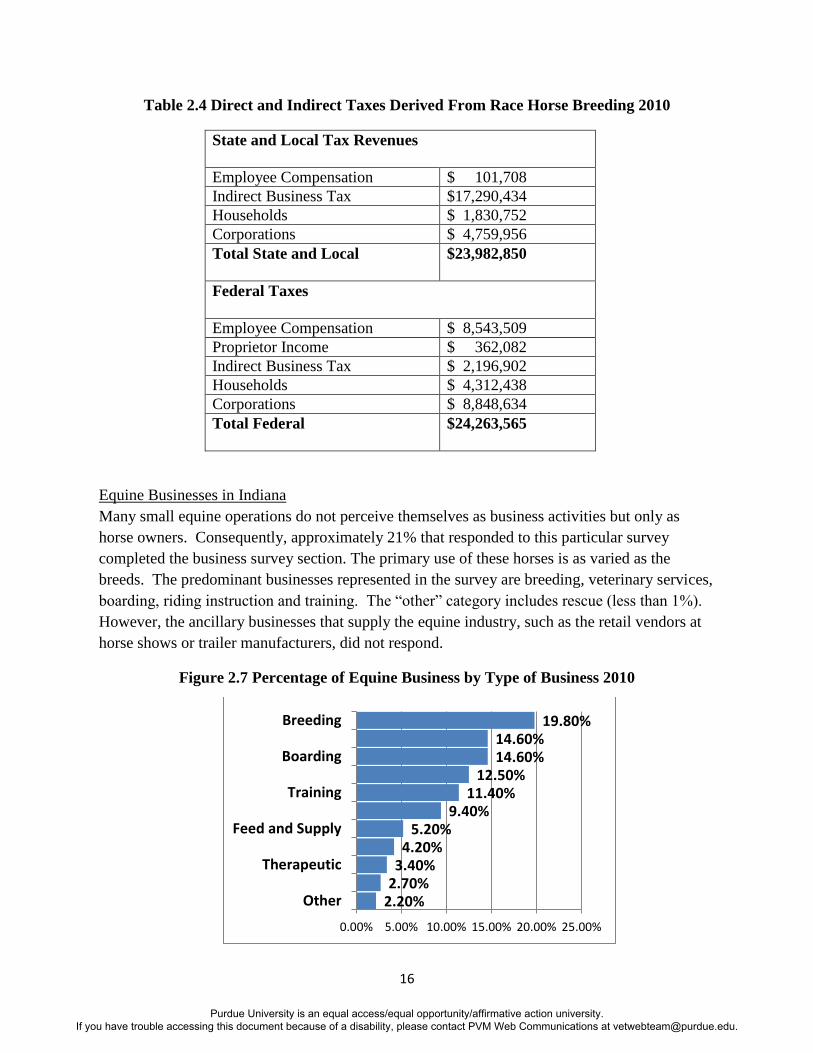
Table 2.4 Direct and Indirect Taxes Derived From Race Horse Breeding 2010
State and Local Tax Revenues
Employee Compensation $ 101,708
Indirect Business Tax $17,290,434
Households $ 1,830,752
Corporations $ 4,759,956
Total State and Local
$23,982,850
Federal Taxes
Employee Compensation $ 8,543,509
Proprietor Income $ 362,082
Indirect Business Tax $ 2,196,902
Households $ 4,312,438
Corporations $ 8,848,634
Total Federal
$24,263,565
Equine Businesses in Indiana
Many small equine operations do not perceive themselves as business activities but only as
horse owners. Consequently, approximately 21% that responded to this particular survey
completed the business survey section. The primary use of these horses is as varied as the
breeds. The predominant businesses represented in the survey are breeding, veterinary services,
boarding, riding instruction and training. The “other” category includes rescue (less than 1%).
However, the ancillary businesses that supply the equine industry, such as the retail vendors at
horse shows or trailer manufacturers, did not respond.
Figure 2.7 Percentage of Equine Business by Type of Business 2010
2.20% 2.70% 3.40% 4.20%
5.20% 9.40%
11.40% 12.50%
14.60% 14.60%
19.80%
0.00% 5.00% 10.00% 15.00% 20.00% 25.00%
Other
Therapeutic
Feed and Supply
Training
Boarding
Breeding
Purdue University is an equal access/equal opportunity/affirmative action university. If you have trouble accessing this document because of a disability, please contact PVM Web Communications at [email protected].
17
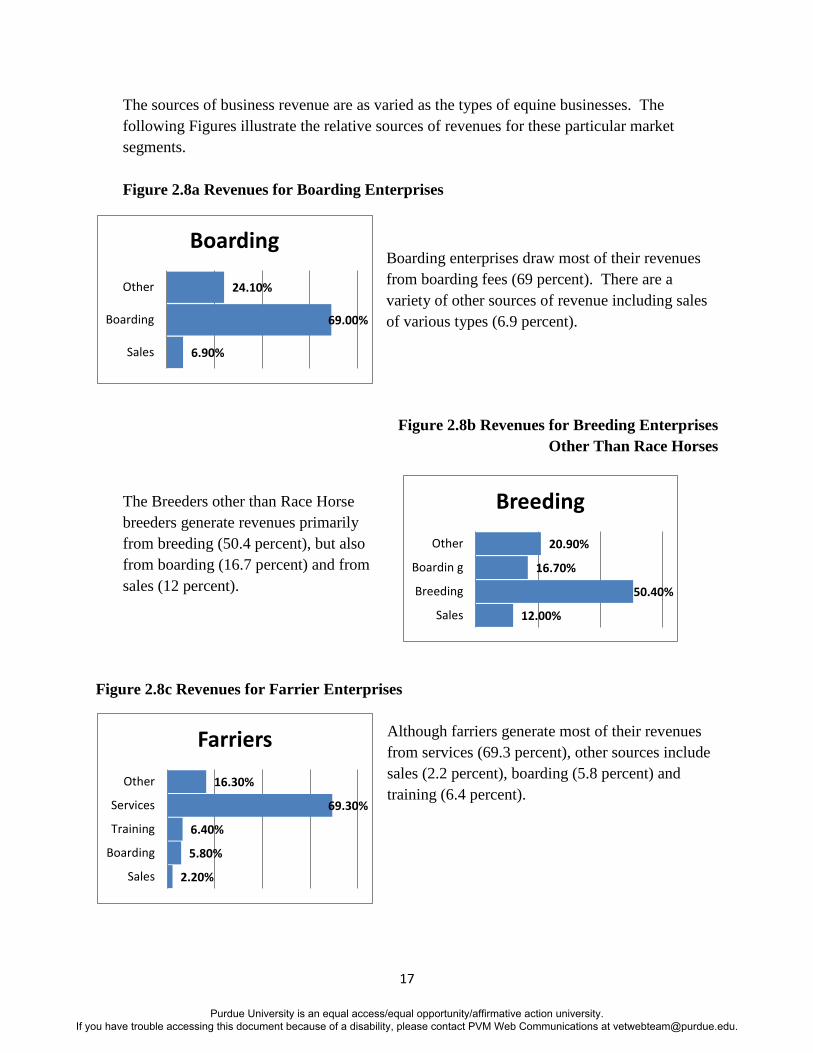
The sources of business revenue are as varied as the types of equine businesses. The
following Figures illustrate the relative sources of revenues for these particular market
segments.
Figure 2.8a Revenues for Boarding Enterprises
Boarding enterprises draw most of their revenues
from boarding fees (69 percent). There are a
variety of other sources of revenue including sales
of various types (6.9 percent).
Figure 2.8b Revenues for Breeding Enterprises
Other Than Race Horses
The Breeders other than Race Horse
breeders generate revenues primarily
from breeding (50.4 percent), but also
from boarding (16.7 percent) and from
sales (12 percent).
Figure 2.8c Revenues for Farrier Enterprises
Although farriers generate most of their revenues
from services (69.3 percent), other sources include
sales (2.2 percent), boarding (5.8 percent) and
training (6.4 percent).
6.90%
69.00%
24.10%
Sales
Boarding
Other
Boarding
12.00%
50.40%
16.70%
20.90%
Sales
Breeding
Boardin g
Other
Breeding
2.20%
5.80%
6.40%
69.30%
16.30%
Sales
Boarding
Training
Services
Other
Farriers
Purdue University is an equal access/equal opportunity/affirmative action university. If you have trouble accessing this document because of a disability, please contact PVM Web Communications at [email protected].
18
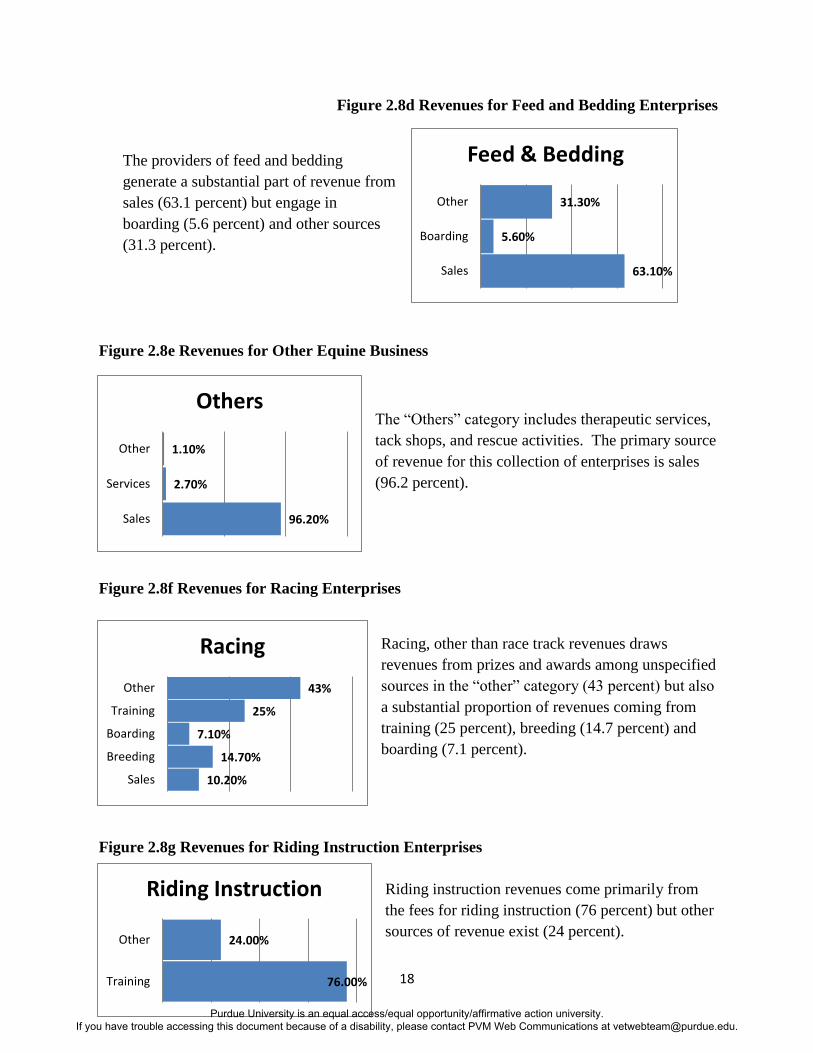
Figure 2.8d Revenues for Feed and Bedding Enterprises
The providers of feed and bedding
generate a substantial part of revenue from
sales (63.1 percent) but engage in
boarding (5.6 percent) and other sources
(31.3 percent).
Figure 2.8e Revenues for Other Equine Business
The “Others” category includes therapeutic services,
tack shops, and rescue activities. The primary source
of revenue for this collection of enterprises is sales
(96.2 percent).
Figure 2.8f Revenues for Racing Enterprises
Racing, other than race track revenues draws
revenues from prizes and awards among unspecified
sources in the “other” category (43 percent) but also
a substantial proportion of revenues coming from
training (25 percent), breeding (14.7 percent) and
boarding (7.1 percent).
Figure 2.8g Revenues for Riding Instruction Enterprises
Riding instruction revenues come primarily from
the fees for riding instruction (76 percent) but other
sources of revenue exist (24 percent).
63.10%
5.60%
31.30%
Sales
Boarding
Other
Feed & Bedding
96.20%
2.70%
1.10%
Sales
Services
Other
Others
10.20%
14.70%
7.10%
25%
43%
Sales
Breeding
Boarding
Training
Other
Racing
76.00%
24.00%
Training
Other
Riding Instruction
Purdue University is an equal access/equal opportunity/affirmative action university. If you have trouble accessing this document because of a disability, please contact PVM Web Communications at [email protected].
19
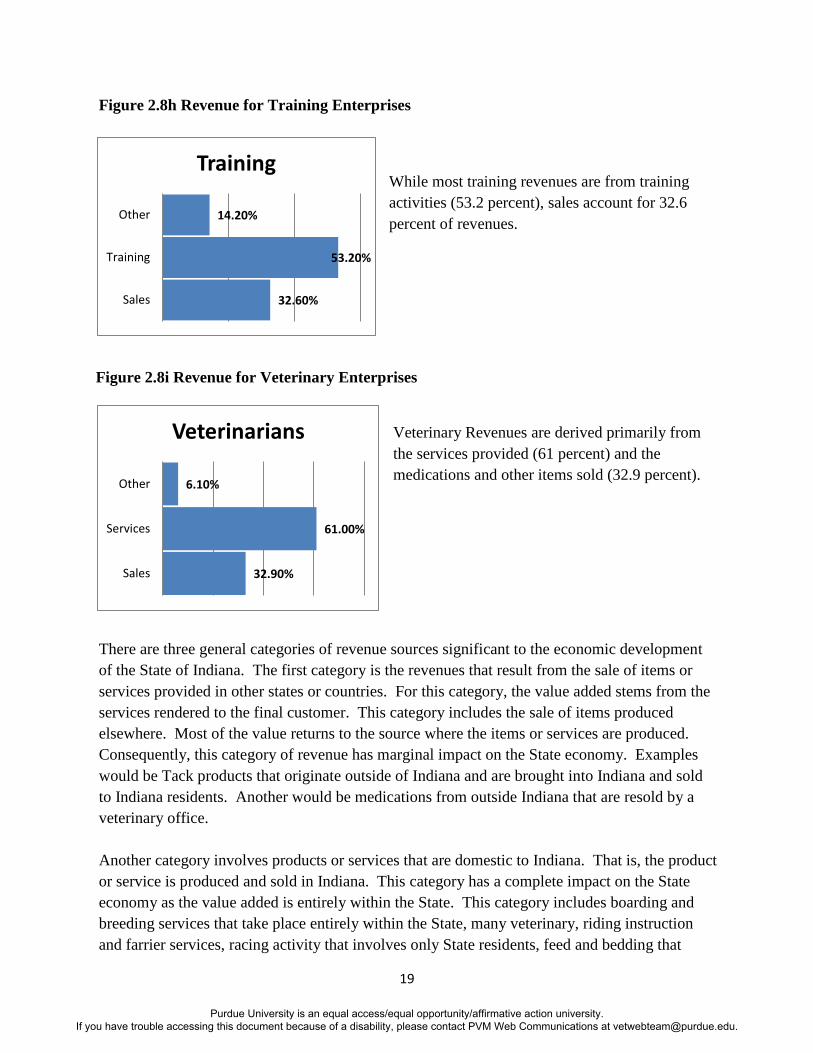
Figure 2.8h Revenue for Training Enterprises
While most training revenues are from training
activities (53.2 percent), sales account for 32.6
percent of revenues.
Figure 2.8i Revenue for Veterinary Enterprises
Veterinary Revenues are derived primarily from
the services provided (61 percent) and the
medications and other items sold (32.9 percent).
There are three general categories of revenue sources significant to the economic development
of the State of Indiana. The first category is the revenues that result from the sale of items or
services provided in other states or countries. For this category, the value added stems from the
services rendered to the final customer. This category includes the sale of items produced
elsewhere. Most of the value returns to the source where the items or services are produced.
Consequently, this category of revenue has marginal impact on the State economy. Examples
would be Tack products that originate outside of Indiana and are brought into Indiana and sold
to Indiana residents. Another would be medications from outside Indiana that are resold by a
veterinary office.
Another category involves products or services that are domestic to Indiana. That is, the product
or service is produced and sold in Indiana. This category has a complete impact on the State
economy as the value added is entirely within the State. This category includes boarding and
breeding services that take place entirely within the State, many veterinary, riding instruction
and farrier services, racing activity that involves only State residents, feed and bedding that
32.60%
53.20%
14.20%
Sales
Training
Other
Training
32.90%
61.00%
6.10%
Sales
Services
Other
Veterinarians
Purdue University is an equal access/equal opportunity/affirmative action university. If you have trouble accessing this document because of a disability, please contact PVM Web Communications at [email protected].
20
originates within the State, and other such economic activities that utilize in State resources to
provide products and services to Indiana customers.
The third category involves product or services that originate in Indiana but the final customer is
from outside of Indiana. Examples of such markets would be boarding of horses for owners
from outside Indiana, wagering revenues from outside of Indiana, or breeding of horses sold to
customers outside of Indiana. These revenues tend to generate new wealth for Indiana and have
the greatest economic impact.
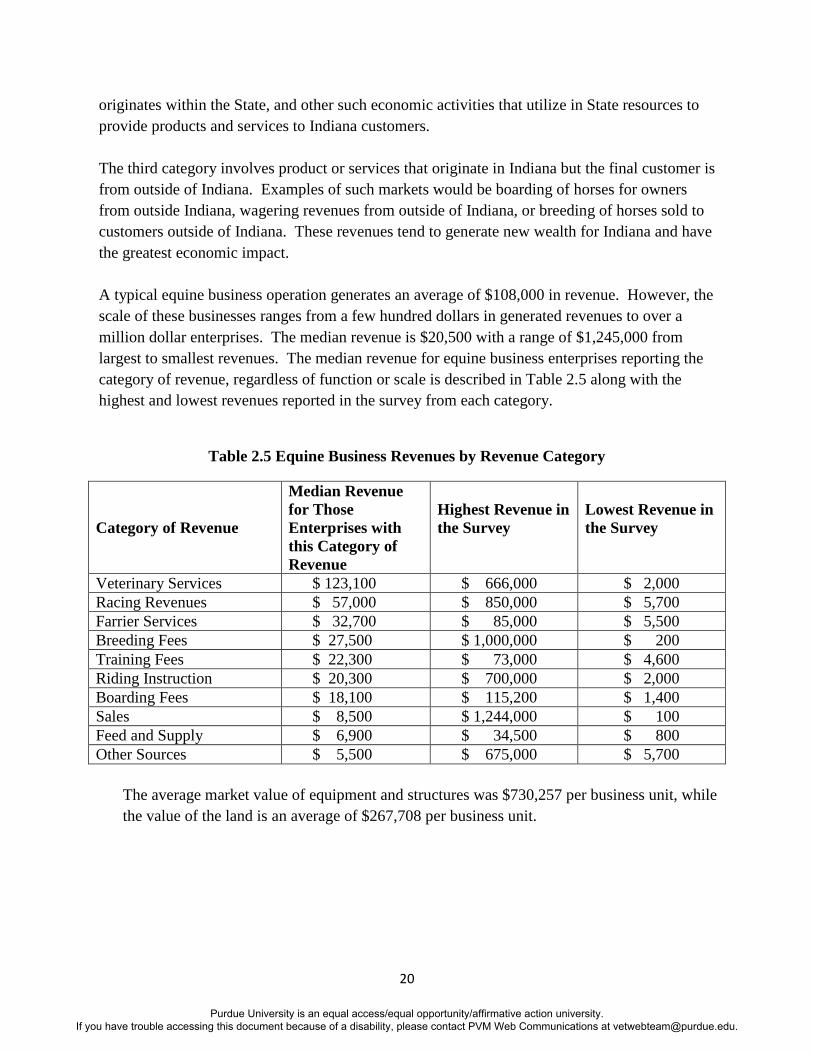
A typical equine business operation generates an average of $108,000 in revenue. However, the
scale of these businesses ranges from a few hundred dollars in generated revenues to over a
million dollar enterprises. The median revenue is $20,500 with a range of $1,245,000 from
largest to smallest revenues. The median revenue for equine business enterprises reporting the
category of revenue, regardless of function or scale is described in Table 2.5 along with the
highest and lowest revenues reported in the survey from each category.
Table 2.5 Equine Business Revenues by Revenue Category
Category of Revenue
Median Revenue
for Those
Enterprises with
this Category of
Revenue
Highest Revenue in
the Survey
Lowest Revenue in
the Survey
Veterinary Services $ 123,100 $ 666,000 $ 2,000
Racing Revenues $ 57,000 $ 850,000 $ 5,700
Farrier Services $ 32,700 $ 85,000 $ 5,500
Breeding Fees $ 27,500 $ 1,000,000 $ 200
Training Fees $ 22,300 $ 73,000 $ 4,600
Riding Instruction $ 20,300 $ 700,000 $ 2,000
Boarding Fees $ 18,100 $ 115,200 $ 1,400
Sales $ 8,500 $ 1,244,000 $ 100
Feed and Supply $ 6,900 $ 34,500 $ 800
Other Sources $ 5,500 $ 675,000 $ 5,700
The average market value of equipment and structures was $730,257 per business unit, while
the value of the land is an average of $267,708 per business unit.
Purdue University is an equal access/equal opportunity/affirmative action university. If you have trouble accessing this document because of a disability, please contact PVM Web Communications at [email protected].
21
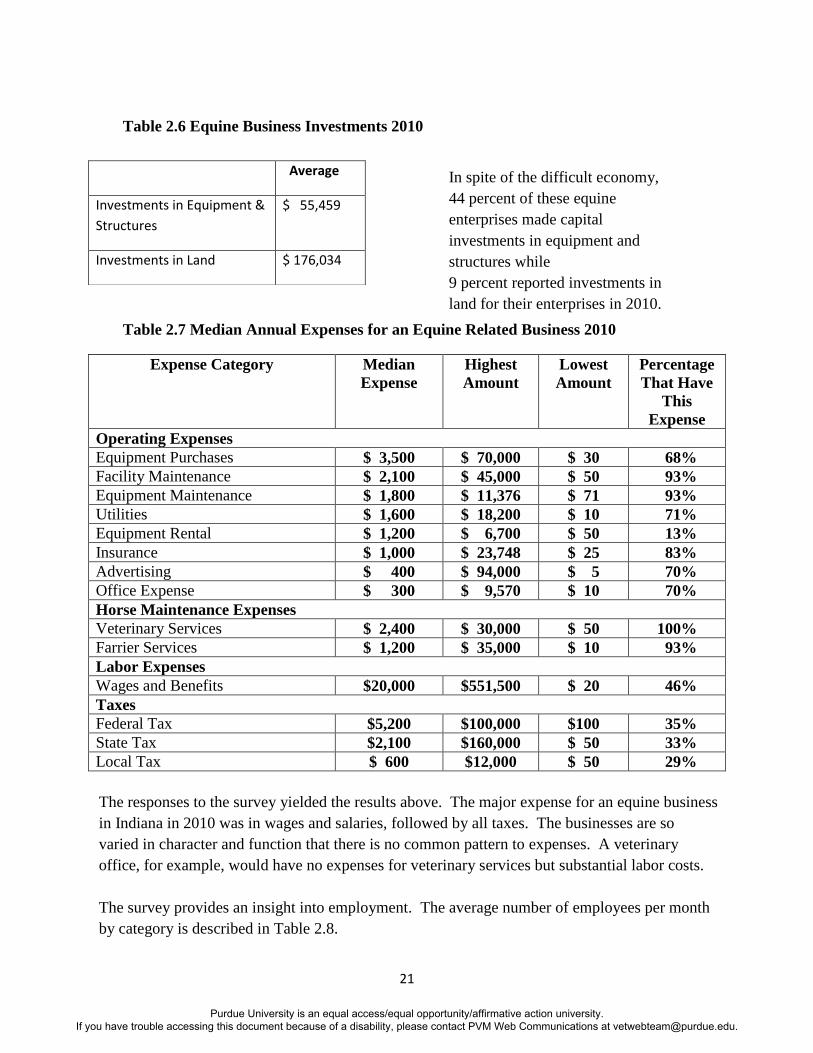
Table 2.6 Equine Business Investments 2010
Table 2.7 Median Annual Expenses for an Equine Related Business 2010
Expense Category Median
Expense
Highest
Amount
Lowest
Amount
Percentage
That Have
This
Expense
Operating Expenses
Equipment Purchases $ 3,500 $ 70,000 $ 30 68%
Facility Maintenance $ 2,100 $ 45,000 $ 50 93%
Equipment Maintenance $ 1,800 $ 11,376 $ 71 93%
Utilities $ 1,600 $ 18,200 $ 10 71%
Equipment Rental $ 1,200 $ 6,700 $ 50 13%
Insurance $ 1,000 $ 23,748 $ 25 83%
Advertising $ 400 $ 94,000 $ 5 70%
Office Expense $ 300 $ 9,570 $ 10 70%
Horse Maintenance Expenses
Veterinary Services $ 2,400 $ 30,000 $ 50 100%
Farrier Services $ 1,200 $ 35,000 $ 10 93%
Labor Expenses
Wages and Benefits $20,000 $551,500 $ 20 46%
Taxes
Federal Tax $5,200 $100,000 $100 35%
State Tax $2,100 $160,000 $ 50 33%
Local Tax $ 600 $12,000 $ 50 29%
The responses to the survey yielded the results above. The major expense for an equine business
in Indiana in 2010 was in wages and salaries, followed by all taxes. The businesses are so
varied in character and function that there is no common pattern to expenses. A veterinary
office, for example, would have no expenses for veterinary services but substantial labor costs.
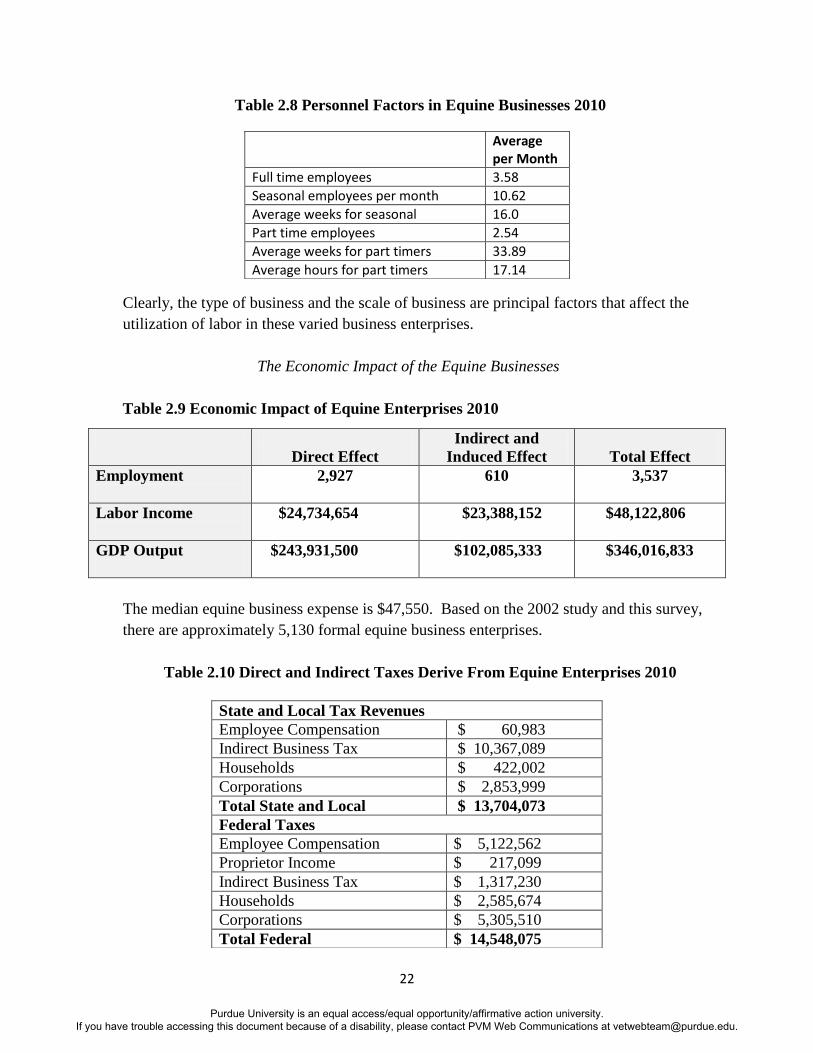
The survey provides an insight into employment. The average number of employees per month
by category is described in Table 2.8.
Average
Investments in Equipment &
Structures
$ 55,459
Investments in Land $ 176,034
In spite of the difficult economy,
44 percent of these equine
enterprises made capital
investments in equipment and
structures while
9 percent reported investments in
land for their enterprises in 2010.
Purdue University is an equal access/equal opportunity/affirmative action university. If you have trouble accessing this document because of a disability, please contact PVM Web Communications at [email protected].
22
Table 2.8 Personnel Factors in Equine Businesses 2010
Clearly, the type of business and the scale of business are principal factors that affect the
utilization of labor in these varied business enterprises.
The Economic Impact of the Equine Businesses
Table 2.9 Economic Impact of Equine Enterprises 2010
Direct Effect
Indirect and
Induced Effect
Total Effect
Employment
2,927 610 3,537
Labor Income
$24,734,654 $23,388,152 $48,122,806
GDP Output
$243,931,500 $102,085,333 $346,016,833
The median equine business expense is $47,550. Based on the 2002 study and this survey,
there are approximately 5,130 formal equine business enterprises.
Table 2.10 Direct and Indirect Taxes Derive From Equine Enterprises 2010
Average per Month
Full time employees 3.58
Seasonal employees per month 10.62
Average weeks for seasonal 16.0
Part time employees 2.54
Average weeks for part timers 33.89
Average hours for part timers 17.14
State and Local Tax Revenues
Employee Compensation $ 60,983
Indirect Business Tax $ 10,367,089
Households $ 422,002
Corporations $ 2,853,999
Total State and Local $ 13,704,073
Federal Taxes
Employee Compensation $ 5,122,562
Proprietor Income $ 217,099
Indirect Business Tax $ 1,317,230
Households $ 2,585,674
Corporations $ 5,305,510
Total Federal $ 14,548,075
Purdue University is an equal access/equal opportunity/affirmative action university. If you have trouble accessing this document because of a disability, please contact PVM Web Communications at [email protected].
23
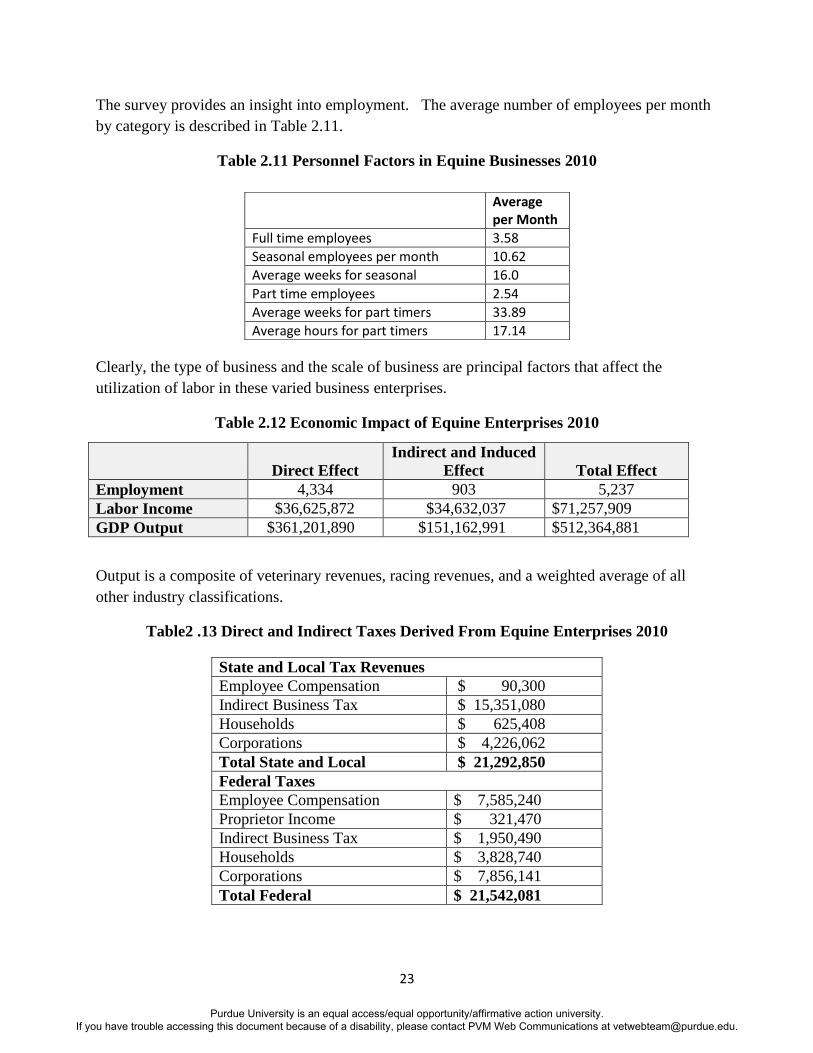
The survey provides an insight into employment. The average number of employees per month
by category is described in Table 2.11.
Table 2.11 Personnel Factors in Equine Businesses 2010
Clearly, the type of business and the scale of business are principal factors that affect the
utilization of labor in these varied business enterprises.
Table 2.12 Economic Impact of Equine Enterprises 2010
Direct Effect
Indirect and Induced
Effect
Total Effect
Employment 4,334 903 5,237
Labor Income $36,625,872 $34,632,037 $71,257,909
GDP Output $361,201,890 $151,162,991 $512,364,881
Output is a composite of veterinary revenues, racing revenues, and a weighted average of all
other industry classifications.
Table2 .13 Direct and Indirect Taxes Derived From Equine Enterprises 2010
Average per Month
Full time employees 3.58
Seasonal employees per month 10.62
Average weeks for seasonal 16.0
Part time employees 2.54
Average weeks for part timers 33.89
Average hours for part timers 17.14
State and Local Tax Revenues
Employee Compensation $ 90,300
Indirect Business Tax $ 15,351,080
Households $ 625,408
Corporations $ 4,226,062
Total State and Local $ 21,292,850
Federal Taxes
Employee Compensation $ 7,585,240
Proprietor Income $ 321,470
Indirect Business Tax $ 1,950,490
Households $ 3,828,740
Corporations $ 7,856,141
Total Federal $ 21,542,081
Purdue University is an equal access/equal opportunity/affirmative action university. If you have trouble accessing this document because of a disability, please contact PVM Web Communications at [email protected].
24
Indiana Equine Owners
The vast majority of horses are privately held and many of the owners do not consider
themselves as formal business enterprises. However, the activities of the owners represent a
significant economic impact generating revenues and incurring expenses. The primary purpose
for raising and maintaining horses according to the survey is 60.4% for recreation, 25.6% for
competition, 7.2% for racing, 1.8% for work and 5.0% for other uses.
Regarding horse ownership, 97.9% of the horses are owned entirely by one party while the
remaining are owned by several parties. It was found that 75.7% boarded their horses rather
than maintaining them on their own property.
Most of these horses are housed in Indiana (98.2%), while a small percentage were reportedly
housed outside the state, primarily in Ohio , Illinois, Kentucky, and Michigan (1.6%).
The number of operations reporting horses makes it difficult to detail accurately the distribution
of horses throughout the State. It is assumed that the pattern, as well as the number, has not
changed significantly since the 2002 survey of equine in the State. In this sample, the operations
with horses identified were in 76 of the 92 counties.
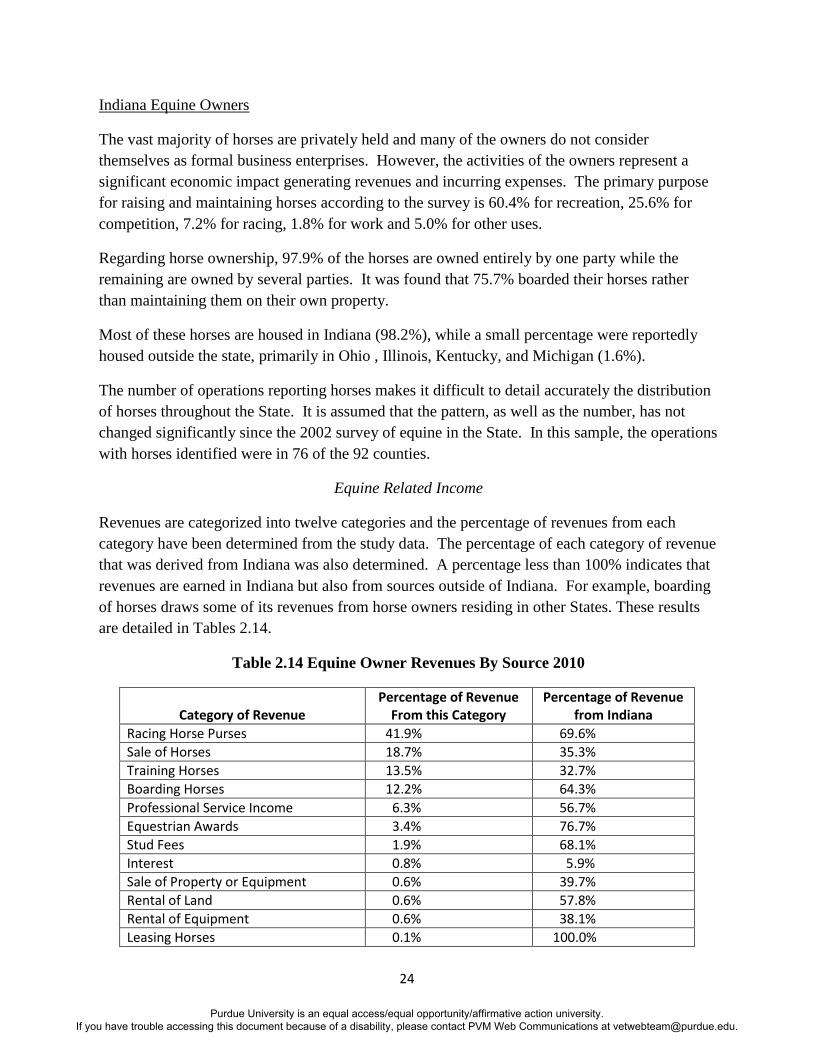
Equine Related Income
Revenues are categorized into twelve categories and the percentage of revenues from each
category have been determined from the study data. The percentage of each category of revenue
that was derived from Indiana was also determined. A percentage less than 100% indicates that
revenues are earned in Indiana but also from sources outside of Indiana. For example, boarding
of horses draws some of its revenues from horse owners residing in other States. These results
are detailed in Tables 2.14.
Table 2.14 Equine Owner Revenues By Source 2010
Category of Revenue
Percentage of Revenue From this Category
Percentage of Revenue from Indiana
Racing Horse Purses 41.9% 69.6%
Sale of Horses 18.7% 35.3%
Training Horses 13.5% 32.7%
Boarding Horses 12.2% 64.3%
Professional Service Income 6.3% 56.7%
Equestrian Awards 3.4% 76.7%
Stud Fees 1.9% 68.1%
Interest 0.8% 5.9%
Sale of Property or Equipment 0.6% 39.7%
Rental of Land 0.6% 57.8%
Rental of Equipment 0.6% 38.1%
Leasing Horses 0.1% 100.0%
Purdue University is an equal access/equal opportunity/affirmative action university. If you have trouble accessing this document because of a disability, please contact PVM Web Communications at [email protected].
25
Racing purses are a primary source of revenue for those deriving revenue from horses.
Leasing of horses, rental of land or equipment and interest income are relatively insignificant in
the overall revenue picture. In many categories, equine owners that engage in economic
activities extract a significant part of revenue from sources that reside outside of Indiana,
particularly in the sale of horses, the training of horses, and the sale of equipment.
A significant part of reported revenues for sale of horses, boarding of horses and training of
horses, which are three of the more substantial revenue categories, occur from sources outside of
Indiana. This suggests that a significant number of the formal equine business enterprises are
providing services for out-of-state horse owners.
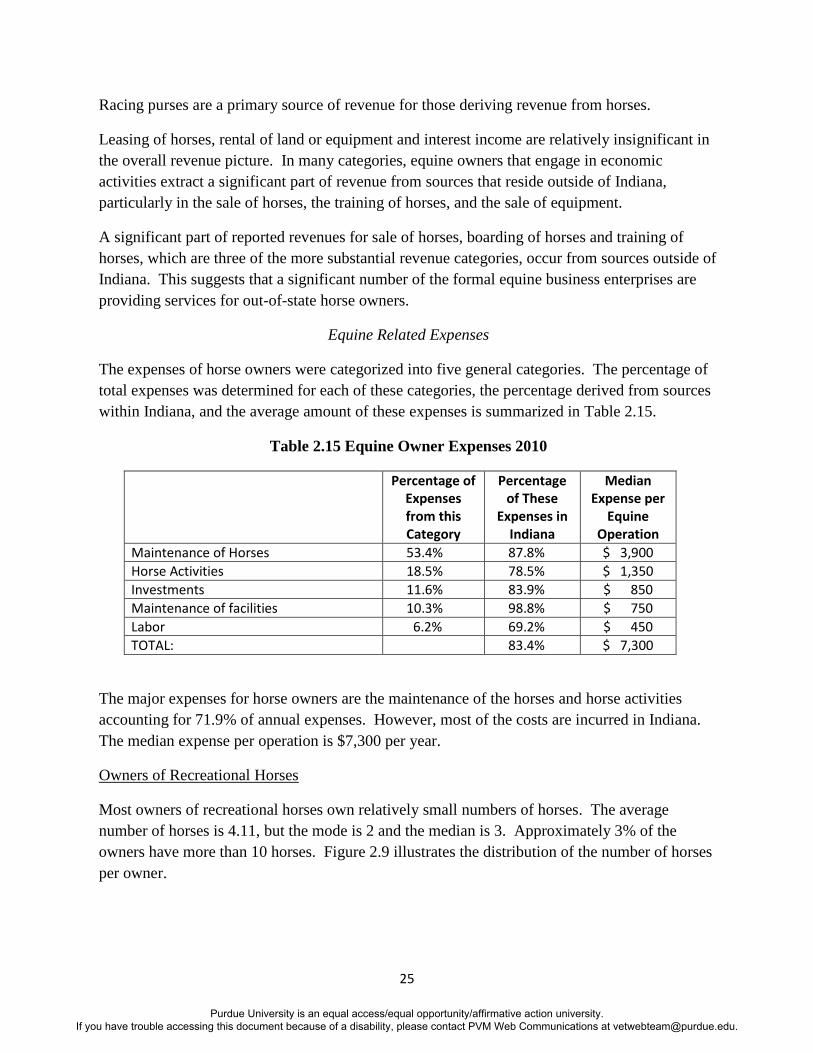
Equine Related Expenses
The expenses of horse owners were categorized into five general categories. The percentage of
total expenses was determined for each of these categories, the percentage derived from sources
within Indiana, and the average amount of these expenses is summarized in Table 2.15.
Table 2.15 Equine Owner Expenses 2010
Percentage of Expenses from this Category
Percentage of These
Expenses in Indiana
Median Expense per
Equine Operation
Maintenance of Horses 53.4% 87.8% $ 3,900
Horse Activities 18.5% 78.5% $ 1,350
Investments 11.6% 83.9% $ 850
Maintenance of facilities 10.3% 98.8% $ 750
Labor 6.2% 69.2% $ 450
TOTAL: 83.4% $ 7,300
The major expenses for horse owners are the maintenance of the horses and horse activities
accounting for 71.9% of annual expenses. However, most of the costs are incurred in Indiana.
The median expense per operation is $7,300 per year.
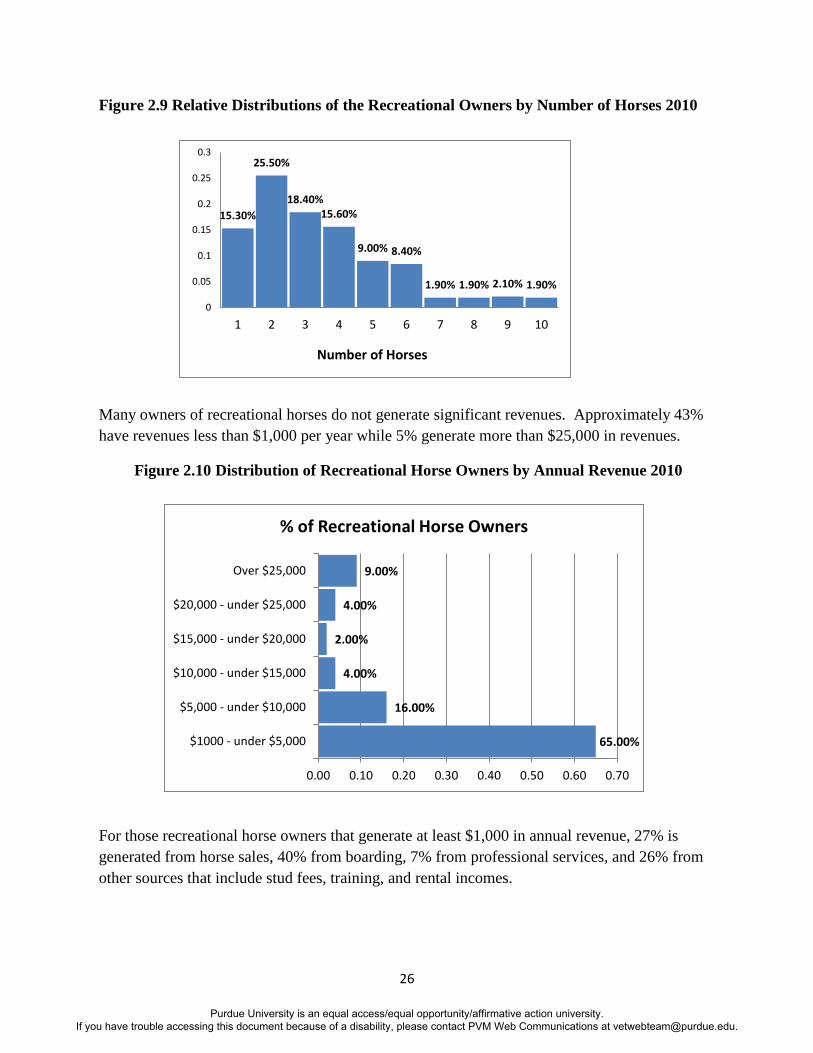
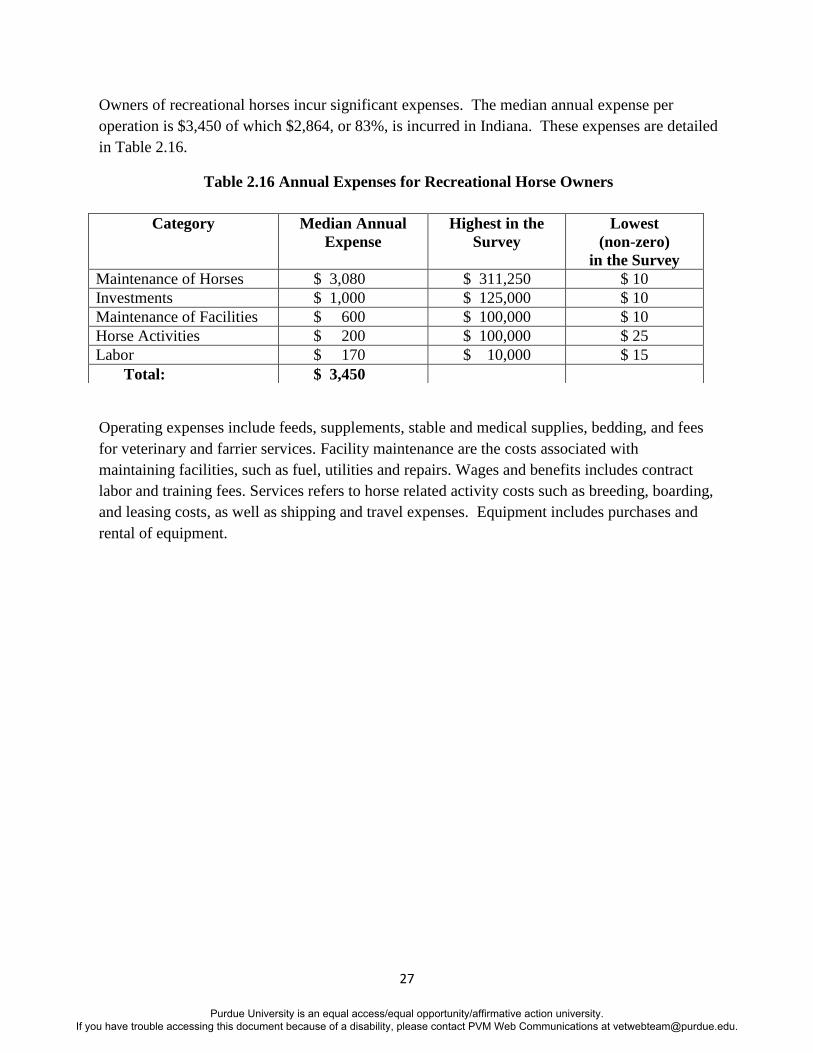
Owners of Recreational Horses
Most owners of recreational horses own relatively small numbers of horses. The average
number of horses is 4.11, but the mode is 2 and the median is 3. Approximately 3% of the
owners have more than 10 horses. Figure 2.9 illustrates the distribution of the number of horses
per owner.
Purdue University is an equal access/equal opportunity/affirmative action university. If you have trouble accessing this document because of a disability, please contact PVM Web Communications at [email protected].
26
Figure 2.9 Relative Distributions of the Recreational Owners by Number of Horses 2010
Many owners of recreational horses do not generate significant revenues. Approximately 43%
have revenues less than $1,000 per year while 5% generate more than $25,000 in revenues.
Figure 2.10 Distribution of Recreational Horse Owners by Annual Revenue 2010
For those recreational horse owners that generate at least $1,000 in annual revenue, 27% is
generated from horse sales, 40% from boarding, 7% from professional services, and 26% from
other sources that include stud fees, training, and rental incomes.
15.30%
25.50%
18.40% 15.60%
9.00% 8.40%
1.90% 1.90% 2.10% 1.90%
0
0.05
0.1
0.15
0.2
0.25
0.3
1 2 3 4 5 6 7 8 9 10
Number of Horses
65.00%
16.00%
4.00%
2.00%
4.00%
9.00%
0.00 0.10 0.20 0.30 0.40 0.50 0.60 0.70
$1000 - under $5,000
$5,000 - under $10,000
$10,000 - under $15,000
$15,000 - under $20,000
$20,000 - under $25,000
Over $25,000
% of Recreational Horse Owners
Purdue University is an equal access/equal opportunity/affirmative action university. If you have trouble accessing this document because of a disability, please contact PVM Web Communications at [email protected].
27
Owners of recreational horses incur significant expenses. The median annual expense per
operation is $3,450 of which $2,864, or 83%, is incurred in Indiana. These expenses are detailed
in Table 2.16.
Table 2.16 Annual Expenses for Recreational Horse Owners
Operating expenses include feeds, supplements, stable and medical supplies, bedding, and fees
for veterinary and farrier services. Facility maintenance are the costs associated with
maintaining facilities, such as fuel, utilities and repairs. Wages and benefits includes contract
labor and training fees. Services refers to horse related activity costs such as breeding, boarding,
and leasing costs, as well as shipping and travel expenses. Equipment includes purchases and
rental of equipment.
Category Median Annual
Expense
Highest in the
Survey
Lowest
(non-zero)
in the Survey
Maintenance of Horses $ 3,080 $ 311,250 $ 10
Investments $ 1,000 $ 125,000 $ 10
Maintenance of Facilities $ 600 $ 100,000 $ 10
Horse Activities $ 200 $ 100,000 $ 25
Labor $ 170 $ 10,000 $ 15
Total: $ 3,450
Purdue University is an equal access/equal opportunity/affirmative action university. If you have trouble accessing this document because of a disability, please contact PVM Web Communications at [email protected].
28
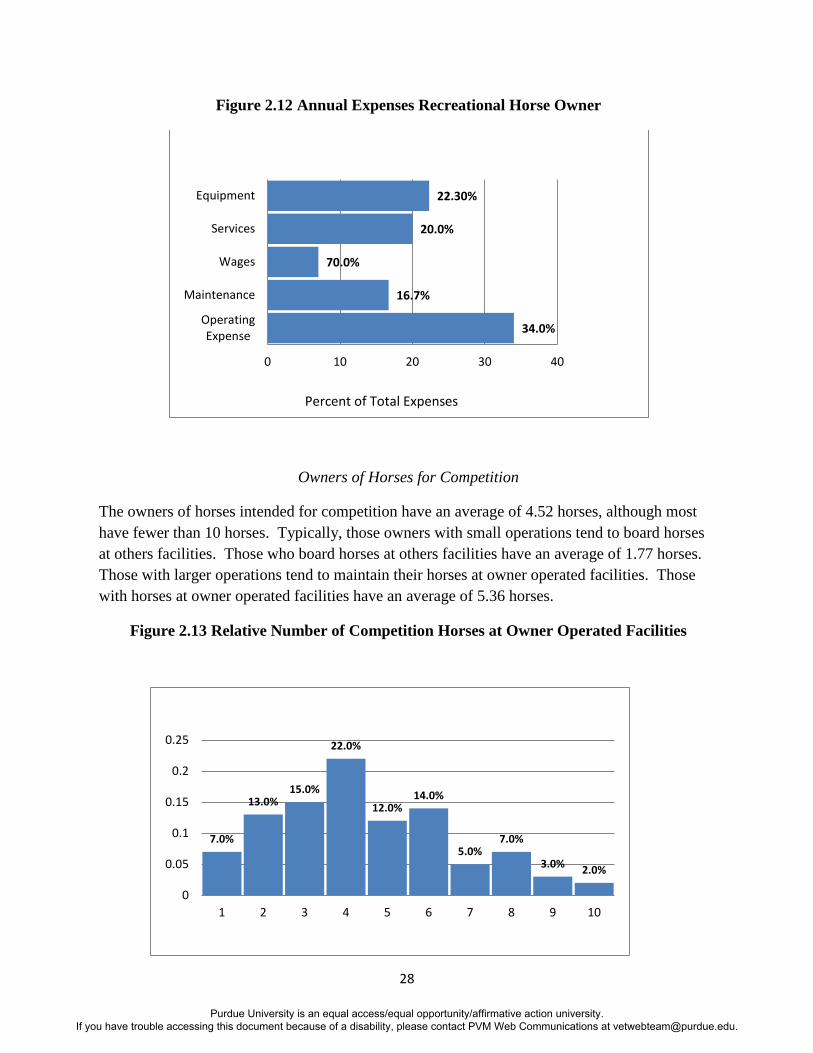
Figure 2.12 Annual Expenses Recreational Horse Owner
Owners of Horses for Competition
The owners of horses intended for competition have an average of 4.52 horses, although most
have fewer than 10 horses. Typically, those owners with small operations tend to board horses
at others facilities. Those who board horses at others facilities have an average of 1.77 horses.
Those with larger operations tend to maintain their horses at owner operated facilities. Those
with horses at owner operated facilities have an average of 5.36 horses.
Figure 2.13 Relative Number of Competition Horses at Owner Operated Facilities
34.0%
16.7%
70.0%
20.0%
22.30%
0 10 20 30 40
OperatingExpense
Maintenance
Wages
Services
Equipment
7.0%
13.0% 15.0%
22.0%
12.0% 14.0%
5.0% 7.0%
3.0% 2.0%
0
0.05
0.1
0.15
0.2
0.25
1 2 3 4 5 6 7 8 9 10
Percent of Total Expenses
Purdue University is an equal access/equal opportunity/affirmative action university. If you have trouble accessing this document because of a disability, please contact PVM Web Communications at [email protected].
29
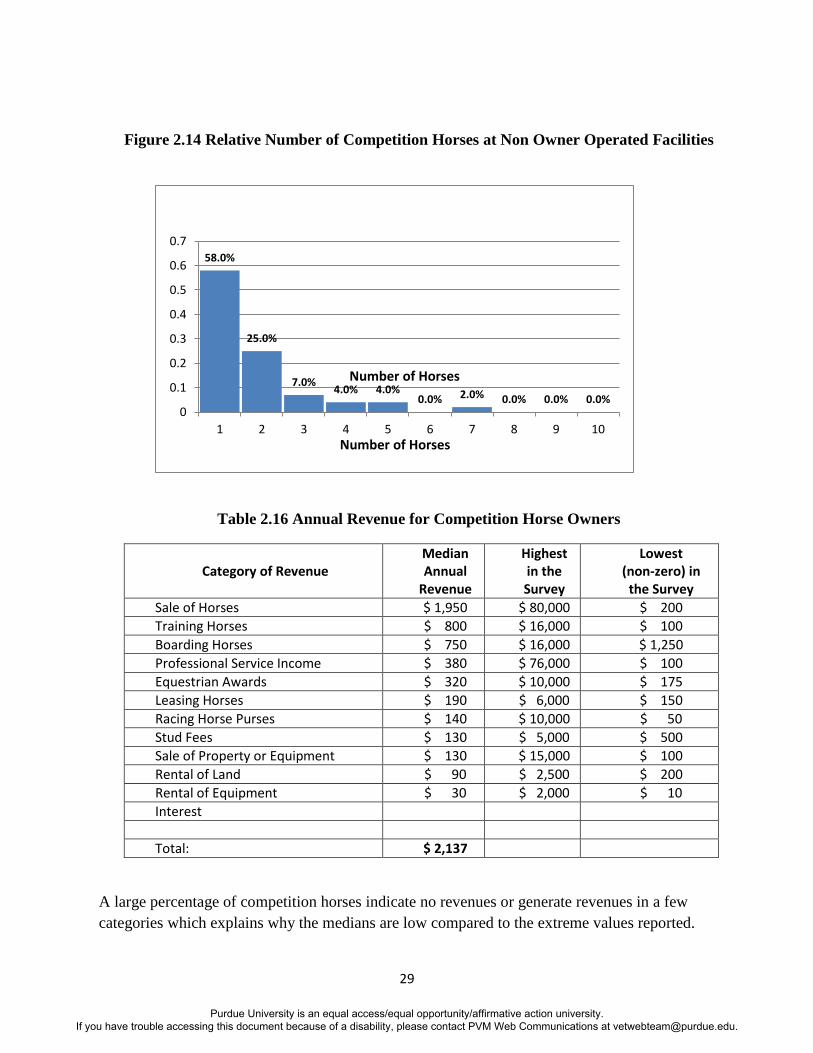
Figure 2.14 Relative Number of Competition Horses at Non Owner Operated Facilities
Table 2.16 Annual Revenue for Competition Horse Owners
Category of Revenue
Median Annual
Revenue
Highest in the Survey
Lowest (non-zero) in
the Survey
Sale of Horses $ 1,950 $ 80,000 $ 200
Training Horses $ 800 $ 16,000 $ 100
Boarding Horses $ 750 $ 16,000 $ 1,250
Professional Service Income $ 380 $ 76,000 $ 100
Equestrian Awards $ 320 $ 10,000 $ 175
Leasing Horses $ 190 $ 6,000 $ 150
Racing Horse Purses $ 140 $ 10,000 $ 50
Stud Fees $ 130 $ 5,000 $ 500
Sale of Property or Equipment $ 130 $ 15,000 $ 100
Rental of Land $ 90 $ 2,500 $ 200
Rental of Equipment $ 30 $ 2,000 $ 10
Interest
Total: $ 2,137
A large percentage of competition horses indicate no revenues or generate revenues in a few
categories which explains why the medians are low compared to the extreme values reported.
58.0%
25.0%
7.0% 4.0% 4.0%
0.0% 2.0% 0.0% 0.0% 0.0% 0
0.1
0.2
0.3
0.4
0.5
0.6
0.7
1 2 3 4 5 6 7 8 9 10Number of Horses
Number of Horses
Purdue University is an equal access/equal opportunity/affirmative action university. If you have trouble accessing this document because of a disability, please contact PVM Web Communications at [email protected].
30
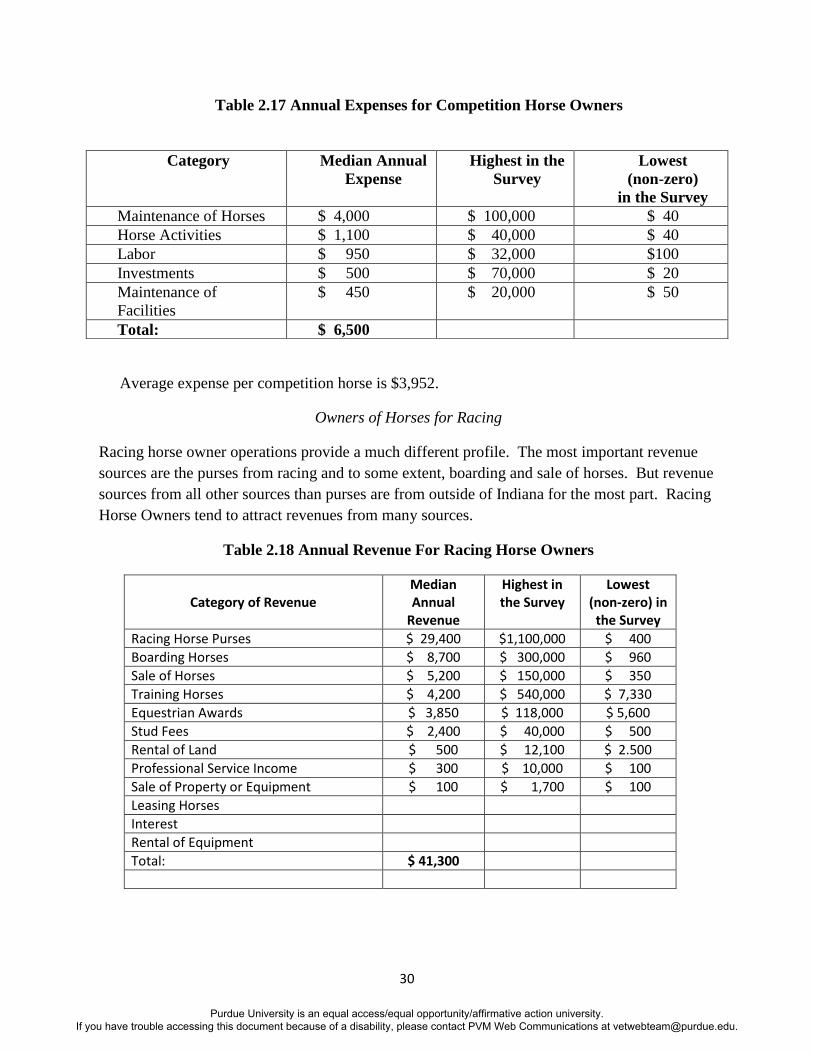
Table 2.17 Annual Expenses for Competition Horse Owners
Average expense per competition horse is $3,952.
Owners of Horses for Racing
Racing horse owner operations provide a much different profile. The most important revenue
sources are the purses from racing and to some extent, boarding and sale of horses. But revenue
sources from all other sources than purses are from outside of Indiana for the most part. Racing
Horse Owners tend to attract revenues from many sources.
Table 2.18 Annual Revenue For Racing Horse Owners
Category of Revenue
Median Annual
Revenue
Highest in the Survey
Lowest (non-zero) in
the Survey
Racing Horse Purses $ 29,400 $1,100,000 $ 400
Boarding Horses $ 8,700 $ 300,000 $ 960
Sale of Horses $ 5,200 $ 150,000 $ 350
Training Horses $ 4,200 $ 540,000 $ 7,330
Equestrian Awards $ 3,850 $ 118,000 $ 5,600
Stud Fees $ 2,400 $ 40,000 $ 500
Rental of Land $ 500 $ 12,100 $ 2.500
Professional Service Income $ 300 $ 10,000 $ 100
Sale of Property or Equipment $ 100 $ 1,700 $ 100
Leasing Horses
Interest
Rental of Equipment
Total: $ 41,300
Category Median Annual
Expense
Highest in the
Survey
Lowest
(non-zero)
in the Survey
Maintenance of Horses $ 4,000 $ 100,000 $ 40
Horse Activities $ 1,100 $ 40,000 $ 40
Labor $ 950 $ 32,000 $100
Investments $ 500 $ 70,000 $ 20
Maintenance of
Facilities
$ 450 $ 20,000 $ 50
Total: $ 6,500
Purdue University is an equal access/equal opportunity/affirmative action university. If you have trouble accessing this document because of a disability, please contact PVM Web Communications at [email protected].
31
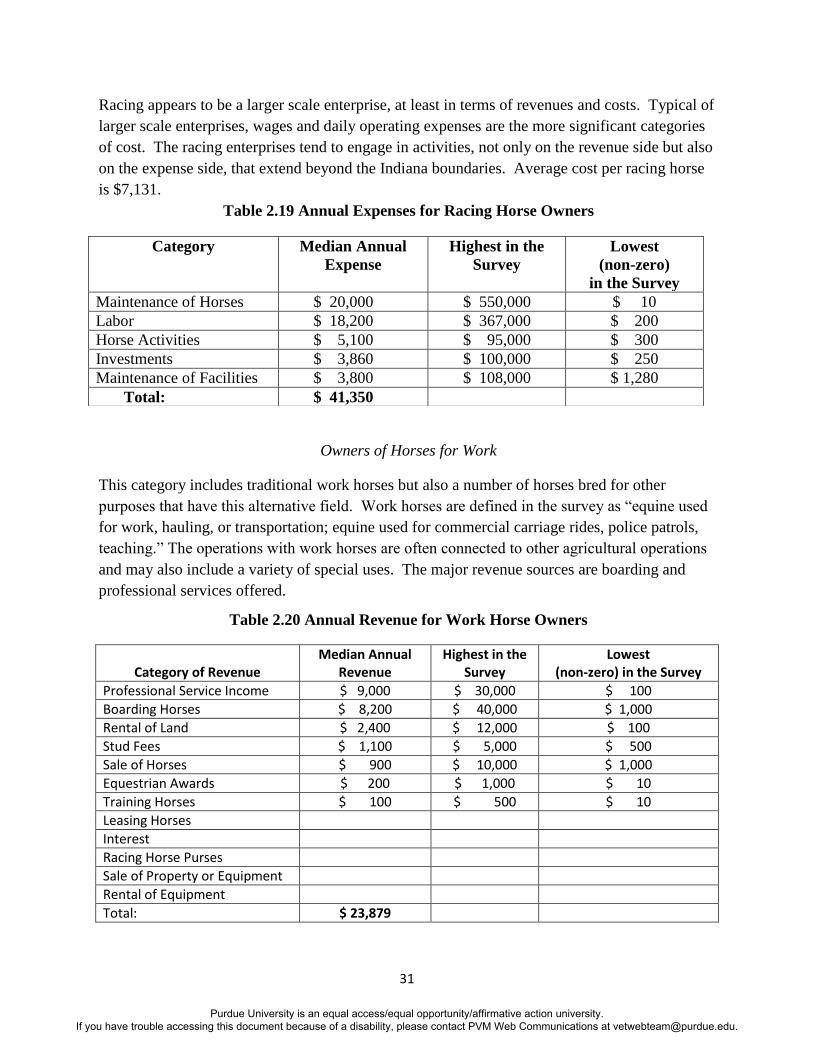
Racing appears to be a larger scale enterprise, at least in terms of revenues and costs. Typical of
larger scale enterprises, wages and daily operating expenses are the more significant categories
of cost. The racing enterprises tend to engage in activities, not only on the revenue side but also
on the expense side, that extend beyond the Indiana boundaries. Average cost per racing horse
is $7,131.
Table 2.19 Annual Expenses for Racing Horse Owners
Owners of Horses for Work
This category includes traditional work horses but also a number of horses bred for other
purposes that have this alternative field. Work horses are defined in the survey as “equine used
for work, hauling, or transportation; equine used for commercial carriage rides, police patrols,
teaching.” The operations with work horses are often connected to other agricultural operations
and may also include a variety of special uses. The major revenue sources are boarding and
professional services offered.
Table 2.20 Annual Revenue for Work Horse Owners
Category of Revenue
Median Annual Revenue
Highest in the Survey
Lowest (non-zero) in the Survey
Professional Service Income $ 9,000 $ 30,000 $ 100
Boarding Horses $ 8,200 $ 40,000 $ 1,000
Rental of Land $ 2,400 $ 12,000 $ 100
Stud Fees $ 1,100 $ 5,000 $ 500
Sale of Horses $ 900 $ 10,000 $ 1,000
Equestrian Awards $ 200 $ 1,000 $ 10
Training Horses $ 100 $ 500 $ 10
Leasing Horses
Interest
Racing Horse Purses
Sale of Property or Equipment
Rental of Equipment
Total: $ 23,879
Category Median Annual
Expense
Highest in the
Survey
Lowest
(non-zero)
in the Survey
Maintenance of Horses $ 20,000 $ 550,000 $ 10
Labor $ 18,200 $ 367,000 $ 200
Horse Activities $ 5,100 $ 95,000 $ 300
Investments $ 3,860 $ 100,000 $ 250
Maintenance of Facilities $ 3,800 $ 108,000 $ 1,280
Total: $ 41,350
Purdue University is an equal access/equal opportunity/affirmative action university. If you have trouble accessing this document because of a disability, please contact PVM Web Communications at [email protected].
32
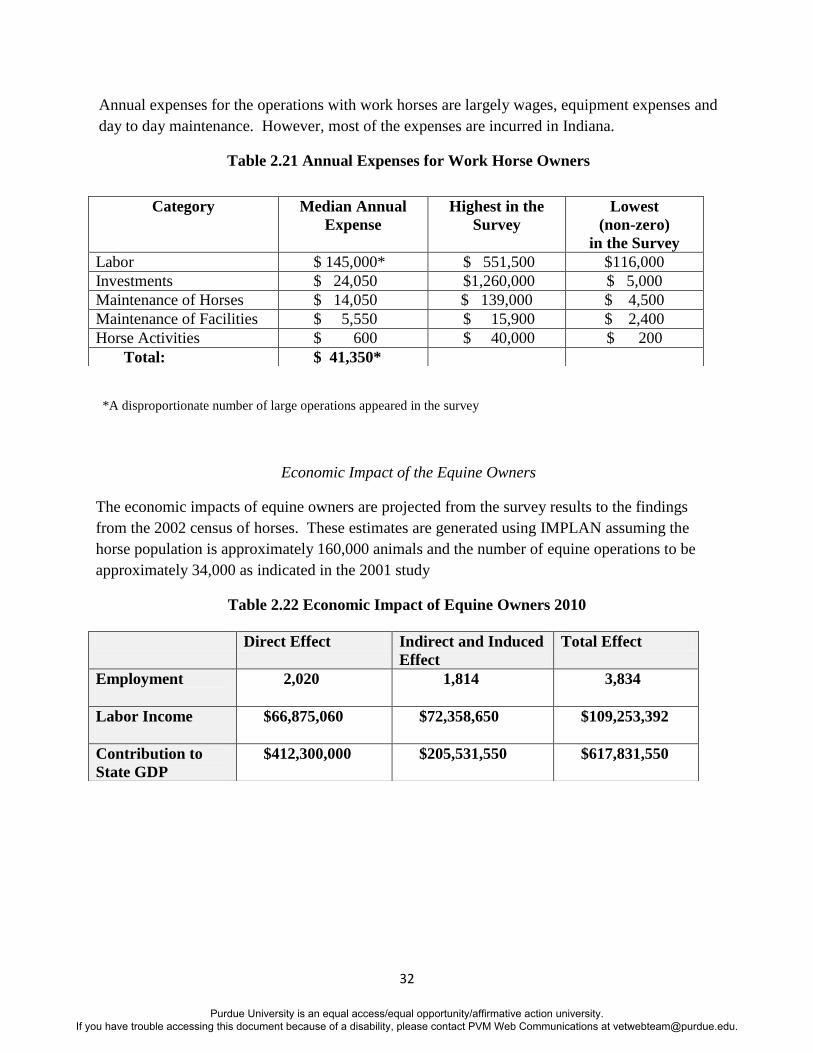
Annual expenses for the operations with work horses are largely wages, equipment expenses and
day to day maintenance. However, most of the expenses are incurred in Indiana.
Table 2.21 Annual Expenses for Work Horse Owners
*A disproportionate number of large operations appeared in the survey
Economic Impact of the Equine Owners
The economic impacts of equine owners are projected from the survey results to the findings
from the 2002 census of horses. These estimates are generated using IMPLAN assuming the
horse population is approximately 160,000 animals and the number of equine operations to be
approximately 34,000 as indicated in the 2001 study
Table 2.22 Economic Impact of Equine Owners 2010
Category Median Annual
Expense
Highest in the
Survey
Lowest
(non-zero)
in the Survey
Labor $ 145,000* $ 551,500 $116,000
Investments $ 24,050 $1,260,000 $ 5,000
Maintenance of Horses $ 14,050 $ 139,000 $ 4,500
Maintenance of Facilities $ 5,550 $ 15,900 $ 2,400
Horse Activities $ 600 $ 40,000 $ 200
Total: $ 41,350*
Direct Effect Indirect and Induced
Effect
Total Effect
Employment
2,020 1,814 3,834
Labor Income
$66,875,060 $72,358,650 $109,253,392
Contribution to
State GDP
$412,300,000 $205,531,550 $617,831,550
Purdue University is an equal access/equal opportunity/affirmative action university. If you have trouble accessing this document because of a disability, please contact PVM Web Communications at [email protected].
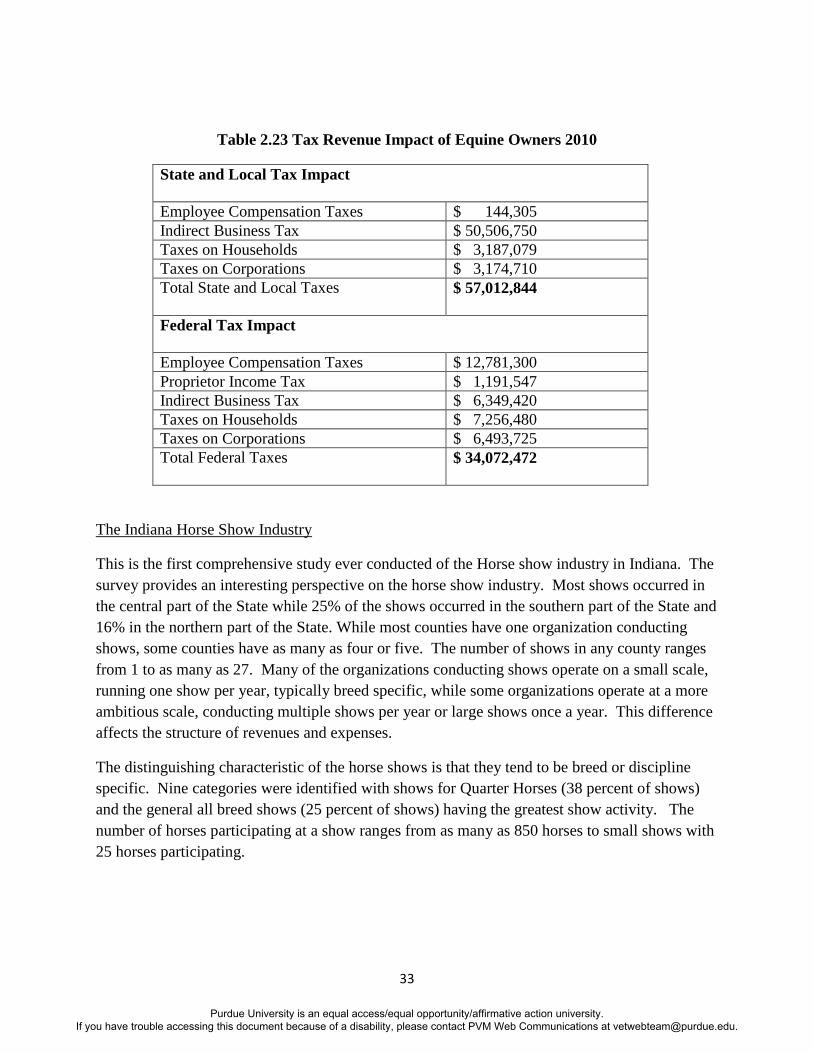
33
Table 2.23 Tax Revenue Impact of Equine Owners 2010
State and Local Tax Impact
Employee Compensation Taxes $ 144,305
Indirect Business Tax $ 50,506,750
Taxes on Households $ 3,187,079
Taxes on Corporations $ 3,174,710
Total State and Local Taxes
$ 57,012,844
Federal Tax Impact
Employee Compensation Taxes $ 12,781,300
Proprietor Income Tax $ 1,191,547
Indirect Business Tax $ 6,349,420
Taxes on Households $ 7,256,480
Taxes on Corporations $ 6,493,725
Total Federal Taxes
$ 34,072,472
The Indiana Horse Show Industry
This is the first comprehensive study ever conducted of the Horse show industry in Indiana. The
survey provides an interesting perspective on the horse show industry. Most shows occurred in
the central part of the State while 25% of the shows occurred in the southern part of the State and
16% in the northern part of the State. While most counties have one organization conducting
shows, some counties have as many as four or five. The number of shows in any county ranges
from 1 to as many as 27. Many of the organizations conducting shows operate on a small scale,
running one show per year, typically breed specific, while some organizations operate at a more
ambitious scale, conducting multiple shows per year or large shows once a year. This difference
affects the structure of revenues and expenses.
The distinguishing characteristic of the horse shows is that they tend to be breed or discipline
specific. Nine categories were identified with shows for Quarter Horses (38 percent of shows)
and the general all breed shows (25 percent of shows) having the greatest show activity. The
number of horses participating at a show ranges from as many as 850 horses to small shows with
25 horses participating.
Purdue University is an equal access/equal opportunity/affirmative action university. If you have trouble accessing this document because of a disability, please contact PVM Web Communications at [email protected].

34
Table 2.24 Horse Shows by Breed or Purpose
Breed
Percentage of
Shows
Percentage of
Horses
Participating
Quarter Horses 39 51
All Breeds 30 15
Thoroughbreds 13 9
Saddlebreds 6 4
Barrel Racing 5 2
Warmbloods 4 14
Reining 2 4
Appaloosas 1 1
The average number of horses participating in a show is 88.87 horses per show with a range of
825.
Table 2.25 Relative Distribution of Horse Shows by Number of Horses Participating
These shows generate revenues. Some attract sponsorship and 45.6% indicate that there is
financial sponsorship with an average of $14,070 per sponsored operation and an average of
$5,081 per sponsored show. The amounts show substantial variation as the range of sponsorship
was $134,828.
Number of Horses Participating Percentage of Shows
Under 100 horses 38%
100 to 300 horses 38%
300 to 500 horses 14%
500 or more horses 10%
Purdue University is an equal access/equal opportunity/affirmative action university. If you have trouble accessing this document because of a disability, please contact PVM Web Communications at [email protected].
35
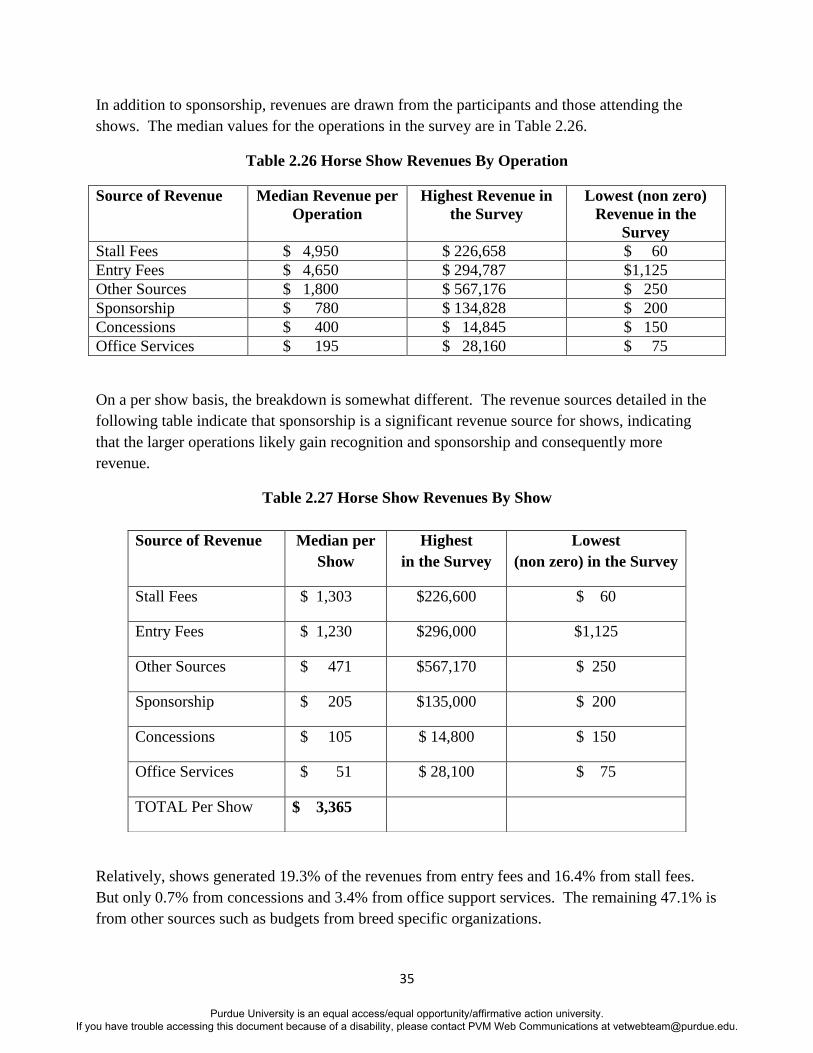
In addition to sponsorship, revenues are drawn from the participants and those attending the
shows. The median values for the operations in the survey are in Table 2.26.
Table 2.26 Horse Show Revenues By Operation
Source of Revenue Median Revenue per
Operation
Highest Revenue in
the Survey
Lowest (non zero)
Revenue in the
Survey
Stall Fees $ 4,950 $ 226,658 $ 60
Entry Fees $ 4,650 $ 294,787 $1,125
Other Sources $ 1,800 $ 567,176 $ 250
Sponsorship $ 780 $ 134,828 $ 200
Concessions $ 400 $ 14,845 $ 150
Office Services $ 195 $ 28,160 $ 75
On a per show basis, the breakdown is somewhat different. The revenue sources detailed in the
following table indicate that sponsorship is a significant revenue source for shows, indicating
that the larger operations likely gain recognition and sponsorship and consequently more
revenue.
Table 2.27 Horse Show Revenues By Show
Relatively, shows generated 19.3% of the revenues from entry fees and 16.4% from stall fees.
But only 0.7% from concessions and 3.4% from office support services. The remaining 47.1% is
from other sources such as budgets from breed specific organizations.
Source of Revenue Median per
Show
Highest
in the Survey
Lowest
(non zero) in the Survey
Stall Fees $ 1,303 $226,600 $ 60
Entry Fees $ 1,230 $296,000 $1,125
Other Sources $ 471 $567,170 $ 250
Sponsorship $ 205 $135,000 $ 200
Concessions $ 105 $ 14,800 $ 150
Office Services $ 51 $ 28,100 $ 75
TOTAL Per Show $ 3,365
Purdue University is an equal access/equal opportunity/affirmative action university. If you have trouble accessing this document because of a disability, please contact PVM Web Communications at [email protected].
36
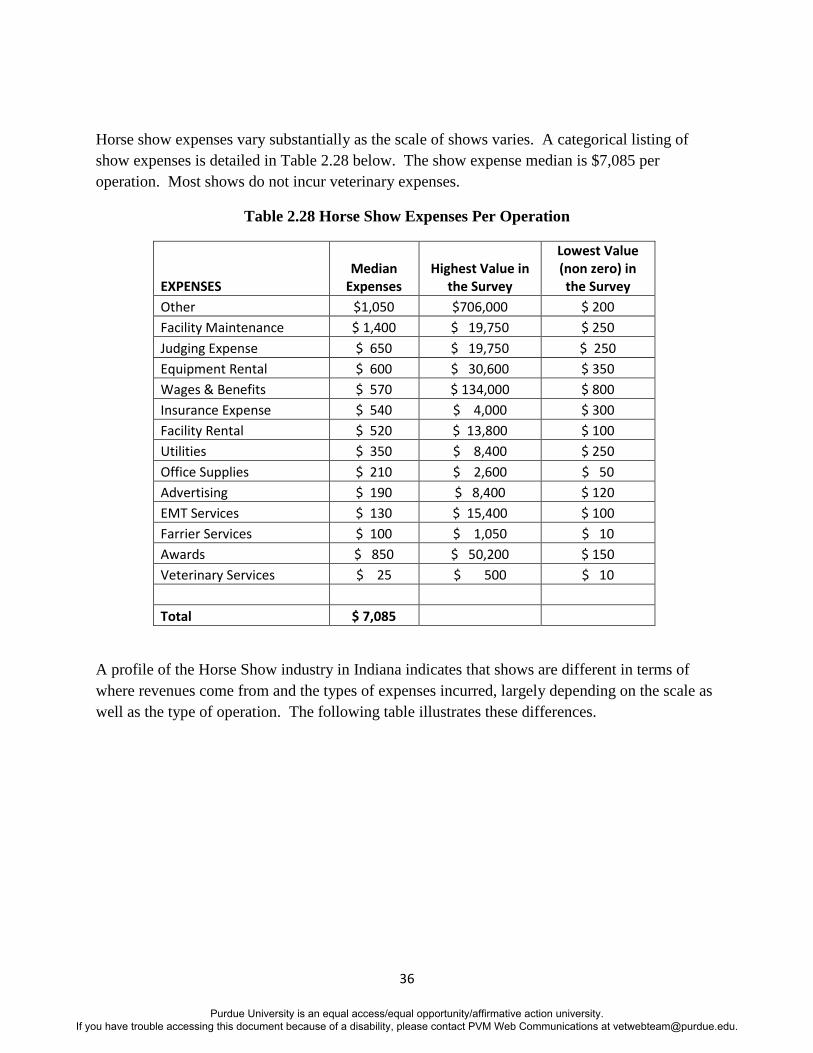
Horse show expenses vary substantially as the scale of shows varies. A categorical listing of
show expenses is detailed in Table 2.28 below. The show expense median is $7,085 per
operation. Most shows do not incur veterinary expenses.
Table 2.28 Horse Show Expenses Per Operation
EXPENSES Median
Expenses Highest Value in
the Survey
Lowest Value (non zero) in the Survey
Other $1,050 $706,000 $ 200
Facility Maintenance $ 1,400 $ 19,750 $ 250
Judging Expense $ 650 $ 19,750 $ 250
Equipment Rental $ 600 $ 30,600 $ 350
Wages & Benefits $ 570 $ 134,000 $ 800
Insurance Expense $ 540 $ 4,000 $ 300
Facility Rental $ 520 $ 13,800 $ 100
Utilities $ 350 $ 8,400 $ 250
Office Supplies $ 210 $ 2,600 $ 50
Advertising $ 190 $ 8,400 $ 120
EMT Services $ 130 $ 15,400 $ 100
Farrier Services $ 100 $ 1,050 $ 10
Awards $ 850 $ 50,200 $ 150
Veterinary Services $ 25 $ 500 $ 10
Total $ 7,085
A profile of the Horse Show industry in Indiana indicates that shows are different in terms of
where revenues come from and the types of expenses incurred, largely depending on the scale as
well as the type of operation. The following table illustrates these differences.
Purdue University is an equal access/equal opportunity/affirmative action university. If you have trouble accessing this document because of a disability, please contact PVM Web Communications at [email protected].
37
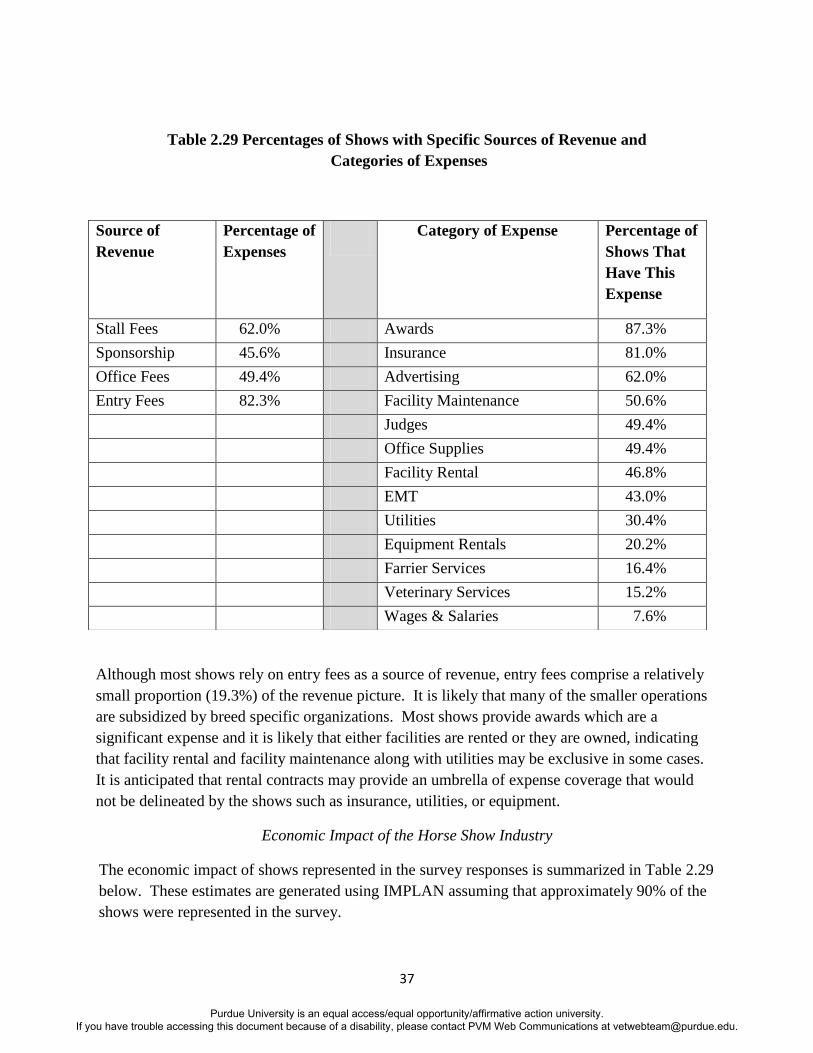
Table 2.29 Percentages of Shows with Specific Sources of Revenue and
Categories of Expenses
Although most shows rely on entry fees as a source of revenue, entry fees comprise a relatively
small proportion (19.3%) of the revenue picture. It is likely that many of the smaller operations
are subsidized by breed specific organizations. Most shows provide awards which are a
significant expense and it is likely that either facilities are rented or they are owned, indicating
that facility rental and facility maintenance along with utilities may be exclusive in some cases.
It is anticipated that rental contracts may provide an umbrella of expense coverage that would
not be delineated by the shows such as insurance, utilities, or equipment.
Economic Impact of the Horse Show Industry
The economic impact of shows represented in the survey responses is summarized in Table 2.29
below. These estimates are generated using IMPLAN assuming that approximately 90% of the
shows were represented in the survey.
Source of
Revenue
Percentage of
Expenses
Category of Expense Percentage of
Shows That
Have This
Expense
Stall Fees 62.0% Awards 87.3%
Sponsorship 45.6% Insurance 81.0%
Office Fees 49.4% Advertising 62.0%
Entry Fees 82.3% Facility Maintenance 50.6%
Judges 49.4%
Office Supplies 49.4%
Facility Rental 46.8%
EMT 43.0%
Utilities 30.4%
Equipment Rentals 20.2%
Farrier Services 16.4%
Veterinary Services 15.2%
Wages & Salaries 7.6%
Purdue University is an equal access/equal opportunity/affirmative action university. If you have trouble accessing this document because of a disability, please contact PVM Web Communications at [email protected].
38
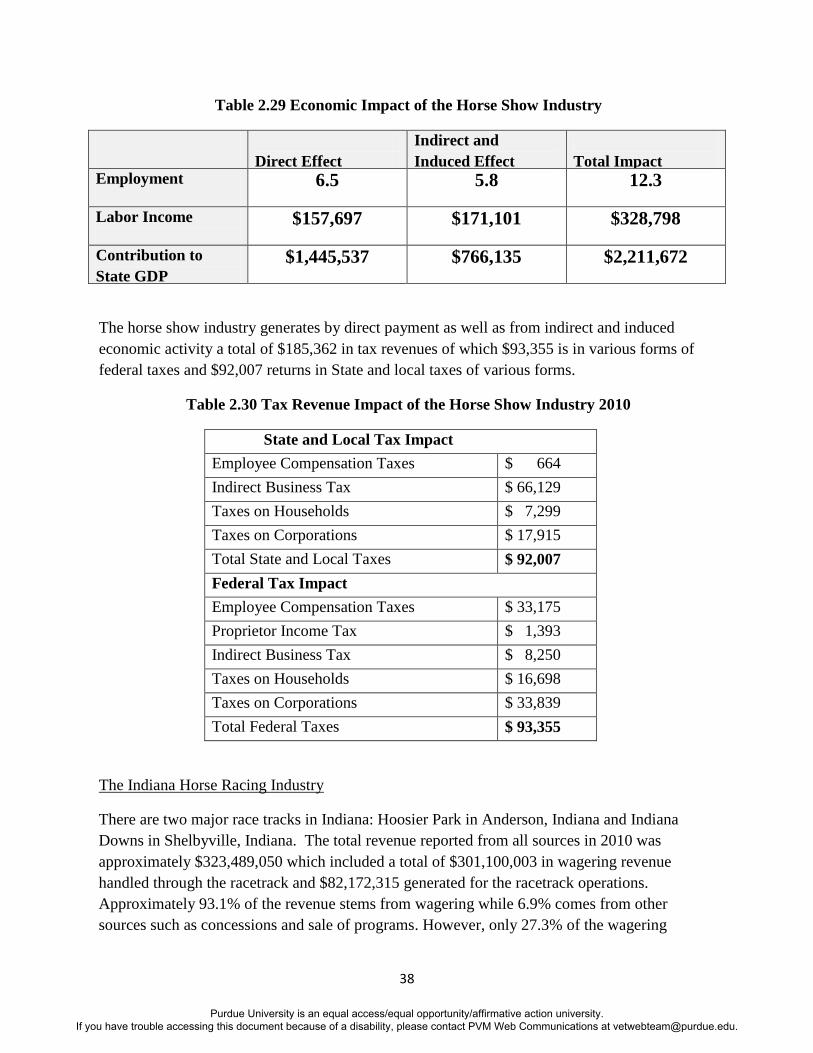
Table 2.29 Economic Impact of the Horse Show Industry
Direct Effect
Indirect and
Induced Effect
Total Impact Employment
6.5 5.8 12.3
Labor Income
$157,697 $171,101 $328,798
Contribution to
State GDP
$1,445,537 $766,135 $2,211,672
The horse show industry generates by direct payment as well as from indirect and induced
economic activity a total of $185,362 in tax revenues of which $93,355 is in various forms of
federal taxes and $92,007 returns in State and local taxes of various forms.
Table 2.30 Tax Revenue Impact of the Horse Show Industry 2010
State and Local Tax Impact
Employee Compensation Taxes $ 664
Indirect Business Tax $ 66,129
Taxes on Households $ 7,299
Taxes on Corporations $ 17,915
Total State and Local Taxes
$ 92,007
Federal Tax Impact
Employee Compensation Taxes $ 33,175
Proprietor Income Tax $ 1,393
Indirect Business Tax $ 8,250
Taxes on Households $ 16,698
Taxes on Corporations $ 33,839
Total Federal Taxes
$ 93,355
The Indiana Horse Racing Industry
There are two major race tracks in Indiana: Hoosier Park in Anderson, Indiana and Indiana
Downs in Shelbyville, Indiana. The total revenue reported from all sources in 2010 was
approximately $323,489,050 which included a total of $301,100,003 in wagering revenue
handled through the racetrack and $82,172,315 generated for the racetrack operations.
Approximately 93.1% of the revenue stems from wagering while 6.9% comes from other
sources such as concessions and sale of programs. However, only 27.3% of the wagering
Purdue University is an equal access/equal opportunity/affirmative action university. If you have trouble accessing this document because of a disability, please contact PVM Web Communications at [email protected].
39
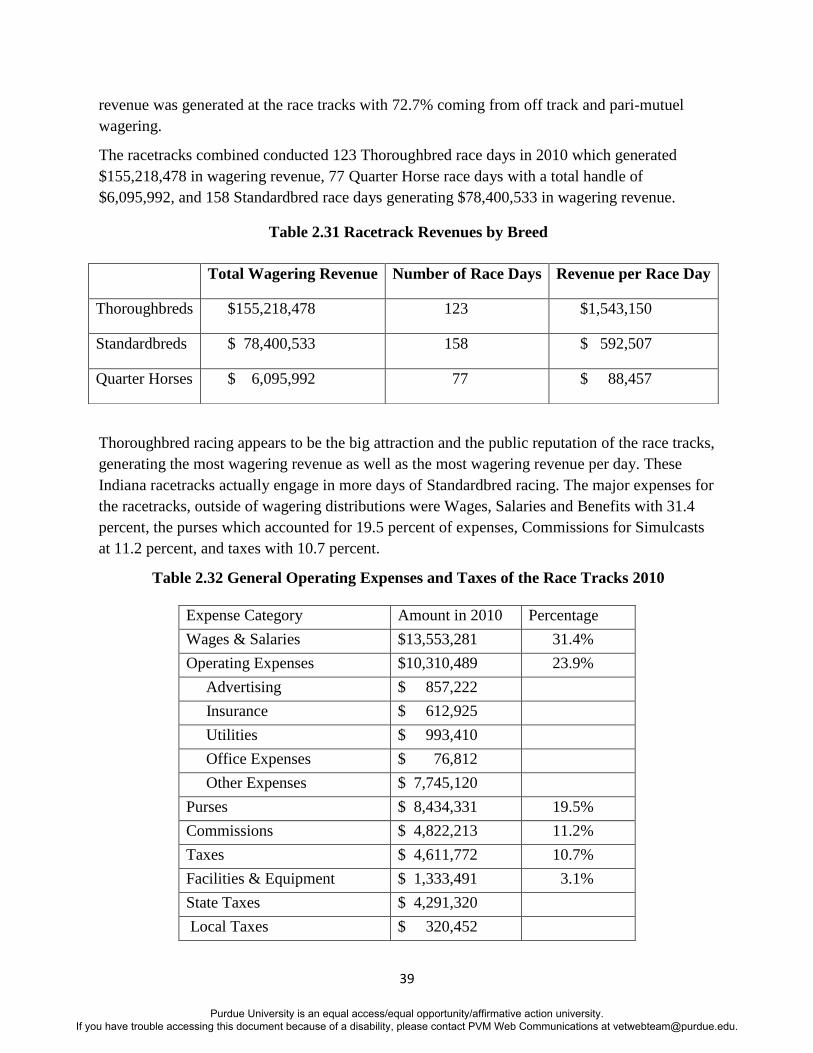
revenue was generated at the race tracks with 72.7% coming from off track and pari-mutuel
wagering.
The racetracks combined conducted 123 Thoroughbred race days in 2010 which generated
$155,218,478 in wagering revenue, 77 Quarter Horse race days with a total handle of
$6,095,992, and 158 Standardbred race days generating $78,400,533 in wagering revenue.
Table 2.31 Racetrack Revenues by Breed
Thoroughbred racing appears to be the big attraction and the public reputation of the race tracks,
generating the most wagering revenue as well as the most wagering revenue per day. These
Indiana racetracks actually engage in more days of Standardbred racing. The major expenses for
the racetracks, outside of wagering distributions were Wages, Salaries and Benefits with 31.4
percent, the purses which accounted for 19.5 percent of expenses, Commissions for Simulcasts
at 11.2 percent, and taxes with 10.7 percent.
Table 2.32 General Operating Expenses and Taxes of the Race Tracks 2010
Total Wagering Revenue Number of Race Days Revenue per Race Day
Thoroughbreds $155,218,478 123 $1,543,150
Standardbreds $ 78,400,533 158 $ 592,507
Quarter Horses $ 6,095,992 77 $ 88,457
Expense Category Amount in 2010 Percentage
Total Expenses Wages & Salaries $13,553,281 31.4%
Operating Expenses $10,310,489 23.9%
Advertising $ 857,222
Insurance $ 612,925
Utilities $ 993,410
Office Expenses $ 76,812
Other Expenses $ 7,745,120
Purses $ 8,434,331 19.5%
Commissions $ 4,822,213 11.2%
Taxes $ 4,611,772 10.7%
Facilities & Equipment $ 1,333,491 3.1%
State Taxes $ 4,291,320
Local Taxes $ 320,452
Purdue University is an equal access/equal opportunity/affirmative action university. If you have trouble accessing this document because of a disability, please contact PVM Web Communications at [email protected].
40
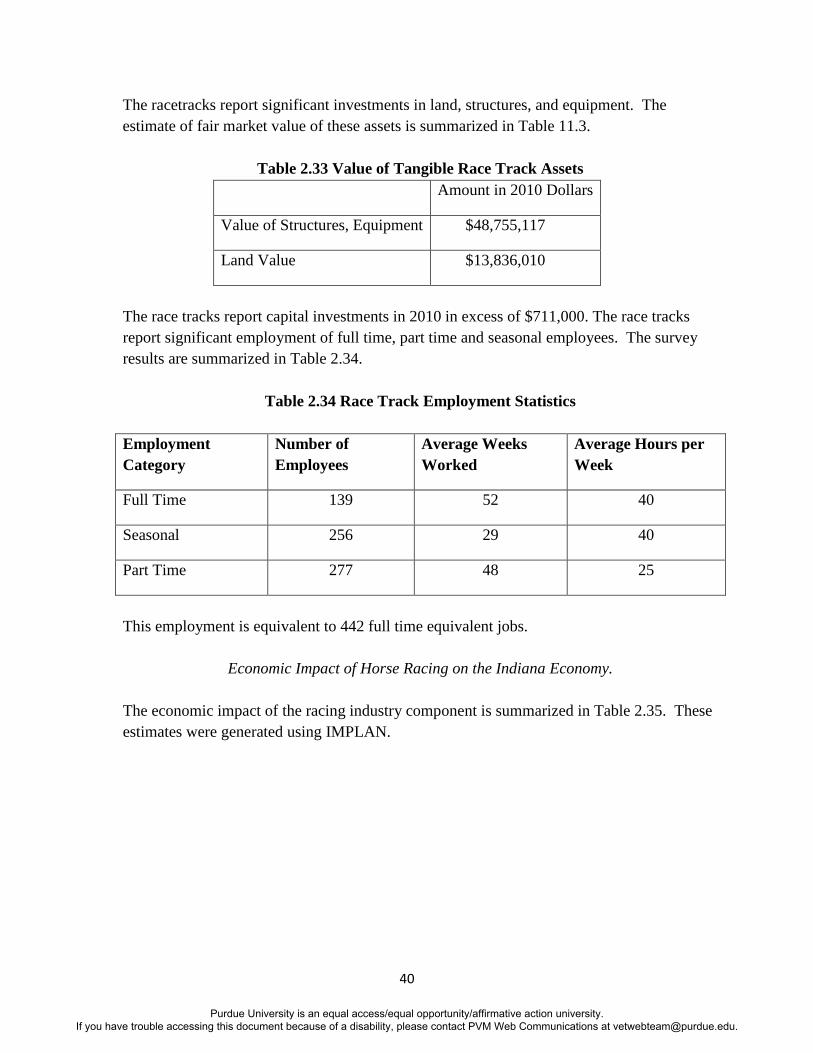
The racetracks report significant investments in land, structures, and equipment. The
estimate of fair market value of these assets is summarized in Table 11.3.
Table 2.33 Value of Tangible Race Track Assets
Amount in 2010 Dollars
Value of Structures, Equipment $48,755,117
Land Value $13,836,010
The race tracks report capital investments in 2010 in excess of $711,000. The race tracks
report significant employment of full time, part time and seasonal employees. The survey
results are summarized in Table 2.34.
Table 2.34 Race Track Employment Statistics
Employment
Category
Number of
Employees
Average Weeks
Worked
Average Hours per
Week
Full Time 139 52 40
Seasonal 256 29 40
Part Time 277 48 25
This employment is equivalent to 442 full time equivalent jobs.
Economic Impact of Horse Racing on the Indiana Economy.
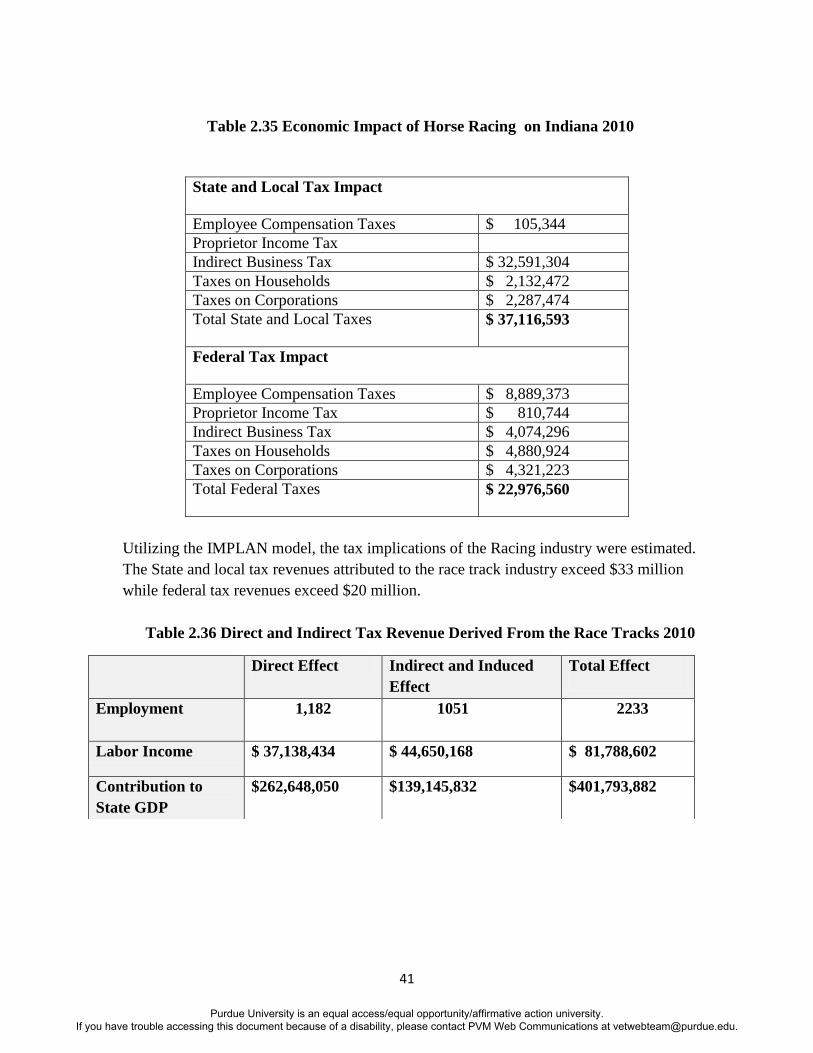
The economic impact of the racing industry component is summarized in Table 2.35. These
estimates were generated using IMPLAN.
Purdue University is an equal access/equal opportunity/affirmative action university. If you have trouble accessing this document because of a disability, please contact PVM Web Communications at [email protected].
41
Table 2.35 Economic Impact of Horse Racing on Indiana 2010
Utilizing the IMPLAN model, the tax implications of the Racing industry were estimated.
The State and local tax revenues attributed to the race track industry exceed $33 million
while federal tax revenues exceed $20 million.
Table 2.36 Direct and Indirect Tax Revenue Derived From the Race Tracks 2010
State and Local Tax Impact
Employee Compensation Taxes $ 105,344
Proprietor Income Tax
Indirect Business Tax $ 32,591,304
Taxes on Households $ 2,132,472
Taxes on Corporations $ 2,287,474
Total State and Local Taxes
$ 37,116,593
Federal Tax Impact
Employee Compensation Taxes $ 8,889,373
Proprietor Income Tax $ 810,744
Indirect Business Tax $ 4,074,296
Taxes on Households $ 4,880,924
Taxes on Corporations $ 4,321,223
Total Federal Taxes
$ 22,976,560
Direct Effect Indirect and Induced
Effect
Total Effect
Employment
1,182 1051 2233
Labor Income $ 37,138,434 $ 44,650,168 $ 81,788,602
Contribution to
State GDP
$262,648,050 $139,145,832 $401,793,882
Purdue University is an equal access/equal opportunity/affirmative action university. If you have trouble accessing this document because of a disability, please contact PVM Web Communications at [email protected].
42
Section III Entrepreneurship Results
The Entrepreneur Survey
Many of the equine enterprises are small scale operations, often involving one or two horses and
likely to be a part of another enterprise. Many operations are not even considered as business
enterprises as the purpose may be recreation. There are, however, a number of small operations
that view themselves as entrepreneurial enterprises, investing their own resources and taking
risks to initiate a business enterprise on a small scale.
A survey was incorporated into the business study to identify patterns and trends of
entrepreneurship in the equine industry. When asked about the utilization of the internet in their
businesses, a significant percentage of respondents have a website and are generating revenue
from the web site. Most prepare financial statements and are legally registered as a business.
However, not many have a business plan, many do not see the equine business as a primary
source of income, and a substantial number have employment outside of their businesses.
Although there is a significant range, 0 to 75% that claim revenue generated from their websites,
the average percentage of these equine businesses that draw revenue from the internet was
24.17%.
In this section of the survey, a series of questions designed to measure five different components
of the entrepreneurial process were asked. The five sets of questions, covered below, were:
1. Actions taken to start and run an equine business
2. Attitudes toward being an entrepreneur
3. Perceived approval for starting a business
4. Perceived ability to be a successful business owner
5. Intention to become an equine business owner
These questions were drawn from a stream of entrepreneurship research related to Icek Ajzen’s
theory of planned behavior. This theory suggests that the actions required to start and run a
business (#1, above) are influenced by several factors (#2 through #4 above) that contribute to
what we call entrepreneurial intent (#5). The stronger these factors are, the more likely a person
is to start a business. In general, a region interested in creating new businesses and ultimately
new jobs and sources of tax revenue has an interest in creating conditions where people are more
likely to start businesses. Examining all of these categories together, it appears that they are self-
reinforcing. That is, people with approval from their social network are more likely to undertake
actions toward making their business successful. The more supportive a person’s network, the
higher a person’s perceive chances of success, their intention to become a business owner, and
the more positively they viewed business ownership as a career option.
Purdue University is an equal access/equal opportunity/affirmative action university. If you have trouble accessing this document because of a disability, please contact PVM Web Communications at [email protected].
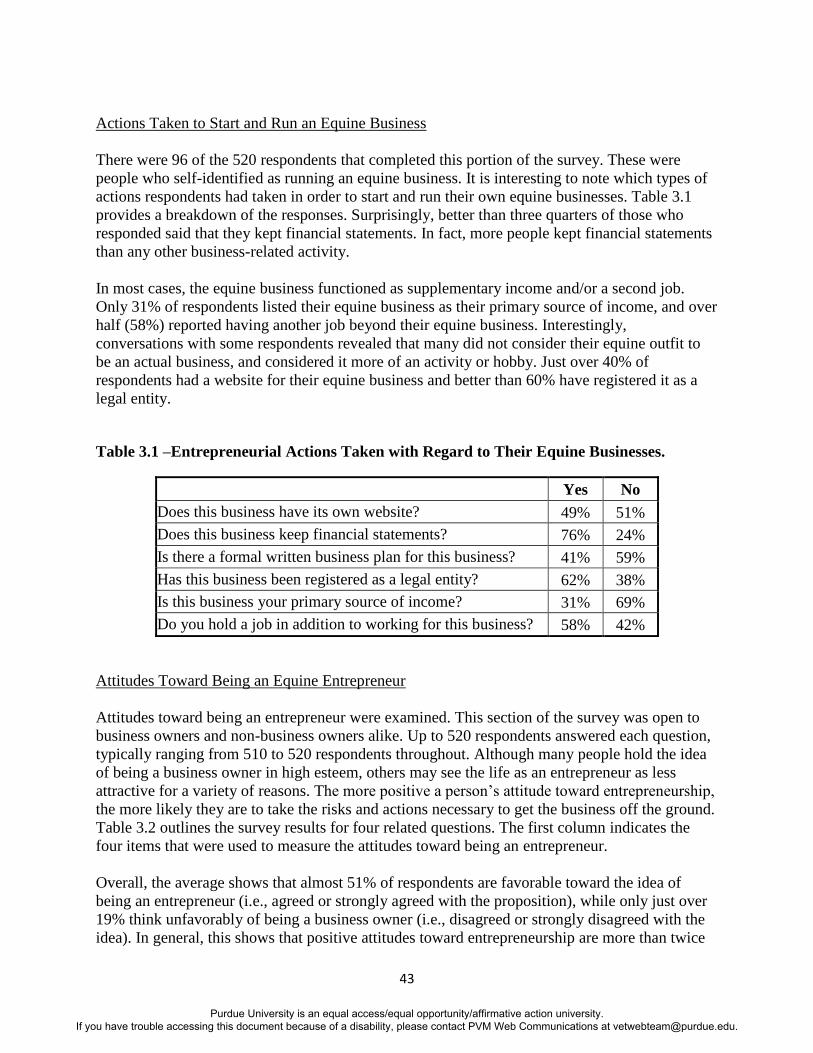
43
Actions Taken to Start and Run an Equine Business
There were 96 of the 520 respondents that completed this portion of the survey. These were
people who self-identified as running an equine business. It is interesting to note which types of
actions respondents had taken in order to start and run their own equine businesses. Table 3.1
provides a breakdown of the responses. Surprisingly, better than three quarters of those who
responded said that they kept financial statements. In fact, more people kept financial statements
than any other business-related activity.
In most cases, the equine business functioned as supplementary income and/or a second job.
Only 31% of respondents listed their equine business as their primary source of income, and over
half (58%) reported having another job beyond their equine business. Interestingly,
conversations with some respondents revealed that many did not consider their equine outfit to
be an actual business, and considered it more of an activity or hobby. Just over 40% of
respondents had a website for their equine business and better than 60% have registered it as a
legal entity.
Table 3.1 –Entrepreneurial Actions Taken with Regard to Their Equine Businesses.
Yes No
Does this business have its own website? 49% 51%
Does this business keep financial statements? 76% 24%
Is there a formal written business plan for this business? 41% 59%
Has this business been registered as a legal entity? 62% 38%
Is this business your primary source of income? 31% 69%
Do you hold a job in addition to working for this business? 58% 42%
Attitudes Toward Being an Equine Entrepreneur
Attitudes toward being an entrepreneur were examined. This section of the survey was open to
business owners and non-business owners alike. Up to 520 respondents answered each question,
typically ranging from 510 to 520 respondents throughout. Although many people hold the idea
of being a business owner in high esteem, others may see the life as an entrepreneur as less
attractive for a variety of reasons. The more positive a person’s attitude toward entrepreneurship,
the more likely they are to take the risks and actions necessary to get the business off the ground.
Table 3.2 outlines the survey results for four related questions. The first column indicates the
four items that were used to measure the attitudes toward being an entrepreneur.
Overall, the average shows that almost 51% of respondents are favorable toward the idea of
being an entrepreneur (i.e., agreed or strongly agreed with the proposition), while only just over
19% think unfavorably of being a business owner (i.e., disagreed or strongly disagreed with the
idea). In general, this shows that positive attitudes toward entrepreneurship are more than twice
Purdue University is an equal access/equal opportunity/affirmative action university. If you have trouble accessing this document because of a disability, please contact PVM Web Communications at [email protected].
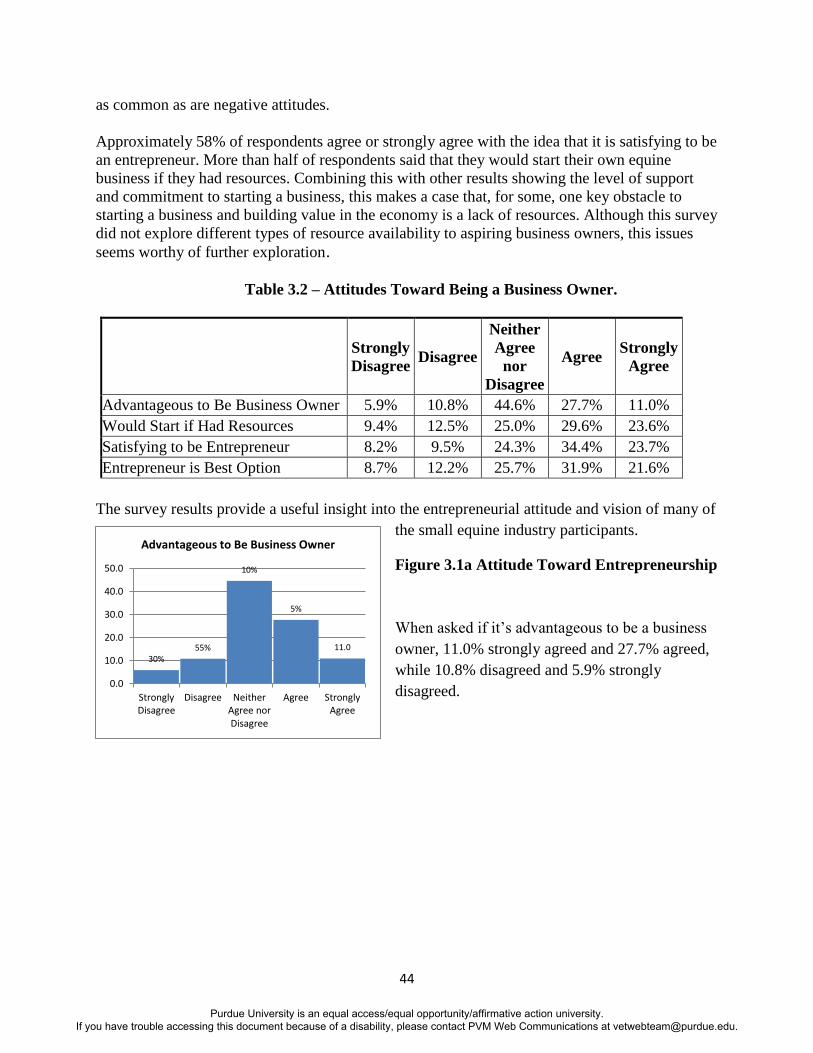
44
as common as are negative attitudes.
Approximately 58% of respondents agree or strongly agree with the idea that it is satisfying to be
an entrepreneur. More than half of respondents said that they would start their own equine
business if they had resources. Combining this with other results showing the level of support
and commitment to starting a business, this makes a case that, for some, one key obstacle to
starting a business and building value in the economy is a lack of resources. Although this survey
did not explore different types of resource availability to aspiring business owners, this issues
seems worthy of further exploration.
Table 3.2 – Attitudes Toward Being a Business Owner.
Strongly
Disagree Disagree
Neither
Agree
nor
Disagree
Agree Strongly
Agree
Advantageous to Be Business Owner 5.9% 10.8% 44.6% 27.7% 11.0%
Would Start if Had Resources 9.4% 12.5% 25.0% 29.6% 23.6%
Satisfying to be Entrepreneur 8.2% 9.5% 24.3% 34.4% 23.7%
Entrepreneur is Best Option 8.7% 12.2% 25.7% 31.9% 21.6%
The survey results provide a useful insight into the entrepreneurial attitude and vision of many of
the small equine industry participants.
Figure 3.1a Attitude Toward Entrepreneurship
When asked if it’s advantageous to be a business
owner, 11.0% strongly agreed and 27.7% agreed,
while 10.8% disagreed and 5.9% strongly
disagreed.
30% 55%
10%
5%
11.0
0.0
10.0
20.0
30.0
40.0
50.0
StronglyDisagree
Disagree NeitherAgree norDisagree
Agree StronglyAgree
Advantageous to Be Business Owner
Purdue University is an equal access/equal opportunity/affirmative action university. If you have trouble accessing this document because of a disability, please contact PVM Web Communications at [email protected].
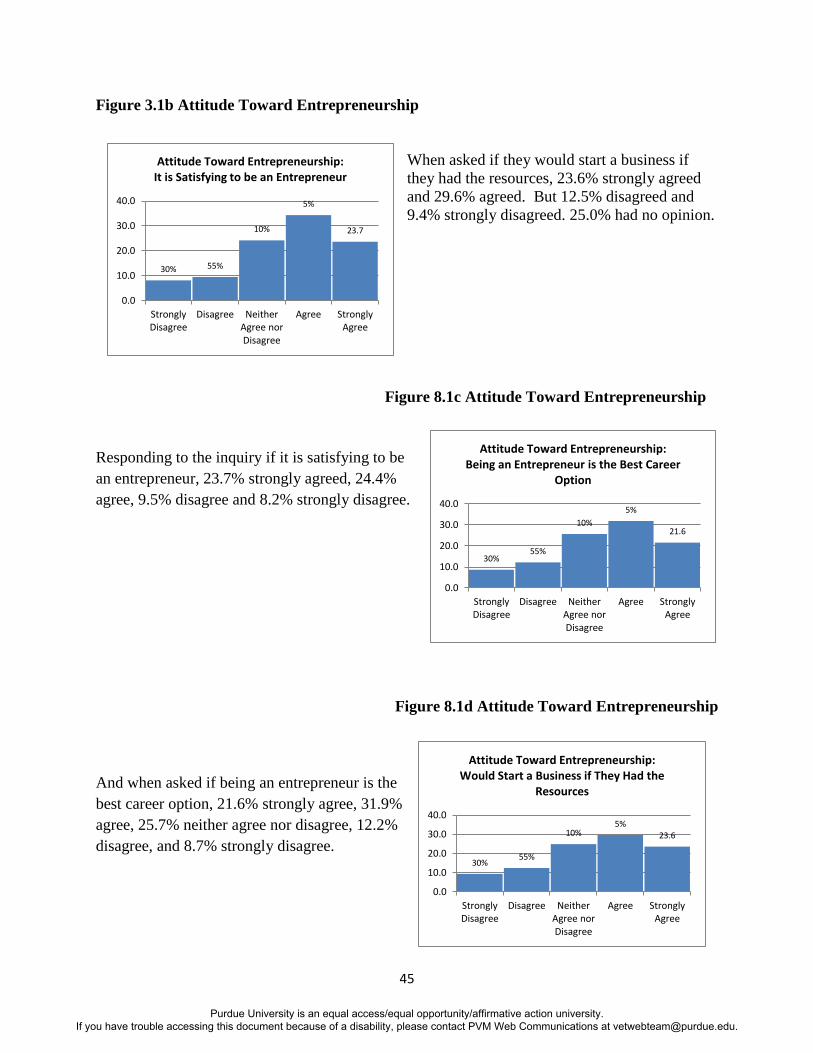
45
Figure 3.1b Attitude Toward Entrepreneurship
When asked if they would start a business if
they had the resources, 23.6% strongly agreed
and 29.6% agreed. But 12.5% disagreed and
9.4% strongly disagreed. 25.0% had no opinion.
Figure 8.1c Attitude Toward Entrepreneurship
Responding to the inquiry if it is satisfying to be
an entrepreneur, 23.7% strongly agreed, 24.4%
agree, 9.5% disagree and 8.2% strongly disagree.
Figure 8.1d Attitude Toward Entrepreneurship
And when asked if being an entrepreneur is the
best career option, 21.6% strongly agree, 31.9%
agree, 25.7% neither agree nor disagree, 12.2%
disagree, and 8.7% strongly disagree.
30% 55%
10%
5%
23.7
0.0
10.0
20.0
30.0
40.0
StronglyDisagree
Disagree NeitherAgree norDisagree
Agree StronglyAgree
Attitude Toward Entrepreneurship: It is Satisfying to be an Entrepreneur
30% 55%
10% 5%
23.6
0.0
10.0
20.0
30.0
40.0
StronglyDisagree
Disagree NeitherAgree norDisagree
Agree StronglyAgree
Attitude Toward Entrepreneurship: Would Start a Business if They Had the
Resources
30% 55%
10%
5%
21.6
0.0
10.0
20.0
30.0
40.0
StronglyDisagree
Disagree NeitherAgree norDisagree
Agree StronglyAgree
Attitude Toward Entrepreneurship: Being an Entrepreneur is the Best Career
Option
Purdue University is an equal access/equal opportunity/affirmative action university. If you have trouble accessing this document because of a disability, please contact PVM Web Communications at [email protected].
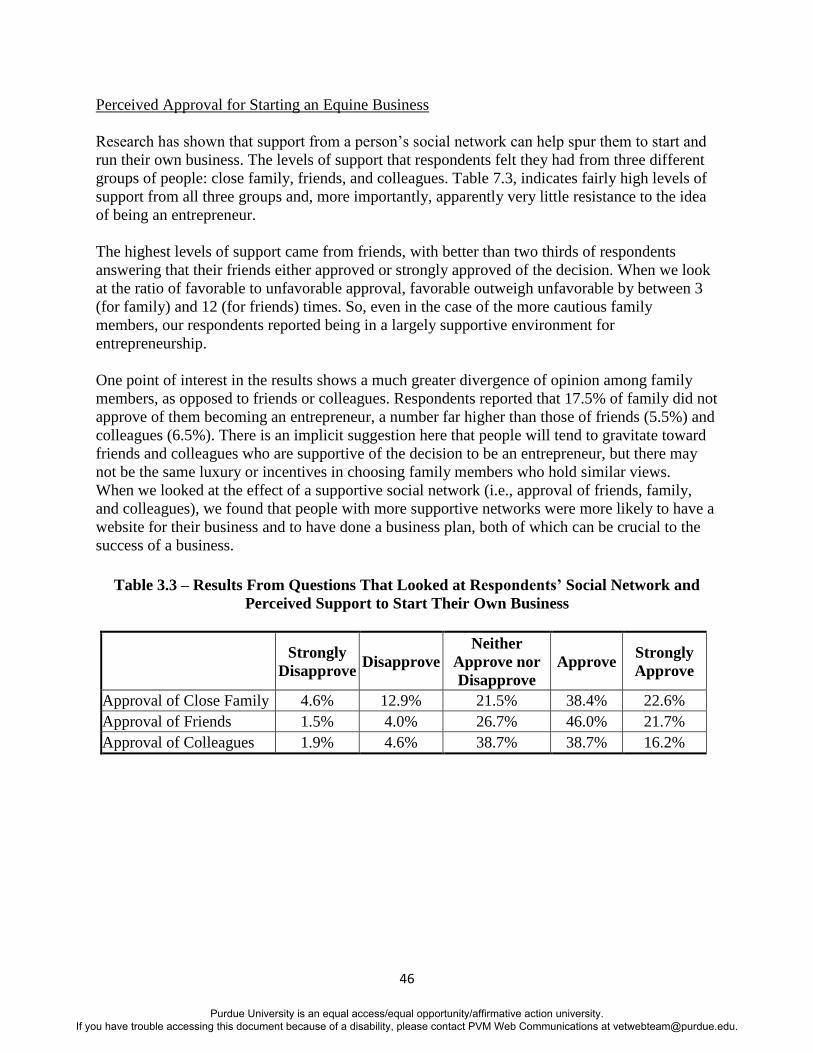
46
Perceived Approval for Starting an Equine Business
Research has shown that support from a person’s social network can help spur them to start and
run their own business. The levels of support that respondents felt they had from three different
groups of people: close family, friends, and colleagues. Table 7.3, indicates fairly high levels of
support from all three groups and, more importantly, apparently very little resistance to the idea
of being an entrepreneur.
The highest levels of support came from friends, with better than two thirds of respondents
answering that their friends either approved or strongly approved of the decision. When we look
at the ratio of favorable to unfavorable approval, favorable outweigh unfavorable by between 3
(for family) and 12 (for friends) times. So, even in the case of the more cautious family
members, our respondents reported being in a largely supportive environment for
entrepreneurship.
One point of interest in the results shows a much greater divergence of opinion among family
members, as opposed to friends or colleagues. Respondents reported that 17.5% of family did not
approve of them becoming an entrepreneur, a number far higher than those of friends (5.5%) and
colleagues (6.5%). There is an implicit suggestion here that people will tend to gravitate toward
friends and colleagues who are supportive of the decision to be an entrepreneur, but there may
not be the same luxury or incentives in choosing family members who hold similar views.
When we looked at the effect of a supportive social network (i.e., approval of friends, family,
and colleagues), we found that people with more supportive networks were more likely to have a
website for their business and to have done a business plan, both of which can be crucial to the
success of a business.
Table 3.3 – Results From Questions That Looked at Respondents’ Social Network and
Perceived Support to Start Their Own Business
Strongly
Disapprove Disapprove
Neither
Approve nor
Disapprove
Approve Strongly
Approve
Approval of Close Family 4.6% 12.9% 21.5% 38.4% 22.6%
Approval of Friends 1.5% 4.0% 26.7% 46.0% 21.7%
Approval of Colleagues 1.9% 4.6% 38.7% 38.7% 16.2%
Purdue University is an equal access/equal opportunity/affirmative action university. If you have trouble accessing this document because of a disability, please contact PVM Web Communications at [email protected].
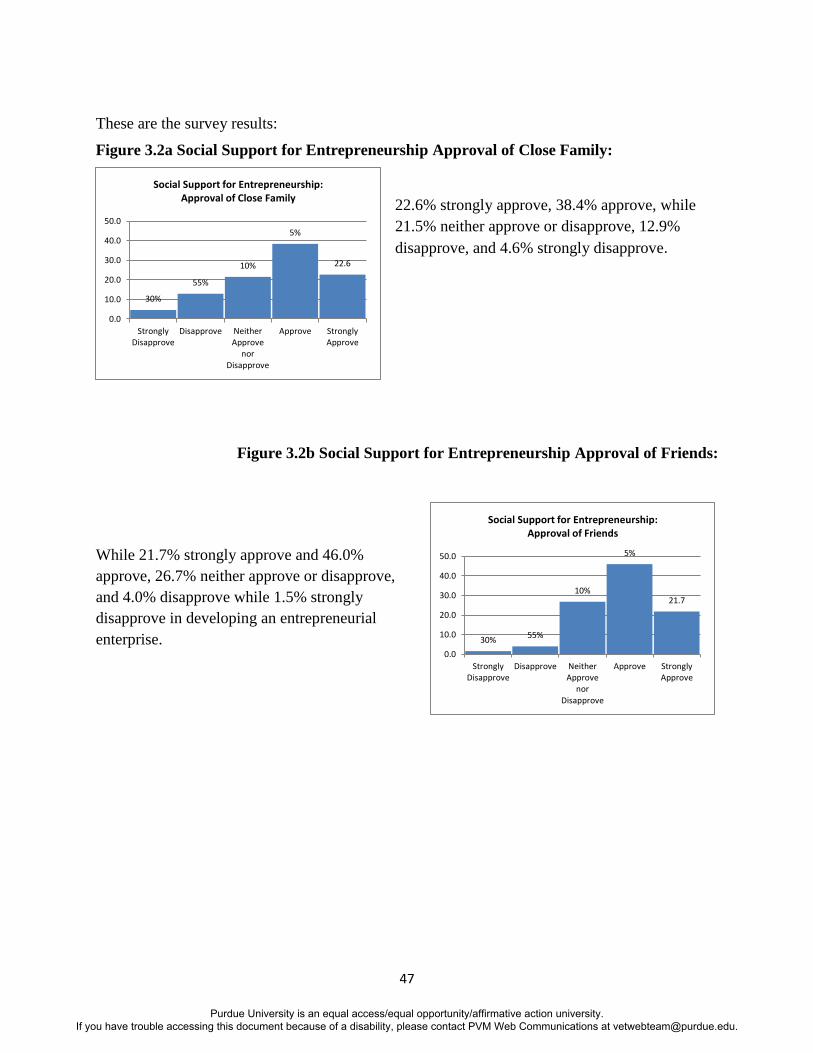
47
These are the survey results:
Figure 3.2a Social Support for Entrepreneurship Approval of Close Family:
22.6% strongly approve, 38.4% approve, while
21.5% neither approve or disapprove, 12.9%
disapprove, and 4.6% strongly disapprove.
Figure 3.2b Social Support for Entrepreneurship Approval of Friends:
While 21.7% strongly approve and 46.0%
approve, 26.7% neither approve or disapprove,
and 4.0% disapprove while 1.5% strongly
disapprove in developing an entrepreneurial
enterprise.
30%
55%
10%
5%
22.6
0.0
10.0
20.0
30.0
40.0
50.0
StronglyDisapprove
Disapprove NeitherApprove
norDisapprove
Approve StronglyApprove
Social Support for Entrepreneurship: Approval of Close Family
30% 55%
10%
5%
21.7
0.0
10.0
20.0
30.0
40.0
50.0
StronglyDisapprove
Disapprove NeitherApprove
norDisapprove
Approve StronglyApprove
Social Support for Entrepreneurship: Approval of Friends
Purdue University is an equal access/equal opportunity/affirmative action university. If you have trouble accessing this document because of a disability, please contact PVM Web Communications at [email protected].

48
Figure 3.2c Social Support for Entrepreneurship
When it comes to the approval of colleagues,
16.2% strongly approve, 38.7% approve, while
38.7 neither approve or disapprove, 4.6
disapprove and 1.9% strongly disapprove.
Perceived Ability to be a Successful Equine Business Owner
This group of questions was designed to assess respondents’ perception of their ability to be a
successful business owner. Comparing results from the preceding two groups of questions, we
see that people were much more modest in their estimate of ability to succeed than they were in
terms of perceived support and positive view of entrepreneurship. In the overall average, only
38% of respondents answered favorably (answered Agree or Strongly Agree) regarding their
ability to be successful. In contrast, on average more than a third of respondents disagreed or
strongly disagreed with the notion that they had the ability to be a successful business owner.
Table 3.4 – Questions Outlining Respondents’ Perceptions of Their Ability to be a
Successful Business Owner.
Strongly
Disagree Disagree
Neither
Agree
nor
Disagree
Agree Strongly
Agree
Easy to Start Business 12.3% 30.9% 24.2% 26.5% 6.1%
Prepared to Start Business 19.0% 34.9% 24.0% 17.6% 4.5%
Can Control Creation Process 9.3% 15.3% 26.7% 37.9% 10.8%
Know How to Start an Equine Business 10.2% 22.8% 22.0% 36.3% 8.7%
High Probability of Success 9.7% 14.1% 34.9% 33.0% 8.3%
Average 12.1% 23.6% 26.4% 30.3% 7.7%
30% 55%
10% 5%
16.2
0.0
10.0
20.0
30.0
40.0
50.0
StronglyDisapprove
Disapprove NeitherApprove norDisapprove
Approve StronglyApprove
Social Support for Entrepreneurship: Approval of Colleagues
Purdue University is an equal access/equal opportunity/affirmative action university. If you have trouble accessing this document because of a disability, please contact PVM Web Communications at [email protected].
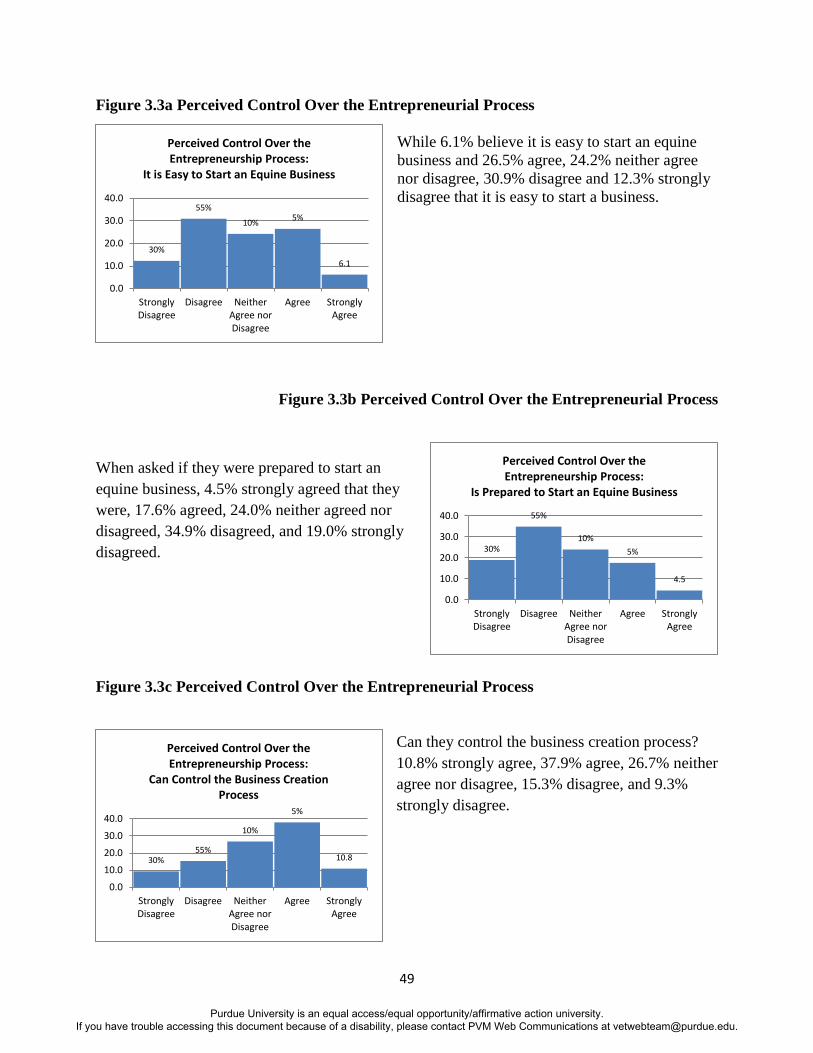
49
Figure 3.3a Perceived Control Over the Entrepreneurial Process
While 6.1% believe it is easy to start an equine
business and 26.5% agree, 24.2% neither agree
nor disagree, 30.9% disagree and 12.3% strongly
disagree that it is easy to start a business.
Figure 3.3b Perceived Control Over the Entrepreneurial Process
When asked if they were prepared to start an
equine business, 4.5% strongly agreed that they
were, 17.6% agreed, 24.0% neither agreed nor
disagreed, 34.9% disagreed, and 19.0% strongly
disagreed.
Figure 3.3c Perceived Control Over the Entrepreneurial Process
Can they control the business creation process?
10.8% strongly agree, 37.9% agree, 26.7% neither
agree nor disagree, 15.3% disagree, and 9.3%
strongly disagree.
30%
55%
10% 5%
6.1
0.0
10.0
20.0
30.0
40.0
StronglyDisagree
Disagree NeitherAgree norDisagree
Agree StronglyAgree
Perceived Control Over the Entrepreneurship Process:
It is Easy to Start an Equine Business
30%
55%
10%
5%
4.5
0.0
10.0
20.0
30.0
40.0
StronglyDisagree
Disagree NeitherAgree norDisagree
Agree StronglyAgree
Perceived Control Over the Entrepreneurship Process:
Is Prepared to Start an Equine Business
30% 55%
10%
5%
10.8
0.0
10.0
20.0
30.0
40.0
StronglyDisagree
Disagree NeitherAgree norDisagree
Agree StronglyAgree
Perceived Control Over the Entrepreneurship Process:
Can Control the Business Creation Process
Purdue University is an equal access/equal opportunity/affirmative action university. If you have trouble accessing this document because of a disability, please contact PVM Web Communications at [email protected].
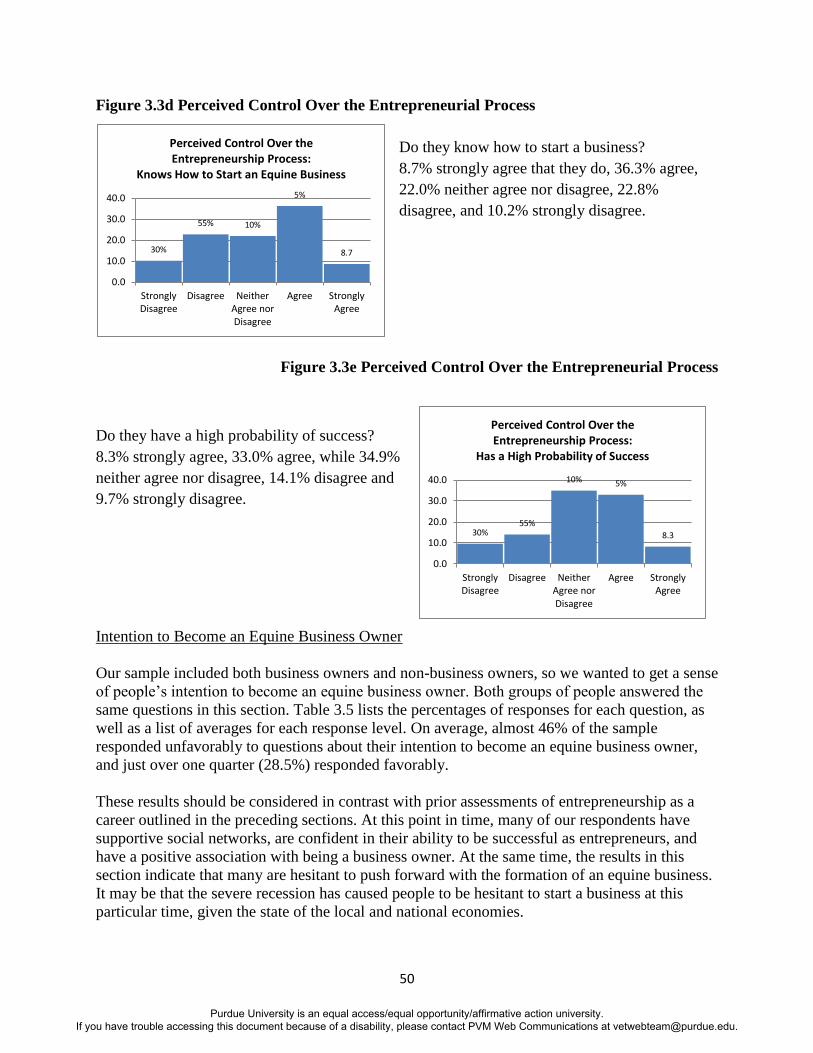
50
Figure 3.3d Perceived Control Over the Entrepreneurial Process
Do they know how to start a business?
8.7% strongly agree that they do, 36.3% agree,
22.0% neither agree nor disagree, 22.8%
disagree, and 10.2% strongly disagree.
Figure 3.3e Perceived Control Over the Entrepreneurial Process
Do they have a high probability of success?
8.3% strongly agree, 33.0% agree, while 34.9%
neither agree nor disagree, 14.1% disagree and
9.7% strongly disagree.
Intention to Become an Equine Business Owner
Our sample included both business owners and non-business owners, so we wanted to get a sense
of people’s intention to become an equine business owner. Both groups of people answered the
same questions in this section. Table 3.5 lists the percentages of responses for each question, as
well as a list of averages for each response level. On average, almost 46% of the sample
responded unfavorably to questions about their intention to become an equine business owner,
and just over one quarter (28.5%) responded favorably.
These results should be considered in contrast with prior assessments of entrepreneurship as a
career outlined in the preceding sections. At this point in time, many of our respondents have
supportive social networks, are confident in their ability to be successful as entrepreneurs, and
have a positive association with being a business owner. At the same time, the results in this
section indicate that many are hesitant to push forward with the formation of an equine business.
It may be that the severe recession has caused people to be hesitant to start a business at this
particular time, given the state of the local and national economies.
30%
55% 10%
5%
8.7
0.0
10.0
20.0
30.0
40.0
StronglyDisagree
Disagree NeitherAgree norDisagree
Agree StronglyAgree
Perceived Control Over the Entrepreneurship Process:
Knows How to Start an Equine Business
30% 55%
10% 5%
8.3
0.0
10.0
20.0
30.0
40.0
StronglyDisagree
Disagree NeitherAgree norDisagree
Agree StronglyAgree
Perceived Control Over the Entrepreneurship Process:
Has a High Probability of Success
Purdue University is an equal access/equal opportunity/affirmative action university. If you have trouble accessing this document because of a disability, please contact PVM Web Communications at [email protected].
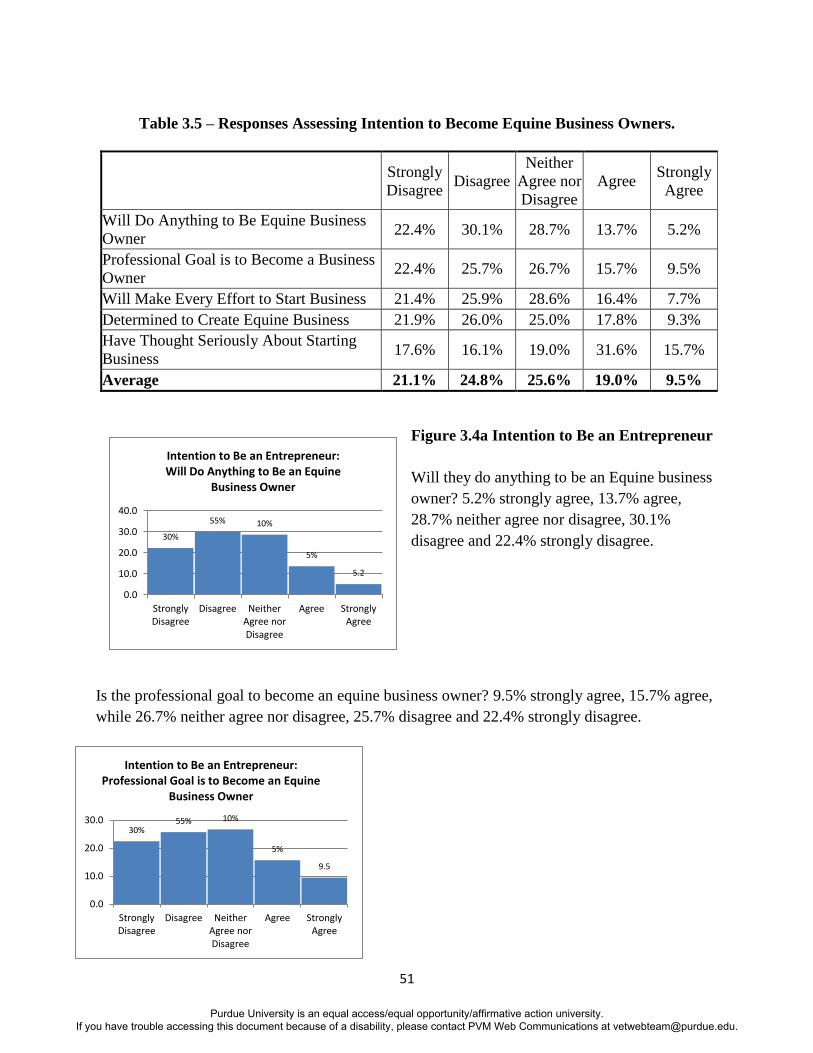
51
Table 3.5 – Responses Assessing Intention to Become Equine Business Owners.
Strongly
Disagree Disagree
Neither
Agree nor
Disagree
Agree Strongly
Agree
Will Do Anything to Be Equine Business
Owner 22.4% 30.1% 28.7% 13.7% 5.2%
Professional Goal is to Become a Business
Owner 22.4% 25.7% 26.7% 15.7% 9.5%
Will Make Every Effort to Start Business 21.4% 25.9% 28.6% 16.4% 7.7%
Determined to Create Equine Business 21.9% 26.0% 25.0% 17.8% 9.3%
Have Thought Seriously About Starting
Business 17.6% 16.1% 19.0% 31.6% 15.7%
Average 21.1% 24.8% 25.6% 19.0% 9.5%
Figure 3.4a Intention to Be an Entrepreneur
Will they do anything to be an Equine business
owner? 5.2% strongly agree, 13.7% agree,
28.7% neither agree nor disagree, 30.1%
disagree and 22.4% strongly disagree.
Is the professional goal to become an equine business owner? 9.5% strongly agree, 15.7% agree,
while 26.7% neither agree nor disagree, 25.7% disagree and 22.4% strongly disagree.
30%
55% 10%
5%
5.2
0.0
10.0
20.0
30.0
40.0
StronglyDisagree
Disagree NeitherAgree norDisagree
Agree StronglyAgree
Intention to Be an Entrepreneur: Will Do Anything to Be an Equine
Business Owner
30% 55% 10%
5%
9.5
0.0
10.0
20.0
30.0
StronglyDisagree
Disagree NeitherAgree norDisagree
Agree StronglyAgree
Intention to Be an Entrepreneur: Professional Goal is to Become an Equine
Business Owner
Purdue University is an equal access/equal opportunity/affirmative action university. If you have trouble accessing this document because of a disability, please contact PVM Web Communications at [email protected].
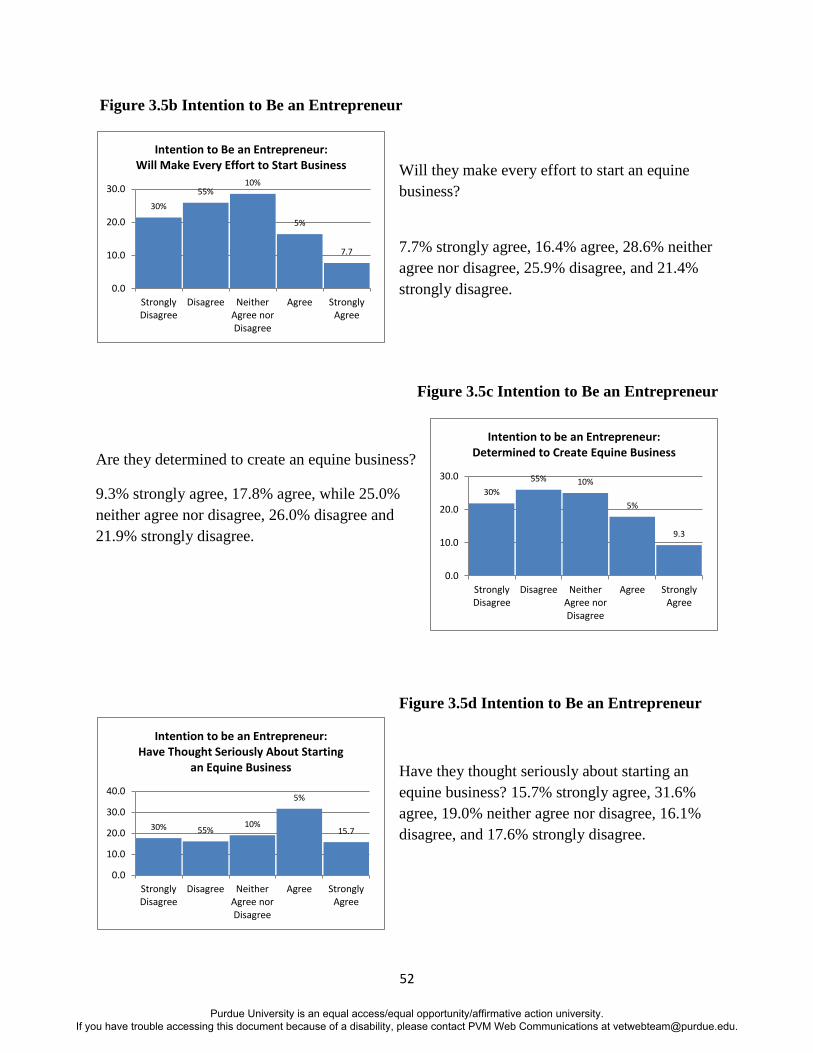
52
Figure 3.5b Intention to Be an Entrepreneur
Will they make every effort to start an equine
business?
7.7% strongly agree, 16.4% agree, 28.6% neither
agree nor disagree, 25.9% disagree, and 21.4%
strongly disagree.
Figure 3.5c Intention to Be an Entrepreneur
Are they determined to create an equine business?
9.3% strongly agree, 17.8% agree, while 25.0%
neither agree nor disagree, 26.0% disagree and
21.9% strongly disagree.
Figure 3.5d Intention to Be an Entrepreneur
Have they thought seriously about starting an
equine business? 15.7% strongly agree, 31.6%
agree, 19.0% neither agree nor disagree, 16.1%
disagree, and 17.6% strongly disagree.
30%
55% 10%
5%
7.7
0.0
10.0
20.0
30.0
StronglyDisagree
Disagree NeitherAgree norDisagree
Agree StronglyAgree
Intention to Be an Entrepreneur: Will Make Every Effort to Start Business
30%
55% 10%
5%
9.3
0.0
10.0
20.0
30.0
StronglyDisagree
Disagree NeitherAgree norDisagree
Agree StronglyAgree
Intention to be an Entrepreneur: Determined to Create Equine Business
30% 55% 10%
5%
15.7
0.0
10.0
20.0
30.0
40.0
StronglyDisagree
Disagree NeitherAgree norDisagree
Agree StronglyAgree
Intention to be an Entrepreneur: Have Thought Seriously About Starting
an Equine Business
Purdue University is an equal access/equal opportunity/affirmative action university. If you have trouble accessing this document because of a disability, please contact PVM Web Communications at [email protected].
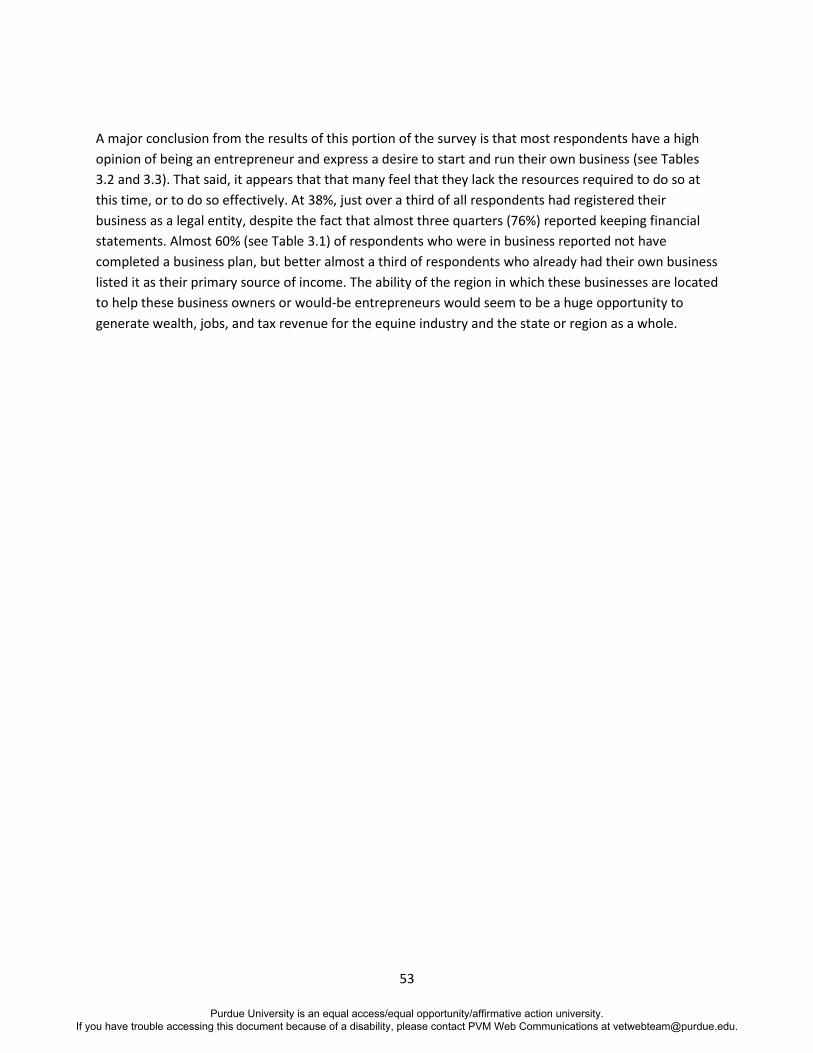
53
A major conclusion from the results of this portion of the survey is that most respondents have a high
opinion of being an entrepreneur and express a desire to start and run their own business (see Tables
3.2 and 3.3). That said, it appears that that many feel that they lack the resources required to do so at
this time, or to do so effectively. At 38%, just over a third of all respondents had registered their
business as a legal entity, despite the fact that almost three quarters (76%) reported keeping financial
statements. Almost 60% (see Table 3.1) of respondents who were in business reported not have
completed a business plan, but better almost a third of respondents who already had their own business
listed it as their primary source of income. The ability of the region in which these businesses are located
to help these business owners or would-be entrepreneurs would seem to be a huge opportunity to
generate wealth, jobs, and tax revenue for the equine industry and the state or region as a whole.
Purdue University is an equal access/equal opportunity/affirmative action university. If you have trouble accessing this document because of a disability, please contact PVM Web Communications at [email protected].
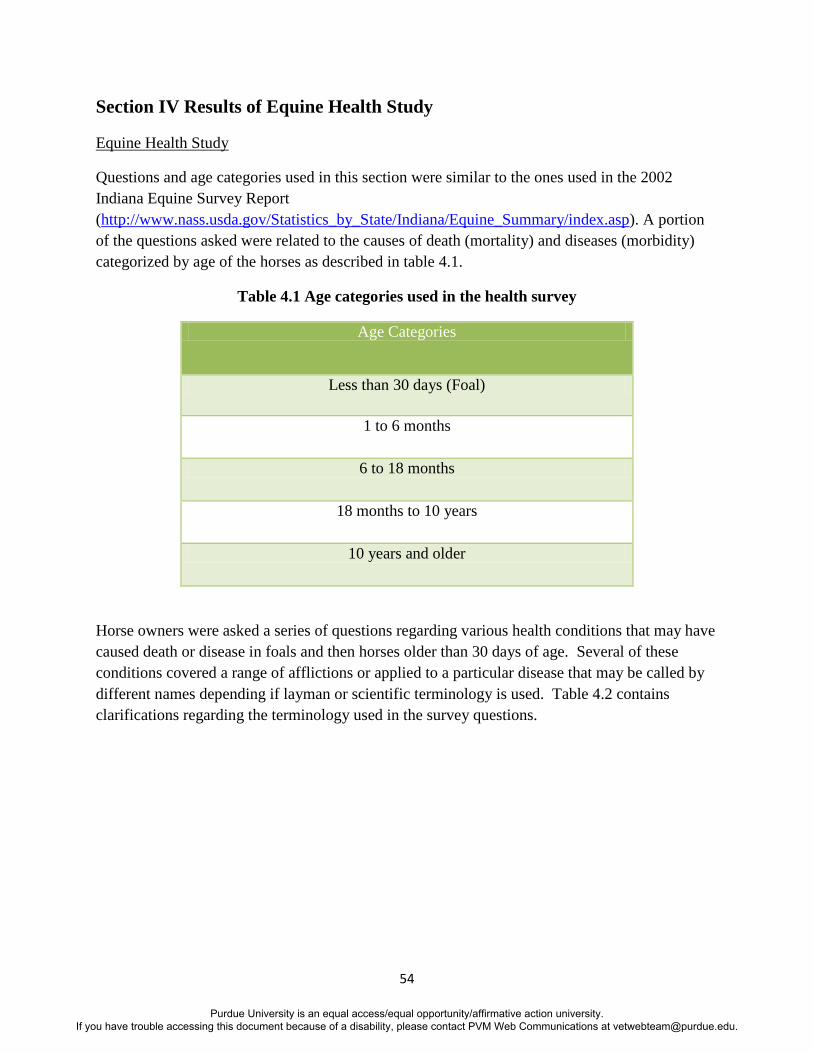
54
Section IV Results of Equine Health Study
Equine Health Study
Questions and age categories used in this section were similar to the ones used in the 2002
Indiana Equine Survey Report
(http://www.nass.usda.gov/Statistics_by_State/Indiana/Equine_Summary/index.asp). A portion
of the questions asked were related to the causes of death (mortality) and diseases (morbidity)
categorized by age of the horses as described in table 4.1.
Table 4.1 Age categories used in the health survey
Age Categories
Less than 30 days (Foal)
1 to 6 months
6 to 18 months
18 months to 10 years
10 years and older
Horse owners were asked a series of questions regarding various health conditions that may have
caused death or disease in foals and then horses older than 30 days of age. Several of these
conditions covered a range of afflictions or applied to a particular disease that may be called by
different names depending if layman or scientific terminology is used. Table 4.2 contains
clarifications regarding the terminology used in the survey questions.
Purdue University is an equal access/equal opportunity/affirmative action university. If you have trouble accessing this document because of a disability, please contact PVM Web Communications at [email protected].
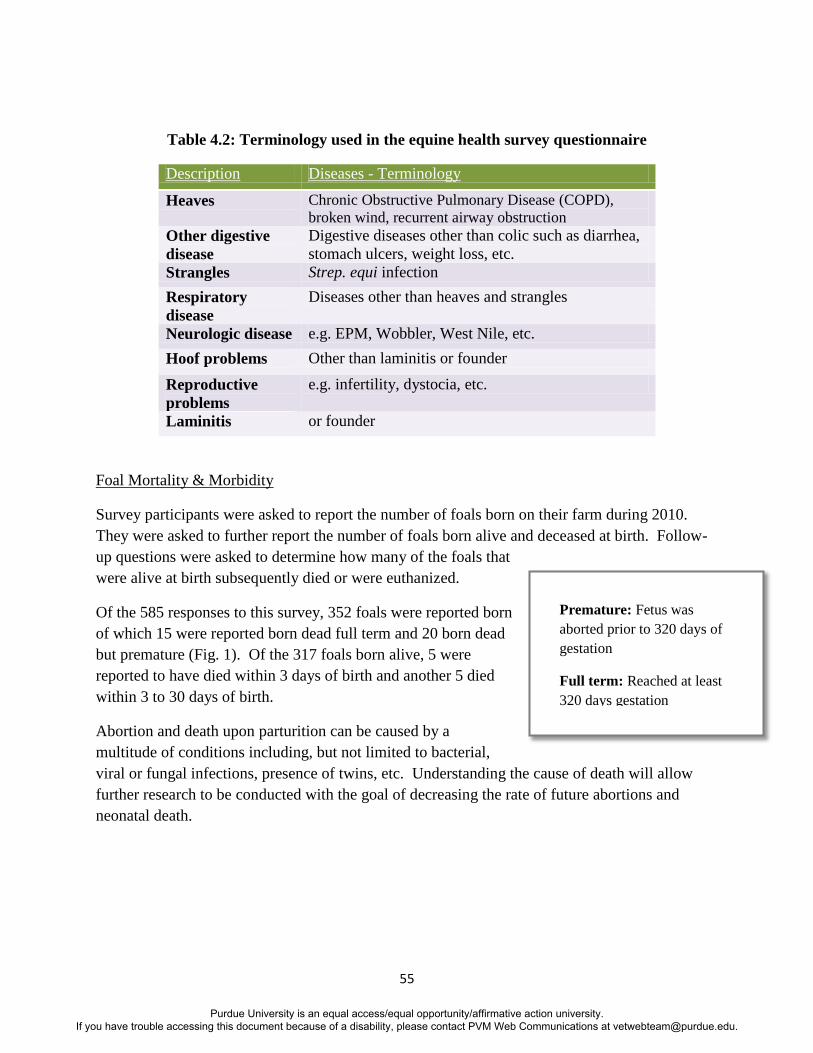
55
Table 4.2: Terminology used in the equine health survey questionnaire
Description Diseases - Terminology
Heaves Chronic Obstructive Pulmonary Disease (COPD),
broken wind, recurrent airway obstruction
Other digestive
disease
Digestive diseases other than colic such as diarrhea,
stomach ulcers, weight loss, etc.
Strangles Strep. equi infection
Respiratory
disease
Diseases other than heaves and strangles
Neurologic disease e.g. EPM, Wobbler, West Nile, etc.
Hoof problems Other than laminitis or founder
Reproductive
problems
e.g. infertility, dystocia, etc.
Laminitis or founder
Foal Mortality & Morbidity
Survey participants were asked to report the number of foals born on their farm during 2010.
They were asked to further report the number of foals born alive and deceased at birth. Follow-
up questions were asked to determine how many of the foals that
were alive at birth subsequently died or were euthanized.
Of the 585 responses to this survey, 352 foals were reported born
of which 15 were reported born dead full term and 20 born dead
but premature (Fig. 1). Of the 317 foals born alive, 5 were
reported to have died within 3 days of birth and another 5 died
within 3 to 30 days of birth.
Abortion and death upon parturition can be caused by a
multitude of conditions including, but not limited to bacterial,
viral or fungal infections, presence of twins, etc. Understanding the cause of death will allow
further research to be conducted with the goal of decreasing the rate of future abortions and
neonatal death.
Premature: Fetus was
aborted prior to 320 days of
gestation
Full term: Reached at least
320 days gestation
Purdue University is an equal access/equal opportunity/affirmative action university. If you have trouble accessing this document because of a disability, please contact PVM Web Communications at [email protected].
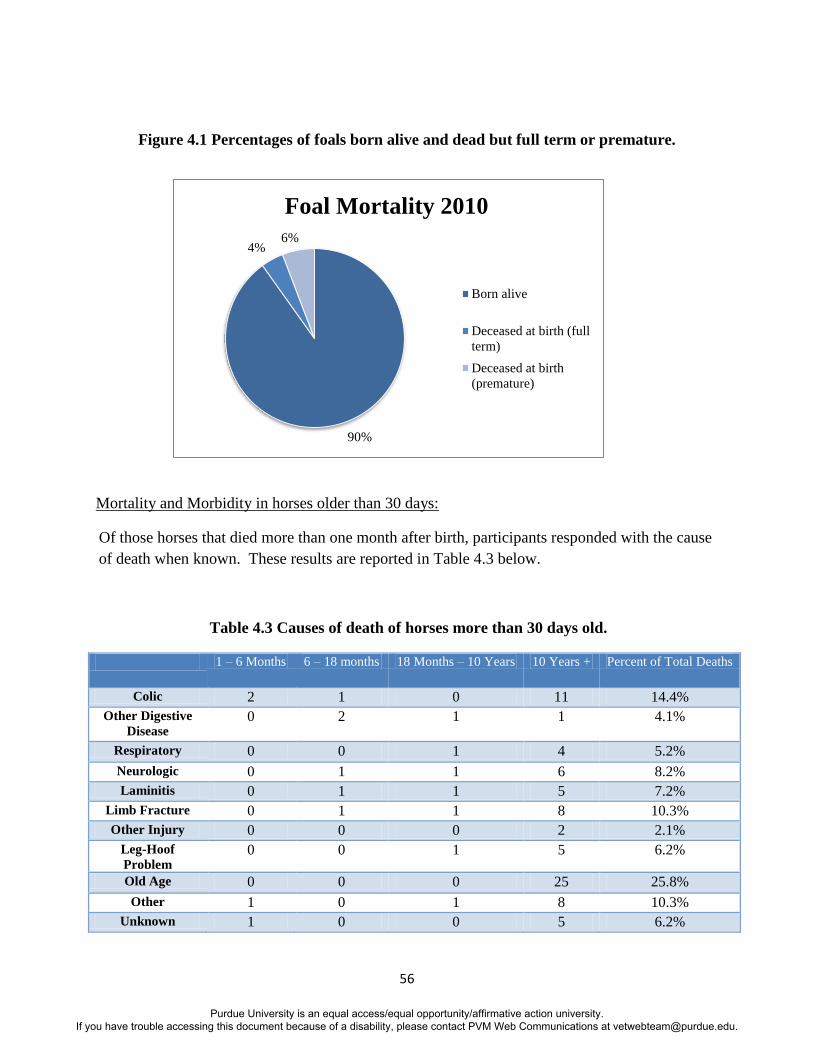
56
Figure 4.1 Percentages of foals born alive and dead but full term or premature.
Mortality and Morbidity in horses older than 30 days:
Of those horses that died more than one month after birth, participants responded with the cause
of death when known. These results are reported in Table 4.3 below.
Table 4.3 Causes of death of horses more than 30 days old.
1 – 6 Months 6 – 18 months 18 Months – 10 Years 10 Years + Percent of Total Deaths
Colic 2 1 0 11 14.4%
Other Digestive
Disease 0 2 1 1 4.1%
Respiratory 0 0 1 4 5.2%
Neurologic 0 1 1 6 8.2%
Laminitis 0 1 1 5 7.2%
Limb Fracture 0 1 1 8 10.3%
Other Injury 0 0 0 2 2.1%
Leg-Hoof
Problem 0 0 1 5 6.2%
Old Age 0 0 0 25 25.8%
Other 1 0 1 8 10.3%
Unknown 1 0 0 5 6.2%
90%
4% 6%
Foal Mortality 2010
Born alive
Deceased at birth (full
term)
Deceased at birth
(premature)
Purdue University is an equal access/equal opportunity/affirmative action university. If you have trouble accessing this document because of a disability, please contact PVM Web Communications at [email protected].
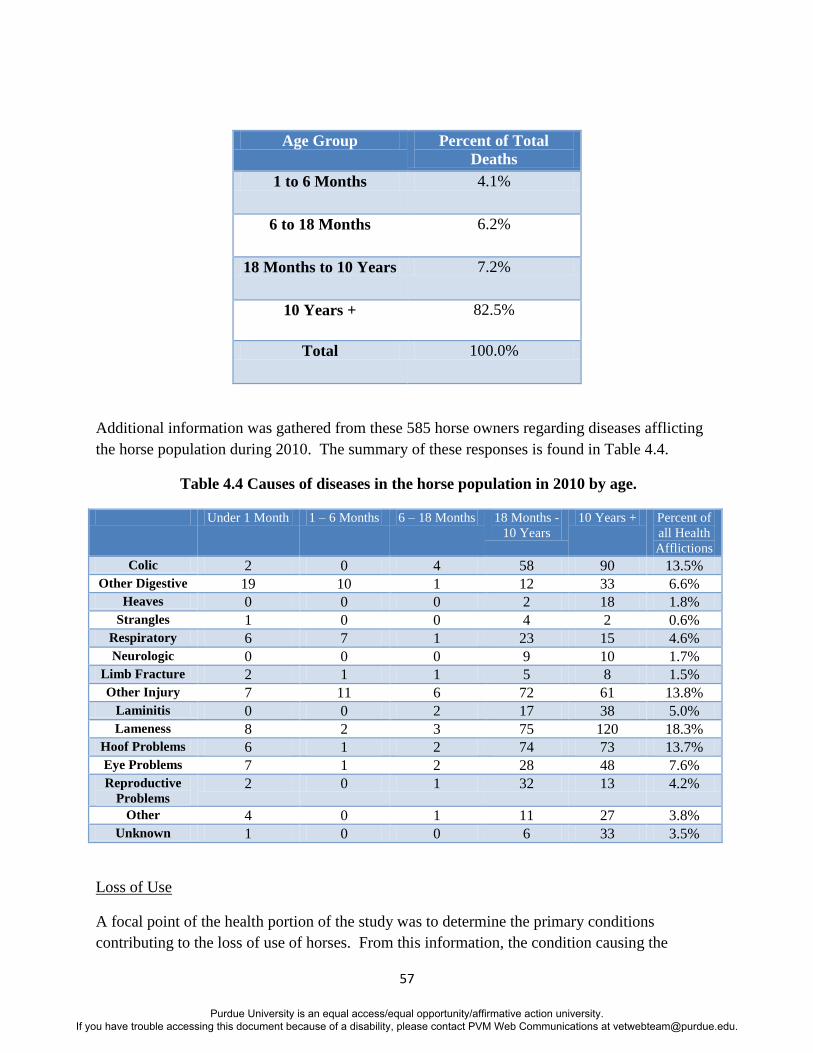
57
Age Group Percent of Total
Deaths
1 to 6 Months 4.1%
6 to 18 Months 6.2%
18 Months to 10 Years 7.2%
10 Years + 82.5%
Total 100.0%
Additional information was gathered from these 585 horse owners regarding diseases afflicting
the horse population during 2010. The summary of these responses is found in Table 4.4.
Table 4.4 Causes of diseases in the horse population in 2010 by age.
Under 1 Month 1 – 6 Months 6 – 18 Months 18 Months -
10 Years
10 Years + Percent of
all Health
Afflictions
Colic 2 0 4 58 90 13.5%
Other Digestive 19 10 1 12 33 6.6%
Heaves 0 0 0 2 18 1.8%
Strangles 1 0 0 4 2 0.6%
Respiratory 6 7 1 23 15 4.6%
Neurologic 0 0 0 9 10 1.7%
Limb Fracture 2 1 1 5 8 1.5%
Other Injury 7 11 6 72 61 13.8%
Laminitis 0 0 2 17 38 5.0%
Lameness 8 2 3 75 120 18.3%
Hoof Problems 6 1 2 74 73 13.7%
Eye Problems 7 1 2 28 48 7.6%
Reproductive
Problems 2 0 1 32 13 4.2%
Other 4 0 1 11 27 3.8%
Unknown 1 0 0 6 33 3.5%
Loss of Use
A focal point of the health portion of the study was to determine the primary conditions
contributing to the loss of use of horses. From this information, the condition causing the
Purdue University is an equal access/equal opportunity/affirmative action university. If you have trouble accessing this document because of a disability, please contact PVM Web Communications at [email protected].
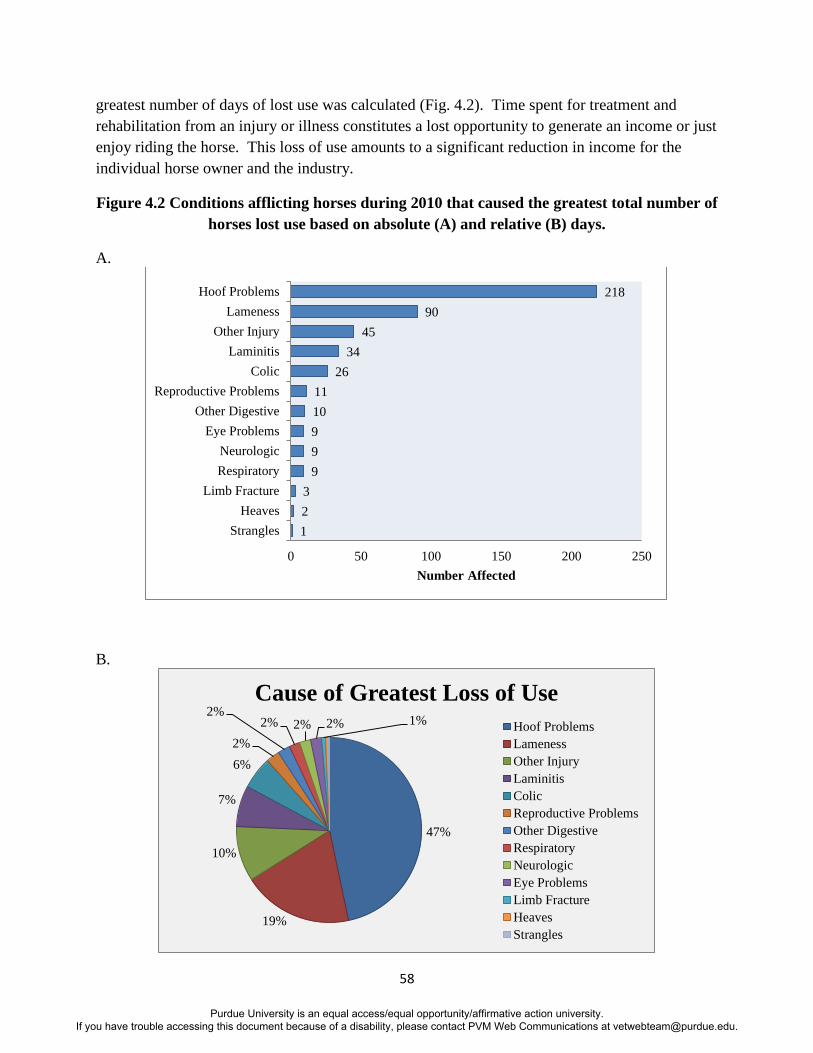
58
greatest number of days of lost use was calculated (Fig. 4.2). Time spent for treatment and
rehabilitation from an injury or illness constitutes a lost opportunity to generate an income or just
enjoy riding the horse. This loss of use amounts to a significant reduction in income for the
individual horse owner and the industry.
Figure 4.2 Conditions afflicting horses during 2010 that caused the greatest total number of
horses lost use based on absolute (A) and relative (B) days.
A.
B.
1
2
3
9
9
9
10
11
26
34
45
90
218
0 50 100 150 200 250
Strangles
Heaves
Limb Fracture
Respiratory
Neurologic
Eye Problems
Other Digestive
Reproductive Problems
Colic
Laminitis
Other Injury
Lameness
Hoof Problems
Number Affected
47%
19%
10%
7%
6%
2%
2% 2% 2% 2% 1%
Cause of Greatest Loss of Use
Hoof Problems
Lameness
Other Injury
Laminitis
Colic
Reproductive Problems
Other Digestive
Respiratory
Neurologic
Eye Problems
Limb Fracture
Heaves
Strangles
Purdue University is an equal access/equal opportunity/affirmative action university. If you have trouble accessing this document because of a disability, please contact PVM Web Communications at [email protected].
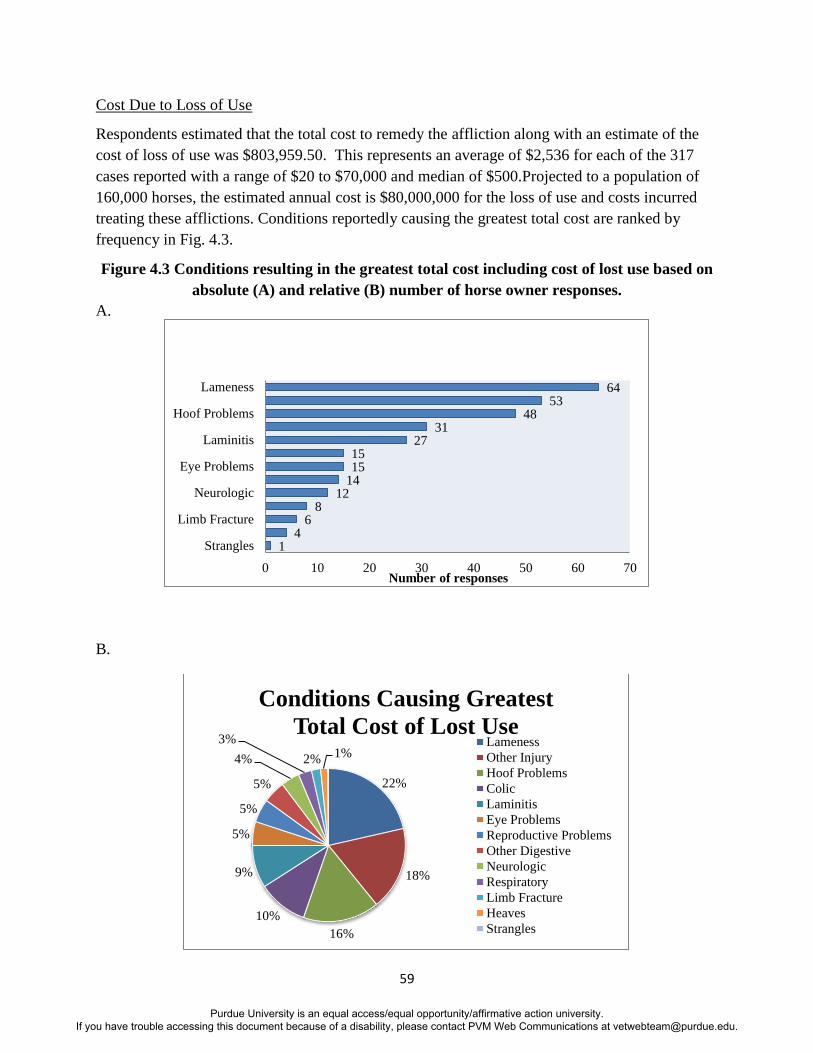
59
Cost Due to Loss of Use
Respondents estimated that the total cost to remedy the affliction along with an estimate of the
cost of loss of use was $803,959.50. This represents an average of $2,536 for each of the 317
cases reported with a range of $20 to $70,000 and median of $500.Projected to a population of
160,000 horses, the estimated annual cost is $80,000,000 for the loss of use and costs incurred
treating these afflictions. Conditions reportedly causing the greatest total cost are ranked by
frequency in Fig. 4.3.
Figure 4.3 Conditions resulting in the greatest total cost including cost of lost use based on
absolute (A) and relative (B) number of horse owner responses.
A.
B.
1 4
6 8
12 14 15 15
27 31
48 53
64
0 10 20 30 40 50 60 70
Strangles
Limb Fracture
Neurologic
Eye Problems
Laminitis
Hoof Problems
Lameness
Number of responses
22%
18%
16%
10%
9%
5%
5%
5%
4%
3%
2% 1%
Conditions Causing Greatest
Total Cost of Lost Use Lameness
Other Injury
Hoof Problems
Colic
Laminitis
Eye Problems
Reproductive Problems
Other Digestive
Neurologic
Respiratory
Limb Fracture
Heaves
Strangles
Purdue University is an equal access/equal opportunity/affirmative action university. If you have trouble accessing this document because of a disability, please contact PVM Web Communications at [email protected].
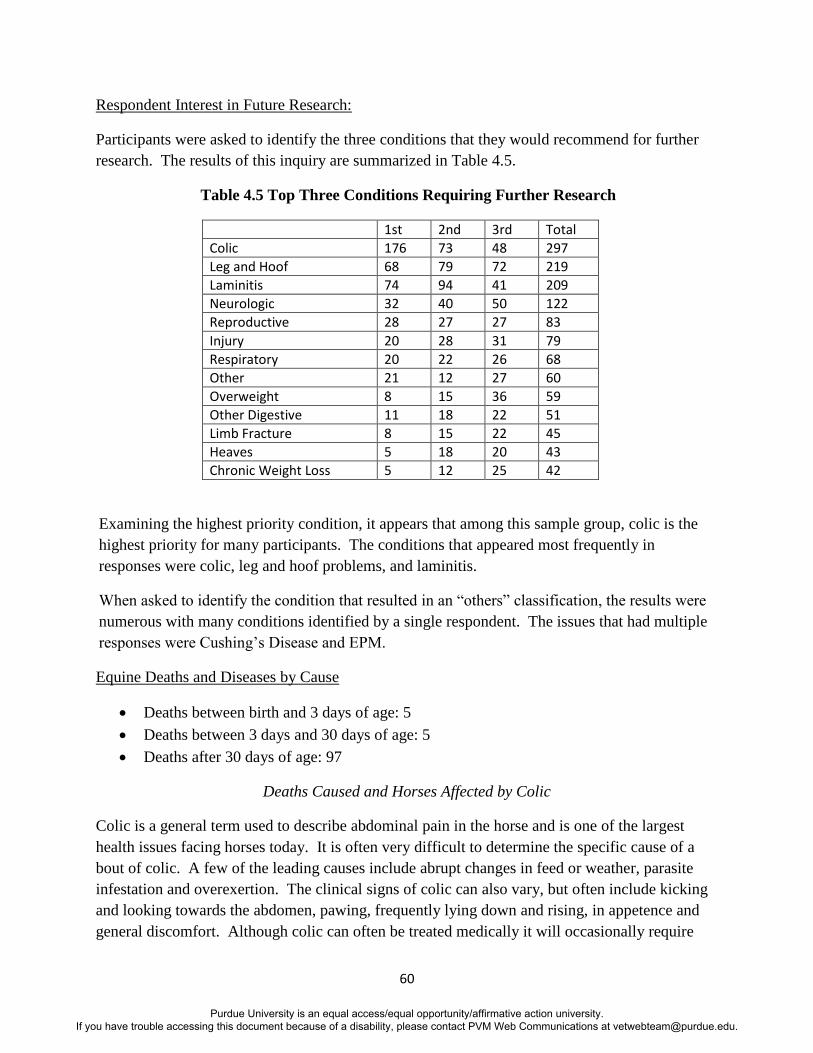
60
Respondent Interest in Future Research:
Participants were asked to identify the three conditions that they would recommend for further
research. The results of this inquiry are summarized in Table 4.5.
Table 4.5 Top Three Conditions Requiring Further Research
1st 2nd 3rd Total Colic 176 73 48 297 Leg and Hoof 68 79 72 219 Laminitis 74 94 41 209 Neurologic 32 40 50 122 Reproductive 28 27 27 83 Injury 20 28 31 79 Respiratory 20 22 26 68 Other 21 12 27 60 Overweight 8 15 36 59 Other Digestive 11 18 22 51 Limb Fracture 8 15 22 45 Heaves 5 18 20 43 Chronic Weight Loss 5 12 25 42
Examining the highest priority condition, it appears that among this sample group, colic is the
highest priority for many participants. The conditions that appeared most frequently in
responses were colic, leg and hoof problems, and laminitis.
When asked to identify the condition that resulted in an “others” classification, the results were
numerous with many conditions identified by a single respondent. The issues that had multiple
responses were Cushing’s Disease and EPM.
Equine Deaths and Diseases by Cause
Deaths between birth and 3 days of age: 5
Deaths between 3 days and 30 days of age: 5
Deaths after 30 days of age: 97
Deaths Caused and Horses Affected by Colic
Colic is a general term used to describe abdominal pain in the horse and is one of the largest
health issues facing horses today. It is often very difficult to determine the specific cause of a
bout of colic. A few of the leading causes include abrupt changes in feed or weather, parasite
infestation and overexertion. The clinical signs of colic can also vary, but often include kicking
and looking towards the abdomen, pawing, frequently lying down and rising, in appetence and
general discomfort. Although colic can often be treated medically it will occasionally require
Purdue University is an equal access/equal opportunity/affirmative action university. If you have trouble accessing this document because of a disability, please contact PVM Web Communications at [email protected].
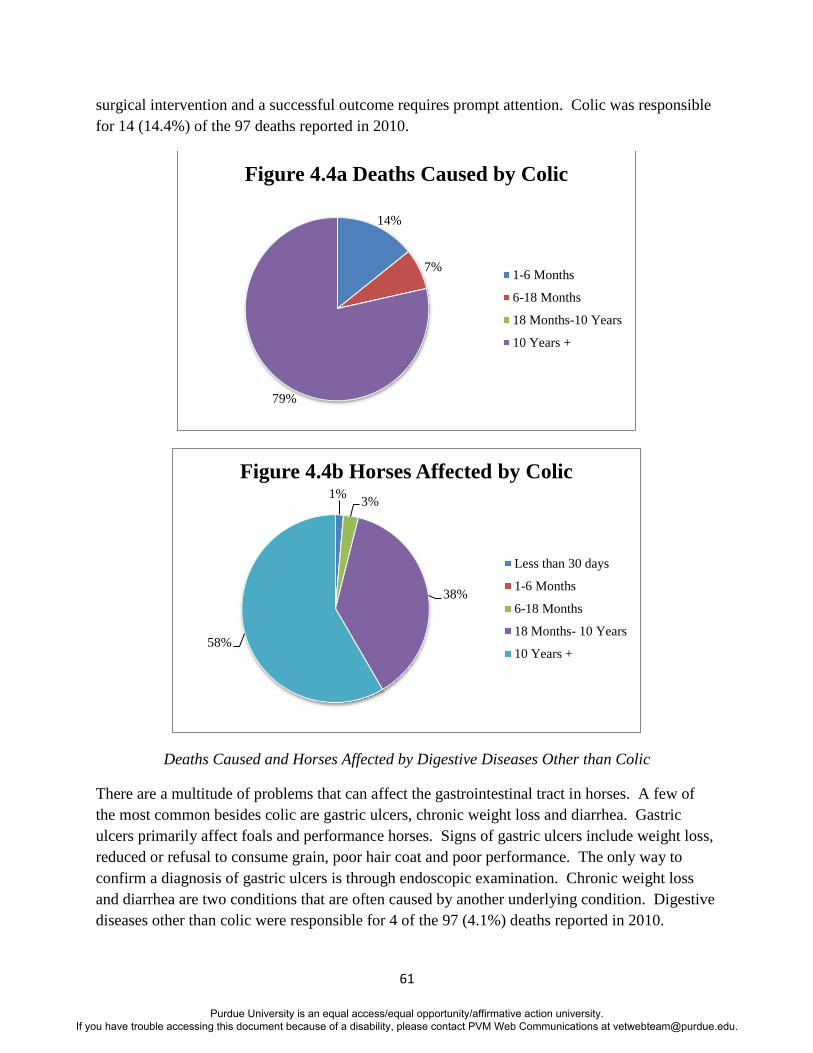
61
surgical intervention and a successful outcome requires prompt attention. Colic was responsible
for 14 (14.4%) of the 97 deaths reported in 2010.
Deaths Caused and Horses Affected by Digestive Diseases Other than Colic
There are a multitude of problems that can affect the gastrointestinal tract in horses. A few of
the most common besides colic are gastric ulcers, chronic weight loss and diarrhea. Gastric
ulcers primarily affect foals and performance horses. Signs of gastric ulcers include weight loss,
reduced or refusal to consume grain, poor hair coat and poor performance. The only way to
confirm a diagnosis of gastric ulcers is through endoscopic examination. Chronic weight loss
and diarrhea are two conditions that are often caused by another underlying condition. Digestive
diseases other than colic were responsible for 4 of the 97 (4.1%) deaths reported in 2010.
14%
7%
79%
Figure 4.4a Deaths Caused by Colic
1-6 Months
6-18 Months
18 Months-10 Years
10 Years +
1% 3%
38%
58%
Figure 4.4b Horses Affected by Colic
Less than 30 days
1-6 Months
6-18 Months
18 Months- 10 Years
10 Years +
Purdue University is an equal access/equal opportunity/affirmative action university. If you have trouble accessing this document because of a disability, please contact PVM Web Communications at [email protected].
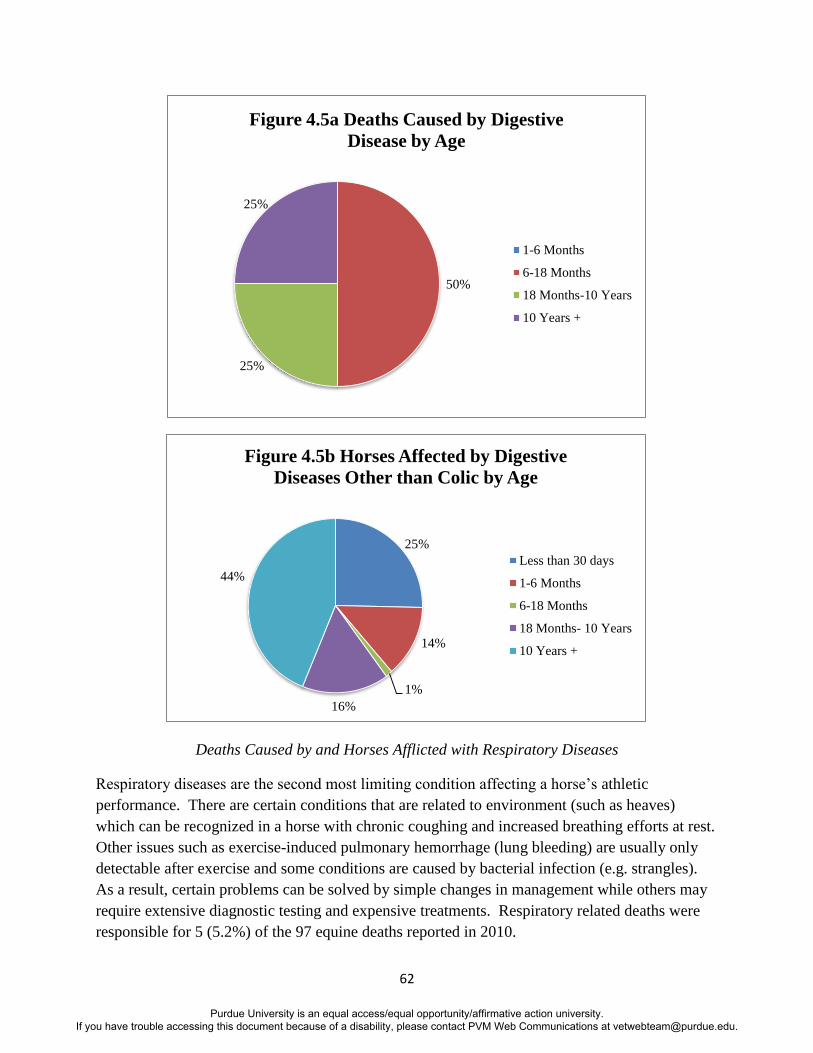
62
Deaths Caused by and Horses Afflicted with Respiratory Diseases
Respiratory diseases are the second most limiting condition affecting a horse’s athletic
performance. There are certain conditions that are related to environment (such as heaves)
which can be recognized in a horse with chronic coughing and increased breathing efforts at rest.
Other issues such as exercise-induced pulmonary hemorrhage (lung bleeding) are usually only
detectable after exercise and some conditions are caused by bacterial infection (e.g. strangles).
As a result, certain problems can be solved by simple changes in management while others may
require extensive diagnostic testing and expensive treatments. Respiratory related deaths were
responsible for 5 (5.2%) of the 97 equine deaths reported in 2010.
50%
25%
25%
Figure 4.5a Deaths Caused by Digestive
Disease by Age
1-6 Months
6-18 Months
18 Months-10 Years
10 Years +
25%
14%
1%
16%
44%
Figure 4.5b Horses Affected by Digestive
Diseases Other than Colic by Age
Less than 30 days
1-6 Months
6-18 Months
18 Months- 10 Years
10 Years +
Purdue University is an equal access/equal opportunity/affirmative action university. If you have trouble accessing this document because of a disability, please contact PVM Web Communications at [email protected].
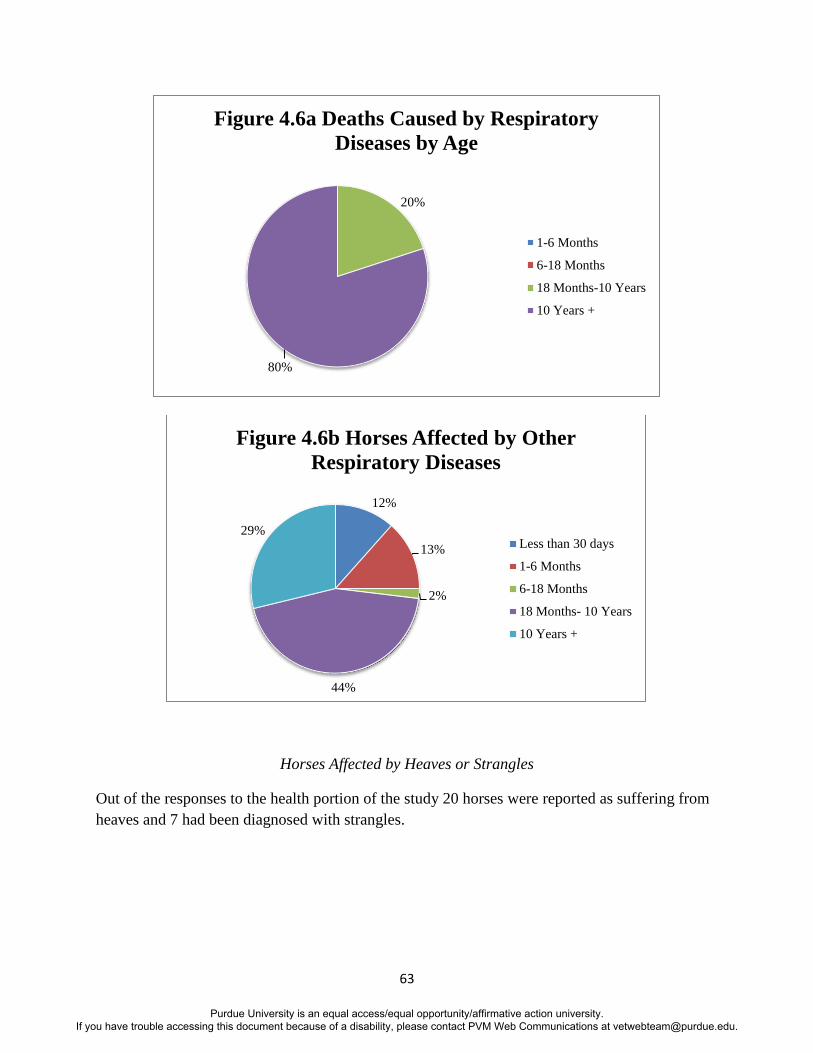
63
Horses Affected by Heaves or Strangles
Out of the responses to the health portion of the study 20 horses were reported as suffering from
heaves and 7 had been diagnosed with strangles.
20%
80%
Figure 4.6a Deaths Caused by Respiratory
Diseases by Age
1-6 Months
6-18 Months
18 Months-10 Years
10 Years +
12%
13%
2%
44%
29%
Figure 4.6b Horses Affected by Other
Respiratory Diseases
Less than 30 days
1-6 Months
6-18 Months
18 Months- 10 Years
10 Years +
Purdue University is an equal access/equal opportunity/affirmative action university. If you have trouble accessing this document because of a disability, please contact PVM Web Communications at [email protected].
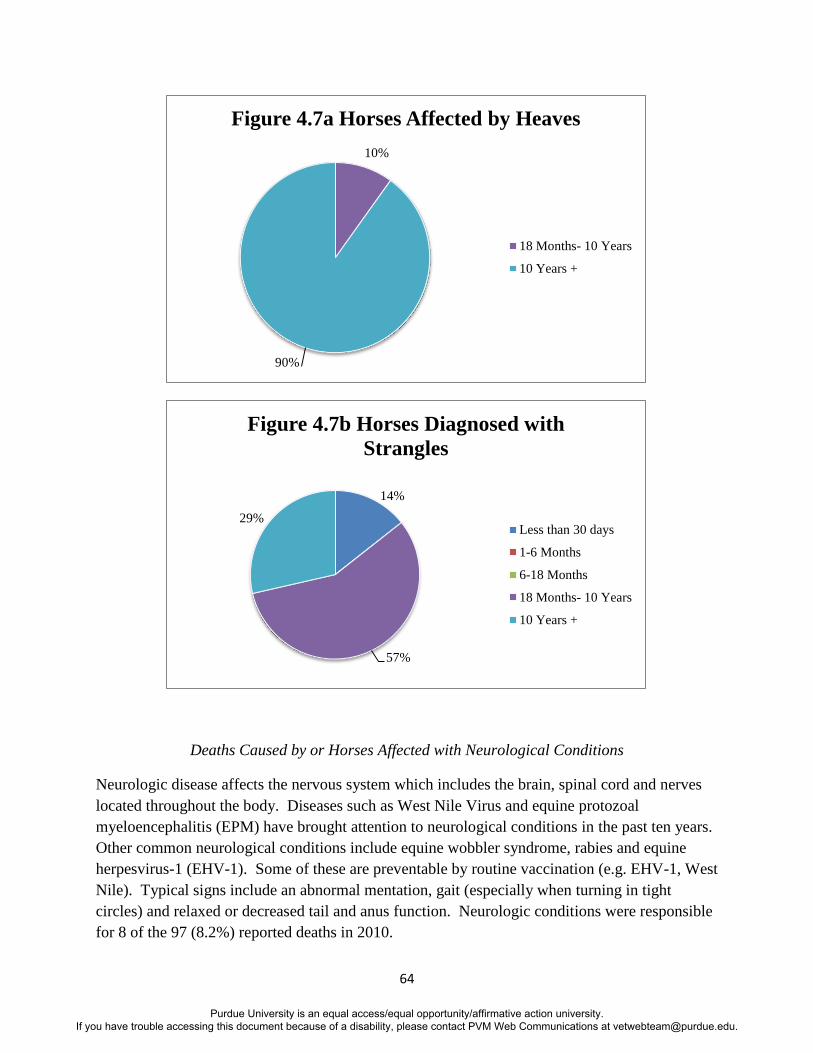
64
Deaths Caused by or Horses Affected with Neurological Conditions
Neurologic disease affects the nervous system which includes the brain, spinal cord and nerves
located throughout the body. Diseases such as West Nile Virus and equine protozoal
myeloencephalitis (EPM) have brought attention to neurological conditions in the past ten years.
Other common neurological conditions include equine wobbler syndrome, rabies and equine
herpesvirus-1 (EHV-1). Some of these are preventable by routine vaccination (e.g. EHV-1, West
Nile). Typical signs include an abnormal mentation, gait (especially when turning in tight
circles) and relaxed or decreased tail and anus function. Neurologic conditions were responsible
for 8 of the 97 (8.2%) reported deaths in 2010.
10%
90%
Figure 4.7a Horses Affected by Heaves
18 Months- 10 Years
10 Years +
14%
57%
29%
Figure 4.7b Horses Diagnosed with
Strangles
Less than 30 days
1-6 Months
6-18 Months
18 Months- 10 Years
10 Years +
Purdue University is an equal access/equal opportunity/affirmative action university. If you have trouble accessing this document because of a disability, please contact PVM Web Communications at [email protected].

65
Deaths Caused by or Horses Affected with Laminitis/Founder
Laminitis or founder is a complex condition that occurs when the hoof laminae (attached to both
the hoof wall and coffin bone) begin to degenerate. Although laminitis can affect all four feet, it
is often more common in the front feet. The cause of laminitis can be one of numerous reasons
including a carbohydrate overload from consuming too much grain or fresh, lush grass, colic,
severe infection, a retained placenta (in mares) or hormone imbalances. Clinical signs of a horse
exhibiting laminitis include a shortened stride, increased digital pulse strength, hooves that feel
hot to the touch and changing the posture to shift more weight on the heels (front feet out in front
and hind feet under the body). There are many different treatments depending on the severity of
12%
13%
75%
Figure 4.8a Deaths Caused by
Neurological Conditions
1-6 Months
6-18 Months
18 Months-10 Years
10 Years +
47%
53%
Figure 4.8b Horses Afflicted with
Neurologic Conditions
18 Months- 10 Years
10 Years +
Purdue University is an equal access/equal opportunity/affirmative action university. If you have trouble accessing this document because of a disability, please contact PVM Web Communications at [email protected].
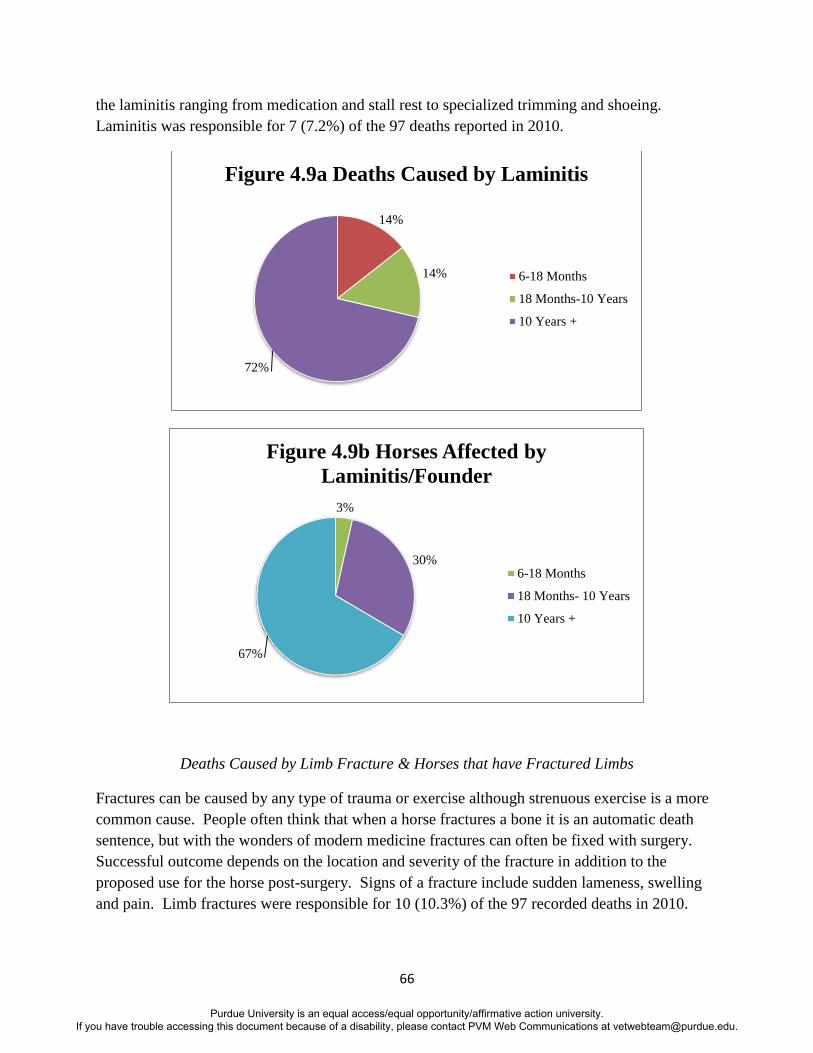
66
the laminitis ranging from medication and stall rest to specialized trimming and shoeing.
Laminitis was responsible for 7 (7.2%) of the 97 deaths reported in 2010.
Deaths Caused by Limb Fracture & Horses that have Fractured Limbs
Fractures can be caused by any type of trauma or exercise although strenuous exercise is a more
common cause. People often think that when a horse fractures a bone it is an automatic death
sentence, but with the wonders of modern medicine fractures can often be fixed with surgery.
Successful outcome depends on the location and severity of the fracture in addition to the
proposed use for the horse post-surgery. Signs of a fracture include sudden lameness, swelling
and pain. Limb fractures were responsible for 10 (10.3%) of the 97 recorded deaths in 2010.
14%
14%
72%
Figure 4.9a Deaths Caused by Laminitis
6-18 Months
18 Months-10 Years
10 Years +
3%
30%
67%
Figure 4.9b Horses Affected by
Laminitis/Founder
6-18 Months
18 Months- 10 Years
10 Years +
Purdue University is an equal access/equal opportunity/affirmative action university. If you have trouble accessing this document because of a disability, please contact PVM Web Communications at [email protected].
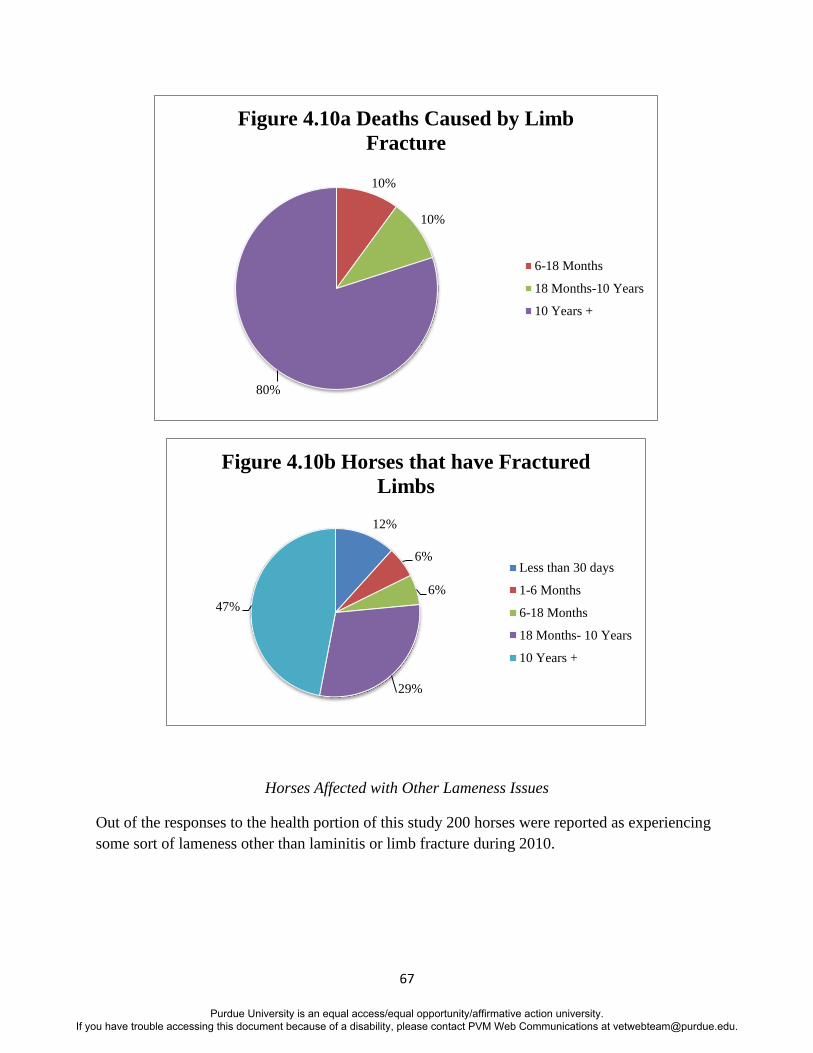
67
Horses Affected with Other Lameness Issues
Out of the responses to the health portion of this study 200 horses were reported as experiencing
some sort of lameness other than laminitis or limb fracture during 2010.
10%
10%
80%
Figure 4.10a Deaths Caused by Limb
Fracture
6-18 Months
18 Months-10 Years
10 Years +
12%
6%
6%
29%
47%
Figure 4.10b Horses that have Fractured
Limbs
Less than 30 days
1-6 Months
6-18 Months
18 Months- 10 Years
10 Years +
Purdue University is an equal access/equal opportunity/affirmative action university. If you have trouble accessing this document because of a disability, please contact PVM Web Communications at [email protected].
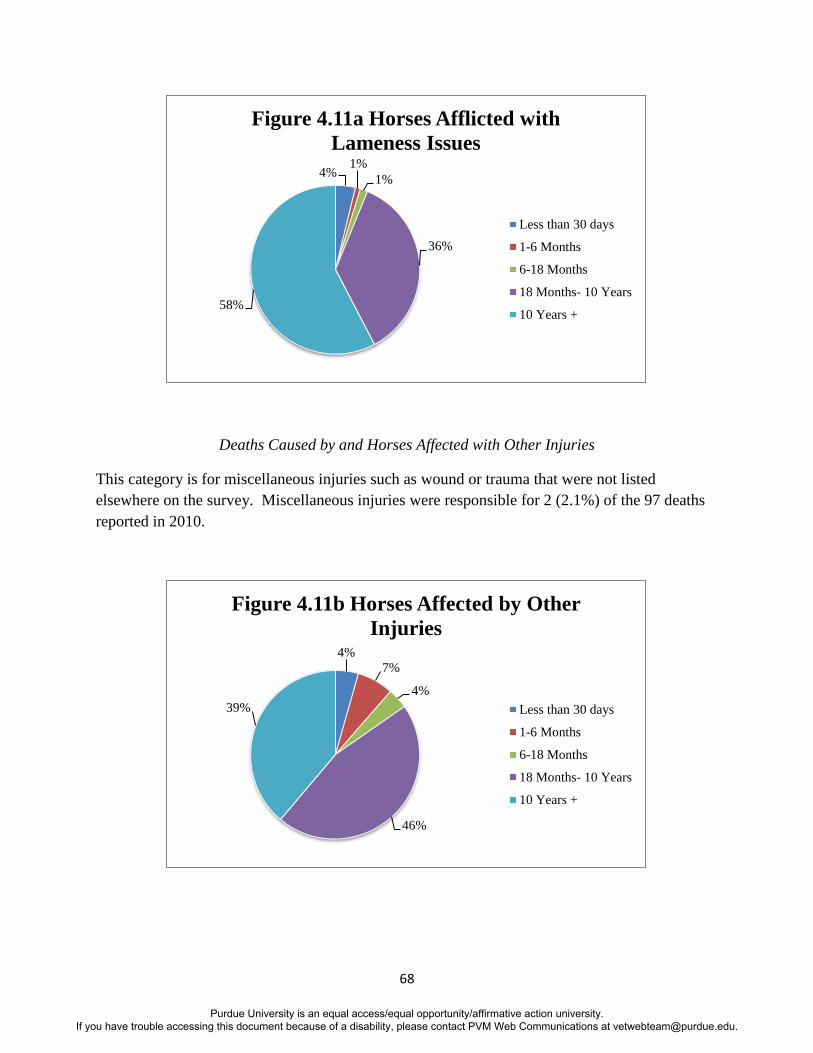
68
Deaths Caused by and Horses Affected with Other Injuries
This category is for miscellaneous injuries such as wound or trauma that were not listed
elsewhere on the survey. Miscellaneous injuries were responsible for 2 (2.1%) of the 97 deaths
reported in 2010.
4% 1%
1%
36%
58%
Figure 4.11a Horses Afflicted with
Lameness Issues
Less than 30 days
1-6 Months
6-18 Months
18 Months- 10 Years
10 Years +
4%
7%
4%
46%
39%
Figure 4.11b Horses Affected by Other
Injuries
Less than 30 days
1-6 Months
6-18 Months
18 Months- 10 Years
10 Years +
Purdue University is an equal access/equal opportunity/affirmative action university. If you have trouble accessing this document because of a disability, please contact PVM Web Communications at [email protected].
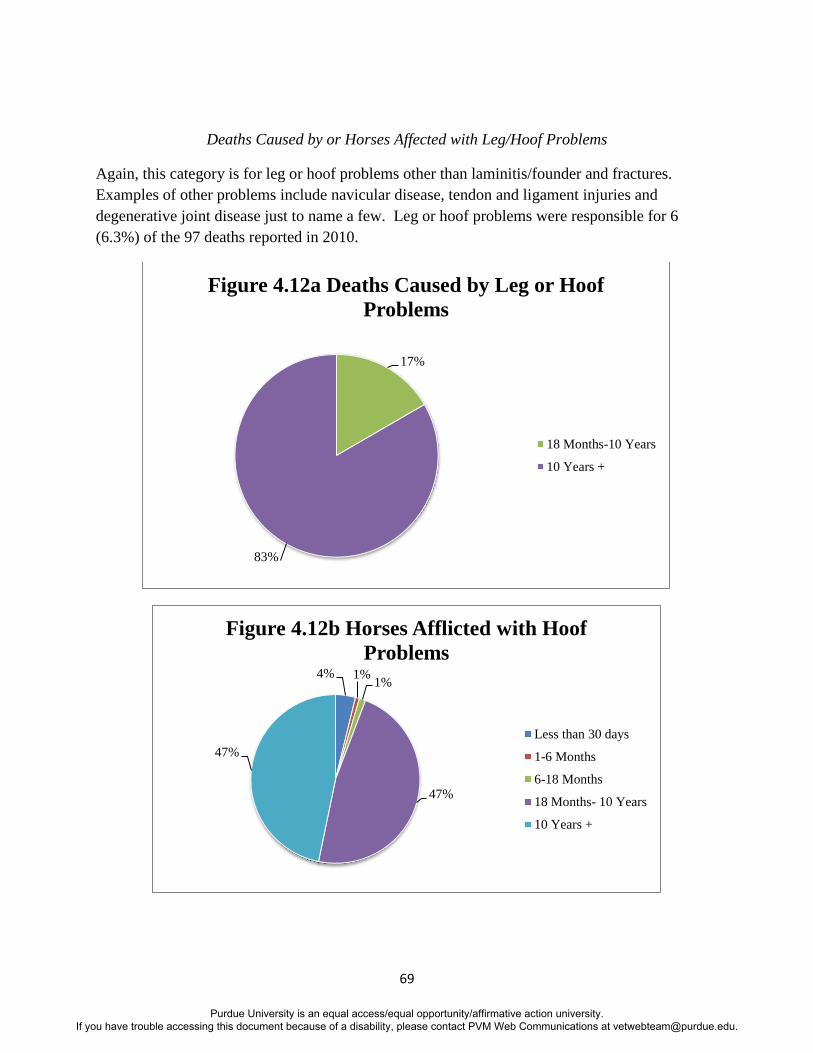
69
Deaths Caused by or Horses Affected with Leg/Hoof Problems
Again, this category is for leg or hoof problems other than laminitis/founder and fractures.
Examples of other problems include navicular disease, tendon and ligament injuries and
degenerative joint disease just to name a few. Leg or hoof problems were responsible for 6
(6.3%) of the 97 deaths reported in 2010.
17%
83%
Figure 4.12a Deaths Caused by Leg or Hoof
Problems
18 Months-10 Years
10 Years +
4% 1% 1%
47%
47%
Figure 4.12b Horses Afflicted with Hoof
Problems
Less than 30 days
1-6 Months
6-18 Months
18 Months- 10 Years
10 Years +
Purdue University is an equal access/equal opportunity/affirmative action university. If you have trouble accessing this document because of a disability, please contact PVM Web Communications at [email protected].
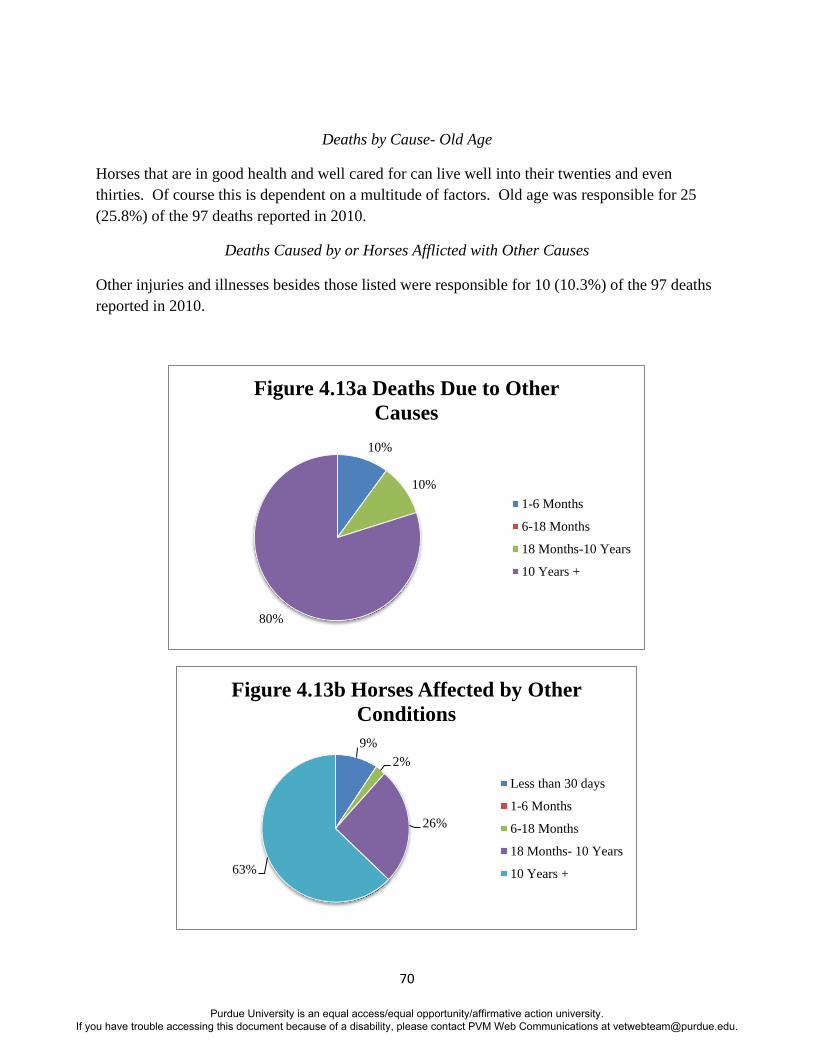
70
Deaths by Cause- Old Age
Horses that are in good health and well cared for can live well into their twenties and even
thirties. Of course this is dependent on a multitude of factors. Old age was responsible for 25
(25.8%) of the 97 deaths reported in 2010.
Deaths Caused by or Horses Afflicted with Other Causes
Other injuries and illnesses besides those listed were responsible for 10 (10.3%) of the 97 deaths
reported in 2010.
10%
10%
80%
Figure 4.13a Deaths Due to Other
Causes
1-6 Months
6-18 Months
18 Months-10 Years
10 Years +
9%
2%
26%
63%
Figure 4.13b Horses Affected by Other
Conditions
Less than 30 days
1-6 Months
6-18 Months
18 Months- 10 Years
10 Years +
Purdue University is an equal access/equal opportunity/affirmative action university. If you have trouble accessing this document because of a disability, please contact PVM Web Communications at [email protected].
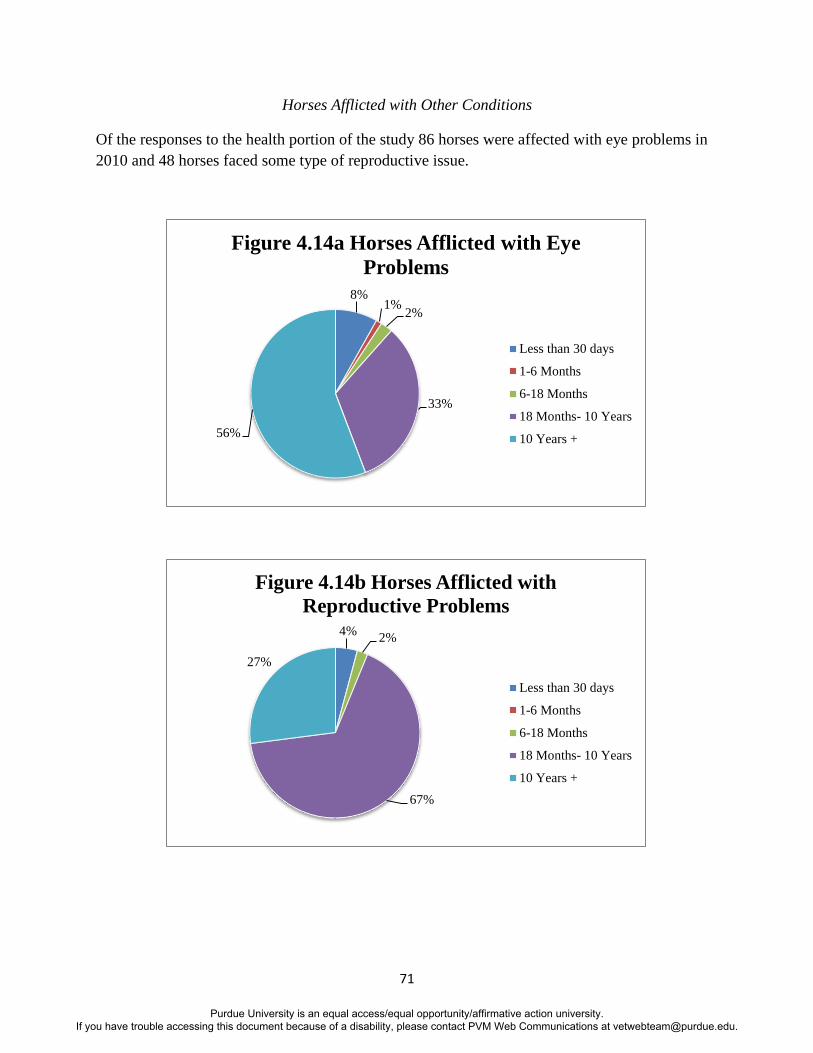
71
Horses Afflicted with Other Conditions
Of the responses to the health portion of the study 86 horses were affected with eye problems in
2010 and 48 horses faced some type of reproductive issue.
8% 1%
2%
33%
56%
Figure 4.14a Horses Afflicted with Eye
Problems
Less than 30 days
1-6 Months
6-18 Months
18 Months- 10 Years
10 Years +
4% 2%
67%
27%
Figure 4.14b Horses Afflicted with
Reproductive Problems
Less than 30 days
1-6 Months
6-18 Months
18 Months- 10 Years
10 Years +
Purdue University is an equal access/equal opportunity/affirmative action university. If you have trouble accessing this document because of a disability, please contact PVM Web Communications at [email protected].
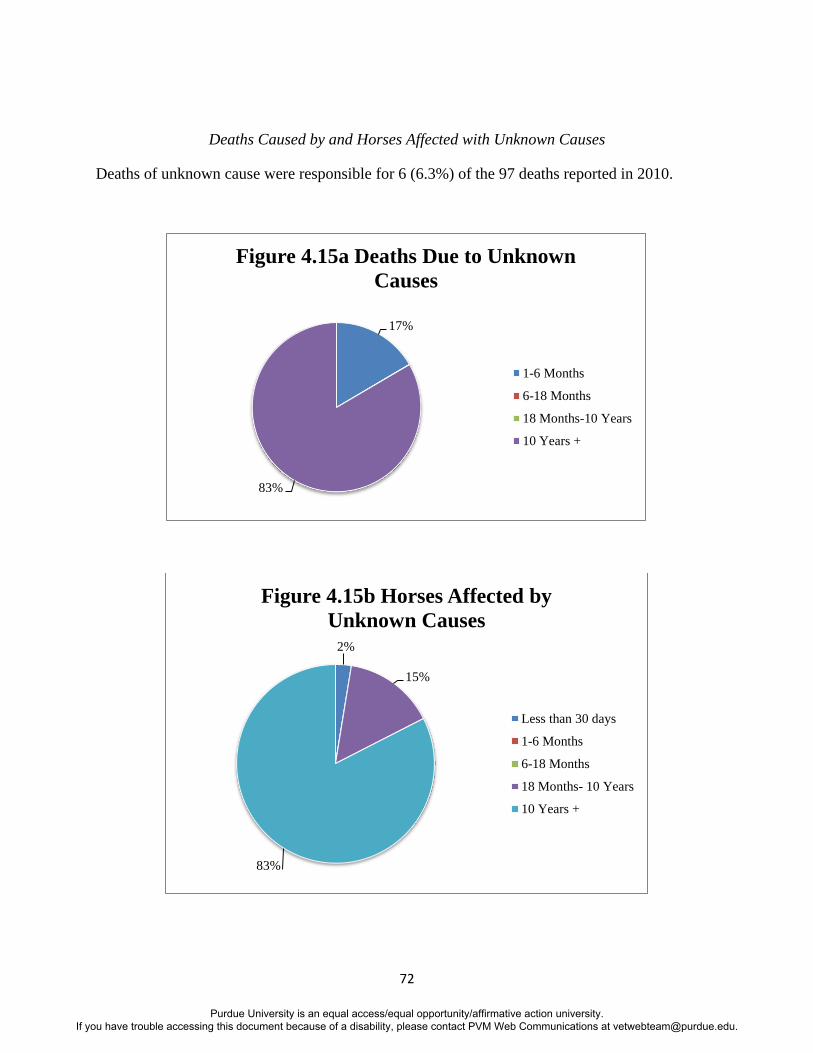
72
Deaths Caused by and Horses Affected with Unknown Causes
Deaths of unknown cause were responsible for 6 (6.3%) of the 97 deaths reported in 2010.
17%
83%
Figure 4.15a Deaths Due to Unknown
Causes
1-6 Months
6-18 Months
18 Months-10 Years
10 Years +
2%
15%
83%
Figure 4.15b Horses Affected by
Unknown Causes
Less than 30 days
1-6 Months
6-18 Months
18 Months- 10 Years
10 Years +
Purdue University is an equal access/equal opportunity/affirmative action university. If you have trouble accessing this document because of a disability, please contact PVM Web Communications at [email protected].
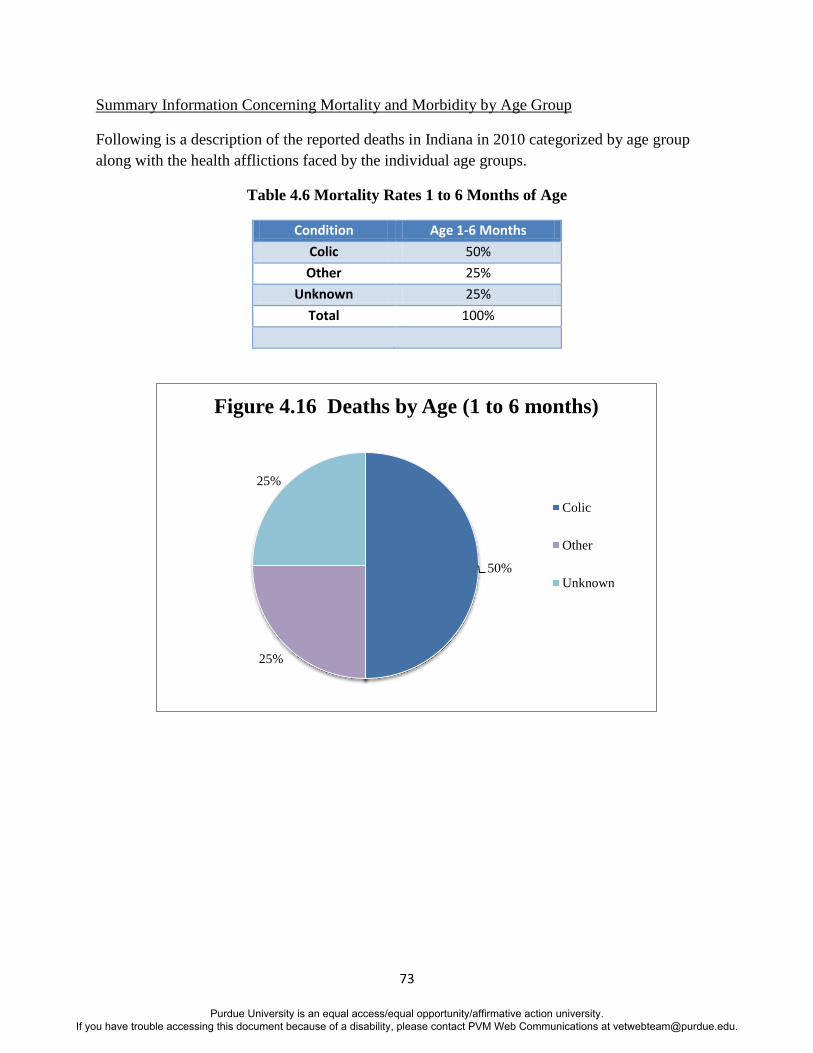
73
Summary Information Concerning Mortality and Morbidity by Age Group
Following is a description of the reported deaths in Indiana in 2010 categorized by age group
along with the health afflictions faced by the individual age groups.
Table 4.6 Mortality Rates 1 to 6 Months of Age
Condition Age 1-6 Months
Colic 50%
Other 25%
Unknown 25%
Total 100%
50%
25%
25%
Figure 4.16 Deaths by Age (1 to 6 months)
Colic
Other
Unknown
Purdue University is an equal access/equal opportunity/affirmative action university. If you have trouble accessing this document because of a disability, please contact PVM Web Communications at [email protected].
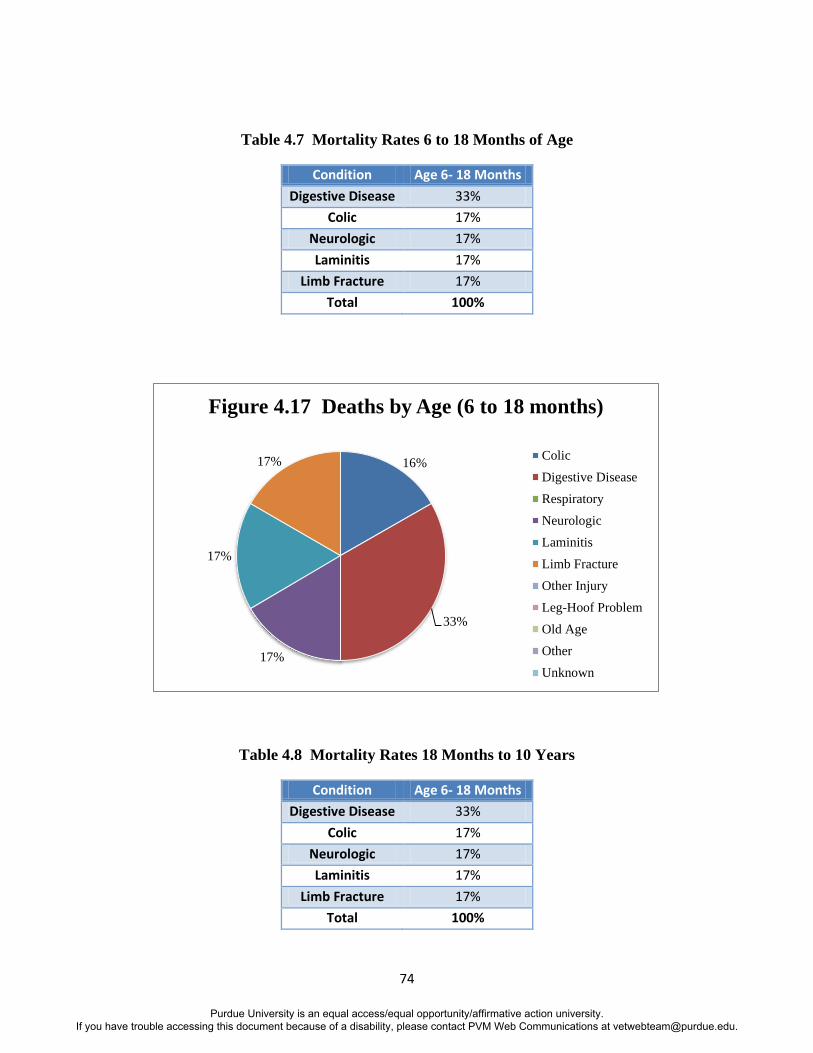
74
Table 4.7 Mortality Rates 6 to 18 Months of Age
Condition Age 6- 18 Months
Digestive Disease 33%
Colic 17%
Neurologic 17%
Laminitis 17%
Limb Fracture 17%
Total 100%
Table 4.8 Mortality Rates 18 Months to 10 Years
Condition Age 6- 18 Months
Digestive Disease 33%
Colic 17%
Neurologic 17%
Laminitis 17%
Limb Fracture 17%
Total 100%
16%
33%
17%
17%
17%
Figure 4.17 Deaths by Age (6 to 18 months)
Colic
Digestive Disease
Respiratory
Neurologic
Laminitis
Limb Fracture
Other Injury
Leg-Hoof Problem
Old Age
Other
Unknown
Purdue University is an equal access/equal opportunity/affirmative action university. If you have trouble accessing this document because of a disability, please contact PVM Web Communications at [email protected].
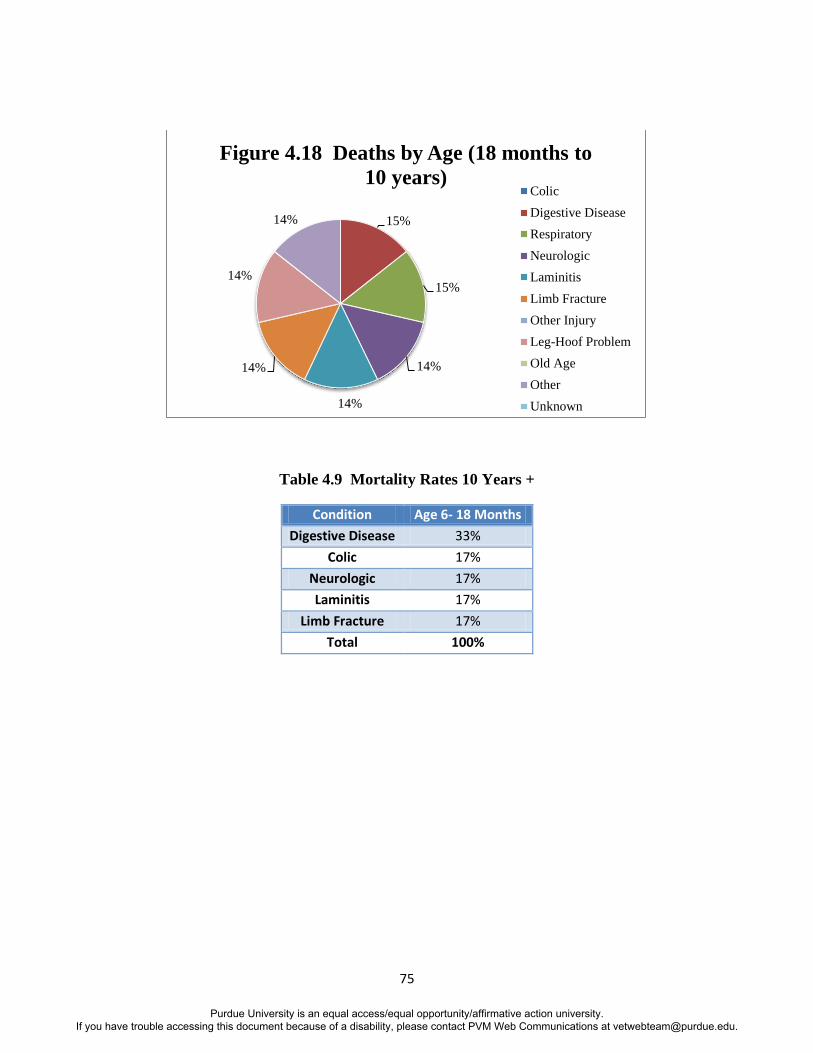
75
Table 4.9 Mortality Rates 10 Years +
Condition Age 6- 18 Months
Digestive Disease 33%
Colic 17%
Neurologic 17%
Laminitis 17%
Limb Fracture 17%
Total 100%
15%
15%
14%
14%
14%
14%
14%
Figure 4.18 Deaths by Age (18 months to
10 years) Colic
Digestive Disease
Respiratory
Neurologic
Laminitis
Limb Fracture
Other Injury
Leg-Hoof Problem
Old Age
Other
Unknown
Purdue University is an equal access/equal opportunity/affirmative action university. If you have trouble accessing this document because of a disability, please contact PVM Web Communications at [email protected].
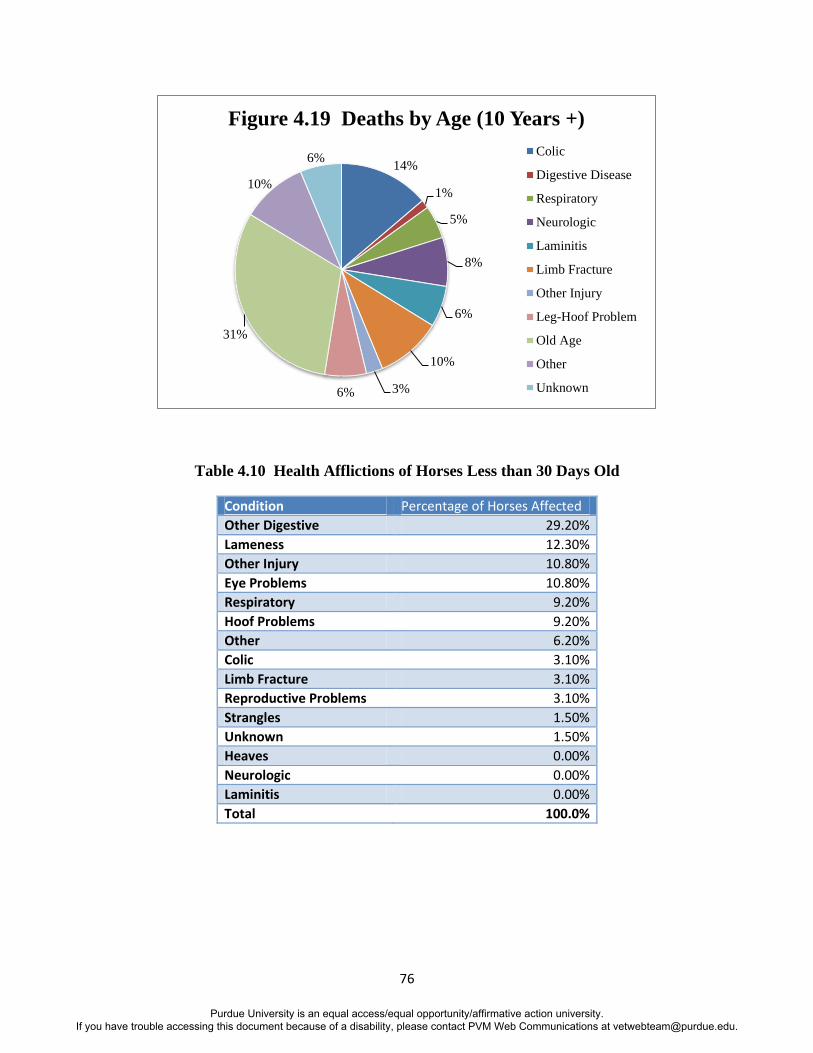
76
Table 4.10 Health Afflictions of Horses Less than 30 Days Old
Condition Percentage of Horses Affected
Other Digestive 29.20%
Lameness 12.30%
Other Injury 10.80%
Eye Problems 10.80%
Respiratory 9.20%
Hoof Problems 9.20%
Other 6.20%
Colic 3.10%
Limb Fracture 3.10%
Reproductive Problems 3.10%
Strangles 1.50%
Unknown 1.50%
Heaves 0.00%
Neurologic 0.00%
Laminitis 0.00%
Total 100.0%
14%
1%
5%
8%
6%
10%
3% 6%
31%
10%
6%
Figure 4.19 Deaths by Age (10 Years +)
Colic
Digestive Disease
Respiratory
Neurologic
Laminitis
Limb Fracture
Other Injury
Leg-Hoof Problem
Old Age
Other
Unknown
Purdue University is an equal access/equal opportunity/affirmative action university. If you have trouble accessing this document because of a disability, please contact PVM Web Communications at [email protected].
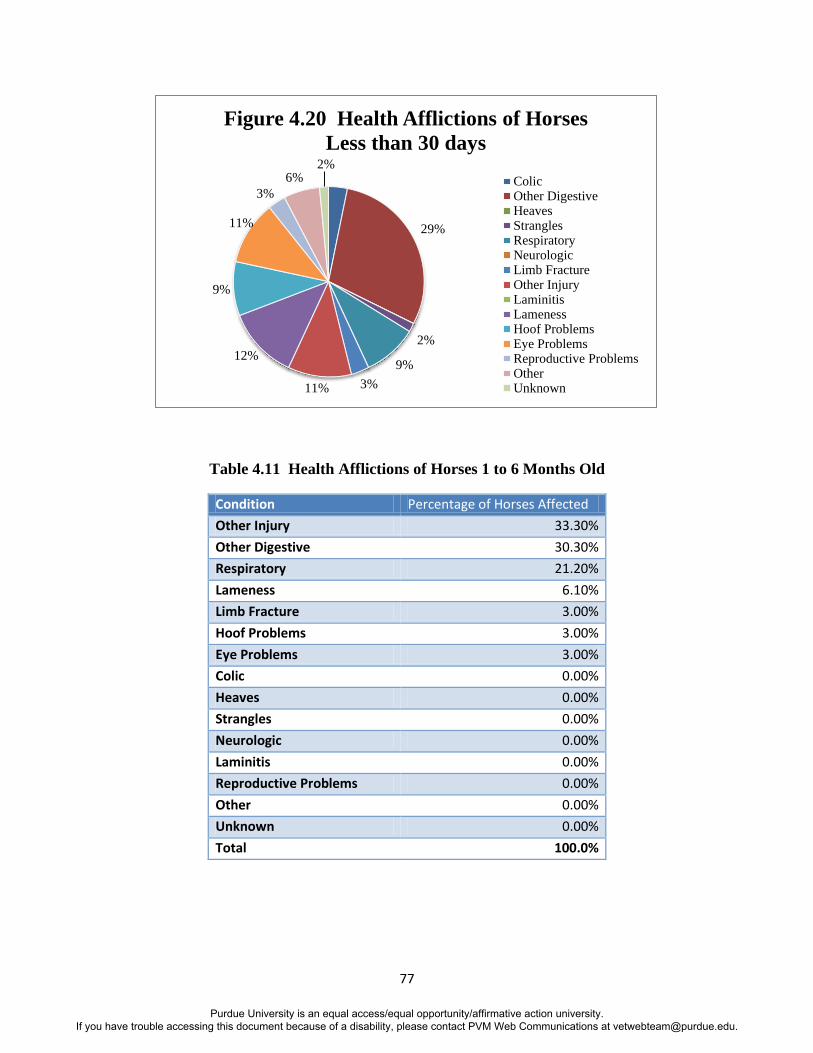
77
Table 4.11 Health Afflictions of Horses 1 to 6 Months Old
Condition Percentage of Horses Affected
Other Injury 33.30%
Other Digestive 30.30%
Respiratory 21.20%
Lameness 6.10%
Limb Fracture 3.00%
Hoof Problems 3.00%
Eye Problems 3.00%
Colic 0.00%
Heaves 0.00%
Strangles 0.00%
Neurologic 0.00%
Laminitis 0.00%
Reproductive Problems 0.00%
Other 0.00%
Unknown 0.00%
Total 100.0%
29%
2%
9%
3% 11%
12%
9%
11%
3%
6% 2%
Figure 4.20 Health Afflictions of Horses
Less than 30 days
ColicOther DigestiveHeavesStranglesRespiratoryNeurologicLimb FractureOther InjuryLaminitisLamenessHoof ProblemsEye ProblemsReproductive ProblemsOtherUnknown
Purdue University is an equal access/equal opportunity/affirmative action university. If you have trouble accessing this document because of a disability, please contact PVM Web Communications at [email protected].
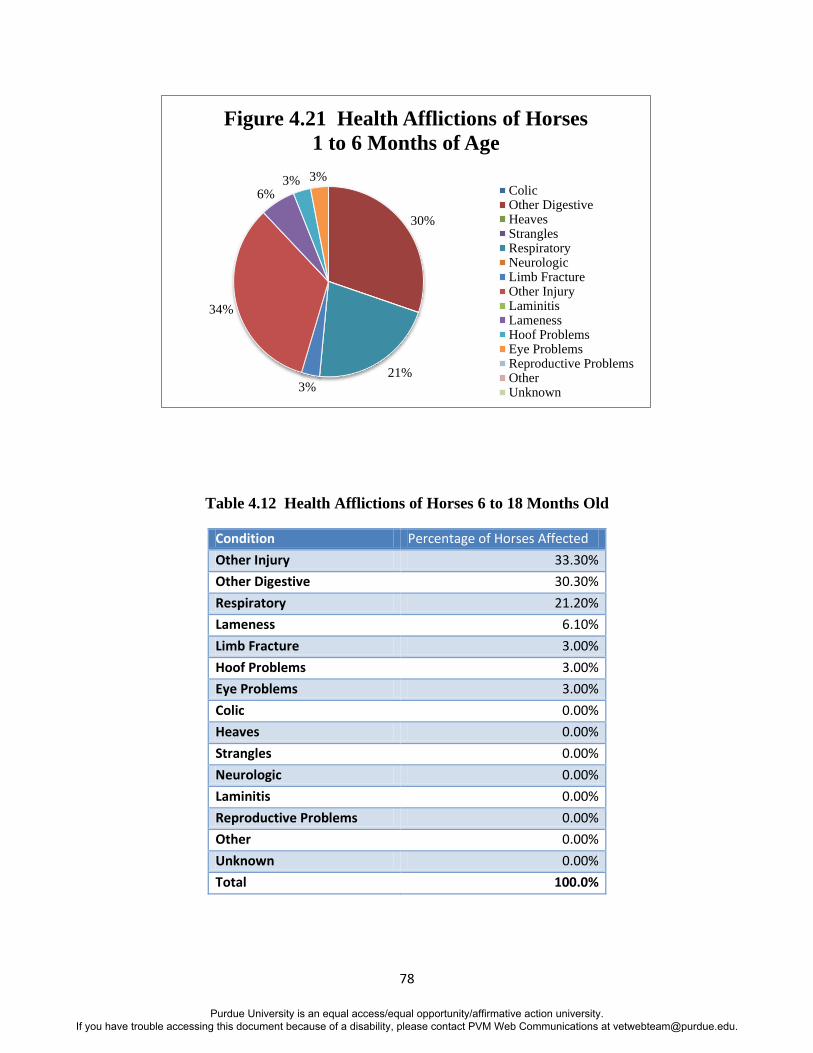
78
Table 4.12 Health Afflictions of Horses 6 to 18 Months Old
Condition Percentage of Horses Affected
Other Injury 33.30%
Other Digestive 30.30%
Respiratory 21.20%
Lameness 6.10%
Limb Fracture 3.00%
Hoof Problems 3.00%
Eye Problems 3.00%
Colic 0.00%
Heaves 0.00%
Strangles 0.00%
Neurologic 0.00%
Laminitis 0.00%
Reproductive Problems 0.00%
Other 0.00%
Unknown 0.00%
Total 100.0%
30%
21% 3%
34%
6% 3% 3%
Figure 4.21 Health Afflictions of Horses
1 to 6 Months of Age
ColicOther DigestiveHeavesStranglesRespiratoryNeurologicLimb FractureOther InjuryLaminitisLamenessHoof ProblemsEye ProblemsReproductive ProblemsOtherUnknown
Purdue University is an equal access/equal opportunity/affirmative action university. If you have trouble accessing this document because of a disability, please contact PVM Web Communications at [email protected].
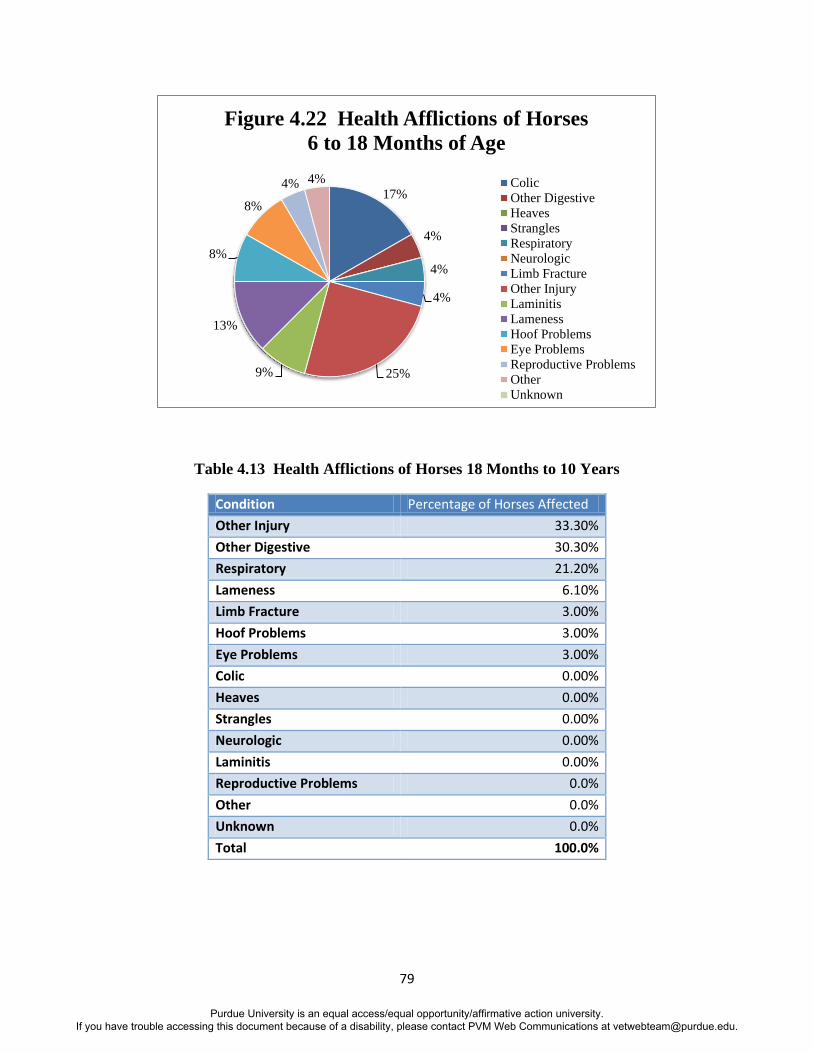
79
Table 4.13 Health Afflictions of Horses 18 Months to 10 Years
Condition Percentage of Horses Affected
Other Injury 33.30%
Other Digestive 30.30%
Respiratory 21.20%
Lameness 6.10%
Limb Fracture 3.00%
Hoof Problems 3.00%
Eye Problems 3.00%
Colic 0.00%
Heaves 0.00%
Strangles 0.00%
Neurologic 0.00%
Laminitis 0.00%
Reproductive Problems 0.0%
Other 0.0%
Unknown 0.0%
Total 100.0%
17%
4%
4%
4%
25% 9%
13%
8%
8%
4% 4%
Figure 4.22 Health Afflictions of Horses
6 to 18 Months of Age
Colic
Other Digestive
Heaves
Strangles
Respiratory
Neurologic
Limb Fracture
Other Injury
Laminitis
Lameness
Hoof Problems
Eye Problems
Reproductive Problems
Other
Unknown
Purdue University is an equal access/equal opportunity/affirmative action university. If you have trouble accessing this document because of a disability, please contact PVM Web Communications at [email protected].
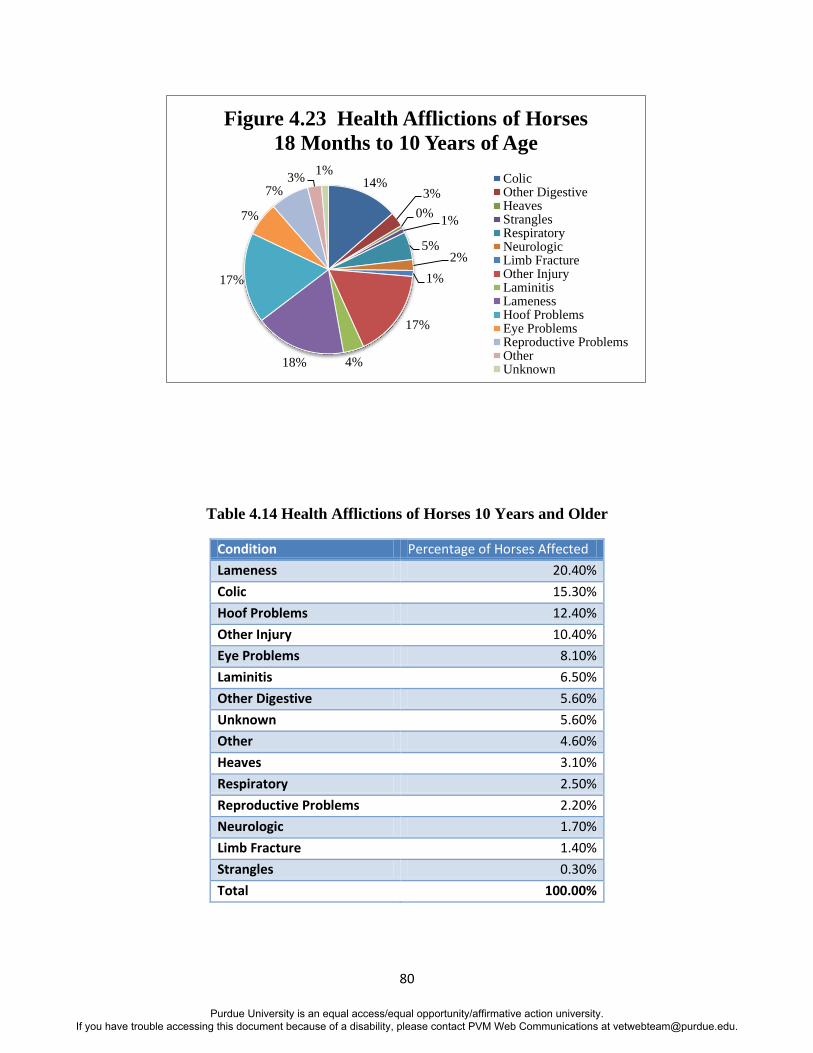
80
Table 4.14 Health Afflictions of Horses 10 Years and Older
Condition Percentage of Horses Affected
Lameness 20.40%
Colic 15.30%
Hoof Problems 12.40%
Other Injury 10.40%
Eye Problems 8.10%
Laminitis 6.50%
Other Digestive 5.60%
Unknown 5.60%
Other 4.60%
Heaves 3.10%
Respiratory 2.50%
Reproductive Problems 2.20%
Neurologic 1.70%
Limb Fracture 1.40%
Strangles 0.30%
Total 100.00%
14% 3%
0% 1%
5% 2%
1%
17%
4% 18%
17%
7%
7% 3%
1%
Figure 4.23 Health Afflictions of Horses
18 Months to 10 Years of Age
ColicOther DigestiveHeavesStranglesRespiratoryNeurologicLimb FractureOther InjuryLaminitisLamenessHoof ProblemsEye ProblemsReproductive ProblemsOtherUnknown
Purdue University is an equal access/equal opportunity/affirmative action university. If you have trouble accessing this document because of a disability, please contact PVM Web Communications at [email protected].
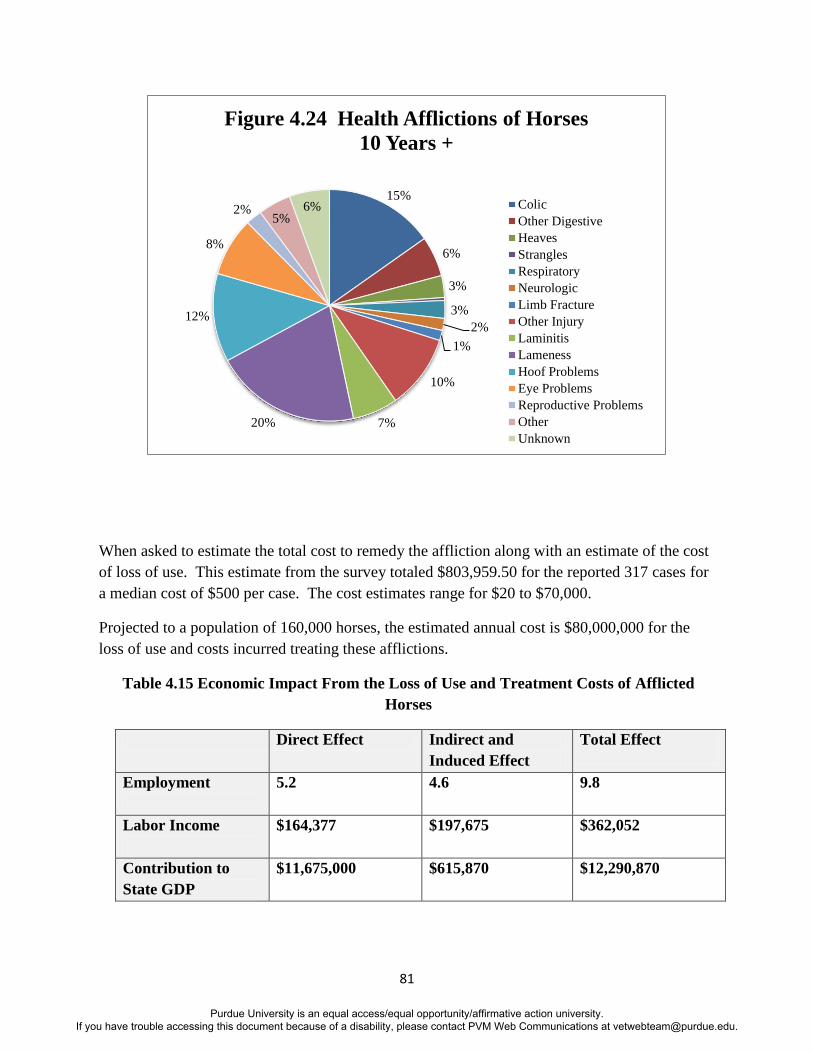
81
When asked to estimate the total cost to remedy the affliction along with an estimate of the cost
of loss of use. This estimate from the survey totaled $803,959.50 for the reported 317 cases for
a median cost of $500 per case. The cost estimates range for $20 to $70,000.
Projected to a population of 160,000 horses, the estimated annual cost is $80,000,000 for the
loss of use and costs incurred treating these afflictions.
Table 4.15 Economic Impact From the Loss of Use and Treatment Costs of Afflicted
Horses
Direct Effect Indirect and
Induced Effect
Total Effect
Employment
5.2 4.6 9.8
Labor Income
$164,377 $197,675 $362,052
Contribution to
State GDP
$11,675,000 $615,870 $12,290,870
15%
6%
3%
3%
2%
1%
10%
7% 20%
12%
8%
2% 5%
6%
Figure 4.24 Health Afflictions of Horses
10 Years +
Colic
Other Digestive
Heaves
Strangles
Respiratory
Neurologic
Limb Fracture
Other Injury
Laminitis
Lameness
Hoof Problems
Eye Problems
Reproductive Problems
Other
Unknown
Purdue University is an equal access/equal opportunity/affirmative action university. If you have trouble accessing this document because of a disability, please contact PVM Web Communications at [email protected].
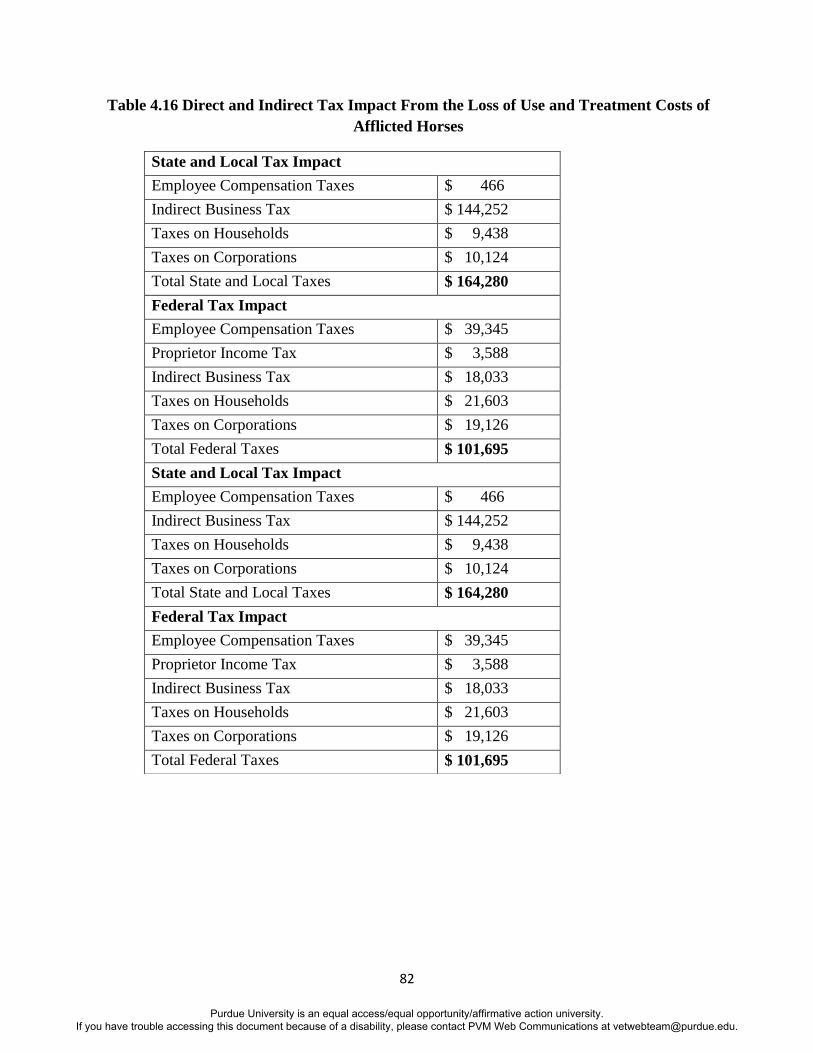
82
Table 4.16 Direct and Indirect Tax Impact From the Loss of Use and Treatment Costs of
Afflicted Horses
State and Local Tax Impact
Employee Compensation Taxes $ 466
Indirect Business Tax $ 144,252
Taxes on Households $ 9,438
Taxes on Corporations $ 10,124
Total State and Local Taxes
$ 164,280
Federal Tax Impact
Employee Compensation Taxes $ 39,345
Proprietor Income Tax $ 3,588
Indirect Business Tax $ 18,033
Taxes on Households $ 21,603
Taxes on Corporations $ 19,126
Total Federal Taxes
$ 101,695
Purdue University is an equal access/equal opportunity/affirmative action university. If you have trouble accessing this document because of a disability, please contact PVM Web Communications at [email protected].
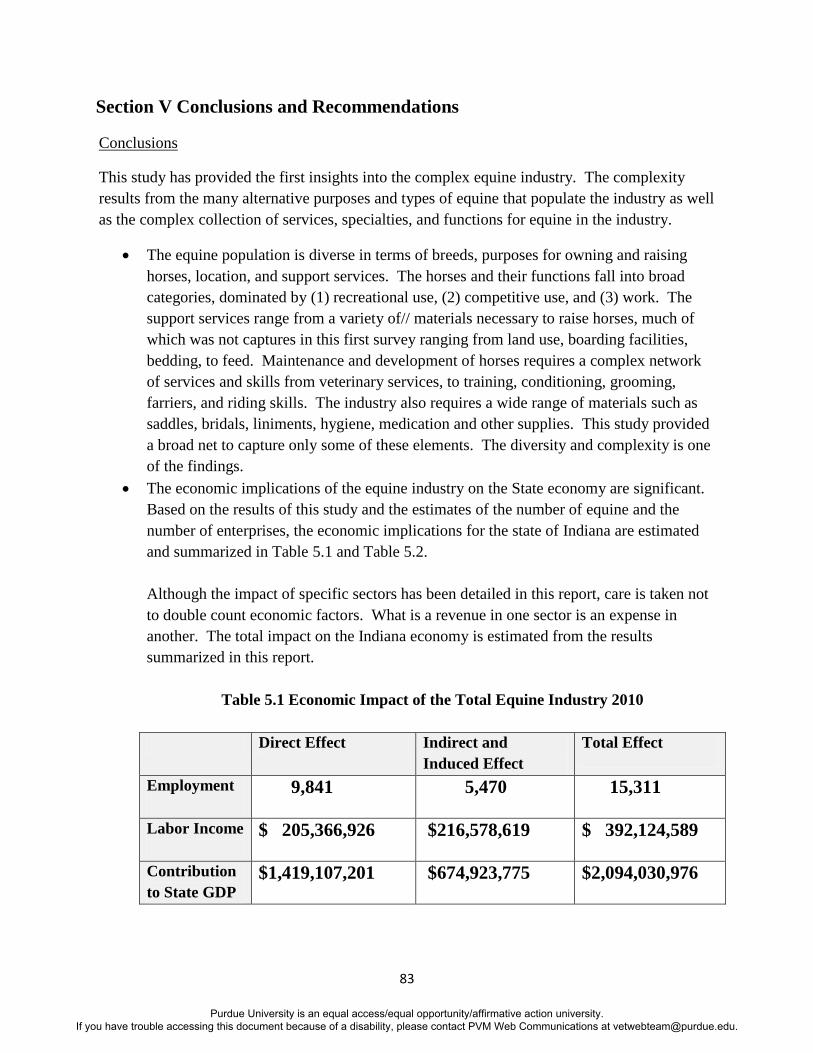
83
Section V Conclusions and Recommendations
Conclusions
This study has provided the first insights into the complex equine industry. The complexity
results from the many alternative purposes and types of equine that populate the industry as well
as the complex collection of services, specialties, and functions for equine in the industry.
The equine population is diverse in terms of breeds, purposes for owning and raising
horses, location, and support services. The horses and their functions fall into broad
categories, dominated by (1) recreational use, (2) competitive use, and (3) work. The
support services range from a variety of// materials necessary to raise horses, much of
which was not captures in this first survey ranging from land use, boarding facilities,
bedding, to feed. Maintenance and development of horses requires a complex network
of services and skills from veterinary services, to training, conditioning, grooming,
farriers, and riding skills. The industry also requires a wide range of materials such as
saddles, bridals, liniments, hygiene, medication and other supplies. This study provided
a broad net to capture only some of these elements. The diversity and complexity is one
of the findings.
The economic implications of the equine industry on the State economy are significant.
Based on the results of this study and the estimates of the number of equine and the
number of enterprises, the economic implications for the state of Indiana are estimated
and summarized in Table 5.1 and Table 5.2.
Although the impact of specific sectors has been detailed in this report, care is taken not
to double count economic factors. What is a revenue in one sector is an expense in
another. The total impact on the Indiana economy is estimated from the results
summarized in this report.
Table 5.1 Economic Impact of the Total Equine Industry 2010
Direct Effect Indirect and
Induced Effect
Total Effect
Employment
9,841 5,470 15,311
Labor Income
$ 205,366,926 $216,578,619 $ 392,124,589
Contribution
to State GDP
$1,419,107,201 $674,923,775 $2,094,030,976
Purdue University is an equal access/equal opportunity/affirmative action university. If you have trouble accessing this document because of a disability, please contact PVM Web Communications at [email protected].
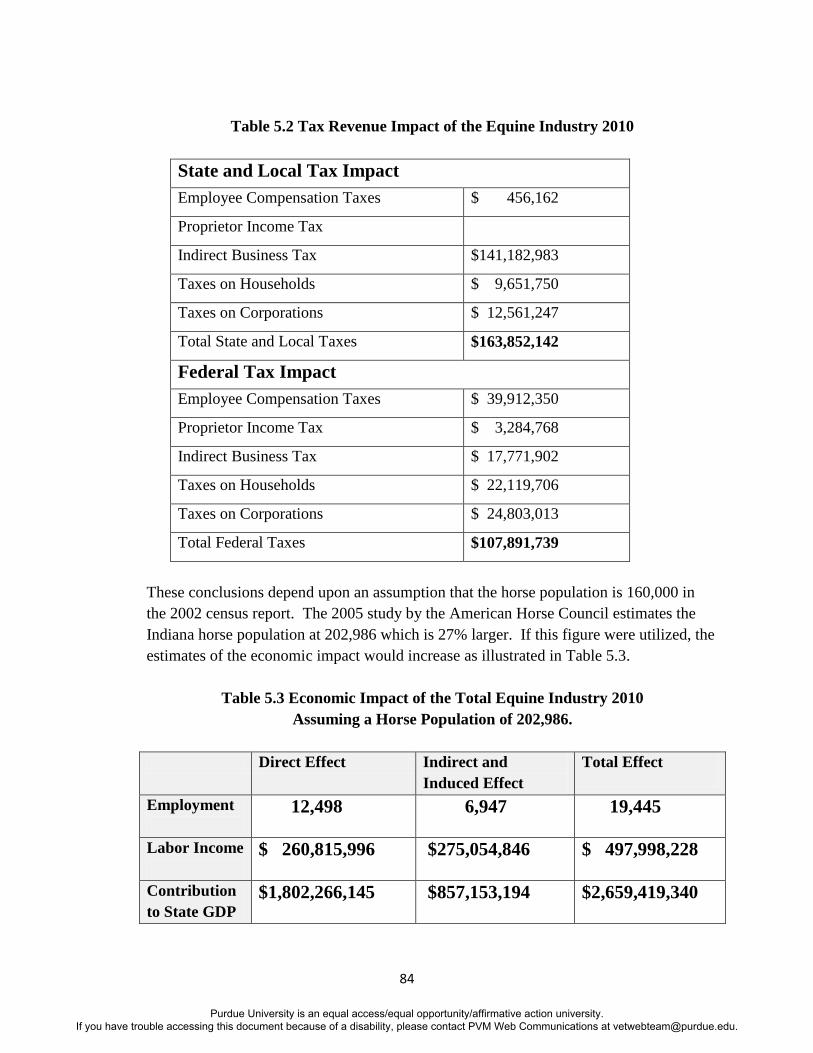
84
Table 5.2 Tax Revenue Impact of the Equine Industry 2010
State and Local Tax Impact
Employee Compensation Taxes $ 456,162
Proprietor Income Tax
Indirect Business Tax $141,182,983
Taxes on Households $ 9,651,750
Taxes on Corporations $ 12,561,247
Total State and Local Taxes
$163,852,142
Federal Tax Impact
Employee Compensation Taxes $ 39,912,350
Proprietor Income Tax $ 3,284,768
Indirect Business Tax $ 17,771,902
Taxes on Households $ 22,119,706
Taxes on Corporations $ 24,803,013
Total Federal Taxes
$107,891,739
These conclusions depend upon an assumption that the horse population is 160,000 in
the 2002 census report. The 2005 study by the American Horse Council estimates the
Indiana horse population at 202,986 which is 27% larger. If this figure were utilized, the
estimates of the economic impact would increase as illustrated in Table 5.3.
Table 5.3 Economic Impact of the Total Equine Industry 2010
Assuming a Horse Population of 202,986.
Direct Effect Indirect and
Induced Effect
Total Effect
Employment
12,498 6,947 19,445
Labor Income
$ 260,815,996 $275,054,846 $ 497,998,228
Contribution
to State GDP
$1,802,266,145 $857,153,194 $2,659,419,340
Purdue University is an equal access/equal opportunity/affirmative action university. If you have trouble accessing this document because of a disability, please contact PVM Web Communications at [email protected].
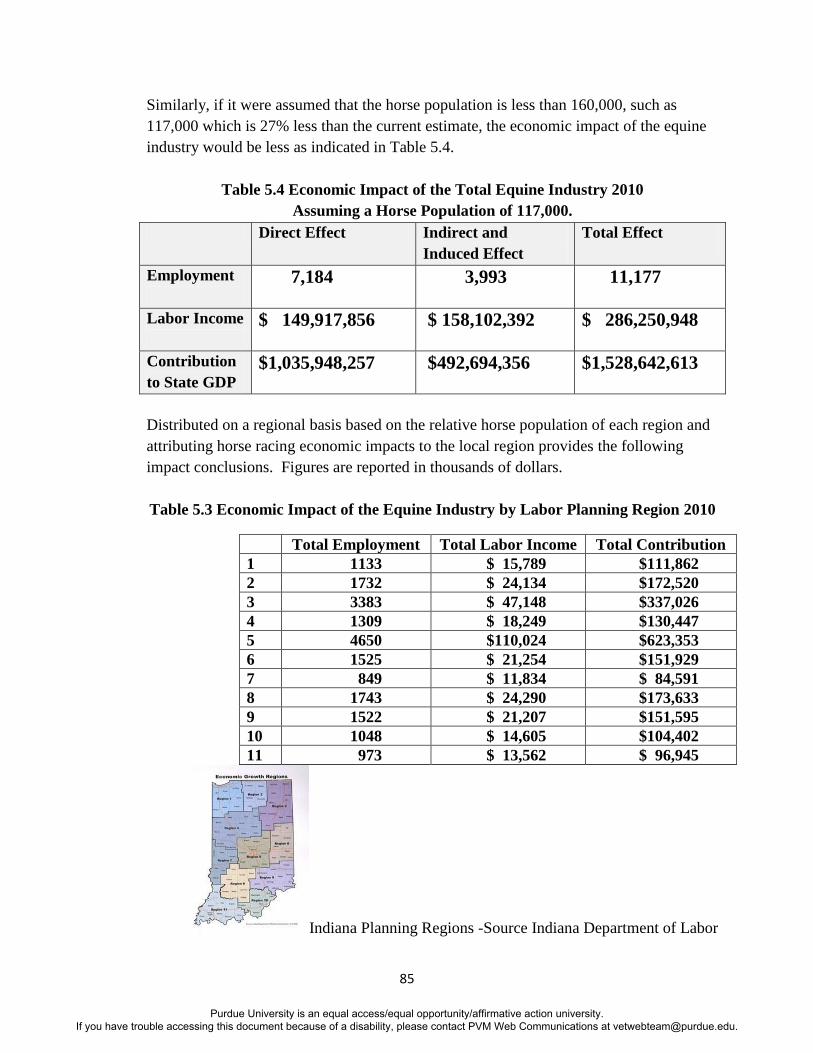
85
Similarly, if it were assumed that the horse population is less than 160,000, such as
117,000 which is 27% less than the current estimate, the economic impact of the equine
industry would be less as indicated in Table 5.4.
Table 5.4 Economic Impact of the Total Equine Industry 2010
Assuming a Horse Population of 117,000.
Direct Effect Indirect and
Induced Effect
Total Effect
Employment
7,184 3,993 11,177
Labor Income
$ 149,917,856 $ 158,102,392 $ 286,250,948
Contribution
to State GDP
$1,035,948,257 $492,694,356 $1,528,642,613
Distributed on a regional basis based on the relative horse population of each region and
attributing horse racing economic impacts to the local region provides the following
impact conclusions. Figures are reported in thousands of dollars.
Table 5.3 Economic Impact of the Equine Industry by Labor Planning Region 2010
Reg
ion
Total Employment
Impact
Total Labor Income
Impact ($000)
Total Contribution
to GDP
($000)
1 1133 $ 15,789 $111,862
2 1732 $ 24,134 $172,520
3 3383 $ 47,148 $337,026
4 1309 $ 18,249 $130,447
5 4650 $110,024 $623,353
6 1525 $ 21,254 $151,929
7 849 $ 11,834 $ 84,591
8 1743 $ 24,290 $173,633
9 1522 $ 21,207 $151,595
10 1048 $ 14,605 $104,402
11 973 $ 13,562 $ 96,945
Indiana Planning Regions -Source Indiana Department of Labor
Purdue University is an equal access/equal opportunity/affirmative action university. If you have trouble accessing this document because of a disability, please contact PVM Web Communications at [email protected].
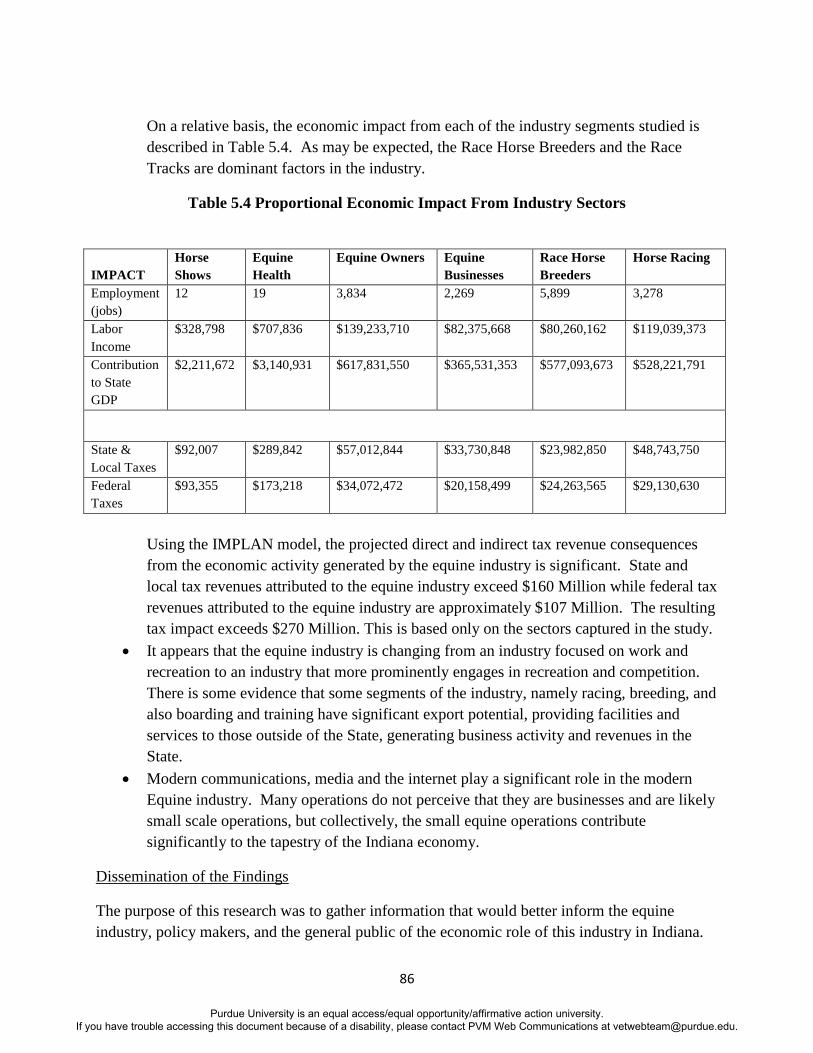
86
On a relative basis, the economic impact from each of the industry segments studied is
described in Table 5.4. As may be expected, the Race Horse Breeders and the Race
Tracks are dominant factors in the industry.
Table 5.4 Proportional Economic Impact From Industry Sectors
IMPACT
Horse
Shows
Equine
Health
Equine Owners Equine
Businesses
Race Horse
Breeders
Horse Racing
Employment
(jobs)
12 19 3,834 2,269 5,899 3,278
Labor
Income
$328,798 $707,836 $139,233,710 $82,375,668 $80,260,162 $119,039,373
Contribution
to State
GDP
$2,211,672 $3,140,931 $617,831,550 $365,531,353 $577,093,673 $528,221,791
State &
Local Taxes
$92,007 $289,842 $57,012,844 $33,730,848 $23,982,850 $48,743,750
Federal
Taxes
$93,355 $173,218 $34,072,472 $20,158,499 $24,263,565 $29,130,630
Using the IMPLAN model, the projected direct and indirect tax revenue consequences
from the economic activity generated by the equine industry is significant. State and
local tax revenues attributed to the equine industry exceed $160 Million while federal tax
revenues attributed to the equine industry are approximately $107 Million. The resulting
tax impact exceeds $270 Million. This is based only on the sectors captured in the study.
It appears that the equine industry is changing from an industry focused on work and
recreation to an industry that more prominently engages in recreation and competition.
There is some evidence that some segments of the industry, namely racing, breeding, and
also boarding and training have significant export potential, providing facilities and
services to those outside of the State, generating business activity and revenues in the
State.
Modern communications, media and the internet play a significant role in the modern
Equine industry. Many operations do not perceive that they are businesses and are likely
small scale operations, but collectively, the small equine operations contribute
significantly to the tapestry of the Indiana economy.
Dissemination of the Findings
The purpose of this research was to gather information that would better inform the equine
industry, policy makers, and the general public of the economic role of this industry in Indiana.
Purdue University is an equal access/equal opportunity/affirmative action university. If you have trouble accessing this document because of a disability, please contact PVM Web Communications at [email protected].
87
The completed report is available November 1, 2011 and includes the technical report. The plan
for disseminating the information has three components: report to sponsors, report to equine
organizations and report to general public. The report will be posted on the Purdue University
and Purdue University Calumet websites. The agricultural extension website will have fact
sheets on various components of the research.
All sponsors of the Indiana Economic Impact and Health Study will be sent a hard copy and
electronic copy of the report with a letter indicating that a presentation of the results at their
business meeting can be arranged at their request. Sponsors are encouraged to post a copy of the
report on their website.
The various Indiana equine organizations will be sent a hardcopy and an electronic copy of the
report and encouraged to post the electronic copy on their website. They are encouraged to
inform their members of the three public meetings discussing the research. If requested, one of
the researchers will speak to their group at a business meeting.
There will be three public meetings scheduled to discuss the results of the survey. One meeting
located in the northern portion of the state, one in the central portion of the state and one in the
southern portion of the state to reach the greatest number of people in the equine industry.
Information on the dates and locations of the meetings will be posted and at least two of the
researchers will be available to present the findings and answer questions at each meeting.
There is a lack of business related data for the Indiana equine industry. This report is intended to
provide this industry with summary data to better assist them in understanding the industry status
and their economic role in the state economy. The report will be sent electronically to anyone
who requests a copy and disseminated as widely as possible in the state.
A copy of this report and the technical report can be obtained by contacting Dr. Conners at
Purdue University is an equal access/equal opportunity/affirmative action university. If you have trouble accessing this document because of a disability, please contact PVM Web Communications at [email protected].
88
Recommendations
There is a need for a long range research plan to provide information on horse
populations and equine enterprises. A census of equine every ten years, followed by data
collection and studies of significant market segments - racing, breeding, competition,
recreation and shows – on regular time tables.
There is a need to develop a comprehensive data base to identify all the participants in
the industry. This includes not only the more familiar segments of the equine industry,
but also the many suppliers and service providers that have not viewed themselves as
industry participants. The database created with this research is a starting point.
There is a need for further education of those in the equine industry, to recognize their
economic role, to help them operate their enterprises more like businesses, and for policy
makers to be better informed about the industry.
Recommend funding be allocated for further research.
Purdue University is an equal access/equal opportunity/affirmative action university. If you have trouble accessing this document because of a disability, please contact PVM Web Communications at [email protected].