indian river county water coming and going river county water coming and going august 2010 version....
TRANSCRIPT
Indian River CountyWATER
Coming and Going
August 2010 Version

Sponsored in part byAudubon of Florida
and by thePelican Island Audubon Society
Cover photograph: White Ibis at the West County Wastewater Treatment Plant by Bob Montanaro.

Indian River County Water
Topics CoveredTopics Covered
Where Water Comes From The Aquifer pages 6-8Rainfall page 9
Where Water Goes Local Water Districts pages 10, 11Drinking Water Treatment Plants pages 12. 13
Managing Wastes Drinking Water Treatment Plants pages 14, 15Waste Water Treatment Plants pages 16-18Managing Stormwater pages 19-23
Challenges to water supplies From Growth pages 24-27From Climate Patterns pages 28-33From the Managers pages 34-39
Background Land Use Map-Indian River County pages 40, 41

Acknowledgments This project could not have been undertaken without help from Indian River County staff: Erik Olson, Director of Utility Services, Deputy Director Mike Hotchkiss, Keith McCully, Stormwater Engineer, Stormwater Division, Department of Public Works; from the City of Vero Beach’s John Ten Eyck, Director, Water Department; and from the staff of the water control districts: Bob Ulevich, Administrator, St. Johns Improvement District; David Gunter, Superintendent, Indian River Farms Water Control District; Rodney Tillman, Superintendent, Fellsmere Water Control District.
Anonymous experts working at many state and federal agencies contributed through the reports they posted on the Internet about their data and research. Web sites most frequently referenced were those of the St. Johns River Water Management District, the U.S. Geological Survey, the U.S. Department of Agriculture and the National Oceanic and Atmosphere Administration.
Most important, was the support given to me by the Pelican Island Audubon Society. Board members reviewed multiple drafts, generously sharing with me their knowledge about this subject. DSE
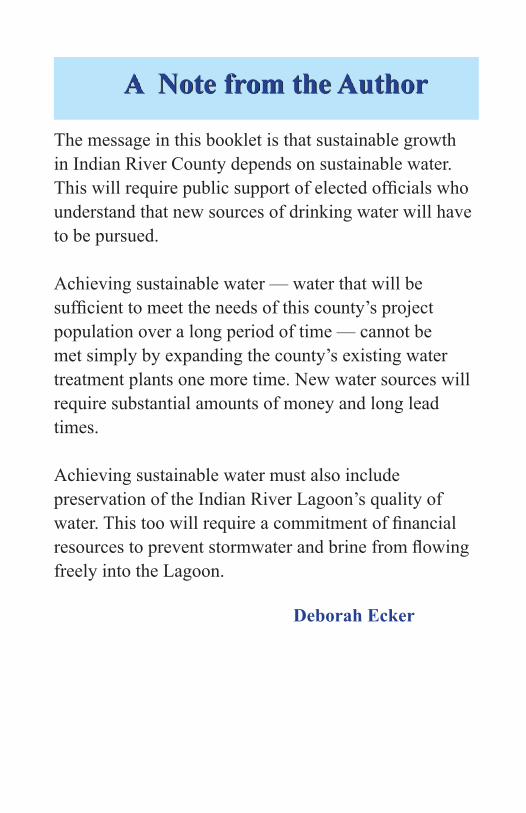
A Note from the Author
The message in this booklet is that sustainable growth in Indian River County depends on sustainable water. This will require public support of elected officials who understand that new sources of drinking water will have to be pursued.
Achieving sustainable water — water that will be sufficient to meet the needs of this county’s project population over a long period of time — cannot be met simply by expanding the county’s existing water treatment plants one more time. New water sources will require substantial amounts of money and long lead times.
Achieving sustainable water must also include preservation of the Indian River Lagoon’s quality of water. This too will require a commitment of financial resources to prevent stormwater and brine from flowing freely into the Lagoon. Deborah Ecker

6
Where Water Comes From —The Floridan Aquifer
The Floridan aquifer is one of the most productive aquifers in the world. It covers an area of about 100,000 square miles and is the primary source of water for roughly 10 million people. It is composed of a thick sequence of limestone and dolomite rocks that are millions of years old.
Sources: U.S. Geological Survey Ground Water Atlas, HA730G; “Water Withdrawals and Trends from the Floridan Aquifer System in the Southeastern United States, 1950-2000,” Circular 1278, U.S. Geological Survey.

7
100% of the county’s drinking water comes from the Upper Floridan aquifer.
66% of the City of Vero Beach’s drinking water comes from the surficial aquifer; 33% from the Upper Floridan Aquifer.
Source: U.S. Geological Survey Ground Water Atlas, HA730G
The top layer is the surficial aquifer (50 to 80 feet); below it is the intermediate confining unit, mostly clay, (200-300 feet) that restricts the flow of water; and below that is the Upper Floridan aquifer (about 1000 feet deep). Small black arrows show how salt water intrusion occurs among the layers, through fractures in the porous rocks. Salt water also intrudes into the surficial aquifer when too much water is pumped from it, reducing pressure on water held in the Upper Floridan aquifer.
8
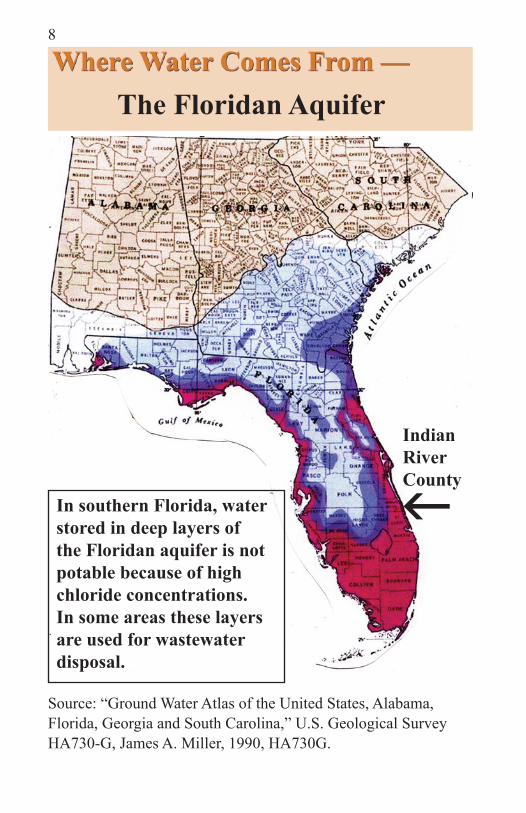
Where Water Comes From —The Floridan Aquifer
In southern Florida, water stored in deep layers of the Floridan aquifer is not potable because of high chloride concentrations. In some areas these layers are used for wastewater disposal.
Source: “Ground Water Atlas of the United States, Alabama, Florida, Georgia and South Carolina,” U.S. Geological Survey HA730-G, James A. Miller, 1990, HA730G.
hIndianRiverCounty
9
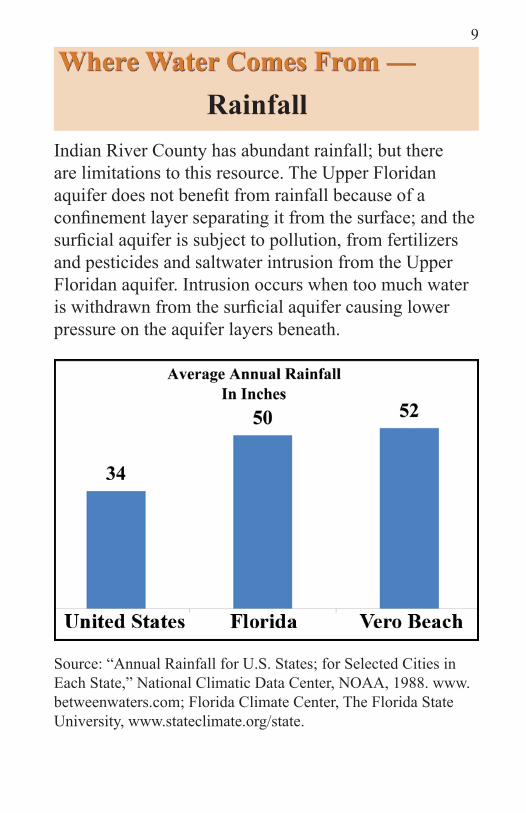
Where Water Comes From —Rainfall
Indian River County has abundant rainfall; but there are limitations to this resource. The Upper Floridan aquifer does not benefit from rainfall because of a confinement layer separating it from the surface; and the surficial aquifer is subject to pollution, from fertilizers and pesticides and saltwater intrusion from the Upper Floridan aquifer. Intrusion occurs when too much water is withdrawn from the surficial aquifer causing lower pressure on the aquifer layers beneath.
Source: “Annual Rainfall for U.S. States; for Selected Cities in Each State,” National Climatic Data Center, NOAA, 1988. www.betweenwaters.com; Florida Climate Center, The Florida State University, www.stateclimate.org/state.

10
Where Water Goes —Local Water Districts
There are six water districts within Indian River County. Florida’s extensive wetlands caused the 1905 Florida legislature to create drainage districts throughout the state, primarily to dry out wetlands for agriculture. The Fellsmere and Indian River Farms Water Control Districts date back to the early 1900s. The local water districts are responsible for flood control not only for agriculture but also for the urban areas within their ter-ritories. Pumping stations control the flow of rainfall through culverts, ditches and canals.
Source: St. Johns River Water Management District, 2009.

11
The districts cover large tracts of land: Fellsmere, 80 square miles; Indian River Farms Water Control District, 75 square miles (including all of the City of Vero Beach); and the St. Johns Water Improvement District, 44 square miles. The districts primarily serve citrus, grazing lands and sod farms. Citrus requires large amounts of water for irrigation and freeze protection.
Agriculture is the major consumer of water.
Source: Chapter 3b, Potable Water Sub-Element, Comprehensive Plan 2010-2030, Indian River County.
Private water supplies: There is no exact count of private wells because many were installed before permits were required. The county’s Comprehensive Plan 2010-2030 reports that the county issued 12,065 permits between 1995-2006, 60% were for agriculture. There are three private water franchise facilities: two serve trailer parks, the third is for agriculture.

12
Where Water Goes —Drinking Water Treatment Plants
The City of Vero Beach’s Water Treatment Plant
Source: Water Department, City of Vero Beach.
The city supplies water beyond its limits—south on the barrier island to St. Lucie County, north to most of Indian River Shores and west to Dodgertown. Two-thirds of the city’s water is pumped from the surficial aquifer and treated by a water softening process and aeration. It is then mixed with the one-third that comes from the Upper Floridan aquifer that has been treated by reverse osmosis, desalination treatment system.

13The county has North County and South County Water Treatment Plants. These supply water to the City of Sebastian, the Town of Orchid and unincorporated areas within the Urban Service Boundary. All the water the county withdraws is from the Upper Floridan aquifer, treated by reverse osmosis. Reverse osmosis is a system in which water is forced through slightly permeable membranes to remove nonpotable dissolved elements. While the system effectively treats the water, it produces a waste product called brine (about 20% of total processed water) that has to be discarded. Finding locations and ways to do this without harming the natural environment is a challenge.
A Reverse Osmosis SystemStacked Tubes Filled With Filtering Membranes
Photo by author. City of Vero Beach Water Treatment Plant.

14
Managing Wastes From —Drinking Water Treatment Plants
Vero Beach -Currently, brine from the city’s drinking water treat-ment plant goes into the Main Relief Canal, then into the Indian River Lagoon.In the future, brine from the city’s drinking water treat-ment plant will be injected into a 3,000 foot deep well into the lower aquifer. During the rainy season, excess reuse water will also be injected.
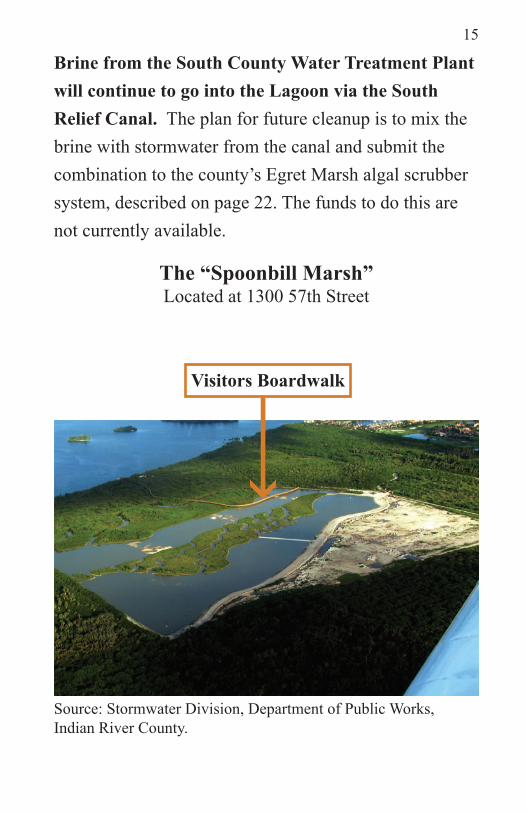
The county is undertaking a new approach to the disposal of brine from the North County Water Treatment Plant: a project called the “Spoonbill Marsh” on the edge of the Indian River Lagoon. Florida’s Department of Environmental Protection is monitoring this pilot process closely because it could be a model for other coastal areas also looking for ways to dispose of reverse osmosis wastes. At the Spoonbill Marsh, brine is pumped from the North County Water Treatment Plant into a marsh where it is mixed with water from the Lagoon. The expectation is that marsh vegetation and evaporation will remove enough damaging pollutants so that the water going back into the Lagoon will be the same or better quality than what was pumped out.
15
Brine from the South County Water Treatment Plant will continue to go into the Lagoon via the South Relief Canal. The plan for future cleanup is to mix the brine with stormwater from the canal and submit the combination to the county’s Egret Marsh algal scrubber system, described on page 22. The funds to do this are not currently available.
The “Spoonbill Marsh”Located at 1300 57th Street
Visitors Boardwalk
Source: Stormwater Division, Department of Public Works,Indian River County.
16
Managing Discharge From —Wastewater Treatment Plants
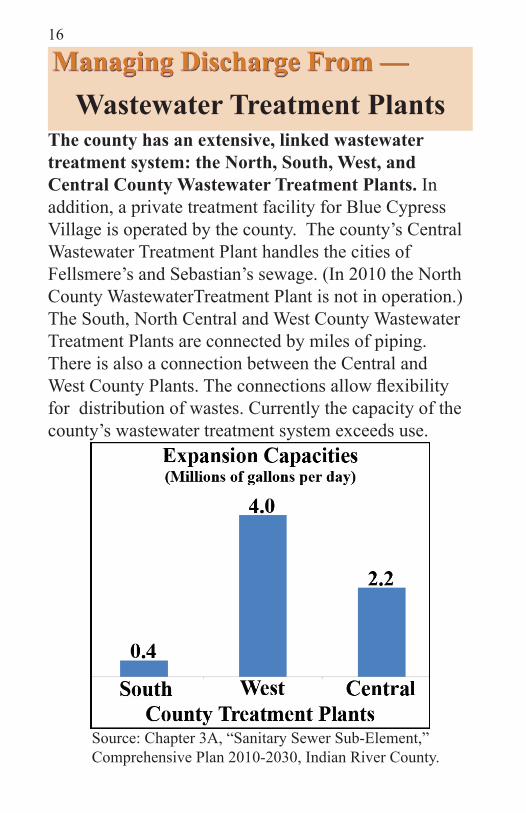
The county has an extensive, linked wastewater treatment system: the North, South, West, and Central County Wastewater Treatment Plants. In addition, a private treatment facility for Blue Cypress Village is operated by the county. The county’s Central Wastewater Treatment Plant handles the cities of Fellsmere’s and Sebastian’s sewage. (In 2010 the North County WastewaterTreatment Plant is not in operation.) The South, North Central and West County Wastewater Treatment Plants are connected by miles of piping. There is also a connection between the Central and West County Plants. The connections allow flexibility for distribution of wastes. Currently the capacity of the county’s wastewater treatment system exceeds use.
Source: Chapter 3A, “Sanitary Sewer Sub-Element,” Comprehensive Plan 2010-2030, Indian River County.
17
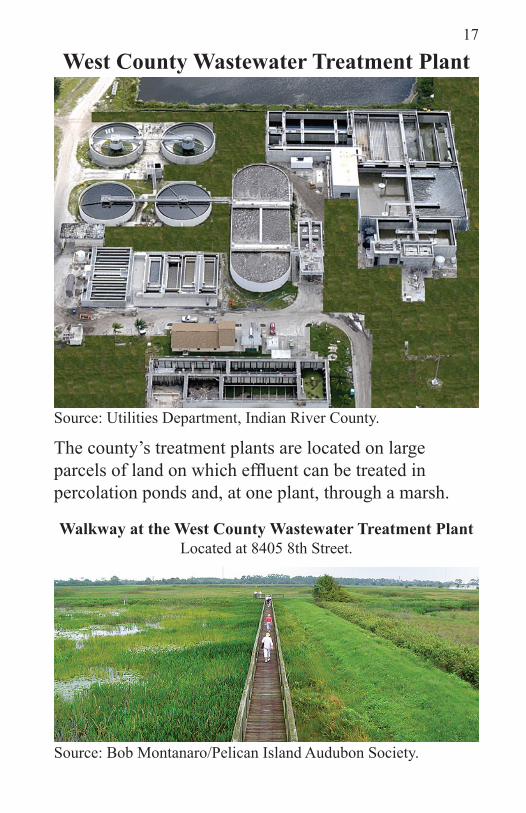
West County Wastewater Treatment Plant
Source: Utilities Department, Indian River County.
The county’s treatment plants are located on large parcels of land on which effluent can be treated in percolation ponds and, at one plant, through a marsh.
Walkway at the West County Wastewater Treatment PlantLocated at 8405 8th Street.
Source: Bob Montanaro/Pelican Island Audubon Society.

18
Most water from the county’s wastewater treatment plants is distributed for irrigation, but there are exceptions: about one million gallons per day flow from the South County Wastewater Treatment Plant into the South Relief Canal and then into the Lagoon. The plan is to make this water available as reuse for north county customers. As reuse water to a portion of the north barrier island. A cautionary concern about reuse water is that it too eventually enters the Lagoon, carrying undesired nitrates and phosphates. Along with the county government’s extensive wastewater treatment system there are four private sewer systems - the Su-Rene and Royal Oak mobile home parks, and the Sun Ag Corporation, which has two near Fellsmere. There are thousands of private septic tanks. The county’s Comprehensive Plan 2010-2030 reports that an average 656 new septic systems were installed each year, 1995-2006. Septic systems have potential problems because the area’s high water table, combined with underlying hardpan soil, prevents proper filtration of effluent. These conditions make septic disposal systems a likely, but unseen, source of contamination for wells that pump drinking water from the surficial aquifer.
Managing Discharge From —Wastewater Treatment Plants

19
Reuse water from the City of Vero Beach’s Wastewater Treatment Plant is almost 100% distributed as irrigation for golf courses and landscaping. The exception follows rain storms when reuse customers do not need this water for irrigation.
The Moorings Golf Course One of Many Irrigated with Reuse Water
Source: Photograph by Ray Camparetta.
The city’s wastewater treatment plant is located on the edge of the Lagoon where it is highly vulnerable to storm surges and sea level rise. In 2007, consultants recommended the city’s plant be closed and moved near the city’s water treatment plant or that it be merged with the county’s wastewater treatment system. In early 2010, the county and city are undertaking a new study to review the feasibility of merging their water and sewer facilities.
20
Managing Stormwater —
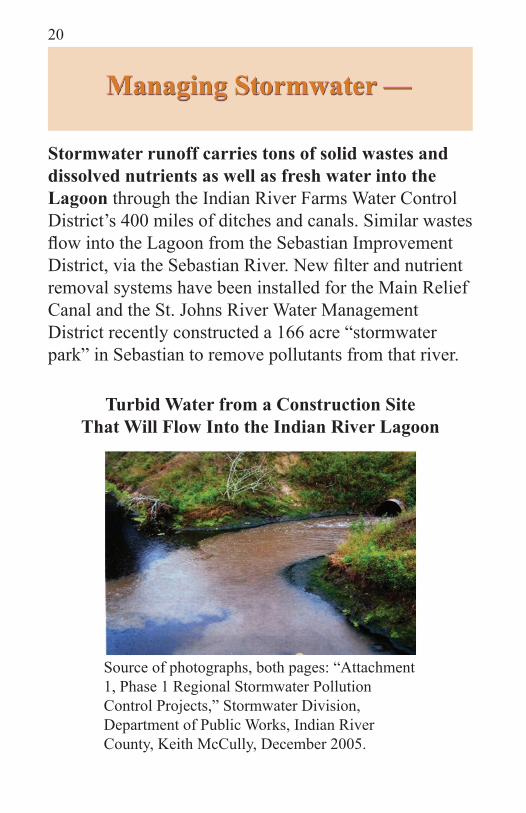
Stormwater runoff carries tons of solid wastes and dissolved nutrients as well as fresh water into the Lagoon through the Indian River Farms Water Control District’s 400 miles of ditches and canals. Similar wastes flow into the Lagoon from the Sebastian Improvement District, via the Sebastian River. New filter and nutrient removal systems have been installed for the Main Relief Canal and the St. Johns River Water Management District recently constructed a 166 acre “stormwater park” in Sebastian to remove pollutants from that river.
Turbid Water from a Construction Site That Will Flow Into the Indian River Lagoon
Source of photographs, both pages: “Attachment 1, Phase 1 Regional Stormwater Pollution Control Projects,” Stormwater Division, Department of Public Works, Indian River County, Keith McCully, December 2005.
21
Solid Wastes That Will Be Swept Into The Lagoon During The Next Storm
Pollutants PoundsNitrogen 184,702Phosphorous 31,805Suspended solids 2,954,472Total Polluntants 3,170,979
Pounds of Pollutants Going Into the LagoonFrom Ditches and Canals
Source: “East Indian River County Master Stormwater Management Plan,” Carter Associates, Inc.
The pounds of pollutants in the table above are for the South and North Relief Canals. The Main Relief Canal is not included because of the lift system, completed 2008, and the algal scrubber being installed 2010. There are no available figures for pollutants from the Sebastian River.
22
Managing Stormwater —
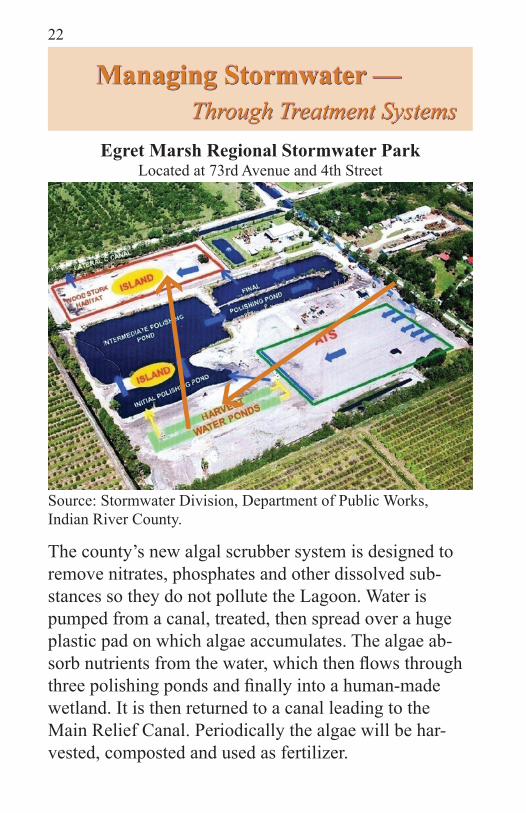
Egret Marsh Regional Stormwater Park Located at 73rd Avenue and 4th Street
The county’s new algal scrubber system is designed to remove nitrates, phosphates and other dissolved sub-stances so they do not pollute the Lagoon. Water is pumped from a canal, treated, then spread over a huge plastic pad on which algae accumulates. The algae ab-sorb nutrients from the water, which then flows through three polishing ponds and finally into a human-made wetland. It is then returned to a canal leading to the Main Relief Canal. Periodically the algae will be har-vested, composted and used as fertilizer.
Source: Stormwater Division, Department of Public Works,Indian River County.
Through Treatment Systems
23
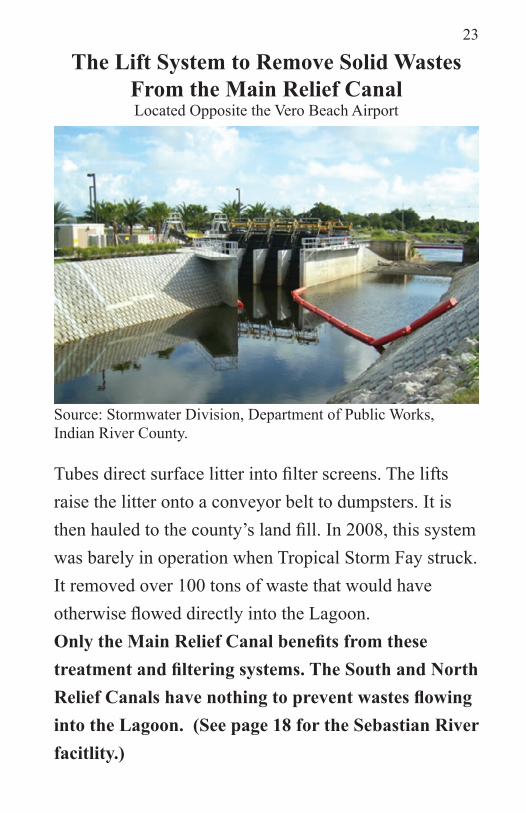
The Lift System to Remove Solid WastesFrom the Main Relief CanalLocated Opposite the Vero Beach Airport
Source: Stormwater Division, Department of Public Works,Indian River County.
Tubes direct surface litter into filter screens. The lifts raise the litter onto a conveyor belt to dumpsters. It is then hauled to the county’s land fill. In 2008, this system was barely in operation when Tropical Storm Fay struck. It removed over 100 tons of waste that would have otherwise flowed directly into the Lagoon. Only the Main Relief Canal benefits from these treatment and filtering systems. The South and North Relief Canals have nothing to prevent wastes flowing into the Lagoon. (See page 18 for the Sebastian River facitlity.)
24
Challenges to Water Supplies —From Growth
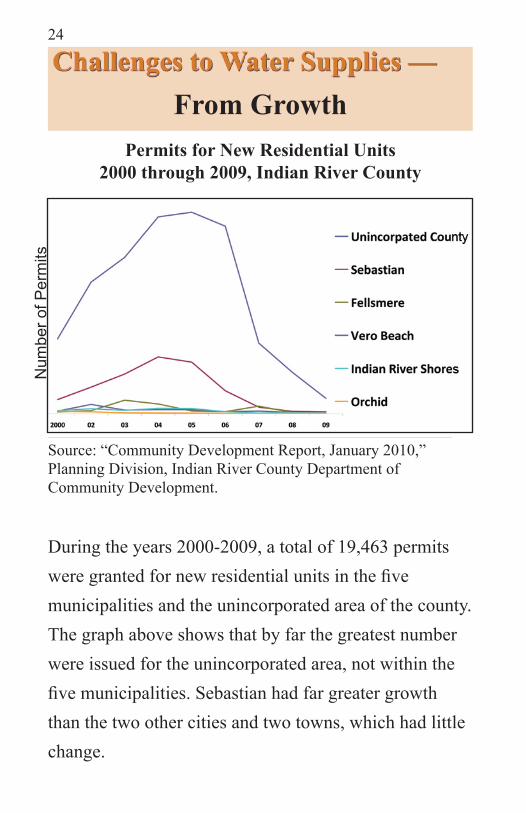
Permits for New Residential Units2000 through 2009, Indian River County
Source: “Community Development Report, January 2010,” Planning Division, Indian River County Department of Community Development.
During the years 2000-2009, a total of 19,463 permits were granted for new residential units in the five municipalities and the unincorporated area of the county. The graph above shows that by far the greatest number were issued for the unincorporated area, not within the five municipalities. Sebastian had far greater growth than the two other cities and two towns, which had little change.
Num
ber o
f Per
mits
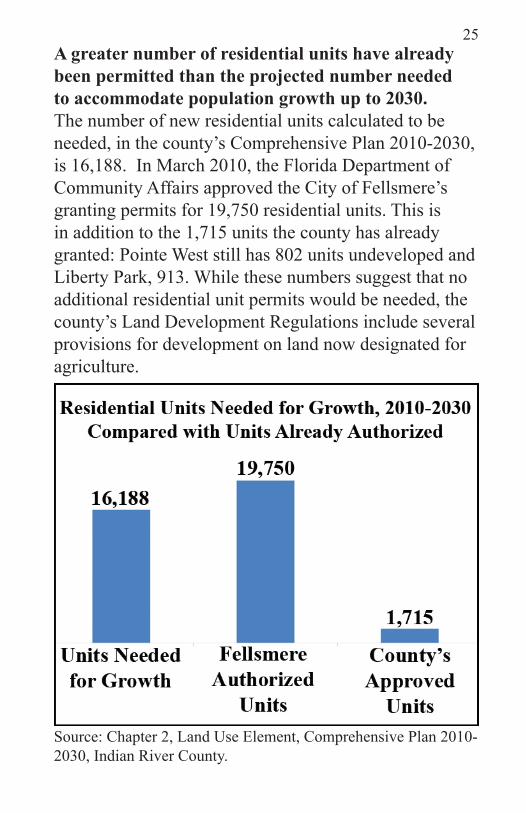
25A greater number of residential units have already been permitted than the projected number needed to accommodate population growth up to 2030. The number of new residential units calculated to be needed, in the county’s Comprehensive Plan 2010-2030, is 16,188. In March 2010, the Florida Department of Community Affairs approved the City of Fellsmere’s granting permits for 19,750 residential units. This is in addition to the 1,715 units the county has already granted: Pointe West still has 802 units undeveloped and Liberty Park, 913. While these numbers suggest that no additional residential unit permits would be needed, the county’s Land Development Regulations include several provisions for development on land now designated for agriculture.
Source: Chapter 2, Land Use Element, Comprehensive Plan 2010-2030, Indian River County.
26
Challenges to Water Supplies —From Growth
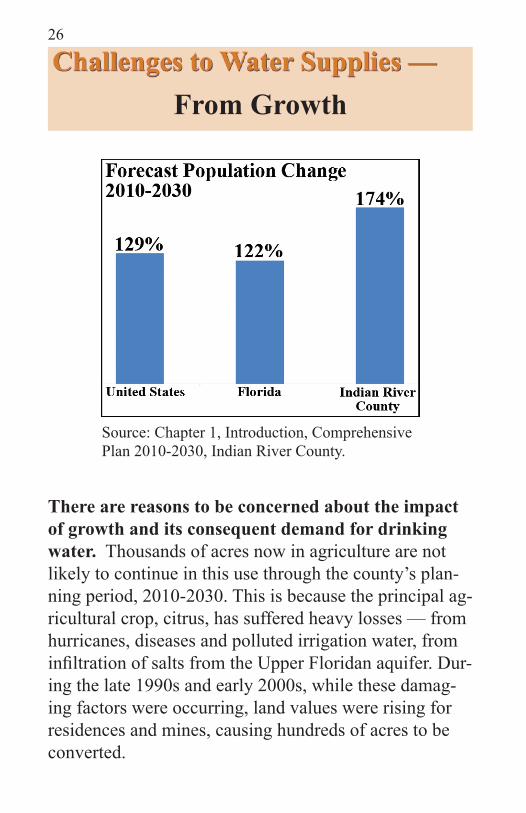
Source: Chapter 1, Introduction, Comprehensive Plan 2010-2030, Indian River County.
There are reasons to be concerned about the impact of growth and its consequent demand for drinking water. Thousands of acres now in agriculture are not likely to continue in this use through the county’s plan-ning period, 2010-2030. This is because the principal ag-ricultural crop, citrus, has suffered heavy losses — from hurricanes, diseases and polluted irrigation water, from infiltration of salts from the Upper Floridan aquifer. Dur-ing the late 1990s and early 2000s, while these damag-ing factors were occurring, land values were rising for residences and mines, causing hundreds of acres to be converted.
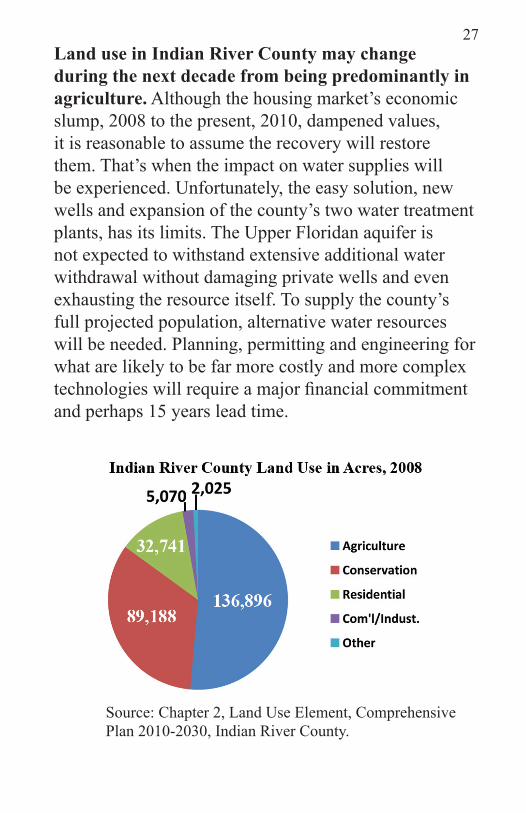
27Land use in Indian River County may change during the next decade from being predominantly in agriculture. Although the housing market’s economic slump, 2008 to the present, 2010, dampened values, it is reasonable to assume the recovery will restore them. That’s when the impact on water supplies will be experienced. Unfortunately, the easy solution, new wells and expansion of the county’s two water treatment plants, has its limits. The Upper Floridan aquifer is not expected to withstand extensive additional water withdrawal without damaging private wells and even exhausting the resource itself. To supply the county’s full projected population, alternative water resources will be needed. Planning, permitting and engineering for what are likely to be far more costly and more complex technologies will require a major financial commitment and perhaps 15 years lead time.
Source: Chapter 2, Land Use Element, Comprehensive Plan 2010-2030, Indian River County.

28
Challenges to Water Supplies —From Climate Patterns
Source: “Historical Climatological Series, 5-1, NOAA’s National Climatic Data Center, NC.
Regional rainfall averages are high (~50 inches), but its occurrences are not distributed evenly throughout the year. This results in summer months with more rainfall than can be used. and other months when there are droughts have increased. This great resource is lost for meeting drinking water needs because there are no reservoirs to capture and hold the summer peaks. A storage proposal for agriculture is “water farming,” in which the government would pay owners of land in agricultural use to store rainfall in ditches.
Monthly Rainfall Patterns, Florida and the U.S.
29
Plugged drainage ditches may provide suitable water storage for agriculture, but drinking water preservation — especially in this climate, to prevent evaporation — requires marshlands or above-or-underground reservoirs. Historically, the county has put these approaches aside because of high estimated costs for land acquisition and construction. One day, necessity may trump frugality.
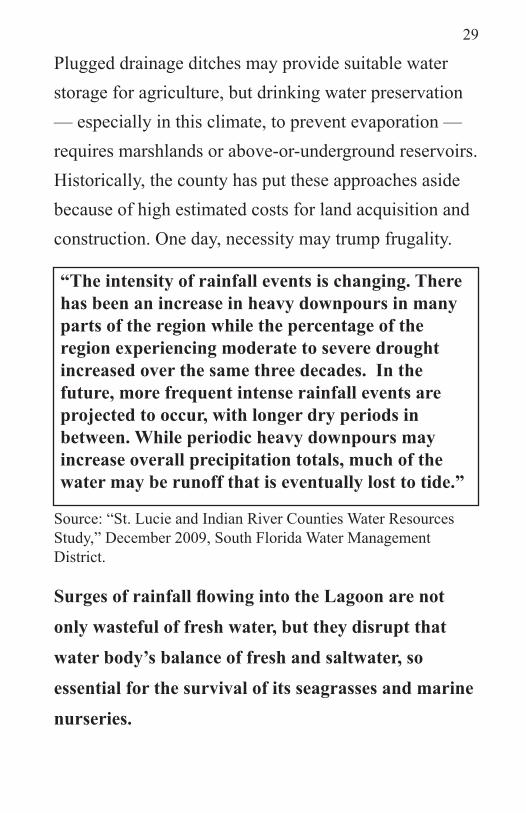
“The intensity of rainfall events is changing. There has been an increase in heavy downpours in many parts of the region while the percentage of the region experiencing moderate to severe drought increased over the same three decades. In the future, more frequent intense rainfall events are projected to occur, with longer dry periods in between. While periodic heavy downpours may increase overall precipitation totals, much of the water may be runoff that is eventually lost to tide.”
Source: “St. Lucie and Indian River Counties Water Resources Study,” December 2009, South Florida Water Management District.
Surges of rainfall flowing into the Lagoon are not only wasteful of fresh water, but they disrupt that water body’s balance of fresh and saltwater, so essential for the survival of its seagrasses and marine nurseries.
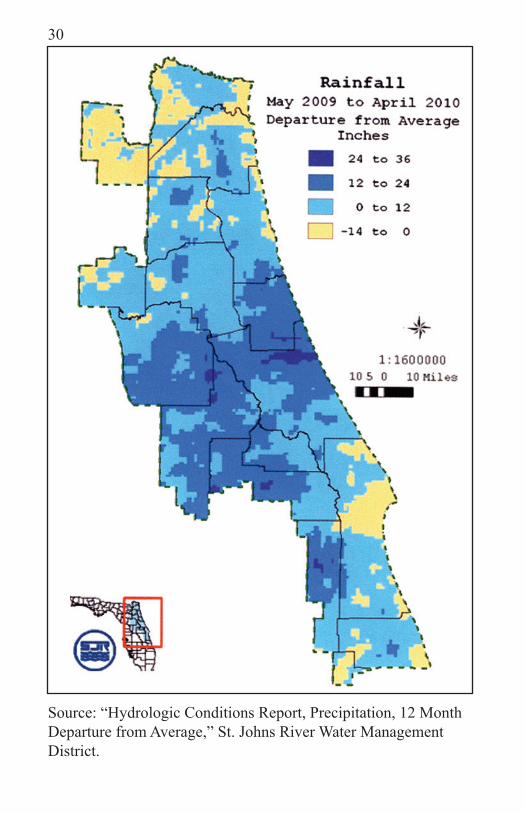
30
Source: “Hydrologic Conditions Report, Precipitation, 12 Month Departure from Average,” St. Johns River Water Management District.
31
Challenges to Water Supplies —From Climate Patterns
From February 2009 to January 2010, portions of Indian River County received 10 to 20 fewer inches less rain-fall than average — in contrast to the county’s histori-cally high annual 52 inches of rainfall. The same low rainfall occurred during the previous year, causing this county, perhaps for the first time ever, to be included on a Drought Monitor map.
Two years of low rainfall do not make a pattern, but they do serve as an alert. When pumping water is heavy, during a drought, intrusions of chloride-loaded water can rise into private and public wells, ending their use. It was concern for this hazard that caused the St. Johns River Water Management District, in 2008, to require the North County Wastewater Treatment Plant to dig six new shallow wells instead of three deep wells.
In 2010, Florida weather is impacted by what the state’s climatologist describes as moderate El Niño conditions. An active storm track in the Southeast, associated with El Niño was along the Gulf coast and across the peninsula. This brought above normal rainfall to both northwestern and southern areas.
Source: Florida Climate Center, Florida State University Institute of Science and Public Affairs, February 2010.
32
Challenges to Water Supplies —From Climate Patterns
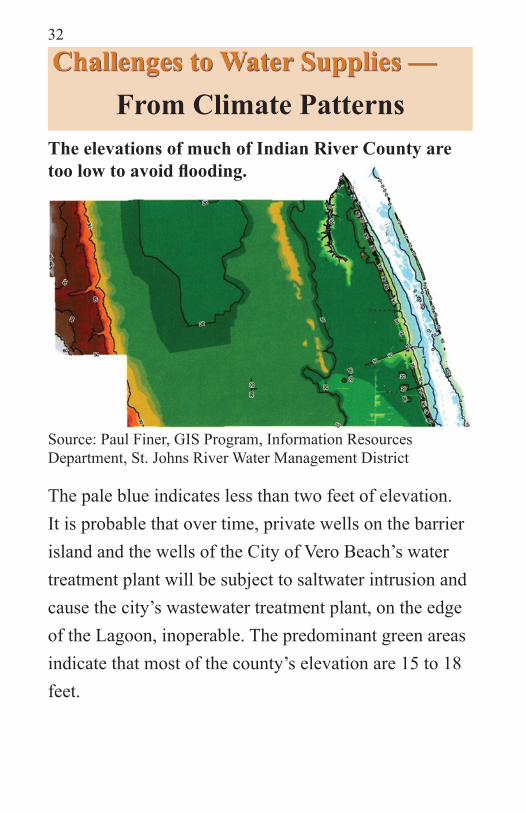
The elevations of much of Indian River County are too low to avoid flooding.
Source: Paul Finer, GIS Program, Information Resources Department, St. Johns River Water Management District
The pale blue indicates less than two feet of elevation. It is probable that over time, private wells on the barrier island and the wells of the City of Vero Beach’s water treatment plant will be subject to saltwater intrusion and cause the city’s wastewater treatment plant, on the edge of the Lagoon, inoperable. The predominant green areas indicate that most of the county’s elevation are 15 to 18 feet.
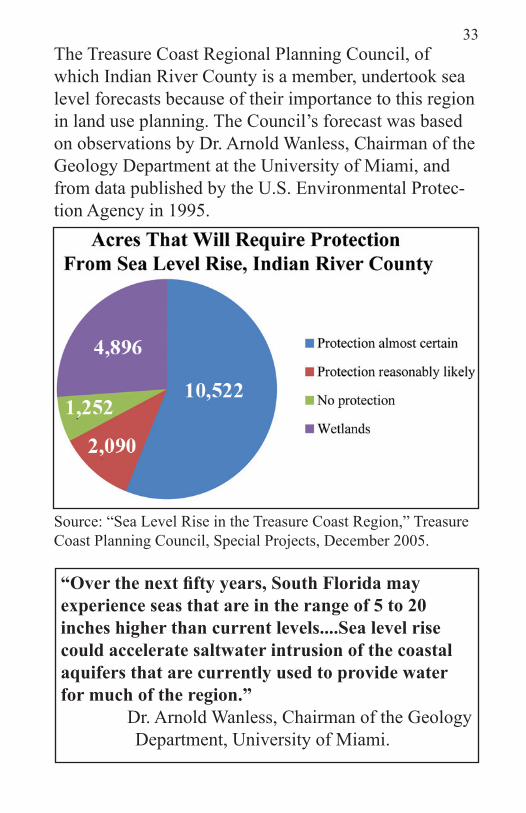
33The Treasure Coast Regional Planning Council, of which Indian River County is a member, undertook sea level forecasts because of their importance to this region in land use planning. The Council’s forecast was based on observations by Dr. Arnold Wanless, Chairman of the Geology Department at the University of Miami, and from data published by the U.S. Environmental Protec-tion Agency in 1995.
Source: “Sea Level Rise in the Treasure Coast Region,” Treasure Coast Planning Council, Special Projects, December 2005.
“Over the next fifty years, South Florida may experience seas that are in the range of 5 to 20 inches higher than current levels....Sea level rise could accelerate saltwater intrusion of the coastal aquifers that are currently used to provide water for much of the region.” Dr. Arnold Wanless, Chairman of the Geology Department, University of Miami.
34
Challenges to Water Supplies —From the Managers
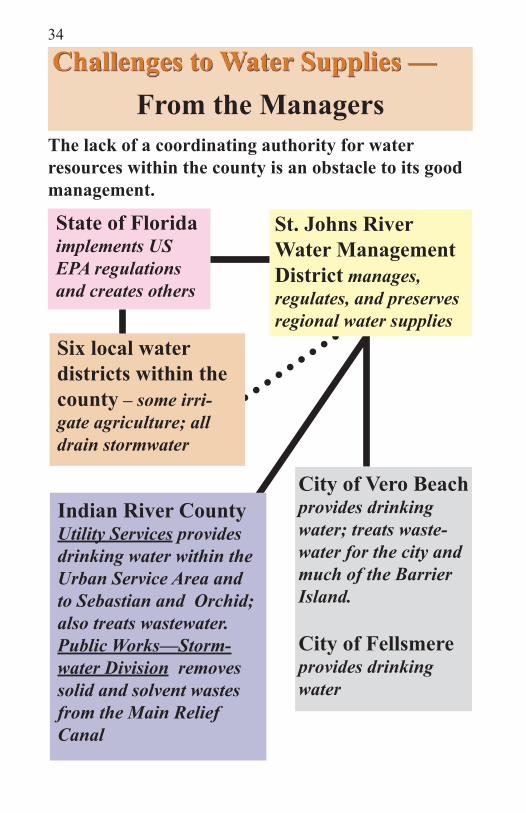
The lack of a coordinating authority for water resources within the county is an obstacle to its good management.
State of Floridaimplements US EPA regulations and creates others
St. Johns RiverWater Management District manages, regulates, and preserves regional water supplies
Six local water districts within the county – some irri-gate agriculture; all drain stormwater
Indian River CountyUtility Services provides drinking water within the Urban Service Area and to Sebastian and Orchid; also treats wastewater.Public Works—Storm-water Division removes solid and solvent wastes from the Main Relief Canal
City of Vero Beachprovides drinking water; treats waste- water for the city and much of the Barrier Island.
City of Fellsmere provides drinking water
35The State of Florida enacts laws and regulations, often in response to Acts of Congress; for example the Federal Clean Water Act of 1972.
The St. Johns River Water Management District, one of five state-created regional water management districts, is the dominant government agency with authority to approve or turn down private, city and county applications for new wells and to regulate where and how much water may be withdrawn.
Indian River County has the Departments of Utility Services and of Public Works.
Six local water districts operate under Florida law Chapter 298, essentially autonomously, subject to some St. Johns River Water Management District regulations. None are responsible to the county or any city or town.
The Cities of Vero Beach and Fellsmere have their own independent water systems.
No management links exist between the county and the cities or between the county, the cities and the six water districts.h
36
Challenges to Water Supplies —From the Managers
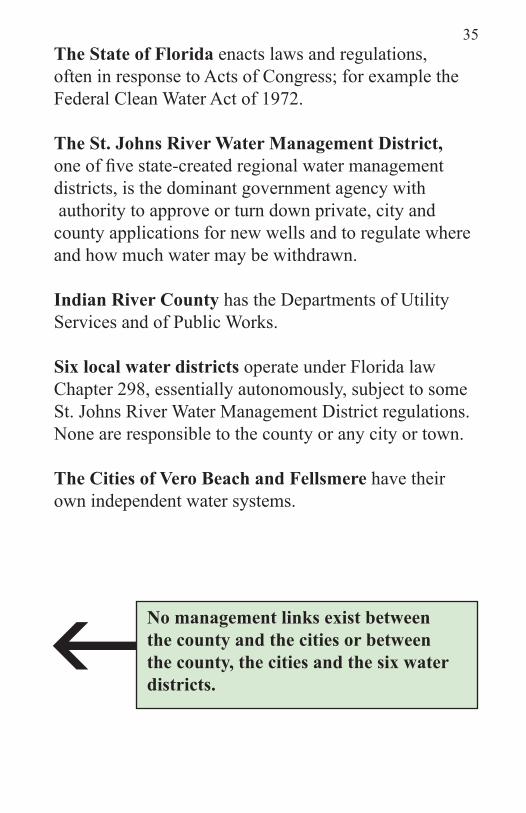
The St. Johns River Water Management District: (Map left)In December 2009, the District forecast this county would have no water shortages up to 2060. Only one year before, the District classified this county as a “Potential Priority Water Resource Caution Area;” and during that year the District reported 10-20 fewer inches of rainfall. (Page 30) Political pressures may be involved. The District is looking for water supplies in response to other counties’ demands for water, to meet shortages and population increases.
Yellow = Priority Water Resource Caution Area
Crosshatch=Potential Priority Water Resource Caution areaSource: St, Johns River Water Management District.
IndianRiverCounty

37
In late 2008, the District notified Indian River County that within the foreseeable future it should not look for alternative water resources from the marshlands west of I-95, that are headwaters of the St. Johns River, the District’s water resource north to Jacksonville.
Indian River County: A challenge to drinking water resources is whether the county’s elected officials will contain new development within the Urban Service Area. It is within this area that either the county or a municipality is obligated to provide urban services such as schools, water utilities and sheriff protection. The area’s boundaries are not permanent. Large tracts of land, now in agriculture, are likely to be subject to pressures for development — for residential units, mining, and other new uses. Under the county’s Land Use Regulations only low-density resi-dential units are allowed on agricultural land; but these regulations also have provisions for agricultural land to be converted. One allowable new land use is a New Town, with a minimum of 2500 new residential units. Under current law there could be four New Towns — two within, two outside the Urban Service Area. This and other allowed agricultural conversions have desir-able objectives, but if fully implemented, the increased demand for drinking water would require major infra-structure investments.
38
Challenges to Water Supplies —From the Managers
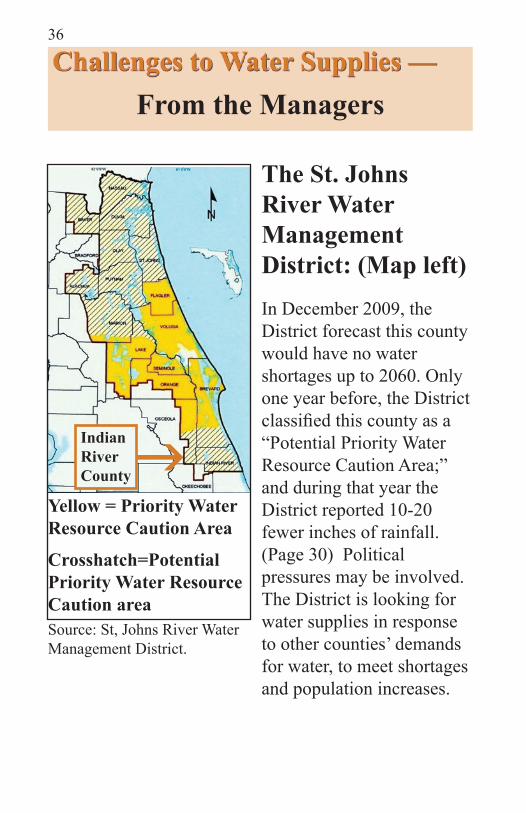
Indian River Farms Water Control District:Three million pounds of solid wastes and solvent pollut-ants flow each year into the Lagoon, harming seagrasses and marine wildlife.
An average annual of 35 billion gallons of rain water each year is emptied into the Lagoon instead of being captured and preserved for drinking water.
St. Johns River Water Improvement District:The proposed unplugging of the water discharge system will allow the District’s excess water to flow south into a St. Lucie County reservoir to serve that county’s grow-ing population. The restoration of drainage to its natural flow may be desirable but it deprives Indian River Coun-ty of a water resource.
City of Vero Beach:The city’s wastewater treatment plant poses a serious threat of pollution. Consultants advised the city that the plant is at high risk to have sewage overflow into the Lagoon during a storm surge. In addition, the city’s principal water source, the surficial aquifer, is vulnerable
Note: Figures adjusted from average per day, to average per year.Source: “Attachment 1, Phase 1 Regional Stormwater Pollution Control Projects; Why Stormwa-ter Pollution Control Projects Are Needed In Indian River County,” Keith McCulley, December 2005.

39to pollution from insecticides and fertilizers applied on agricultural and residential properties. The city’s pump-ing from the Upper Floridan also is exposed to risk.
Current drinking water supplies are adequate, but not for the forecast population 2010-2030. The county receives plenty of rainfall, but there are no reservoirs for drinking water. Some wastewater is properly treated, but millions of gallons continue to pollute the Lagoon. Many water managers, but there is poor coordination among government entities.This means sustainable water supplies will require tough decisions.
City of Fellsmere:While the impact of Fellsmere’s growth on the rest of the county could be substantial — development of the permitted 19,750 new residential units would result in a population greater than the current combined popula-tions of the cities of Vero Beach and Sebastian—- water supplies are expected to be provided by a private water utility, using a reservoir to be constructed on the prop-erty. Further permitting for this project would also be required from the St. Johns River Water Management District.
“In 20 years chloride concentrations may increase...in 35 of the wells identified as having critically increasing trends....These wells supply water for the following 14 utilities...Vero Beach.”
Source: David Toth, “Appendix C-Evaluation of the Likelihood of Impacts to Groundwater Quality as a Result of Projected 2030 Water Use,” June 30, 2008.

40
BACKGROUND: Est. 2009 county population 142,300; Vero Beach 17,855; Sebastian 22,722; Fells-mere 5183, Unincorporated county 91,606.
Multicolored areas within the Urban Service Boundary indicate different land use categories, e.g. commercial and residential. Outside the Boundary, blue areas are conservation; green are agriculture.
Route 60
City ofFellsmere

41
The county covers 512 square miles. More than half is west of I-95, mostly zoned for agriculture or con-servation. Fellsmere (44 square miles) is larger than Vero Beach and Sebastian combined (13 square miles each.
I-95
I-95
Black & white dotted line is the Urban Service Area.
City of Sebastian
Town of Orchid
Town ofIndianRiver Shores
City ofVero Beach
42
Deborah Ecker: For most of her adult life she and her husband Hoyt lived in a suburb of Boston where they raised two daughters and a son. Fifteen years ago the couple brought their sailboat down the Intracoastal Waterway ending up in Vero Beach. For the past fifteen years they have split their time between this city and the town of Chatham on Cape Cod.
Deborah’s education was in economics at Vassar Col-lege, followed by an M.A. from Brandeis Univer-sity. Her volunteer work for many years was with the League of Women Voters and she served on local and state Boards of Directors. Her specialty, the state’s fis-cal policies, led to appointments by both Republican and Democratic governors to the positions of Associate Commissioner of the Department of Revenue and As-sistant Cabinet Secretary of Administration and Finance. Between these appointments she was the head of Bank Structures Research at the Federal Reserve Bank of Bos-ton, and following that, chief of the fiscal policy staff of the state’s Senate Committee on Ways and Means.
In Vero Beach Deborah serves on the Boards of Direc-tors of the Pelican Island Audubon Society and the Indian River Neighborhood Association. Her early immersion into the county’s civic affairs was working on a rewrite of the county’s tree protection ordinance, fol-lowed by amendments to the landscape regulations.It was these projects which turned her attention to Indian River County’s water issues.
About the Author

43
Facts To Tell Your Friends
Plenty of rainfall, but so much comes at one time, and there are no reservoirs to capture and preserve it for drinking water. Average rainfall 52 inches in
Vero Beach
Neither the cities nor the county can pump drinking water from the ditches and canals of the local water control districts that flow into the Indian River Lagoon (billions of gallons each year.)
In spite of new county projects, there are still hundreds of tons of pollutants flowing into the Indian River Lagoon: fertilizers and pesticides from agriculture and household landscapes.
We also need a clean Lagoon for recreation.
44
The Upper Floridan aquifer is not expected to withstand additional water withdrawal without damaging private wells and even exhausting the resources itself.
To supply the county’s full projected population, alternative water resources will be needed.
Planning, permitting and engineering for what are likely to be far more costly and more complex technologies will require a major financial com-mitment and perhaps 15 years lead-time.
45
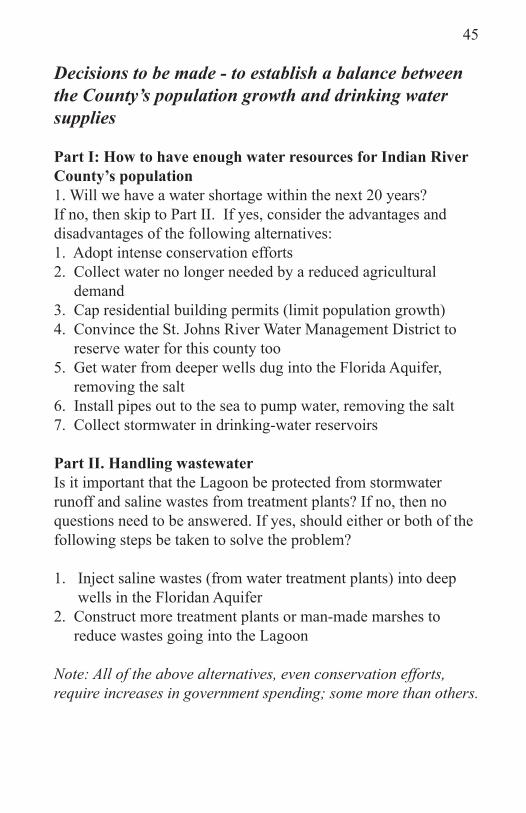
Decisions to be made - to establish a balance between the County’s population growth and drinking water supplies Part I: How to have enough water resources for Indian River County’s population1. Will we have a water shortage within the next 20 years?If no, then skip to Part II. If yes, consider the advantages and disadvantages of the following alternatives: 1. Adopt intense conservation efforts 2. Collect water no longer needed by a reduced agricultural demand 3. Cap residential building permits (limit population growth)4. Convince the St. Johns River Water Management District to reserve water for this county too5. Get water from deeper wells dug into the Florida Aquifer, removing the salt 6. Install pipes out to the sea to pump water, removing the salt 7. Collect stormwater in drinking-water reservoirs Part II. Handling wastewaterIs it important that the Lagoon be protected from stormwater runoff and saline wastes from treatment plants? If no, then no questions need to be answered. If yes, should either or both of the following steps be taken to solve the problem? 1. Inject saline wastes (from water treatment plants) into deep wells in the Floridan Aquifer2. Construct more treatment plants or man-made marshes to reduce wastes going into the Lagoon Note: All of the above alternatives, even conservation efforts, require increases in government spending; some more than others.
The message in this booklet is that sustainable growth in Indian River County depends on sustainable water and that this will require citizens to support elected officials who are willing to invest in new drinking water resources.
The booklet is a primer about Indian River County’s water resources — where our water comes from and where it goes, for agriculture and for drinking water. It also covers the challenges facing the county’s water supplies.
Indian River County does not have the water shortages facing other areas of the world. There is abundant rainfall and plentiful water in the aquifer below. In spite of this abundance there are problems: no reservoirs to capture rainfall for drinking water and heavy chlorides in the water stored in the aquifer. The author, an advocate for the natural environment, not a scientist, describes these conditions so they are easily understood.