indian point, units 1, 2, and 3 - transmittal of 2015
TRANSCRIPT

May 12, 2016
NL-16-058
U.S. Nuclear Regulatory Commission A TIN: Document Control Desk 11555 Rockville Pike Rockville, MD 20852
Subject: 2015 Annual Radiological Environmental Operating Report Indian Point Unit Nos. 1, 2 and 3 Docket Nos. 50-003, 50-24 7, and 50-286 License Nos. DPR-5, DPR-26, and DPR-64
Dear Sir or Madam:
Indian Point Energy Center 450 Broadway, GSB P.O. Box249 Buchanan, N.Y. 10511-0249 Tel.(914) 254-6700
Lawrence Coyle Site Vice President
Enclosed please find one copy of the Entergy Nuclear Operations, Inc. Indian Point Energy Center Annual Radiological Environmental Operating Report for the period January 1, 2015 to December 31, 2015.
This report is submi.tted in.accordance with facility Technical Specification, Appendix A, Section 5.6.2 associated with license numbers DPR-5, DPR-26 and DPR-64 for Indian Point Unit Nos. 1, 2 and 3 respectively. There are no new regulatory commitments being made by Entergy in this correspondence.
t'

NL-16-058 Docket Nos. 50-003, 50-247, 50-286
Page 2 of 2
Should you or your staff have any questions regarding this matter, please contact Mr. Robert Walpole, Manager, Regulatory Assurance at (914) 254-6710.
Sincerely,
LC/cbr
Enclosure: nvironmental Operating Report
cc: Mr. Daniel H. Dorman, Regional Administrator, NRC Region I Mr. Douglas Pickett, Senior Project Manager, NRC NRR DORL NRC Resident Inspectors Office, Indian Point Energy Center Ms. Kimberly Conway, IPEC NRC Unit 1 Project Manager .Mr. Timothy Rice, Bureau of Hazardous Waste & Radiation Management, NYSDEC Ms. Bridget Frymire, New York State Public Service Commission Mr. John B. Rhodes, President and CEO, NYSERDA
--........ _

ENCLOSURE TO NL-16-058
2015 Annual Radiological Environmental Operating Report
Entergy Nuclear Operations, Inc. Indian Point Unit Nos. 1, 2 and 3
Docket Nos. 50-003, 50-247, and 50-286

ANNUAL RADIOLOGICAL ENVIRONMENTAL OPERATING REPORT
ENTERGY NUCLEAR
INDIAN POINT NUCLEAR GENERATING STATION UNITS 1, 2, AND 3
Docket No. 50-003 Indian Point Unit 1 (IP1) Docket No. 50-247 Indian Point Unit 2 (IP2) Docket No. 50-286 Indian Point Unit 3 (IP3)
January 1 - December 31, 2015

TABLE OF CONTENTS
EXECUTIVE SUMMARY Page vii
1.0 INTRODUCTION 1-1 1.1 Overview 1 ;..1
2.0 BACKGROUND 2-1 2.1 Site Description 2-1 2.2 Program Background 2-1 2.3 Program Objectives 2-1
3.o· PROGRAM DESCRIPTION 3-1 3.1 Sample Collection 3-1 3.2 Sample Analysis· 3-1 3.3 Sample Collection and Analysis Methodology 3-1
3.3.1 Direct Radiation 3-1 3.3.2 Airborne Particulates and Radioiodine 3-1 3.3.3 Precipitation 3-2 3.3.4 Drinking Water 3-2 3.3.5 Ground Water 3-2 3.3.6 Soil 3-2 3.3. 7 Broad Leaf Vegetation 3-2 3:3.8 Hudson River Water 3-2 3.3.9 Hudson River Bottom Sediment 3-3 3.3.10 Hudson River Shoreline Soil 3-3 3.3.11 Hudson River Aquatic Vegetation 3-3 3.3.12 Fish and Invertebrates 3-3 3.3.13 Lan.d Use Census 3-3
3.4 Statistical Methodology 3-4 3.4.1 Lower Limit of Detection and MDC 3-4 3.4.2 Table Statistics 3-5
/

TABLE OF CONTENTS {continued} Page
4.0 RESULTS AND DISCUSSION 4-1 4.1 Direct Radiation 4-3 4.2 Airborne Particulates and Radioiodine 4-4 4.3 Precipitation 4-4 4.4 Drinking Water 4-4 4.5 Ground Water 4-5 4.6 Soil 4-5 4.7 Broad Leaf Vegetation 4-5 4.8 Hudson River Water 4-5 4.9 Hudson River Bottom Sediment 4-5 4.10 Hudson River Shoreline Soil 4-6 4.11 Hudson River Aquatic Vegetation 4-6 4.12 Fish and Invertebrates 4-6
. 4.13 Land Use Census 4'-7 4.14 Conclusion 4-7
5.0 REFERENCES 5-1
APPENDICES:
A. ENVIRONMENTAL SAMPLING AND ANALYSIS REQUIREMENTS A-1
B. RADIOLOGICAL ENVIRONMENTAL MONITORING PROGRAM B-1 RESULTS SUMMARY
C. HISTORICAL TRENDS C-1
D. INTERLABORATORY COMPARISON PROGRAM D-1 • Teledyne Environmental Laboratory • TLD Dosimeter Testing
ii

LIST OF FIGURES
FIGURE TITLE Page
A-1 Sampling Locations (Within Two Miles) A-5
A-2 Sampling Locations (Greater Than Two Miles) A-6
A-3 Additional Sampling Locations A-7
C-1 Direct Radiation, Annual Summary, 2005 to 2015 C-3
C-2 Radionuclides in Air - Gross Beta, 2005 to 2015 C-5
C-3 Radionuclides in Hydson River Water, Inlet & Discharge C-7 2005 to 2015
C-4 Radionuclides in Drinking Water, C-9 2005 to 2015
C-5 Radionuclides in Shoreline Soil, 2005 to 2015 C-11
C-6 Broad Leaf Vegetation, 2005 to 2015 C-13
C-7 Radionuclides in Fish & Invertebrates, C-15
2005 to.2015
C-8 Radionuclides in Bottom Sediment, 2005 to 2015 C-18
iii

LIST OF TABLES
TABLE TITLE Page
A-1 Indian Point REMP Sampling Station Locations A-2
A-2 Lower Limit of Detection Requirements for Environmental Sample Analysis A-8
A-3 Reporting Levels for Radioactivity Concentrations in Environmental Samples A-10
B-1 Sampling Summary, 2015 B-2
B-1a 2015 Air Sampling Deviations B-3
B-1b 2015 Other Media Deviations B-3
B-2 Radiological Environmental Monitoring Program Summary B-4
Indian Point Energy Center - 2015
B-3 Direct Radiation, Quarterly Data - 2015 B-13
B-4 Direct Radiation, 2005 through 2015 Data B-15
B-5 Direct Radiation, Inner and Outer Rings - 2015 B-17
B-6 Gross Beta Activity in Airborne Particulate Samples"-2015 B-18
B-7 lodine-131 in Airborne Charcoal Samples -2015 B-20
B-8 Gamma Emitters in Airborne Particulate Samples- 2015 B-22
B-9 Radionuclides in Rain Water Samples - 2015 B-26
B-10 Radionuclides in Drinking Water Samples - 2015 B-27
B-11 Radionuclides in Ground Water Samples - 2015 B:-31
B-12 Gamma Emitters in Soil Samples - 2015 B-32 (
B-13 Gamma Emitters in Broad Leaf Vegetation Samples - 2015 B-33
B-14 Radionuclides in River Water Samples - 2015 B-42
B-15 Gamma Emitters in Bottom Sediment Samples - 2015 B-46
B-16 Radionuclides in Shoreline Soil Samples - 2015 B-47
B-17 Gamma Emitters in Aquatic Vegetation Samples - 2015 B-49
B-18 Radionuclides in Fish/ Invertebrates - 2015 B-50
B-19 Land Use Census, Residence & Milk Animal Results 2015 B-54
B-20 Land Use Census - 2015 - Unrestricted Area Boundary B-55 and Nearest Residences
iv

LIST OF TABLES (Continued)
TABLE TITLE Page
C-1 Direct Radiation Annual Summary, 2005 - 2015 C-2
C-2 Radionuclides in Air, 2005 - 2015 C-4
C-3 Radionuclides in Hudson River Water, Inlet & Discharge C-6 2005 to 2015
I
C-4 Radionuclides in Drinking Water C-8 2005 to 2015
C-5 Radionuclides in Shoreline Soil, 2005 to 2015 C-10
C-6 Broad Leaf Vegetation, 2005 to 2015 C-12
C-7 Radionuclides in Fish & Invertebrates, C-14 2005 to 2015
C-8 River Water Discharge Area Tritium, REMP vs Effluent C-16
C-9 Radionuclides in Bottom Sediment, 2005 to 2015 C-17
D-2.1 Ratio of Agreement D-2
D-3.1 Analytics lnterlaboratory Comparison Program D-3 and Ratio of Agreement
D-3.2 DOE lnterlaboratory Comparison Program D-6 and Ratio of Agreement
D-3.3 ERA lnterlaboratory ~omparison Program D-8 and Ratio of Agreement
D-4.1 Percent of lndividualDosimeters That Passed EDC D-9 Internal Criteria, 2015 -
D-4.2 Mean Dosimeter Analysis (N=6), 2015 D-10
D-4.3 Summary of Independent Dosimeter Testing, 2015 D-10
v

EXECUTIVE SUMMARY
vi

EXECUTIVE SUMMARY
INTRODUCTION
This report summarizes the results of the Radiological Environmental Monitoring Program (REMP) conducted in the vicinity of Indian Point Energy Center (IPEC) during the period from January 1 to December 31, 2015. The Indian Point site consists of Units 1, 2 and 3, which are operated by Entergy Nuclear Operations Inc. Unit 1 was retired as a generating facility in 1974, and its reactor is no longer operated.
The REMP has been established to monitor/measure the radiation and radioactivity detectable in the environment that may be attributable to the operation of IPEC. This program, initiated in 1958, includes the collection, analysis, and evaluation of radiological data in order to assess the impact of IPEC on the environment.
SAMPLING AND ANALYSIS
The environmental sampling media collected in the vicinity of IPEC and at distant locations included air particulate filters and charcoal cartridges, soil, drinking water, ground water, broadleaf vegetation, river water, precipitation, shoreline sediment, bottom sediment, aquatic vegetation, fii:;h, and invertebrates. '-
During 2015, there were 1164 samples collected from the atmospheric, aquatic, and terrestrial environments. This includes 164 exposure measurements were obtained using environmental thermoluminescent dosimeters (TLDs).
A small number of inadvertent issues were encountered in 2015 in the collection of environmental samples in accordance with the IPEC Offsite Dose Calculation Manual (ODCM). Equipment failures and electrical outages resulted in a small number of Instances in which lower than normal sampling volumes were collected at the airborne monitoring stations. A full description of all discrepancies encountered with the environmental monitoring program is presented in the Table B-1 of this report.
There were 1327 analyses performed on the environmental media samples. The analysis of the 2015 Indian Point environmental samples was performed by several laboratories. General Engineering Labs (GEL) of Charlestown, SC, performed the ground water analyses. Thermoluminescent dosimeters were analyzed by Environmental Dosimetry Company (formerly Stanford Associates) of Sterling, MA. Teledyne Brown Engineering, Inc. of Knoxville, TN performed all the remaining analyses for 2015. Samples were analyzed as required by the IPEC ODCM.
LAND USE CENSUS
The annual land use census in the vicinity of IPEC was conducted as required by the IPEC ODCM in May through October. No dairy animals whose milk is used for human consumption were identified within 5 miles of the Station during the census. Due to the difficulty of locating individual gardens and determining those having an area greater than 500 square feet, broadleaf sampling was performed. As allowed for in the ODCM, monthly broad leaf sampling may be used in lieu of a garden census.
vii

SUMMARY OF RESULTS
Most samples collected as part of the IPEC REMP continued to contain detectable amounts of naturally-occurring and man-made radioactive materials. There was no plant related activity detected in any of the terrestrial samples. Offsite ambient radiation measurements using environmental TLDs beyond the site boundary ranged between 44 and 78 milliRoentgens (mR) per year. The range of ambient radiation levels observed with the TLDs is consistent with natural background radiation levels for New York.
Monitoring of the aquatic environment in the area of the station indicated the presence of the following potential station related reactivity, tritium and cesium-137. The tritium was found in river water at the upstream intake and downstream mixing zone of the discharge at levels that were expected from routine plant operation, or other sources such as fallout from past weapons testing. Low-levels of cesium-137 were detected in Hudson River bottom sediment samples downstream of the discharge, in both upstream and downstream shoreline sediment samples, and in an aquatic vegetation sample taken upstream of the station. The levels detected were consistent with historical findings. No other plant related activity was detected in any offsite samples. The predominant radioactivity for all samples was from non-plant related sources, such as fallout from nuclear weapons tests and naturally occurring radionuclides.
CONCLUSIONS
The 2015 Radiological Environmental Monitoring Program for IPEC resulted in the collection and analysis of over a thousand environmental samples and measurements. The data obtained were used to determine the impact of f PEC's operation on the environment and on the general public.
An evaluation of direct radiation measurements, environmental sample analyses, and dose calculations demonstrates that all applicable federal criteria were met. Furthermore, radiation levels and resulting doses from station operation were a small fraction of those attributed to natural and man-made background radiation.
In summary, the levels of radionuclides in the environment surrounding Indian Point were within the historical ranges, i.e., previous levels resulting from natural and anthropogenic sources for the detected radionuclides. Further, IPEC operations in 2015 did not result in exposure to the public greater than environmental background levels.
/
viii

SECTION 1.0
INTRODUCTION

1 . 1 Overview
The Radiological Environmental Monitoring Program (REMP) for 2015 performed by Entergy for the Indian Point Energy Center (IPEC) is discussed in this report. Since the operation of a nuclear power plant results ii'! the release of small amounts of radioactivity and low levels of radiation, the Nuclear Regulatory Commission (NRC) requires a program to be established to monitor radiation and radioactivity in the environment (Reference 1). This report, which is submitted to the NRC annually per Indian Point Technical Specifications, summarizes the results of measurements of radiation and radioactivity in the environment in the vicinity of the IPEC and at distant locations during the period January 1 to December 31, 2015.
The REMP is used to measure the direct radiation and the airborne and waterborne pathway activity in the vicinity of the Indian Point site. Direct radiation pathways include radiation from buildings and plant structures, airborne and liquid material that might be released from the plant, cosmic radiation, and the naturally occurring radioactive materials in the ground. Analysis of thermoluminescent dosimeters (TLDs), used to measure direct radiation, indicated that there were no increased radiation levels attributable to plant operations.
The airborne pathway includes measurements of air, precipitation, drinking water, and broad leaf vegetation samples. The airborne pathway measurements indicated that there was no adverse radiological impact to the surrounding environment attributed to Indian Point Station operations.
The waterborne pathway consists of Hudson River water, fish and invertebrates, aquatic vegetation, bottom sediment, and shoreline sediment. Measurements of the media comprising the waterborne pathway indicated that there was no adverse radiological impact · to the surrounding environ.ment attributed to Indian Point Station operations.
\
The ground water table is listed after the rain water and drinking water tables for ease of data comparison. However, ground water is not a dose pathway since it is not a drinking water pathway at IPEC.
These results are reviewed by IPEC's staff and have been reported semiannually or annually to the Nuclear Regulatory Commission and others for over 30 years.
This report contains a description of the REMP for IPEC and the conduct of that program in 2015 as required by the IPEC ODCM. Also included are summaries and discussions of the results of the 2015 program, trend analyses (where appropriate), comparison to historical results and trend analyses (where appropriate) and evaluation of any pptential impact on the environment. Results of the annual land use census, as well as the inter-laboratory comparison program are included, per the ODAs requirements.
1-1

SECTION 2
BACKGROUND

2.0 BACKGROUND
2.1 Site Description
The Indian Point site occupies 239 acres on the east bank of the Hudson River on a point of land at Mile Point 42.6. The site is located in the Village of Buchanan, Westchester County, New York. Three nuclear reactors, Indian Point Unit Nos. 1, 2 and 3, and associated buildings occupy approximately 35 acres. Unit 1 began operation in 1962 and was retired as a generating facility in 1974. Units 2 and 3 began operation 1974 and 1978. Indian Point Units 1 and 2 are owned by Entergy Nuclear Indian Point 2, LLC and Unit 3 is owned by Entergy Nuclear Indian Point 3 LLC. All three units are operated by Entergy Nuclear, although only Units 2 and 3 continue to operate.
2.2 Program Background
Environmental monitoring and surveillance have been conducted at Indian Point since 1958, four years prior to the start-up of Unit 1. The pre-operational program was designed and implemented to determine the background radioactivity and to measure the variations in activity levels from natural and other sources in the vicinity, as well as fallout from atmospheric nuclear weapons tests. Thus, as used in this report, background levels consist of those resulting from both natural and anthropogenic sol,lrces of environmental radioactivity. . Accumulation of this background data permits the detection and assessment of environmental activity attributable to plant operations.
2.3 Program Objectives
The current environmental monitoring program is designed to meet two primary objectives:
1. To enable the identification and quantification of changes in the radioactivity of the area.
2. To measure radionuclide concentrations in the environment attributable to operations of the Indian Point site.
To identify changes in activity, the environmental sampling schedule requires that analyses be conducted for specific environmental media on a regular basis. The radioactivity profile of the environment is established and monitored through routine evaluation of the analytical results obtained.
The REMP designates sampling locations for the collection of environmental media for analysis. These sample locations are divided into indicator and control locations. Indicator locations are established near the site, where the presence of environmental radioactivity of plant origin is most likely to be detected. Control locations are established farther away (and upwind/upstream, where applicable) from the site, where the level would not generally be affected by plant discharges. The use of indicator and control locations enables the identification of potential sources of detected radioactivity, thus meeting one of the program objectives.
2-1

Verification of expected radionuclide concentrations resulting from effluent releases attributable to the site is another objective of the REMP, which is met by meeting the two primary program objective described above. Verifying projected concentrations through the REMP is difficult since the environmental concentrations resulting from plant releases are typically too small to be detected. Plant related radionuclides were detected in 2015 in very low levels; however, residual radioactivity from atmospheric weapons tests and naturally occurring radioactivity were the predominant sources of radioactivity in the samples collected. Analysis of the 2015 REMP sample results confirms that environmental concentrations which could be attributed to radiological effluents were well below regulatory limits.
2-2

SECTION 3
PROGRAM DESCRIPTION

3.0 PROGRAM DESCRIPTION
To achieve the objectives of the REMP and ensure compliance with the ODCM, sampling and analysis of environmental media are performed as outlined in Table A-1 and described in section 3.3.
3.1 Sample Collection
Entergy personnel perform collection of environmental samples for the Indian Point site, with the exception of groundwater and fish/invertebrate samples. The groundwater samples are collected by a contracted environmental vendor, GZA Geo Environmental, Inc. Collection of fish and invertebrate samples is performed by a contracted environmental vendor, Normandeau Associates, Inc.
3.2 Sample Analysis
The analysis of the 2015 Indian Point environmental samples was performed by several laboratories. General Engineering Labs (GEL)- of Charlestown, SC, performed the ground water analyses. Thermoluminescent dosimeters were analyzed by Environmental Dosimetry Company (formerly Stanford Associates) of Sterling, MA. Teledyne Brown Engineering, Inc. of Knoxville, TN performed all the remaining analyses.
3.3 Sample Collection and Analysis Methodology
3.3.1 Direct Radiation
Direct gamma radiation is measured using integrating calcium sulfate thermoluminescent dosimeters (TLDs), which provide cumulative measurements of radiation exposure (i.e., total integrated exposures in milli-roentgen, mR) for a given period. The area surrounding the Indian Point site is divided into 16 compass sectors. Each sector has two TLD sample locations. The inner ring is located near the site boundary at approximately 1 mile (1.6 km). The outer ring is located at approximately 5 miles (8 km) from the site (6.7- 8.0 km), see Figures A-1 and A-2. Additional TLD locations include a control location at Roseton (20.7 miles north) and eight locations of special interest. In total, there are 41 TLD sample sites, designated DR-1 through DR-41, with two TLDs placed at each site. TLDs are collected and processed on a quarterly basis. The results are reported as mR per standard quarter (91 days). The data reported is the average of the two TLDs from each sample site.
3.3.2 Airborne Particulates and Radioiodine
Air samples were taken at eight locations varying in distance from 0.28 to 20.7 miles (0.4 to 33 km) from the plant. These locations represent one control at sampling station 23 (AS) and seven indicator locations. These indicator locations are at sampling stations 4 (A1), 5 (A4), 27, 29, 44, 94 (A2), and 95 (A3). The locations are shown on Figures A-1, A-2, and A-3. The air samples are collected continuously by means of fixed air particulate filters followed by in-line charcoal cartridges. Both filters and cartridges are changed on a weekly basis. The filters are analyzed for gross beta and the cartridge samples for radioiodine. In addition, gamma spectroscopy analysis (GSA) is performed on quarterly composites of the air particulate filters.
3-1

3.3.3 · Precipitation
Precipitation samples are continuously collected at one indicator location (sampling station 44) and one control location (23); see Figure A-3. They are collected in sample bottles designed to hinder evaporation. They are composited quarterly and analyzed by gamma spectroscopy and for tritium.
3.3.4 Drinking Water
Samples of drinking water are collected monthly from the Camp Field Reservoir (3.4 miles NE, sample station 7, sample designation Wb1) and New Croton Reservoir (6.3 miles SE, sample station 8); see Figure A-3. Each monthly sample is approximat~ly 4 liters and is analyzed for gross beta and gamma-emitting radionuclides. Monthly samples are composited quarterly and analyzed for tritium.
3.3.5 Groundwater Water
Groundwater samples are obtained semi-annually at Lafarge (106.) Samples are analyzed for tritium, strontium-90, and nickel-63 and by gamma spectroscopy.
3.3.6 Soil
Soil samples are collected from two indicator locations (sampling stations 94 and 95), and one control location (23) on an annual basis; see Figure A-3. They are approximately 2 kg in size and consist of about twenty 2-inch deep cores. The soil samples are analyzed by gamma spectroscopy.
3.3.7 Broad Leaf Vegetation
Broad leaf vegetation samples are collected from three locations during the growing season. The indicator locations are sampling stations 94 (lc2) and 95 (lc1), and the control location is at sampling station 23 (lc3). See Figures A-1 and A-2. The samples are collected monthly, when available, and analyzed by gamma spectroscopy. These samples consist of at least 1 kg of leafy vegetation and are used in the assessment of the food product and milk ingestion pathways.
3.3.8 Hudson River Water
Hudson River water sampling is performed continuously at the intake structure (sampling station 9, Wa1) and at a point exterior to the discharge canal where Hudson River water and water from the discharge canal mix (sampling station 10, Wa2); see Figure A-1. An automatic composite sampler is used to take representative samples. On a weekly basis, accumulated samples are taken from both sample points. These weekly river water samples are composited for monthly gamma spectroscopy analysis and quarterly for tritium analysis.
3-2

3.3.9 Hudson River Bottom Sediment
Bottom sediment and benthos are sampled at four locations: _three indicator locations (sampling stations 10, 17, and 28) and .one control location (84), along the Hudson River, once each spring and summer; see Figure A-3. These samples are obtained using a Peterson grab sampler or similar instrument. The bottom sediment samples are analyzed by !;lamma spectroscopy.
3.3.1 O Hudson River Shoreline Soil
Shoreline soil samples are collected at three indicator and two control locations along the Hudson River. The indicator locations are at sampling stations 53 (Wc1), 28, and 17. The control locations are at sampling stations 50 (Wc2) and 84. Figures A-1, A-2, and A-3 show these locations. The samples are gathered at a level above low tide and below high tide and are approximately 2-kg grab samples. These samples are collected at greater than 90 days apart and are analyzed by gamma spectroscopy and for strontium-90.
3.3.11 Hudson River Aquatic Vegetation
During the spring and summer, aquatic vegetation samples are collected from the Hudson River at two indicator locations (sampling stations 17 and 28) and one control location (84); see Figure A-3. Samples of aquatic vegetation are obtained depending on sample availability. These samples are analyzed by gamma spectroscopy.
3.3.12 Fish and Invertebrates
Fish and invertebrate samples are obtained from the Hudson River at locations upstream and downstream of the plant discharge. The indicator location (downstream sample point) is designated as sampling station 25 (lb1), and a second sampling point is located further downstream. The control location (upstream) is at sampling station 23 (lb2). See Figures A-1 and A-2. These samples are collected in season or semiannually if they are not seasonal. The fish and invertebrates sampled are analyzed by gamma spectroscopy as well as for · strontium-90 and for nickel-63.
3.3.13 Land Use Census
Each year a land use census consisting of milch animal and residence surveys is conducted during the growing season to determine the current utilization of land within 5 miles (8 km) of the site. These surveys are used to determine whether there are changes in existing conditions that warrant changing the sampling program.
For example, the milch animal census is used to identify animals producing milk for human consumption within 5 miles (8 km) of Indian Point. This census consists of visual field surveys of the areas where a high probability of milch animals exists and confirmation through New York State records or with personnel such as feed suppliers who deal with farm animals and dairy associations (See Tables B-21 and B-22).
Visual inspections are made of the 5-mile area around the Indian Point Site during routine sample collections and emergency plan equipment inspections in the area throughout the year. An extensive land survey is conducted of the 5-mile area in an attempt to identify new residential areas, commercial developments and to identify milch animals in pasture.
3-3

Although there are presently no animals producing milk for human consumption within 5 miles (8 km) of the site, the census is performed to determine if a milk-sampling program needs to be conducted.
r
A residence census is also performed to identify the nearest residence(s) to the site in each of the 16 sectors surrounding Indian Point. See Table B-22.
A garden census was not performed, since the ODCM allows sampling of vegetation in two sectors near the site boundary in lieu of a garden census. The sectors are chosen to be in
·the pre-dominant wind directions with the highest predicted deposition rates.
3.4 Statistical Methodology
There are several statistical calculation methodologies used in evaluating the data from the Indian Point REMP. These methods include determination of Lower Limits of Detection (LLD) and the Minimum Detectable Concentration (MDC), and estimation of the mean and associated propagated error.
3.4.1 LOWER LIMIT OF DETECTION (LLD)
The LLD is the smallest concentration of radioactive material in a sample that will yield a net count above system background, and be detected with 95% probability, with a 5% probability of falsely concluding that a blank observation represents a "real" signal.
For a particular measurement system (which may include radiochemical separation):
Where:
LLD=
Ts=
E=
V=
k=
Y=
A=
t=
2. 71+3.29 Sb* Jl+(T') LLD= Ts Ts
E * V * k * Y * e-).J
The lower limit of detection as defined above (as picocurie per unit mass or volume)
The sample counting time in minutes
The standard deviation of the background counting rate or of the counting rate of a blank sample as appropriate (as counts per minute)
The background count time in minutes
The counting efficiency (as counts per transformation)
The sample size (in units of mass or volume)
A constant for the number of transformations per minute per unit of activity (normally, 2.22E+6 dpm per uCi)
The fractional radiochemical yield (when applicable)
The radioactive decay constant for the particular radionuclide
The elapsed time between midpoint of sample collection and time of counting
3-4

Note: The above LLD formula accounts for differing background and sample count times. The Radiological Environmental Monitoring Program, REMP, may use an LLD formula that assumes equal background and sample count times, when appropriate. The constants 2.71 and 3.29 and the general LLD equation were derived from References 2 and 3.
The value of Sb used in the calculation of the LLD for a detection system shall be based on the actual observed variance of the background counting rate or of the counting rate of the blank samples (as appropriate) rather than on an unverified theoretically predicted variance. In calculating the LLD for a radionuclide determined by gamma ray spectrometry, the background shall include the typical contributions of other radionuclides normally present in the samples. Typical values of E, V, Y, and t shall be used in the calculation. The background count rate is calculated from the background counts that are determined by a separate background count or in the case of gamma ray spectroscopy, from adjacent channels of the energy band of the gamma ray peak used for the quantitative analysis for that radionuclide.
It should be recognized that the LLD is defined as an a priori (before the fact) limit representing the capability of a measurement process and not as an a posteriori (after the fact) limit for a particular measurement. To document the post priori (after the fact) measurement statistics, the MDC is calculated after the measurement using the same equation as above.
To handle the a posteriori problem, a decision level must be defined. To minimize the number of false positives, a value is not considered positive unless it is greater than the MDC or 3 times the total standard deviation of the post priori measurement, where MDC is the post priori (after the fact) measurement statistic calculated similar to the LLD equation listed above (for Tb= Ts. the term 3.29 O"b* [(1 + (Tb I Ts ))112
] = 4.66 ob)-
3.4.2 Table Statistics
The averages shown in the summary table (Table B-2) are the averages of the positive values in accordance with the NRC's Branch Technical Position (BTP) to Regulatory Guide 4.8 (Reference 4). Samples with"<" values are not included in the averages.
It should be noted that this statistic for the mean using only positive values tends to strongly bias the average ,high, particularly when only a few of the data are measurably positive. The REMP data show few positive values; thus the corresponding means are biased high. Exceptions to this include direct radiation measured by TLDs and gross beta radioactivity in air, which show positive monitoring results throughout the year.
The historical data tables contain the annual averages of the positive values for each year. The historical averages are calculated using only the positive values presented for 2005 through 2014. The 2015 average values are included in these historic tables for purposes of comparison.
3-5

SECTION 4
RES UL TS AND DISCUSSION

4.0 RES UL TS AND DISCUSSION
The 2015 Radiological Environmental Monitoring Program (REMP) was conducted in accordance with Indian Point's Offsite Dose Calculation Manual ODCM. The ODCM contains requirements for the number and distribution of sampling locations, the types of samples to be collected, and the types of analyses to be performed for measurement of radioactivity. ·
The REMP at Indian Point includes measurements of radioactivity levels in the following environmental pathways.
Direct Gamma Radiation Precipitation Groundwater Broad Leaf Vegetation Bottom Sediment Aquatic Vegetation
Airborne Particulates and Radioiodine Drinking Water Soil Hudson River Water Shoreline Soil Fish and Invertebrates
An annual land use and milch animal census is also part of the REMP.
To evaluate the contribution of plant operations to environmental radioactivity levels, other man-made and natural sources of environmental radioactivity, as well as the aggregate of past monitoring data, must be considered. It is not merely the detection of a radionuclide, but the evaluation of the location, magnitude, source, and history of its detection that determines its significance. Therefore, we have reported the data collected in 2014 and assessed the significance of the findings.
A summary of the results of the 2015 REMP is presented in Table B-2. This Table lists the mean and range of all positive results obtained for each of the media sampled at ODCM indicator and control locations. Discussions of these results and their evaluations are provided below.
The radionuclides detected in the environment can be grouped into three categories: (1) naturally occurring radionuclides; (2) radionuclides resulting from weapons testing and other non-plant related, anthropogenic sources; and (3) radionuclides that could be related to plant operations.
The environment contains a broad inventory of naturally occurring radionuclides which can be classified as, cosmic ray induced (e.g., Be-7, H-3) or geologically derived (e.g., Ra-226 and progeny, Th-228 and progeny, and K-40.) These radionuclides constitute the majority of the background radiation source and thus account for a majority of the annual background dose detected. Since the detected concentrations of these radionuclides were consistent at indicator and control locations, and unrelated to plant operations, their presence is noted only in the data tables and will not be discussed further.
The second group of radionuclides detected in 2015 consists of those resulting from past weapons testing in the earth's atmosphere. The more recent contamination events resulting from the Chernobyl and Fukushima accidents only indicated detectable activity shortly after their occurrences (Reference 5). However, weapons testing in the 1950's and 1960's

resulted in a significant atmospheric radionuclide inventory, which, in turn, still contributes to the concentrations in the ecological systems. Although reduced in frequency, atmospheric weapons testing continued into the 1980's. The resultant radionuclide inventory of some radionuclides, although diminishing with time (e.g., through radioactive decay and natural dispersion processes), remains detectable.
In 2015, the detected radionuclides that may be attributable to past atmospheric weapons testing consisted of Cs-137 and in several media. The levels detected were consistent with the historical levels of radionuclides resulting from weapons tests as measured in previous years.
The final group of radionuclides detected by the 2015 REMP comprises those that may be attributable to current plant operations. During 2015, Cs-137 and Tritium were the only potentially plant-related radionuclides detected in any environmental samples.
. H-3 may be present in the local environment due to either natural occurrence, other manmade sources, or as a result of plant operations. Natural occurrence is very low (on the order of approximately 5 pCi/liter - well below typical detectable levels). The major source of H-3 is typically from above ground nuclear weapons testing, in the range of 50 to 150 pCi/liter). Other sources include weapons production and industrial uses where levels are highly dependent on the release rates and distance from the source term. One such industrial source is nuclear power plant operation.
Cs-137 is ubiquitous in the environment from atmospheric testing debris and a lesser amount from the Chernobyl accident. In 2015, there were two detections of Cs-137 in bottom sediment and shoreline soil at both control and indicator locations. Cs-137 was also detected in one aquatic vegetation sample obtained at an upstream (control) location at very low levels but none was detected in downstream (indicator) locations. In all cases, the Cs-137 concentrations, when detected, were consistent with historical values. ,
The fact that there was no Cs-134 present (recent plant releases would contain Cs-134) and that the levels detected were consistent with historical values indicates that th~ activity may be due to atmospheric weapons testing, with some contribution from plant releases from the past years. None of the fish samples indicated any detectable levels of these isotopes.
Strontium-90 (Sr-90) may also be present ilJ the environment from atmospheric testing debris. No Sr-90 was detected in any of the fish, shoreline soil or groundwater samples.
1-131 is also produced in fission reactors, but can result from non-plant related anthropogenic sources, e.g., medical administrations, such as in previous years. 1-131 was not detected in 2015 in aquatic or terr~strial vegetation indicator and control locations.
4-2

Co-58 and Co-60 are activation/corrosion products also related to plant operations. They are produced by neutron activation in the reactor core. Co-58 has a much shorter half-life than Co-60. If Co-58 and Co-60 are concurrently detected in environmental samples, then the source of these radionuclides is more likely the result of recent releases. When significant concentrations of Co-60 are detected but no Co-58, there is an increased likelihood that the Co-60 is due to residual Co-60 from past operations. There was no Co-58 or Co-60 detected in the 2015 REMP, although they were observed in historical data.
In the following sections, a summary of the results of the 2014 REMP is presented by sample medium and the significance of any positive findings discussed. It should be noted that naturally occurring radionuclides are omitted from the summary table (Table 8-2) and further discussion.
4.1 Direct Radiation
The environmental TLDs used to measure the direct radiation were TLDs supplied and processed by Environmental Dosimetry Company. In 2015, the TLD program produced a consistent picture of ambient background radiation levels in the vicinity of the Indian Point Station. A summary of the annual TLD data is provided in Table 8-2 and all the TLD data are presented in Tables 8-3, 8-4 and 8-5. TLD sample site DR-40 is the control site for the direct radiation (DR) series of measurements.
Table 8-3 provides the quarterly and annual average reported doses in mR per standard quarter for each of the direct radiation sample points, DR-1 through DR-41. Table 8-4 provides the mean, standard deviation, minimum and maximum values in mR per standard quarter for the years 2003 through 2015. The 2015 means are also presented in Table 8-4. Table 8-5 presents the 2015 TLD data for the inner ring and outer ring of TLDs. The table also provides the sector for each of the DR sample points.
The 2015 mean value for the indicator direct radiation sample points was 13.6 mR per standard quarter - which is consistent with historical values. At those locations where the · 2015 mean value was higher than historical means, they are within historical bounds for the respective locations.
The DR sample locations are arranged so that there are two concentric rings of TLDs around the Indian Point site. The inner ring (DR-1 to DR-16) is close to the site boundary. The outer ring (DR-17 to DR-32) has a radius of approximately 5 miles from the three Indian Point units. The results for these two rings of TLDs are provided in Table 8-5. The annual average for the inner ring was 13.5 mR per standard quarter and also average for the outer ring was 14.0 mR per standard quarter. The control location average for 2014 was 14.3 mR per standard quarter.
Table C-1 and Figure C-1 present the 10-year historical averages for the inner and outer rings of TLDs. The 2015 averages are consistent with the historical data. The 2015 and previous years' data show that there is no measurable direct radiation in the environment due to the operation of the Indian Point site.
4-3

4.2 Airborne Particulates and Radioiodine
An annual summary of the results of the 2015 air particulate filter and charcoal cartridge analyses is presented in Table 8-2. As shown, there were no radionuclides detected in the air attributable to plant operations. ·
The results of the analyses of weekly air particulate filter samples for gross beta activity are presented in Table 8-6 and the weekly charcoal cartridge analytical results are presented in Table 8-7.
Gross beta activity was found in air particulate samples throughout the year at all indicator and control locations. The average gross beta activity for the eight indicator air sample · locations was 0.016 pCi/m3 and the average for the control location was 0.015 pCi/m3
. The activities detected were consistent for all locations, with no significant differences in gross beta activity in any sample due to location. There was a noticeable increase in gross beta activity during the week of 12/7-12/14. However, the increase was similar at all locations indicating that it was due to some natural phenomenon. In addition, other facilities in the Northeast report similar increases during that time. All the charcoal cartridge results were less than MDC, consistent with historical trends when there were no episodes of fresh fallout from Weapons Testing or accidents.
The results of the GSA of the quarterly composites of these samples are in Table 8-8. These quarterly composite air samples showed that no reactor-related radionuclides were detected and that only naturally-occurring radionuclides were present at detectable levels.
The mean annual gross beta concentrations and Cs-137 concentrations in air for the past 10 years are presented in Table C-2. From this table and Figure C-2, it can be seen that the average 2015 gross beta concentration was consistent with historical levels. Cs-137 has not been detected since 1987. This is consistent with the trend of decreasing ambient Cs-137 concentrations in recent years.
From the data, it can be seen that no airborne radioactivity attributable to the operation of Indian Point was detected in 2015. ·
4'.3 Precipitation
A summary of the precipitation sample analysis results is presented in Table 8-2. Table 8-9 contains the results of the precipitation samples for 2015. Only one naturally occurring radionuclide was detected in the precipitation samples. ·
A review of historical data over the last 1 O years indicates tritium had been detE;icted in one indicator precipitation sample in 2010 and both indicator and control locations in 2010; however, there have been no instances of positive values in 2015.
4.4 Drinking Water
'
The annual program summary table (Table 8-2) contains a summary of the 2015 drinking water sample analysis results. Results of the gross beta, tritium and gamma spectroscopy analyses of the monthly drinking water samples are in Table 8-10. Other than naturally occurring radionuclides, no radioactivity was detected in drinking water samples. This has
4-4

historically been the case for the radionuclide results for this media. Operation of the Indian Point units had no detectable radiological impact on drinking water.
4.5 Ground Water
A summary of the groundwater samples for 2015 is contained in Table B-2. Data resulting from analysis of the groundwater samples for gamma emitters, tritium analysis, Ni-63 and Sr-90 are given in Table B-11. No plant related nuclides were noted in these samples.
4.6 Soil
A summary of the soil sample analysis results is presented in Table B-2. Table B-12 contains the results of the soil samples for 2015. Other than naturally occurring radionuclides, no activity was detected in any of the soil samples.
4. 7 Broad Leaf Vegetation
Table B-2 contains a summary of the broad leaf vegetation sample analysis results. Data from analysis of the 2015 samples are presented in Table B-13.
Table C-3 contains an historical summary and Figure C-3 is an illustration of the broad leaf vegetation analysis results. There were no plant related nuclides detected in the 2015 samples. The detection of low levels of Cs-137 has occurred sporadically at indicator -1ocations at relatively low conc~ntrations for the past ten years, most likely the result of previous atmospheric weapons testing.
4.8 Hudson River Water
A summary of the radionuclides detected in the Hudson River water is contained in Table B-2. Data resulting from analysis of monthly Hudson River water samples for gamma emitters and quarterly composites of H-3 are presented in Tables B-14.
The only plant related activity detected was H-3, and it was detected at low levels in indicator and control samples. The levels are consistent with occasional historical detection of H-3. Table C-3 shows historical H-3 concentrations at the plant inlet and discharge points. Table C-8 contains a comparison of H-3 detected at the plant discharge (Hudson River Water mixing point) versus calculated quarterly average effluents concentrations. The data in table C-8 provides assurance that the REMP is indeed providing verification of the calculation of radionuclide concentrations resulting from effluent releases attributable to the site.
4.9 Hudson River Bottom Sediment
A summary of the Hudson River bottom sediment analysis results is included in Table B-2. Table B-15 contains the results, of the analysis of bottom sediment samples for 2015. Cesium-137 was detected in all six of the indicator station samples, and none of the control location samples. Detection of positive levels of Cs-137 in river bottom sediment is not unusual. Cs-134 was not detected in any bottom seqiment samples. The lack of Cs-134 points to the primary source of the Cs-137 in bottom sediment as being from prior historical plant releases over the years and from residual weapons test fallout.
Historical levels of Cs-137 in bottom sediment samples are shown in table C-9 and figure C-8. This data shows the continued detection of Cs-137 in bottom sediment samples at.
4-5

varying levels, and demonstrates that the levels observed during 2015 sampling are within the range of levels identified in historical samples.
4.10 Hudson River Shoreline Soil
A summary of the radionuclide concentrations detected in the shoreline soil samples is contained in Table 8-2. Table 8-16 contains the results of the gamma spectroscopic and strontium-90 analyses of the shoreline soil samples.
In addition to the naturally occurring radionuclides, Cs-137 was identified in the Hudson River shoreline soil samples in 2015. Cesium-137 was detected at the Verplank location in in both samples from that location, for a total of two positive values out of eight samples from indicator locations. Cesium-137 was not detected at either of the control locations (Manitou Inlet and Cold Springs). The average concentration for the indicator locations that had positive indication of Cs-137 was 110 pCi/kg (dry) with a maximum concentration of 138 pCi/kg (dry).
An historical look at Cs-137 detected in shoreline soil at indicator and control locations can be viewed in Table C-6 and Figure C-6. Cesium-137 has been and continues to be present in this media, both at indicator and occasionally at the control location, at a consistent level over the past ten years. Cesium-134 and Cs-137 are both discharged from the plant in similar quantities. The lack of Cs-134 activity is an indication that the primary source of the Cs-137 in the shoreline soil is legacy contamination from weapons fallout.
Strontium-90 (Sr-90) was not detected in any of the 8 indicator location samples or any of the control location samples. ·
4.11 Aquatic Vegetation
A summary of the aquatic sample analysis results is presented in Table 8-2. Table 8-17 contains the results of the analysis of aquatic vegetation samples for 2015. No plant related radionuclides were detected in any indicator samples and a very low level of Cs-137 (14 pCi/kg) was detected in a single control location sample. This is consistent with historical findings.
4.12 Fish and Invertebrates
A summary of the fish and invertebrate sample analysis results is presented in Table 8-2. Table 8-18 contains the results of the analysis of fish and invertebrate samples for 2015. No plant related radionuclides were detected. This is consistent with historical results which are shown in table and figure c,.7.
4.13 Land Use Census
A census was performed in the vicinity of Indian Point in 2015. This census consisted of a milch animal and a residence census. Res.ults of this census are presented in Tables 8-21 and 8-22.
4-6

The results of the 2015 census were generally same as the 2014 census results, in 2014 the presence of goats was noted on a property located approximately 4.99 miles NNW of IPEC. However, discussions with the owner for both the 2014 and 2015 land use surveys confirmed that the goats did not produce milk for human consumption and are therefore not milk animals.
The census revealed that the two nearest residences in different sectors are located 0.44 miles (0. 71 km) ESE and 0. 73 miles (1.13 km) S of the plant. The 2014 land use census indicated there were no new residences that were closer in proximity to IPEC.
The ODCM allows the sampling of broad leaf vegetation in two sectors at the site boundary in lieu of performing a garden census. Analysis results for these two sectors are discussed in Section 4.6 and presented in Table 8-14, Table C-6 and Figure C-6.
4.14 Conclusion
The Radiological Environmental Monitoring Program is conducted each, year to determine the radiological impact of Indian Point operations on the environment. The preceding discussions of the results of the 2015 REMP reveal that operations at the station did not result in an impact on the environment.
The 2015 REMP results demonstrate the relative contributions of different radionuclide sources, both natural and anthropogenic, to the environmental concentrations. The results indicate that the fallout from previous atmospheric weapons testing continues to contribute to detection of Cs-137 in some environmental samples. There are infrequent detections of plant related activity (e.g., H-3) in the· environs; however, the radiological levels are very low and are significantly less than those from natural background and other anthropogenic sources.
4-7

SECTION 5
REFERENCES

5.0 REFERENCES
1. United States of America, Code of Federal Regulations, Title 10, Part 50, Appendix A Criteria 64.
2. Currie, L.A., "Limits for Qualitative Detection of Quantitative Determination", Analytical Chemistry, 40:586-593, 1968.
3. Mayer, Dauer, "Application of Systematic Error Bounds to Detection Limits for Practical Counting"., Health Physics Journal, 65(1): 89-91, 1993.
4. U.S. Nuclear Regulatory Commission, Branch Technical Position, "An Acceptable Radiological Environmental Monitoring Program," Revision 1, November 1979.
5. Wetherbee, Gregory A., et.al., Wet Deposition of Fission-Product Isotopes to North America from the Fukushima Dai-ichi Incident, March 2012, Environmental Science and Technology.
6. IPEC Offsite Dose Calculation Manual, Units 1, 2 and 3.
7. United States of America, Code of Federal Regulations, Title 10.
8. United States of America, Code of Federal Regulations, Title 40.
9. U.S. Nuclear Regulatory Commission, Regulatory Guide .4.1,. "Program for Monitoring Radioactivity in the Environs of Nuclear Power Plants," Revision 1, April 1975.
10. U.S. Nuclear Regulatory Commission, Regulatory Guide 4.1, Radiological Environmental Monitoring for Nuclear Power Plants, Revision 2, June 2009.
11. Entergy Nuclear Indian Point, Radiological Environmental Monitoring Chemistry Procedures.
1~. U.S. Nuclear Regulatory Commission, Regulatory Guide 4.8, Environmental Technical Specifications for Nuclear Power Plants, December 1975.
13. Eisenbud, M., Environmental Radioactivity, Academic Press, New York, 1987.
14. Glasstone, S., and W. H. Jordan, Nuclear Power and Its Environmental Effects, American Nuclear Society, La Grange Park, IL, 1980.
15. Cohen N., and Eisenbud M., Radiological Studies of the Hudson River, Progress Report Institute of Environmental Medicine, New York University Medical Center, December 1983.
16. U.S. Nuclear Regulatory Commission. Regulatory Guide 4.15, Revision 1, Quality Assurance for Radiological Monitoring Programs (Normal Operations) - Effluent Streams and the Environment February 1979.
17. J. W. Poston, Cesium-137 and Other Man-Made Radionuclides in the Hudson River: A Review of the Available Literature, Applied Physical Technology, Inc., report to NYPA, September 1977.
5-1

18. U.S. Environmental Protection Agency Report EPC-520/1 80-012, Upgrading Environmental Radiation Data .. August 1980.
19. Andrews, Howard L. and Lapp, Ralph E. Nuclear Radiation Physics, Prentice-Hall, Inc., Englewood Cliffs, New Jersey, 1972.
20. U.S. Nuclear Regulatory Commission, Branch Technical Position to Regulatory Guide 4.8, An Acceptable Radiological Environmental Monitoring Program, November 1979. ·
21. Eichholz, Geoffrey G., Environmental Aspects of Nuclear Power, Lewis Publishers, Inc., Chelsea, Michigan, 1985.
22. Kelly, J. J. (Ed.), Effluent and Environmental Radiation Surveillance, ASTM STP #698, Philadelphia, PA, 1978.
23. Knoll, Glenn F., Radiation Detection and Measurement, first edition, John Wiley and Sons, New York, 1979.
24. Dixon, Wilfred J., Introduction to Statistical Analysis, third edition, McGraw-Hill Inc., 1969.
25. National Council on Radiation Protection. NCRP Report No. 94, Exposure of the Population in the United States and Canada from Natural Background Radiation December 1987.
26. National Council on Radiation Protection. NCRP Report No. 62, Tritium in the Environment, March 1979.
27. Kuhn, W.,et al., The Influence of Soil Parameters on Cs-137 Uptake by Plants from Long-Term Fallout on Forest Clearings and Grasslands, Health Physics Journal, 46(5), p. 1083, May 1984.
28. Garner, J. ,et al., High Radiocesium Levels in Granite Outcrop Vegetation and Reductions Through Time, Health Physics Journal, 60(4), p. 533, April 1991.
29. McGee, E., et al., The Variability. in Fallout Content of Soils and Plants and the Design of Optimum Field Sampling Strategies, Health Physics Journal, 68(3), March 1995.
30. Consolidated Edison Company of New York, Safety Evaluation for Amendment #45 to Unit 1 Provisional Operating License, January 1996.
31. U.S Nuclear Regulatory Commission, Regulatory Guide 4.13, Performance, Testing, and Procedural Specifications for Thermoluminescence Dosimetry: Environmental Applications, November 1979.
32. Office of Environmental Management, Semi-Annual Report of the Department of Energy, Quality Assessment Program, EML 617, June 2003.
33. Office of Environmental Management, Semi-Annual Report of the Department of Energy, Quality Assessment Program, EML 618, December 2003.
5-2

34. McFarland, RC., et al., The Counting Room: Special Edition, Radioactivity and Radiochemistry, Caretaker Publications, Atlanta, Georgia, 1994.
35. Bevington, P.R., Data Reduction and Error Analysis for the Physical Sciences,· McGraw Hill, 1969.
36. ENN-Ll-102, Corrective Action Process
37. Technical Information Document 2003-011 "Justification for the Removal of the Radiological Environmental Monitoring Blind Spike Program at IPEC"
38. National Council on Radiation Protection and Measurements, Report No. 169, "Design of Effective Radiological Effluent Monitoring and Environmental Surveillance Programs", December 2010.
39. Donald T. Oakley, "Natural Radiation Exposure in the United States." U. S. Environmental Protection Agency, ORP/SID 72-1, June 1972.
40. National Council on Radiation Protection and Measurements, Report No. 160, "Ionizing Radiation Exposures of the Population of the United States," March 2009.
41. National Council on Radiation Protection and Measurements, Report No. 94, "Exposure of the Population of the United States and Canada from Natural Background Radiation," December 1987.
42. U.S. Nuclear Regulatory Commission, Regulatory Guide 8.29, "Instructions Concerning Risks from Occupational Radiation Exposure," Revision 0, July 1981.
43. U.S. Nuclear Regulatory Commission, NUREG-1301, "Offsite Dose Calculation Manual Guidance: Standard Radiological Effluent Controls for Pressurized Water Reactors," April 1991.
44. NYS Department of Environmental Conservation, "Measurement of Strontium and Other Radionuclides in Edible Tissue and Bone/carapace of Fish and Blue Crabs from the Lower Hudson River, New York", November 2009.
5-3

APPENDIX A
ENVIRONMENTAL SAMPLING AND ANALYSIS REQUIREMENTS

APPENDIX A
Environmental media are sampled at the locations specified in Table A-1 and shown in Figures A-1, A-2, and A-3. The samples are analyzed according to criteria established in the ODCM. These requirements include: methods of sample collection; types of sample analysis; minimum sample size required; lower limit of detection, which must be attained for each medium, sample, or
. analysis type, and environmental concentrations requiring special reports.
Table A-1 provides the sampling station number, location, sector, and distance from Indian Point, sample designation code, and sample type. This table gives the complete listing of sample locations used in the 2015 REfylP.
Three maps are provided to show the locations of REMP sampling. Figure A-1 shows the sampling locations within two miles of Indian Point. Figures A-2 and A-3 show the sampling locations within ten miles of Indian Point.
The ODCM required lower limits of detection (LLD) for Indian Point sample analyses are presented in Table A-2. These required lower limits of detection are not the same as the lower limits of detection or critical levels actually achieved by the laboratory. The laboratory's lower limits of detection and -critical levels must be equal to or lower than the required levels presented in Table A-2.
Table A-3 provides the reporting level for radioactivity in various media. Sample results that exceed these levels and are due to plant operations require that a special report be submitted to the NRC.
In addition to the sampling outlined in Table A-1, there is an environmental surveillance requirement that an annual land use and milch animal census be performed. See Tables 8-19 and 8-20 for the milch animal and land use census.
A-1

TABLE A-1 INDIAN POINT REMP SAMPLING STATION LOCATIONS
SAMPLING SAMPLE LOCATION
STATION DESIGNATION
3 DRS Service Center Building
4 A1
Algonquin Gas Line A1
A4
s A4 NYU Tower
DR10
7 Wb1 Camp Field Reservoir
8 ** Croton Reservoir
9 Wa1 Plant Inlet (Hudson River Intake)*
10 Wa2
Discharge Canal (Mixing Zone) **
14 DR? Water Meter House
**
17 ** Off Verplanck
**
20 DR38 Cortlandt Yacht Club (AKA Montrose Marina)
**
AS
AS 23 DR40 Roseton*
lc3
**
lb2
2S lb1 Downstream
**
27 ** Croton Point
DR41
**
28 DR4
Lent's Cove **
**
**
29 ** Grassy Point
DR39
33 DR33 Hamilton Street (Substation)
34 DR9 South East Corner of Site
3S DRS Broadway & Bleakley Avenue
38 DR34 Furnace Dock (Substation)
**
• = Control location •• = Locations listed do not have sample designation locations
specified in the ODCM A-2 HR = Hudson River R/S = Reuter Stokes
DISTANCE
Onsite -0.3S Mi (SSE) at 1 S8°
Onsite - 0.28 Mi (SW) at 234°
Onsite - 0.88 Mi (SSW) at 208°
3.4 Mi (NE) at S1 °
6.3 Mi (SE) at 124°
Onsite -0.16 Mi (W) at 273°
Onsite -0.3 Mi (WSW) at 249°
Onsite - 0.3 Mi (SE) at 133°
1.S Mi (SSW) at 202.5°
1.S Mi (S) at 180°
20.7 Mi (N) at 3S7°
Downstream
6.36 Mi (SSE) at 1 S6°
0.4S Mi (ENE) at 069°
3.37 Mi (SSW) at 196°
2.88 Mi (NE) at OS3°
Onsite -O.S2 Mi (S) at 179°
Onsite -0.37 Mi (E) at 092°
3.43 Mi (SE) at 141 °
SAMPLE TYPES
Direct Gamma
Air Particulate
Radioiodine
Air Particulate
Radioiodine
Direct Gamma
Drinking Water
Drinking Water
HR Water
HR Water
HR Bottom Sediment
Direct Gamma
HR Aquatic Vegetation
HR Shoreline Soil
HR Bottom Sediment
Direct Gamma
Precipitation
Air Particulate,
Radioiodine
Direct Gamma
Broad Leaf Vegetation
Soil
Fish & Invertebrates
Fish & Invertebrates
Air Particulate
Radioiodine
Direct Gamma
HR Shoreline Soil
Direct Gamma
HR Bottom Sediment
HR Aquatic Vegetation
Air Particulate
Radioiodine
Direct Gamma
Direct Gamma
Direct Gamma
Direct Gamma
Direct Gamma
Precipitation

TABLE A-1 INDIAN POINT REMP SAMPLING STATION LOCATIONS
SAMPLING SAMPLE LOCATION
STATION DESIGNATION
44 .. Peekskill Gas Holder Bldg .. 50 Wc2 Manitou Inlet*
53 Wc1
White Beach DR11
56 DR37 Verplanck - Broadway & 6th Street
57 DR1 Roa Hook
58 DR17 Route 9D - Garrison
59 DR2 Old Pemart Avenue
60 DR18 Gallows Hill Road & Sprout Brook Road
61 DR36 Lower South Street & Franklin Street
62 DR19 Westbrook Drive (near the Community Center)
64 DR20 Lincoln Road - Cortlandt (School Parking Lot)
66 DR21 Croton Avenue - Cortlandt
67 DR22 Colabaugh Pond Road - Cortlandt
69 DR23 Mt. Airy & Windsor Road
71 DR25 Warren Ave - Haverstraw
72 DR26 Railroad Avenue & 9W - Haverstraw
73 DR27 Willow Grove Road & Captain Faldermeyer Drive
74 DR12 West Shore Drive - South
75 DR31 Palisades Parkway
76 DR13 West Shore Drive - North
77 DR29 Palisades Parkway
78 DR14 Rt. 9W across from R/S #14
79 DR30 Anthony Wayne Park
80 DR15 Route 9W South of Ayers Road
81 Palisades Pkwy - Lake Welch Exit
82 DR16 Ayers Road
83 DR32 Route 9W - Fort Montgomery .. 84 .. Cold Spring • .. 88 DR6 Reuter Stokes Pole #6
89 DR35 Highland Ave & Sprout Brook Road (near rock cut)
• = Control location •• = Locations listed do not have sample designation locations
specified in the ODCM HR= Hudson River R/S = Reuter Stokes A-3
DISTANCE
1.84 Mi (NE) at 052°
4.48 Mi (NNW) at 347°
0.92 Mi (SW) at 226°
1.25 Mi (SSW) at 202°
2 Mi (N) at 005°
5.41 Mi (N) at 358°
1.8 Mi (NNE) at 032°
5.02 Mi (NNE) at 029°
1.3 Mi (NE) at 052°
5.03 Mi (NE) at 062°
4.6 Mi (ENE) at 067°
4.87 Mi (E) at 083°
4 .5 Mi (ESE) at 114°
4.97 Mi (SE) at 127°
4.83 Mi (S) at 188°
4.53 Mi (SSW) at 203°
4.97 Mi (SW) at 226°
1.59 Mi (WSW) at 252°
4.65 Mi (NW) at 225°
1.21 Mi (W) at 276°
4.15 Mi (W) at 272°
1.2 Mi (WNW) at 295°
4.57 Mi (WNW) at 296°
1.02 Mi (NW) at 317°
4.96 Mi (WSW) at 310°
1.01 Mi (NNW) at 334°
4.82 Mi (NNW) at 339°
10.88 Mi (N) at 356°
0.32 Mi (ESE) at 118°
2.89 Mi (NNE) at 025°
SAMPLE TYPES
Air Particulate
Radioiodine
HR Shoreline Soil
HR Shoreline Soil
Direct Gamma
Direct Gamma
Direct Gamma
Direct Gamma
Direct Gamma
Direct Gamma
Direct Gamma
Direct Gamma
Direct Gamma
Direct Gamma
Direct Gamma
Direct Gamma
Direct Gamma
Direct Gamma
Direct Gamma
Direct Gamma
Direct Gamma
Direct Gamma
Direct Gamma
Direct Gamma
Direct Gamma
Direct Gamma
Direct Gamma
Direct Gamma
Direct Gamma
HR Aquatic Vegetation
HR Shoreline Soil
HR Bottom Sediment
Direct Gamma
Direct Gamma

TABLE A-1 INDIAN POINT REMP SAMPLING STATION LOCATIONS
SAMPLING SAMPLE LOCATION
STATION DESIGNATION
90 DR3 Charles Point
92 DR24 Warren Road - Cortlandt
A2
94 A2
IPEC Training Center lc2 .. A3
95 A3
Meteorological Tower lc1 ..
106 .. Lafarge Monitoring Well
107 .. Vicinity of Haverstraw Bay
* = Control location ** = Locations listed do not have sample designation locations
specified in the ODCM A-4 HR = Hudson River R/S = Reuter Stokes
DISTANCE
0.88 Mi (NE) at 047°
3.84 Mi (SSE) at 149°
Onsite- 0.39 Mi (S) at 193°
Onsite -0.46 Mi (SSW) at 208°
0.63 mi SW
2.5 mi SSW (downstream)
SAMPLE TYPES
Direct Gamma
Direct Gamma
Air Particulate
Radioiodine
Broad Leaf Vegetation
Soil
Air Particulate
Radioiodine
Broad Leaf Vegetation
Soil
Groundwater
Fish & Invertebrates

1 mile
Rockland Count.
~ Hudson River Shoreline V Soil Sampling Location
Fish and Invertebrates
FIGURE A-1
SAMPLING LOCATIONS Within Two Miles of Indian Point
lb# (where available) downstream Hudson River
~ Hudson River Sample CJ Upstream & Downstream
Airborne Iodine/Part Sample Location
Direct Ra,liation Sample Location DR#
A-5
Buchanan
Q Broadleaf Vegetation L:J Sample Location

FIGURE A-2
SAMPLING LOCATIONS Greater than Two Miles from Indian Point
~ Bear Mnt Bridge V
Broadleaf Vegetation Sample Location
H Direct Radiation Sample Location DR#
r;l Airborne Iodine & L:..J Particulate Sample
l I ~Drinking Water
Sample ~ation
~Hudson Ri~er ~.,line Soil ySampling Location
-P ek kill
Indian Point
Cw "'
#107
A Fish and lnvertebra s (where available) down.-;. t eam Hudson River
p V r
A-6
Corti ndt Manor
l:. I _.,, Am\'
f ~I 1w
h• ht
Westchester County 5 miles

123: p ~
Roseton, 20. 7 miles north
Hsmrnan p Precipitation
J:':"\.Drinking Water \:!:!!:./Sam pie Location
t;1 Airborne Iodine_~ r, t 'IY L.:J Pa11iculate Sa"1pJ.e
/:::::-... Hudson :ver Shoreline Soil y Sam plin Location
f ~ r: r ...A..soitSamplmg L ca ion ..... J."
./~
FIGURE A-3
SAMPLING LOCATIONS Additional Sampling Locations
N ' s4: Cold Spiing, 10.9 miles north
w~J h.~ •. :tr i1W
A-7
Crug r3
Cor t-r
t" Q
" ~ ~·
utnam ..... Count~
3:
I""
t t
Jp~fr~r·. n V1lley Y1)(l<tow
York own
5 mil es
Af"law
fo·~ tow
He19hL
~ •·-I "- ·-Westchester County
1 ;.~' Monitoring \Veit, GW SW of Site Boundary
""7 Aquatic Vegetation
Oss1rnn udson River
Bottom Sediment

RADIONUCLIDE .ANALYSIS
Gross Beta
H-3
Mn-54
Fe-59
Co-58
Co-60
Ni-63 (f)
Zn-65
Sr-90 (f)
Zr-95
Nb-95
1-131
Cs-134
Cs-137
Ba-140
La-140
TABLEA-2
LOWER LIMIT OF DETECTION (LLD) REQUIREMENTS FOR ENVIRONMENTAL SAMPLES
AIRBORNE FISH FOOD WATER MILK PRODUCTS (pCi/L) PARTIUCLATE 9,R (pCi/kg, (pCi/L) (pCi/kg, wet) . GASES (pCi/m ) wet)
4 0.01
2,000 (d)
15 130
30 260
. 15 130
15 130
30 100
30 260
1 5
30
15
1 (d) 0.07 1 60
15 0.05 130 15 60
18 0.06 150 18 80
60 60
15 15
A-8
SOIL or SEDIMENT
(pCi/kg; dry)
5000
150
180

TABLE A-2
LOWER LIMIT OF DETECTION (LLD) REQUIREMENTS FOR ENVIRONMENTAL SAMPLES
Table Notation
(a) This list does not mean that only these nuclides are to be considered. Other peaks that are identifiable, together with those of the above nuclides, shall also be analyzed and reported in the Annual Radiological Environmental Operating Report pursuant to the ODCM.
I
(b) Required detection capabilities for thermoluminescent dosimeters used for environmental measurements are given in Regulatory Guide 4.13.
(c) The LLD is defined as the smallest concentration of radioactive material in a sample that will yield a net count, above system background, that will be detected with 95% probability with only 5% probability of falsely concluding that a blank observation represents a "real" signal.
It should be recognized that the LLD is defined as an g_ priori (before the fa.ct) limit representing the capability of a measurement system and not as an g_ posteriori (after the fact) limit for a particular measurement.
Analyses shall be performed in such a manner that the stated LLDs will be achieved under routine conditions. Occasionally background fluctuations, unavoidable small sample sizes, the presence of interfering nuclitles, or other uncontrollable circumstances may render these LLDs unachievable.
In such cases, the contributing factors shall be identified and described in the Annual Radiological Environmental Operating Report pursuant to the ODCM.
(d) These LLDs are for drinking water samples. If no drinking water pathway exists, the LLDs may be increased to 3,000 for H-3 and 15 for 1-131.
(e) These required lower limits of detection are associated only with the REMP requirements. The Radiological Ground Water Monitoring Program may involve unique reporting level criteria, independent of the REMP, and defined in station procedures.
-(f) Sr-90 and Ni-63 are included in this table due to their historical presence
in ground water and possible migration to the environment.
A-9

TABLEA.;3
REPORTING LEVELS FOR RADIOACTIVITY CONCENTRATIONS IN ENVIRONMENTAL SAMPLES
RADIONUCLIDE WATER AIRBORNE · FISH MILK ANALYSIS (pCi/L) PARTIUCLATE Cf.R (pCi/kg, W~t) (pCi/L) GASES (pCi/m )
H-3 20,000.
Mn-54 1,000 30,000
Fe-59 400 10,000
Co-58 1,000 30,000
Co-60 300 10,000
Ni-63 ••• 300 1,000
Zn-65 300 20,000
Sr-90 ••• a• 40
Zr-95 400
Nb-95 -400
1-131 2. 0.9 3
Cs-134 30 10 1,000 60
Cs-137 50 20 2,000 70
Ba-140 200 300
La-140 200 300
FOOD· PRODUCTS (pCi/kg, wet)
100
1,000
2,000
Values provided are for drinking water pathways. If no drinking water pathway exists, higher values are allowed, as follows:
H-3 30,000 pCi/L (This is a 40 CFR 141 value)
Sr-90 12 pCi/L
1-13.1 20 pCi/L
•• These reporting levels are associated only with the REMP requirements. The Radiological Ground Water Monitoring Program may involve unique reporting level criteria, independent of the REMP, and defined in station procedures.
••• Sr-90 and Ni-63 are included in this table due to their historical presence in ground water and possible migration to the environment.
A-10

APPENDIX B
RADIOLOGICAL ENVIRONMENTAL MONITORING PROGRAM RESULTS SUMMARY

APPENDIX 8
B.1 2015 Annual Radiological Environmental Monitoring Program Summary
lhe results of the 2015 radiological environmental sampling program are presented in Tables B-2 through B-18. Table B-2 is a summary table of the sample results for 2014. The format of this summary table conforms to the reporting requirements of the ODCM, NRG Regulatory Guide 4.8, and NRG Branch Technical Position to Regulatory Guide 4.8 (Reference 4). In addition, the data obtained from the analysis of samples are provided in Tables B-3 through B-18.
REMP samples were analyzed by various counting methods as appropriate. The methods are; gross beta, gamma spectroscopy analysis, liquid scintillation, radiochemical analysis, and TLD processing. Gamma spectroscopy analysis was performed for the following radionuclides; Be-7, K-40, Mn-54, Co-58, Co-60, Fe-59, Zn-65, Zr-95, Nb-95, Ru-103, Ru-106, 1-131, Cs-134, Cs-137, Ba/La-140, Ce-141, Ce-144, Ra-226 and Ac/Th-228. Radiochemical analyses were performed for H-3, Ni-63, Sr-90 and 1-131 for specific media and locations as required in the ODCM.
B.2 Land Use Census
In accordance with Sections IP2-D3.5.2 and IP3-2.8 of the ODCM, a land use census was conducted to identify the nearest milch animal and the nearest residence. The results of the milch animal and land use census are presented in Tables B-19 and B-20, respectively. In lieu of identifying and sampling the nearest garden of greater than 50 m2
, at least three kinds of broad leaf vegetation were sampled near the site boundary in two sectors and at a designated control location (results are presented in Table B-13). ·
B.3 Sampling Deviations
During 2015, environmental sampling was performed for 12 unique media types addressed in the ODCM and for direct radiation. A total of 1162 samples of
' 1164 scheduled were obtained. Of the scheduled samples, 99.7% were collected and analyzed for the program. Sampli.ng deviations are summarized in Table B-1. Discussions of the reasons for the deviations are provided in Table B-1 a for the air samples and Table B-1 b for other media.
B.4 Analytical Deviations
No analytical deviations were found in 2015.
B.5 Special Reports
No special reports were required under the REMP.
B-1

TOTAL NUMBER OF SAMPLING NUMBER OF REASON FOR
MEDIA SCHEDULED SAMPLES
DEVIATIONS* EFFICIENCY % ANALYSES** DEVIATION
MEDIA
TLD 164 0 100% 164 N/A
PARTICULATES IN AIR 416 0 100% 448 N/A
CHARCOAL FILTER 416 0 100% 416 N/A
PRECIPITATION 8 0 100% 16 N/A
DRINKING WATER 24 0 100% 56 N/A
GROUNDWATER 2 0 100% 8 N/A
SAMPLES
SOIL 3 0 100% 3 N/A
BROAD LEAF 55 2 96% 53 See Table B-1a
VEGETATION
HUDSON RIVER WATER 21 0 100% 42 N/A
SHORELINE SOIL 10 0 100% 10 N/A
HUDSON RIVER BOTIOM 8 0 100% 8 N/A
SEDIMENT
AQUATIC VEGETATION 4 0 100% 4 N/A
FISH & INVERTEBRATES 33 0 100% 99 NIA
TOTALS 1164 2 99.8% 1327
TOTAL NUMBER OF SAMPLES COLLECTED= 1162
* Samples not collected or unable to be analyzed.
** Several sample types require more than one analysis
B-2

LOCATION
Algonquin
NYU Tower
Met Tower
NYU Tower
Croton Point
DATE
2/9/2015
TABLE B-1a 2015 Air Sampling Deviations
PROBLEM I ACTIONS TO PREVENT RECURRENCE
Air Particulate sample lost due to damage to air filter, discovered at changeout. New filter installed
3/22/2015 Loss of 114 hours due to power outage. Power restored.
6/29/2015 Loss of 94 hours due to a blown fuse . Fuse replaced.
7/27/2015 Loss of 141 hours due to power outage resulting from a fallen tree . Power restored .
8/3/2015 Loss of 149 hours due to blown motor fuse . Fuse replaced .
Note: All air particulate filters and charcoal cartridges were analyzed, except for the air filter from Stn 23 on 2/3/14. Since the filter media was
not properly covering the fi lter charcoal the entire time, the sampled was discarded.
LOCATION
Lent's Cove
Verplank Area
TABLE B-1b 2015 Other Media Deviations
Date3 PROBLEM I ACTIONS TO PREVENT RECURRENCE
611 012015 Unable to locate and collecct samples of species of interest aquatic vegetation , at this location.
611 012015 Unable to locate and collecct samples of species of interest aquatic vegetation , at th is location.
Note: Only samples not obtained were the TLDs that were found to be missing from Station DR3 on 4/1 0/1 4.
B-3

Medium or
Pathway
Sampled
(Units)
Direct Radiation (mR/Standard Quarter)
Air Particulate (pCi/m')
Air Iodine (pCi/m3
)
Air Particulate (1 o"" pCi/m3
)
Rainwater (pCi/liter)
Rainwater (cont'd) (pCi/liter)
Drinking Water (pCi/liter)
TABLE B-2 RADIOLOGICIAL ENVIRONMENT MONITORING PROGRAM SUMMARY INDIAN POINT ENERGY CENTER - 2015
Dockets 50-03, 50-247 & 50-286
Indicator
Analysis Total LLD* Locations Location with Highest Mean
Type Number Mean•• Location I Distance I Mean
(Range) Number Direction (Range)
lid-Quarterly 164 NA 13.7 (160/160) DR-28 4.96 Mi. 19.6 (4/4) (10.2/26.7) WSW (16.6/21)
Gr-B 416 0.01 . 016 (364/364) 27 6.36Mi. .017 (52/52) (.003/.056) SSE (.006/.056)
GAMMA 416 1-131 0.07 <LLD
GAMMA 32 Be-7 NA 105 (28/28) 23 20.7Mi. 114.7 (4/4)
(70.6/161.9) N (75/161.5)
K-40 NA <LLD
Cs-134 0.05 <LLD
Cs-137 0.06 <LLD
Th-228 NA <LLD
H-3 8 3000 <LLD
GAMMA 8 Co-60 15 <LLD
Cs-134 15 <LLD
Cs-137 18 <LLD
Gr-B 24 4 3.11 (13/24) 7 3.4 Mi. 3.98 (1/1) (2.28/4. 12) NE
H-3 8 2000 <LLD
GAMMA 24 Mn-54 15 <LLD
Co-58 15 <LLD
Fe-59 30 <LLD
B-4
Control
Locations Non-Routine
Mean Reported
(Range) Measurements
14.3 (4/4) 0 (12.2/15.2)
.015 (52152) 0 (.003/.031)
<LLD 0
114.7 (4/4) 0 (75/161.5)
<LLD 0
<LLD 0
<LLD 0
<LLD 0
<LLD 0
<LLD 0
<LLD 0
<LLD 0
NA 0
NA 0
NA 0
NA 0
NA 0

Medium or
Pathway
Sampled
(Units)
Drinking Water (cont'd) (pCi/I iter)
Groundwater (pCi/liter)
TABLE B-2 RADIOLOGICIAL ENVIRONMENT MONITORING PROGRAM SUMMARY INDIAN POINT ENERGY CENTER - 2015
Dockets 50-03, 50-247 & 50-286
Indicator
Analysis Total LLD* Locations Location with Highest Mean
Type Number Mean•• Location I Distance I Mean
(Range) Number Direction (Range)
Co-60 15 <LLD
Zn-65 30 <LLD
Nb-95 15 <LLD
Zr-95 15 <LLD
1-131 <LLD
Cs-134 15 <LLD
Cs-137 18 <LLD
Ba-140 60 <LLD
La-140 15 <LLD
H-3 2 3000 <LLD
Ni-63 1 2 30 <LLD
Sr-90 2 <LLD
GAMMA 2 Mn-54 15 <LLD
C0-58 15 <LLD
Fe-59 30 <LLD
Co-60 15 .<LLD
Zn-65 30 <LLD
Nb-95 15 <LLD
B-5
Control
Locations Non-Routine
Mean Reported
(Range) Measurements
NA 0
NA 0
NA 0
NA 0
NA 0
NA 0
NA 0
NA 0
NA 0
NA 0
NA 0
NA 0
NA 0
NA 0
NA 0
NA 0
NA 0
NA 0

Medium or
Pathway
Sampled
(Units)
Groundwater (cont'd) (pCi/liter)
Soil (pCi/kg dry)
Broadleaf Vegetation (pCi/kg wet)
TABLE B-2 RADIOLOGICIAL ENVIRONMENT MONITORING PROGRAM SUMMARY INDIAN POINT ENERGY CENTER - 2015
Dockets 50-03, 50-247 & 50-286
Indicator Control
Analysis Total LLD* Locations Location with Highest Mean Locations
Type Number Mean•• Location I Distance I Mean Mean
(Range) Number Direction (Range) (Range)
Zr-95 30 <LLD NA
1-131 15 <LLD NA
Cs-134 18 <LLD NA
Cs-137 60 <LLD NA
Ba-140 15 <LLD NA
La-140 15 <LLD NA
GAMMA 3 Be-7 NA <LLD <LLD
K-40 NA 14440 (2/2) 94 0.39 Mi. 17250 (1/1) 16420 (1/1) (11630/17250) s
Co-60 NA <LLD <LLD
Cs-134 150 <LLD <LLD
Cs-137 180 <LLD <LLD
Ra-226 NA <LLD <LLD
Th-228 NA 540.2 (2/2) 23 20.7Mi. 834.2 (1/1) 834.2 (1/1) (312.3n68) N
GAMMA 53 Be-7 NA 1321. 72 (33/35) 94 0.39 Mi. 1339.94 (16/18) 1295.03 (18/18)
(295.3/4569) s (374.2/4569) (292. 7 /3315)
K-40 NA 4927.51 (35/35) 23 20.7Mi. 5031.22 (18/18) 5031.22 (18/18) (2253/7831) N (2638n769) (263Bn769)
Co-60 NA <LLD <LLD
1-131 60 <LLD <LLD
Cs-134 60 <LLD <LLD
B-6
Non-Routine
Reported
Measurements
0
0
0
0
0
0
0
0
0
0
0
0
0
0
0
0
0
0

Medium or
Pathway
Sampled
(Units) ~
Broad leaf Vegetation (cont'd) (pCi/kg wet)
River Water (pCi/liter)
Bottom Sediment (pCi/kg dry)
TABLE B-2 .RADIOLOGICIAL ENVIRONMENT MONITORING PROGRAM SUMMARY INDIAN POINT ENERGY CENTER - 2015
Dockets 50-03, 50-247 & 50-286
Indicator
Analysis Total LLD* Locations Location with Highest Mean
Type Number Mean** Location I Distance I Mean
(Range) Number Direction (Range)
Cs-137 80 <LLD
Th-228 NA 39.65 (1/35) 94 0.39 Mi. 39.65 (1/18)
s H-3 8 3000 524.7 (3/4) 10 0.3Mi. 524.7 (3/4)
(274/959) WSW (274/959)
GAMMA 24 Mn-54 15 <LLD
Co-58 15 <LLD
Fe-59 30 <LLD
Co-60 15 <LLD
Zn-65 30 <LLD
Nb-95 15 <LLD
Zr-95 15 <LLD
1-131 15 <LLD
Cs-134 15 <LLD
Cs-137 18 <LLD
Ba-140 15 <LLD
La-140 15 <LLD
GAMMA 8 K-40 NA 18973.3 (6/6) 84 10.88 Mi. 26700 (2/2)
(16700/22500) N (25340/28060)
Co-60 NA <LLD
Cs-134 150 <LLD
B-7
Control
Locations Non-Routine
Mean Reported
(Range) Measurements
<LLD 0
<LLD 0
367 (1/4) 0
<LLD 0
<LLD 0
<LLD 0
<LLD 0
<LLD 0
<LLD 0
<LLD 0
<LLD 0
<LLD 0
<LLD 0
<LLD 0
<LLD 0
26700 (2/2) 0 (25340/28060)
<LLD 0
<LLD 0

Medium or
Pathway
Sampled
(Units)
Bottom Sediment (confd) (pCi/kg dry)
Shoreline Soil (pCi/kg dry)
Aquatic Vegetation (pCi/liter)
TABLE B-2 RADIOLOGICIAL ENVIRONMENT MONITORING PROGRAM SUMMARY INDIAN POINT ENERGY CENTER - 2015
Dockets 50-03, 50-247 & 50-286
Indicator
Analysis Total LLD* Locations Location with Highest Mean
Type Number Mean•• Location I Distance I Mean
(Range) Number Direction (Range)
Cs-137 180 875.6 (6/6) 10 0.3Mi. 1872.8 (212)
(224.7/3010) WSW (735.5/3010) Ra-226
NA 3125 (1/6) 10 0.3 Mi. 3125 (1/2) WSW
Th-228 NA 1216.9 (6/6) 17 1.5 Mi. 1434.5 (2/2)
(931.6/1789) SSW (1080/1789) Sr-90 10 5000 <LLD
GAMMA 10 K-40 NA 11840.8 (8/8) 84 10.88 Mi. 29300 (2/2)
(7399/16430) N (28610/29990)
Cs-134 150 <LLD
Cs-137 180 110.4 (2/8) 17 1.5 Mi. 110.4 (2/2) (82.6/138.2) SSW (82.6/138.2)
Ra-226 NA 4065 (1/8) 50 4.48Mi. 4065 (1/2) NNW
Th-228 NA 542.6 (6/8) 84 10.88 Mi. 819.6 (2/2) (369.1/835. 7) N (511.1/1128)
GAMMA 4 Be-7 NA <LLD 84 10.88 Mi. 115.6 (1/2)
N
K-40 NA 2996.5 (2/2) 28 0.45 Mi. 3113 (1/1) (2880/3113) ENE
Co-60 NA <LLD
1-131 60 <LLD
Cs-134 60 <LLD
Cs-137 80 <LLD 84 10.88 Mi. 13.9 (1/2) N
Ra-226 NA <LLD 84 10.88 Mi. 197.7 (1/2) N
Ac-228 NA <LLD
Th-228 NA 98.3 (2/2) 28 0.45 Mi. 131.5 (1/1) (65/131.5) ENE
B-8
Control
Locations Non-Routine
Mean Reported
(Range) Measurements
<LLD 0
<LLD 0
922.5 (2/2) 0 (847.4/997.6)
<LLD 0
29300 (2/2) 0 (28610/29990)
<LLD 0
<LLD 0
<LLD 0
819.6 (2/2) 0 (511.1/1128)
115.6 (1/2) 0
2600.5 (2/2) 0 (2329/2872)
<LLD 0
<LLD 0
<LLD 0
13.9 (1/2) 0
197.7 (1/2) 0
<LLD 0
95.3 (1/2) 0

TABLE B-2 RADIOLOGICIAL ENVIRONMENT MONITORING PROGRAM SUMMARY INDIAN POINT ENERGY CENTER - 2015
Dockets 50-03, 50-247 & 50-286
Medium or Indicator
Pathway Analysis Total LLD* Locations
Sampled Type Number Mean••
(Units) (Range)
Fish Ni-63 33 100 <LLD (pCi/kg wet)
Sr-90 33 5 <LLD
GAMMA 33 K-40 NA 2813 (22/22)
(1520/3895)
Mn-54 130 <LLD
Co-58 130 <LLD
Fe-59 260 <LLD
Co-60 130 <LLD
Zn-65 260 <LLD
Cs-134 130 <LLD
Cs-137 150 <LLD
Th-228 NA 197 (2/22) (115/280)
* LLD IS THE LOWER LIMIT OF DETECTION ••THE MEAN VALUES ARE CALCULATED USING THE POSITIVE VALUES •••MDC IS THE MIMINUM DETECTABLE CONCENTRATION
B-9
Location with Highest Mean
Location I Distance I Mean
Number Direction (Range)
23 20.7Mi. 3065 (11/11) N (2010/4255)
107 2.5Mi. 197 (2/11) SSW (downstre~ (115/280)
Control
Locations Non-Routine
Mean Reported
(Range) Measurements
<LLD 0
<LLD 0
3065 (11/11) 0 (2010/4255)
<LLD 0
<LLD 0
<LLD 0
<LLD 0
<LLD 0
<LLD 0
<LLD 0
81 0

INDIAN POINT ENERGY CENTER TABLE B-3
DIRECT RADIATION, QUARTERLY DATA-2015
Sample Station Nuclide Number
First Quarter 01/01-03/31
TLD DR-01 13.6 ± 0.6 DR-02 13.0 ± 0.9 DR-03 10.4 ± 0.6 DR-04 11.7 ± 0.5 DR-05 12.2 ± 0.7 DR-06 12.1 ± 0.7 DR-07 13.5 ± 0.8 DR-08 10.9 ± 0.5 DR-09 12.1 ± 0.5 DR-10 12.6 ± 0.7 DR-11 10.2 ± 0.4' DR-12 13.5 ± 0.6 DR-13 14.3 ± 0.8 DR-14 11.9 ± 0.6 DR-15 11.5 ± 0.5 DR-16 12.1 ± 0.6 DR-17 12.5 ± 0.7 DR-18 12.5 ± 1.0 DR-19 13.2 ± 0.9 DR-20 12.0 ± 0.7 DR-21 12.0 ± 0.7 DR-22 10.2 ± 0.6 DR-23 12.5 ± 0.5 DR-24 12.7 ± 0.9 DR-25 10.7 ± 0.6 DR-26 12.1 ± 0.5 DR-27 12.0 ± 0.6 DR~28 16.6 ± 1.6 DR-29 12.0 ± 0.8 DR-30 11.8 ± 0.8 DR-31 13.9 ± 0.6 DR-32 10.8 ± 0. 7 DR-33 11.9 ± 0.6 DR-34 12.3 ± 0.5 DR-35 10.5 ± 0.6 DR-36 12.9 ± 0.7 DR-37 12.3 ± 0.6 DR-38 10.9 ± 0.7 DR-39 12.4 ± 0.8 DR-40* 12.2 ± 0.7 DR-41 11.6 ± 0.5
AVERAGE (Indicator 12.2 Locations)
• Control location
mR/Quarter ± 1 sigma
Second Quarter 04/01-06/30
17.1 ± 0.7 14.7 ± 0.7 12.2 ± 0.6 13.3 ± 0.6 13.8 ± 0.9 14.7 ± 0.6 15.8 ± 0.8 12.2 ± 0.7 13.2 ± 0.6 14.2 ± 0.5 10.9 ± 0.5 15.6 ± 0.7 16.0 ± 0.7 12.9 ± 0.6 12.9 ± 0.6 14.6 ± 0.6 14.2 ± 0.6 14.0 ± 0.7 14.1 ± 0.5 13.6 ± 0.7 12.8 ± 0.5 11.4 ± 0.5 14.2 ± 0.8 14.4 ± 1.1 12.5 ± 0.8 14.6 ± 1.1 14.1 ± 0.6 20.3 ± 0.9 14.4 ± 0.6 14.8 ± 1.1 16.3 ± 1.0. 13.3 ± 0.8 14.0 ± 1.1 13.7 ± 0.7 13.4 ± 0.7 14.5 ± 0.7 13.8 ± 0.6 12.3 ± 0.5 15.0 ± 1.1 15.2 ± 1.1 13.5 ± 0.6
14.1
B-10
Third Quarter 07101-09/30
17.4 ± 0.6 15.0 ± 0.7 12.7 ± 0.6 14.2 ± 0.5 14.4 ± 0.8 14.2 ± 0.9 16.3 ± 0.9 11.6 ± 0.5 13.8 ± 0.6 14.2 ± 0.7 11.1 ± 0.6 16.5 ± 1.6 16.5 ± 0.6 13.6 ± 0.6 13.2 ± 0.8 14.9 ± 0.8 14.7 ± 0.5 14.9 ± 1.1 15.5 ± 0.6 14.6 ± 0.5 14.0 ± 0.7 11.4 ± 0.5 14.3 ± 0.9 15.5 ± 0.6 12.4 ± 0.5
- 14.0 ± 0.8 13.6 ± 0.8 21.0 ± 0.9 15.4 ± 0.7 15.6 ± 0.5 17.4 ± 0.7 13.7 ± 0.8 13.7 ± 0.6 13.4 ± 0.6 13.0 ± 0.7 14.8 ± 0.9 14.3 ± 0.5 12.5 ± 0.8 15.3 ± 0.8 14.8 ± 0.6 13.2 ± 0.6
14.4
Fourth Quarter 10/01-01/01
16.4 ± 0.7 14.6 ± 0.7 11.4 ± 0.5 13.3 ± 0.6 13.2 ± 0.5 13.8 ± 0.6 15.1 ± 0.7 11.3 ± 0.5 15.1 ± 0.8 26.7 ± 1.0 10.3 ± 0.6 15.4 ± 0.7 15.7 ± 0.6 12.6 ± 0.5 12.7 ± 0.7 13.8 ± 0.6 14.2 ± 0.6 13.4 ± 0.5 14.0 ± 0.7 14.4 ± 0.6 14.1 ± 0.6 11.8 ± 0.5 14.5 ± 0.7 14.8 ± 0.8 12.6 ± 0.5 14.1 ± 0.5 14.3 ± 0.7 20.3 ± 0.9 14.3 ± 0.9 14.1 ± 0.7 16.5 ± 0.7 13.6 ± 0.7 13.8 ± 0.6 13.4 ± 0.7 13.8 ± 1.0 14.6 ± 0.7 13.7 ± 0.6 12.3 ± 0.6 14.2 ± 0.8 15.0 ± 0.7 12.7 ± 1.0
14.3
Annual Average
16.1 ± 1.8
Annual Total
64.5 14.3 ± 0.9 57.3 11.7 ± 1.0 46.8 13.1 ± 1.0 52.6 13.4 ± 0.9 53.5 13.7 ± 1.1 54.7 12.1 ± 1.2 60.7 11.5 ± 0.6 45.9 13.5 ± 1.3 54.2 16.9 ± 6.5 67.7 10.6 ± 0.5 42.5 15.2 ± 1.2 61.0 15.6 ± 1.0 62.5 12.8 ± 0.701 5
11.1
12.6 ± 0.7 50.3 13.8 ± 1.257 55.3 13.9 ± 0.988 55.6 13.7 ± 1.017 54.8 14.2 ± 0.954 56.8 13.6 ± 1.19 54.6 13.2 ± 1.028 53.0 11.2 ± 0.699 44.8 13.9 ± 0.903 55.5 14.4 ± 1.193 57.4 12.0 ± 0.91 48.2 13.7 ± 1.086 '54.7 13.5 ± 1.057 53.9 19.6 ± 1.978 78.2 14.0 ± 1.456 56.1 14.1 ± 1.428 56.3 16.0 ± 1.498 64.0 12.8 ± 1.395 51.3 13.3 ± 0.951 53.4 13.2 ± 0.62 52.8 12.7 ± 1.479 50.7 14.2 ± 0.869 56.8 13.5 ± 0.859 54.2 12.0 ± 0.726 47.9 14.2 ± 1.322 56.8 14.3 ± 1.401 57.2 12.7 ± 0.846 51.0
13.6 55.0

INDIAN POINT ENERGY CENTER TABLE B-4
DIRECT RADIATION, 2005 THROUGH 2015 DATA
mR per Year
Station Mean Standard Deviation Minimum Value Maximum Value 2015Annual Number (2005-2014) (2005-2014) (2005-2014) (2005-2014) Total
DR-01 60.4 2.3 55.6 63.6 64.5 DR-02 57.4 1.4 56.0 60.0 67.7 DR-03 46.8 1.3 44.4 48.4 42.5 DR-04 53.4 1.2 52.0 55.6 61.0 DR-05 54.6 1.3 53.2 56.8 62.5 DR-06 55.7 1.3 54.0 57.6 51.1 DR-07 63.1 1.9 61.2 66.4 50.3 DR-08 48.1 2.0 45.2 50.8 55.3 DR-09 52.3 1.5 50.0 54.8 55.6 DR-10 56.5 1.4 54.4 58.8 54.8 DR-11 43.3 1.1 41.6 45.6 56.8 DR-12 63.3 3.1 59.6 68.4 57.3 DR-13 72.2 7.6 62.4 82.o 54.6 DR-14 52.9 1.6 50.4 55.2 53.0 DR-15 52.6 1.3 50.4 54.8 44.8 DR-16 58.1 1.6 55.2 60.8 55.5 DR-17 58.4 1.9 55.6 61.2 57.4 DR-18 56.9 1.4 54.4 59.2 48.2 OR-19 59.1 1.4 56.0 60.8 54.7 OR-20 53.8 1.2 52.4 55.2 53.9 DR-21 54.7 1.9 52.0 57.6 78.2 OR-22 44.7 1.3 42.4 46.4 56.1 OR-23 55.5 1.3 53.6 58.0 46.8 OR-24 57.6 1.0 56.0 58.8 56.3 OR-25 49.1 1.9 45.6 52.4 64.0 OR-26 55.4 1.7 52.8 58.8 51.3 DR-27 53.8 1.4 51.6 56.4 53.4 OR-28 77.3 0.9 76.4 79.2 52.8 OR-29 56.6 1.2 54.8 58.8 50.7 OR-30 58.1 2.3 54.8 62.0 56.8 OR-31 65.9 2.3 61.6 69.2 54.2 DR-32 51.8 1.7 48.8 54.8 47.9 DR-33 54.0 0.9 52.4 54.8 56.8 OR-34 50.9 0.4 50.4 51.2 52.6 OR-35 52.5 1.7 50.0 54.4 57.2 OR-36 58.4 1.7 56.0 60.0 51.0 DR-37 54.4 1.9 52.0 58.0 53.5 DR-38 49.9 3.1 46.8 56.0 54.7 OR-39 58.9 2.6 54.8 61.6 60.7 DR-40* 60.8 9.0 49.2 75.2 45.9 OR-41 50.8 1.1 48.4 52.0 54.2
AVERAGE (Indicator 55.7 55.3 Locations)
('
* Control location
B-11

Inner Ring
ID
DR-01
DR-02
DR-03
DR-04
DR-05
DR-06 '
DR-07
DR-08
DR-09
DR-10
DR-11
c DR-12
DR-13
DR-14
DR-15
DR-16
Average
INDIAN POINT ENERGY CENTER TABLE 8-5
DIRECT RADIATION, INNER AND OUTER RINGS - 2015 (mR per Year)
Outer Ring Sector Inner Ring
ID Annual Average
DR-17 N 64.51
DR-18 NNE 57.27
DR-19 NE •46.75
DR-20 ENE 52.55
DR-21 E 53.52
DR-22 ESE 54.74
DR-23 SE 60.68
DR-24 SSE 45.92
DR-25 s 54.18
DR-26 SSW 67.66
DR-27 SW 42.48
DR-28 WSW 60.95
DR-29 w 62.49
DR-30 WNW 51.05
DR-31 NW 50.26
DR-32 NNW 55.28
55.02
8-12
Outer Ring
Annual Average
55.58
54.82
56.83
54.56
52.96
44.78
55.49
57.40
48.16
54.68
53.89
78.22
56.06
56.30
64.03
51.30
56.25.

,r
INDIAN POINT ENERGY CENTER TABLE B-6
GROSS BETA ACTIVITY IN AIRBORNE PARTICULATE SAMPLES- 2015
pCi/m" ± 2 Sigma
PERIOD Algonquin NYUTower Roseton Croton Point Grassy Point Peekskill Training Building Met Tower
ENDING 4 5 23* 27' 29 44 94 95 01/05/15 0.016 ± 0.002 0.015 ± 0.002 ( 0.013 ± 0.002 O.Q14 ± 0.002 0.016 ± 0.002 0.016 ± 0.003 0.016 ± 0.002 0.012 ± 0.002 01112/15 O.o18 ± 0. 002 . 0.018 ± 0.003 0.016 ± 0.002 0.017 ± 0.002 0.018 ± 0.002 0.016 ± 0.002 O.Q16 ± 0.002 0.016 ± 0.002 01/20/15 0.017 ± 0.002 0.014 ± 0.002 0.017 ± 0.002 0.017 ± 0.002 0.019 ± 0.002 0.014 ± 0.002 0.016 ± 0.002 0.016 ± 0.002 01/26/15 0.014 ± 0.003 0.008 ± 0.002 0.012 ± 0.002 0.013 ± 0.003 0.014 ± 0.003 0.013 ± 0.003 0.014 ± 0.003 0.016 ± 0.003 02/02/15 0.014 ± 0.002 0.015 ± 0.002 0.014 ± 0.002 0.015 ± 0.002 0.014 ± 0.002 0.015 ± 0.002 0.013 ± 0.002 0.016 ± 0.002 02/09/15 0.011 ± 0.002 0.017 ± 0.003 0.017 ± 0.002 0.014 ± 0.002 0.017 ± 0.002 0.016 ± 0.002 0.017 ± 0.003 0.016 ± 0.003 02/17/15 0.017 ± 0.003 0.014 ± 0.002 0.003 ± 0.002 0.013 ± 0.002 0.016 ± 0.003 0.016 ± 0.003 0.014 ± 0.003 0.017 ± 0.003 02/23/15 0.024 ± 0.003 0.024 ± 0.003 0. 025 ± 0. 003 0.024 ± 0.003 0.024 ± 0.003 0.024 ± 0.003 0.024 ± 0.003 0.020 ± 0.003 03/01/15 0.021 ± 0.003 0.020 ± 0.003 0.020 ± 0.003 0.023 ± 0.003 0.025 ± 0.003 0.021 ± 0.003 0.020 ± 0.003 0.025 ± 0.003 03/08/15 0.016 ± 0.003 0.016 ± 0.003 0.018 ± 0.003 0.016 ± 0.003 0.017 ± 0.003 0.017 ± 0.003 0.017 ± 0.003 0.017 ± 0.003 03/15/15 0.012 ± 0.002 0.014 ± 0.002 0.011 ± 0.002 0.012 ± 0.002 0.014 ± 0.002 0.013 ± 0.002 0.014 ± 0.002 0.011 ± 0.002. 03/22/15 0.011 ± 0.002 0.010 ± 0.004 0.011 ± 0.002 0.011 ± 0.002 0.011 ± 0.002 0.011 ± 0.002 0.011 ± 0.002 0.012 ± 0.002 03/30/15 0.012 ± 0.002 0.012 ± 0.002 0.011 ± 0.002 0.011 ± 0.002 0.012 ± 0.002 0.014 ± 0.002 0.015 ± 0.002 0.013 ± 0.002 04/07/15 0.014 ± 0.002 0.012 ± 0.002 0.013 ± 0.002 0.014 ± 0.002 0.012 ± 0.002 0.013 ± 0.002 0.014 ± 0.002 0.014 ± 0.002 04/13/15 0.009 ± 0.002 0.008 ± 0.002 0.009 ± 0.002 0.010 ± 0.002 0.011 ± 0.002 0.008 ± 0.002 0.010 ± 0.002 0.011 ± 0.002 04/20/15 0.012 ± 0.002 0.010 ± 0.002 . 0.010 ± 0.002 0.010 ± 0.002 0.010 ± 0.002 0.010 ± 0.002 0.009 ± 0.002 0.012 ± 0.002 04/27115 0.005 ± 0.002 0.005 ± 0.002 0.004 ± 0.002 0.006 ± 0.002 0.004 ± 0.002 0.005 ± 0.002 0.007 ± 0.002 0.003 ± 0.001 05/04/15 0.005 ± 0.002 0.007 ± 0.002 0.007 ± 0.002 0.006 ± 0.002 0.005 ± 0.002 0.006 ± 0.002 0.006 ± 0.002 0.006 ± 0.002 05/11/15 0.020 ± 0.003 0.020 ± 0.003 0.016 ± 0.002 0.020 ± 0.003 0.017 ± 0.003 0.017 ± 0.003 0.019 ± 0.003 0.020 ± 0.003 05/18/15 O.Q18 ± 0.003 0.016 ± 0.003 0.018 ± 0.003 0.017 ± 0.002 0.017 ± 0.003 0.016 ± 0.002 O.Q16 ± 0.002 0.017 ± 0.002 05/26/15 0.016 ± 0.002 0.019 ± 0.002 0.019 ± 0.002 0.017 ± 0.002 0.016 ± 0.002 0.015 ± 0.002 0.017 ± 0.002 O.D16 ± 0. 002 06/01/15 0.012 ± 0.002 O.Q14 ± 0.003 0.013 ± 0.003 0.013 ± 0.003 0.017 ± 0.003 0.014 ± 0.003 0.016 ± 0.003 O.Q14 ± 0.003 06/08/15 0.009 ± 0.002 0.007 ± 0.002 0.007 ± 0.002 0.009 ± 0.002 0.009 ± 0.002 0.009 ± 0.002 0.009 ± 0.002 0.008 ± 0.002 06/15/15 0.017 ± 0.003 0.018 ± 0.003 0.016 ± 0.002 0.019 ± 0.003 0.020 ± 0.003 0.022 ± 0.003 0.020 ± 0.003 0.018 ± 0.002 06/22115 0.012 + 0.002 0.011 ± 0.002 0.011 ± 0.002 0.014 ± 0.002 0.011 ± 0.002 0.011 ± 0.002 0.012 ± 0.002 0.010 ± 0.002
•control Location
8-13

INDIAN POINT ENERGY CENTER TABLE B-6
GROSS BETA ACTIVITY IN AIRBORNE PARTICULATE SAMPLES - 2015
pCi/m" ± 2 Sigma
PERIOD Algonquin NYUTower Roseton Croton Point Grassy Point Peekskill Training Building Met Tower
ENDING 4 5 23* 27 29 44 94 95 06/29/15 0.013 ± 0.002 0.012 ± 0.002 0.012 ± 0.002 0.012 ± 0.002 0.010 ± 0.002 0.011 ± 0.002 0.010 ± 0.002 0.022 ± 0.005 07/06/15 0.014 ± 0.002 0.016 ± 0.003 0.017 ± 0.002 0.017 ± 0.003 0.016 ± 0.002 0.017 ± 0.003 0.015 ± 0.002 0.014 ± 0.002 07/13/15 0.015 ± 0.002 0.017 ± 0.002 0.017 ± 0.002 0.014 ± 0.002 0.017 ± 0.003 0.015 ± 0.002 0.016 ± 0.002 0.015 ± 0.002 07/20/15 0.017 ± 0.003 ·0.015 ± 0.003 0.014 ± 0.002 0.018 ± 0.003 0.D19 ± 0. 003 0.017 ± 0.003 0.016 ± 0.003 0.017 ± 0.003 07/27/15 0.018 ± 0.002 0.045 ± 0.010 0.016 ± 0.002 0.016 ± 0.002 0.018 ± 0.003 0.016 ± 0.002 0.020 ± 0.003 0.019 ± 0.003 08/03/15 0.022 ± 0.003 0.021 ± 0.003 0.021 ± 0.003 0.056 ± 0.016 0.020 ± 0.003 0.023 ± 0.003 0.021 ± 0.003 0.020 ± 0.003 08/10/15 0.012 ± 0.002 0.012 ± 0.002 0.011 ± 0.002 0.012 ± 0.002 0.011 ± 0.002 0.011 ± 0.002 0.013 ± 0.002 0.013 ± 0.002 08/17/15 0.014 ± 0.002 0.013 ± 0.002 0.014 ± 0.002 0.015 ± 0.003 0.014 ± 0.002 0.014 ± 0.002 0.011 ± 0.002 0.014 ± 0.002 08/24/15 0.015 ± 0.002 0.019 ± 0.003 0.019 ± 0.003 0,018 ± 0.003 0,019 ± 0.003 0.018 ± 0.003 0.019 ± 0.003 O.D18 ± 0.003 08/31/15 0.021 ± 0.003 0.017 ± 0.003 0.018 ± 0.003 0.020 ± 0.003 0.022 ± 0.003 0.021 ± 0.003 0.018 ± 0.003 0.D19 ± 0.003 09/08/15 0.031 ± 0.003 0.032 ± 0.003 0.029 ± 0.003 0.031 ± 0.003 0.030 ± 0.003 0.029 ± 0.003 0.030 ± 0.003 0.029 ± 0.003 09/14/15 0.018 ± 0.003 0.019 ± 0.002 0.016 ± 0.003 0.016 ± 0.003 0.018 ± 0.003 0.017 ± 0.003 0.017 ± 0.003 0.018 ± 0.003 09/21/15 0.022 ± 0.003 0.025 ± 0.004 0.020 ± 0.003 . 0.021 ± 0.003 0.021 ± 0.003 0.024 ± 0.003 0.023 ± 0.003 0.024 ± 0.003 09/28/15 0.013 ± 0.002 0.014 ± 0.002 0.D15 ± 0.002 0.D16 ± 0.002 0.016 ± 0.002 0.016 ± 0.002 0.014 ± 0.002 0.D15 ± 0.002 10/05/15 0.012 ± 0.002 0.012 ± 0.002 0.011 ± 0.002 0.011 ± 0.002 0.011 ± 0.002 0.013 ± 0.002 0.012 ± 0.002 0.010 ± 0.002 10/13/15 0.016 ± 0.002 0.016 ± 0.002 0.016 ± 0.002 0.017 ± 0.002 0.016 ± 0.002 0.017 ± 0.002 O.D16 ± 0.002 0.018 ± 0.002 10/20/15 0.012 ± 0.002 0.012 ± 0.002 0.010 ± 0.002 0.014 ± 0.003 0.011 ± 0.002 0.012 ± 0.002 0.013 ± 0.002 0.012 ± 0.002 10/26/15 0.026 ± 0.003 0.024 ± 0.003 0.024 ± 0.003 0.026 ± 0.003 0. 026 ± 0. 003 0.026 ± 0.003 0.027 ± 0.003 0. 022 ± 0. 003 11/02/15 0.016 ± 0.003 0.015 ± 0.003 0.016 ± 0.003 0.016 ± 0.003 0.016 ± 0.003 0.017 ± 0.003 0.016 ± 0.003 0.014 ± 0.002 11/09/15 0.024 ± 0.003 0.026 ± 0.003 0.022 ± 0.003 0.025 ± 0.003 0.024 ± 0.003 0. 023 ± 0. 003 0.027 ± 0.003 0.022 ± 0.003 11/16/15 0.016 ± 0.003 0.017 ± 0.003 0.016 ± 0.002 0.018 ± 0.003 0.017 ± 0.003 0.016 ± 0.003 0.016 ± 0.003 0.015 ± 0.002 11/23/15 0.019 ± 0.003 0.017 ± 0.002 0.D15 ± 0.002 0.017 ± 0.003 0.016 ± 0.002 0.017 ± 0.003 0.016 ± 0.003 0.017 ± 0.003 11/30/15 0.015 ± 0.002 0.018 ± 0.002 0.016 ± 0.002 0.017 ± 0.003 0.017 ± 0.002 0.016 ± 0.002 0.017 ± 0.00? 0.014 ± 0.002 12/07/15 0.014 ± 0.002 0.019 ± 0.003 0.015 ± 0.002 0.018 ± 0.003 0.018 ± 0.003 0.015 ± 0.002 0.D19 ± 0.003 0,016 ± 0.002 12114/15 0.041 ± 0.004 0.036 ± 0.003 0.031 ± 0.003 0.039 ± 0.004 0.035 ± 0.003 0.032 ± 0.003 0.035 ± 0.003 0.034 ± 0.003 12/21/15 0.011 ± 0.002 0.012 ± 0.002 0.011 ± 0.002 0.011 ± 0.002 0.012 ± 0.002 0.011 ± 0.002 0.010 ± 0.002 0.014 ± 0.002 12/28/15 O.D15 ± 0.002 0.014 ± 0.002 0.013 ± 0.002 0.016 ± 0.002 0.015 ± 0.002 0.015 ± 0.002 0.013 ± 0.002 0.015 ± 0.002
•control Location
B-14

INDIAN POINT ENERGY CENTER TABLE B-7
IODINE-131 ACTIVITY IN AIRBORNE CHARCOAL SAMPLES- 2015
pCi/m" ± 2 Sigma
PERIOD Algonquin NYUTower Roseton Croton Point Grassy Point Peekskill Training Building Met Tower ENDING 4 5 23* 27 29 44 94 95 01105/15 < 0.038 < 0.038 < 0.035 < 0.039 < 0.035 < 0.039 < 0.039 < 0.038 01/12115 < 0.022 < 0.022 < 0.022 < 0.022 < 0.023 < 0.025 < 0.022 < 0.025
01/20/15 < 0.028 < 0.027 < 0.034 < 0.029 < 0.035 < 0.038 < 0.030 < 0.037 01/26/15 < 0.057 < 0.057 < 0.052 < 0.056 < 0.054 < 0.060 < 0.060 < 0.057
02/02/15 < 0.054 < 0.056 < 0.052 < 0.056 < 0.052 < 0.059 < 0.057 < 0.057
02109/15 < 0.046 < 0.048 < 0.041 < 0.048 < 0.043 < 0.043 < 0.048 < 0.051 02/17/15 < 0.041 < 0.041 < 0.030 <-0.042 < 0.031 < 0.031 < 0.044 < 0.029
02/23/15 < 0.023 < 0.023 < 0.038 < 0.024 < 0.039 < 0.039 < 0.025 < 0.039 03/01115 < 0.037 < 0.038 < 0.026 < 0.039 < 0.030 < 0.031 < 0.041 < 0.032 03/08/15 < 0.039 < 0.040 < 0.039 < 0.041 < 0.036 < 0.036 < 0.043 < 0.038 03/15/15 < 0.013 < 0.013 < O.D16 < 0.013 < 0.016 < 0.016 < 0.014 < 0.016
03/22/15 < 0.022 < 0.068 < 0.022 < 0.022 < 0.023 < 0.022 < 0.024 < 0.023 03/30/15 < 0.024 < 0.027 < 0.031 < 0.024 < 0.031 < 0.033 < 0.026 < 0.030 04/07/15 < 0.067 < 0.068 < 0.056 < 0.009 < 0.055 < 0.054 < 0.065 < 0.057 04/13/15 < 0.013 < 0.025 < 0.049 < 0.025 < 0.049 < 0.049 < 0.025 < 0.048 04/20/15 < 0.041 < 0.041 < 0.044 < 0.042 < 0.044 < 0.044 < 0.040 < 0.042 04/27/15 < 0.037 < 0.012 < 0.027 < 0.039 < 0.027 < 0.028 < 0.037 < 0.025 05/04/15 < 0.019 < 0.020 < 0.021 <. 0.019 < 0.021 < 0.021 < 0.019 < 0.019 05/11115 < 0.045 < 0.047 < 0.045 < 0.019 < 0.048 < 0.050 < 0.045 < 0.044 05/18/15 < 0.022 < 0.023 < 0.023 < 0.022 < 0.025 < 0.023 < 0.023 < 0.022 05/26/15 < 0.037 < 0.038 < 0.036 < 0.038 < 0.038 < 0.038 < 0.020 < 0.035 06/01/15 < 0.035 < 0.037 < 0.047 < 0.036 < 0.049 < 0.051 < 0.037 < 0.048 06/08/15 < 0.019 < 0.020 < 0.013 < 0.020 < 0.014 < 0.014 < 0.020 < 0.005 06/15/15 < 0.019 < 0.020 < 0.022 < 0.020 < 0.023 < 0.024 < 0.020 < 0.023 06/22115 < 0.018 < 0.020 < 0.024 < 0.020 < 0.026 < 0.027 < 0.019 < 0.024 06/29/15 < 0.047 < 0.050 < 0.036 < 0.049 < 0.039 < 0.039 < 0.049 < 0.048
*Control Location
B-15

INDIAN POINT ENERGY CENTER TABLE B-7
IODJNE-131 ACTIVITY IN AIRBORNE CHARCOAL SAMPLES- 2015
pCi/m" ± 2 Sigma
PERIOD Algonquin NYUTower Roseton Croton Point Grassy Point Peekskill Training Building Met Tower ENDING 4 5 23* 27 29 44 94 95 01/05/15 < 0.038 < 0.038 < 0.035 < 0.039 < 0.035 < 0.039 < 0.039 < 0.038 07/06/15 < 0.016 < 0.018 < 0.011 < 0.017 < 0.022 < 0.022 < 0.017 < 0.021 07/13/15 < 0.023 <: 0.025 < 0.025 < 0.025 < 0.028 < 0.011 < 0.025 < 0.026 07/20/15 < 0.005 < 0.013 < 0.012 < 0.013 < 0.012 < 0.012 < 0.012 < 0.012 07/27/15 < 0.018 < 0.052 < 0.007 < 0.019 < 0.019 < 0.019 < 0.019 < 0.018 08/03/15 < 0.044 < 0.051 < 0.039 < 0.387 < 0.043 < 0.043 < 0.047 < 0.038 08/10/15 < 0.025 < 0.028 < 0.022 < 0.027 < 0.024 < 0.024 < 0.027 < 0.023 08/17/15 < 0.042 < 0.046 < 0.043 < 0.045 < 0.045 < 0.048 < 0.046 < 0.045 08/24/15 < 0.039 < 0.042 < 0.033 < 0.041 < 0.036 < 0.035 < 0.041 < 0.035 08/31/15 < 0.040 < 0.045 < 0.047 < 0.044 < 0.051 < 0.052 < 0.044 < 0.050 09/08/15 < 0.023 < 0.025 < 0.013 < 0.024 < 0.034 < 0.033 < 0.034 < 0.033 ..
09/14115 < 0.031 < 0.012 ' < 0.030 < 0.034 < 0.033 < 0.034 < 0.034 < 0.032 09/21/15 < 0.037 < 0.064 < 0.034 < 0.039 < 0.030 < 0.037 < 0.040 < 0.036 09/28/15 < 0.021 < 0.024 < 0.023 < 0.023 < 0.023 < 0.024 < 0.023 < 0.023 10/05/15 < 0.022 < 0.024 < 0.021 < Q.024 < 0.021 < 0.022 < 0.024 < 0.021 10/13/15 < 0.028 < 0.030 < 0,028 < 0.031 < 0.028 < 0.029 < 0.031 < 0.027 10/20/15 < 0.053 < 0.060 < 0.047 < 0.057 < 0.047 < 0.048 < 0.060 < 0.048 10/26/15 < 0.030 < 0.034 < 0.04J < 0.033 < 0.040 < 0.040 < 0.034 < 0.040 11/02/15 < 0.031, < 0.032 < 0.030 < 0.031 < 0.031 < 0.032 < 0.032 < 0.030 11/09/15 < 0.029 < 0.029 < 0.041 < 0.029 < 0.042 < 0.042 < 0.030 < 0.045 11/16/15 < 0.056 < 0.058 < 0.057 < 0.055 < 0.058 < 0.060 < 0.062 < 0.027 11/23/15 < 0.031 < 0.030 < 0.027 < 0.031 < 0.028 < 0.028 < 0.032 < 0.028 11/30/15 < 0.021 < 0.019 < 0.014 < 0.020 < 0.015 < 0.015 < 0.021 < 0.014 12/07/15 < 0.038 < 0.037 < 0.043 < 0.040 < 0.042 < 0.044 < 0.041 < 0.042 12/14/15 < 0.056 < 0.051 < 0.023 < 0.056 < 0.039 < 0.041 < 0.058 < 0.039 12/21/15. < 0.057 < 0.054 < 0.037 < 0.058 < 0.038 < 0.039 < 0.053 < 0.038 12/28/15 < 0.007 < 0.006 < 0.008 < 0.0.07 < 0.008 < 0.008 < _0.007 < 0.008
*Control Location
B-16

INDIAN POINT ENERGY CENTER TABLE B-8
GAMMA EMITTERS IN AIRBORNE PARTICULATE SAMPLES - 2015
10"" pCi/m" ± 2 Sigma
Algonquin NYU Tower 4 5
DATE 1st Quarter 2nd Quarter 3rd Quarter 4th Quarter 1st Quarter 2nd Quarter 3rd Quarter 4th Quarter
Be-7 71 ± 37 86 ± 26 138 ± 30 78 ± 16 94 ± 24 91 ± 30, 162 ± 33 95 ± 19 K-40 < 28 < 20 < 7 < 15 < 34 < 20 < 27 < 21 Mn-54 <2 < 1 < 1 < 1 <2 <2 <2 < 1 Co-58 <4 < 3 < 2 '< 1 <4 <3 < 3 <2 Fe-59 < 10 < 10 < 10 <3 < 18 < 10 < 13 <7 Co-60 < 2 < 1 <2 < 1 <2 < 1 <2 < 1 Zn-65 < 5 < 3 <2 <3 < 6 < 5 <4 <3 Nb-95 < 4 <3 < 2 < 2 < 5 <4 < 5 < 3 Zr-95 < 8 < 4 < 5 < 3 < 8 < 6 < 7 < 4 Ru-103 <8 <4 < 5 <2 <9 <6 < 8 <3 Ru-106 < 18 < 11 < 8 <7 < 16 < 11 < 17 <9 1-131 < 8870 < 2670 < 2580 < 261 < 9670 < 4270 < 6590 < 362 Cs-134 <2 < 1 < 1 < 1 <2 <2 <2 < 1 Cs-137 <2 < 1 < 1 < 1 <2 < 1 <2 < 1 Ba-140 < 1210 < 509 < 696 < 110 < 1290 < 777 < 919 < 174 La-140 < 364 < 218 < 243 < 39 < 296 < 337 < 375 < 82 Ce-141 < 14 < 9 < 9 < 3 < 14 < 11 < 16 < 4 Ce-144 < 8 < 6 < 5 <4 . < 9 < 8 < 11 <5 Ra-226 < 22 < 16 < 15 < 14 < 2~ < 26 < 32 < 18 Ac-228 < 6 < 5 <4 <3 < 7 <6 < 6 <4 Th-228 <2 <2 < 1 < 1 <3 <2 < 3 < 2
8-17

INDIAN POINT ENERGY CENTER TABLE B-8
GAMMA EMIITERS IN AIRBORNE PARTICULATE SAMPLES - 2015
10" pOi/m" ± 2 Sigma
Roseton Croton Point 23* 27
DATE 1st Quarter 2nd Quarter 3rd Quarter 4th Quarter 1st Quarter 2nd Quarter 3rd Quarter 4th Quarter
Be-7 77 ± 25 145 ± 33 162 ± 31 75 ± 17 111 ± 32 123 ± 27 109 ± 33 91 ± 21 K-40 < 14 < 20 < 22 < 22 < 17 < 24 21 ± 16 < 11 Mn-54 < 1 < 1 < 1 < 1 < 1 < 1 < 1 < 1 Co-58 <3 <4 <2 <2 <2 < 3 <3 <2 Fe-59 < 13 <9 <8 < 5 < 10 < 10 < 11 <6 Co-60 < 1 <2 < 1 < 1 < 1 < 1 <2 < 1 Zn-65 < 4 < 4 < 3 < 3 <4 <4 <3 < 3 Nb-95 <2 < 3 < 3 <2 <3 < 3 < 3 <2 Zr-95 <4 <5 < 4 < 3 <6 < 5 <4 < 4 Ru-103 < 5 <5 < 5 <3 <6 <5 <5 <2 Ru-106 < 14 < 13 < 11 < 11 < 10 < 11 < 12 <8 1-131 < 6120 < 3580 < 3290 < 327 < 6090 < 2620 < 3970 < 387 Cs-134 < 1 < 1 < 1 < 1 < 1 < 1 < 1 < 1 Cs-137 < 1 < 1 < 1 < 1 < 1 < 1 < 1 < 1 Ba-140 < 813 < 602 < 707 < 155 < 867 < 523 < 559 < 154 La-140 < 342 < 284 < 274 < 46 < 214 < 287 < 197 < 67 Ce-141 < 11 < 10 < 9 <4 < 11 < 8 < 9 <5 Ce-144 < 6 < 8 <6 <5 <6 <6 < 7 <6 Ra-226 < 20 < 25 < 18 < 19 < 21 < 19 < 19 -< 21 Ac-228 <5 <4 <3 < 4 <5 <5 <5 <4 Th-228 <2 <2" <2 <2 <2 <2 <2 < 2
• Control Location
8-18

INDIAN POINT ENERGY CENTER TABLE B-8
GAMMA EMITTERS IN AIRBORNE PARTICULATE SAMPLES - 2015
10-• pCi/m' ± 2 Sigma
Grassy Point Peekskill 29 44
DATE 1st Quarter 2nd Quarter 3rd Quarter 4th Quarter 1st Quarter 2nd Quarter 3rd Quarter 4th Quarter
Be-7 122 ± 39 102 ± 33 114 ± 35 86 ± 23 88 ± 34 84 ± 24 123 ± 29 98 ± 21 K-40 < 42 < 23 < 17 < 27 < 22 < 23. < 26 < 15 Mn-54 < 3 < 1 < 1 <2 < 1 < 1 < 1 < 1 Co-58 <4 < 1 <4 <3 < 3 < 3 <3 <2 Fe-59 < 18 <4 < 12 < 8 < 11 < 10 < 10 <4 Co-60 < 3 < 1 < 2 < 1 <2 < 1 < 1 < 1 Zn-65 < 6 <3 <4 < 4 <4 < 4 < 5 < 3 Nb-95 < 5 <2 <4 < 3 <2 <3 '<3 <2 Zr-95 <7 <5 <7 <5 <4 <6 <6 <4 Ru-103 - < 11 < 3 < 5 <4 <5 <5 <6 <3 Ru-106 < 20 <9 < 11 < 16 < 11 < 9 < 11 < 10 1-131 < 10400 < 2490 ·< 5090 < 618 < 6300 < 3490 < 5440 < 498 Cs-134 < 2 < 1 <2 <2 < 1 < 1 < 1 < 1 Cs-137 < 2 < 1 < 1 <2 < 1 < 1 < 1 < 1 Ba-140 < 1490 < 418 < 679 < 239 < 658 < 509 < 749 < 148 La-140 < 521 < 210 < 312 < 62 < 255 < 152. < 295 < 53 Ce-141 < 15 <5 < 11 <8 < 11 <8 < 11 < 10 Ce-144 < 9 <5 < 6 <9 <7 <6 < 7 < 12 Ra-226 < 35 < 14 < 22 < 29 < 22 < 19 < 23 < 32 Ac-228 < 9 < 3 <4 <6 < 5 <4 <5 <4 Th-228 < 3 < 1 <2 <2 <2 <2 < 2 < 3
B-19

INDIAN POINT ENERGY CENTER TABLE B-8
GAMMA EMITTERS IN AIRBORNE PARTICULATE SAMPLES - 2015
10-" pCi/m" ± 2 Sigma
Training Building Met Tower 94 95
DATE 1st Quarter 2nd Quarter 3rd Quarter 4th Quart.er 1st Quarter 2nd Quarter 3rd Quarter 4th Quarter
Be-7 108 ± 27 109 ± 35 135 ± 38 87 ± 21 126 ± 40 108 ± 24 105 ± 25 98 ± 26 K-40 < 13 < 31 < 25 < 11 < 44 < 20 < 10 < 26 Mn-54 < 1 < 2 <2 < 1 < 1 < 1 < 1 <2 Co-58 <2 .< 5 <4 <2 < 5 <2 <2 < 4 Fe-59 < 12 < 1:2 < 12 <6 < 19 <6 < 9 < 10 Co-BO <2 < 2 < 1 < 1 <3 < 1 < 1 <2 Zn-£5 <4 <6 <5 < 3 <7 < 3 <2 < 5 Nb-95 < 3 < 5 <4 <2 < 8 <2 < 3 < 4 Zr-95 < 7 < 9 <6 <4 < 10 < 4 <4 <6 Ru-103 < 7 < 8 < 7 < 3 < 11 <4 <4 < 5 Ru-106 < 11 < 21 < 15 < 10 < 22 < 9 <9 < 18 1-131 < 6580 < 4340 < 5960 < 419 < 9830 < 2080 < 3630 < 582 Cs-134 < 1 <2 <2 < 1 <3 < 1 < 1 <2 Cs-137 < 1 <2 <2 < 1 <3 < 1 < 1 < 2 Ba-140 < 810 < 665 < 866 < 155 < 1630 < 465 < 574 < 258 La-140 < 364 < 400 < 361 < 64 < 663 < 218 < 283 < 117 Ce-141 < 12 < 10 < 15 <6 < 14 < 7 < 9 < 6 Ce-144 < 7 < 8 < 10 < 6 <9 < 5 < 7 <6 Ra-226 < 23 < 25 < 31 < 18 < 34 < 16 < 19 < 25 Ac-228 <5 <6 <6 <5 < 9 <5 < 4 < 7 Th-228 <2 <2 <3 <2 <3 <2 <2 <2
B-20

INDIAN POINT ENERGY CENTER TABLE B-9
RADIONUCLIDES IN RAINWATER SAMPLES - 2015
10-;:s pCi/m;:s ± 2 Sigma
Roseton '-Peekskill
23* 44
DATE 1st Quarter 2nd Quarter 3rd Quarter 4th Quarter 1st Quarter 2nd Quarter 3rd Quarter 4th Quarter
RADIOCHEMICAL
H-3 < 152 < 196 < 185 < 182 < 152 < 196 < 186 < 194
GAMMA /
Be-7 < 8 < 13 < 11 < 12 36 ± 19 < 11 < 11 < 12 K-40 < 10 < 7 <7 < 20 < 18 < 5 < 5 < 8 Mn-54 < 0 < 1 < 1 < 1 < 1 < 1 < 1 < 1 Co-58 < 1 < 1 < 1 < 1 < 1 < 1 < 1 < 1 Fe-59 < 2 <4 < 3 < 3 <2 <2 < 2 < 3 Co-60 < 0 < 1 < 1 < 1 < 1 < 1 < 1 < 1 Zn-65 < 1 <2 < 2 < 2 < 1 < 1 < 1 < 2 Nb-95 < 1 <2 < 1 < 1 < 1 < 1 < 1 < 1 Zr-95 < 1 < 3 <2 < 2 < 2 <2 <2 < 2 Ru-103 < 1 < 2 < 2 < 2 < 1 < 2 < 1 <2 Ru-106 < 4 < 8 < 8 < 6 < 6 < 6 < 6 < 7 1-131 < 32 < 84 < 50 < 63 < 42 < 65 < 40 < 75 Cs-134 < 0 < 1 < 1 < 1 < 1 < 1 < 1 < 1 Cs-137 < 0 < 1 < 1 < 1 < 1 < 1 < 1 < 1 Ba-140 < 23 < 56 < 35 < 43 < 27 < 39 < 32 < 39 La-140 <6 < 21 < 10 < 11 < 9 < 12 < 9 < 15 Ce-141 < 2 <4 <4 < 4 < 3 < 3 < 3 < 3 Ce-144 < 4 < 7 - < 7 < 6 <4 < 6 < 5 < 5 Ra-226 < 11 < 24 < 23 < 19 < 16 < 19 < 19 < 19 Ac-228 <2 < 5 < 2 <4 < 3 <3 < 3 <4 Th-228 < 1 < 2 < 1 <2 < 1 <2 < 2 <2
* Control Location
8-21

f)
INDIAN POINT ENERGY CENTER TABLE B-10
RADIONUCLIDES IN DRINKING WATER SAMPLES - 2015
pCi/L ± 2 Sigma
Camp Field 7
DATE 1/13/2015 2/10/2015 3/9/2015 4/13/2015 5/12/2015 6/8/2015
RADIOCHEMICAL
Gr-8 3.3 ± 1.7 < 2.3 2.6 ± 1.3 2.5 ± 1.6 2.9 ± 1.6 4.1 ± 1.7 H-3 (a) < 178 < 183
GAMMA
Be-7 < 38 < 38 < 49 < 63 < 22 < 60 K-40 < 42 < 73 "128 < 84 < 38 < 119 Mn-54 < 5 <4 < 5 < 7 < 2 < 5 Co-58 <4 <4 <6 < 6 < 2 < 7 Fe-59 < 10 < 10 < 10 < 13 < 6 < 16 Co-60 <4 <4 <5 < 8 < 2 < 5 Zn-65 < 9 < 9 < 10 < 13 < 5 < 14 Nb-95 < 5 <4 <6 < 6 < 3 <7 Zr-95 < 8 « 8 < 10 < 12 <4 < 14 Ru-103 < 5 <4 < 6 < 8 < 3 < 8 Ru-106 < 43 < 32 < 41 < 65 < 22 < 54 1-131 < 9 < 14 < 12 < 14 < 8 < 15 Cs-134 <4 <4 < 5 < 6 <2 < 6 Cs-137 < 5 <4 <6 < 7 < 3 <7 Ba-140 < 23 < 28 < 31 < 41 < 17 < 38 La-140 < 7 < 9 < 11 < 13 < 5 < 14 Ce-141 < 8 < 9 < 12 < 14 < 5 < 17 Ce-144 < 32 < 32 < 42 < 54 < 19 < 68 Ra-226 < 115 ~ 110 < 151 < 193 < 57 < 202 Ac-228 < 15 < 13 < 22 < 27 < 9 < 23 Th-228 < 9 < 7 < 11 < 13 < 5 < 15
(a) Quarterly Composite
B-22

INDIAN POINT ENERGY CENTER TABLE B-10
RADIONUCLIDES IN DRINKING WATER SAMPLES -2015
pCi/L ± 2 Sigma
Camp Field 7
DATE 7/14/2014 8/10/2015 9/9/2015 10/20/2015 11/9/2015 12/22/2015
RADIOCHEMICAL
Gr-B < 3.1 3.5 ± 1.7 < 2.2 2.6 ± 1.6 3.7 ± 1.7 2.6 ± 1.7 H-3 (a) < 182 < 189
GAMMA
Be-7 < 34 < 53 < 45 < 54 < 70 < 47 K-40 < 36 83 ± 55 < 143 < 39 < 147 < 77 Mn-54 < 4 < 5 < 6 < 6 < 8 <4 Co-58 , < 3 I < !i < 6 < 5 < 8 < 5 Fe-59 < 7 < 13 < 15 < 9 < 16 < 11 Co-60 < 4 <7 < 6 < 6 < 8 < 6 Zn-65 < 8 < 14 < 11 < 12 < 17 < 11 Nb-95 <4 <4 < 7 < 6 < 9 < 5 Zr-95 < 6 < 9 < 11 < 10 < 14 < 7 Ru-103 < 4 < 6 < 7 < 6 < 7 < 5 Ru-106 < 35 < 52 < 60 < 63 < 82 < 44 1-131 < 5 < 12 < 13 < 12 < 13 < 9 Cs-134 < 3 < 6 <6 < 6 < 7 < 5 Cs-137 < 3 < 6 < 6 < 6 < 8 < 5 Ba-140 < 14 < 31 < 34 < 28 < 39 < 23 La-140 <4 < 8 < 11 < 10 < 15 < 9 Ce-141 < 8 < 12 < 11 < 11 < 11 < 9 Ce-144 < 31 < 46 < 45 < 40 < 42 < 41 Ra-226 < 109 < 152 < 169 < 153 < 167 < 139
. Ac-228 < 15 < 22 < 25 < 23 < 26 < 22 Th-228 < 8 < 11 < 13 < 11 < 13 < 9
(a) Quarterly Composite
8-23

INDIAN POINT ENERGY CENTER TABLE B-10
RADIONUCLIDES IN DRINKING WATER SAMPLES - 2015
pCi/L ± 2 Sigma
Croton 8
DATE 1/13/2015 2/9/2015 3/9/2015 4/13/2015 5/12/2015 6/8/2015
RADIOCHEMICAL
Gr-B 2.8 ± 1.6 2.8 + 1.5 < 2.3 < 2.4 2.6 ± 1.5 < 2.1 H-3 (a) < 180 < 190
GAMMA
Be-7 < 57 < 32 < 39 < 49 < 24 < 43 K-40 < 117 < 31 < 90 < 56 < 23 < 61 Mn-54 < 7 < 3 < 5 < 6 < 3 <5 Co-58 < 8 < 3 < 5 < 6 < 3 < 6 Fe-59 < 16 <7 < 10 < 13 < 6 < 11 Co-60 < 8 < 3 < 5 < 6 < 2 <6 Zn-65 < 13 < 6 < 9 < 13 <4 < 12 Nb-95 < 8 <4 < 5 < 7 < 3 < 5 Zr-95 < 15 < 6 < 8 < 12 < 5 < 10 Ru-103 < 8 <4 < 5 < 7 < 3 < 6 Ru-106 < 66 < 27 < 48 < 58 < 23 < 43 1-131 < 12 < 12 < 8 < 14 < 8 < 13 Cs-134 < 7 <3 < 5 < 6 < 2 <4 Cs-137 < 7 <4 < 5 < 6 < 2 < 5 Ba-140 < 36 < 25 < 20 < 33 < 17 < 26 La-140 < 11 <6 < 6 < 11 < 5 < 8 Ce-141 < 10 < 8 < 9 <fa < 6 < 10 Ce-144 < 39 < 27 < 34 < 49 < 21 . < 36 Ra-226 < 156 < 98 < 115 < 164 < 60 < 139 Ac-228 < 29 < 15 < 18 < 17 < 9 < 23 Th-228 < 12 <7 <9 < 11 < 5 < 12
(a) Quarterly Composite
B-24

INDIAN POINT ENERGY CENTER TABLE B-10
RADIONUCLIDES IN DRINKING WATER SAMPLES -2015
pCi/L ± 2 Sigma
Croton 8
DATE 7/13/2015 8/10/2015 9/9/2015. 10/20/2015 11/9/2015 12/21/2015
RADIOCHEMICAL
Gr-8 3 ± 1.7 < 2.5 3.8 ± 1.6 3.2 ± 1.9 < 2.5 2.3 ± 1.5 H-3 (a) < 185 < 190
GAMMA
Be-7 < 72 < 59 < 67 < 61 < 54 < 41 K-40 < 181 < 145 < 182 < 129 < 52 < 72 Mn-54 < 12 < 6 < 7 < 6 < 6 < 3 Co-58 < 7 < 7 < 8 < 6 < 6 <4 Fe-59 < 23 < 13 < 12 < 17 < 13 < 10 Co-60 < 13 <7 < 10 < 6 < 8 <4 Zn"65 < 22 < 13 < 11 < 17 < 12 < 8 Nb-95 < 11 < 7 < 9 < 7 < 6 <4 Zr-95 < 20 < 12 < 17 < 13 < 10 < 7 Ru-103 < 11 < 8 < 8 < 8 < 6 < 5 Ru-106 < 85 < 54 < 63 < 64 < 53 < 35 1-131 < 14 < 14 < 13 < 14 < 8 < 13 Cs-134 < 9 < 6 < 7 < 5 < 5 <4 Cs-137
~r < 9 <6 < 10 < 7 < 5 <4
Ba-140 < 39 < 35 < 40 < 39 < 22 < 29 La-140 < 14 < 10 < 8 < 13 < 6 < 8 Ce-141 < 14 < 12 < 18 < 13 < 11 < 9 Ce-144 < 59 < 46 < 73 < 53 < 46 < 34 Ra-226 < 219 < 174 < 257 < 170 < 142 < 93 Ac-228 < 44 < 30 < 43 < 28 < 22 < 11 Th-228 < 17 < 13 < 17 < 14 < 12 < 8
(a) Quarterly Composite
B-25

DATE
RADIOCHEMICAL
H-3
Ni-63
Sr-90
GAMMA
Be-7
K-40
Mn-54
Co-58 Fe-59
Co-60
Zn-65 Nb-95
Zr-95
Ru-103
Ru-106
Cs-134
Cs-137 Ba-140
La-140
Ce-141 Ce-144
Ac-228
/
INDIAN POINT ENERGY CENTER TABLE 8-11
RADIONUCLIDES IN GROUNDWATER SAMPLES - 2015
5/5/2015
< 443
< 26
< 1
< 88
< 126
< 9
< 8
< 24
< 9
< 17
< 12
< 19
< 78 < 7
<B
< 16
< 73
< 22
< 48
< 34
pCi/L ± 2 Sigma
Lafarge Monitoring Well 106
8-26
11/14/2014
< 376
< 15
< 1
< 66
<.74 < 7
< 6
< 18
< 6 < 16
< 8
< 14
< 63
< 7
< 7
< 82
< 31
< 15
< 44
< 30

INDIAN POINT ENERGY CENTER TABLE B-12
GAMMA EMITTERS IN SOIL SAMPLES, 2015
pCi/kg dry ± 2 Sigma
Roseton Training Building Met Tower 23* 94 95
DATE 9/21/2015 9/21/2015 9/21/2015
Be-7 < 544 < 655 < 481
K-40 16400 ± 1970 17300 ± 2060 11600 ± 1400 Mn-54 < 87 < 74 < 71
Co-58 < 66 < 71 < 70
Fe-59 < 175 < 147 < 151
Co-60 < 90 < 54 < 70
Zn-65 < 192 < 160 < 185 Nb-95 < 90 < 76 < 73 Zr-95 < 144 < 123 < 75 Ru-103 < 63 < 62 < 49
Ru-106 < 662 < 566 < 496
1-131 < 86 < 77 < 58 Cs-134 < 87 < 57 < 50
Cs-137 < 103 < 57 < 58 Ba-140 < 268 < 265 < 217
La-140 < 118 < 48 < 85 Ce-141 < 75 < 113 < 61 Ce-144 < 282 < 444 < 241 Ra-226 < 1250 < 1840 < 1150 Th-228 834 ± 132 768 ± 141 312 ± 95
• Control Location
B-27

INDIAN POINT ENERGY CENTER TABLE 8-13
GAMMA EMITTERS IN BROADLEAF VEGETATION SAMPLES -2015
pCi/kg wet ± 2 Sigma
Roseton 23*
DATE 05/19/15 05/19/15 05/19/15 06/15/15 06/15/15 06/15/15
GAMMA
Be-7 293 ± 94 611 ± 134 636 ± 147 1360 ± 256 1140 ± 156 770 ± 184 K-40 4680 ± 288 7420 ± 372 3960 ± 344 4610 ± 418 5310 ± 430 4650 ± 403
Mn-54 < 12 < 12 < 10 < 17 < 16 < 13
Co-58 < 14 < 14 < 9 < 16 < 19 < 18
Fe-59 < 30 < 33 < 20 < 41 < 45 < 44
Co-60 < 13 < 13 < 11 < 18 < 15 < 16
Zn-65 < 26 < 29 < 24 < 40 < 41 < 33
Nb-95 < 15 < 13 < 8 < 20 < 21 < 18 Zr-95 < 24 < 25 < 17 < 34 < 29 < 35 Ru-103 < 15 < 15 < 12 < 21 < 19 < 19
Ru-106 < 106 < 115 < 83 < 152 < 160 < 140
1-131 < 56 < 56 < 54 < 58 < 58 < 53
Cs-134 < 12 < 12 < 9 < 16 < 17 < 14 Cs-137 < 12 < 12 < 10 < 16 < 18 < 17 sa-140 < 108 < 99 < 105 < 115 < 123 < 118 La-140 < 23 < 28 < 21 < 30 < 28 < 37 Ce-141 < 26 < 27 < 18 < 36 < 37 < 29 Ce-144 < 80 , < 91 < 57 < 116 < 124 < 98 Ra-226 < 255 < 273 < 189 < 440 < 410 < 363 Th-228 -- < 21 < 22 < 16 < 31 < 32 < 30
• Control Location
B-28

INDIAN POINT ENERGY CENTER TABLE 8-13
GAMMA EMITTERS IN BROADLEAF VEGETATION SAMPLES-2015
pCi/kg wet ± 2 Sigma
Roseton 23*
DATE 07/20/15 07/20/15 07/20/15 08/17/15 08/17/15 08/17/15
GAMMA
Be-7 837 ± 183 902 ± 168 541 ± 239 638 ± 315 665 ± 349 722 ± 301 K-40 3830 ± 419 7770 ± 441 2640 ± 403 4340 ± 770 7560 ± 1060 3900 ± 758 Mn-54 < 17 < 15 < 22 < 47 < 41 < 33
Co-58 < 18 < 17 < 27 < 42 < 39 < 39
Fe-59 < 49 < 34 < 58 < 83 < 87 < 87
Co-60 < 16 < 15 < 23 < 42 < 42 < 52
Zn-65 < 40 < 35 < 49 < 105 < 113 < 68
Nb"95 < 20 < 15 < 22 < 44 < 45 < 32
Zr-95 < 35 < 26 < 33 < 77 < 59 < 84
Ru-103 < 18 < 15 < 22 < 47 < 38 < 31
Ru-106 < 164 < 133 < 209 < 417 < 302 < 307 1-131 < 41 < 33 < 47 < 58 < 57 < 53
Cs-134 < 20 < 13 < 19 < 54 < 41 < 33
Cs-137 < 21 < 15 < 23 < 43 < 43 < 33
Ba-140 < 105 < 82 < 128 < 198 < 162 < 133 La-140 < 25 < 20 < 29 < 35 < 49 < 57
Ce-141 < 35 < 28 < 28 < 77 < 66 < 42
Ce-144 < 129 < 105 < 105 < 305 < 251 < 183 Ra-226 < 430 < 389 < 429 < 1170 < 943 < 755 Th-228 < 36 < 26 < 34 < 85 < 68 < 60
* Control Location
B-29

INDIAN POINT ENERGY CENTER TABLE B-13
GAMMA EMITTERS IN BROADLEAF VEGETATION SAMPLES - 2015
pCi/kg wet ± 2 Sigma
Roseton 23*
DATE 09/14/15 09/14/15 09/14/15 10/05/15 10/05/15 10/05/15
GAMMA
Be-7 2130 ± 348 1370 ± 288 2620 ± 306 3320 ± 471 1930 ± 462 2850 ± 565 K-40 3360 ± 486 4810 ± 561 6310 ± 554 3360 ± 700 5550 ± 870 6520 ± 1030 Mn-54 < 20 < 26 < 29 < 37 < 31 < 38 Co-58 < 25 < 28 < 25 < 38 < 35 < 43 Fe-59 < 49 < 69 < 56 < 73 < 70 < 53 Co-60 < 19 < 29 < 27-.!. < 39 < 35 < 17 Zn-65 < 57 < 74 < 61 < 62 < 94 < 75 Nb-95 < 21 < 36 < 25 < 42 < 41 < 32 Zr-95 < 40 < 52 < 51 < 50 < 73 < 67 Ru-103 < 20 < 31 < 31 < 28 < 40 < 40 Ru-106 < 182 < 261 < 241 < 306 < 386 < 289 1-131 < 37 < 53 < 50 < 47 < 53 < 47 Cs-134 < 22 < 29 < 24 ( < 30 < 34 < 36 Cs-137 < 20 < 28 < 25 < 34 < 41 < 36 Ba-140 < 121 < 150 < 138 < 98 < 138 < 190 La-140 < 32 < 39 < 37 < 36 < 46 < 43 Ce-141 < 39 < 52 < 48 < 51 < 56 < 67 Ce-144 < 131 < 198 < 173 < 225 < 289 < 280 Ra-226 < 540 < 639 < 658 < 861 < 945 < 912 Th-228 < 43 < 53 < 46 < 65 < 78 < 91
* Control Location
B-30

INDIAN POINT ENERGY CENTER TABLE 8-13
GAMMA EMITTERS IN BROADLEAF VEGETATION SAMPLES~ 2015
pCi/kg wet ± 2 Sigma
Training Center 94
DATE 05/19/15 05/19/15 05/19/15 06/15/15 06/15/15 06/15/15
GAMMA
Be-7 854 ± 201 < 131 374 ± 121 953 ± 180 642 ± 217 783 ± 93 K-40 5590 ± 293 7310 ± 349 3340 ± 238 7020 ± 538 4990 ± 375 3510 ± 167
Mn-54 < 13 < 13 < 8 < 15 < 16 < 8
Co-58 < 13 < 14 < 10 < 16 < 18 < 9
Fe-59 < 32 < 32 < 25 < 50 < 40 < 22
Co-60 < 13 < 13 < 10 < 15 < 12 < 8
Zn-65 < 29 < 32 < 21 < 39 < 37 < 18
Nb-95 < 15 < 13 < 10 < 18 < 18 < 9
Zr-95 < 23 < 25 < 19 < 31 < 33 < 16
Ru-103 < 14 < 15 < 12 < 22 < 20 < 9
Ru-106 < 113 < 104 < 94 < 143 < 157 < 68
1-131 < 42 < 44 < 54 < 59 < 59 < 47
Cs-134 < 11 < 12 < 9 < 14 < 17 < 7
Cs-137 < 11 < 13 < 10 < 15 < 17 < 7
Ba-140 < 92 < 103 < 96 < 122 < 123 < 84
La-140 < 26 < 23 < 33 < 25 < 30 < 25
Ce-141 < 18 < 24 < 19 < 34 < 35 < 13
Ce-144 < 56 < 73 < 57 < 110 < 118 < 37 Ra-226 < 222 < 252 < 220 < 403 < 411 < 140
Th-228 < 16 < 20 < 19 < 33 < 33 40 ± 14
8-31

INDIAN POINT ENERGY CENTER TABLE 8-13
GAMMA EMITTERS IN BROADLEAF VEGETATION SAMPLES-2015
pCi/kg wet ± 2 Sigma
Training Center 94
DATE 07/20/15 07/20/15 07/20/15 08/17/15 08/17/15 08/17/15
GAMMA
Be-7 1500 ± 244 820 ± 259 571 ± 164 1070 ± 352 686 ± 346 ± 268 K-40 7510 ± 493 6100 ± 525 2270 ± 335 7780 ± 900 6290 ± 877 2300 ± 581
Mn-54 < 20 < 24 < 19 < 44 < 38 < 26
Co-58 < 21 < 26 < 22 < 34 < 39 < 34
Fe-59 < 46 < 59 < 51 < 78 < 86 < 55
Co-60 < 19 < 24 < 21 < 34 < 37 < 25
Zn-65 < 46 < 55 < 38 < 80' < 88 < 71
Nb-95 < 19 < 26 < 22 < 48 < 31 < 31
Zr-95 < 33 < 36 < 40 < 61 < 56 < 46
Ru-103 < 20 < 24 < 23 < 41 < 30 < 31
Ru-106 < 162 < 205 < 191 < 250 < 358 < 208 1-131 < 43 < 41 < 44 < 54 < 56 < 35
Cs-134 < 17 < 23 < 22 < 39 < 38 < 22
Cs-137 < 19 < 26 < 21 < 47 < 34 < 34
Ba-140 < 105 < 132 < 114 < 129 < 164 < 138 La-140 < 25 < 35 < 25 < 50 < 36 < 32
Ce-141 < 32 < 37 < 37 < 72 < 63 < 47
Ce-144 < 115 < 149 < 141 < 301 < 251 < 162 Ra-226 < 430 < 530 < 490 < 1020 < 1010 < 577
Th-228 < 33 < 40 < 39 < 84 < 81 < 55
B-32

INDIAN POINT ENERGY CENTER TABLE B-13
GAMMA EMITTERS IN BROADLEAF VEGETATION SAMPLES-2015
pCi/kg wet ± 2 Sigma
Training Center 94
DATE 09/14/15 09/14/15 09/14/15 10/05/15 10/05/15 10/05/15
GAMMA
Be-7 1960 ± 270 1150 ± 358 1030 ± 243 2730 ± 338 4570·± 607 1740 ± 401 K-40 5980 ± 609 4470 ± 795 2250 ± 360 5280 ± 596 4170 ± 688 2560 ± 682 Mn-54 < 25 < 27 < 25 < 34 < 39 < 28 Co-58 < 24 < 26 < 21 < 34 < 47 < 38 Fe-59 < 55 < 80 < 49 < 75 < 68 < 63 Co-60 < 25 < 33 < 18 < 30 < 39 < 27 Zn-65 < 60 < 62 < 47 < 76 < 97 < 67 Nb-95 < 25 < 34 < 25 < 41 < 37 < 45 Zr-95 < 45 < 71 < 36 < 53 < 61 < 68 Ru-103 < 23 < 36 < 22 < 34 < 34 < 37 Ru-106 < 230 < 274 < 229 < 336 < 295 < 298 1-131 < 46 < 59 < 43 < 47 < 59 < 49 Cs-134 < 25 < 38 < 20 < 35 < 42 < 34 Cs-137 < 23 < 30 < 22 < 33 < 43 < 37 Ba-140 < 107 < 153 < 126 < 148 < 156 < 141 La-140 < 30 < 35 < 32 < 28 < 30 < 34 C~-141 < 37 < 63 < 39 < 57 < 65 < 55 Ce-144 < ·144 < 219 < 152 < 250 < 238 < 224 Ra-226 < 530 < 756 < 557 < 821 < 1060 < 1090 Th-228 < 38 < 62 < 44 < 72 '< 67 < 76
8-33

INDIAN POINT ENERGY CENTER TABLE B-13
GAMMA EMITTERS IN BROADLEAFVEGETATION SAMPLES-2015
pCi/kg wet ± 2 Sigma
Met Tower 95
DATE 5/19/2015 5/19/2015 5/19/2015 6/15/2015 6/15/2015 6/15/2015
GAMMA
Be-7 902 ± 108 907 ± 135 687 ± 144 295 ± 71 543 ± 84 1290 ± 111 K-40 3460 ± 202 5120 ± 297 3840 ± 246 3420 ± 165 3740 ± 182 7090 ± 237 Mn-54 < 8 < 9 < 10 < 7 < 8 < 8 Co-58 < 9 < 11 < 9 < 7 < 9 < 9 Fe-59 < 20 < 28 < 23 < 19 < 23 < 25 Co-60 < 9 < 11 < 8 < 7 < 8 < 8 Zn-65 < 21 < 21 < 21 < 15 < 20 < 19 Nb-95 < 9 < 10 < 11 < 7 < 10 < 10 Zr-95 < 18 < 20 < 19 < 13 < 17 < 17 Ru-103 < 10 < 12 < 12 < 9 < 11 < 10 Ru-106 < 72 < 87 < 85 < 56 < 70 < 68 1-131 < 48 < 52 < 50 < 45 < 55 < 60 Cs-134 < 7 < 9 < 9 < 6 < 8 < 7 Cs-137 < 9 < 9 < 9 < 6 < 8 < 9 Ba-140 < 84 < 95 < 86 < 71 < 95 < 93 La-140 < 20 < 24 < 23 < 19 < 29 < 28 Ce-141 < 21 < 20 < 21 < 15 < 14 < 17 Ce-144 < 62 < 57 < 60 < 42 < 38 < 51 Ra-226 < 216 < 231 < 181 < 134 < 133 < 187 Th-228 < 14 < 18 < 15 < 11 < 12 < 15
B-34

INDIAN POINT ENERGY CENTER TABLE 8-13
GAMMA EMITTERS IN BROADLEAF VEGETATION SAMPLES-2015
pCi/kg wet ± 2 Sigma
Met Tower 95
DATE 7/20/2015 7/20/2015 7/20/2015 8/17/2015 8/1~/2015 8/17/2015
GAMMA
Be-7 791 ± 252 1550 ± 235 955 ± 270 1450 ± 493 1380 ± 411 727 ± 229 K-40 5980 ± 569 7830 ± 578 3900 ± 451 5330 ± 814 5360 ± 930 4660 ± 853 Mn-54 < 20 < 20 < 22 < 36 < 39 < 36 Co-58 « 20 < 23 < 22 < 39 < 35 < 35 Fe-59 < 44 < 47 < 53 < 76 < 84 < 86
Co-60. < 20 < 21 < 24 < 31 < 46 < 34 Zn-65 < 40 < 48 < 47 < 76 < 104 < 78 Nb-95 < 24 < 22 < 25 < 35 < 38 < 26 Zr-95 < 35 < 35 < 43 < 51 < 64 < 87 Ru-103 < 20 < 25 < 25 < 43 < 33 < 30 Ru-106 < 156 < 185 < 197 < 340 < 332 < 326 1-131 < 45 < 47 < 56 < 53 < 58 < 53 Cs-134 < 20 < 23 < 23 < 33 < 38 < 30 Cs-137 < 17 < 22 < 24 < 38 < 35 < 34 Ba-140 < 102 < 117 < 132 < 162 < 162 < 165 La-140 < 20 < 29 < 31 < 35 < 33 < 54 Ce-141 < 38 < 41 < 44 < 56 < 63 < 55 Ce-144 < 142 < 156 < 170 < 234 < 244 < 209 Ra-226 < 444 < 467 < 533 < 925 < 949 < 818 Th-228 < 40 < 41 < 49 < 71 < 76 < 64
\
8-35
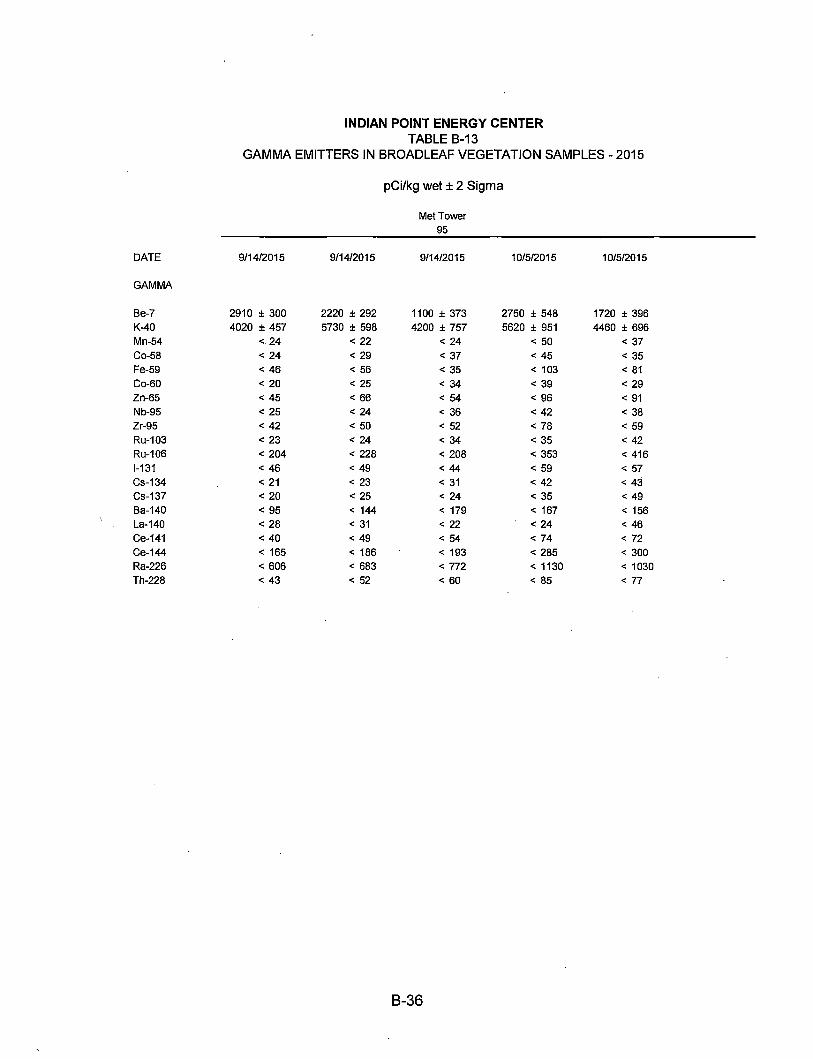
INDIAN POINT ENERGY CENTER TABLE B-13
GAMMA EMITTERS IN BROADLEAF VEGETATION SAMPLES -2015
pCi/kg wet ± 2 Sigma
MetTower 95
DATE 9/14/2015 9/14/2015 9/14/2015 10/5/2015 10/5/2015
GAMMA
Be-7 2910 ± 300 2220 ± 292 1100 ± 373 2750 ± 548 1720 ± 396 K-40 4020 ± 457 5730 ± 598 4200 ± 757 5620 ± 951 4460 ± 696 Mn-54 < 24 < 22 < 24 < 50 < 37 Co-58 < 24 < 29 < 37 < 45 < 35 Fe-59 < 46 < 56 < 35 < 103 < 81 Co-60 < 20 < 25 < 34 < 39 < 29 Zn-65 < 45 < 66 < 54 < 96 < 91 Nb-95 < 25 < 24 < 36 < 42 < 38 Zr-95 < 42 < 50 < 52 < 78 < 59 Ru-103 < 23 < 24 < 34 < 35 < 42 Ru-106 < 204 < 228 < 208 < 353 < 416 1-131 < 46 < 49 < 44 < 59 < 57 Cs-134 < 21 < 23 < 31 < 42 < 43 Cs-137 < 20 < 25 < 24 < 35 < 49 Ba-140 < 95 < 144 < 179 < 167 < 156 La-140 < 28 < 31 < 22 < 24 < 46 Ce-141 < 40 < 49 < 54 < 74 < 72 Ce-144 < 165 < 186 < 193 < 285 < 300 Ra-226 < 606 < 683 < 772 < 1130 < 1030 Th-228 < 43 < 52 < 60 < 85 < 77
B-36

INDIAN POINT ENERGY CENTER TABLE 8-14
RADIONUCLIDES IN RIVER WATER SAMPLES -2015
pCi/L ± 2 Sigma
Plant Inlet Hudson River Intake 9*
DATE 1/28/2015 212412015 3/31/2015 4/28/2015 5/27/2015 6/30/2015
RADIOCHEMICAL
H-3 (a) 367 ± 117 < 190
GAMMA
K-40 < 46 49 ± 28 44 ± 25 < 18 < 12 < 31 Mn-54 < 2 <2 < 1 <2 < 1 < 1 Co-58 < 3 < 2 < 2 < 2 <2 <2 Fe-59 < 6 < 5 <4 < 5 <4 <4 Co-60 < 2 <2 < 1 < 2 < 1 < 1 Zn-6p < 5 <4 < 3 <4 < 3 < 3 Nb-95 < 3 < 2 <2 < 2 < 2 <2 Zr-95 < 5 <.4 < 3 <4 < 3 < 3 Ru-103 < 3 < 3 < 2 <3 < 2 < 2 Ru-106 < 23 < 18 < 14 < 17 < 13 < 15 1-131. < 14 < 12 < 13 < 14 < 9 < 15 Cs-134 <2 < 2 < 1 < 2 < 1 < 1 Cs-137 < 3 <2 < 1 <2 < 1 <2 Ba-140 < 25 < 21 < 18 < 22 < 15 < 21 La-140 < 9 < 7 < 5 < 7 <4 < 7 Ce-141 < 6 < 5 <4 < 5 <4 <4 Ce-144 < 19 < 15 < 12 < 15 < 11 < 11 Ra-226 < 64 < 47 < 41 < 54 < 33 < 42 Ac-228 < 9 < 6 < 6 < 7 < 5 < 7 Th-228 < 5 < 3 < 3 <4 < 3 <3
* Control Location (a) Quarterly Composite
8-37

INDIAN POINT ENERGY CENTER TABLE 8-14
RADIONUCLIDES IN RIVER WATER SAMPLES-2015
pCi/L ± 2 Sigma
Plant Inlet Hudson River Intake 9*
DATE 7/29/2015 9/1/2015 9/29/2015 10/28/2015 11/24/2015 12/29/2015
RADIOCHEMICAL
H-3 (a) < 184 < 189
GAMMA
K-40 < 15 55 ± 23 < 28 39 ± 17 58 ± 32 < 31 Mn-54 < 1 < 2 < 3 < 1 < 2 < 2 Co-58 <2 <2 < 3 < 1 < 2 < 2 Fe-59 <4 <5 <7 < 3 < 5 <4 Co-60 < 2 < 2 < 3 < 1 < 2 < 2 Zn-65 < 3 <4 <6 < 3 <4 < 3 Nb-95 < 2 < 2 < 3 <2 <2 < 2 Zr-95 < 3 <4 <6 < 2 <4 < 3 Ru-103 <2 < 3 <4 < 2 < 3 < 2 Ru-106 < 12 < 17 < 25 < 12 < 16 < 14 1-131 < 15 < 13 < 12 < 8 < 13 < 14 Cs-134 < 1 < 2 < 3 < 1 < 2 < 2 Cs-137 < 2 < 2 < 3 < 1 < 2 < 2 Ba-140 < 22 < 21 < 23 < 12 < 19 < 21 La-140 < 7 < 7 <7 <4 < 6 < 7 Ce-141 <4 < 5 <7 <4 < 5 < 5 Ce-144 < 11 < 14 < 22 < 12 < 15 < 13 Ra-226 < 42 < 46 < 81 < 33 < 53 < 44 Ac-228 <7 < 6 < 9 < 5 < 7 <6 Th-228 <3 < 4 <6 < 3 <4 < 3
* Control Location (a) Quarterly Composite
B-38

INDIAN POINT ENERGY CENTER TABLE B-14
RADIONUCLIDES IN RIVER WATER SAMPLES -2015
pCi/L ± 2 Sigma
Discharge Canal 10
DATE 1/28/2015 2/24/2015 3/31/2015 4/28/2015 5/27/2015 6/30/2015
RADIOCHEMICAL
H-3 (a) 959 ± 152 274 ± 138
GAMMA
K-40 < 31 < 15 30 ± 19 < 13 < 33 56 ± 31 Mn-54 < 2 < 2 < 1 <2 < 2 <2 Co-58 < 2 <2 < 1 < 2 < 2 <2 Fe-59 <4 < 4· < 3 < 3 <4 <4 Co-60 <2 < 2 < 1 < 1 < 2 < 2 Zn-65 <4 < 3 < 2 < 3 < 3 < 3 Nb-95 < 2 <2 < 1 < 2 <2 < 2 Zr-95 < 3 < 3 < 2 < 3 < 3 < 3 Ru-103 < 3 < 2 <2 <2 < 2 < 2 Ru-106 < 17 < 15 < 11 < 13 < 14 < 15 1-131 < 12 < 10 < 9 < 11 < 9 < 15 Cs-134 < 2 < 1 < 1 < 1 < 1 <2 Cs-137 < 2 < 2 < 1 <2 < 2 < 2 Ba-140 < 19 < 17 < 15 < 18 < 16 < 22 La-140 < 5 < 6 <4 < 5 < 6 < 8 Ce-141 < 5 <4 < 3 < 4 <4 <4 Ce-144 < 15 < 12 < 9 < 12 < 11 < 12 Ra-226 < 45 < 36 < 37 < 36 < 40 < 34 Ac-228 < 6 < 5 < 4 <5 < 7 <7 Th-228 <4 < 3 <2 < 3 < 3 < 3
(a) Quarterly Composite
B-39

J
INDIAN POINT ENERGY CENTER TABLE 8~14
RADIONUCLIDES IN RIVER WATER SAMPLES -2015
pCi/L ± 2 Sigma
Discharge Canal 10
DATE 7/29/2015 9/1/2015 9/29/2015 10/28/2015 11/24/2015 12/29/2015
RADIOCHEMICAL
H-3 (a) < 186 341 ± 131
GAMMA
K-40 < 12 74 ± 29 < 31 50 ± 26 < 20 36 ± 23 Mn-54 <2 < 2 <3 < 2 < 2 <2 Co-58 <2 < 2 <4 < 2 < 3 <2 Fe-59 <4 <4 < 9 <4 < 6 <4 Co-60 < 1 <2 <4 <2 < 2 < 2
Zn"65 < 3 <4 < 8 < 3 < 4 < 3 Nb-95 <2 <2 <4 <2 < 2 < 2 Zr-95 <3 <. 3 < 7 < 3 < 4 < 3 Ru-103 · < 2 < 2 < 5 < 2 < 3 <2 Ru-106 < 12 < 15 < 33 . < 15 < 20 < 15 1-131 < 12 < 13 < 15 < 10 < 13 ·< 14 Cs-134 < 1 < 2 < 4 < 2 < 2 < 2 Cs-137 < 1 < 2 <4 <2 < 2 < 2 Ba-140 < 20 < 20 < 32 < 16 < 23 < 21 La-140 < 7 < 7 < 11 < 5 < 8 < 7 Ce-141 < 3 . < 5 <9 <4 < 4 < 5 Ce-144 <7 < 14 < 30 < 13 < 12 < 13 Ra-226 < 30 < 48 < 97 < 47 < 46 < 40 Ac-228 < 6 <7 < 15 < 7 < 9 < 6 Th-228 <2 <4 < 7 <4 < 3 < 3
(a) Quarterly·Composite
8-40

DATE
GAMMA
Be-7
K-40
Mn-54
Co-58
Fe-59 Co-60
Zn-65
Nb-95
Zr-95
Ru-103
Ru-106 1-131
Cs-134
Cs-137
Ba-140 Ce-141
Ce-144
Ra-226
Th-228
INDIAN POINT ENERGY CENTER TABLE B-15
GAMMA EMITTERS IN BOTTOM SEDIMENT SAMPLES - 2015
pCi/kg dry ± 2 Sigma
Discharge Canal 10
6/11/2015 8/26/2015
< 970 < 947
22500 ± 2100 18200 ± 2870 < 92 < 83 < 99 < 98
< 239 < 133
< 91 < 59
< 195 < 135
< 106 < 81
< 185 < 149
< 148 < 124 < 803 < 836 < 1590 - < 199 < 66 < 95
736 ± 154 3010 ± 307
< 1880 < 281 < 223 < 180
< 505 < 689
3130 ± 1480 < 3040
1180 ± 146 1270 ± 222
B-41
6/11/2015
< 1500
21000 ± 2000 < 115
< 148
< 301
< 115
< 260
< 163
< 277
< 188
< 1040
< 2630
< 142
225 ± 125 < 2620
< 414
< 942
< 2790
1790 ± 189
Off Verplanck
17
8/27/2015
< 708
18400 ± 2830
< 135
< 74
< 226
< 134
< 265
< 118
< 148
< 111
< 965
< 118
< 91
318 ± 163
< 537
< 196
< 758
< 2970
1080 ± 332

DATE
GAMMA
Be-7
K-40
Mn-54
Co-58
Fe-59 Co-60
Zn-65
Nb-95
Zr-95
Ru-103
Ru-106
1-131
Cs-134
Cs-137
Ba-140
Ce-141
Ce-144
Ra-226
Th-228
* Control Location
INDIAN POINT ENERGY CENTER TABLE B-15
GAMMA EMITTERS IN BOTTOM SEDIMENT SAMPLES - 2015
6/11/2015
< 917
16700 ± 2040
< 94
< 91
< 301
< 79
< 151
< 109
< 184
< 128 < 778
< 1540 < 80
314 ± 100 < 1720 < 198
< 461
< 1430
1060 ± 125
Lent's Cove 28
pCi/kg dry ± 2 Sigma
8/26/2015
< 1300
17000 ± 3620
< 114
< 152
< 191
< 152
< 278
< 141
< 237
< 157
< 869 < 210
< 111
651 ± 233 < 387
< 255
< 978 < 3260
932 ± 384
8-42
6/10/2015
< 986
25300 ± 2160 < 79
< 109
< 296
< 79
< 205
< 123 < 192
< 127
< 718 < 1460
< 72
< 96
< 1910 < 204
< 454
< 1340
998 ± 115
Cold Spring 84*
8/26i2015
< 787
28100 ± 3440
< 111
< 94
< 215 < 80
< 243
< 107 < 170
< 93
< 765 < 151
< 73
< 99
< 475
< 164
< 623
< 2070
847 ± 300

DATE
RADIOCHEMICAL
Sr-90
GAMMA
Be-7 K-40 Mn-54 Co-58 Fe-59 Co-60 Zn-65 Nb-95 Zr-95 Ru-103 Ru-106 1-131 Cs-134 Cs-137 Ba-140 La-140 Ce-141 Ce-144 Ra-226 Ac-228 Th-228
INDIAN POINT ENERGY CENTER TABLE 8-16
RADIONUCLIDES IN SHORELINE SOIL SAMPLES - 2015
pCi/kg dry ± 2 Sigma
Off Verplanck 17
6/11/2015 8/20/2015 6/10/2015
< 35 < 47 < 34
< 443 < 339 < 542 16400 ± 1290 13800 ± 1280 13900 ± 1510
< 53 < 42 < 56 < 52 < 45 < 59 < 149 < 86 < 130 < 51 < 30 < 74 < 102 < 102 < 152 < 57 < 42 < 86 < 109 < 64 < 136 < 62 < 48 < 79 < 423 < 353 < 498 < 277 < 116 < 341 < 46 < 33 < 58
83 ± 47 138 ± 59 < 69 < 499 < 216 < 581 < 98 < 31 < 140 < 107 < 81 < 124 < 296 < 294 < 380 < 959 < 1030 ± 1140 < 314 < 328 < 207
658 ± 84 381 ± 97 521 ± 90
B-43
Lent's Cove 28
8/20/2015
< 42
< 555 10500 ± 1610
< 45 < 48 < 115 < 51 < 148 < 45 < 97 < 67 < 355 < 142 < 52 < 60 < 328 < 65 < 110 < 395 < 1760 < 157
369 ± 155

DATE
RADIOCHEMICAL
Sr-90
GAMMA
Be-7 K-40 Mn-54 Co-58 Fe-59 Co-60 Zn-65 Nb-95 Zr-95 Ru-103 Ru-106 1-131 Cs-134 Cs-137 Ba-140 La-140 Ce-141 Ce-144 Ra-226 Ac-228 Th-228
• Control Location
INDIAN POINT ENERGY CENTER TABLE B-16
RADIONUCLIDES IN SHORELINE SOIL SAMPLES - 2015
pCi/kg dry± 2 Sigma
Manitou Inlet 50*
6/10/2015 8/20/2015 6/11/2015
< 38 < 49 < 27
< 893 < 461 < 564 12900 ± 1580 11000 ± 1230 7400 ± 1450
< 77 < 43 < 58 < 89 < 43 < 76 < 207 < 120 < 190 < 61 < 46 < 58 < 176 < 97 < 174 < 124 < 54 < 85 < 148 < 86 < 154 < 113 < 48 < 80 < 818 < 440 < 700 < 473 < 120 < 299 < 82 < 43 < 58 < 82 < 59 < 66 < 858 < 320 < 493 < 269 < 90 < 107 < 178 < 107 < 93 < 532 < 346 < 299
4070 ± 1730 ± 1170 < 1280 < 506 < 357 < 244
836 ± 128 491 ± 96 < 113
8-44
White Beach 53
8/20/2015
< 43
< 420 8860 ± 1500
< 46 < 53 < 121 < 30 < 116 < 55 < 68 < 57 < 395 < 118 < 39 < 50 < 240 < 79 < 84 < 322 < 1320 < 242 < 83

. DATE
RADIOCHEMICAL
Sr-90
GAMMA
Be-7 K-40 Mn-54 Co-58 Fe-59 Co-60 Zn-65 Nb-95 Zr-95 Ru-103 Ru-106 1-131 Cs-134 Cs-137 Ba-140 La-140 Ce-141 Ce-144 Ra-226 Ac-228 Th-228
* Control Location
INDIAN POINT ENERGY CENTER TABLE 8-16
RADIONUCLIDES IN SHORELINE SOIL SAMPLES - 2015
6/10/2015
< 31
< 593 28600 ± 2120
< 79
< 6~ - < 179
< 59 < 166 < 93 < 146 < 78 < 556 < 398 < 58 < 73 < 666 < 245 < 137 < 398 ± 1310 < 217
1130 ± 106
Cold Spring 84*
pCi/kg dry ± 2 Sigma
8/20/2015
< 43
< 378 30000 ± 1860
< 47 < 50 < 134 < 51 < 119 < 54 < 92 < 45 < 407 < 119 < 39 < 62 < 293 < 74 < 90 < 337 < 1120 < 350
511 ± 126
8-45

DATE
Be-7
K-40
Mn-54
Co-58
Fe-59
Co-60
Zn-65
Nb-95
Zr-95
Ru-103
Ru-106
1-131
Cs-134
Cs-137
Ba-140
La-140
Ce-141
Ce-144
Ra-226
Ac-228
Th-228
INDIAN POINT ENERGY CENTER TABLE B-17
GAMMA EMITTERS IN AQUATIC VEGETATION SAMPLES - 2015
6/10/2015
Myrophyllium
(a)
pCi/kg wet ± 2 Sigma
Lent's Cove
28
8/,?6/2015
Myrophyllium
< 239
3110 ± 539
< 33
< 23
< 75
< 21
< 57
< 35
< 49
< 31
< 214
< 57
< 26
< 32
< 140
< 49
< 43
< 151
< 612
< 149
132 ± 47
(a) Unable to locate and collect samples at this location
B-46

DATE
Be-7
K-40
Mn-54
Co-58
Fe-59
Co-60
Zn-65
Nb-95
Zr-95
Ru-103
Ru-106
1-131
Cs-134
Cs-137
Ba-140
La-140
Ce-141
Ce-144
Ra-226
Ac-228
Th-228
INDIAN POINT ENERGY CENTER TABLE 8-17
GAMMA EMITTERS IN AQUATIC VEGETATION SAMPLES - 2015
6/10/2015
Myrophyllium
(a)
pCi/kg wet ± 2 Sigma
Off Verplanck
17
I
8/27/2015
Myrophyllium
- 152 < 164
2880 ± 441
< 14
< 12
< 13
< 16
< 31
< 12
< 22
< 13
< 98
< 30
< 12
< 22
< 50
< 15
< 24
< 70
< 311
< 33
65 ± 38
(a) Unable to locate and collect samples at this location
8-47

DATE
Be-7
K-40
Mn-54
Co-58 r
Fe-59
Co-60
Zn-65
Nb-95
Zr-95
Ru-103
Ru-106
1-131
Cs-134
Cs-137
Ba-140
La-140
Ce-141
Ce-144
Ra-226
Ac-228
Th-228
* Control Location
INDIAN POINT ENERGY CENTER TABLE B-17
GAMMA EMITTERS IN AQUATIC VEGETATION SAMPLES - 2015
pCi/kg wet ± 2 Sigma
Cold Spring
84*
6/10/2015 8/26/2015
Myrophyllium Myrophyllium
116 ± 72 < 210
2870 ± 154 2330 ± 384
< 7 < 21
< 8 < 24
< 20 < 43
< 7 < 17
< 14 < 47
< 8 < 22
< 14 < 34
< 9 < 21
< 55 < 156
< 56 < 43
< 6 < 16
14 ± 8 < 26
< 84 < 103
< 33 < 33
< 12 < 28
< 30 < 96
198 ± 124 < 420
< 36 < 65
95 ± 9 < 29
B-48

INDIAN POINT ENERGY CENTER TABLE B-18
RADIONUCLIDES IN FISH/ INVERTEBRATES - 2015
pCi/kg wet ± 2 Sigma
Downstream 107
DATE 4/30/2015 5nt2015 5/7/2015 5/7/2015 5/27/2015 7/27/2015 Eel Eel
RADIOCHEMICAL
Ni-63 < 83 < 82 < 73 < 31 < 98 < 83 Sr-90 < 2 < 2 < 2 < 1 <2 < 3
GAMMA
Be-7 < 1010 < 833 < 806 < 658 < 745 < 978 K-40 2550 ± 798 20~9 ± 689 2700 ± 688 2920 ± 812 3020 ± 660 3430 ± 627 Mn-54 < 44 < 50 < 41 < 45 < 41 < 55 Co-58 < 107 < 77 < 62 <: 86 < 59 < 81 Fe-59 < 256 <'227 < 204 < 249 < 176 < 242 Co-60 < 41 < 30 < 41 < 38 < 39 < 48 Zn-65 < 99 < 116 < 86 < 70 < 98 < 113 Nb-95 < 116 < 84 < 77 < 77 < 79 < 106 Zr-95 < 167 < 149 < 140 < 139 < 139 < 168 Ru-103 < 200 < 112 < 121 < 149 < 106 < 159 Ru-106 < 384 < 410 < 372 < 436 < 426 < 445 1-131 < 91800 < 18800 < 14700 < 15800 < 8200 < 25000 Cs-134 < 49 < 41 < 36 < 43 < 47 < 51 Cs-137 < 39 < 39 < 50 < 43 < 46 < 54 Ba-140 < 17700 < 6460 < 5710 < 6600 < 4670 < 7520 La-140 < 5700 < 2630 < 1340 < 2570 < 1430 < 2010 Ce-141 < 424 < 214 < 212 < 206 < 213 < 306 Ce-144 < 347 < 226 < 233 < 214 < 292 < 341 Ra-226 < 1090 < 842 < 795 < 844 < 998 < 895 Th-228 < 98 < 63 < 62 < 75 < 80 280 ± 73
B-49

INDIAN POINT ENERGY CENTER TABLE B-18
RADIONUCLIDES IN FISH I INVERTEBRATES -2015
pCi/kg wet ± 2 Sigma
Downstream 107
DATE 7/30/2015 7/30/2015 8/5/2015 8/11/2015 8/20/2015 Eel Stripped Bass Catfish Perch Blue Crab
RADIOCHEMICAL
Ni-63 < 42 < 54 < 36 < 78 < 80 Sr-90 < 2 <3 < 2 < 3 < 3
GAMMA
Be-7 < 987 < 972 < 627 < 883 < 954 K-40 2000 ± 619 1520 ± 750 3190 ± 653 3110 ± 746 2940 ± 887 Mn-54 < 44 < 56 < 47 < 55 < 63 Co-58 < 85 < 98 < 73 < 80 < 74 Fe-59 < 231 < 257 < 208 <,212 < 258 Co-60 < 40 < 44 < 39 < 46 < 62 Zn-65 < 104 < 118 < 91 < 85 < 163 Nb-95 < 89 < 112 < 85 < 80 < 107 Zr-95 < 144 < 160 < 130 < 164 < 193 Ru-103 < 163 < 160 < 122 < 153 < 136 Ru-106 < 385 < 501 < 347 < 540 < 499 1-131 < 56600 < 35400 < 26100 < 14400 < 7600 Cs-134 < 41 < 52 < 39 < 45 < 59 Cs-137 < 41 < 53 < 33 < 49 < 70 Ba-140 < 12200 < 10500 < 7780 < 4970 < 4360 La-140 < 3090 < 2750 < 2520 < 1380 < 1010 Ce-141 < 323 < 269 < 215 < 262 < 247 Ce-144 < 277 < 229 < 224 < 325 < 423 Ra-226 < 863 < 913 < 718 < 1050 < 1280 Th-228 < 89 < 77 < 67 < 92 115 ± 72
8-50

INDIAN POINT ENERGY CENTER TABLE B-18
RADIONUCLIDES IN FISH I INVERTEBRATES - 2015
pCi/kg wet ± 2 Sigma
Roseton 23*
DATE 4/30/2015 5/5/2015 5/5/2015 5/29/2015 5/29/2015 8/4/2015 Cat Fish White Perch Sunfish Eel Perch Blue Crab
RADIOCHEMICAL
Ni-63 < 58 < 59 < 59 < 84 < 72 < 34
Sr-90 < 3 < 1 < 1 < 2 < 2 < 3
GAMMA
Be-7 < 742 < 824 < 751 < 689 < 761 < 485
K-40 3690 ± 494 3060 ± 527 2630 ± 662 2680 ± 610 3280 ± 622 2730 ± 475
Mn-54 < 34 < 36 < 45 < 49 < 47 < 20
Co-58 < 70 < 76 < 77 < 59 < 64 < 41
Fe-59 < 255 < 260 < 242 < 163 < 233 < 114
Co-60 < 28 < 32 < 39 < 40 < 43 < 24 Zn-65 < 70 < 82 < 102 < 94 < 112 < 44
Nb-95 < 84 < 78 < 88 < 80 < 81 < 48
Zr-95 < 140 < 140 < 145 < 147 < 127 < 87 Ru-103 < 152 < 138 < 151 < 124 < 130 < 80
Ru-106 < 274 < 287 < 384 < 413 < 401 < 215 1-131 < 214000 < 56800 < 43200 < 19100 < 18800 < 16100
Cs-134 < 28 < 33 < 36 < 38 < 43 < 22 Cs-137 < 31 < 33 < 35 < 34 < 41 < 24
Ba-140 < 27400 < 11600 < 11700 < 5900 < 6650 < 4850
La-140 < 6840 < 3480 < 4090 < 1810 < 1920 < 1400
Ce-141 < 325 < 249 < 201 < 236 < 255 < 182
Ce-144 < 197 < 205 < 176 < 262 < 249 < 186
Ra-226 < 587 < 742 < 548 < 967 < 910 < 486
Th-228 < 50 < 60 < 56 < 84 < 79 < 47
* Control Location
B-51

INDIAN POINT ENERGY CENTER TABLE B-18
RADIONUCLIDES IN FISH I INVERTEBRATES - 2015
pCi/kg wet ± 2 Sigma
Roseton 23*
DATE 8/4/2015 8/4/2015 8/19/2015 8/24/2015 8/24/2015 Eel Blue Crab Eel' Striped Bass Catfish
RADIOCHEMICAL
Ni-63 < 80 < 84 <. 58 < 40 <: 86 Sr-90 < 3 <4 <4 < 3 < 2
GAMMA
Be-7 < 736 < 819 < 622 < 473 < 774 K-40 3240 ± 670 3530 ± 650 4260 ± 704 2010 ± 478 2620 ± 682 Mn-54 < 54 < 47 < 39 < 38 < 56 Co-58 < 78 < 82 < 63 < 39 < 75 Fe-59 < 212 < 258 < 200 < 122 < 192 Co-60 < 43 < 43 < 42 < 25 < 51 Zn-65 < 90 < 117 < 99 < 59 < 95 Nb-95 < 82 < 99 ' < 69 < 46 < 83 Zr-95 < 144 < 155 < 135 < 81 < 125 Ru-103 -< 128 < 128 < 101 < 71 < 124 Ru-106 < 377 < 421 < 320 < 222 < 448 1-131 < 14300 < 15100 < 8380 < 4270 < 5580 Cs-134 < 36 < 42 < 39 < 23 < 48 Cs-137 < 42 < 47 < 34 < 36 < 50 Ba-140 < 5650 < 6260 < 3960 < 1990 < 3550 La-140 < 1840 < 2040 < 1030 < 632 < 1150 Ce-141 < 213 < 187 < 165 < 156 < 209 Ce-144 < 248 < 207 < 196 < 223 < 318 Ra-226 < 826 < 689 < 802 < 781 < 973 Th-228 < 75 81 ± 51 < 68 < 66 < 81
* Control Location
B-52

INDIAN POINT ENERGY CENTER TABLE B-18
RADIONUCLIDES IN FISH I INVERTEBRATES - 2015
pCi/kg wet ± 2 Sigma
Downstream 25
DATE 4/29/2015 5/26/2015 5/26/2015 5/27/2015 5/27/2015 7/30/2015 Perch Sunfish Eel Catfish Striped Bass Blue Crab
RADIOCHEMICAL
Ni-63 < 85 < 94 < 70 < 73 < 96 < 36 Sr-90 < 2 <2 <2 < 2 < 5 <4
GAMMA
Be-7 < 694 < 920 < 1140 < 862 < 870 < 900 K-40 3220 ± 527 3610 ± 868 3900 ± 976 2730 ± 567 2700 ± 621 2790 ± 598 Mn-54 < 36 < 57 < 71 < 49 < 47 < 44 Co-58 ' < 52 < 93 < 96 < 77 < 60 < 78 Fe-59 < 256 < 241 < 255 < 252 < 257 < 242 Co-60 < 28 < 55 < 56 < 40 < 36 < 31 Zn-65 < 80 < 125 < 170 < 98 < 105 < 93 Nb-95 < 77 < 112 < 144 < 82 < 95 < 90 Zr-95 < 139 < 169 < 254 < 143 < 151 < 144 Ru-103 < 137 < 181 < 215 < 142 < 145 < 143 Ru-106 < 282 < 503 < 580 < 407 < 450 < 395 1-131 < 229000 < 41900 < 54300 < 30300 < 27900 < 42800 Cs-134 < 29 < 52 < 67 < 40 < 37 < 40 Cs-137 < 31 < 66 < 63 < 44 <. 49 < 37 Ba-140 < 24600 < 10300 < 14100 < 9150 < 9910 < 10300 La-140 < 7870 < 2630 < 5930 < 2770 < 2570 < 2310 Ce-141 < 296 < 326 < 360 < 257 < 289 < 254 Ce-144 < 174 < 326 < 385 < 252 < 246 < 250 Ra-226 < 480 < 1040 < 1260 < 834 < 704 < 758 Th-228 < 42 < 83 < 114 < 79 < 83 < 69
8-53

INDIAN POINT ENERGY CENTER TABLE B-18
RADIONUCLIDES IN FISH/ INVERTEBRATES - 2015
pCi/kg wet± 2 Sigma
Downstream 25
DATE 7/30/2015 7/30/2015 7/30/2015 7/30/2015 8/4/2015 Blue Crab Striped Bass Sunfish Catfish Perch
RADIOCHEMICAL
Ni-63 < 43 < 85 < 92 < 59 < 97 Sr-90 < 3 <4 < 3 <2 < 4
GAMMA
Be-7 < 660 < 750 < 552 < 806 < 671 K-40 2060 ± 476 3410 ± 623 2770 ± 449 2380 ± 563 2910 ± 620 Mn-54 < 35 < 36 < 32 < 37 < 29 Co-58 < 70 < 67 < 45 < 67 < 55 Fe-59 ·< 220 < 227 < 141 < 256 < 162 Co-60 < 37 < 34 < 25 < 34 < 23 Zn-65 < 97 < 89 < 69 < 73 < 67 Nb-95 < 77 < 79 < 53 < 87 < 55 Zr-95 < 137 < 133 < 96 < 143 < 114 Ru-103 < 122 < 118 < 88 < 137 < 107 Ru-106 < 319 < 343 < 283 < 319 < 300 1-131 < 42300 < 33200 < 10800 < 46000 < 24300 Cs-134 < 34 < 35 < 29 < 29 < 28 Cs-137 < 31 < 39 < 31 < 34 < 29 /'
Ba-140 < 10100 < 9440 < 4160 < 9760 < 7050 La-140 < 3640 < 2580 < 1120 < 4000 < 1610 Ce-141 < 243 < 220 < 168 < 228 < 208
.Ce-144 < 201 < 196 < 193 < 208 < 213 Ra-226 < 569 < 737 < 633 < 564 < 688 Th-228 < 58 < 61 .< 54 < 52 < 54
B-54

INDIAN POINT ENERGY CENTER TABLE B-19
LAND USE CENSUS - RESIDENCE AND MILCH ANIMAL RESULTS
2015
The 2015 land use census indicated there were no new residences that were closer in proximity to IPEC. IPEC
maintains a complete nearest residence survey with updated distances.
No milch animals were observed during this reporting period within the 5-mile zone. Therre are no animals producing
milk for human consumption within five miles of Indian Point.
8-55

Sector Compass Point
N
2 NNE
3 NE
4 ENE
5 E
6 ESE
7 SE
8 SSE
9 s
10 SSW
11 SW
12 WSW
13 w
14 WNW
15 NW
16 NNW
Distance to site
INDIAN POINT ENERGY CENTER
TABLE B-20
LAND USE CENSUS
2015
UNRESTRICTED AREA BOUNDARY
AND NEAREST RESIDENCES
Distance to site Distance to nearest Boundary from Unit 2 Boundary from Unit 3 resident, from Unit 1 Plant Vent (meters) Plant Vent (meters) superheater (meters)
RIVER RIVER 1788
RIVER RIVER 3111
550 636 1907
600 775 1478
662 785 1371
569 622 715
553 564 1168
569 551 1240
700 566 1133
755 480 1574
544 350 3016
RIVER RIVER 2170
RIVER RIVER 1919
RIVER RIVER 1752
RIVER RIVER 1693
RIVER RIVER 1609
B-56
Address of nearest resident, Last Census
41 River Road Tomkins Cove
Chateau Rive Apts. John St. Peekskill
211 Viewpoint Terrace, Peekskill
1018 Lower South St. Peekskill
1103 Lower South St. Peekskill
461 Broadway Buchanan
223 First St. Buchanan
5 Pheasant's Run Buchanan
320 Broadway Verplanck
240 Eleventh St. Verplanck
8 Spring St. Tomkins Cove
9 West Shore Dr. Tomkins Cove
712 Rt. 9W Tomkins Cove
770 Rt. 9W Tomkins Cove
807 Rt. 9W Tomkins Cove
4 River Rd. Tomkins Cove

APPENDIX C
HISTORICAL TRENDS

APPENDIX C
The past ten years of historical data for various radionuclides and media are presented both in tabular form and graphical form to facilitate the comparison of 2015 data with historical values. Although other samples were taken and analyzed , values were only tabulated and plotted where positive indications were present.
Averaging the positive values in these tables can result in a biased high value , especially, when the radionuclide is detected in only one or two quarters for the year.
C-1

Table C-1
DIRECT RADIATION ANNUAL SUMMARY 2005-2015
Average Quarterly Dose (mR/Quarter)
Control Year Inner Ring Outer Ring
Location
2005
2006
2007
2008
2009
2010
2011
2012
2013
2014
2015
Historical Average 2005-2014
'
14.1
13.9
14.4
14.5
14.5
14.0
13.6
13.2
13.4
13.7
13.8
13.9
C-2
14.1 15.9
14.3 17.5
14.6 18.8
14.2 17.3
14.2 17.3
14.3 13.0
14.4 13.4
13.5 12.5
13.8 14.2
13.6 14.2
14.0 14.3
14.1 15.4
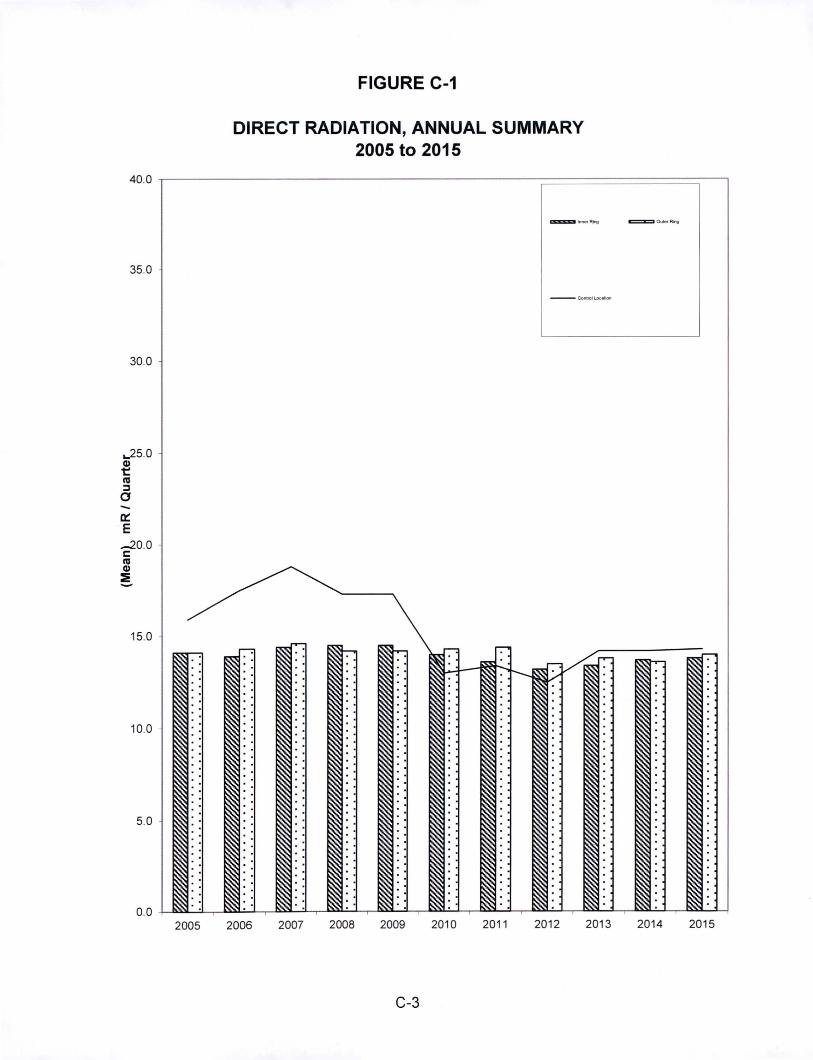
FIGURE C-1
DIRECT RADIATION, ANNUAL SUMMARY 2005 to 2015
40.0 -r---------------------;:::::::==============::::---1
35.0
30.0
,_25 0 Q)
t:: ns ::J 0 -0::: E -20.0 c: ns Q)
:E -
2005 2006 2007 2008 2009 2010 2011 2012 2013 2014 2015
C-3

Year
2005
2006
2007
2008
2009
2010
2011
2012
2013
2014
2015
Historical Average 2005-2014
I
TABLE C-2
RADIONUCLIDES IN AIR 2005 to 2015
(pCi/m3)
Gross Beta Cs-137
All Indicator Control All Indicator Locations Location Locations
0.02 0.02 <Le
0.01 0.01 <Le
0.01 0.01 <Le
0.01 0.01 <Le
0.01 0.01 <Le
0.01 0.01 <Le
0.014 0.014 < Le
0.014 0.014 < Le
0.014 0.014 < Le
0.013 0.013 < Le
0.016 0.015 < Le
0.01 0.01 < Le
Critical Level (Le) is less than the ODCM required LLD.
<Le indicates no positive values above sample critical level.
C-4
Control Location
<Le
<Le
<Le
<Le
<Le
<Le
< Le
< Le
<Le
< Le
< Le
< Le
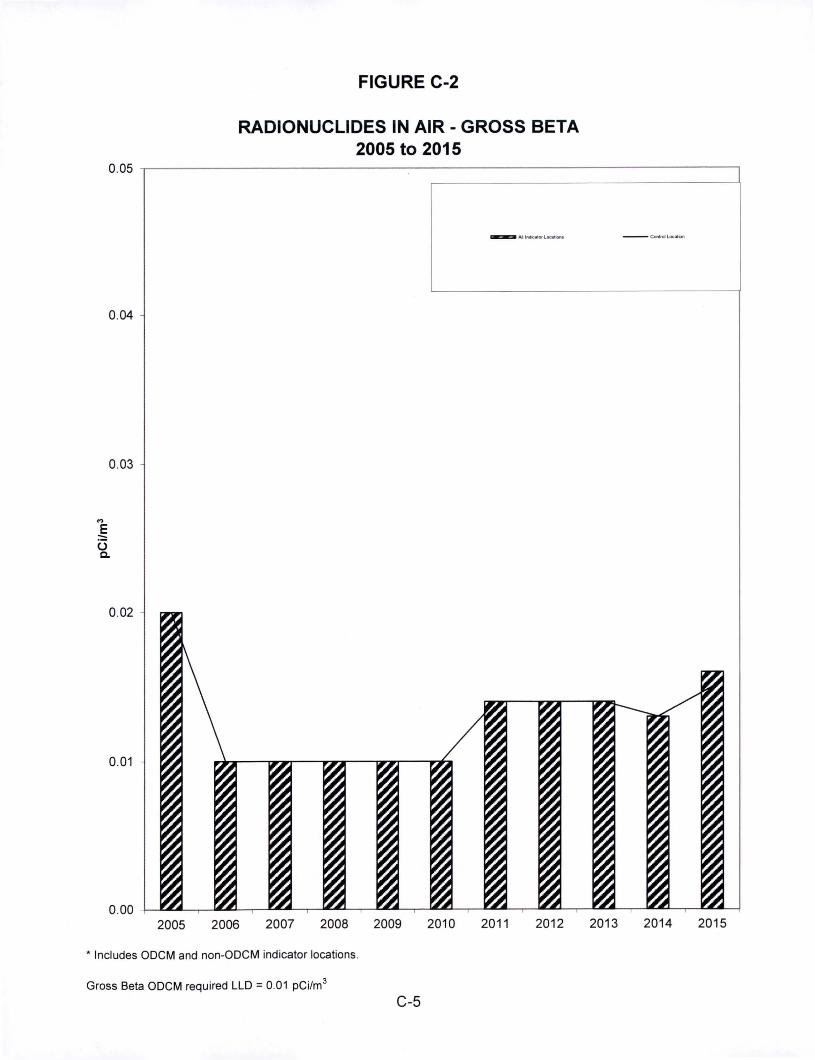
0.04
0.03
1: -0 a.
FIGURE C-2
RADIONUCLIDES IN AIR - GROSS BETA 2005 to 2015
- Con1<al Locarlon
2005 2006 2007 2008 2009 2010 2011 2012 2013 2014 2015
* Includes ODCM and non-ODCM indicator locations.
Gross Beta ODCM requ ired LLD = 0.01 pCi/m3
C-5

TABLE C-3
RADIONUCLIDES IN HUDSON RIVER WATER- TRITIUM 2005 to 2015
(pCi/L)
Tritium (H-3) Cs-137
Year Inlet Discharge Inlet Discharge
2005 <Le 618 <Le <Le
2006 <Le 386 <Le <Le
2007 <Le < Le < Le <Le
2008 < Le <Le <Le <Le
2009 <Le < Le <Le <Le
2010 428 <Le <Le <Le
2011 <Le 661 < Le < Le
2012 <Le . 539 < Le < Le
2013 241 462 < Le < Le
2014 224 253 < Le < Le
2015 188 341 < Le < Le
Historical Average 298 487 < Le < Le 2005-2014
Critical Level (Le) is less than the ODCM required LLD.
<Le indicates no positive values above sample critica l level.
C-6

1800
1600
1400
1200
...J G1ooo a.
800
FIGURE C-3
RADIONUCLIDES IN HUDSON RIVER WATER-TRITIUM 2005 to 2015
• ..i.t(H-3)
2005 2006 2007 2008 2009 2010 2011 2012 2013 2014 2015
Tritium ODCM required LLD = 3000 pCi/L
C-7

TABLE C-4
RADIONUCLIDES IN DRINKING WATER 2005 to 2015
(pCi/L)
Year Tritium (H-3) Cs-137
2005 <Le <Le
2006 <Le <Le
2007 <Le <Le
2008 <Le <Le
2009 <Le <Le
2010 <Le <Le
2011 <Le <Le
2012 < Le < Le
2013 < Le < Le
2014 < Le < Le
2015 < Le < Le
Historical Average < Le < Le
2005-2014 I
Critical Level (Le) is less than the ODCM required LLD.
<Le indicates no positive values above sample critical level.
C-8

1800
1600
1400
1200
...J
61000 c.
800
600
400
200
FIGURE C-4
RADIONUCLIDES IN DRINKING WATER 2005 to 2015
NO IDENTIFIED NUCLIDES IN PREVIOUS TEN YEARS HISTORY
2005 2006 2007 2008 2009 2010 2011 2012 2013 2014 2015
Tritium ODCM required LLD = 2000 pCi/L
C-9

TABLE C-5
RADIONUCLIDES IN SHORELINE SOIL 2005 to 2015 (pCi/Kg, dry)
Cs-134 Cs-137
Year Indicator Control Indicator
2005 <Le <Le 156
2006 <Le <Le 120
2007 <Le <Le 190
2008 <Le <Le 187
2009 <Le <Le 149
2010 <Le <Le 154
2011 < Le < Le 108
2012 < Le < Le 141
2013 < Le < Le 133
2014 < Le < Le 327
2015 < Le < Le 110
Historical Average < Le < Le 167 2005-2014
Critical Level (Le) is less than the RETS required LLD.
<Le indicates no positive values above sample critical level.
C-10
Control
36
<Le
<Le
<Le
<Le
63
< Le
< Le
< Le
< Le
< Le
50

FIGURE C-5
RADIONUCLIDES IN SHORELINE SOIL 2005 to 2015
~ "C
Cl :::.::::
750
650
550
450
~ 350 Q.
250
150
50
-50
-
... , 2005
- -
-
"'" 2006 2007 2008
Cs-134 ODCM required LLD= 150 pCi/Kg, dry Cs-1 37 ODCM requ ired LLD= 175 pCi/Kg , dry
-====:1 lndiealor (C&· 134)
c::::::::::l lndiealor(C.-137)
-- - --
~I / ~""
2009 2010 2011 2012 2013
C-11
c:::::::1 Coo1rol (Ca-134)
- Con11ol(Ca-IJ7)
-
-
2014 2015

TABLE C-6
RADIONUCLIDES IN BROAD LEAF VEGETATION 2005 to 2015 (pCi/Kg, wet)
Cs-137
Year Indicator Control ~
2005 10 <Le
2006 <Le <Le
2007 <Le <Le
2008 <Le <Le
2009 <Le <Le
2010 <Le <Le
2011 31 <Le
2012 <Le < Le
2013 44 < Le
2014 < Le < Le
2015 < Le < Le
Historical Average 28 <Le
2005-2014 I
Critical Level (Le) is less than the ODCM required LLD.
<Le indicates no positive values above sample critical level.
C-12

-(I) ~ C>
::..::: -u c..
80
60
40
FIGURE C-6
BROAD LEAF VEGETATION 2005 to 2015
2005 2006 2007 2008 2009 2010 2011
ODCM required LLD = 80 pCi/Kg , wet
C-13
• ndDtOf {Ca-137) 9:onl1Dl(C•-1l7)
2012 2013 2014 2015

TABLE C-7
FISH AND INVERTEBRATES 2005 to 2015 (pCi/Kg, dry)
Cs-137
Year Indicator Control
2005 <Le <Le
2006 <Le <Le
2007 <Le <Le
2008 <Le <Le
2009 <Le <Le
2010 <Le <Le
2011 <Le <Le
2012 < Le < Le
2013 < Le < Le
2014 < Le < Le
2015 < Le < Le
Historical Average < Le < Le 2005-2014
I
Critical Level (Le) is less than the ODCM required LLD.
<Le indicates no positive values above sample critical level.
C-14

... QI
3:
180
160
140
120
~100 0 Cl.
80
60
40
20
2005 2006 2007
FIGURE C-7
FISH AND INVERTEBRATES 2005 to 2015
NO IDENTIFIED Cs-1 37 IN PREVIOUS TEN YEARS HISTORY
2008 2009 2010 2011 201 2 2013
Cs-137 ODCM required LLD= 150 pCi/Kg, wet
C-15
2014 2015

TABLE C-8
RIVER WATER - Discharge Area - Tritium REMP vs. EFFLUENT
(pCi/liter)
Year REMP* EFFLUENT**
1 Q 2011 661 2192
2Q 2011 < 424 400
3Q 2011 < 412 493
4Q 2011 < 182 389
1Q2102 617 2186
2Q 2012 < 178 394
3Q 2012 < 193 489
4Q 2012 460 860
1Q2103 357 1813
2Q 2013 < 170 223
3Q 2013 < 186 428
4Q 2013 306 896
1Q 2104 <195 952
2Q 2014 253 82
3Q 2014 <189 26
4Q 2014 <157 218
1Q 2015 959 1940
2Q 201 274 241
3Q 2015 <186 350
4Q 2015 341 536
Four Year Average, by 442 897
Quarter, 2011 - 2015
* Sample from mixing zone, expected to be less than average activity in the discharge canal.
** Based upon Effluent Report data, average activity in the discharge canal calculated from the total H-3 discharged divided by the total dilution volume for the quarter.
C-16

TABLE C-9
RADIONUCLIDES IN BOTTOM SEDIMENT 2005 to 2015 (pCi/Kg, dry)
Cs-137
Year Indicator Control
2005 426 < Le
2006 282 95
2007 221 254
2008 239 < Le
2009 493 225
2010 552 < Le
2011 287 238
2012 284 < Le
2013 2738 264
2014 327 < Le
2015 876 < Le
Historical Average 585 215 2005-2014
Critical Level (Le) is less than the RETS required LLD.
<Le indicates no positive values above sample critical level.
C-17

~ "C
C> ~ -u a.
FIGURE C-8
RADIONUCLIDES IN BOTTOM SEDIMENT 2005 to 2015
2800 ~-~:== ... -i----------~ 2600
2400
2200
2000
1800
1600
1400
1200
1000
800
600
400
200
2005 2006 2007 2008 2009 2010 2011 2012 2013 2014 2015
Cs-137 ODCM required LLD= 175 pCi/Kg, dry
C-18

APPENDIX D
INTERLABORATORY COMPARISON PROGRAM

APPENDIX D
INTERLABORATORY COMPARISON PROGRAM
This section presents the results of the interlaboratory comparison program for the Teledyne Brown Engineering Environmental Services and Environmental Dosimetry Company. Since General Engineering Labs only analyzed 2 samples, their interlaboratory data is not presented. However, their results can be provided upon request.
D.1 Program Description - Teledyne Brown Engineering Environmental Services Comparison Programs
The Teledyne Brown Engineering Environmental Services participates in several interlaboratory comparison programs. These programs include sample media for which samples are routinely collected and for which comparison samples are commercially available. Participation in these interlaboratory comparison programs ensure that independent checks on the precision and accuracy of the measurement of radioactive material in the environmental samples are performed as part of the Quality Assurance Program for environmental monitoring. To fulfill the requirement for an lnterlaboratory Comparison Program, Teledyne Brown Engineering Environmental Services has engaged the following programs:
• Eckert & Ziegler Analytics Environmental Radioactivity Cross Check Program • Department of Energy (DOE) Mixed Analyte Performance Evaluation Program
(MAPEP) • Environmental Resource Associates (ERA) Cross Check Program
These programs supply sample media as blind samples (typically spikes) , which contain certified levels of radioactivity unknown to the analysis laboratory. These samples are prepared and analyzed by the Teledyne Brown Engineering Environmental Services using standard laboratory procedures. Each program issues a statistical summary report of the results. Teledyne Brown Engineering Environmental Services uses predetermined acceptance criteria methodology for evaluating its laboratory performance.
Teledyne Brown Engineering Environmental Services also analyzes laboratory blanks. The analysis of laboratory blanks provides a means to detect and measure radioactive contamination of analytical samples. The analysis of analytical blanks also provides information on the adequacy of background subtraction . Laboratory blank results are analyzed using control charts.
D.2 Acceptance Criteria
Each sample result is evaluated to determine the accuracy and precision of the laboratory's analysis result. The sample evaluation method is discussed below.
D-1

D.2.1 Analytics Sample Results Evaluation
Samples provided by Analytics are evaluated using what is specified as the NRC method. This method is based on the calculation of the ratio of results reported by the participating laboratory (QC result) to the Vendor Laboratory Known value (reference result) .
An Environmental Laboratory analytical result is evaluated using the following calculation:
The value for the error resolution is calculated.
Error Resolution = Reference Result Reference Results Error (1 sigma)
Using the appropriate row under the Error Resolution column in Tables D-3.1, D-3.2, and D-3.3, a corresponding Ratio of Agreement interval is given.
The value for the ratio is then calculated .
Ratio of agreement = QC Result Reference Result
If the value falls within the agreement interval , the result is acceptable.
TABLE D-2.1 Ratio of Agreement
ERROR RESOLUTION RATIO OF AGREEMENT <4 No Comparison 4 to 7 0.5-2.0 8 to 15 0.6-1 .66 16 to 50 0.75-1 .33 51 to 200 0.8-1 .25 >200 0.85-1 .18
This acceptance test is generally referred to as the "NRC" method. The acceptance criteria are contained in Procedure EN-CY-102. The NRC method generally results in an acceptance range of approximately ± 25% of the Known value when applied to sample results from the Eckert & Ziegler Analytics lnterlaboratory Comparison Program. This method is used as the procedurally required assessment method and requires the generation of a deviation from QA/QC program report when results are unacceptable.
D.2.2 ERA and MAPEP Sample Result Evaluation
Both these programs supply an acceptance range for evaluating the results.
D.3 Program Results Summary
The lnterlaboratory Comparison Program numerical results are summarized in the following tables.
0-2

TABLE D-3.1 ANALYTICS ENVIRONMENTAL RADIOACTIVITY CROSS CHECK PROGRAM TELEDYNE BROWN ENGINEERING, 2015
(PAGE 1OF2)
Identification Reported Known Ratio (c)
Month/Year Number Matrix Nuclide Units Value (a) Value (b) TBE/Analy!ics Evaluation (d)
March 2015 E11181 Milk Sr-89 pCi/L 88.9 97.2 0.91 A Sr-90 pCi/L 12.2 17.4 0.70 w
E11182 Milk 1-131 pCi/L 61.3 65.1 0.94 A Ce-141 pCi/L 104 113 0.92 A Cr-51 pCi/L 265 276 0.96 A Cs-134 pCi/L 138 154 0.90 A Cs-137 pCi/L 205 207 0.99 A Co-58 pCi/L 178 183 0.97 A Mn-54 pCi/L 187 188 0.99 A Fe-59 pCi/L 182 177 1.03 A Zn-65 pCi/L 345 351 0.98 A Co-60 pCi/L 379 405 0.94 A
E11184 AP Ce-141 pCi 107 85.0 1.26 w Cr-51 pCi 261 224 1.17 A Cs-134 pCi 74.6 77.0 0.97 A Cs-137 pCi 99.6 102 0.98 A Co-58 pCi 99.8 110 0.91 A Mn-54 pCi 99.2 96.9 1.02 A Fe-59 pCi 109 119 0.92 A Zn-65 pCi 188 183 1.03 A Co-60 pCi 200 201 1.00 A
E11183 Charcoal 1-131 pCi 82.9 85.4 0.97 A
E11185 Water Fe-55 pCi/L 1950 1900 1.03 A
June 2015 E11234 Milk Sr-89 pCi/~ 94.9 92.6 1.02 A Sr-90 pCi/L 14.3 12.7 1.13 A
E11238 Milk 1-131 pCi/L 93.2 95.9 0.97 A Ce-141 pCi/L Not provided for this study Cr-51 pCi/L 349 276 1.26 w Cs-134 pCi/L 16!:i 163 1.01 A Cs-137 . pCi/L 143.0 125 1.14 A Co-58 pCi/L 82.0 68.4 1.20 A Mn-54 pCi/L 113 101 1.12 A Fe-59 pCi/L 184 151 1.22 w Zn-65 pCi/L 269 248 1.08 A Co-60 pCi/L 208 193 1.08 A
E11237 AP Ce-141 pCi Not provided for this study Cr-51 pCi 323 233 1.39 N (1) Cs-134 pCi 139 138 1.01 A Cs-137 pCi 111 106 1.05 A Co-58 pCi 54.0 57.8 0.93 A Mn-54 pCi 96.8 84.9 1.14 A Fe-59 pCi 162 128 1.27 w Zn-65 pCi 198 210 0.94 A Co-60 pCi 178 163 1.09 A
E11236 Charcoal 1-131 pCi 93.9 80 1.17 A
D-3

TABLE D-3.1 ANALYTICS ENVIRONMENTAL RADIOACTIVITY CROSS CHECK PROGRAM TELEDYNE BROWN ENGINEERING, 2015
(PAGE20F2)
Identification Reported Known Ratio (c) Month/Year Number Matrix Nuclide Units Value (a) Value (b) TBE/Analy!ics Evaluation (d)
June 2015 E11238 Water Fe-55 pCi/L 1890 1790 1.06
December 2015 E11354 Milk Sr-89 pCi/L 96.2 86.8 1.11 Sr-90 pCi/L 14.8 12.5 1.18
E11355 Milk 1-131 pCi/L 95.1 91.2 1.04 Ce-141 pCi/L 117 129 0.91 Cr-51 pCi/L 265 281 0.94 Cs-134 pCi/L 153 160 0.96 Cs-137 pCi/L 119 115 1.03 Co-58 pCi/L 107 110 0.97 Mn-54 pCi/L 153 145 1.06 Fe-59 pCi/L 117 108 1.08 Zn-65 pCi/L 261 248 1.05 Co-60 pCi/L 212 213 1.00
E11357 AP Ce-141 pCi 89.9 84.0 1.07 Cr-51 pCi 215 184 1.17 Cs-134 pCi 103 105 0.98 Cs-137 pCi 76.6 74.8 1.02 Co-58 pCi 76.2 71.9 1.06 Mn-54 pCi 91.4 94.4 0.97 Fe-59 pCi 78.6 70.3 1.12 Zn-65 pCi 173 162 1.07
' Co-60 pCi 138 139 0.99
E11422 AP Sr-89 pCi 98.0 96.9 1.01 Sr-90 pCi 10.0 14.0 0.71
E11356 Charcoal 1-131 pCi 74.9 75.2 1.00
E11358 Water Fe-55 pCi/L 2160 1710 1.26
E11353 Soil Ce-141 pCi/kg 252 222 1.14 Cr-51 pCi/kg 485 485 1.00 Cs-134 pCi/kg 319 277 1.15 Cs-137 pCi/kg 292 276 1.06 Co-58 pCi/kg 193 190 1.02 Mn-54 pCi/kg 258 250 1.03 Fe-59 pCi/kg 218 186 1.17 Zn-65 pCi/kg 457 429 1.07 Co-60 pCi/kg 381 368 1.04
(1) AP Cr-51 - Cr-51 has the shortest half-life and the weakest gamma energy of the mixed nuclide sample, which produces a large error. Taking
into account the error. the lowest value would be 119% of the reference value, which would be considered acceptable. NCR 15-18
(a) Teledyne Brown Engineering reported result.
(b) The Analytics known value is equal to 100% of the parameter present in the standard as determined by gravimetric and/or
volumetric measurements made during standard preparation.
(c) Ratio of Teledyne Brown Engineering to Analytics results.
(d) Analytics evaluation based on TBE internal QC limits: A= Acceptable, reported result falls within ratio limits of0.80-1.20.
W-Acceptable with warning, reported result falls within 0. 70-0.80or1.20-1.30. N =Not Acceptable, reported
result falls outside the ratio limits of< 0. 70 and> 1.30.
D-4
A
A A
A A A A A A A A A A
A A A A A A A A A
A w
A
w
A A A A A A A A A

TABLE D-3.2 DOE'S MIXED ANAL YTE PERFORMANCE EVALUATION PROGRAM (MAPEP) TELEDYNE BROWN ENGINEERING, 2015
{PAGE 1OF1)
Identification Reported Known Acceptance Month/Year Number '"" Media Nuclide* Units Value (a) Value (b) Range Evaluation (c)
March 2015 15-MaW32 Water Am-241 Sq/L 0.632 0.654 0.458 - 0.850 A Ni-63 Sq/L 2.5 (1) A Pu-238 Sq/L 0.0204 0.0089 (2) A Pu-239/240 Sq/L 0.9 0.8 0.582 - 1.082 A
15-MaS32 Soil Ni-63 Sq/kg 392 448.0 314 - 582 A Sr-90 Sq/kg 286 653 487 -849 N (3)
15-RdF32 AP Sr-90 Sq/sample -0.0991 (1) A U-234/233 Sq/sample 0.0211 0.0155 0.0109 - 0.0202 N (3) U-238 Sq/sample 0.095 0.099 0.069 - 0.129 A
15-GrF32 AP Gr-A Sq/sample 0.448 1.77 0.53 - 3.01 N (3) Gr-S Sq/sample 0.7580 0.75 0.38 - 1.13 A
15-RdV32 Vegetation Cs-134 Sq/sample 8.08 7.32 5.12 - 9.52 A Cs-137 Sq/sample 11.6 9.18 6.43-11.93 w Co-57 Sq/sample -0.0096 (1) A Co-60 . Sq/sample 6.53 5.55 3.89 - 7.22 A Mn-54 Sq/sample 0.0058 (1) A Sr-90 Sq/sample 0.999 1.08 0.76 -1.40 A Zn-65 Sq/sample -0.108 (1) A
September 2015 15-MaW33 Water Am-241 Sq/L 1.012 1.055 0.739 - 1.372 A Ni-63 Sq/L 11.8 8.55 5.99-11.12 N (4) Pu-238 Sq/L 0.727 0.681 0.477 - 0.885 A Pu-239/240 Sq/L 0.830 0.900 0.630-1.170 A
15-MaS33 Soil Ni-63 Sq/kg 635 682 477 -887 A Sr-90 Sq/kg 429 425 298-553 A
15-RdF33 AP Sr-90 Sq/sample 1.48 2.18 1.53 - 2.83 N (4) U-234/233 Sq/sample 0.143- 0.143 0.100- 0.186 A U-238 Sq/sample 0.149 0.148 0.104- 0.192 A
15-GrF33 AP Gr-A Sq/sample 0.497 0.90 0.27 -1.53 A Gr-S Sq/sample 1.34 1.56 0.78 - 2.34 A
15-RdV33 Vegetation Cs-134 Sq/sample 6.10 5.80 4.06- 7.54 A Cs-137 Sq/sample 0.0002 (1) A Co-57 Sq/sample 8.01 6.62 4.63 - 8.61 w Co-60 . Sq/sample 4.97 4.56 3.19-5.93 A Mn-54 Sq/sample 8.33 7.68 5.38-9.98 A Sr-90 Sq/sample 0.386 1.30 0.91 -1.69 N (4)
(1) False positive test. Zn-65 Sq/sample 6.07 5.46 3.82-7.10 A (2) Sensit(vity evaluation.
(3) Soil Sr-90 - incomplete digestion of the sample resulted in low results; AP U-2341233 - extremely low activity was difficult to quantify
AP Gr-A - the MAPEP filter has the activity embedded in the filter. To corrected the low bias, TBE will create an attenuated efficiency tor
MAPEP samples. NCR 15-13
(4) Water Ni-63 extremely low activity was difficult to quantify; AP & Vegetation Sr-90 was lost during separation, possible from substance added by MAPEP NCR 15-21.
(a) Teledyne Brown Engineering reported result.
(b) The MAPEP known value is equal to 100% of the parameter present in the standard as determined by gravimetric and/or
volumetric measurements made during standard preparation.
(c) DOEIMAPEP evaluation: A=acceptable, W=acceptable with warning, N=not acceptable.
D-5

TABLE D-3.3 ERA ENVIRONMENTAL RADIOACTIVITY CROSS CHECK PROGRAM TELEDYNE BROWN ENGINEERING, 2015
(PAGE 1OF1)
Identification Reported Known Acceptance MonthNear Number Media Nuclide Units Value (a) Value (b) Limits
May 2015 RAD-101 Water Sr-89 pCi/L 45.2 63.2 51.1 - 71.2 Sr-90 pCi/L 28.0 41.9 30.8 -48.1 Ba-133 pCi/L 80.6 82.5 63.9 - 90.8 Cs-134 pCi/L 71.7 75.7 61.8 - 83.3 Cs-137 pCi/L 187 189 170 - 210 Co-60 pCi/L 85.7 84.5 76.0- 95.3 Zn-65 pCi/L 197 203 183 - 238 Gr-A pCi/L 26.1 42.6 22.1 - 54.0 Gr-B pCi/L 28.8 32.9 21.3 - 40.6 1-131 pCi/L 23.5 23.8 19.7 - 28.3 U-Nat pCi/L 6.19 6.59 4.99.- 7.83 H-3 pCi/L 3145 3280 2770-3620
MRAD-22 Filter Gr-A pCi/filter 28.3 62.2 20.8- 96.6
September 2015 RAD-103 Water Sr-89 pCi/L 40.9 35.7 26.7 -42.5 Sr-90 pCi/L 29.3 31.1 22.7 - 36.1 Ba-133 pCi/L 31.5 32.5 25.9- 36.7 Cs-134 pCi/L 59.65 62.3 50.6 - 68.5 Cs-137 pCi/L 156 157 141 - 175 Co-60 pCi/L 70.6 71.1 64.0- 80.7 Zn-65 pCi/L 145 126 113 - 149 Gr-A pCi/L 38.2 51.6 26.9 - 64.7 Gr-B pCi/L 42.0 36.6 24.1 - 44.2 1-131 pCi/L 24.8 26.3 21.9-31.0 U-Nat pCi/L 146.90 56.2 45.7 -'62.4 H-3 pCi/L 21100 21300 18700 - 23400
MRAD-23 Filter Gr-A pCi/filter Lost during processing
(1) Yield on the high side of our acceptance range indicates possibility of calcium interference. NCR 15-09
(2) Technician failed to dilute original sample. If dilulted, the result would have been 57.1, which fell within the acceptance limits. NCR 15-19
(a) Teledyne Brown Engineering reported result.
(b) The ERA known value is equal to 100% of the parameter present in the standard as determined by gravimetric and/or
volumetric measurements made during standard preparation.
(c) ERA evaluation: A=acceptable. Reported result falls within the Warning Limits. NA=not acceptable. Reported result falls
outside of the Control Limits. CE=check for Error. Reported result falls within the Control Limits and outside of the Warning Limit.
D-6
Evaluation (c)
N (1) N(1)
A A A A A A A A A A
A
A A A A A A A A A A
N (2)
A /

D.4 Environmental TLD Quality Assurance
Environmental dosimetry services for the reporting period of January - December, 2015 were provided by the Environmental Dosimetry Company (EDC) , Sterling , Massachusetts. The TLD systems at the Environmental Dosimetry Company (EDC) are calibrated and operated to ensure consistent and accurate evaluation of TLDs. The quality of the dosimetric results reported to EDC clients is ensured by in house performance testing and independent performance testing by EDC clients.
The purpose of the dosimetry quality assurance program is to provide performance documentation of the routine processing of EDC dosimeters. Performance testing provides a statistical measure of the bias and precision of dosimetry processing against a reliable standard , which in turn points out any trends or performance changes. Dosimetry quality control tests are performed on EDC Panasonic 814 Environmental dosimeters. These tests include: (1) the in house testing program conducted by the EDC QA Officer and (2) independent test perform by EDC clients.
Excluded from this report are instrumentation checks. Although instrumentation checks represent an important aspect of the quality assurance program, they are not included as process checks in this report. Instrumentation checks represent between 5-10% of the TLDs processed.
Table D-4.1 provides a summary of individual dosimeter results evaluated against the EDC internal acceptance criteria for high-energy photons (Cs-137) only. The internal acceptance (tolerance) criteria for the Panasonic Environmental dosimeters are: ± 15% for bias and ± 12.8% for precision. During this period, 100% (72/72) of the individual dosimeters, evaluated against these criteria met the tolerance limits for accuracy and 100% (72/72) met the criterion for precision.
Table D-4.2 provides the Bias+ Standard deviation results for each group (N=6) of dosimeters evaluated against the internal tolerance criteria. Overall , 100% (12/12) of the dosimeter sets evaluated against the internal tolerance performance criteria met these criteria .
Table D-4.3 presents the independent blind spike results for irradiated dosimeters provided by client utilities during this annual period . All results passed the performance acceptance criterion.
TABLE D-4.1
PERCENTAGE OF INDIVIDUAL DOSIMETERS THAT PASSED EDC INTERNAL CRITERIA JANUARY - DECEMBER 2015 (1>. (2)
Dosimeter Type Number
% Passed Bias Criteria Tested
Pa nasonic Environmental 72 100
(l)This table summarizes results of tests conducted by EDC. (ZlEnvironmenta l dosimet er results are free in air.
D-7
% Passed Precision Criteria
100

TABLE D-4.2
MEAN DOSIMETER ANALYSES (N=G) JANUARY- DECEMBER 201511>· 12>
Process Date Mean Bias% Standard Tolerance
Deviation% Limit +/-15%
4/16/2015 55 4.5 Pass
4/28/2015 91 2.7 Pass
5/07/2015 48 0.3 Pass
7/22/2015 28 1.5 Pass
7/24/2015 106 2.9 Pass
8/06/2015 -77 -3.3 Pass
10/30/2015 28 3.7 Pass
11/04/2015 63 2.5 Pass
11/22/2015 85 -2.9 Pass
1/27/2016 61 3.1 Pass 1/31/2016 112 2.2 Pass 2/05/2016 36 3.2 Pass
(l JThis table summarizes results of tests conducted by EDC for TLDs issued in 2015. tiJEnvironmental dosimeter results are free in air.
TABLE D-4.3 SUMMARY OF INDEPENDENT DOSIMETER TESTING
JANUARY - DECEMBER 201511>· 12>
Issuance Period Client
1st Qtr. 2015 Millstone 2nd Qtr.2015 Millstone 2nd Qtr.2015 Seabrook 3rd Qtr. 2015 Millstone 4th Qtr.2015 Millstone 4th Qtr.2015 Seabrook
(lJPerformance criteria are+/- 30%. tzJ Blind spike irradiations using Cs-137
Mean Bias% Standard
Deviation%
-6.5 2.9 -2.2 3.7 1.4 0.9 -3.4 1.1 -1.5 2.3 0.8 1.8
0-8
Pass I Fail
Pass Pass Pass Pass Pass Pass