indian nations as interest groups: tribal motivations for contributions...
TRANSCRIPT
1
Indian Nations as Interest Groups: Tribal Motivations for Contributions to U.S. Senators
Frederick J. Boehmke University of Iowa
Richard Witmer
Creighton University
April 21, 2010
Correspondence: [email protected], [email protected]. The authors would like to thank Jenn Haas for her assistance gathering data used in this project.
2
Indian Nations as Interest Groups: Tribal Motivations for Contributions to U.S. Senators
Abstract
The expansion of Indian Gaming has produced significant financial gains for Indian nations across the United States. In response to this influx of revenue, tribes have expanded their political activity, particularly in those areas that are heavily resource dependent. In this paper we argue that adopting an organized interests perspective enhances our understanding of tribal political activity. To demonstrate this, we study Indian gaming contributions received by Senators from 1990 to 2004. We apply broadly utilized theories of contribution patterns based on the value of access for a group and the cost of access to a member, focusing on ideology, access, electoral security, and constituency characteristics. Our results indicate that tribes respond to all of these factors in ways similar to more traditional organized interests.

3
Introduction
Since the passage of the Indian Gaming Regulatory Act in 1988, the Indian Gaming industry has
emerged by 2008 as a twenty-six billion dollar a year industry.1 The resulting opportunity for
greater financial resources for over two hundred Indian nations with gaming agreements has
provided a new opportunity for Native Americans to influence government policies at the state
and national level. Yet little is known about how Indian nations have utilized these newly
available resources in pursuit of political objectives. In this paper we argue that we can increase
our understanding of the motivations for tribal political expenditures in two ways. First, we apply
modified theories of political incorporation and resource mobilization to understand the context
of Indian political participation (Witmer and Boehmke 2007). Second, we evaluate this
perspective by applying to tribal nations theories developed to explain patterns of contributions
to members of Congress by organized interest groups (e.g., Grier and Munger 1993).
As scholars before us have noted, Indian nations are intriguing political actors as they can
act as both sovereign nations and as interest groups when interacting with government officials
(e.g., Mason 2000; Wilkins 1999). In addition, Indian nations are headed by elected leaders who
represent the interests of members of the tribe. This is especially important when dealing with
off-reservation actors including federal, state and local governments. While working with off
reservation officials, tribal leaders seek to influence the policy process in a number of different
ways including the provision of information, contributions to office-seekers, and the
mobilization of Indian voters (Witmer and Boehmke 2007).
While gaming is a relatively new issue among more traditional concerns for Indian
nations, the potential to address these issues via lobbying and campaign contributions has greatly
increased over the same time period. Thus unlike earlier eras of American Indian involvement in
national politics, which were marked by limited resource availability, the current era represents a

4
significant departure, suggesting that new approaches may be necessary to fully understand the
current patterns of participation. Most useful for this study is a modified political incorporation
perspective according to which tribes and American Indian organizations have moved beyond an
approach that seeks to have members of the group win elections or serve in appointed positions
(Browning, Marshall and Tabb 1984, 1986, 1997; Warren 1997, Hero 1992). Instead, a number
of Indian nations have utilized resources now available following the advent of Indian gaming, to
pursue an interest group strategy (Witmer and Boehmke 2007, Mason 2000, Wilkins 1999). This
increased participation is fairly widespread, with over 100 different tribes engaging in lobbying
or making campaign contributions at the Federal level just in 2000. At the same time, there exists
a tension between focusing on Indian nations’ sovereign rights and distinct cultures and viewing
them solely through the relatively narrow lens of organized interests in the American political
system.
While an emerging literature has utilized the organized interests perspective to study
political activity by Indian nations, particularly for political expenditures (e.g., Skopek,
Engstrom and Hansen 2005; Witmer and Boehmke 2007), we believe that it is still underused as
previous studies rarely explicitly evaluate its effectiveness for understanding tribal activities. In
this paper we explore the value of this perspective in more detail by conducting regression
analysis to study Indian nations’ campaign contributions to all United States Senators since the
passage of IGRA in 1988 until 2004. In particular, we rely on a well-established literature on the
factors that help determine contributions by organized interests to provide a theoretically-
motivated set of explanatory variables, including Senators’ institutional standing, ideology,
electoral prospects and constituency. We then directly compare our results to those for the more
traditional interests examined in prior work, such as businesses and labor unions.
5
Our results indicate that Indian nations’ contributions respond to most of these factors in
much the same way as do contributions from other interests while also reflecting the role of their
Native constituency. These findings reinforce the value of combining existing, general theories
of organized interests’ behavior while also considering American Indian Nations’ unique
position in the American political system. Before discussing the literature on campaign
contribution strategies and examining the pattern of contributions from Indian nations, however,
we first discuss the politics and economics of the Indian gaming industry and different
perspectives on tribal nation’s political participation.
Indian Gaming and Indian Nations in the American Political System
In the 1980’s high stakes bingo and other forms of gaming emerged as an alternative for
cash poor Indian nations looking to pursue economic self-sufficiency. Yet states, including
Florida and California, sought to step in and prohibit Indian gaming operations that went counter
to state law. On the heels of the 1981 Supreme Court ruling in Seminole Tribe of Florida v
Butterworth (658 F.2d 310 [1981]), the Court’s decision in California v. Cabazon Band of
Indians (480 U.S. 202 [1987]) confirmed that the state of California, and other states including
Florida, could not prohibit Indian nations from operating gaming businesses on Indian
reservations that were regulated off reservation by the state. The Court did allow for the
regulation of tribal gaming, but placed those decisions in the hands of Congress. A compromise
between American Indians and the states was reached in 1988 when Congress passed the Indian
Gaming Regulatory Act.2 With IGRA, tribes and states were compelled to negotiate gaming
compact in good faith or the federal government would step in and issue a decision on gaming
within a reservation.

6
As a result, since the passage of IGRA, the emergence of Indian gaming has put pressure
on state governments to work with Indian nations to negotiate the type and amount of gaming
within states (Boehmke and Witmer 2004; Rand and Light 2006). Consequently, Indian nations
have a financial incentive to become involved with the policy process as gaming negotiations
and federal regulation greatly impact their economic self-sufficiency (Skopek, Engstrom and
Hansen 2005). In fact, by 2008 the National Indian Gaming Commission reported that tribal
gaming revenue exceeded $26.7 billion. The number of tribal gaming operations that year
exceeded 400, with the top 122 operations bringing in 83% of total revenues (nigc.org).
There also remains an underlying conflict between federal and state control and self-
determination in the area of Indian gaming (Corntassel and Witmer 2008, Light and Rand 2005;
Smith 2000). As a result of this conflict and confusion, Indian nations have an incentive to both
clarify existing regulations and influence future decisions regarding Indian policy. As noted
earlier, tribal governments are well suited to represent the collective interests of their members in
non-tribal policy decisions.
The evolution and success of compacting in this new era of Indian-state relations has led
to broad changes for Native Americans including increased awareness of the need to engage in
the political process (Cornell, Kalt, Krepps and Taylor 1998; Light and Rand 2005; National
Gambling Impact Study Commission 1999; McCulloch 1994).3 Further, the revenues obtained
from Indian gaming have led to the emergence of Indian nations as important political actors in
state and national politics. Corntassel and Witmer (2008) study the effect of this post-IGRA era,
noting that gaming has ushered in an era of Forced Federalism, which has lead to an increase in
the electoral participation of American Indians. Importantly, their surveys of Indian tribal
leaders suggest that gaming and sovereignty issues are central to tribal support of candidates.
7
This contrasts with prior studies of American Indian political participation, which have
traditionally focused on three areas: Indian activism, including protest activity and civil
disobedience, legal challenges to existing law, and electoral mobilization (Corntassel and
Witmer 1997). Far fewer studies have examined the efforts of Indians and Indian organizations
to lobby Congress on important Indian issues, although Cornell (1988) provides numerous
examples of Indian efforts. Wilkins (1999), in a discussion of the Navajo Nation, also addresses
the role of Indian nations as interest groups, noting that “tribes themselves have over the years
been active in pushing – as interest groups – to protect or enhance their treaty rights, land rights,
resource rights and civil and political rights” (p. 162).
Of the research on Indian political involvement, little examines efforts to influence
political decision-making through the use of campaign contributions.4 There are two reasons for
this. First, research on the political participation of groups in society has often focused on blacks
and Latinos, while the political mobilization of Indian Nations and Indian organizations are often
not examined (see for example Browning, Marshall and Tabb 1984, 1986, 1997,Bobo and
Gilliam 1990, Warren 1997, Hero 1992).5
Second, Indian nations often lacked the resources necessary to become active in the
political process (Cornell 1988; Corntassel and Witmer 2008; Nagel 1997, Witmer and Boehmke
2007). As a result, there were limited opportunities for Indian nations and Indian organizations
to influence the decision-making of individual members through campaign contributions. It is
our contention that we can gain leverage on the surge in Indian nations’ participation by noting
that Indian nations are incorporating into the political process in ways much different than racial
or ethnic groups in society. Namely, they have been less successful than Blacks or Latinos in
winning non-tribal elections or gaining appointment to positions of influence (Witmer and
Boehmke 2007). In addition, the lack of resources that has often been cited as a primary reason
8
for limited support of office-holders (Cornell 1988, Nagel 1997, Nagel 1982, Gross 1989) is no
longer applicable for dozens, perhaps even over 100, tribes, as we noted earlier
As a result, the evolution of our theoretical understanding of Indian nations in the post-
IGRA era compels us to consider and test theories of organized interests as they apply to Indian
nations. Moreover, this approach is consistent with an emerging line of research that focuses on
political expenditures by Indian nations (e.g., Skopek, Engstrom, and Hansen 2005; Skopek and
Hansen 2006; Witmer and Boehmke 2007), though we extend this work by explicitly comparing
our results to those in the interest group literature. Finally, we view the use of an organized
interest approach as consistent with a political incorporation argument (Witmer and Boehmke
2007) as tribes are faced with a limited set of options. They can either abstain, as a number of
tribes do for cultural or financial reasons, they can seek an alternative means of political
incorporation by utilizing an interest group strategy as we suggest, or they can participating
politically in more traditional ways including activism, the courts, and electoral mobilization
(Corntassel and Witmer 1997). We believe an interest group strategy is a useful alternative for
tribes with resources as it allows them to more directly participate in the policy process. In the
next section we discuss theories of campaign contributions by organized interests, which will
serve as the foundation for our subsequent analysis of contributions by Indian nations.
Interest Group Activity and Campaign Contributions
While there are many different methods through which interest groups attempt to
influence political outcomes, one of the more important ways is through campaign contributions,
which can only be made through associated political action committees (PACs) or independently
by members. While the costs of administering a PAC and raising money to donate to candidates
keep many groups away (Gais 1996), about 25% of interests that lobby the government have

9
associated PACs. For PACs, the primary means of influence is to make contributions to
candidates for federal elected offices. During the 1997-1998 election cycle for example, total
PAC contributions to Congress were $220 million, representing 32% of House campaign
expenditures and 17% of Senate campaign expenditures (Nownes 2001). PAC contributions have
been of particular interest since many people are concerned about the importance of money in
politics and the perception of corruption that it may create. Perhaps for this reason, there is a
large literature on lobbying and the effects of PAC contributions on legislators’ votes and
decisions. Yet the findings regarding the effect of money on votes can best be described as
mixed (see Baumgartner and Leech (1998) for an overview).
A related literature has emerged in the last two decades that studies aggregate PAC
giving for different industries and classes of organized interests in order to understand broad
motivations behind campaign contributions to different legislators (e.g., Box-Steffensmeier and
Grant 1999; Brunell 2005; Cox and Magar 2000; Gopoian, Smith, and Smith 1984; Grenzke
1989; Grier and Munger 1993; Grier, Munger, and Roberts 1994; Mitchell, Hansen, and Jepsen
1997; Stratmann 2002; Wilcox 1989). The theoretical basis behind much of the literature starts
with models of legislative behavior that incorporate the ability of groups to make contributions to
legislators with hope of influencing that behavior. Denzau and Munger (1986), for example, set
up a formal model in which legislators must balance their actions in order to satisfy their
constituents’ demands, but must also raise money to help win reelection. Organized interests
make their contributions in response to these decisions, responding to the needs and abilities of
legislators so as to accomplish their policy goals for the smallest amount of money. In short,
then, groups provide contributions to those legislators positioned to provide services at the
lowest price. This price depends on a number of characteristics of a legislator, including the
compatability of the group’s goals with those of the legislator’s constituency, the legislator’s
10
committee assignments (see also Grier and Munger 1991), seniority, electoral need, and majority
status (Cox and Magar 1999).
Based on their arguments and the subsequent empirical literature that tests patterns of
contributions by business, labor, and other sets of organized interests, we group these various
considerations into three broad categories and test them in the context of tribal contributions:
electoral considerations, institutional considerations, and ideological considerations. We discuss
each of these in turn, highlighting findings from empirical studies of more traditional interests
and discussing how Native American interests may respond.
First, consider electoral considerations. As Grier and Munger (1986) note, legislators
facing potentially close elections will likely need to raise more money and will therefore be more
receptive to campaign contributions. In practice, this means that contributions flow to
incumbents facing tough elections.6 Previous studies have consistently found that legislators with
tighter electoral margins receive more contributions than secure legislators (Box-Steffensmeier
and Grant 1999; Cox and Magar 2000; Grier and Munger 1993; Stratmann 2002). If tribes
similarly make contributions in order affect electoral outcomes, then they should focus on races
that will maximize the effect of their scarce resources. Our first hypothesis is therefore that
Senators facing more competitive races receive more contributions from Indian nations than their
more secure colleagues.
Second, groups also make contributions in order to support their general ideological
goals. Ideology has, not surprisingly, consistently emerged as an important determinant of
contribution patterns in the literature, including the studies cited above. More recently, Wand
(2007) finds that partisanship has played an increasing role in allocation decisions. Groups with
explicit ideological motivations are obviously more likely to give to candidates that they feel will
11
further their political agenda. For example, Grier and Munger (1993) find that partisanship has a
greater effect for labor unions than for corporate interests.
Given the broad set of issues that confront Indian nations, tribal contributions are likely
to depend more on where parties stand on issues of importance than on an explicitly ideological
agenda. We do suspect that differences between the two major parties in the last half century,
however, have led tribes to align more closely with Democrats. In particular, the current era
follows a long history in the post World War II period during which Senators emerged as leaders
in the termination era of the late 1940’s and 1950’s. Despite this, the relationship between party
and Indian support is not absolute, as Republican President Nixon took the lead on Indian issues
in the late 1960’s and early 1970’s. Support from Republicans was short lived, though, as
proposals for deep budget cuts to Indian programs emerged during the administration of former
Republican President Ronald Reagan. In subsequent years, opposition to Indian concerns by
leading Republican Senators such as Slade Gorton have met with much opposition from Indian
groups and their supporters. At the same time, leading Senate Republicans like Ben Nighthorse
Campbell and John McCain have been more sympathetic to Indian issues. Conversely, the
administrations of Democratic Presidents Kennedy, Johnson and Clinton, as well as Senate
Democrats, have generally made greater efforts to include Indian interests in their discussion of
policy issues. Thus since tribes may see benefits from supporting members of either party –
perhaps at different times or for different issues – our second hypothesis is merely that ideology
is an important determination of Indian contributions, though we suspect a general preference for
Democratic lawmakers.7
Third, interest groups give money in order to secure access to relevant decision makers.
The value and cost of access is the central part of Grier and Munger’s theory. Groups interested
in policy change or in blocking policy change will seek out influence through legislators that
12
offer the greatest return on their contributions. Rather than attempting to influence floor votes,
which can be costly given the great number of legislators that may have to be persuaded in order
to secure a majority, groups strategically target a small number of well-placed legislators who
have the ability to shape proposals, whether during the agenda setting or committee stages.
Given the ability of individual legislators to insert or delete key clauses or to use institutional
power to stall or push legislation, the return on contributions for access is likely greater that the
return on contributions for votes (see also Hall and Wayman 1990). Studies examining the effect
of contributions on access are much more consistent in their findings than those that study vote
decisions. Hall and Wayman (1990) find that groups that give more are able to secure greater
access while Wright (1990) finds that committee members that receive a greater number of
contributions are lobbied by a greater number of groups but do not vote differently than other
committee members, suggesting that contributions may help groups get through the door to
engage in direct lobbying but do not directly buy votes.
The value of access depends on many characteristics related to the ability of legislators to
effectively work on groups’ behalf. Majority party status increases legislators’ ability to control
committee proceedings and influence the agenda. Cox and Magar (2000) find that when control
of the House of Representatives shifted to Republicans in 1994, receipts from business PACs
increased by thirty-six thousand dollars; labor PACs appeared to value partisanship more than
majority party status, however, as their contributions to Republicans decreased, if anything. Party
leadership positions (Grenzke 1989) and seniority (Grier and Munger 1993) also allow
legislators to wield greater influence. Finally, membership on important committees also
increases influence for groups interested in the relevant policy area (Box-Steffensmeier and
Grant 1999; Endersby and Munger 1992; Gopoian, Smith, and Smith 1984; Grier and Munger
1993; Stratmann 2002). We expect that tribes will respond similarly to these characteristics.
13
Further, given the context of Federal Indian policy, we expect that tribes will in particular value
access to members of the Committee on Indian Affairs. This committee is charged with
overseeing Federal Indian policy and as a result its members have a critical hand in making
relevant policy. Our third hypothesis is therefore that Indian contributions flow to Senators that
hold important institutional positions.
The final piece of the process is the cost to legislators of delivering for the contributing
group. This ability depends on the extent to which a legislators’ interests mesh with those of the
group – when concordance is great, contributions will be more effective and action will come at
a lower price. Legislator interests may be measured by shared ideological goals, but also depend
more broadly on constituency characteristics. For example, agricultural PACs give more to
members of Congress that have larger proportions of farm land in their districts (Van Doren,
Hoag, and Field 1999). In the context of tribal interests, then, our fourth hypothesis is that
contributions will flow to Senators with greater Native American populations and more Federally
recognized tribes in their states as well as to those with a greater number of tribal gaming
enterprises in their states.
While the theoretical perspective developed by Grier and Munger (1986) and extended by
others as described above is intended to be general in its scope, different types of groups will
emphasize different strategies and value different approaches to achieving their policy goals. For
example, Grier and Munger (1993) explore similar motivations and find that party and ideology
are the only common determinants of receipts for Senators from corporations, labor unions and
trade associations. Only labor unions’ decisions appear to be motivated by electoral concerns.
Cox and Magar (2000) find that the 1994 change in majority party status influences contributions
from business PACs and not labor PACs whereas changes in voting record influence labor and
not business PACs. Differences also exist within broad classes of groups: Endersby and Munger
14
(1992) find that labor unions with different interests target committees appropriate to those
interests. Scholars applying this theoretical perspective to more narrow interests have also found
broadly similar results once the key concepts have been appropriately measured in the context of
those interests, e.g., the auto industry (Hersch and McDougall 2000), the savings and loan
industry (Bennett and Loucks 1994), and agricultural PACs (Van Doren, Hoag, and Field 1999).
We therefore expect Indian nations to respond in similar fashion, despite the complexity
of the interests that they represent. With the rise of gaming, they may have taken on behavior
similar to other business groups. Yet given their position as representatives of tribal members,
they may be influenced more by traditional Native American concerns. In fact, Wilkins (2002)
notes that Indian interest groups may display elements of both a sovereign nation and an ethnic
group depending on the issue. This fits with surveys of tribal leaders who suggest that a variety
of issues, not just gaming, are important considerations when they consider supporting a
candidate for office (Corntassel and Witmer 2008). In the next sections we investigate these
issues using data on contributions to Senators and appropriate measures for our four hypotheses
regarding patterns of contributions by Indian gaming interests.
Contributions and Senate Data
In order to test which factors influence Indian nations’ contribution decisions, we
gathered data on the amount of contributions received by Senators in each election cycle starting
with 1989-1990 and ending with 2005-2006. These data are available from the Center for
Responsive Politics website (http://www.opensecrets.org). Since the Senate has constitutional
ties to Indian policy from the treaty-making era and has traditionally taken a lead on most
legislation that affects Native Americans, its members are the focus of our study. Additionally,
tribes are particularly interested in Senate revisions to IGRA, which are likely to emanate from
15
the Committee on Indian Affairs, making it a natural starting point for studying campaign
contributions. In contrast, the House of Representatives has no standing committee that deals
specifically with Indian affairs making it difficult to compare the two legislative bodies.
Under current FEC regulations, Indian Nations are treated as “individuals” for the
purposes of making contributions (FEC Advisory Opinion 2000-05), meaning that they are
subject to different limitations than PACs and do not have to bear the costs of administering a
PAC.8 This means that it is relatively straightforward for a tribe to make a contribution and that
we do not have to worry about whether tribes have formed PACs to make contributions. The data
therefore represent all contributions made by the tribe or by members of the tribe. Also of
interest is that since the 2000 election, the bulk of those contributions have shifted from
individual donors to tribal PACs, although this does not affect our analysis.
Working with data aggregated by Senator, while common in the literature, does not allow
us to directly test the relationship between the characteristics of individual tribes and the
Senators to which they contribute, thereby limiting our ability to directly address the motivations
that Indian nations have for making contributions. By studying the characteristics of the Senators
that receive them, though, we can begin to draw some conclusions about the objectives of the
contributors and, more importantly, follow the well established methodology in the literature to
which we compare patterns of tribal contributions.9 We return to this issue in the conclusion.
To put these data in context, there has been strong growth in contributions from Indian
nations both over time and relative to other industries. In 2004, for example, Indian gaming
interests contributed almost $7.5 million in PAC, individual contributions and soft money to
candidates for federal office.10 This amount represents 66% of all contributions by the gaming
industry and is also a marked increase from previous years: Indian gaming represented 20% of
all gaming industry contributions in 1994. While a relatively large portion of these contributions
16
was in soft money ($2.5 million in 2002), tribes quickly shifted to individual and PAC
contributions after soft money was banned by the Bipartisan Campaign Reform Act of 2002.
Finally, total contributions from one Indian nation (the Pequot at over half a million dollars)
were greater than those from Pepsi, Accenture, NARAL, Planned Parenthood and the Chamber
of Commerce in 1998 and 2000.11
[Figure 1 here.]
Figure 1 presents the total amount of Indian gaming contributions (in nominal dollars) to
incumbent Senators over the period of interest, 1989-2006, broken down by party affiliation.
Over time, there is a dramatic increase in contributions, mirroring the expansion of gaming
among Indian nations (Boehmke and Witmer 2004). In every year except 1998, there is also a
strong partisan bias with Democrats receiving between two and three times as much money as
Republicans.
[Table 1 here.]
To test our four hypotheses we include a number of measures of each Senator’s
attributes.12 First, we test whether tribes are motivated by electoral incentives. To capture
incumbent vulnerability, we use the competitiveness rating from Cook’s Call. One advantage of
this measure is that is based on forecasts that occur months before the actual election, which
helps break the possible endogenous relationship between contributions and subsequent electoral
success. Incumbent Senators receive ratings on a seven point scale, ranging from a solid
Democratic set to a solid Republican seat, with toss-up as the middle category. We create a
variable, Cook’s Call Close, that is coded one when the seat is rated in the Toss-Up or Leaning
categories and zero otherwise.13 Our hypothesis predicts a positive coefficient for Cook’s Call if
Indian groups are giving to influence election outcomes. Unfortunately, we were unable to obtain

17
data on this measure prior to 1998 and in 2000, so we generate regression results both with and
without this variable. The results are largely unaffected by this restriction.14
Our second hypothesis focuses on group’s potential desire to further an ideological
agenda. We assess the relative importance of ideological motivations by testing whether giving is
influenced by a Senator’s party membership. We therefore include a variable Democratic Party,
which takes on the value one for members of that party.15 As noted in the previous section, given
the historical record and Indian nations’ general issue preferences, we anticipate that they give
more to Democratic Senators (Corntassel and Witmer 2008).
The third motivation for giving is the effect of access and status, so we include variables
that correspond to how much control a Senator may have in the legislative process. Our measures
include indicator variables for whether a Senator is a committee chair, a member of a prestige
committee (Budget, Appropriations, and Finance), whether the Senator holds a party leadership
position and whether the Senator is a member of the majority party at the time. Given that the
majority of Indian-specific issues are dealt with by one committee, we also include a separate
variable for all members of the Senate Committee on Indian Affairs. If access and influencing
legislative outputs motivate tribal nations, then these Senators should receive larger amounts of
contributions. We also include a measure of years in office to capture institutional status.
Because first-term members of Congress have generally been found to receive increased
contributions as they search for a niche and interest groups vie for their attention (Grier and
Munger 1991), we also include an indicator variable for first-term status.
To test our last hypothesis about the relationship between tribal and Native American
interests and political activity, we include three additional independent variables. First, we test
whether gaming increases tribal political activity by controlling for the number of gaming tribes,
which measures the number of tribes with Class III gaming in each Senator’s state.16 If gaming

18
resources leads to political contributions, Senators from states with more gaming should receive
more contributions. Second, we include a measure of the size of a state’s Native American
Population17 to gauge the affect that the proportion of the state population that is American
Indian has on Senate contributions. This provides a measure of the level of constituent interest
presence in the state that the Senator represents and therefore the potential desire to influence the
Senator’s activities. Furthermore, if tribes are lobbying to advance traditional Native American
interests, and not just gaming, then Senators from states with larger Native American populations
should receive more contributions. Third, we include the number of Federally recognized Indian
tribes in a state as a measure of organized tribal interests. See Table 1 for summary statistics for
all of the variables used in our analysis.18 We checked these variables for potentially problematic
correlations, particularly between state level variables and institutional position for Senators and
found no troublesome relationships (e.g., membership on the Indian Affairs committee and state
Native American population only have a correlation of 0.37).
We also include a few control variables. First, we include election cycle fixed effects to
control for year-to-year changes in the environment. Note that these variables will account for
possible Presidential election year effects, since the total amount of money available to Senate
candidates may be reduced in the presence of a Presidential election. Second, we also control for
whether a Senator is up for reelection during the current cycle. Because contributions to Senators
may be focused towards the end of a term, we expect this variable to have a positive effect.
Further, we also run versions of our model that limit the analysis to these Senators, since many
of the factors we study may have greater influence during this part of a term.
Since the dependent variable is the amount of contributions received and tribes did not
give any money to about 78% of the Senators during a given election cycle in our sample (this
decreases to 62% among Senators up for reelection), we must account for this in our empirical
19
model. Otherwise such a large number of zeros in the dependent variable would seriously bias
the coefficient estimates from a linear regression model. We therefore follow the practice in the
literature and estimate a tobit model, which accounts for this large number of non-recipients by
treating them as censored.19 That is, the model assumes that tribes would have preferred to make
negative contributions to these Senators, but since they are prevented from doing so these
observations enter the data as receiving zero contributions.20
Empirical Determinants of Tribal Contributions
The results of our four tobit regressions are reported in Table 2. The first model includes
all Senators and all election cycles, and therefore omits the Cook’s Call variable. The second
model includes this variable, thereby limiting us to cycles for which we have a measure of it. To
determine whether the results for the other variables are affected by this restriction, in the third
model we exclude the Cook’s Call variable but limit the sample to the same years. Finally, we
also present a model that further restricts the sample to Senators up for reelection.21 None of the
variables produces different findings across the four models, though the effect sizes are much
larger in later years and when limited to Senators up for reelection, so we discuss the results in
general.
[Table 2 here.]
First, we are interested in whether tribal giving is driven by electoral incentives. Our
results suggest they are, with tribes giving more to Senators facing an election in all four models.
More importantly, the coefficient on the Cook’s call variable is positive and significant in both
models in which it is included indicating that tribes give more to Senators facing a close election.
Given that these coefficients represent changes in the underlying latent variable, desired
contributions, caution should be taken before translating them into actual dollars received. In

20
order to ease interpretation of the coefficients, we convert them into changes in contributions by
multiplying them by a scale factor.22 This conversion implies that tribes give about $4025 more
to Senators facing difficult reelection prospects.
Note that limiting the sample to the electoral cycles for which we have a measure of the
Cook’s Call variable does not influence the findings, as evidenced by the comparison of the first
and third models. Further, the competitiveness results are not an artifact of Senators standing for
reelection (since those not facing an election all score zero on this variable) as the effect is still
significant in the fourth model, which limits the sample to those Senators. It is also much larger
in this limited sample, corresponding to an $11,574 increase in contributions as compared to just
$4113 in the second model.
Second, consider the results for our test of the role of ideology. The coefficient for
Democrats is positive and significant, indicating that on average Indian nations perceive that
Democrats better represent their interests. This relationship is significant at the 0.05 level in all
four models. In dollar terms, Democrats receive about $2621 more than Republicans per election
cycle.
The third factor we consider for Senate attributes is access. Examining our measures of a
members’ role in the Senate suggests that tribes are extremely conscious of member influence
and their access to decision-making on Indian issues. Most important is party leadership: tribes
give significantly more money, about $1985, to party leaders from both political parties. This
effect is significant at the 0.10 level or better in all four models. Also extremely important is
membership on the Indian Affairs Committee. Tribes give about $2952 more to its members and
the coefficients are significant at the 0.05 level in all models.
Surprisingly, given our expectations of access to decision-makers, members of prestige
committees are not so well rewarded. Members of the three money committees – Budget,

21
Appropriations and Finance – receive $881 more than other members, but the corresponding
coefficients never approach conventional significance levels. We also find no effect for majority
party status, though we can only include this variable in the first model, nor for institutional
position measured by years in the Senate. We do find some weak evidence of a boost in
contributions to first term Senators on the order of about $2124, but this effect is only significant
in the first model.
Our final hypothesis concerns the impact of tribal and Native American interests in a
Senator’s state. The results in Table 2 demonstrate a strong relationship between all three
measures and contributions. Senators from states with more gaming tribes and a greater share of
Native Americans in the population receive significantly greater contributions. In dollar terms,
each additional gaming tribe corresponds to about $185 more in contributions whereas each
percentage increase in the proportion of Native Americans increases contributions by $410. On
the other hand, Senators from states with more Indian nations receive fewer contributions. Here
each additional non-gaming tribe results in about a $20 loss in contributions. Because we include
the number of gaming as well as the total number of tribes, this last effect must be considered in
context: Senators from states with one additional nongaming tribe receive fewer contributions
from Indian nations, but those from states one additional gaming tribe receive greater
contributions. The latter effect occurs since the coefficient for each additional gaming tribe is
much larger than the coefficient for each additional tribal nation, resulting in a positive net
effect.
These findings make sense, since, as we expected, Indian nations with gaming have
greater resources to devote to political activities while nations without gaming may have more
pressing concerns. On the other hand, the decrease in receipts as the number of Indian nations
increase runs contrary to our expectations,23 though it could be explained by the collective action
22
problem as research by Lowery, Gray, Anderson, and Newmark (2004) finds that the rate of
political participation decreases with the number of interests in a state. Gaming tribes may not
face as great a collective action problem since they have greater resources and may be able to
influence outcomes on their own. Previous research has also occasionally produced similarly
unexpected findings, such as Endersby and Munger’s (1992) finding that unions give less to
House members with more blue collar workers in their districts.
Interpretation and Discussion
American Indian political participation, at least as measured by contributions to United
States Senators, has clearly increased in the years since the passage of IGRA. From a baseline of
$0 in the first election cycle of 1989-1990 to over $115,000 in 1997-1998 and nearly $75,000
more in 1999-2000, Indians are supporting Senate incumbents. By combining these data with
members’ characteristics, we were able to evaluate a number of theories about interest group
contributions in the context of Indian nations’ contributions in the post-IGRA era.
What do our results say about tribal motivations for making contributions to Senators?
Clearly, Indian nations respond to a number of factors when making decisions about where to
allocate their resources. All the different motivations that we considered – gaming, access,
ideology, influencing elections, and the position of Native Americans in the state – appear to
influence their decisions: Senators from states with more gaming tribes, that hold party
leadership positions, are members of the committee on Indian affairs, are Democrats, or are up
for reelection receive greater campaign funds whereas Republicans and members of prestige
committees are generally less well supported.
Our results show that tribes respond in similar ways as more traditional organized
interests. This is unsurprising in many ways, since tribes’ motivations for participation in the
23
political process overlap in many ways, particularly in the context of Indian gaming, which is,
after all, a business enterprise. Contributions go to Senators who are sympathetic to Native
American’s interests, and who have the institutional positions and prestige to influence outcomes
of interest. Frankly, it would have been surprising if our data had shown otherwise. While we
perform our analysis at the Senator level, consistent with prior research, much could be learned
about differences in motivations across tribal nations by moving to a dyadic tribal-Senator
analysis. Such data may be a challenge to assemble in a systematic fashion, but we did go
through listed individual contributions from the Indian gaming industry for 2005-2006 to identify
those to Senators. While we identified only a small fraction of all such contributions, totaling just
over $45,000, we do find that tribes are not just giving to Senators from the same state: in 2006
the Mashantucket Pequot tribal nation, which operates Foxwoods casino in Connecticut, gave
money to Joe Lieberman, Lincoln Chafee, Hillary Clinton, and Debbie Stabenow. Stabenow,
from Michigan, also received contributions from the Morongo and Pechanga Bands of Mission
Indians in California.
An important question for addressing the issue of political incorporation by Native
American tribes is which tribes and whose interests our analysis reflects. Since our data focus on
contribution receipts by Senators, they do not directly address the number and characteristics of
tribes whose interest these contributions may further. While we were unable to identify each
contributor directly, we did extensive searches to put our results in context.24 For example, other
data suggest that a broad range of tribes engage in political expenditures, with over 128 different
tribes between 1998 and 2002 making hard or soft money contributions to Federal candidates or
parties or filing lobbying reports under the Lobbying Disclosure Act. This includes at least 25
tribes without gaming operations, suggesting that our results may reflect fairly broad patterns of
activity by a large number of Indian nations.
24
In this context, our empirical results should speak to the broader representation of Indian
nations in the political process and, specifically, provide evidence that Indian nations’
contribution patterns reflect consideration of the same set of concerns that influence traditional
categories of organized interests, such as business and labor PACs. We believe that this provides
prima facia evidence of the value of examining Indian nations’ political activities through the
lens of theories of organized interests. We wish to emphasize, however, that this is not
tantamount to claiming that we can simplify the complex legal, political, and historical status of
Indian nations to that of mere organized interests. Rather, we believe that applied properly,
valuable insight can be gained from these theories. This perspective has its limits, however: it is
critical to recognize the distinct historical and cultural circumstances that tribes face when
drawing these comparisons. For example, nations’ sovereign status makes them unlike any other
organized interest, as does their consequent, unique set of interactions with the Federal
government. Still, we believe that cautiously incorporated, theories of organized interests can
further our understanding of Indian nations’ unique participation in the political process at a time
when their participation is expanding and changing in important ways.

25
Appendix Table A1.
Coding of Variables Indian Gaming contributions Total contributions received by a Senator in each election
cycle from the Indian gaming industry. Data from the Center for Responsive Politics (http://www.opensecrets.org).
Number of tribes with gaming Total number of Indian nations with agreements for Class III gaming. Taken from list compiled from the Federal Register by the Office of Indian Gaming Management, Bureau of Indian Affairs (last updated July 06, 2000); updated through 2006 using the Federal Register’s online version.
State Indian population Native American population as a percentage of a state’s total population. Taken from Statistical Abstract of the States, various years.
Indian affairs committee member
Senator is a member of the Indian Affairs Committee. Taken from the Almanac of American Politics, various years.
Number of federally recognized Indian tribes
Number of federally recognized Indian tribes. Taken from the Bureau of Indian Affairs current listing (December 1998).
Democratic party member Senator is a member of the Democratic party. Holds party leadership position Senator holds party leadership position. Taken from the
Almanac of American Politics, various years. Member of prestige committee Senator is member of Finance, Budget or Appropriations
committees. Taken from the Almanac of American Politics, various years.
Committee chair Senator is a committee chair. Taken from the Almanac of American Politics, various years.
Up for election this year Senator is up for re-election at the end of the current cycle. Cook’s Call – Close Constructed from Cook’s Call (Charlie Cooks’s political
report). For 1998, 2004, and 2006 elections, we code the Toss-Up and Leaning categories 1; for 2000 election we code the Potentially Vulnerable and Highly Vulnerable categories as 1.
Majority Party Senator is member of the party that holds a majority of seats in the Senate during the current election cycle.
26
Endnotes
1 As of 2008, the National Indian Gaming Commission reported there were 405 Indian gaming
operations in twenty-nine states that produced estimated revenues of $26.7 billion a year
(http://www.nigc.gov/Default.aspx?tabid=67, accessed October 19, 2009).
2 Indian Gaming Regulatory Act, 25 U.S.C. 2701-2721.
3 See also the National Indian Gaming Association webpage at http://www.Indiangaming.org for
additional information on the programs funded by Indian gaming receipts.
4 Though Mason (2000) does discuss the role that Indian Nations and gaming interests played in
New Mexico’s 1994 gubernatorial race. New Mexico tribes contributed over 10% of challenger
and eventual winner Gary Johnson’s general election expenditures, largely due to his support for
tribal gaming and incumbent Bruce King’s unwillingness to sign compacts.
5 Bobo and Tuan (2006) do focus on American Indians and specifically Chippewa Treaty rights
in Wisconsin, however the purpose of the book is less about political incorporation or political
participation by American Indians. Instead the authors focus on the role of group position and
racial prejudice and how and why it enters into politics more broadly.
6 An alternate perspective on this is provided by Grier and Munger (1993), who note that if
groups want access they should give to members who are most likely to stay in office, suggesting
the opposite relationship. Given the weight of subsequent empirical findings, we stick with the
hypothesis of a positive relationship between competitiveness and contribution receipts.
7 This is consistent with Corntassel and Witmer’s (2008) survey results, which found that issues
were more important than party, though Democrats are generally favored by Indian nations.
8 Tribes are treated as “persons” in the sense that they are limited making contributions of up to
$2000 per candidate per election cycle, but are not treated as “individuals” in the sense that they
27
are permitted to exceed the $25,000 per election cycle limit imposed on individual donors (FEC
Advisory Opinion 2000-05).
9 Another drawback of the data is that it only includes officeholders. This means that
contributions to ousted incumbents or failed challengers are not included, which would
understate total contributions over the period studied. Given our focus on Senators’
characteristics as determinants of receipts, however, this restriction is necessary and appropriate.
10 Data from the Center for Responsive Politics web site: http://www.opensecrets.org.
11 Data from the Center for Responsive Politics web site: http://www.opensecrets.org.
12 Since Senator’s characteristics affect their contributions during the current election cycle, we
match the data as follows. Contributions received during the 2001-2002 election cycle are
matched with Senate characteristics for the current Congress, that is, with committee
assignments etc. that are allocated following the 2000 election.
13 The codings were slightly different in the 2000 election, for which we code the Potentially
Vulnerable and Highly Vulnerable categories as 1.
14 We tried other measures of competitiveness based on primary and general election results from
the previous election as well as challenger fundraising: lagged vote share, whether the incumbent
held a safe seat (won last election with at least 55% of the vote), the number of primary
challengers, and the runner-up’s expenditures in the previous election. None of these alternatives
produced a significant finding. Six years may be too long a time for these lagged variables to still
exert an influence.
15 We also included ADA scores and found the findings varied little.
16 Appendix A contains definitions and sources of our variables.
28
17 We tried this variable both as the actual number as a percentage of total state population.
While the effects of other variables remained essentially unchanged, the number of Native
Americans performed stronger than the percentage.
18 Of course, it is possible that gaming revenues are not directed based on state, but rather that
they are given based on committee memberships etc. Lack of a relationship between state
gaming levels and contributions is not sufficient to determine that gaming is not related to
contributions. The opposite occurrence (tribes with gaming giving not to their Senators, but to
Senators from other states that also have gaming) is probably less likely, however, meaning that
the existence of a relationship is almost certainly based on activity from same-state gaming
tribes. As we note in the conclusion, in a small sample of tribal contributions, about 60% went to
a Senator from the tribe’s state.
19 Maddala (1983) explains the tobit model and explicitly derives the bias of the OLS estimates.
Also see Long (1997) for an explication of the tobit and related models.
20 Given the large number of zeros in our data, we also estimated the model as a probit regression
where the dependent variable was zero for all Senators who did not receive any contributions and
one for all Senators who received any non-zero amount of contributions that year. The results
from the two models were quite similar.
21 This restriction makes it impossible to include a variable for majority party since there is no
variation in this subsample.
22 The coefficients from the regression represent the marginal change in the underlying latent
variable, y*, which is not bounded below at zero. We may be more interested in the marginal
change in observed contributions, y, which, letting z=x is given by (z). Alternatively, we
may be interested in the change in contributions when they are non-zero (y* > 0), which is given

29
by [1-z((z)/(z))-((z)/(z))2]. In the context of our first model, a rough translation for our
coefficients can be obtained by calculating the two scale factors at the average value of the
independent variables: (z)=0.28 and [1-z((z)/(z))-((z)/(z)) 2] = 0.26. See Maddala (1983)
for derivation of these results. In our discussion we use the first scale factor, and set continuous
variables to their mean values, dichotomous variables to zero, and use 2002 as our base year.
Note that this provides a relatively low estimate since most of the dichotomous variables have
large and positive effects: setting these variables to one almost doubles the reported marginal
effects.
23 Since California and Alaska have about 60% of all tribal nations, we checked whether either of
these two outliers was behind this finding. Excluding either one renders this variable
insignificant, but excluding both produces a coefficient that is significant at the .108 level.
24 We tried to scan Senator’s individual contributions, but Open Secrets only lists the top 1000.
For Maria Cantwell in 2005-2006, when she was the top recipient of Indian gaming
contributions, this only covered the period from October through December 2006. We were
unable to identify any contributions among these 1000 that originated from a tribal nation.

30
References Anders, Gary C. 2000. “Indian Gaming” in Contemporary Native American Political Issues,
Troy R. Johnson, ed. Walnut Creek, CA; Altamira Press.
Baumgartner, Frank and Beth Leech, 1998. Basic Interest: The Importance of Groups In Politics
and Political Science. Princeton: Princeton University Press.
Bennett, Randall W. and Christine Loucks. 1994. “Savings and Loan and Finance Industry PAC
Contributions to Incumbent Members of the House Banking Committee.” Public Choice 79
(1/2): 83-104.
Bobo, Lawrence and Franklin D. Gilliam, Jr. 1990. “Race, Sociopolitical Participation, and
Black Empowerment.” The American Political Science Review, Vol. 84(2), pp. 377-393.
Bobo, Lawrence and Mia Tuan. 2006. Prejudice in Politics. Cambridge:Harvard University
Press.
Boehmke, Frederick J. and Richard Witmer. 2004. “Disentangling Diffusion: The Effects of
Social Learning and Economic Competition on State Policy Innovation and Expansion.”
Political Research Quarterly 57 (1): 39-51.
Bordewich, Fergus M. 1996. Killing the White Man’s Indian. New York: Doubleday.
Box-Steffensmeier, Janet M., and J. Tobin Grant. 1999. “All in a Day’s Work: The Financial
Rewards of Legislative Effectiveness.” Legislative Studies Quarterly, 24 (4): 511-24.
Browning, Rufus P., Dale Rogers Marshall and David H. Tabb. 1984. Protest is Not Enough.
Berkeley:University of California Press.
Browning, Rufus P., Dale Rogers Marshall and David H. Tabb. 1986. “Protest is Not Enough: A
Theory of Political Incorporation”, PS: 19(3):576-581.
Browning, Rufus P., Dale Rogers Marshall and David H. Tabb. eds. 1997. Racial Politics in
American Cities. 2nd ed. White Plain, NY:Longman Press.
Cornell, Stephen. 1988. Return of the Native: American Indian Political Resurgence. New
York: Oxford University Press.
Cornell, Stephen, Joseph Kalt, Matthew Krepps and Jonathan Taylor. 1999. American Indian
Gaming Policy and Its Socio-Economic Effects” A Report to the National Gambling Impact
Study Commission. Cambridge, MA: The Economics Resource Group, Inc.
Corntassel, Jeff and Richard Witmer. 1997. "American Indian Tribal Government Support of
Office-Seekers: Findings From the 1994 Election." The Social Science Journal. 34.(5).
Corntassel, Jeff and Richard Witmer. 2000. “Battlelines of Sovereignty: Forced Federalism and
American Indian Mobilization in the 1990’s.” Paper presented at the American Political
Science Association Meeting, Washington, DC, Aug 31-Sept 3.
Corntassel, Jeff and Richard C. Witmer. 2008. Forced Federalism: Contemporary Challenges to
Indigenous Nationhood. Norman: University of Oklahoma Press.
Cox, Gary W. and Eric Magar. 1999. How Much is Majority Status in the U.S. Congress
Worth?" American Political Science Review 93: 299-310.
Denzau, Arthur and Michael Munger. 1986. “Legislators and Interest Groups: How Unorganized
Interests Get Represented.” American Political Science Review 80 (1): 89-106.
Endersby, James W., and Michael C. Munger. 1992. “The Impact of Legislator Attributes on
Union PAC Campaign Contributions.” Journal of Labor Research XIII (1): 79-97.
Gais, Thomas. 1996. Improper Influence: Campaign Finance Law, Interest Groups, and the
Problem of Equality. Ann Arbor: University of Michigan Press.
Getches, David, Charles Wilkinson and Robert Williams, Jr. 1998. Federal Indian Law, 4th ed.
St. Paul, MN:West Group.
Gibbs, Dennis. 1999. “Intergovernmental Compacts in Native American Law: Models for
Expanded Usage” Harvard Law Review. 112 (3): 922-939.

Goldberg, Carole. 1975. “Public Law 280: The Limits of State Jurisdiction Over Reservation
Indians.” UCLA Law Review 22 (2): 535-539.
Gopoian, J. David, Hobart Smith and William Smith. 1984.“ What Makes PACs Tick? An
Analysis of the Allocation Patterns of Economic Interest Groups.” American Journal of
Political Science 28: 259-277.
Grenzke, Janet. 1989. “Candidate Attributes and PAC Contributions.” Western Political
Quarterly 42: 245-264.
Grier, Kevin B. and Michael C. Munger. 1986. “The Impact of Legislator Attributes on Interest-
Group Campaign Contributions.” Journal of Labor Research 7 (4): 349-361.
Grier, Kevin B. and Michael C. Munger. 1991. “Committee Assigments, Constituent
Preferences, and Campaign Contributions To House Incumbents.” Economic Inquiry 29: 24-
43.
Grier, Kevin B. and Michael C. Munger. 1993. “Comparing Interest Group PAC Contributions
to House and Senate Incumbents, 1980-1986.” The Journal of Politics 55(3): 615-643.
Grier, Kevin B., Michael C. Munger and Brian E. Roberts. 1994. “The Determinants of Industry
Political Activity, 1978-1986.” The American Political Science Review 88(4): 911-926.
Hall, Richard L. and Frank W. Wayman. 1990. “Buying Time: Moneyed Interests and the
Mobilization of Bias in Congressional Committees.” American Political Science Review 84
(3): 797-820.
Hero, Rodney. 1992. Latinos and the U.S. Political System: Two-Tiered Pluralism.
Philadelphia:Temple University Press.
Hersch, Philip L. and Gerald S. McDougall. 2000. “Determinants of Automobile PAC
Contributions to House Incumbents: Own versus Rival Effects.” Public Choice 104 (3/4):
329-343
Light, Steven Andrew and Kathryn R.L. Rand. 2005. Indian Gaming and Tribal Sovereignty:
The Casino Compromise. Lawrence, KS: University Press of Kansas.
Long, J. Scott. 1997. Regression Models for Categorical and Limited Dependent Variables.
United States of America: Sage Publications.
Lowery, David; Virginia Gray; Jennifer Anderson; and Adam J. Newmark. 2004. “Collective
Action and the Mobilization of Institutions.” The Journal of Politics 66 (3): 684-705.
Maddala, G.G. 1983. Limited Dependent and Qualitative Variables in Econometrics. Cambridge:
Cambridge University Press.
Mason, W. Dale. 2000. Indian Gaming. Norman: University of Oklahoma Press.
McCulloch, Anne. 1994. “The Politics of Indian Gaming: Tribe/State Relations and American
Federalism” Publius 24 (2): 99-112.
Mitchell, Neil J., Wendy L. Hansen and Eric M. Jepsen. 1997. “The Determinants of Domestic
and Foreign Corporate Political Activity.” The Journal of Politics 59: 1096-113.
Nagel, Joane. 1997. American Indian Ethnic Renewal. New York: Oxford University Press.
National Gambling Impact Study Commission. 1999. Final Report.
National Indian Gaming Commission. NIGC Tribal Gaming Revenues. nigc.org. Accessed
3/19/2010.
Nownes, Anthony J. 2001. Pressure and Power: Organized Interests in American Politics.
U.S.A.: Houghton Mifflin Company.
Rand, Kathryn R.L. and Steven Andrew Light. 2006. Indian Gaming Law and Policy. Durham,
NC: Carolina Academic Press.
Skopek, Tracy A., Engstrom, Jr., Richard, and Kenneth N. Hansen. 2005. “All that
Glitters…The Rise of American Indian Tribes in State Political Behavior.” American Indian
Culture and Research Journal 29 (4): 45-58.
Skopek, Tracy A. and Kenneth N. Hansen. 2006. “Reservation Gaming, Tribal Sovereignty, and
the State of Texas: Gaining Ground in the Political Arena?” Politics & Policy 34 (1): 110-
133.
Smith, Dean Howard. 2000. Modern Tribal Development. Walnut Creek, CA: Alta Mira Press.
Snyder, James M. 1990. “Campaign Contributions as Investments: the U.S. House of
Representatives, 1980-1986.” Journal of Political Economy 98: 1195-1227.
Stratmann, Thomas. 1992. Are Contributors Rational? Untangling Strategies of Political Action
Committees.” Journal of Political Economy 100: 647-664.
Van Doren, Terry D.; Dana L. Hoag; and Thomas G. Field. 1999. “Political and Economic
Factors Affecting Agricultural PAC Contribution Strategies.” American Journal of
Agricultural Economics 81 (2): 397-407.
Wand, Jonathan. 2007. “The Allocation of Campaign Contributions by Interest Groups and the
Rise of Elite Polarization”. Working paper, Stanford University.
Warren, Christopher. 1997. “Hispanic Incorporation and Structural Reform in Miami” in Racial
Politics in American Cities, 2nd edition, ed. Rufus D. Browning, Dale Rogers Marshall,
and David H. Tabb. White Plains, NY:Longman Press.
Wilcox, Clyde. 1989. “Organizational Variables and the Contribution Behavior of Large PACs.”
Political Behavior 11: 157-173.
Wilkins, David. 1994. “Reconsidering the Tribal-State Compact Process” Policy Studies Journal
22 (3): 474-488.
Wilkins, David. 1999. The Navajo Political Experience” Tsaile, Az:Dine College Press.
Witmer, Richard. 1996. “The High Stakes of Indian Gaming: Economic Development and the
Political Behavior of Indian Tribal Governments.” Red Ink: An American Indian Journal 5
(1).

Witmer, Richard and Frederick J. Boehmke. 2007. “American Indian Political Incorporation in
the Post- Indian Gaming Regulatory Act Era.” Social Science Journal 44 (1): 127-145.
Wright, John R. 1990. “Contributions, Lobbying, and Committee Voting in the U.S. House of
Representatives.” The American Political Science Review 84(2): 417-438.
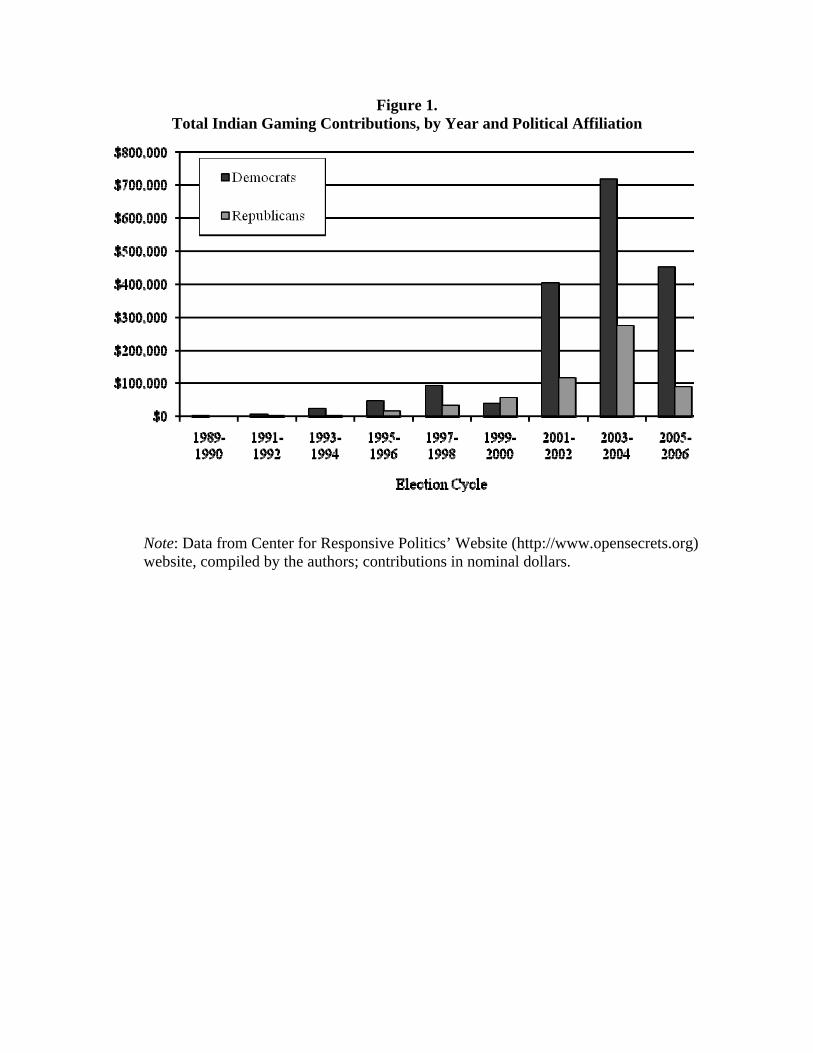
Figure 1. Total Indian Gaming Contributions, by Year and Political Affiliation
Note: Data from Center for Responsive Politics’ Website (http://www.opensecrets.org) website, compiled by the authors; contributions in nominal dollars.

37
Table 1. Summary of Independent Variables
Mean S.D. N Contributions Received ($1000) 2.50 10.95 915Number of tribes with gaming 2.55 6.67 915Number of federally recognized Indian tribes 11.54 34.64 915State Indian population percent 1.71 3.01 915Indian affairs committee member 0.14 0.35 915Democratic party member 0.50 0.50 915Holds party leadership position 0.14 0.34 915Member of prestige committee 0.56 0.50 915Committee chair 0.17 0.38 915First term Senator 0.34 0.47 915Years in Senate 11.12 9.41 915Up for election this year 0.32 0.46 915Cook's Call Close 0.09 0.28 401

Table 2. Tobit Model of Indian Gaming Contributions Received by Senate
Incumbents, 1990-2006 Election Cycles
All Years with Cook’s Call
Election Year
Number of tribes with gaming 0.65** 0.71** 0.70** 0.91**(0.27) (0.23) (0.25) (0.32)
Number of tribes -0.10** -0.16** -0.15** -0.21* (0.05) (0.06) (0.06) (0.11)
Percent Native American 1.84** 2.42** 2.40** 2.81* (0.65) (0.83) (0.87) (1.43)
Indian affairs committee member 11.17** 12.51** 12.40** 24.30**(4.82) (5.48) (5.69) (8.69)
Cook's Call - Contested 14.60** 19.00**(7.33) (8.71)
Democratic party member 9.13** 12.22** 12.77** 18.89**(3.25) (3.54) (3.83) (5.83)
Member of majority party -2.41 (2.70)
Holds party leadership position 8.01** 12.58** 12.55** 13.63* (3.21) (4.55) (4.67) (7.73)
Member of prestige committee 3.50 0.49 1.73 -5.52 (2.92) (3.71) (3.87) (5.66)
Committee chair 1.55 4.33 4.48 7.92 (3.15) (6.12) (6.08) (10.21)
First term in Senate 8.12* 4.87 7.47 2.04 (4.37) (5.48) (5.39) (8.86)
Years in Congress 0.23 0.28 0.29 0.51 (0.28) (0.32) (0.31) (0.57)
Up for election this year 18.51** 18.86** 23.14** (2.93) (3.61) (4.63)
Constant -82.77** -54.92** -57.55** -15.30 (15.21) (10.36) (11.65) (15.30)
Observations 914 401 401 129 Uncensored Observations 205 122 122 64
Note: Contributions converted to real (2002) dollars (in thousands). Election cycle fixed effects (not reported) included in all models. Standard errors in parentheses, clustered on Senator. * indicates coefficient significantly different from zero at the .10 level; ** significantly different from zero with at the .05 level.