indian & howard’s creek local watershed plan with/watershed...fieldwork activities that have...
TRANSCRIPT

Indian Creek and Howards Creek
Local Watershed Plan Watershed Assessment Report
April 2010

This document was prepared by Mike
Herrmann and Hal Bryson, NC EEP Watershed Planning.
Suggested Citation: NC Ecosystem Enhancement Program. 2010. Indian Creek and Howards Creek Local
Watershed Plan. Watershed Assessment Report. April 2010. Cover Photos: Upper Mill Creek (large photo). Inset photos were taken in upper Howards Creek.
i

TABLE OF CONTENTS SECTION TITLE Page
Section I. Introduction 1 Section II. Watershed Assessment Methods 6A. Habitat 6 B. Hydrology 8 C. Water Quality 9
Section III. Watershed Assessment Results 13
A. Habitat 13 B. Hydrology 21 C. Water Quality 26
Section IV. Discussion of Results and Stressors 32 Section V. Assessment of Watershed Functions 38
D. Methods 39 E. Results 43 F. Discussion 44
Section VI. Conclusions 46 Section XII. References 47 Appendix A. Identification and Prioritization of High Quality Habitat 50 Appendix B. Land Cover Statistics by Subwatershed. 54 Appendix C. Functional Ratings for Subwatersheds 55
ii

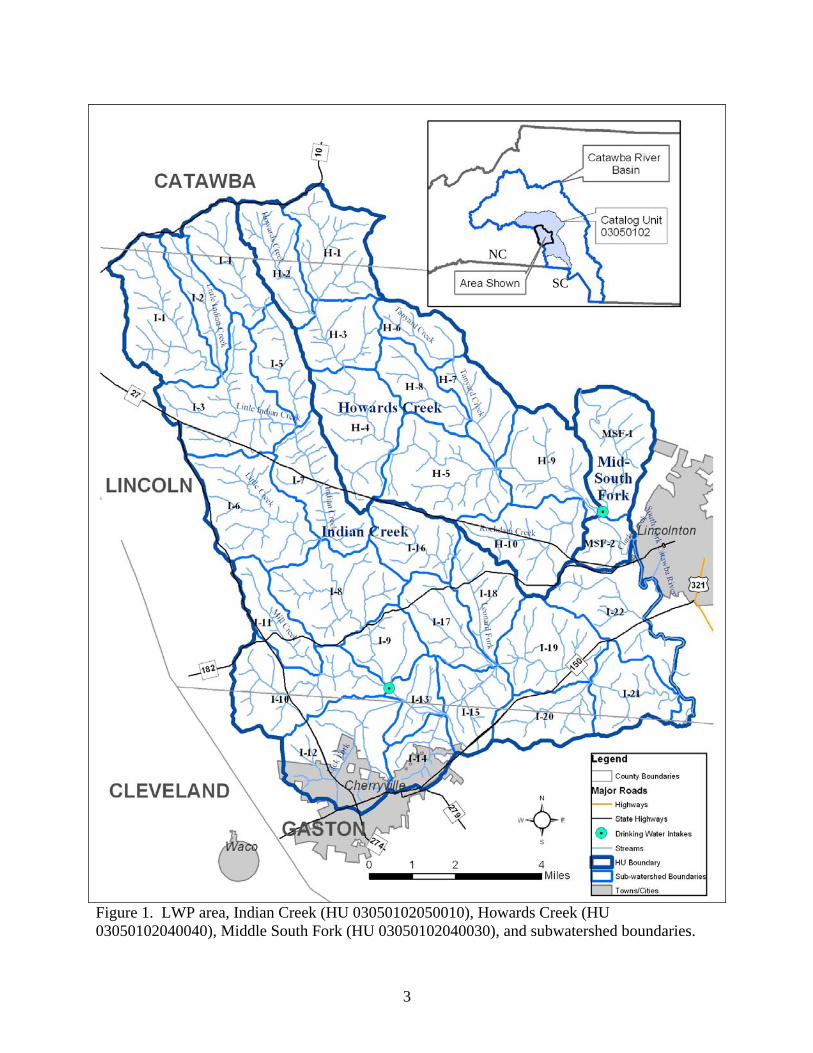
SECTION I. INTRODUCTION This document, the Watershed Assessment Report, describes and summarizes the monitoring and fieldwork activities that have occurred during Phase 2 of the Indian Creek and Howards Creek Local Watershed Plan (LWP). These activities include field examination of wetlands and streams, chemical and biological monitoring of streams, and a limited investigation of stormwater runoff from several developed areas. In early 2008, North Carolina’s Ecosystem Enhancement Program (NC EEP) selected Indian Creek and Howards Creek watersheds to implement a detailed planning approach, or LWP, to identify opportunities to protect and restore streams and wetlands. Indian Creek, Hydrologic Unit (HU) 03050102050010, and Howards Creek, HU 03050102040040, are located in North Carolina’s western Piedmont. The watersheds drain to the South Fork of the Catawba River, which flows to the main stem of the Catawba River at Lake Wylie. A small HU, referred to in this document as Middle South Fork (HU 03050102040030), hydrologically connects Howards Creek to Indian Creek. These three HUs constitute NC EEP’s Indian Creek and Howards Creek LWP area (see Figure 1). A Phase 1 preliminary assessment of these watersheds was completed in December 2008 (NC EEP, 2008). As part this phase, the 3 HUs were subdivided into 34 subwatersheds (see Figure 1). The subwatershed delineation helps characterize conditions and factors influencing different portions of the watershed. This characterization can also benefit the planning process by showing where resources should be focused to field assess restoration or preservation opportunities. Finally, subwatersheds are also the scale where the success of implementation efforts may best be measured (Center for Watershed Protection, 2000). During Phase 1, examination of existing data and preliminary fieldwork detailed a number of stressors impacting the LWP area (NC EEP, 2008). In Indian Creek, the effect of these watershed stressors led to a “Fair” biological rating (i.e., bioclassification) and a subsequent listing from the NC Division of Water Quality (DWQ) on the State’s 2006 list of impaired waters (i.e., 303(d) list) for Indian Creek mainstem near Cherryville downstream to its terminus at the Catawba River’s South Fork (NC DWQ, 2006b). Table 1 summarizes findings made during Phase 1 along with strategies utilized in Phase 2 to follow up on these findings. These strategies resulted in the selection of assessments, study methods, and the results contained in this report. Development of the Watershed Assessment Report and its findings was supported by resource professionals working in the LWP area (i.e., watershed stakeholders). Table 2 lists LWP stakeholders. These groups have made valuable contributions toward improving the focus of the LWP fieldwork.
1

Table 1. Major Phase 1 Findings and Phase 2 Assessment Strategies.
Phase 1 Finding Phase 2 Assessment Strategy Indicators of stress such as degraded streamside forest, cattle accessing wetlands and streams, and stream channel relocation are more prevalent in Howards Creek than Indian. Lower Indian Creek, however, has been found to have impaired biological integrity by NC DWQ.
Both HUs need further water quality and biological monitoring to understand the conditions stressing their aquatic habitat and, in the case of Indian Creek, causing their impairment.
Several locations have been identified as potential preservation opportunities. The predominance of agriculture land cover, however, makes overall habitat conditions in the area marginal.
Potential high quality habitat areas need to be visited to assess their preservation value.
All three HUs in the LWP have stream and wetland impacts hindering their watershed functions of hydrology, habitat and water quality.
To improve watershed functions, stressor sites in the LWP area need to be visited and assessed to identify opportunities to improve functions.
Urban subwatersheds in and around Cherryville have relatively large areas of impervious surface. Stormwater runoff from these areas may contribute to stream and wetland degradation.
Visit areas in the urban subwatersheds to assess stormwater impacts and, if necessary, identify opportunities for implementation of stormwater best management practices (BMPs).
Elevated bacteria levels at Cherryville’s drinking water intake are an indicator of water quality stress and need further investigation.
Possible sources for this contamination need to be identified to help develop a strategy to improve water quality at the intake.
Table 2. LWP Project Stakeholders
- Lincoln and Gaston Co. Soil & Water - NC DWQ - Watershed Assessment Team
Conservation Districts (SWCD) (WAT)
-NC Source Water Protection Program - City of Lincolnton Planning
- Carolina Land & Lakes Resource - County & NCSU Cooperative Extension Conservation & Development Service (CES)
- NC DWQ – Mooresville Regional Office - Gaston County Natural Resources
- NC EEP - Lincoln County Planning
- NC DOT Division 12 - Catawba Lands Conservancy
- NC Rural Water Association
2
NC
SC
Figure 1. LWP area, Indian Creek (HU 03050102050010), Howards Creek (HU 03050102040040), Middle South Fork (HU 03050102040030), and subwatershed boundaries.
3

In addition to helping steer the project fieldwork, stakeholders helped to define LWP goals. The development process for the goals is detailed in the Phase 1 report (NC EEP, 2008). These goals were then used to shape the Phase 2 fieldwork activities. Table 3 outlines these goals that include a mix of short-term actions or products to be achieved during the NC EEP LWP process (i.e., by the end of Phase 3) as well as goals that represent long-term activities that would be continued by local stakeholders after completion of the NC EEP LWP. Work during Phase 2 has been completed through services provided by the NC Division of Water Quality (DWQ) Watershed Assessment Team (WAT), and ENTRIX Incorporated, an environmental consulting firm. Their support helped characterize restoration, enhancement and preservation opportunities of over 50 streams and 45 wetlands in the watershed. Additionally, they helped to monitor the stream chemistry and biology and better define the major stressors affecting streams. Findings from their assessments are the backbone of this report. This remainder of the report is organized as follows:
▪ Section 2 details the watershed assessment methods for habitat, hydrology, and water quality functions, focusing on those provided by streams and wetlands.
▪ Section 3 provides results from Phase 2 assessments. It is organized by three categories of major watershed functions: habitat, hydrology and water quality.
▪ Section 4 gives discussion of the results, including identification of the primary stressors affecting watershed functions.
▪ Section 5 contains the functional assessment methods and results for the LWP area. ▪ Section 6 summarizes the conclusions of the document.
At the next phase of this project, Phase 3, a Watershed Management Plan will be completed summarizing recommendations for the LWP area along with providing a Project Atlas that details restoration, enhancement, preservation, and other watershed improvement opportunities.
4

Table 3. Goals for the LWP
Goal Timeframe
Short-term 1 - Identify the best subwatersheds and project sites for stormwater best management practices (BMPs).
Short-term 2 - Develop recommendations for improving stormwater management.
Long-term 3 - Seek funding for stormwater BMPs identified through the LWP.
Long-term 4 - Work with rural landowners to implement agricultural BMPs within priority subwatersheds.
Short-term 5 – Develop a rural preservation strategy.
Short-term 6 – Identify the best subwatersheds for various project types, and rank projects for implementation.
Long-term 7 – Evaluate the effectiveness of current local ordinances related to watershed protection, and:
a – Establish new local ordinances, as needed; and
b – Provide for more effective enforcement of existing rules/ordinances.
Short-term 8 – Develop a local Watershed Education Program.
Short-term 9 – Develop a Source Water Protection Plan for Cherryville.
5

SECTION II. WATERSHED ASSESSMENT METHODS This section details the methods that have been applied to assess conditions in the LWP area. These include:
▪ Geographic information systems (GIS) examination of riparian, floodplain and terrestrial habitat conditions;
▪ Monitoring of stream chemistry, biology, and habitat conditions; ▪ Field assessment of stream channels and riparian corridors; ▪ Field assessment of wetlands and wetland restoration opportunities; ▪ Examination of stormwater impacts in developed areas; and ▪ Review of existing reports and available data on local watershed conditions.
HABITAT ASSESSMENT METHODS Habitat assessments were conducted both remotely using GIS and through field examinations. Remotely, GIS was used to identify areas of potentially high quality forest, streams, and wetlands using a mix of data sets including soils, land cover, aerial photography and others as described in the Phase 1 report (NC EEP, 2008). Once identified, a subset of sites were visited, field verified, and their functions were evaluated using the following habitat assessment protocols:
Wetlands: Wetlands meeting soils, hydrology, and vegetation criteria (i.e., jurisdictional wetlands) were evaluated using the North Carolina Wetland Assessment Method (NC WAM). NC WAM provides a consistent, rapid, observational, scientifically-based field method to determine the level of function of a wetland relative to reference condition (NC WFAT, 2008). Using GIS data, 67 sites were identified to field evaluate wetland function. Of these, 29 met wetland criteria and were evaluated based on their habitat, hydrology, and water quality functions using NC WAM (NC DWQ, 2008). In addition to the NC WAM evaluations, 21 wetlands were assessed using the US Army Corps of Engineers wetland delineation procedures (1987) to determine restoration or enhancement potential by ENTRIX. Evaluations characterized the conditions of soils, hydrology and vegetation. These criteria were then used to rate wetland restoration or enhancement potential. Streams: Habitat assessments were performed on a mixture of stream types ranging from degraded to high quality. Streams were assessed using the standard NC DWQ Biological Assessment Unit (BAU) form for the Piedmont/Mountains included in the benthic macroinvertebrate sampling procedures (NC DWQ, 2006a). The parameters and their descriptions for this assessment are provided in Table 4. In total, 68 sites were visited and rated by three different groups including BAU (4 sites), WAT (18 sites) and ENTRIX (46 sites). These data were examined by stream reach and also averaged by subwatershed units that were delineated during Phase 1 of this project.
Finally, completion of the habitat assessment built upon data developed to identify high quality habitat during Phase 1. These data include forested wetlands, floodplains, and areas with long and contiguous riparian forest buffer (NC EEP, 2008)
6

Table 4. Description of NC DWQ Habitat Assessment Form metrics (NC DWQ, 2009a).
Metric Max Metric 1Number Score Name Description
I 5 Channel modification
Assesses the evidence of dredging and/or channel alterations.
Considers the percentage of a stream reach that is favorable for benthos colonization or fish cover. Type of cover assessed are rocks, macrophytes, sticks and leaf packs, snags and logs, and undercut banks or root mats.
II 20 In stream habitat
Represents an assessment of the entire reach for the sizes of particles (gravel, cobble, etc.) composing the stream bottom. Embeddedness is only assessed at riffles.
III 15 Bottom substrate
IV 10 Pool variety Assesses the presence/absence and frequency and sizes of pools.
V 16 Riffle habitats Assesses length and width of riffles.
VI 14 Stream bank stability and vegetation
Assesses bank stability and types of riparian vegetation (e.g. wooded, mixed, grasses, etc.).
Assesses whether the riparian vegetation (canopy) can block sunlight on the stream when the sun is directly above the stream.
VII 10 Light penetration
Riparian vegetation zone width
Assesses width of riparian vegetation and whether there are breaks in the vegetation. VIII 10
1 Metric number as used on the NCDWQ Habitat Assessment Field Data Sheet – Mountain/Piedmont Streams (NC DWQ, 2006a).
An assessment developed by the Natural Heritage Program (NHP) for the NC Conservation Planning Tool, the Biodiversity and Wildlife Habitat Assessment (BWHA), was adapted to consolidate and rank habitat data collected during LWP fieldwork. The BWHA represents an integrated framework consolidating a number of different state and federal datasets to help identify and protect biodiversity, wildlife, and their habitat. The BWHA was developed utilizing a stakeholder process where a group of habitat experts ranked data based on the three criteria of
7

rarity, habitat function, and data quality. Using a scale from 1 to 10, data comparing well in the three criteria are ranked high (i.e., closer to 10). For the LWP, this same framework was applied to identify and rank habitat data collected in the field and through GIS analyses. Appendix A contains more information on the methods and data used to develop the LWP-based version of the BWHA. Additionally, details on the original BWHA can be found in Chapter 4 of One NC Naturally Conservation Planning Tool (NC NHP, 2008). HYDROLOGIC ASSESSMENT METHODS Hydrology was assessed using a variety of field measures. First, NC EEP identified 50 sites where ENTRIX staff were directed to then assess the level of stream incision. Out in the field, seven of these sites were found to be ditches or too large, leaving 43 sites where stream incision was measured. During Phase 1, NC EEP used GIS to select the sites for field assessment based on their need for restoration/ enhancement (35 streams) and preservation (8 streams). Site selection criteria included the condition of riparian vegetation, land use, number of landowners, and the sites proximity to other features (e.g., protected lands or other project opportunities). ENTRIX used a Channel Capacity Ratio (CCR) to then determine the ability of high stream flow events to access the floodplain. The CCR compares field measurements of stream channel capacity against expected discharge estimates developed by the United States Geologic Survey (Pope et al., 2001). The result is a ratio of the cross-sectional area at the top-of-bank at a representative riffle section divided by the flow area of an estimated discharge of specific recurrence interval. ENTRIX (2009) further describes the CCR as follows:
Figure 2. ENTRIX staff measuring stream channel capacity and incision.
Cross-sectional data collected during the riparian corridor assessment was used to determine channel capacity ratios.... This information is extremely useful … to determine if channel adjustment (down-cutting) has occurred. This information may also be important for determining the frequency of flooding events at a given reach and the implications of these events for affecting adjacent floodplain wetland hydrology.
A second hydrologic assessment method utilized a submetric of the DWQ Stream Habitat Assessment Rating, the Bank Stability and Vegetation Assessment measure, to gage bank erosion and lateral stream stability. Figure 3 shows how this metric is scored. The measure ranges from 0 (i.e., severe bank erosion and instability) to 14 (i.e., most stable condition). This submetric was collected at 68 stream sites throughout the LWP area as detailed in the prior Habitat Assessment Methods Section. Finally, subwatersheds I-12 and I-14 in Cherryville and an additional site in subwatershed I-7 (i.e., West Lincoln High School) were visited to assess stormwater impacts and gage the
8
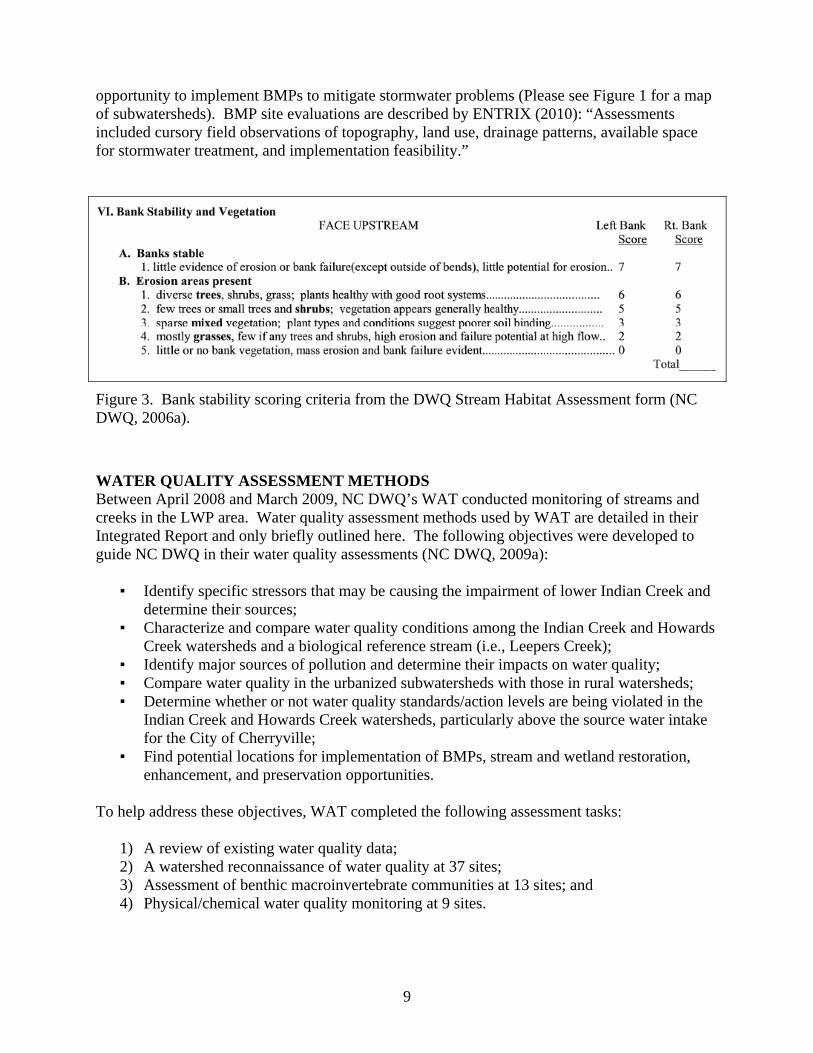
opportunity to implement BMPs to mitigate stormwater problems (Please see Figure 1 for a map of subwatersheds). BMP site evaluations are described by ENTRIX (2010): “Assessments included cursory field observations of topography, land use, drainage patterns, available space for stormwater treatment, and implementation feasibility.”
Figure 3. Bank stability scoring criteria from the DWQ Stream Habitat Assessment form (NC DWQ, 2006a).
WATER QUALITY ASSESSMENT METHODS Between April 2008 and March 2009, NC DWQ’s WAT conducted monitoring of streams and creeks in the LWP area. Water quality assessment methods used by WAT are detailed in their Integrated Report and only briefly outlined here. The following objectives were developed to guide NC DWQ in their water quality assessments (NC DWQ, 2009a):
▪ Identify specific stressors that may be causing the impairment of lower Indian Creek and determine their sources;
▪ Characterize and compare water quality conditions among the Indian Creek and Howards Creek watersheds and a biological reference stream (i.e., Leepers Creek);
▪ Identify major sources of pollution and determine their impacts on water quality; ▪ Compare water quality in the urbanized subwatersheds with those in rural watersheds; ▪ Determine whether or not water quality standards/action levels are being violated in the
Indian Creek and Howards Creek watersheds, particularly above the source water intake for the City of Cherryville;
▪ Find potential locations for implementation of BMPs, stream and wetland restoration, enhancement, and preservation opportunities.
To help address these objectives, WAT completed the following assessment tasks:
1) A review of existing water quality data; 2) A watershed reconnaissance of water quality at 37 sites; 3) Assessment of benthic macroinvertebrate communities at 13 sites; and 4) Physical/chemical water quality monitoring at 9 sites.
9
10
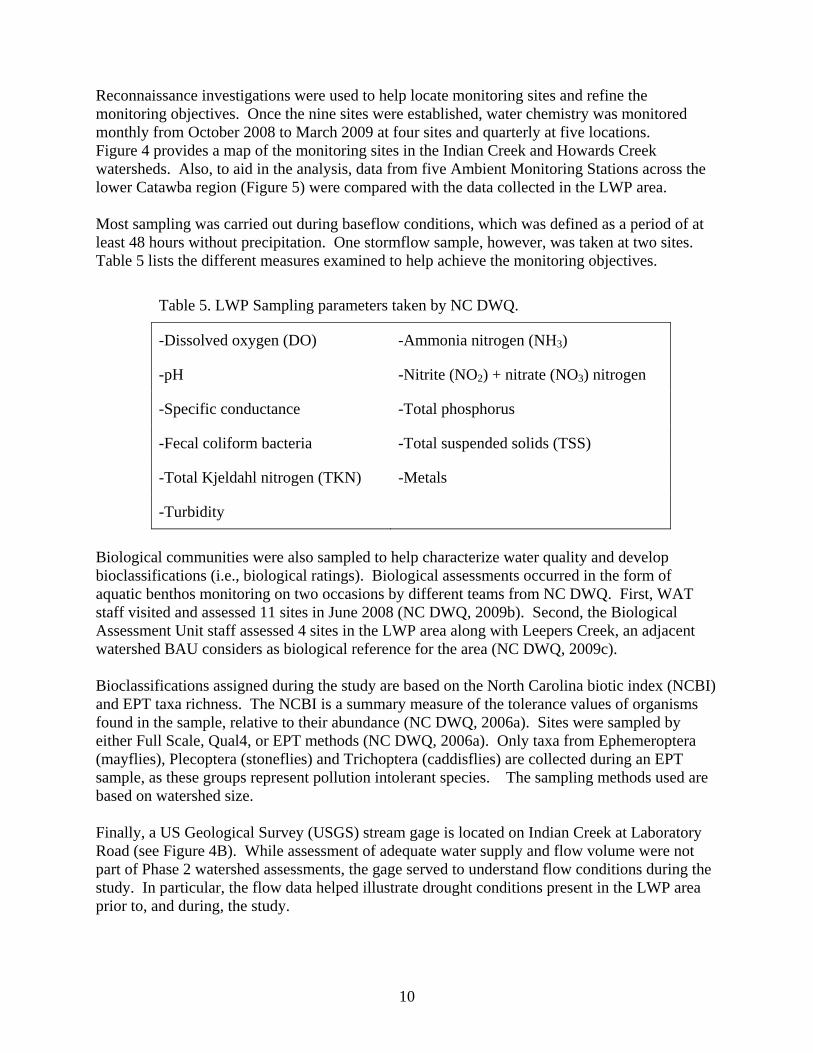
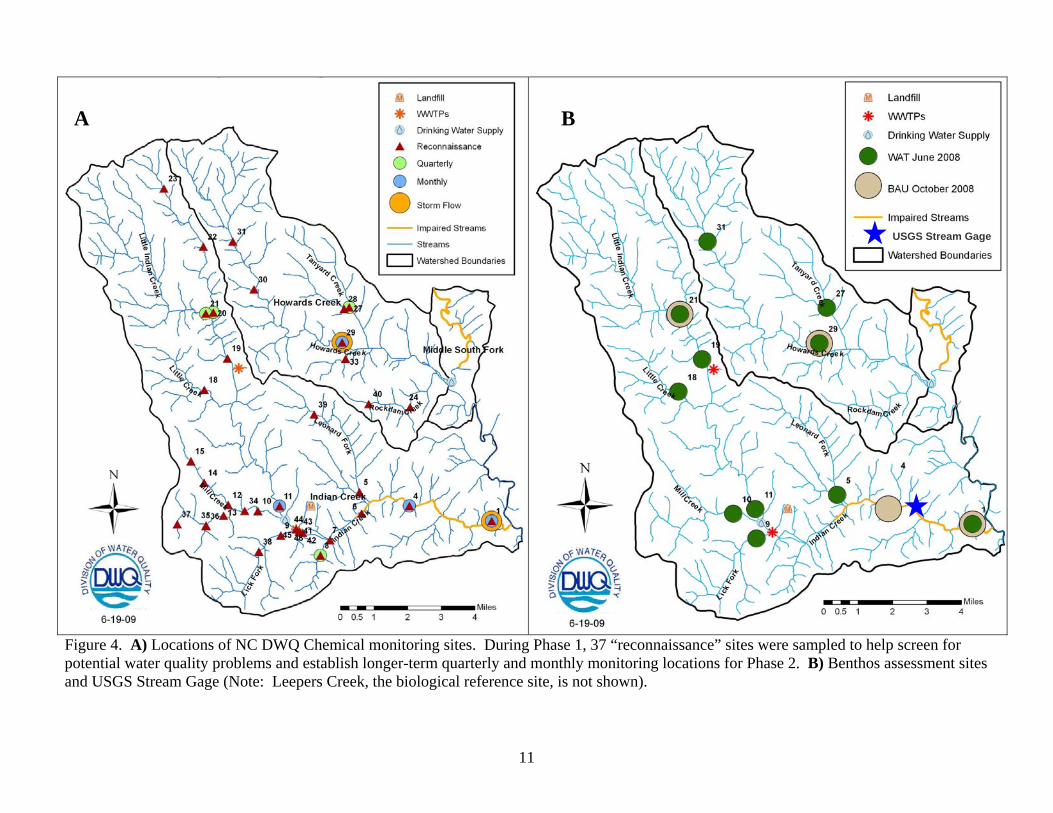
Reconnaissance investigations were used to help locate monitoring sites and refine the monitoring objectives. Once the nine sites were established, water chemistry was monitored monthly from October 2008 to March 2009 at four sites and quarterly at five locations. Figure 4 provides a map of the monitoring sites in the Indian Creek and Howards Creek watersheds. Also, to aid in the analysis, data from five Ambient Monitoring Stations across the lower Catawba region (Figure 5) were compared with the data collected in the LWP area. Most sampling was carried out during baseflow conditions, which was defined as a period of at least 48 hours without precipitation. One stormflow sample, however, was taken at two sites. Table 5 lists the different measures examined to help achieve the monitoring objectives.
Table 5. LWP Sampling parameters taken by NC DWQ.
-Dissolved oxygen (DO) -Ammonia nitrogen (NH3)
-pH -Nitrite (NO2) + nitrate (NO3) nitrogen
-Specific conductance -Total phosphorus
-Fecal coliform bacteria -Total suspended solids (TSS)
-Total Kjeldahl nitrogen (TKN) -Metals
-Turbidity
Biological communities were also sampled to help characterize water quality and develop bioclassifications (i.e., biological ratings). Biological assessments occurred in the form of aquatic benthos monitoring on two occasions by different teams from NC DWQ. First, WAT staff visited and assessed 11 sites in June 2008 (NC DWQ, 2009b). Second, the Biological Assessment Unit staff assessed 4 sites in the LWP area along with Leepers Creek, an adjacent watershed BAU considers as biological reference for the area (NC DWQ, 2009c). Bioclassifications assigned during the study are based on the North Carolina biotic index (NCBI) and EPT taxa richness. The NCBI is a summary measure of the tolerance values of organisms found in the sample, relative to their abundance (NC DWQ, 2006a). Sites were sampled by either Full Scale, Qual4, or EPT methods (NC DWQ, 2006a). Only taxa from Ephemeroptera (mayflies), Plecoptera (stoneflies) and Trichoptera (caddisflies) are collected during an EPT sample, as these groups represent pollution intolerant species. The sampling methods used are based on watershed size. Finally, a US Geological Survey (USGS) stream gage is located on Indian Creek at Laboratory Road (see Figure 4B). While assessment of adequate water supply and flow volume were not part of Phase 2 watershed assessments, the gage served to understand flow conditions during the study. In particular, the flow data helped illustrate drought conditions present in the LWP area prior to, and during, the study.
11
Figure 4. A) Locations of NC DWQ Chemical monitoring sites. During Phase 1, 37 “reconnaissance” sites were sampled to help screen for potential water quality problems and establish longer-term quarterly and monthly monitoring locations for Phase 2. B) Benthos assessment sites and USGS Stream Gage (Note: Leepers Creek, the biological reference site, is not shown).
USGS Stream Gage
A B

Figure 5. Locations of five regional AMSs in addition to Indian Creek and Leepers Creek, the biological reference site.
12

SECTION III. WATERSHED ASSESSMENT RESULTS
This section details the results of watershed assessments of habitat, hydrology, and water quality functions. Additionally, a summary of biological conditions is included at the end of the section. These results reflect the body of field assessments, GIS analyses, and other watershed evaluations that have occurred in support of the LWP. HABITAT Aquatic and terrestrial habitat assessments within the LWP area identified a range of habitat condition. These assessments help gage the quality of streamside habitat (Stream bank stability, riparian vegetation composition, and canopy cover), aquatic habitat structures (riffles, pools, leaf packs, root mats, sticks and logs, bottom substrate) and wetland habitat (vegetation composition and diversity, landscape position). They can also help identify areas that are being stressed and have the potential to degrade water quality. Aquatic Habitat Assessment Results Sixty-eight stream habitat assessments occurred in the LWP that are described by NCDWQ (2009a). The range of possible habitat scores is from 0 to 100. While no official guidance exists on how to interpret habitat scores, NC DWQ unofficially notes that “Sites with total habitat scores less than 65 are considered ones with habitat conditions that may be [negatively] influencing metrics for benthic macroinvertebrates” (NCDWQ, 2009a). Further, guidance from the Peachtree-Martins Local Watershed Plan LWP offers the following unofficial groupings as a guide to interpreting habitat scores (NC EEP, 2007):
▪ Excellent scores: 85 or higher ▪ Good scores: 65 - 84 ▪ Fair scores: 45 - 64 ▪ Poor scores: 44 or lower
Using this guidance, the mean habitat scores were calculated for each of the delineated subwatersheds. Of the 34 subwatersheds in the LWP, 29 had streams that were scored at least once using the DWQ habitat assessment protocol. Figure 6 gives a graphical look at the habitat assessment scores by subwatershed. Based on overall averages, habitat assessment scores in Indian Creek (Mean of 64) were 10 points higher than those in Howards Creek (Mean of 54), and over 30 points better than those in Middle-South Fork (Mean of 31). Two submetrics of the habitat assessment protocol with significant statistical difference between Indian Creek and Howards Creek are bottom substrate and riparian vegetation zone (NCDWQ, 2009a). Substrate is affected by an abundance of silt and sand that can be found in the LWP area streams, but particularly in Howards Creek. Indeed, several “sand dipping” (i.e., in-stream sand mining) operations have taken advantage of these excess materials and extract sand from the creeks for commercial purposes (see Figure 7B). In comparison, Leepers Creek, the biological reference site, the Bottom Substrate submetric scored better than both Indian Creek and Howards Creek (See Figure 8). This result suggests that sand and sediment levels may be abnormally elevated in the LWP area. A map of stream habitat assessment locations and a summary of scores by subwatershed are included in Figure 9.
13

Figure 6. Total Habitat Scores by Subwatershed. Average scores for Indian, Howards, and Mid-South Fork are shown in red. Watersheds where no streams were evaluated are not shown.
A B
Figure 7. A-Poor riparian vegetation (Upper Howards Creek). B. Crane extracting sand in lower Howards Creek. Poor riparian vegetation and substrate are key contributors to depressed stream habitat scores in the Howards Creek Watershed.
14

15
Figure 8. Comparison of habitat metrics between the Howards Creek watershed and the Indian Creek watershed. Metric scores from the reference site at Leepers Creek are provided for comparison. (N=39 in Indian Creek and N=27 in Howards Creek)

16
A B
Figure 9. A) Location of habitat assessments, scores and subwatersheds. B) Summary of stream habitat scores by Subwatershed. Average subwatershed score is shown in italic and the number of assessments per subwatershed is shown in parenthesis.
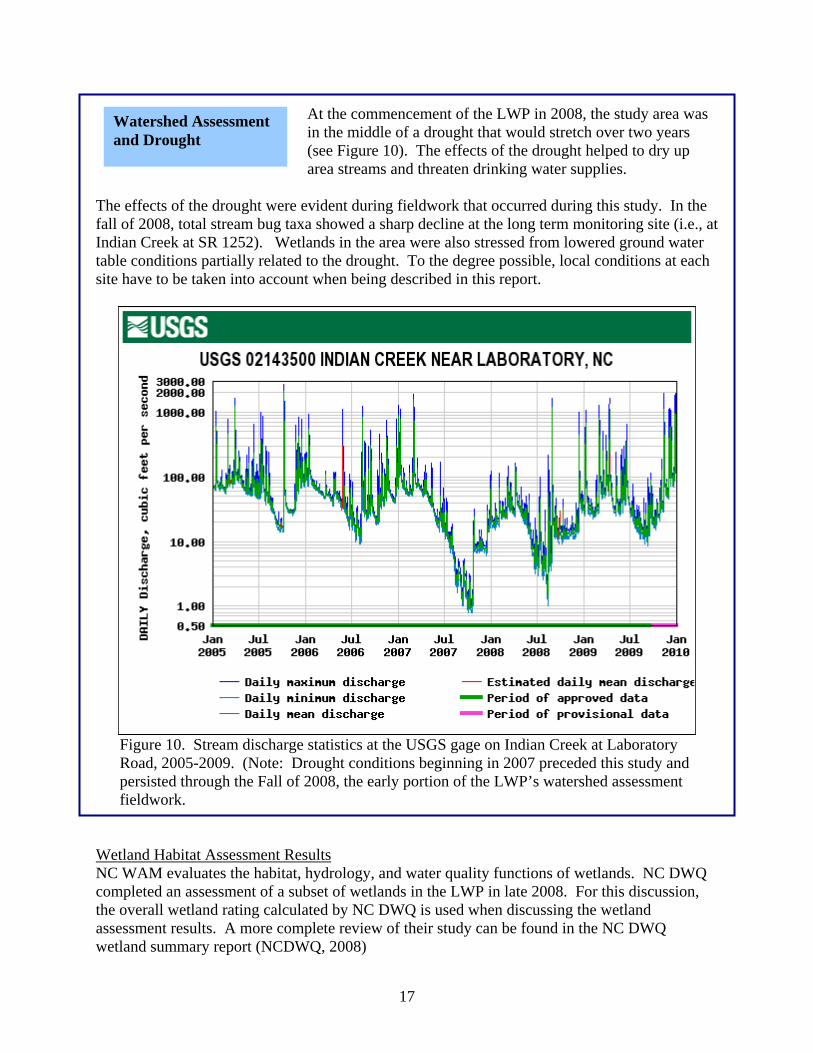
At the commencement of the LWP in 2008, the study area was in the middle of a drought that would stretch over two years (see Figure 10). The effects of the drought helped to dry up area streams and threaten drinking water supplies.
The effects of the drought were evident during fieldwork that occurred during this study. In the fall of 2008, total stream bug taxa showed a sharp decline at the long term monitoring site (i.e., at Indian Creek at SR 1252). Wetlands in the area were also stressed from lowered ground water table conditions partially related to the drought. To the degree possible, local conditions at each site have to be taken into account when being described in this report.
Figure 10. Stream discharge statistics at the USGS gage on Indian Creek at Laboratory Road, 2005-2009. (Note: Drought conditions beginning in 2007 preceded this study and persisted through the Fall of 2008, the early portion of the LWP’s watershed assessment fieldwork.
Watershed Assessment and Drought
Wetland Habitat Assessment Results NC WAM evaluates the habitat, hydrology, and water quality functions of wetlands. NC DWQ completed an assessment of a subset of wetlands in the LWP in late 2008. For this discussion, the overall wetland rating calculated by NC DWQ is used when discussing the wetland assessment results. A more complete review of their study can be found in the NC DWQ wetland summary report (NCDWQ, 2008)
17

Wetlands in Indian Creek tended to rate higher than those in Howards when their functions were evaluated using NCWAM (See Figure 11). Of the 29 wetlands identified and evaluated, 23 were located in the Indian Creek watershed and 6 were in Howards Creek watershed. Over 70% of the wetlands were in the geomorphic floodplain or in close proximity to streams (i.e., Bottomland Hardwood, Riverine Swamp Forests). Of the wetlands found in Indian Creek, 70% were rated as High functioning (16 wetlands). In Howards Creek, however, 67% of wetlands were rated as Low (4 wetlands).
% o
f Tot
al
31%
10%
59%
Overall Rating
0
5
10
15
20
N
4
1 1
5
2
16
LOW MED HIGH LOW MED HIGH
Howards Cr Indian Cr
Overall Rating within Watershed
BA
Figure 11. A) NC WAM Overall Function ratings as a percentage of assessments. B) NC WAM Overall Function rating by Watershed. The number of sites assessed is indicated above each rating’s bar. (Source: NC DWQ, 2009a)
Habitat Assessment Prioritization Results Field data and GIS assessment resulted in an addition of 884 acres of high quality habitat to the existing BWHA. Of the new area, 764 of the acres, about 85%, were added in the Indian Creek watershed. The remaining 120 acres were added to Howards Creek. The additional acres were a mix of high quality and high functioning streams and riparian areas. One unique geological site was added as well. That site, Warlick Mill, contains outcrops of unique rock formations that results in a series of slick rock falls along Tanyard Creek (see Figure 12). It is an excellent example of the lower Tallulah Falls Formation, a geologic layer of the Inner Piedmont. Figure 13 presents the revised BWHA based on results from LWP fieldwork. More information on the habitat prioritization assessment can be found in Appendix A.
18

B A
Figure 12. A) Lower end of the slick rock at Warlick Mill on Tanyard Creek. B) A Spring Salamander (Gyrinophilus porphyriticus) at the site is uncommon in the LWP area but more prevalent in the mountains.
19

Figure 13. The LWP-based Biodiversity and Wildlife Habitat Map. For details on the assessment, see Appendix A.
20

21
HYDROLOGY Results from fieldwork completed by ENTRIX Inc. and NC DWQ are summarized here to evaluate stream hydrology. These results are taken from a series of reports (ENTRIX, 2009, NC DWQ, 2009a) detailing assessments of hydrologic conditions at 68 stream sites in the LWP area. Stream Incision ENTRIX assessed the level of stream incision at 43 sites in the LWP area. Figure 14 provides photos of high and low scoring sites. Generally, less incised sites have a lower CCR. Ideally, the CCR should be close to one meaning that flood flows are accessing the floodplain, thereby reducing stress on stream banks. Sites with a greater CCR values tend to have confined channels where flood flows have difficulty accessing the floodplain. These channels are often incised with steep stream banks.
Figure 14. Channel Capacity Assessments. A) Low CCR value site on upper Mill Creek. B) High value site on an unnamed tributary (UT) to Howards Creek. Note the difference in the bank angle from Site A to Site B. High CCR value sites tend to have incised channels which inhibit flood flows from accessing the floodplain. A value of one or less suggests storm flows are capable of accessing the floodplain.
Figure 15A shows the average score for subwatersheds where one or more streams were measured for their level of incision using the CCR. Subwatersheds in both Indian Creek and Howards Creek had streams that were highly incised. Indian Creek, however, had an average CCR of 2.3 which was slightly higher than Howards (2.1) (See Table 6). Bank Stability A second field measure was used to assess hydrologic condition. This measure, the Bank Stability submetric of the DWQ Stream Habitat Assessment Protocol, was utilized to help evaluate stream bank stability at 68 sites in the LWP area. Values of the submetric range from zero (unstable) to 14 (stable). Figure 16 provides examples of good and poor scoring sites. Figure 15B shows the Bank Stability average score by subwatershed. Overall, bank stability scores at sites in Indian Creek were higher than those in Howards, 9.5 verses 7.2, respectively

22
Figure 15. Field Hydrologic Measures by Subwatershed. A) Channel Incision Rating. A value of one indicates flood flows should have access to the floodplain. B) Bank Stability Submetric. Scores range from zero (unstable) to 14 (stable). (Note: Average subwatershed score is shown in italic and the number of assessments per subwatershed is shown in parenthesis.)
B A
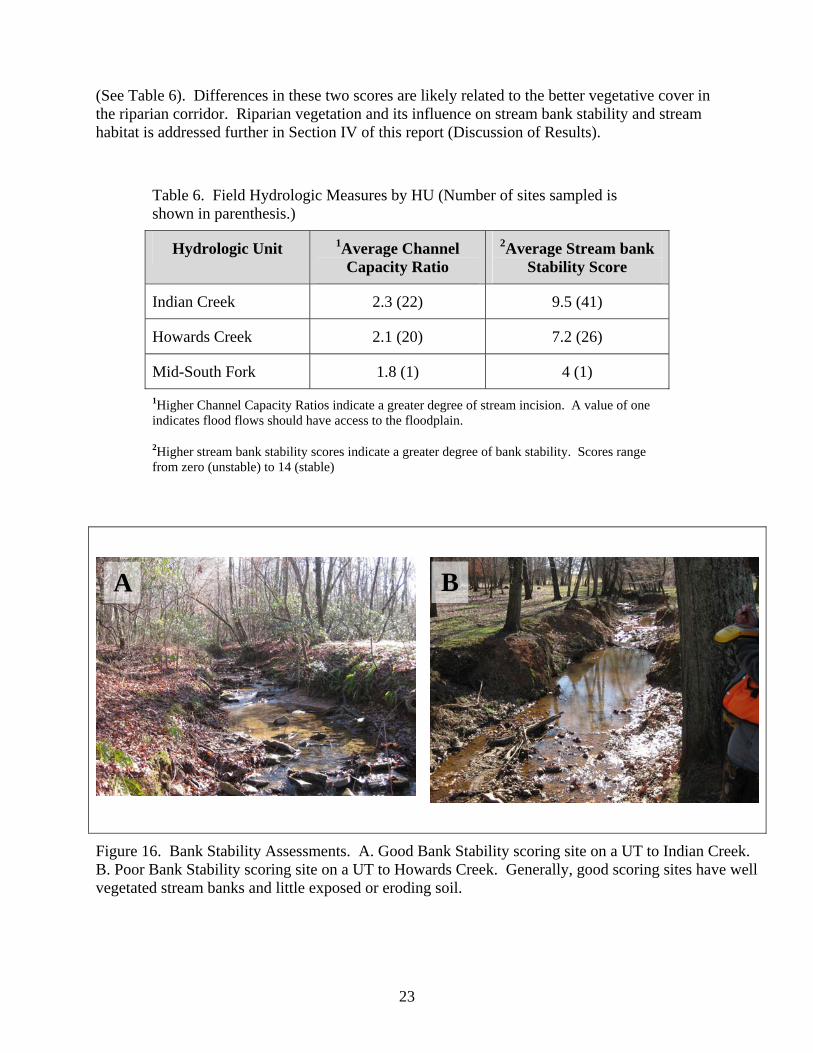
(See Table 6). Differences in these two scores are likely related to the better vegetative cover in the riparian corridor. Riparian vegetation and its influence on stream bank stability and stream habitat is addressed further in Section IV of this report (Discussion of Results).
Table 6. Field Hydrologic Measures by HU (Number of sites sampled is shown in parenthesis.)
1 2Hydrologic Unit Average Channel Average Stream bank Capacity Ratio Stability Score
Indian Creek 2.3 (22) 9.5 (41)
Howards Creek 2.1 (20) 7.2 (26)
Mid-South Fork 1.8 (1) 4 (1)
1Higher Channel Capacity Ratios indicate a greater degree of stream incision. A value of one indicates flood flows should have access to the floodplain.
2Higher stream bank stability scores indicate a greater degree of bank stability. Scores range from zero (unstable) to 14 (stable)
BA
Figure 16. Bank Stability Assessments. A. Good Bank Stability scoring site on a UT to Indian Creek. B. Poor Bank Stability scoring site on a UT to Howards Creek. Generally, good scoring sites have well vegetated stream banks and little exposed or eroding soil.
23

Stormwater RunoffTwo subwatersheds in Cherryville, I-12 and I-14, were evaluated for impacts from stormwater runoff along with one site in subwatershed I-7, where runoff from West Lincoln High School drains to a UT to Indian Creek. In Lick Creek (i.e., subwatershed I-12) and UT to Indian Creek Subwatershed I-14, three priority BMP sites were based on project feasibility and ability to treat runoff. An additional opportunity was also documented at the West Lincoln High School where runoff from the School’s parking lot is causing erosion to the receiving stream (See Figure 17A). These sites are shown on Figure 18 and will be profiled in the Project Atlas to be published with the next LWP report (i.e., Watershed Management Plan). During the study, a concerned landowner contacted NC EEP to report a severe erosion problem associated with flow from a poorly designed stormwater treatment BMP draining the Cherryville WalMart in subwatershed I-15. Visits to the site revealed that extreme channel erosion was occurring and transporting many tons of sediment to Indian Creek (see Figure 17B). Stormwater runoff from impervious surfaces at the WalMart in Cherryville had contributed to the erosion downstream of the stormwater detention basin. Holding time in the basin appeared to be inadequate and flow out of the basin was overwhelming the channel capacity of the small UT receiving the runoff. The result is that a large gulley has formed on the impacted parcel and erosion has damaged the habitat of the small UT, along with sending tons of sediment to the lower portion of Indian Creek. The landowner of the affected site was in negotiation with WalMart to fix the problem but the site illustrates the problems that can arise from stormwater runoff associated with poor development practices.
A B
Figure 17. Stormwater Runoff Impacts. A-Gully forming from parking lot runoff at West Lincoln High School. B – Gully migrating upstream due to poorly designed stormwater BMP upstream at the Cherryville WalMart.
24
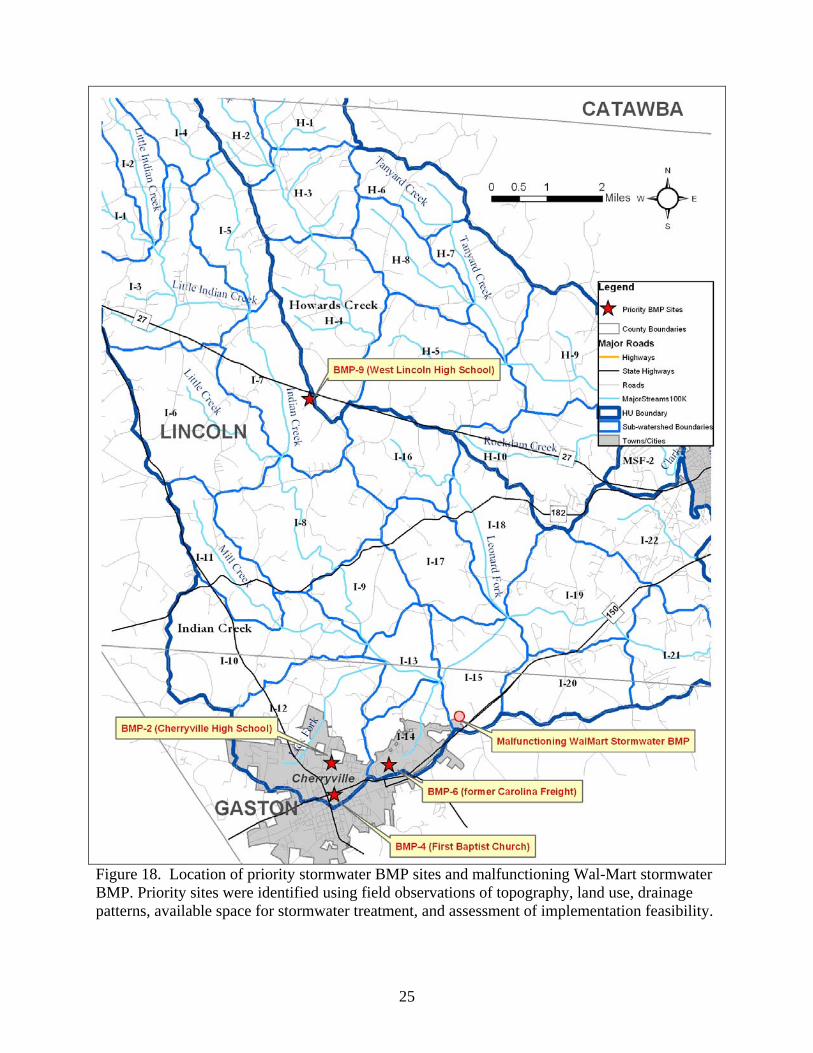
Figure 18. Location of priority stormwater BMP sites and malfunctioning Wal-Mart stormwater BMP. Priority sites were identified using field observations of topography, land use, drainage patterns, available space for stormwater treatment, and assessment of implementation feasibility.
25

26
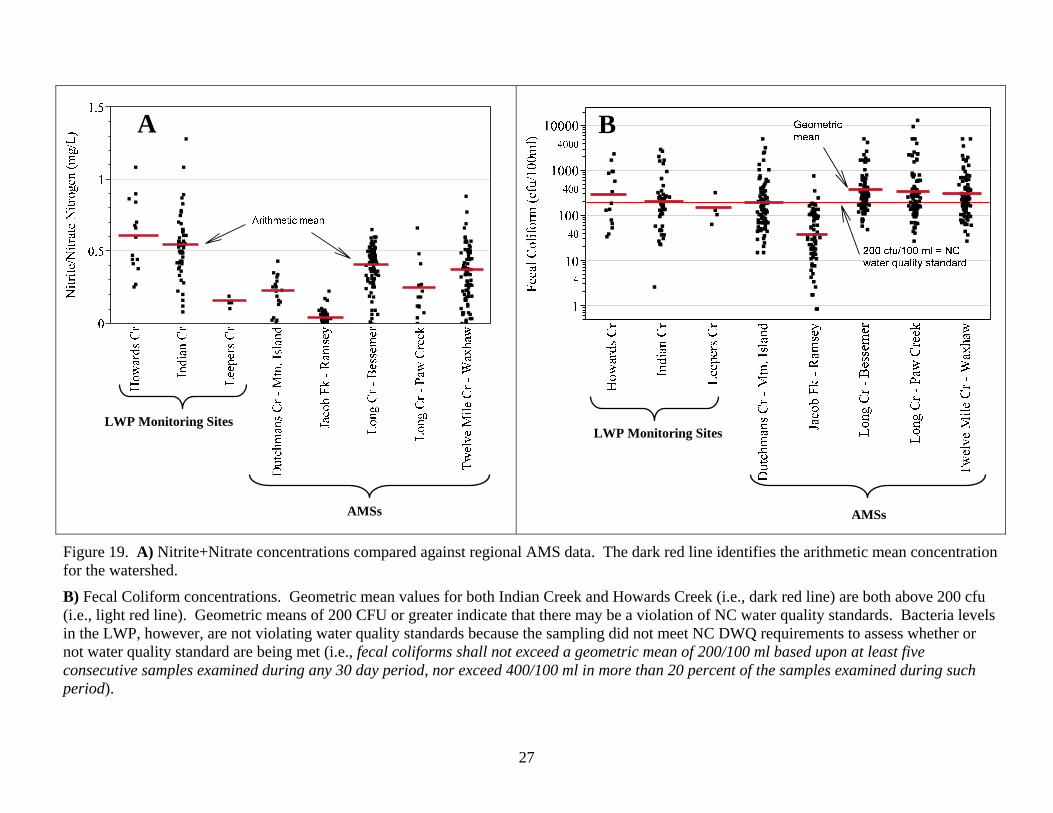
WATER QUALITY NC DWQ’s Integrated Report provides a complete review of water quality monitoring results for Indian Creek and Howards Creek (NC DWQ, 2009a). A summary of their results is provided here. Water quality monitoring results in the LWP area tended to be consistent with those data from regional ambient monitoring stations (AMSs) shown previously in Figure 5. Measures of DO, TKN, NH3, TP, and Turbidity were either below NC water quality standards or similar to regional AMS results. Specific conductance, a general measure of the amount of pollutants in the stream, was relatively low in most of the LWP area except for Indian Creek downstream of the Cherryville waste water treatment plant (WWTP). Here, discharge from the WWTP, combined with urban runoff from Cherryville and agricultural sources upstream, likely contribute to elevated pollutants in the stream. Some measures, however, raise concerns over water quality. Compared with the data from five regional AMSs, there were evidence of elevated nitrite/nitrate. Figure 19A provides a graphical display of this data comparison. Mean concentrations of nitrite + nitrate nitrogen from Howards Creek and Indian Creek were 0.62 mg/L and 0.56 mg/L, respectively. Averages of other sites ranged from a low of 0.07 mg/L at Jacobs Fork to a high of 0.4 mg/L at Long Creek, all below average concentrations of the LWP. Class C waters lack a water quality standard for nutrients, but have a nitrite/nitrate standard of 10 mg/L for water supply watersheds. Figure 20A provides median concentrations for nitrites/nitrates by monitoring site in the LWP area. To comply with NC water quality standards, NC DWQ requires that fecal coliforms shall not exceed a geometric mean of 200 cfu/100 ml based upon at least five consecutive samples examined during any 30 day period (i.e., 5 samples in 30 days), nor exceed 400 cfu/100 ml in more than 20 percent of the samples examined during such period. During this study, the 5-in-30 days sampling threshold was never attempted due to logistical reasons (i.e., location of State sample processing labs and processing time requirements). As a result, the data presented for monitoring sites can not be used to determine whether or not water quality standards for fecal coliform bacteria are being violated. Fecal coliforms, indicators of pathogenic organisms which could impact human health, were also present at high levels. NC DWQ (2009a) reporting on these levels states “the overall geometric mean for the LWP area was 216 colony-forming units (cfu)/100 ml, with one baseflow sample at each of six different locations exceeding 1500 cfu/100 ml: Tanyard Cr at SR1113, Indian Cr at SR1129 and SR1168, Mill Cr at SR1168, UT to Indian Cr at SR1636, and Leonard Fork at SR1180.” By comparison, the geometric mean for Leepers Creek, the biological reference location, was 150 cfu/100 ml. As shown in Figure 19B, the high bacteria concentrations in the LWP seem to be also present at regional AMSs. The median at 4 out of 5 AMSs outside the LWP area were above 200 cfu. These data suggest that streams in Indian Creek and Howards Creek may contain pathogenic organisms that could be harmful to both the health of humans. Figure 20B provides median fecal coliform counts by monitoring site in the LWP area.
A B
LWP Monitoring Sites LWP Monitoring Sites
AMSs AMSs
Figure 19. A) Nitrite+Nitrate concentrations compared against regional AMS data. The dark red line identifies the arithmetic mean concentration for the watershed.
B) Fecal Coliform concentrations. Geometric mean values for both Indian Creek and Howards Creek (i.e., dark red line) are both above 200 cfu (i.e., light red line). Geometric means of 200 CFU or greater indicate that there may be a violation of NC water quality standards. Bacteria levels in the LWP, however, are not violating water quality standards because the sampling did not meet NC DWQ requirements to assess whether or not water quality standard are being met (i.e., fecal coliforms shall not exceed a geometric mean of 200/100 ml based upon at least five consecutive samples examined during any 30 day period, nor exceed 400/100 ml in more than 20 percent of the samples examined during such period).
27

28
Figure 20. A) Median nitrite + nitrate concentrations at LWP monitoring sites. B) Median fecal coliform concentrations at LWP monitoring sites.
B A

BIOLOGICAL ASSESSMENTS For this study, two separate biological surveys were completed: NC DWQ’s June 2008 study (NC DWQ, 2009b) and October 2008 (NC DWQ, 2009c) results are summarized here. WAT completed benthos assessments at 11 sites in June 2008 to help characterize stream biology and gage the impact of drought on streams. BAU followed that study in October by assessing four locations in the LWP and at one site in Leepers Creek, the biological reference site for this study. There were three sites where both BAU and WAT completed assessments, making for 12 assessment sites within the LWP area and one outside (i.e., Leepers Creek). Taken from NC DWQ’s Integrated Report (2009a), Table 7 provides current and historical bioclassifications for streams within the LWP area. These ranged from Poor (Mill Creek) to Good (multiple locations). Of the most recent monitoring in Indian Creek, scores were split between Good-Fair and Good (four sites each). One site, Mill Creek, received a Poor bioclassification. In Howards Creek, the most recent ratings were Good-Fair. BAU noted evidence of drought stress in their study of report (NC DWQ, 2009c). Between the summer of 2007 and the fall of 2008, the time preceding the BAU study, the LWP area had experienced Severe-to-Exceptional drought (NC EEP, 2008). At Indian Creek at SR 1252, one of the long-term benthic study sites, total taxa remained at a fairly constant level, averaging 67
Table 7. Historic and recent bioclassifications in the Indian Creek and Howards Creeks watersheds (Source: NC DWQ, 2009a).1
Map Code2 Location3
Aug
-97
Aug
-02
Feb-
03
May
-06
Jun-
08
Oct
-08
Sep-
03
31 Howards Cr SR1113 -- -- -- -- -- GF -- 29 Howards Cr SR1200 G GF -- -- G G GF 27 Tanyard Cr SR1113 -- -- -- -- -- GF -- 21 Little Indian Cr SR1129 -- -- -- -- -- GF G 19 Indian Cr NC 27 -- -- -- -- -- G -- 18 Little Cr SR1150 -- -- -- -- -- GF -- 11 Indian Cr SR1168 -- -- -- -- -- G -- 10 Mill Cr SR1168 -- -- -- -- -- P -- 9 Lick Fork SR1637 -- -- -- -- -- GF -- 5 Leonard Fork SR1180 -- -- -- -- -- G -- 4 Indian Cr SR1177 -- F NR GF F -- GF 1 Indian Cr SR1252 G -- -- -- G G GF
none Leepers Cr SR1354 -- -- -- G G -- G 1 Bioclassifications: E = Excellent; G = Good; G-F = Good-Fair; F = Fair; P = Poor. 2 See Figure 4B for Map Locations
3 Locations are oriented in upstream to downstream order by major watershed. The June 2008 assessments were conducted by WAT benthic biologists. All other assessments were made by BAU benthic biologists.
29

between the years 1983 to 2006. In 2008, however, total taxa dropped to 48, likely due to low flow in the stream related to the drought (See Figure 21). In spite of this drop, the next upstream site, Indian Creek at SR 1177, showed marginal improvement in its bioclassification (i.e., from Fair to Good-Fair). This improved rating, however, came with a decrease in the EPT Taxa abundance and BAU notes that this evidence “suggests that this site may continue to vacillate between Fair and Good-Fair.” The highest bioclassification scores were in the headwaters of Indian Creek (Little Indian Creek at SR1129 - Site 21 on Figure 4B). BAU noted that this site had “the highest total taxa (87) and EPT taxa (26)”. They also noted the biotic index suggests a benthic community not tolerant of pollution. This site also had a high habitat score (scoring 93 out of 100). Leonard Fork at SR 1180 (Site 5 on Figure 4B) also has highly rated benthic macroinvertebrate communities. Like Little Indian Creek at SR1129, it is a headwater system flowing into Indian Creek. WAT staff who assessed the site state that it “received a Good bioclassification with more taxa (67) and higher abundance of EPT (103) than any other Qual 4 sample in this study. The 5.10 Biotic Index at this site was the second lowest (most intolerant), indicating healthy biotic conditions at the site (NC DWQ, 2009b). Conversely, the lowest rated site was found at Mill Creek at SR1168. This creek has good riparian cover for most of its length but a large dairy operation is present at the downstream end where the stream benthos were sampled. According to DWQ, “Only six EPT taxa were collected here, which gave the site a Poor bioclassification. The 6.93 Biotic Index was nearly a full unit higher than any other site in this study, also indicating degraded conditions” (NC DWQ, 2009b). The owner of the dairy operation has made a number of improvements to the site, including fencing cattle away from the stream and improved animal waste management systems. It was noted during fieldwork, however, that while there is fencing on the site, it was at close proximity to the stream banks with little woody vegetation in the riparian buffer. Consequently, there was direct runoff of nutrients to the stream. A similar situation was noted in Tanyard Creek. The location of a cattle operation just upstream of monitoring site 27 has resulted in the significant degradation to the Creek. Here, DWQ notes “the cattle had destabilized the stream banks and removed most of the vegetation. This allowed
Figure 21. Current and historic Biologic Data at Indian Creek at SR 1252. BAU staff note that drought in 2007/2008 likely contributed to the drop in total taxa between 2006 and 2008.
30
large amounts of sediment into this reach, which filled in pools and buried riffles and large woody debris” resulting in a low habitat score of 42 and a biotic rating at the lower portion of the Good-Fair rating (NC DWQ, 2009b).
31
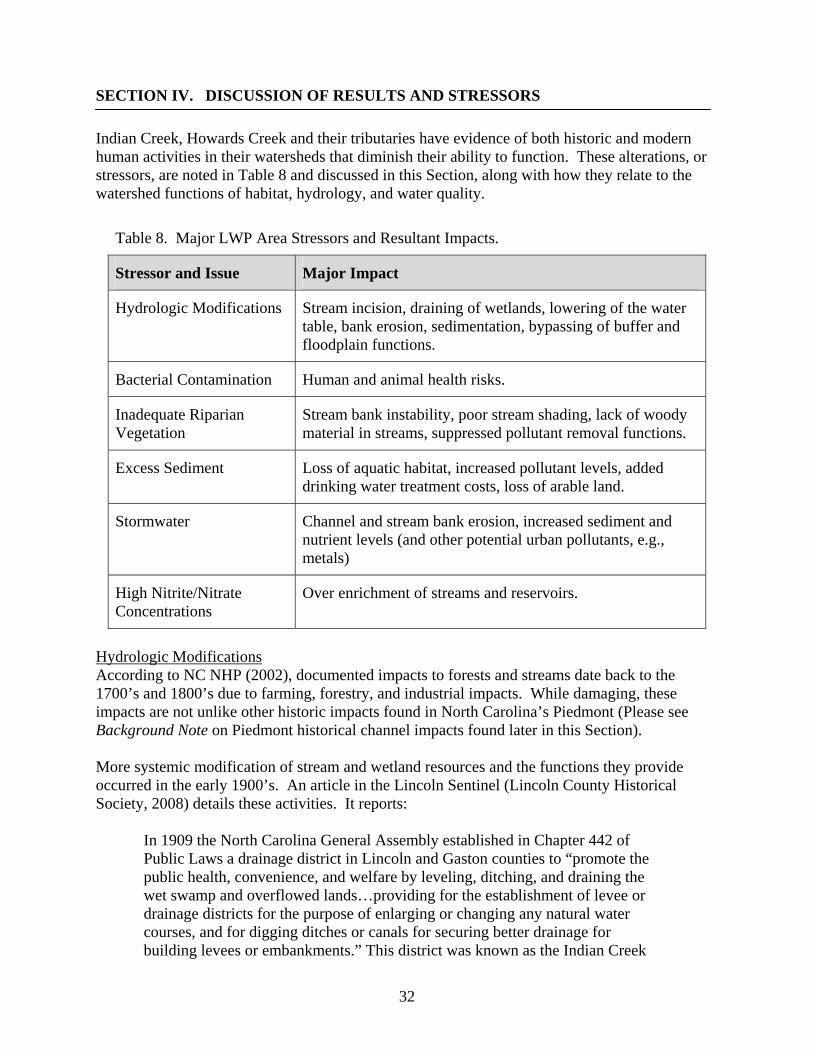
SECTION IV. DISCUSSION OF RESULTS AND STRESSORS Indian Creek, Howards Creek and their tributaries have evidence of both historic and modern human activities in their watersheds that diminish their ability to function. These alterations, or stressors, are noted in Table 8 and discussed in this Section, along with how they relate to the watershed functions of habitat, hydrology, and water quality.
Table 8. Major LWP Area Stressors and Resultant Impacts.
Stressor and Issue Major Impact
Hydrologic Modifications Stream incision, draining of wetlands, lowering of the water table, bank erosion, sedimentation, bypassing of buffer and floodplain functions.
Bacterial Contamination Human and animal health risks.
Inadequate Riparian Vegetation
Stream bank instability, poor stream shading, lack of woody material in streams, suppressed pollutant removal functions.
Excess Sediment Loss of aquatic habitat, increased pollutant levels, added drinking water treatment costs, loss of arable land.
Stormwater Channel and stream bank erosion, increased sediment and nutrient levels (and other potential urban pollutants, e.g., metals)
High Nitrite/Nitrate Concentrations
Over enrichment of streams and reservoirs.
Hydrologic Modifications According to NC NHP (2002), documented impacts to forests and streams date back to the 1700’s and 1800’s due to farming, forestry, and industrial impacts. While damaging, these impacts are not unlike other historic impacts found in North Carolina’s Piedmont (Please see Background Note on Piedmont historical channel impacts found later in this Section). More systemic modification of stream and wetland resources and the functions they provide occurred in the early 1900’s. An article in the Lincoln Sentinel (Lincoln County Historical Society, 2008) details these activities. It reports:
In 1909 the North Carolina General Assembly established in Chapter 442 of Public Laws a drainage district in Lincoln and Gaston counties to “promote the public health, convenience, and welfare by leveling, ditching, and draining the wet swamp and overflowed lands…providing for the establishment of levee or drainage districts for the purpose of enlarging or changing any natural water courses, and for digging ditches or canals for securing better drainage for building levees or embankments.” This district was known as the Indian Creek
32

Drainage District of Lincoln and Gaston counties and measured one mile in width and eight miles in length.
The area noted in the article starts at the terminus of Indian Creek at the South Fork of the Catawba River and continues upstream to near Cherryville. Figure 22 is a historic photo of the dredging operation. Its impacts included the draining of swamps, removal of riparian vegetation, levee building, and channelizing of streams. These activities stress stream and wetland functions, necessitating environmental restoration or enhancement. While the documented historic dredging occurred in the lower part of Indian Creek, much of its upstream tributaries exhibit a high degree of stream incision. These may be a result of systematic environmental modification in the early 1900’s or other human led landscape changes (see Background Note on next page). In either case, persistent effects of this dredging and channelization may be stressors that continue to affect the marginal bioclassifications for Indian Creek
Figure 22. Lower Indian Creek stream dredging circa 1915 (Photo courtesy of the Lincoln County Historical Society.)
1. Impacts of the dredging were also noted in the study of wetlands completed for the LWP (NC DWQ, 2008). Stream incision, one of the relics of the dredging, has two main impacts on adjacent wetlands. First, it can lead to a lowering of the water table, changing the vegetative composition of a wetland. Second, NCDWQ states “the loss of connection between streams and floodplains effectively cut off a primary water source for certain wetland types (e.g., bottomland hardwood forests, riverine swamp forests)” by reducing or eliminating overbank flooding. As a result, the water quality, hydrology, and habitat benefits that these features provide are stressed, affecting the overall functioning of LWP wetlands.
1 While it is not known if dredging occurred along parts of Howards Creek, neighboring streams such as Clarks Creek were dredged in the same time period as Indian Creek (NC DWQ 2002). Consequently, it is likely that at least the lower part of Howards Creek was also dredged in the early 20th Century.
33
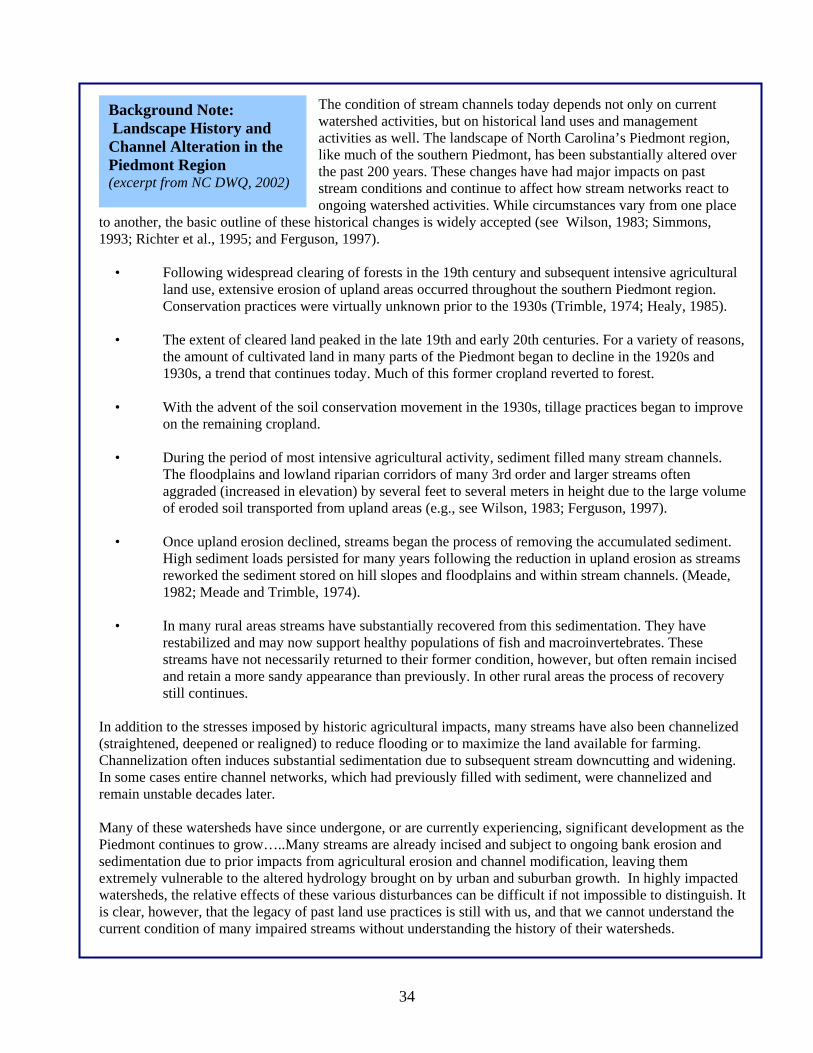
Background Note: Landscape History and Channel Alteration in the Piedmont Region (excerpt from NC DWQ, 2002)
The condition of stream channels today depends not only on current watershed activities, but on historical land uses and management activities as well. The landscape of North Carolina’s Piedmont region, like much of the southern Piedmont, has been substantially altered over the past 200 years. These changes have had major impacts on past stream conditions and continue to affect how stream networks react to ongoing watershed activities. While circumstances vary from one place
to another, the basic outline of these historical changes is widely accepted (see Wilson, 1983; Simmons, 1993; Richter et al., 1995; and Ferguson, 1997).
• Following widespread clearing of forests in the 19th century and subsequent intensive agricultural land use, extensive erosion of upland areas occurred throughout the southern Piedmont region. Conservation practices were virtually unknown prior to the 1930s (Trimble, 1974; Healy, 1985).
• The extent of cleared land peaked in the late 19th and early 20th centuries. For a variety of reasons,
the amount of cultivated land in many parts of the Piedmont began to decline in the 1920s and 1930s, a trend that continues today. Much of this former cropland reverted to forest.
• With the advent of the soil conservation movement in the 1930s, tillage practices began to improve
on the remaining cropland. • During the period of most intensive agricultural activity, sediment filled many stream channels.
The floodplains and lowland riparian corridors of many 3rd order and larger streams often aggraded (increased in elevation) by several feet to several meters in height due to the large volume of eroded soil transported from upland areas (e.g., see Wilson, 1983; Ferguson, 1997).
• Once upland erosion declined, streams began the process of removing the accumulated sediment.
High sediment loads persisted for many years following the reduction in upland erosion as streams reworked the sediment stored on hill slopes and floodplains and within stream channels. (Meade, 1982; Meade and Trimble, 1974).
• In many rural areas streams have substantially recovered from this sedimentation. They have
restabilized and may now support healthy populations of fish and macroinvertebrates. These streams have not necessarily returned to their former condition, however, but often remain incised and retain a more sandy appearance than previously. In other rural areas the process of recovery still continues.
In addition to the stresses imposed by historic agricultural impacts, many streams have also been channelized (straightened, deepened or realigned) to reduce flooding or to maximize the land available for farming. Channelization often induces substantial sedimentation due to subsequent stream downcutting and widening. In some cases entire channel networks, which had previously filled with sediment, were channelized and remain unstable decades later. Many of these watersheds have since undergone, or are currently experiencing, significant development as the Piedmont continues to grow…..Many streams are already incised and subject to ongoing bank erosion and sedimentation due to prior impacts from agricultural erosion and channel modification, leaving them extremely vulnerable to the altered hydrology brought on by urban and suburban growth. In highly impacted watersheds, the relative effects of these various disturbances can be difficult if not impossible to distinguish. It is clear, however, that the legacy of past land use practices is still with us, and that we cannot understand the current condition of many impaired streams without understanding the history of their watersheds.
34

Bacterial Contamination Data collected during Phase 2 of the LWP illustrate the how cattle accessing streams can result in severe impacts to stream health. The geometric mean for bacteria levels in the LWP area exceeded 200 cfu/100 ml, an evaluation level used to gage the health of streams. Five of the six sites with the highest bacteria counts had livestock either accessing the stream or inadequate stream buffers in livestock pasture upstream of the monitoring site. As a result, there was little filtering of runoff and direct input of animal waste to the stream, threatening human health and stressing the aquatic ecosystem.
Figure 23. Cattle accessing the stream at Tanyard Creek.
Inadequate Riparian Vegetation Figure 24 provides riparian land cover statistics for areas upstream of monitoring sites. Examination of these statistics helps reinforce the impact that livestock can have on streams. In spite of research demonstrating the importance of riparian buffers to aquatic health (Sweeney et al., 2004), monitoring sites with the highest levels of riparian forest cover in their watersheds (i.e., Mill Creek at SR1168 and Tanyard Creek at SR1113) had the most degraded biotic communities. While this may seem to contradict our understanding of the importance of stream buffers, it is, more likely, reflective of the role that cattle play as stressors to stream functions. At the two monitoring sites, cattle graze streamside vegetation and destabilize stream banks, allowing for direct runoff of nutrients, bacteria, and sediment to the stream. The net affect is that cattle grazing over a relatively short portion of the stream results in a stream with degraded habitat and stressed biological communities, negating a landscape further upstream that is supportive of a vibrant stream ecosystem. Excess Sediment During stream habitat assessments, an excess level of sediment was noted in many the LWP area streams. Evidence of this condition includes sand dipping operations, sand bars in streams, and poor substrate scores recorded during stream assessments. As show in Figure 25, streams with excess sediment will often have large depositional areas within the stream banks. Problems for aquatic habitat arise when streambed habitat such as riffle areas become embedded with sand or silt, killing off aquatic organisms that live and reproduce on the stream bottom. Sources for this sediment are often unstable stream banks that are eroding due to high velocity flows, a lack of streamside woody vegetation, or hoof sheer from livestock accessing streams. These stressor sources were noted throughout both watersheds, but were more frequently observed in Howards Creek.
35

GF GF GF G G GF G P GF G GF GF
Site Bio-classifications1
Figure 24. Bioclassifcations and watershed riparian land cover for biological monitoring sites. Cattle related impacts at sites 27 and 10 contributed to their lower ratings. 1Site Bioclassifications based on the most recent rating from Table 7. Bioclassifications: E = Excellent;
G = Good; G-F = Good-Fair; F = Fair; P = Poor.
Figure 25. Side bar sediment deposition. Substrate habitat is hindered by an overabundance of sand and silt in streams (Upper Howards Creek).
36

Stormwater Urban land cover in the LWP area remains fairly low (9%) when compared with agriculture (49%) and forest (40%) (NC EEP, 2008). In certain areas, however, development has altered natural runoff process enough to become problematic to downstream channels and their biota. Stressors associated with this runoff from development include high-velocity flows that erode stream banks and deposit sediment in the stream bed, conveyance of vehicle byproducts (e.g., oil, antifreeze, gasoline, metals), and volatility in stream temperatures. Currently, these stressors have been limited to a few subwatersheds (e.g., I-12, I-14, and I-15 in the Cherryville area), but strategies to manage growth are needed to prevent problems with stormwater runoff from expanding across the LWP area. High Nitrite/Nitrate Concentrations Finally, mean baseflow concentrations of 0.6 mg/L nitrate/nitrite in the LWP area were higher than at other regional AMSs (see Figure 19A). In two other studies, however, mean nitrate/nitrite levels in the Piedmont sites across the mid-Atlantic averaged between 0.7 (Schoonover et al., 2005) and 1.1 mg/L (Briel, 1997). So, while levels in the LWP area are high when compared with other regional sites, they do not appear to be excessive. Due to the large presence of agricultural operations in these watersheds, it is likely the sources for elevated nitrate/nitrite are either organic (manure) or inorganic (fertilizers).
37

SECTION V. ASSESSMENT OF WATERSHED FUNCTION
Background Examining the performance of watershed habitat, hydrology, and water quality functions is an integrative way of assessing ecosystem health and understanding the stressors affecting the study area. In Phase 1 and Phase 2 of this study, a number of datasets have been collected and organized at the subwatershed level. Evaluating these data at the subwatershed scale allows us to (1) better spatially characterize the conditions within the LWP area, and (2) prioritize areas for recommended management measures, including BMPs and restoration/enhancement projects. This section details the methods and results used to qualitatively assess watershed functions. Definitions for habitat, hydrology, and water quality functions can vary depending on the location of the study area (i.e., ecoregion) and data availability. This LWP continues to use definitions provided in the Phase 1 report, which are largely built upon those provided in NC EEP’s Peachtree-Martins LWP (NC EEP, 2007): o Habitat function includes both aquatic and terrestrial components. Functioning aquatic habitat provides a setting in which aquatic communities, such as fish and benthic invertebrates, can be both diverse and balanced. Good aquatic habitat in the study area has abundant and diverse microhabitat (sticks, leaf packs, logs, vegetated mats, and root masses), stable stream banks, stream canopy cover, and a variety of bottom substrate (sand, gravel, cobbles and boulders). For terrestrial habitat, a functioning system allows wildlife to move about more easily to find necessary resources (food, shelter, and community) and does not endanger or threaten native species. Properly functioning systems in the study area have minimally fragmented forests, forested floodplains, and corridors that promote wildlife travel and provide resources. o Hydrologic function addresses the ability of a stream to transport water and sediment. Good hydrologic function is most apparent in the stream channel, but extends to riparian areas and uplands. A functioning stream channel has a low degree of incision (vertical stability), reasonably stable streambanks (lateral stability), higher base flows, and lower peak flows. Riparian zones in catchments that display good hydrologic function promote groundwater recharge while storing floodwater flows and deposited sediment. High-functioning riparian zones and floodplains are wooded and help slow flood flows, reducing stress on streams. Upland areas also have higher amounts of forests, wetlands, or other permeable land cover that encourage infiltration and, subsequently, slow delivery of precipitation to streams as groundwater as opposed to quicker overland runoff. o Water quality functions include the ability of a stream to receive and process different elements (chemical, pathogens, and sediments) while maintaining a hospitable environment for aquatic life and attaining its designated use (e.g., biological integrity, recreation, or water supply). In-stream pollutant levels such as nitrogen or phosphorus are a key indicator of water quality function; however, these quantities may be highly dynamic and difficult to characterize without extensive monitoring data over a range of stream flows. In addition to measuring stream pollutants, one can monitor stream biology (i.e., bugs and fish). This provides long-term indicators of water quality and whether waters are supportive of aquatic life.
38

The concept of rating watershed functions is illustrated in Figure 26. Generally, those watersheds with more assets (i.e., high-quality habitat, forested riparian and floodplain area, stable banks, undisturbed uplands, etc.) and few stressors are classified as high-functioning watersheds. These watersheds are likely to be good candidates for preservation opportunities. Watersheds with impacted streams, wetlands, and floodplains are under increased stress and unable to sustain functions. These lower functioning systems have little high quality habitat to preserve, but are more likely to contain stream and wetland restoration and enhancement opportunities. Watersheds in the middle, functioning-at risk, require a mix of conservation and restoration actions to maintain or improve their functions.
Figure 26. Conceptual Diagram for Rating Watershed Function.
Methods Three functional scores (0-Low Functioning; 1-Functioning At-risk; and 2-High Functioning) were utilized to characterize hydrologic, habitat, and water quality functions. Definitions for these functional categories are outlined below:
1) High Functioning (2): Watershed is functioning efficiently and is resilient to changes in the natural environment.
2) Functioning At-risk (1): Watershed functions are minimally achieved but have been diminished and are at risk from both natural and man-made perturbations.
3) Low Functioning (0): Existing conditions indicate that functions are not being achieved. Table 9 lists the indicators and scores used to assess functions at the subwatershed level. Indicators were selected based on data availability (field, and GIS), guidance on how to apply the indicator (e.g., scientific literature), and their relevance to habitat, hydrology and water quality functions. Each indicator is better described following Table 9.
39
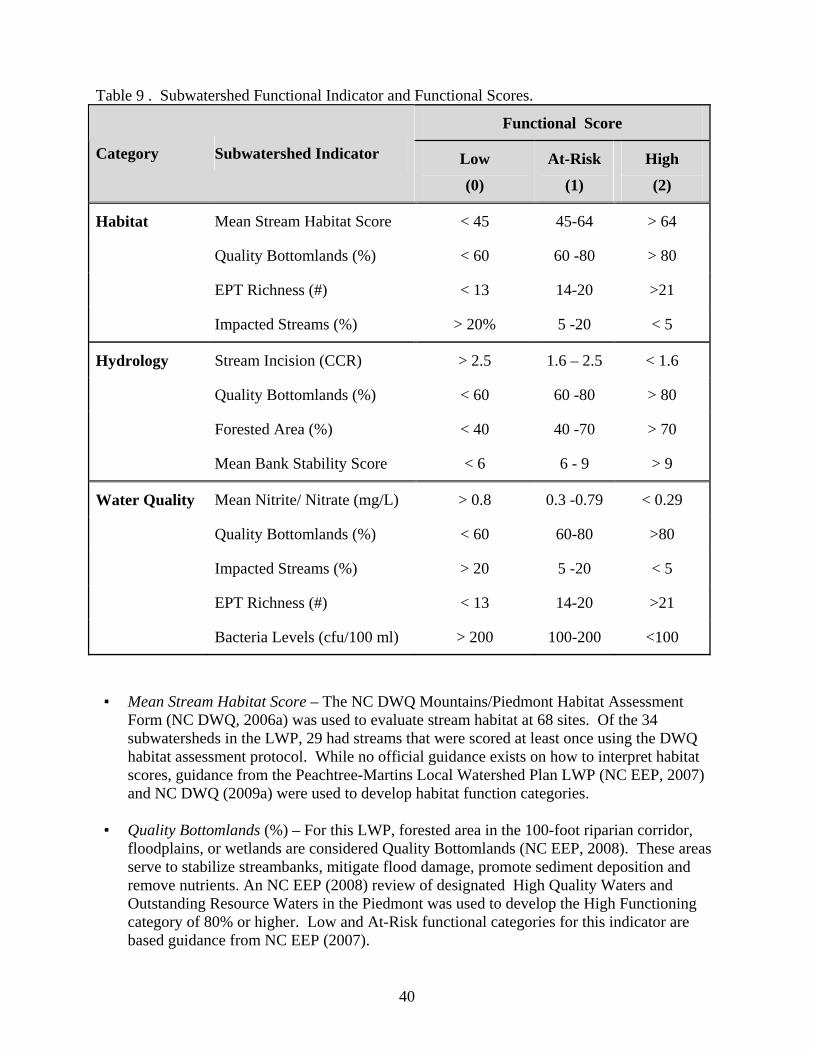
Table 9 . Subwatershed Functional Indicator and Functional Scores.
Functional Score
Category Subwatershed Indicator Low At-Risk High
(0) (1) (2)
Habitat Mean Stream Habitat Score < 45 45-64 > 64
Quality Bottomlands (%) < 60 60 -80 > 80
EPT Richness (#) < 13 14-20 >21
Impacted Streams (%) > 20% 5 -20 < 5
Hydrology Stream Incision (CCR) > 2.5 1.6 – 2.5 < 1.6
Quality Bottomlands (%) < 60 60 -80 > 80
Forested Area (%) < 40 40 -70 > 70
Mean Bank Stability Score < 6 6 - 9 > 9
Water Quality Mean Nitrite/ Nitrate (mg/L) > 0.8 0.3 -0.79 < 0.29
Quality Bottomlands (%) < 60 60-80 >80
Impacted Streams (%) > 20 5 -20 < 5
EPT Richness (#) < 13 14-20 >21
Bacteria Levels (cfu/100 ml) > 200 100-200 <100
▪ Mean Stream Habitat Score – The NC DWQ Mountains/Piedmont Habitat Assessment
Form (NC DWQ, 2006a) was used to evaluate stream habitat at 68 sites. Of the 34 subwatersheds in the LWP, 29 had streams that were scored at least once using the DWQ habitat assessment protocol. While no official guidance exists on how to interpret habitat scores, guidance from the Peachtree-Martins Local Watershed Plan LWP (NC EEP, 2007) and NC DWQ (2009a) were used to develop habitat function categories.
▪ Quality Bottomlands (%) – For this LWP, forested area in the 100-foot riparian corridor,
floodplains, or wetlands are considered Quality Bottomlands (NC EEP, 2008). These areas serve to stabilize streambanks, mitigate flood damage, promote sediment deposition and remove nutrients. An NC EEP (2008) review of designated High Quality Waters and Outstanding Resource Waters in the Piedmont was used to develop the High Functioning category of 80% or higher. Low and At-Risk functional categories for this indicator are based guidance from NC EEP (2007).
40

▪ EPT Taxa Richness – The most recent EPT taxa richness results were used to evaluate
subwatersheds. Good water quality should be reflected in high species richness. According to NC DWQ (2006a) “increasing levels of pollution gradually eliminate the more sensitive species, leading to lower species richness”. Ephemeroptera + Plecoptera + Trichoptera (EPT) are intolerant to pollution and, therefore, good indicators of water quality and aquatic habitat. NC DWQ (2006a) provides ratings for interpreting EPT Taxa Richness breakpoints to gage stream health in the Piedmont in 5 categories ranging from Excellent to Poor. Crouch (2010) further grouped these five categories into the three functional rating used in this study.
▪ Impacted Streams (%) – For this study, we used percent of impacted streams that were 1000
feet or longer and lacked forest cover within a buffer zone of 50 feet (NC EEP, 2008). These streams often had additional impacts such as channelization or livestock accessing them. As found during this LWP, these impacts, even when occurring over a relatively short reach, have the potential to negatively affect stream biota and water quality. Functional categories for this indicator are based on the relative distribution of LWP subwatersheds values and evident breakpoints in the data.
▪ Mean Bank Stability Score – Bank Stability is a submeasure of the NC DWQ Mountains/
Piedmont Habitat Assessment Form. It was utilized to evaluate stream bank stability at 68 sites in the LWP area and 29 of 34 subwatersheds. Functional categories for this indicator were developed from the DWQ bank stability submetric scores (See Figure 3).
▪ Stream Incision (CCR) – As described in the Methods Section of this report, stream incision
was assessed using the CCR. Generally, less incised sites have flood flows that access the floodplain, thereby reducing stress on streambanks (i.e., low CCR close to 1). Sites with a greater CCR values tend to have incised channels where flood flows have difficulty accessing the floodplain
▪ Forested Area (%) – Abundant forest area helps promote infiltration of rainfall, increased
stream baseflows, and reduced stormflows. As a result, forest extent functional categories are related to channel stability (Booth et al., 2002) and increased stream sediment load (Price and Leigh, 2006). Land cover statistics generated in Phase 1 of this LWP were used to estimate percent forested land.
▪ Mean Nitrite + Nitrate levels (mg/L) – Excess nutrients in streams lead to problems with
excessive algal growth and, subsequently, low dissolved oxygen levels which contribute to mortality in aquatic biota. Mean nitrite-nitrate concentrations were utilized to assess stream nutrient levels. High functioning streams were defined using data from Leepers Creek, the biological reference site. Schoonover et al. (2005) research on Piedmont streams helped defined the thresholds for Functioning-At Risk and Low Functioning streams.
▪ Bacteria Levels (cfu/100 ml) – Fecal coliform bacteria are an indicator of either human or
animal sewage waste. According to the US EPA (1997), “they indicate the possible presence of pathogenic (disease-causing) bacteria, viruses, and protozoans that also live in human and animal digestive systems. Therefore, their presence in streams suggests that
41

pathogenic microorganisms might also be present”. The NC water quality standard of 200 cfu/100 ml was used to assess water quality function.
Due to their importance in assessing multiple functions, several indicators are used to rate multiple categories. For example, Palone and Todd (1997) detail the functions of riparian buffer (i.e., quality bottomlands) with moderating water temperature (habitat function), mitigating flood flows (hydrology function), and removing nutrients (water quality function). In the final tabulation of Overall Functional Rating, however, each indicator is only counted once and, therefore, equally weighted. Due to limitation in staff time and project budget, not all indicators have data in all subwatersheds. This is particularly true of field based indicators (e.g., mean nitrate levels or stream incision rating). As a result, an average subwatershed score was calculated to rate category functions. Using this approach, subwatersheds where no data was available for a particular indicator are ignored when averaging functional scores. Every watershed, however, had at least two indicators used to evaluate its function so every subwatershed has received a score. An example of the scoring calculation for Habitat Function is shown below:
(a + b + c + d) / n
Where: a = Mean Stream Habitat Score b = % Quality Bottomlands Score c = EPT Richness Functional Score d = % Impacted Streams Functional Score n = number of indicators receiving a score Note: Scores can average from a low of 0 to a high of 2
Last, category totals were used to rate the level of function for subwatersheds. Table 10 provides the scores used to rate categories and the overall combined functional rating based on best professional judgment. Totals and ratings were then calculated for each LWP subwatershed.
Table 10. Functional Category Ratings and Corresponding Scores.
Average Score Range1 Functional Category
High 1.4 -2.0
At-Risk 0.7 – 1.39
Low 00 – 0.69
1Average score range is based on the average for each functional category (e.g., hydrology, habitat) divided by the number of indicators used in their assessment.
42

ResultsTable 11 and Figures 27 and 28 present a summary of the watershed functional assessement. Overall, watershed functions in Indian Creek tend to be higher scoring than Howards. Of its 22 subwatersheds, 20 (91%) are either High Functioning (5) or Functioning At-Risk (15). In comparison, Howards Creek had 6 subwatersheds (60%) that were Low Functioning and 4 that were Functioning At-Risk (40%). Subwatersheds in Mid-South Fork(2) both rated Low Functioning. The sub-functions of Habitat and Water quality tended to reflect the Overall results (i.e., better functioning subwatersheds in Indian Creek than Howards). Hydrology sub-functions in Indian Creek, however, did not score as well as the other sub-functions. Here, At-Risk subwatersheds (14) were dominant, followed by High (6) then Low (2). A complete list of indicator and subwatershed ratings can be found in Appendix C.
Table 11. Summary of Watershed Functional Ratings Indian Creek Howards Creek Mid-South Fork Function
Rating Subsheds (Count)
% of HU
Subsheds (Count)
% of HU
Subsheds % of (Count) HU
Habitat Low 2 9 6 60 2 100 At-Risk 8 36 2 20 0 0 High 12 55 2 20 0 0 Hydrology Low 2 9 4 40 2 100 At-Risk 14 64 4 40 0 0 High 6 27 2 20 0 0 Water Quality Low 2 9 6 60 2 100 At-Risk 9 41 2 20 0 0 High 11 50 2 20 0 0 Overall Low 2 9 6 60 2 100 At-Risk 15 68 4 40 0 0 High 5 23 0 0 0 0 Total Subsheds 22 10 2 100 100 100
43
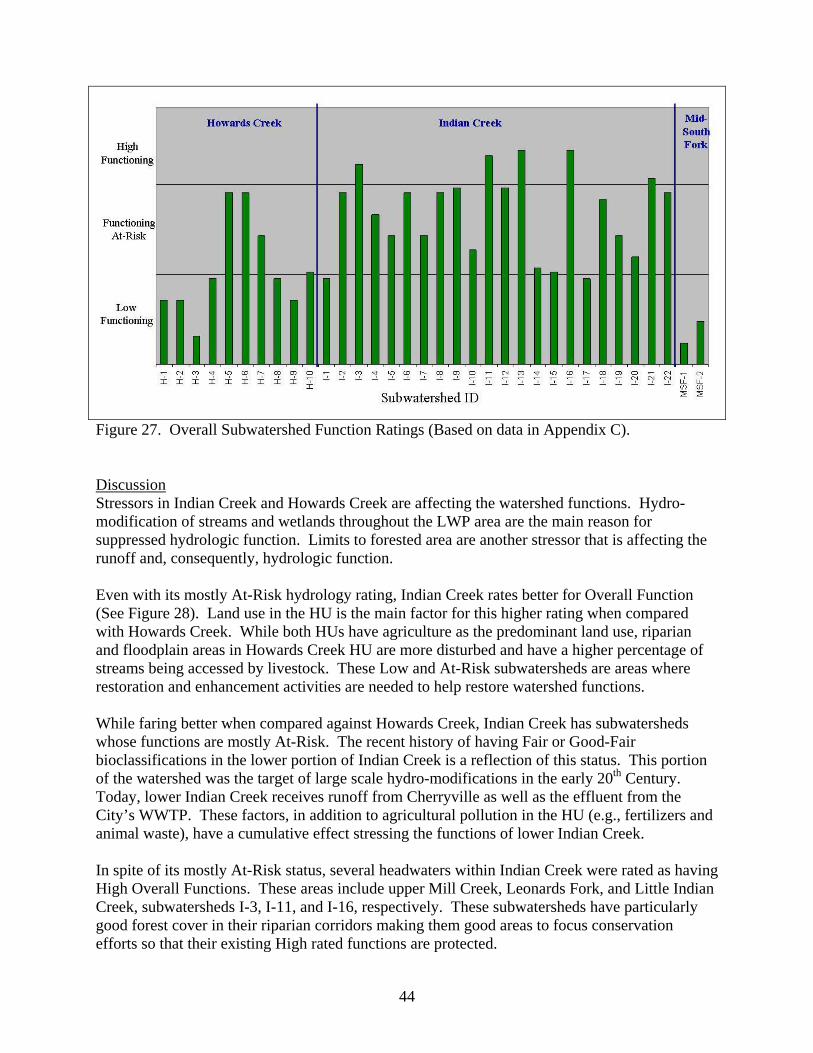
Figure 27. Overall Subwatershed Function Ratings (Based on data in Appendix C). Discussion Stressors in Indian Creek and Howards Creek are affecting the watershed functions. Hydro-modification of streams and wetlands throughout the LWP area are the main reason for suppressed hydrologic function. Limits to forested area are another stressor that is affecting the runoff and, consequently, hydrologic function. Even with its mostly At-Risk hydrology rating, Indian Creek rates better for Overall Function (See Figure 28). Land use in the HU is the main factor for this higher rating when compared with Howards Creek. While both HUs have agriculture as the predominant land use, riparian and floodplain areas in Howards Creek HU are more disturbed and have a higher percentage of streams being accessed by livestock. These Low and At-Risk subwatersheds are areas where restoration and enhancement activities are needed to help restore watershed functions. While faring better when compared against Howards Creek, Indian Creek has subwatersheds whose functions are mostly At-Risk. The recent history of having Fair or Good-Fair bioclassifications in the lower portion of Indian Creek is a reflection of this status. This portion of the watershed was the target of large scale hydro-modifications in the early 20th Century. Today, lower Indian Creek receives runoff from Cherryville as well as the effluent from the City’s WWTP. These factors, in addition to agricultural pollution in the HU (e.g., fertilizers and animal waste), have a cumulative effect stressing the functions of lower Indian Creek. In spite of its mostly At-Risk status, several headwaters within Indian Creek were rated as having High Overall Functions. These areas include upper Mill Creek, Leonards Fork, and Little Indian Creek, subwatersheds I-3, I-11, and I-16, respectively. These subwatersheds have particularly good forest cover in their riparian corridors making them good areas to focus conservation efforts so that their existing High rated functions are protected.
44

The two Middle South Fork subwatersheds, with their limited forest cover and disturbed floodplains, scored Low for Overall Function. In addition, there are several large, highly modified, wetlands in this HU that contribute to the depressed watershed functions. Efforts in the LWP area to improve habitat, hydrology, and water quality functions should focus on increasing woody vegetation in the riparian zone, restoring/enhancing degraded riparian wetlands and preserving high-quality headwater areas. This would help stabilize stream banks, limit sedimentation of the stream channel, and enhance aquatic habitat. Ameliorating hydrologic functions also requires alleviating the impacts of hydro-modifcation by allowing streams to access their floodpains through stream and wetland restoration.
Figure 28. Overall Function Rating for the LWP Area.
45

SECTION VI. CONCLUSIONS This Watershed Assessment Report presents the methods and describes the results of a number of different efforts that have been used to characterize the natural resource problems, assets, and functions in Indian Creek and Howards Creek watersheds. Through the course of the watershed assessment over 50 streams and 90 potential wetlands have been visited and evaluated to assess their function. These assessments are the backbone of this report and the basis for many of these conclusions. Several stressors are creating persistent problems in the LWP area. One that is pervasive, both historically and in present day, is the hydo-modification of streams and wetlands. Modifications include dredging, ditching and channelization. The results of these hydro-modifications can be seen in incised streams and lowered water tables. Other stressors relate to agriculture practices, the predominant land use in the LWP. These include poor riparian vegetation, high bacteria levels, excess sediment and high nitrate levels that are the result of agricultural land use, particularly with cattle having access to streams and their adjacent riparian areas. These conditions are found throughout the LWP area, but are more concentrated in Howards Creek than in Indian Creek. In limited portions of the LWP area, stormwater is a direct stressor to the aquatic environment. These areas are around Cherryville and the West Lincoln High School. Several streams studied in these areas had been negatively impacted by runoff from impervious surfaces, demonstrating how poor development practices can negatively affect stream health. Both Middle South Fork and Howards Creek have subwatersheds that rate predominantly Low for the watershed functions of habitat, hydrology, and water quality. In Indian Creek, subwatershed functions rate mostly At-Risk to both natural and man-made perturbations. To help improve the functions of all three HUs, restoration and enhancement activities are needed. While most subwatershed functions scored poorly, Indian Creek had some that scored High. Within High Functioning (green-shaded) subwatersheds, conservation efforts should serve to protect existing high-quality habitat areas and contribute to the restoration or protection of downstream waters. Finally, efforts to assess stream, wetland, and watershed functions during Phase 2 of the Indian Creek and Howards Creek LWP have helped to characterize restoration, enhancement and preservation opportunities on over 50 streams, 45 wetlands and four BMP sites in the LWP area. These projects will be summarized in the Project Atlas produced as part of the Phase 3 Watershed Management Plan. These projects will provide opportunities to reduce watershed stressors and improve the Low and At-Risk functions found in the LWP area.
46
SECTION XII. REFERENCES Booth, Derek B., D. Hartley and R. Jackson. 2002. Forest Cover, Impervious Surface Area, and
the Mitigation of Stormwater Impacts. J. of the American Water Resources Association. 38:3:835-845.
Briel L.I. 1997. Water Quality in the Appalachian Valley and Ridge, the Blue Ridge, and the
Piedmont Physiographic Provinces, Eastern United States. U.S. Geological Survey Professional Paper 1422-D.
Center for Watershed Protection. 2000. Article 28: Basic Concepts in Watershed Planning: The
Practice of Watershed Protection. T. Schueler and H. Holland, eds. Ellicott City, MD. Crouch. W. (NC DWQ Biologic Assessment Unit) 2010. Pers. communication. 2/18/2010. ENTRIX. 2009. Indian and Howard’s Creek Local Watershed Plan. Technical Memorandum 3:
Summary of Field Assessments. July. ENTRIX. 2010. Project Implementation Report for Indian Creek and Howards Creek. March. Ferguson, B.K. 1997. The Alluvial Progress of Piedmont Streams. Pp 132-143 in L.A. Roesner
(ed) Effects of Watershed Development and Management on Aquatic Ecosystems. ASCE. New York.
Healy, R.G. 1985. Competition for Land in the American South. Conservation Foundation.
Washington, DC. Lincoln County Historical Society. 2008. “The Indian Creek Dredging.” The Lincoln Sentinel.
Volume XI. Issue I. Online at: http://www.lincolncountyhistory.com/newsletter/0805/0805%20LCHA%20Newsletter%20LR.pdf
Meade, R.H. 1982. Sources, Sinks and Storage of River Sediment in the Atlantic Drainage of the United States. J of Geology. 90:235-252.
Meade, R.H. and S.W. Trimble. 1974. Changes in Sediment Loads in Rivers of the Atlantic
Drainage on the United States Since 1900. Pp 99-104. International Assoc of Hydrological Sciences Publ. No. 113.
NC DWQ. 2002. Assessment Report: Biological Impairment in the Upper Clark Creek
Watershed. Online at http://portal.ncdenr.org/c/document_library/get_file?uuid=005fa5d2-a87d-4918-8d6c-0adcb10a121b&groupId=38364 (Accessed 2/12/2010).
47

NC DWQ. 2006a. Standard Operating Procedures for Benthic Macroinvertebrates. Biological Assessment Unit. Online at: http://www.esb.enr.state.nc.us/BAUwww/benthossop.pdf (Accessed 2/10/2010).
NC DWQ. 2006b. North Carolina Water Quality Assessment and Impaired Waters List (2006
Integrated 305(b) and 303(d) Report). Final Approved May 17, 2007. NC DWQ. 2008. Indian and Howards Creeks Local Watershed Planning Area Wetland
Assessment Summary. NC Division of Water Quality, Wetlands and Stormwater Branch, Watershed Assessment Team.
NC DWQ. 2009a. Integrated Analysis Report of Water Quality for the Indian Creek and
Howard’s Creek Local Watershed Planning Area. North Carolina Division of Water Quality, Watershed Assessment Team, Raleigh NC.
NC DWQ. 2009b. Memorandum: Macroinvertebrate Results for Indian/Howards Creek
(Catawba River Basin, 03-08-36, HUC 03050102 Lincoln County) – Spring 2008. North Carolina Division of Water Quality, Watershed Assessment Team, Raleigh NC.
NC DWQ. 2009c. Memorandum: Benthic sampling results for EEP study in Lincoln County,
NC (Catawba River subbasins 33, 35; HUC 03050102, 03050101). North Carolina Division of Water Quality, Biological Assessment Unit, Raleigh NC.
NC EEP. 2007. Peachtree-Martins Creek Local Watershed Plan Phase 2 Hiwassee River Basin.
Watershed Assessment Report. May 2007 NC EEP. 2008. Indian Creek and Howards Creek Local Watershed Plan. Preliminary Findings
Report. NC Ecosystem Enhancement Program, December. Natural Heritage Program. 2002. Lincoln County, North Carolina Natural Heritage Inventory. NC NHP. 2008. Biodiversity and Wildlife Assessment. Online at
http://www.onencnaturally.org/pages/CPT_Detailed_Report.html (Accessed 11/4/2009) NC Wetland Functional Assessment Team (WFAT). 2008. N.C. Wetland Assessment Method
(NC WAM) User Manual. http://h2o.enr.state.nc.us/ncwetlands/rd_pub_not.html Palone, R.S. and A.H. Todd (editors.). 1997. Chesapeake Bay riparian handbook: a guide for
establishing and maintaining riparian forest buffers. USDA Forest Service. NA-TP-02-7. Radnor, PA.
Pope BF, Tasker GD, and Robbins JC. 2001. Estimating the magnitude and frequency of floods in rural basins of North Carolina – Revised. U.S. Geological Survey. Water-Resources Investigations Report 01-4207. Price, Katie and D. S. Leigh. 2006. Morphological and Sedimentological Responses of Streams
to Human Impact in the Southern Blue Ridge Mountains, USA. Geomorphology. 78:142-160.
48

Richter, D.D., K. Korfmacher, and R. Nau. 1995. Decreases in Yadkin River Basin
Sedimentation: Statistical and Geographic Time-Trend Analyses, 1951 to 1990. Report No. 297 Water Resources Research Institute of the University of North Carolina. Raleigh. November.
Schoonover, J.E., Lockaby, B.G., Pan, S. 2005. Changes in chemical and physical properties of
stream water across an urban-rural gradient in western Georgia . Urban Ecosystems. Vol. 8 (1)1573-1642.
Simmons, C.E. 1993. Sediment Characteristics of North Carolina Streams, 1970-79. USGS
Water- Supply Paper 2364 [Originally published in 1987 as Open-File Report 87-701]. Sweeney, B.W., Bott, T.L., Jackson, J.K., Kaplan, L.A., Newbold, J.D., Standley, L.J., Hession,
W.C. 2004. Riparian deforestation, stream narrowing, and loss of stream ecosystem services. PNAS 2004 101:14132-14137; Online at: http://www.pnas.org/content/101/39/14132.full (Accessed 2/17/2010).
Trimble, S.W. 1974. Man-Induced Soil Erosion on the Southern Piedmont 1700-1970. Ankeny,
IA. Soil and Water Conservation Society of America. US Army Corps of Engineers. 1987. Corps of Engineers Wetlands Delineation Manual.
Technical Report Y-87-1. Environmental Laboratory. Vicksburg, MS. http://www.wetlands.com/regs/tlpge02e.htm
US Environmental Protection Agency. 1997. Volunteer Stream Monitoring: A Methods
Manual. Chapter 5. Online at http://www.epa.gov/volunteer/stream/vms511.html (Accessed 2/22/2010)
Wilson, M.P. 1983. Erosion of Banks Along Piedmont Urban Streams. Water Resources
Research Institute of the University of NC. Raleigh. Report No. 189.
49

APPENDIX A. IDENTIFICATION AND PRIORITIZATION OF HIGH QUALITY HABITAT
BACKGROUND The Indian Creek and Howards Creek Local Watershed Plan (LWP) assessment of terrestrial and aquatic habitat was completed to identify important habitat areas for protection and conservation planning. Identification of these habitats was informed by a number of different sources of data. The primary data source used in the habitat assessment is the NC Conservation Planning Tool (CPT). This tool was initially developed in 2008 to guide the One North Carolina Naturally initiative. The CPT data used for this LWP was updated in July 2009. The CPT represents an integrated framework consolidating a number of different state and federal datasets to help identify and protect biodiversity, wildlife, and their habitat. Due to its relevance to state land protection efforts and its updated information, the CPT was selected as the base data upon which to develop the LWP’s identification and prioritization of high quality habitat. The CPT is a geographic data set that ranks the habitat landscape on a relative scale ranging from 1 to 10 using 30x30 meter pixels. The rankings for each pixel are derived from data representing different habitat functions. A group of ecosystem analysts rated the data based on rarity, habitat function, and data quality. Those data comparing well in these three criteria rated high on the relative scale (i.e., closer to 10). More information on the methods and data used to develop the Biodiversity and Wildlife Habitat Assessment (BWHA) can be found in Chapter 4 of One NC Naturally Conservation Planning Tool (NC Natural Heritage Program, 2008). METHODS For the LWP habitat assessment, information collected during Phases 1 and 2 were added to the existing CPT. Data were ranked using the existing CPT framework as a guide. For example, if habitat was evaluated to have county level significance, it was rated similar to Significant Natural Heritage Areas of county level significance (i.e., a value of 6). Figure A-1 provides the ranks given by the CPT along with those added based on LWP assessments. Figure A-1 presents the compilation of datasets used to evaluate habitat from both the CPT and the LWP. The following received a relative rank of 6 and were added to the BWHA:
▪ Warlick’s Mill, a unique geologic feature not included on the Natural Heritage Program Lincoln County Survey but deemed from this project at least a site of county level significance;
▪ 17 wetlands identified by NC DWQ as High functioning (NC DWQ, 2008). ▪ Eight high quality stream reaches identified during the LWP.
Additionally, based on benthic sampling that occurred for the LWP, stream reaches associated with two sites, Leonard Fork SR1180 and Little Indian Cr SR1129, were given a rank of 7 to be consistent with the CPT methods illustrated in Figure A-1. Finally, there were no data collected that supported removing areas from the original BWHA. There was, however, reason to downgrade the ranking for several stream reaches that received a BWHA rank of 7. Stream reaches along lower Indian Creek and most of the mainstem of Howards Creek were given a rank of 7 in the original BWHA based on previously rated Good
50
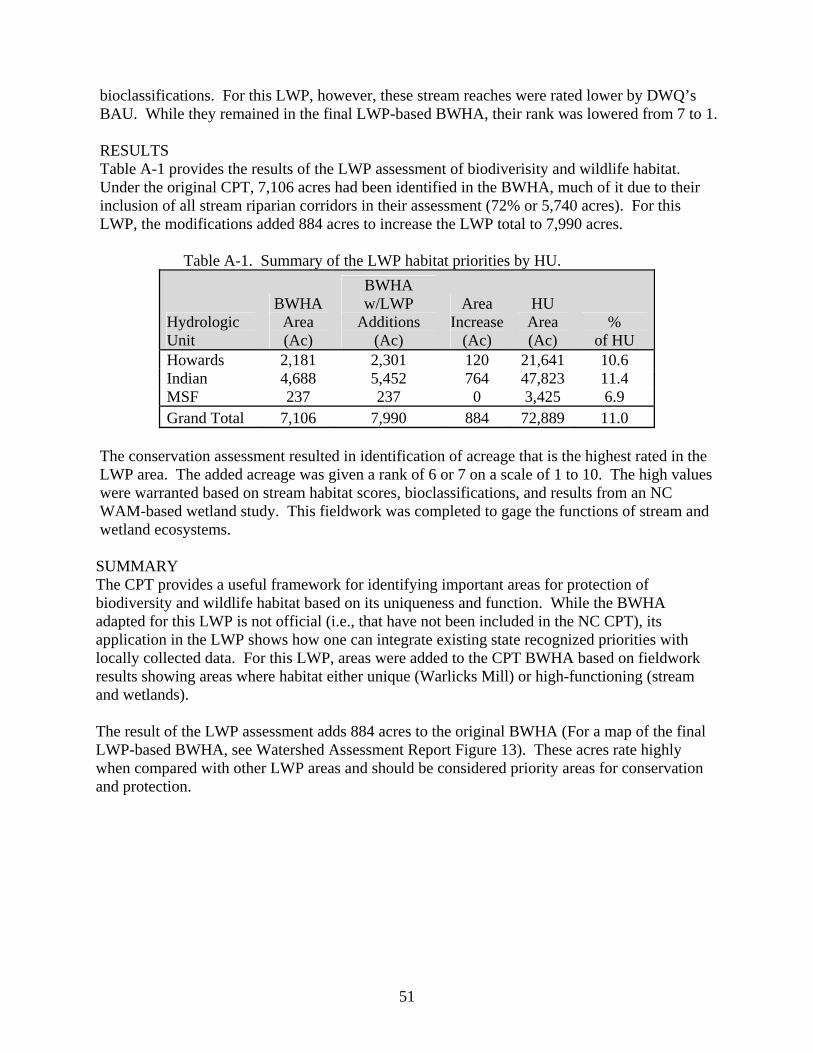
51
bioclassifications. For this LWP, however, these stream reaches were rated lower by DWQ’s BAU. While they remained in the final LWP-based BWHA, their rank was lowered from 7 to 1. RESULTS Table A-1 provides the results of the LWP assessment of biodiverisity and wildlife habitat. Under the original CPT, 7,106 acres had been identified in the BWHA, much of it due to their inclusion of all stream riparian corridors in their assessment (72% or 5,740 acres). For this LWP, the modifications added 884 acres to increase the LWP total to 7,990 acres.
Table A-1. Summary of the LWP habitat priorities by HU.
Hydrologic Unit
BWHA Area (Ac)
BWHA w/LWP
Additions (Ac)
Area Increase
(Ac)
HU Area (Ac)
% of HU
Howards 2,181 2,301 120 21,641 10.6 Indian 4,688 5,452 764 47,823 11.4 MSF 237 237 0 3,425 6.9 Grand Total 7,106 7,990 884 72,889 11.0
The conservation assessment resulted in identification of acreage that is the highest rated in the LWP area. The added acreage was given a rank of 6 or 7 on a scale of 1 to 10. The high values were warranted based on stream habitat scores, bioclassifications, and results from an NC WAM-based wetland study. This fieldwork was completed to gage the functions of stream and wetland ecosystems. SUMMARY The CPT provides a useful framework for identifying important areas for protection of biodiversity and wildlife habitat based on its uniqueness and function. While the BWHA adapted for this LWP is not official (i.e., that have not been included in the NC CPT), its application in the LWP shows how one can integrate existing state recognized priorities with locally collected data. For this LWP, areas were added to the CPT BWHA based on fieldwork results showing areas where habitat either unique (Warlicks Mill) or high-functioning (stream and wetlands). The result of the LWP assessment adds 884 acres to the original BWHA (For a map of the final LWP-based BWHA, see Watershed Assessment Report Figure 13). These acres rate highly when compared with other LWP areas and should be considered priority areas for conservation and protection.
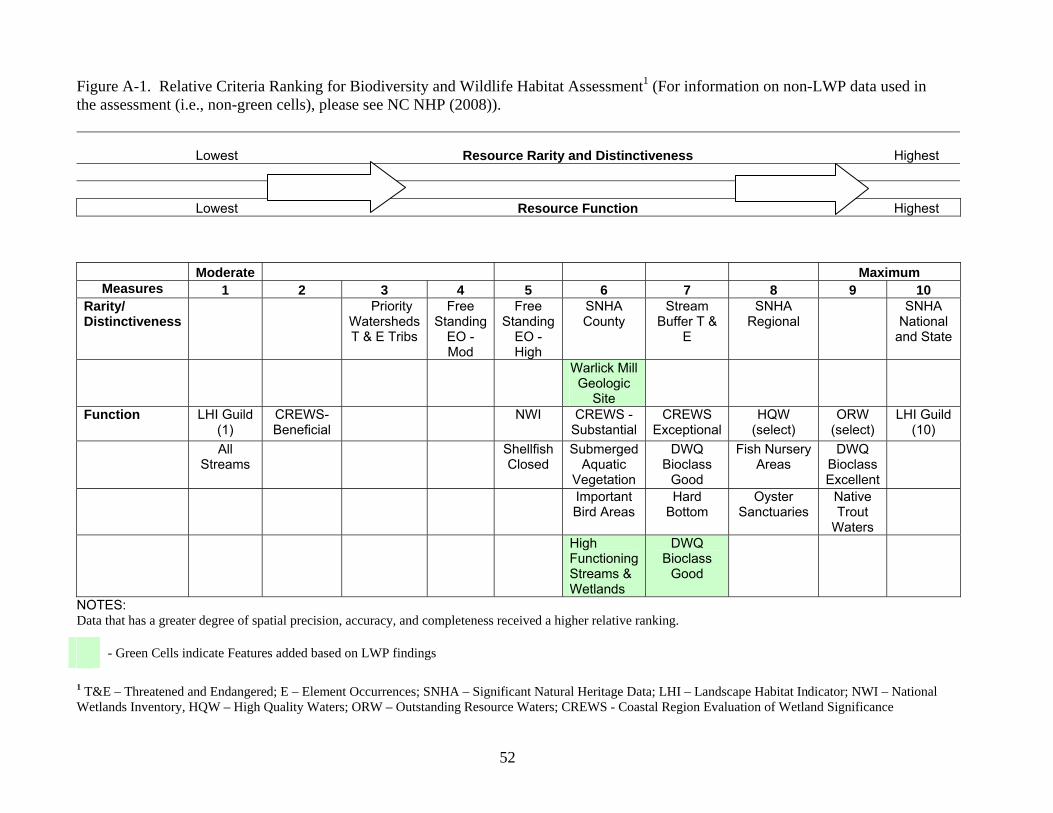
52
Figure A-1. Relative Criteria Ranking for Biodiversity and Wildlife Habitat Assessment1 (For information on non-LWP data used in the assessment (i.e., non-green cells), please see NC NHP (2008)).
Lowest Resource Rarity and Distinctiveness Highest
Lowest Resource Function Highest
Moderate Maximum Measures 1 2 3 4 5 6 7 8 9 10
Rarity/ Distinctiveness
Priority Watersheds T & E Tribs
Free Standing
EO - Mod
Free Standing
EO - High
SNHA County
Stream Buffer T &
E
SNHA Regional
SNHA National
and State
Warlick Mill Geologic
Site
Function LHI Guild
(1) CREWS-Beneficial
NWI CREWS - Substantial
CREWS Exceptional
HQW (select)
ORW (select)
LHI Guild (10)
All Streams
Shellfish Closed
Submerged Aquatic
Vegetation
DWQ Bioclass
Good
Fish Nursery Areas
DWQ Bioclass Excellent
Important Bird Areas
Hard Bottom
Oyster Sanctuaries
Native Trout
Waters
High Functioning Streams & Wetlands
DWQ Bioclass
Good
NOTES: Data that has a greater degree of spatial precision, accuracy, and completeness received a higher relative ranking.
1 T&E – Threatened and Endangered; E – Element Occurrences; SNHA – Significant Natural Heritage Data; LHI – Landscape Habitat Indicator; NWI – National Wetlands Inventory, HQW – High Quality Waters; ORW – Outstanding Resource Waters; CREWS - Coastal Region Evaluation of Wetland Significance
- Green Cells indicate Features added based on LWP findings

Decision Criteria for GIS CPT BWHA Additions Values given based on comparison with existing guidance (NC NHP, 2008). Warlick’s Mill boundary drawn based on the presence of forest cover, buildings and the geologic outcrop. 17 wetlands identified by NC DWQ as High functioning (NC DWQ, 2008). Wetlands were buffered typically by 50 feet. In some case where wetlands were in close proximity, a larger boundary was drawn to indicate a larger protection zone around the wetlands. Eight high quality stream reaches identified during the LWP. To qualify, streams needed to have a habitat score of 65 or higher AND have been identified as a high functioning site during Phase 1. Streams were buffered by 300 feet on each side. Good aquatic insect sites. Little Indian Creek – Good-rated BAU site - streams in the subwatershed were selected and prioritized. Leonards Fork – Good rated DWQ site (“Reference Quality”) - All streams in the tributary (2-subwatersheds) were selected and prioritized.
Two previously ranked Good Benthos sites were reclassified from a relatively high value of 7 to 1 as a result of lower bioclassifications received during this study.
53

54
APPENDIX B. Land Cover Statistics by Subwatershed (Source: NC EEP 2008)
Urban High Density
Low Density Urban
Agriculture Forest Shrub Water Total Sub-watershed ID (ac) % (ac) % (ac) % (ac) % (ac) % (ac) % (ac)
H-1 0 0 0 0 1,487 59 1,008 40 26 1 0 0 2,521 100 H-2 15 1 0 0 1,104 60 717 39 0 0 0 0 1,835 100 H-3 7 0 43 2 1,084 61 618 35 13 1 10 1 1,775 100 H-4 17 1 217 7 1,451 49 1,275 43 12 0 7 0 2,979 100 H-5 8 0 236 7 1,522 47 1,394 43 59 2 11 0 3,230 100 H-6 0 0 0 639 52 576 47 21 2 0 0 1,236 100 H-7 4 0 61 4 806 54 615 41 0 0 0 0 1,487 100 H-8 11 1 164 11 826 54 532 35 0 0 0 0 1,532 100 H-9 0 162 7 1,570 64 687 28 32 1 14 1 2,463 100
H-10 0 300 12 1,226 47 1,016 39 34 1 7 0 2,583 100 Howards
Total 61 0 1,183 5 11,714 54 8,438 39 197 1 48 0 21,641 100
I-1 21 1 88 3 1,811 57 1,241 39 39 1 3 0 3,204 100 I-2 7 1 20 2 730 56 523 40 10 1 4 0 1,294 100 I-3 14 0 383 12 1,396 43 1,456 45 0 0 21 1 3,270 100 I-4 1 0 0 0 1,270 62 741 36 32 2 0 0 2,044 100 I-5 18 1 88 5 754 47 743 46 7 0 6 0 1,616 100 I-6 6 0 358 11 1,723 52 1,198 36 4 0 13 0 3,302 100 I-7 32 1 240 10 1,059 43 1,089 45 13 1 11 0 2,443 100 I-8 0 254 8 1,419 46 1,380 45 4 0 27 1 3,083 100 I-9 1 0 127 9 608 45 610 45 8 1 4 0 1,359 100
I-10 22 1 121 4 1,557 51 1,336 44 12 0 12 0 3,059 100 I-11 0 0 130 9 572 39 773 52 0 0 5 0 1,481 100 I-12 272 8 605 18 1,051 31 1,455 43 18 1 11 0 3,411 100 I-13 1 0 58 6 470 45 509 49 4 0 8 1 1,050 100 I-14 159 13 283 23 238 20 516 43 0 0 12 1 1,208 100 I-15 6 0 93 6 1,121 67 458 27 0 0 1 0 1,679 100 I-16 0 0 123 7 844 47 844 47 0 0 3 0 1,815 100 I-17 0 0 78 5 982 57 623 36 20 1 16 1 1,720 100 I-18 0 0 287 16 934 52 569 31 20 1 0 0 1,809 100 I-19 7 0 455 18 952 37 1,110 43 27 1 14 1 2,565 100 I-20 0 0 264 15 919 54 509 30 4 0 12 1 1,708 100 I-21 27 1 212 12 664 36 910 50 3 0 4 0 1,820 100 I-22 104 4 738 26 821 28 1,201 42 0 0 18 1 2,883 100
Indian Total 698 1 5,006 10 21,897 46 19,795 41 223 0 204 0 47,823 100
MSF-1 4 0 229 9 1,548 60 778 30 15 1 7 0 2,580 100 MSF-2 10 1 229 27 292 35 299 35 8 1 7 1 845 100
Mid-South Fork Total 14 0 458 13 1,840 54 1,077 31 22 1 14 0 3,425 100
LWP Total 773 1 6,647 9 35,451 49 29,310 40 443 1 266 0 72,890 100
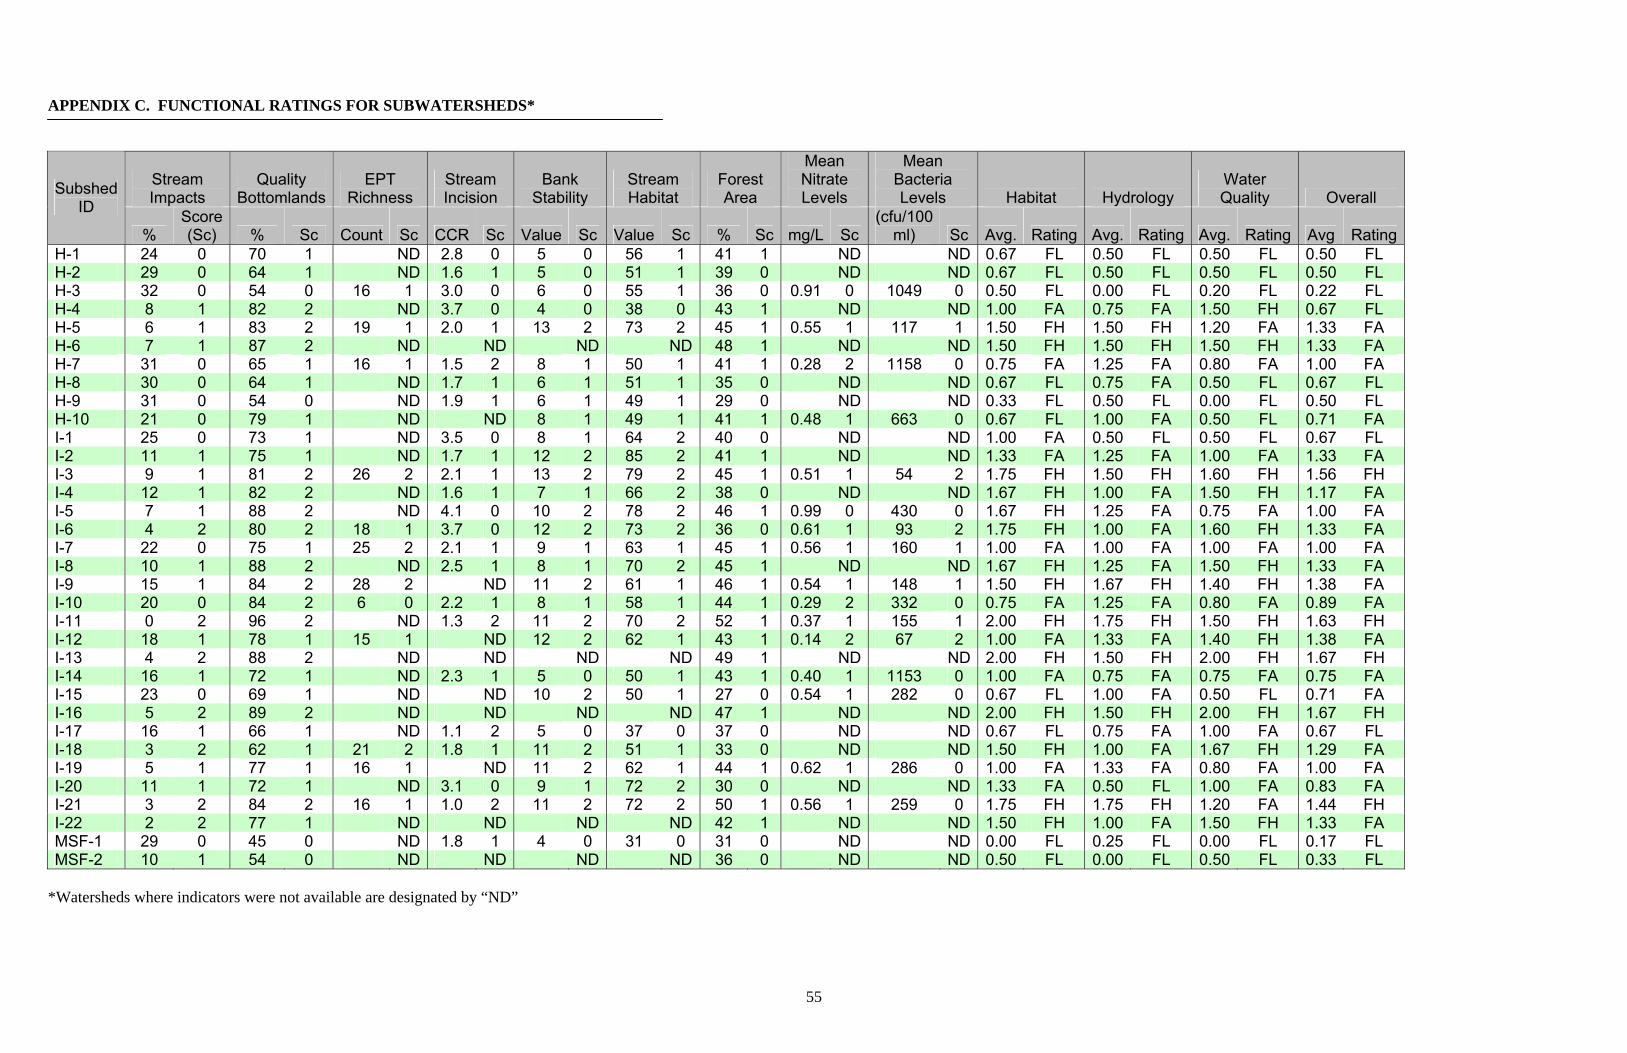
55
APPENDIX C. FUNCTIONAL RATINGS FOR SUBWATERSHEDS*
Stream Impacts
Quality Bottomlands
EPT Richness
Stream Incision
Bank Stability
Stream Habitat
Forest Area
Mean Nitrate Levels
Mean Bacteria Levels Habitat Hydrology
Water Quality Overall Subshed
ID
% Score (Sc) % Sc Count Sc CCR Sc Value Sc Value Sc % Sc mg/L Sc
(cfu/100 ml) Sc Avg. Rating Avg. Rating Avg. Rating Avg Rating
H-1 24 0 70 1 ND 2.8 0 5 0 56 1 41 1 ND ND 0.67 FL 0.50 FL 0.50 FL 0.50 FL H-2 29 0 64 1 ND 1.6 1 5 0 51 1 39 0 ND ND 0.67 FL 0.50 FL 0.50 FL 0.50 FL H-3 32 0 54 0 16 1 3.0 0 6 0 55 1 36 0 0.91 0 1049 0 0.50 FL 0.00 FL 0.20 FL 0.22 FL H-4 8 1 82 2 ND 3.7 0 4 0 38 0 43 1 ND ND 1.00 FA 0.75 FA 1.50 FH 0.67 FL H-5 6 1 83 2 19 1 2.0 1 13 2 73 2 45 1 0.55 1 117 1 1.50 FH 1.50 FH 1.20 FA 1.33 FA H-6 7 1 87 2 ND ND ND ND 48 1 ND ND 1.50 FH 1.50 FH 1.50 FH 1.33 FA H-7 31 0 65 1 16 1 1.5 2 8 1 50 1 41 1 0.28 2 1158 0 0.75 FA 1.25 FA 0.80 FA 1.00 FA H-8 30 0 64 1 ND 1.7 1 6 1 51 1 35 0 ND ND 0.67 FL 0.75 FA 0.50 FL 0.67 FL H-9 31 0 54 0 ND 1.9 1 6 1 49 1 29 0 ND ND 0.33 FL 0.50 FL 0.00 FL 0.50 FL H-10 21 0 79 1 ND ND 8 1 49 1 41 1 0.48 1 663 0 0.67 FL 1.00 FA 0.50 FL 0.71 FA I-1 25 0 73 1 ND 3.5 0 8 1 64 2 40 0 ND ND 1.00 FA 0.50 FL 0.50 FL 0.67 FL I-2 11 1 75 1 ND 1.7 1 12 2 85 2 41 1 ND ND 1.33 FA 1.25 FA 1.00 FA 1.33 FA I-3 9 1 81 2 26 2 2.1 1 13 2 79 2 45 1 0.51 1 54 2 1.75 FH 1.50 FH 1.60 FH 1.56 FH I-4 12 1 82 2 ND 1.6 1 7 1 66 2 38 0 ND ND 1.67 FH 1.00 FA 1.50 FH 1.17 FA I-5 7 1 88 2 ND 4.1 0 10 2 78 2 46 1 0.99 0 430 0 1.67 FH 1.25 FA 0.75 FA 1.00 FA I-6 4 2 80 2 18 1 3.7 0 12 2 73 2 36 0 0.61 1 93 2 1.75 FH 1.00 FA 1.60 FH 1.33 FA I-7 22 0 75 1 25 2 2.1 1 9 1 63 1 45 1 0.56 1 160 1 1.00 FA 1.00 FA 1.00 FA 1.00 FA I-8 10 1 88 2 ND 2.5 1 8 1 70 2 45 1 ND ND 1.67 FH 1.25 FA 1.50 FH 1.33 FA I-9 15 1 84 2 28 2 ND 11 2 61 1 46 1 0.54 1 148 1 1.50 FH 1.67 FH 1.40 FH 1.38 FA I-10 20 0 84 2 6 0 2.2 1 8 1 58 1 44 1 0.29 2 332 0 0.75 FA 1.25 FA 0.80 FA 0.89 FA I-11 0 2 96 2 ND 1.3 2 11 2 70 2 52 1 0.37 1 155 1 2.00 FH 1.75 FH 1.50 FH 1.63 FH I-12 18 1 78 1 15 1 ND 12 2 62 1 43 1 0.14 2 67 2 1.00 FA 1.33 FA 1.40 FH 1.38 FA I-13 4 2 88 2 ND ND ND ND 49 1 ND ND 2.00 FH 1.50 FH 2.00 FH 1.67 FH I-14 16 1 72 1 ND 2.3 1 5 0 50 1 43 1 0.40 1 1153 0 1.00 FA 0.75 FA 0.75 FA 0.75 FA I-15 23 0 69 1 ND ND 10 2 50 1 27 0 0.54 1 282 0 0.67 FL 1.00 FA 0.50 FL 0.71 FA I-16 5 2 89 2 ND ND ND ND 47 1 ND ND 2.00 FH 1.50 FH 2.00 FH 1.67 FH I-17 16 1 66 1 ND 1.1 2 5 0 37 0 37 0 ND ND 0.67 FL 0.75 FA 1.00 FA 0.67 FL I-18 3 2 62 1 21 2 1.8 1 11 2 51 1 33 0 ND ND 1.50 FH 1.00 FA 1.67 FH 1.29 FA I-19 5 1 77 1 16 1 ND 11 2 62 1 44 1 0.62 1 286 0 1.00 FA 1.33 FA 0.80 FA 1.00 FA I-20 11 1 72 1 ND 3.1 0 9 1 72 2 30 0 ND ND 1.33 FA 0.50 FL 1.00 FA 0.83 FA I-21 3 2 84 2 16 1 1.0 2 11 2 72 2 50 1 0.56 1 259 0 1.75 FH 1.75 FH 1.20 FA 1.44 FH I-22 2 2 77 1 ND ND ND ND 42 1 ND ND 1.50 FH 1.00 FA 1.50 FH 1.33 FA MSF-1 29 0 45 0 ND 1.8 1 4 0 31 0 31 0 ND ND 0.00 FL 0.25 FL 0.00 FL 0.17 FL MSF-2 10 1 54 0 ND ND ND ND 36 0 ND ND 0.50 FL 0.00 FL 0.50 FL 0.33 FL
*Watersheds where indicators were not available are designated by “ND”