indian health surveillance report, sexually transmitted diseases
TRANSCRIPT
Indian HealthSurveillance ReportSexually Transmitted Diseases 2009
U.S. DEPARTMENT OF HEALTH AND HUMAN SERVICES Centers for Disease Control and Prevention
Indian Health Service
Copyright Information Additional Data and Ordering Information
All material contained in this report is in the public domain and may be used Additional AI/AN health status information can be obtained from the IHS and reprinted without special permission; citation to source, however, is Division of Program Statistics (http://www.ihs.gov/NonMedicalPrograms/appreciated. IHS_Stats/) or from the IHS Division of Epidemiology and Disease
Prevention (http://www.ihs.gov/MedicalPrograms/Epi/). Suggested Citation
Additional STD data can be obtained from the CDC Division of STD Centers for Disease Control and Prevention and Indian Health Service. Indian Prevention (http://www.cdc.gov/std/stats).Health Surveillance Report--Sexually Transmitted Diseases 2009, Atlanta, GA : US Department of Health and Human Services, January 2012. For free hard copies of this report, please send your name, job title, mailing
address, phone number, and e-mail address to [email protected].
The online version of this report is available at http://cdc.gov/std/stats.
Indian HealthSurveillance ReportSexually Transmitted Diseases 2009
U.S. DEPARTMENT OF HEALTH AND HUMAN SERVICES
Centers for Disease Control and PreventionIndian Health Service
Department of Health and Human Services Centers for Disease Control and Prevention Indian Health Service
Kathleen Sebelius, MPA Thomas R. Frieden, MD, MPH Yvette Roubideaux, MD, MPHSecretary Director Director
Of fice of Infectious Diseases Of fice of Public Health SupportRima Khabbaz, MD Richard M. Church, PharmDDirector Director
National Center for HIV/AIDS, Viral Hepatitis, Division of EpidemiologySTD, and TB Prevention and Disease PreventionKevin Fenton, MD, PhD James E. Cheek, MD, MPHDirector Director
Division of STD Prevention Division of Program StatisticsGail Bolan, MD Francis F. Frazier, FNP, MPHDirector Director (Acting)
National STD ProgramScott Tulloch, BSDirector
Preface
Indian Health Surveillance Report – Sexually Transmitted Diseases 2009 presents statistics and trends for sexually transmitted diseases (STDs) among American Indians and Alaska Natives (AI/AN) in the United States (U.S.). The initial Indian Health Service Surveillance Report – Sexually Transmitted Diseases, containing data through 2004, was published in November 2006.
This report represents a unique collaboration and partnership between the Centers for Disease Control and Prevention (CDC) and the Indian Health Service (IHS). Most of the AI/AN-speci fic data provided in this report are the result of a novel surveillance methodology, whereby existing nationally notifi able STD data reported to CDC were analyzed using standard IHS populations and methods.
The Indian Health Surveillance Report–Sexually Transmitted Diseases 2009 consists of two main parts: the National STD Pro file (1984-2009) contains text and figures that provide an overview of STD morbidity among AI/AN in the U.S.; the IHS Area STD Pro files (1998-2009) present STD rates and trends for the 12 IHS administrative areas.
The surveillance methodology used in this report has served as a model and framework for analyzing AI/AN speci fic data for other nationally noti fiable diseases (e.g. hepatitis, tuberculosis) and for other priority health conditions (e.g. cancer, diabetes, mental health). Such reports are essential for increasing the accessibility and quality of AI/AN health data and play an important role in monitoring disease trends, identifying at-risk populations, and guiding interventions and resources.
Any comments and suggestions that might improve the usefulness of future publications are welcomed and can be sent to the IHS Division of Program Statistics at [email protected].

Acknowledgements
Publication of this report would not have been possible without the Technical and editorial review provided by Jim Braxton (CDC/DSTDP), contributions of the state health departments and STD control programs that Melanie Taylor (CDC/DSTDP), Lori de Ravello (CDC/DRH), Tom Peterman provided surveillance data to CDC. (CDC/DSTDP), Greg Pierce (CDC/DSTDP), Hillard Weinstock (CDC/
DSTDP), Delicia Carey (CDC/DSTDP), Kathleen Hutchins (CDC/DSTDP), Centers for Disease Control and Prevention Larry Layne, (IHS/DEDP), Kirk Greenway (IHS/DPS), Alan Friedman (IHS/ Of fice of Infectious Diseases DPS), Joann Pappalardo (IHS/DPS), Phillip Smith (IHS/DEHS) and James National Center for HIV/AIDS, Viral Hepatitis, STD, and TB Prevention Cheek (IHS/DEDP). Division of STD Prevention (DSTDP) Epidemiology and Surveillance Branch Special thanks to Kerry Kenney, CDC/DSTDP Assignee to Arizona Program and Training Branch Department of Health Services and Antoine Thompson, CDC/DSTDP Statistics and Data Management Branch assignee to New Mexico Department of Health, who assisted in reviewing
select primary and secondary syphilis (P&S) cases.Indian Health Service Of fice of Public Health Support Printing was provided by United States Government Printing Offi ce Division of Epidemiology and Disease Prevention (DEDP) Denver Regional Procurement Of fice, Lakewood, CO. Division of Program Statistics (DPS)
Contents
3 Preface
4 Acknowledgements
7 Background
Rationale for this Report
IHS Organization
CDC Organization
8 Data Sources and Limitations
13 Summary of Data
17 National STD Profi le
Chlamydia
Gonorrhea
Primary and Secondary Syphilis (P&S)
25 IHS Area STD Profi les
53 Tables
99 Appendices
102 References

BackgroundRationale for this Report CDC Organization
American Indian and Alaska Native (AI/AN) health data published by the CDC is also an agency within HHS. The primary mission of CDC is to Indian Health Service (IHS) primarily focus on population estimates, natality/ promote health and quality of life and to prevent and control disease, injury, mortality, health care finance, and patient care utilization.1,2 AI/AN data and disability. CDC is comprised of 15 major organizational units, which speci fic to STDs and other nationally noti fiable diseases are limited. Yet, these are largely managed through 5 overarching of fices: the Of fice of Infectious diseases represent a signi ficant burden on the IHS health care system and on Diseases; the Of fice of Noncommunicable Diseases, Injury and Environmental AI/AN people as a whole. Health; the Of fice of Public Health Preparedness and Response; the Offi ce for
State, Tribal, Local and Territorial Support; and the Of fice of Surveillance, In 2009, among all races and ethnicities, AI/AN had the second highest rates of Epidemiology, and Laboratory Services. The Division of STD Prevention is chlamydia and gonorrhea and the third highest rates of primary and secondary housed at the National Center for HIV/AIDS, Viral Hepatitis, STD, and TB syphilis (P&S).3 Improved awareness of these health disparities, through the Prevention, a center within the Of fice of Infectious Diseases. publication and dissemination of an AI/AN speci fic STD surveillance report, may lead to increased funding, resources, and research activities in AI/AN communities. In September 2004, collaboration between the Centers for Disease Control and Prevention (CDC) and IHS was initiated to develop such a report;4 a report using 2007 data was published in 2009.5 This current report is an update of these earlier reports and adds data though 2009.
IHS Organization
IHS, a federal agency within the U.S. Department of Health and Human Services (HHS), is responsible for providing health services to AI/AN people. The mission of IHS, in partnership with AI/AN people, is to raise their physical, mental, social, and spiritual health to the highest level.
IHS is comprised of 12 regional administrative units called Area Offi ces or IHS Areas. These IHS Areas include all or parts of 35 states. Within each IHS Area, health care facilities may be operated directly by IHS or may be operated by individual tribes (directly or through several forms of contracted services). Based on 2009 IHS service population estimates, the largest IHS Area is the Oklahoma City Area, which is home to 37 tribes and a population of 366,686; the smallest IHS Area is the Tucson Area, which is home to 2 tribes and a population of 36,525.6
Background
7
Data Source and Limitations
Nationally noti fiable disease data, including data for STDs, are submitted to System for Surveillance (NETSS). Data reported through NETSS comprise the CDC from state health departments (and other local reporting jurisdictions) and noti fiable disease information that is published in the Morbidity and Mortality are stored at the Public Health Surveillance Program Of fice (PHSPO). In 2009, Weekly Report (MMWR).there were over 60 nationally noti fiable infectious diseases and conditions.7 Surveillance data for noti fiable STDs are electronically sent from PHSPO The data presented in the National STD Profi le are from STDSS and are based to the Division of STD Prevention (DSTDP), where they are combined with on a combination of aggregated final NETSS electronic data and summary hard historical hard copy data (also sent from state and local jurisdictions) to create copy reporting forms. Monthly hard copy reporting forms include summary the national STD Surveillance System (STDSS). data for syphilis by county and state. Quarterly hard copy reporting forms
include summary data for gonorrhea, chlamydia, syphilis, and other STDs by sex and source of report (STD clinic or non-STD clinic) for the 50 states and
Numerators: Incident STD Cases Reported to CDC outlying areas of the U.S. Annual hardcopy reporting forms include summary data for chlamydia, gonorrhea, and primary and secondary syphilis (P&S) by
All of the STD data in this report are based on cases of nationally notifi able age, race, and sex for the 50 states, DC, and 6 large city project areas.STDs reported to CDC from the STD control programs and health departments in the 50 states, the District of Columbia (DC), and selected U.S. cities. In The IHS speci fic data presented in the IHS Area STD Profi les come only from aggregate, the STD cases reported from all of these jurisdictions are used when NETSS and do not include data from hard copy reporting forms. IHS Area calculating U.S. rates. STD data from U.S. dependencies and territories (e.g., data presented in this report require STD datasets which contain both race and Guam, Puerto Rico, Virgin Islands) are not included in the U.S. rates or for all county variables in order to determine which cases are AI/AN and to assign other rates used in this report. cases to the appropriate IHS Area (based on the patient’s county of residence).
These variables are generally available only with NETSS line-listed data. Data AI/AN rates (as shown in the National STD Pro file section) are based on contained in the IHS Area STD Pro files are restricted to years when STD cases STD cases which occurred among persons identi fied as AI/AN residing in all submitted to NETSS were relatively complete for most states and reporting jurisdictions. In contrast, IHS rates (as shown in the IHS Area STD Profi les) jurisdictions (i.e., 1998-present).are based on a subset of all AI/AN STD cases. The IHS rates include only STD cases which occurred among AI/AN residing in counties where IHS provides 2009 case reports and corrections sent to CDC through June 9, 2010, have been services or resources (see the IHS Denominators section on page 9 for further included in this report. Data and corrections received after this date will appear details); these STD cases may or may not have been diagnosed in IHS, tribal, in subsequent issues and updates.or urban Indian healthcare facilities. These de finitions of AI/AN rates and IHS rates are used consistently throughout this publication.
Adjustments to CDC STD Data
STD Data Sources and Reporting Formats In order to improve the quality of certain national and IHS Area analyses, several adjustments were made to the data prior to calculating rates. These
In the past, STD data were submitted by state STD prevention programs to procedures removed or redistributed cases and populations when one or more CDC on a variety of hard copy summary reporting forms (monthly, quarterly of the following conditions were present: and annually). As of December 31, 2003, all 50 states and DC had converted from summary hard copy reporting to electronic submission of line-listed (i.e., • If a state had >50% of its cases with unknown race/ethnicity, both the case-speci fic) STD data via the National Electronic Telecommunications cases and populations were removed from the case and population
Sexually Transm
itted Diseases 2009
Indian Health S
urveillance Report
8

databases prior to performing analyses involving race/ethnicity. developed the Census 2000 bridged-race fi le,8 which bridges the 31 race • If a state had ≤50% of its cases with unknown race/ethnicity, the cases categories speci fied in the 1997 Of fice of Management and Budget (OMB)
with unknown race/ethnicity were redistributed to known race/ethnicity standards (used in Census 2000) with the 4 race categories specifi ed under categories, based on the percentage of cases in each known category. This 1977 OMB standards (used in the 1980 and 1990 censuses).9
adjustment was made after cases had been summed over the geographic unit of the analysis (e.g., national, state, county, IHS Area). For years 1990-1999, population counts were also updated to incorporate
• If a state did not report cases electronically to NETSS, by race and ethnicity, the bridged-race estimates based on the Census 2000 counts.6 These fi les the populations of those states were removed from the population database in were prepared by the Census Bureau with support from the National Cancer those years. This adjustment was made only for IHS and IHS Area analyses. Institute.
For U.S. cases and rates shown in this report, adjustments were made depending U.S. rates for 1984-1989 were calculated using Census Bureau population on the type of analysis in order to maintain consistency between data presented estimates for corresponding years.10
in this report and data presented in the CDC STD Surveillance Summaries.3 Unadjusted U.S. case counts and rates are presented for STD totals and for analyses by sex; adjusted U.S. cases counts and rates are presented for analyses AI/AN Denominators (National STD Profi le)of sex and age.
National AI/AN rates, like U.S. rates, were calculated using national-level census population estimates. For 1984-1989, rates were calculated using AI/
Population Denominators and Rate Calculations AN-speci fic Census Bureau population estimates.10 For 1990-2009, rates were calculated based on estimates of identi fied AI/AN in the Census 2000 bridged-
Crude incidence rates (new cases/population) were calculated on an annual race fi le.8
basis per 100,000 population. In this report, the 2009 rates for the U.S., IHS, and individual IHS Areas were calculated by dividing the number of cases reported from each area in 2009 by corresponding 2008 population estimates. IHS Denominators (IHS Area STD Profi les)For subsequent reports, the 2009 rates will be updated using 2009 population figures. For all other years, rates were calculated by dividing annual cases by the Population denominators used to calculate IHS rates are based on estimates
appropriate population estimate (e.g. 2001 cases divided by 2001 population). of AI/AN identi fied to be eligible for IHS services (i.e. the IHS eligible Speci fics on population denominators used in this report are detailed below. population).
IHS eligible population estimates are unique to this publication and are based U.S. Denominators on of ficial county estimates from the Census 2000 bridged-race fi le. The
Census Bureau enumerates those individuals who self-identify as being AI/AN. For years 2000-2009, rates were calculated using the Census 2000 bridged-Race The IHS eligible population is estimated by counting those AI/AN (as self- file developed by the Census Bureau and the National Center for Health Statistics identi fied during the Census) who reside in speci fied counties in which IHS
(NCHS). Census 2000 was the first census to allow for racial identifi cation as provides services or resources (“on or near” reservations)—within IHS, these either a single race or in combination with other races; consequently, the Census counties are commonly referred to as contract health service delivery areas 2000 data on race are not directly comparable with data from the 1990 census or (CHSDAs) or service counties. In 2009, there were 625 service counties in 35 earlier censuses. To address this inconsistency, NCHS and the Census Bureau states; the current listing of service counties can be obtained by contacting IHS
Data S
ource and Limitations
9

Data Source and Limitations
Division of Program Statistics (DPS) at [email protected] or accessing Data Limitations and Clarifi cationsthe Federal Register of June 21, 2008.11 Based on current service counties, the estimated overall 2009 IHS eligible population is 1.86 million persons, AI/AN and Hispanic Ethnicitycomprising 75% of all AI/AN residing in the U.S. These people may or may not access IHS services. IHS-speci fic races shown in the IHS Area Pro files section of this report are
based on case reports and population estimates for all individuals identifi ed IHS eligible population estimates are similar, but not identical, to IHS service as AI/AN, including AI/AN Hispanics and AI/AN non-Hispanics. This population estimates, which are of ficial IHS population counts referenced methodology is consistent with current practices at IHS DPS.in IHS publications1,2 and used by IHS when calculating AI/AN natality/mortality rates and other health statistics. In contrast to IHS eligible population In contrast, AI/AN STD rates shown in the National STD Pro file and as estimates, IHS service population estimates are further adjusted using an published in the annual CDC STD Surveillance Summaries include case intercensal smoothing process based on the most current 10 years of AI/ reports and population estimates only for AI/AN non-Hispanics; STD cases AN natality and mortality data. This adjustment results in small differences which occurred among AI/AN Hispanics are included in the Hispanic rates.between the IHS eligible and IHS service population estimates. (Appendix A) Overall, in 2009, IHS eligible population estimates were 2.5% lower than Differences in how AI/AN Hispanics are categorized in the National Profi le vs. IHS service population estimates (1,862,500 vs. 1,909,550 respectively). For IHS Area Pro files result from differences in how primary data were collected in individual IHS Areas, IHS eligible population estimates (when compared to the STDSS and NETSS databases.IHS service population estimates) ranged between 11.8% lower in the Alaska Area and 12.9% higher in the Phoenix Area.
Misreporting of AI/AN RacePopulations and population rankings shown in the individual Area IHS profi les are based on the of ficial IHS service population. A population rank of 1 has the Previous studies have documented misreporting of AI/AN race on death largest population; a rank of 12 has the smallest. Rates in the Area IHS profi le certi ficates and in state STD surveillance databases,13, 14 resulting in under-graphs and tables use IHS eligible populations in order to compute rates by sex estimates when characterizing the burden of disease among AI/AN people. and age for each area. Misreporting of AI/AN race occurs particularly in areas distant from traditional
AI/AN reservations.13 AI/AN and IHS rates presented in this report have not been adjusted for racial misreporting.
Healthy People 2010 Objectives
In January 2000, CDC released Healthy People 2010 (HP 2010), a set of heatlh IHS Areas Containing Partial Service Countiesobjectives for the U.S. to achieve over the first decade of the new century.12 The year 2010 targets for the diseases addressed in this report are: gonorrhea—19 Five of the IHS Areas (Albuquerque, California, Navajo, Phoenix, and Tucson) cases per 100,000 population, and primary and secondary syphilis—0.2 case contain service counties which are shared between IHS Areas or are partially per 100,000 population. contained within an IHS Area. For these 17 partial service counties,Appendix B
IHS DPS developed “percentage splits” (based on the 1990 census), which determine what proportion of the county’s AI/AN population lies within the jurisdiction of a given IHS Area. These percentage splits, which are based
Sexually Transm
itted Diseases 2009
Indian Health S
urveillance Report
10
on geographic boundaries, tribal population counts and health care utilization Reporting of Chlamydia Casesdata, are updated periodically.
Trends in chlamydia case reporting from many states and areas are more For chlamydia and gonorrhea rates presented in this report, case counts and IHS re flective of changes in testing, diagnosis, and reporting of cases, rather populations for partial service counties were determined using percentage splits. than actual trends in disease incidence. Because of this limitation, the CDC This is the same methodology that IHS DPS currently uses when calculating primarily monitors chlamydia trends not by rates (number of positive cases/natality and mortality rates involving partial service counties. population), but by positivity or estimated prevalence (number of positive
cases/number tested).16 In areas where chlamydia positivity data are limited Because primary and secondary syphilis (P&S) rates are signifi cantly lower or not available, it is important to publish data on chlamydia rates (as provided than chlamydia and gonorrhea rates, attributing cases which occurred in partial in this report) in order to emphasize the large numbers of chlamydia cases service counties based on percentage splits could lead to substantial differences being detected. Chlamydia positivity data by IHS Area are not included in this in rates as described in this report compared to actual disease rates. For the report.P&S cases which occurred in partial service counties during 1998-2009, we adjusted rates by reviewing case data with state STD database managers to determine which IHS Area the case should be assigned to, based on the patient’s Interpretation of Case Rates when Case Counts are Smallcommunity of residence. Adjusted P&S case counts and rates are shown for the 5 affected IHS Areas (Albuquerque, California, Navajo, Phoenix, and Tucson). STD case rates for many analyses presented in this report are based on small
case counts (e.g. ≤20 cases); such rates and trends should be interpreted with Urban Indians and Non-Federally Recognized Tribes caution. Small case counts occur in analyses by sex and age as well as P&S
analyses, and analyses involving IHS Areas with small populations (e.g. STD data speci fic to urban Indians and members of non-federally recognized Tucson and Billings). Case counts corresponding to all rates shown in this tribes are not included in this report. Methodologies to describe STD rates in report are provided in the tables section.these populations must still be developed. Such data may be included in future issues and updates.
What is New in This Report
Reporting Practices • The 2009 report is expanded to include cases and rates from 2008-2009.• The algorithm to redistribute cases with unknown race was modifi ed to
Although most areas generally adhere to the case de finition for STDs found in reduce the impact of rounding. This may have resulted in small changes in Case De finitions for Infectious Conditions under Public Health Surveillance,15 the estimated IHS Area cases and rates in some years.there may be differences in the policies and systems for collecting surveillance • Counties in each IHS region were modi fied to be consistent with the data. Thus, comparisons of case numbers and rates between areas should be CHSDA counties reported in the June 21, 2008 Federal Registry.11 interpreted with caution. However, since case de finitions and surveillance Changes included adding Torrance County, NM to Albuquerque IHS activities within a given area remain relatively stable, trends should be area; Grand Parish and LaSalle Parish LA to the Nashville IHS area; Utah minimally affected by these differences. In many areas, the reporting from County, UT to the Phoenix IHS area; and San Juan County, WA to the publicly supported institutions (e.g. STD clinics and IHS, tribal, or urban Indian Portland IHS area. Counties deleted were Hudspeth County, TX from the health organizations) has been more complete than from other sources (e.g. Albuquerque IHS area; Pierce County, WI from the Bemidji IHS area and private practitioners). Thus, trends may not be representative of all segments of Santa Cruz County, AZ from the Tucson IHS area.the population.
Data S
ource and Limitations
11

Summary of Data

Summary of Data
Sexually transmitted diseases (STDs) remain a major Chlamydiapublic health challenge in the U.S. While substantial progress has been made in preventing, diagnosing, and Across all race/ethnicities, chlamydia remains the most commonly reported
infectious disease in the U.S. In 2009, 19,618 chlamydia diagnoses were treating certain STDs in recent years, CDC estimates reported among AI/AN, down slightly from 19,917 cases in 2008.3,20 The
that 19 million new infections occurred in 2000, almost national AI/AN rate of reported chlamydia in 2009 was 776.5 cases per 100,000 population, a decrease of 1.5% from 2008 (788.3 cases per 100,000
half of them among young people ages 15 to 24.17 In population).3,20 The 2009 chlamydia rate among AI/AN was 1.9 times higher addition to the physical and psychological consequences than the U.S. rate (409.2 cases per 100,000 population).3
of STDs, these diseases also exact a tremendous economic toll. Direct medical costs associated with Large Disparity Between IHS and U.S. Rates
STDs in the U.S. are estimated at $15.9 billion Among AI/AN residing in IHS service areas, the overall IHS chlamydia rate annually.18 in 2009 was 816.2 cases per 100,000 population, which was 2.0 times higher
than the corresponding U.S. rate (409.2 cases per 100,000 population); 10 IHS
This report summarizes 2009 national data and trends Areas (all but California and Nashville) had chlamydia rates up to 5.7 times higher than the U.S. rate. For all populations, increases in chlamydia rates
for chlamydia, gonorrhea, and primary and secondary over the past 20 years largely re flect the expansion of screening activities,
syphilis (P&S) among American Indians and Alaska increasingly sensitive diagnostic tests, an increased emphasis on case reporting, and improvements in reporting system. However, many women who are at risk
Natives (AI/AN). AI/ANs are one of the smallest racial are still not being tested.3 Still, several IHS Areas had decreasing chlamydia groups in the U.S., comprising between 0.9%-1.5% of rates between 2008 and 2009: Bemidji (-2.0%), Billings (-4.2%), California
the total U.S. population (-13.9%), Navajo (-4.5%), Oklahoma City (-3.5%), Phoenix (-6.1%) and 19—but are disproportionately Tucson (-5.0%).affected by STDs. In 2009, reported rates of chlamydia, gonorrhea, and P&S among AI/AN were 1.2 to 4.3 times Young Women Especially Affectedhigher than comparable rates for whites.3
Compared to men, chlamydia rates are higher among women and refl ect the fact that women are more likely to be screened for this infection. Chlamydia rates are highest among women age 15-24. In 2009, the overall IHS rate among women ages 15-24 years was 4,701.2 cases per 100,000 population, which was 1.5 times higher than the corresponding U.S. rate (3,231.4 cases per 100,000 population). For individual IHS Areas, chlamydia rates among women 15-24 years ranged between 1,072.4 cases per 100,000 population in the California Area to 12,752.5 cases per 100,000 population in the Alaska Area.
Sexually Transm
itted Diseases 2009
Indian Health S
urveillance Report
14
Gonorrhea Primary and Secondary Syphilis (P&S)
Gonorrhea is the second most commonly reported infectious disease in the The rate of P&S in the U.S. decreased throughout the 1990s, and in 2000 U.S. In 2009, 2,917 gonorrhea diagnoses were reported among AI/AN, up from reached an all-time low. However, over the past 6 years both the U.S. and AI/2,764 cases in 2008.3,20 The national rate of reported gonorrhea in 2009 among AN syphilis rates have been increasing. Between 2008 and 2009, the AI/AN AI/AN was 113.3 cases per 100,000 population, an increase of 5.5% from 2008 P&S rate increased slightly, from 2.3 to 2.4 cases per 100,000 population; (107.4 cases per 100,000 population).3,20 The 2009 gonorrhea rate among AI/ comparatively, the U.S. P&S rate increased from 4.4 to 4.6 cases per 100,000 AN was higher than the U.S. rate (99.1 cases per 100,000 population).3 population. In 2009, 61 P&S diagnoses were reported among AI/AN, up from
58, in 2008.3,20
Overall 2009 IHS Rate Lower than U.S. Rate IHS Cases Primarily Occurring in the Southwest
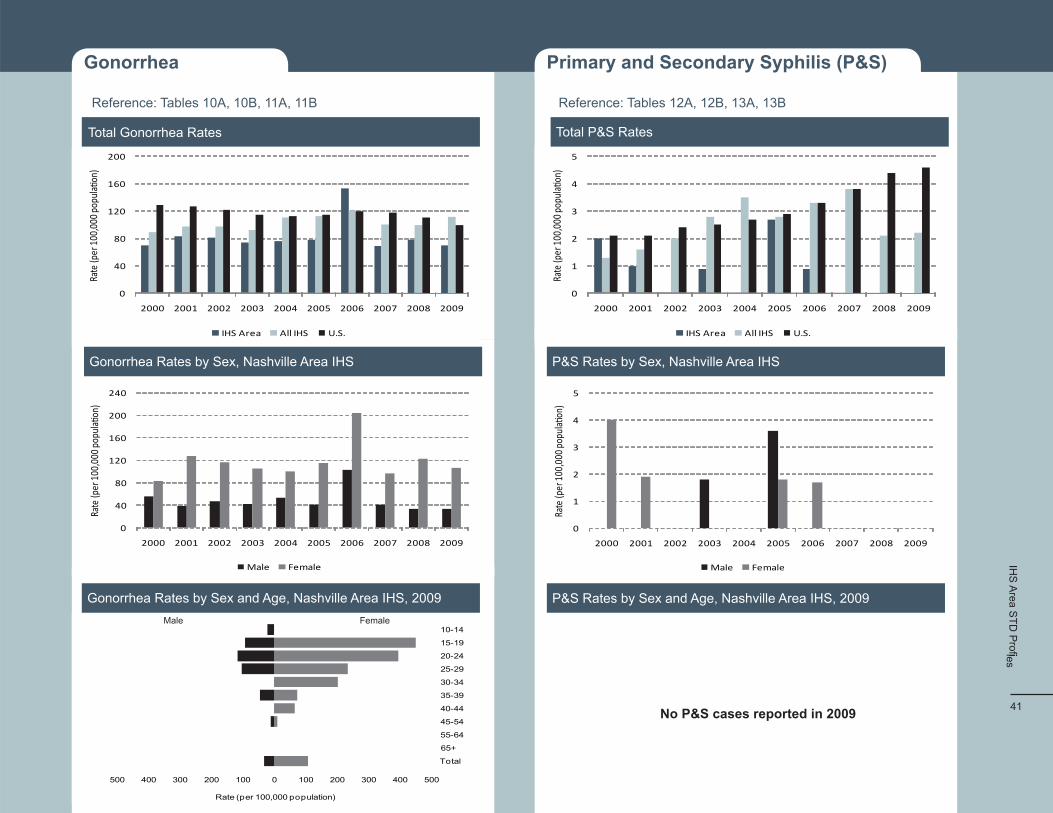
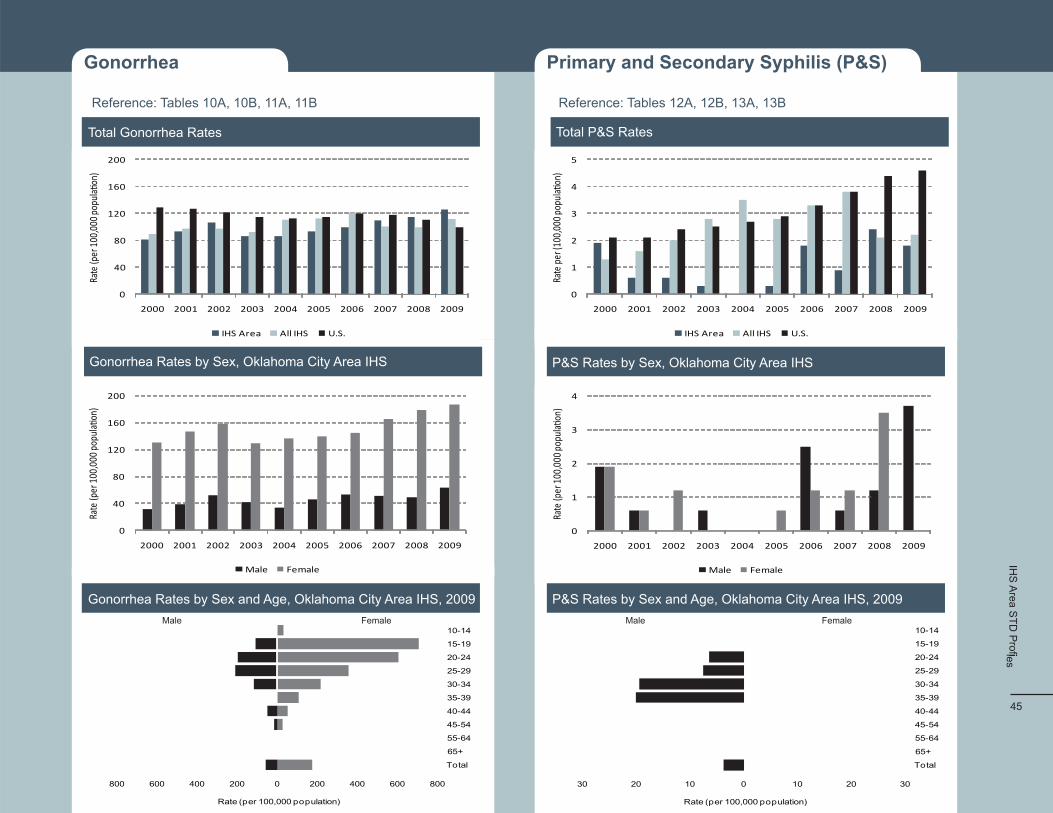
In 2009, the overall IHS gonorrhea rate of 111.6 cases per 100,000 population In 2009, 38 of 41 P&S cases (93%) diagnosed within the IHS service area was higher than the U.S. gonorrhea rate of 99.1 cases per 100,000 population. occurred in 5 IHS Areas in the Southwest—Albuquerque, Navajo, Oklahoma Gonorrhea rates for the overall IHS population increased from 96.3 to 111.6 City, Phoenix, and Tucson; 5 IHS Areas had no P&S cases in 2009. IHS cases per 100,000 population between 1998 and 2009, with a peak of 120.5 in cases of P&S in the Southwest have been increasing since 2000, with peaks 2006. in 2004 (56 cases) and 2007 (54 cases). During 2008-2009, the greatest P&S
rate increase occurred in the Albuquerque Area (from 0.9 to 6.2 cases per High Gonorrhea Rates in 4 IHS Areas 100,000 population), followed by Phoenix Area (from 3.4 to 3.9 cases per
100,000). Three areas had notable decreases in P&S rates: Tucson (from Reported gonorrhea rates in 2009 for 4 IHS Areas—Aberdeen, Alaska, 14.9 to 12.4 cases per 100,000 population, Navajo (from 5.3 to 4.8 cases per Bemidji, and Oklahoma City—were 1.3 to 6.0 times higher than the U.S. rate. 100,000 population), and Oklahoma City (from 2.4 to 1.8 cases per 100,000 The Alaska Area had the highest gonorrhea rate (593.4 cases per 100,000 population).population). For the overall IHS population in 2009, gonorrhea rates were higher—almost double—for women (147.0 cases per 100,000 population) compared to men (75.1 cases per 100,000 population). IHS Cases Evenly Distributed Between Men and Women
For overall IHS cases in 2009, the P&S male-to-female rate ratio was 3:1, which indicates a disproportionate number of P&S cases occurring among AI/AN men compared to AI/AN women. This is a large increase since the 2007 surveillance report was published, when the ratio was 1:1.5 The U.S. P&S male-to-female rate ratio in 2009 was 6:1. These disparities refl ect recent syphilis outbreaks in the U.S. which have primarily occurred among urban men who have sex with men (MSM). The ratios vary between IHS areas, with some affected areas having proportionately more men infected (e.g., Phoenix (8:1), Navajo (2:1), Albuquerque (3:1), Oklahoma City (4:1); however, in Tucson the female-to-male ratio is slightly higher (1.4:1).
Data S
ource and Limitations
15

National STD Profi leChlamydia
Gonorrhea
Primary and Secondary Syphilis
Chlamydia
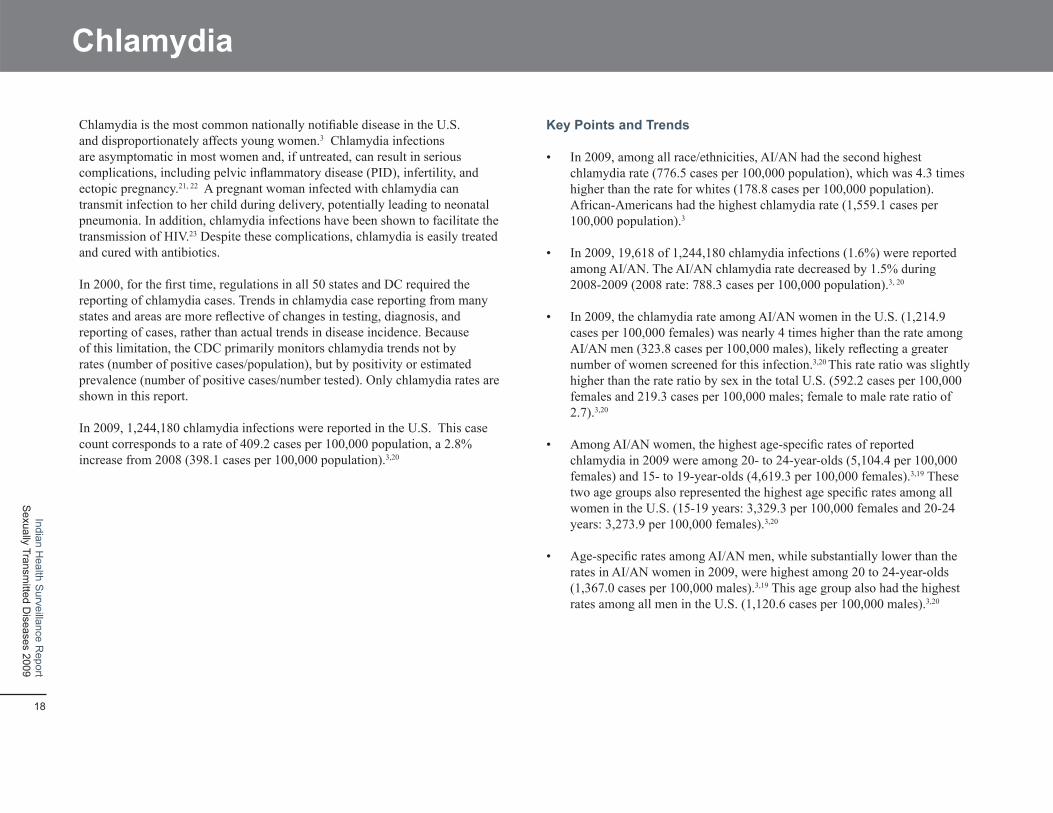
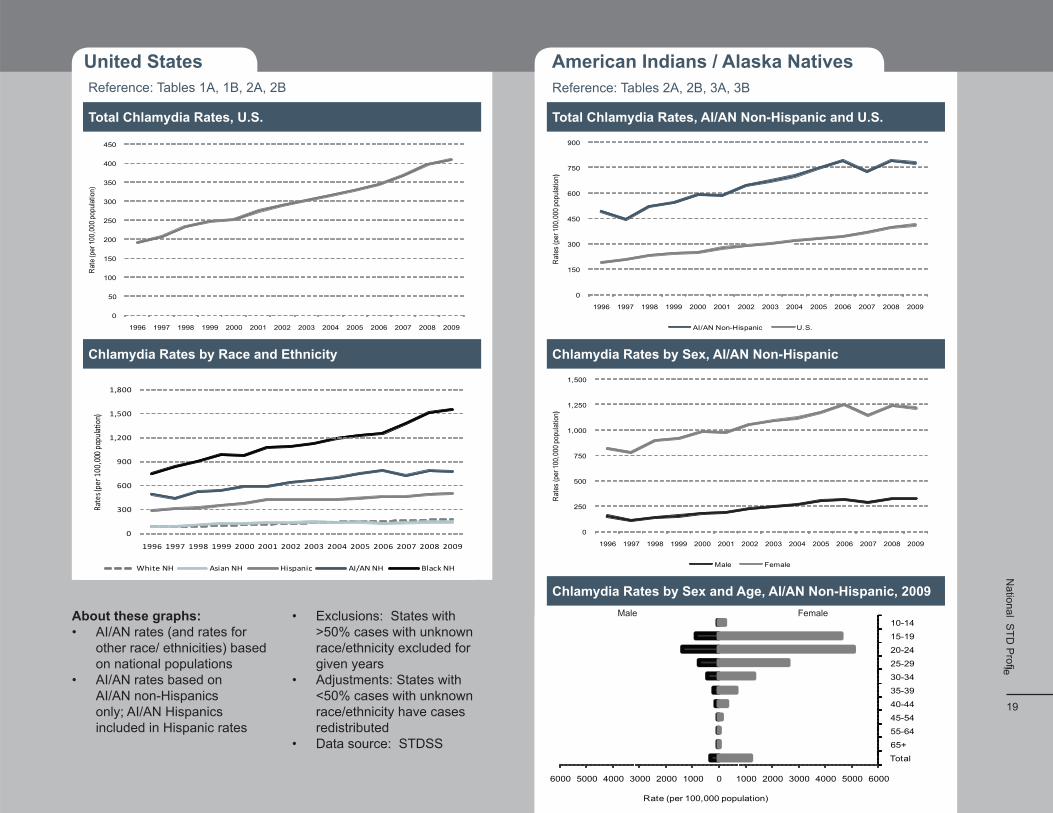
Chlamydia is the most common nationally noti fiable disease in the U.S. Key Points and Trendsand disproportionately affects young women.3 Chlamydia infections are asymptomatic in most women and, if untreated, can result in serious • In 2009, among all race/ethnicities, AI/AN had the second highest complications, including pelvic in flammatory disease (PID), infertility, and chlamydia rate (776.5 cases per 100,000 population), which was 4.3 times ectopic pregnancy.21, 22 A pregnant woman infected with chlamydia can higher than the rate for whites (178.8 cases per 100,000 population). transmit infection to her child during delivery, potentially leading to neonatal African-Americans had the highest chlamydia rate (1,559.1 cases per pneumonia. In addition, chlamydia infections have been shown to facilitate the 100,000 population).3
transmission of HIV.23 Despite these complications, chlamydia is easily treated and cured with antibiotics. • In 2009, 19,618 of 1,244,180 chlamydia infections (1.6%) were reported
among AI/AN. The AI/AN chlamydia rate decreased by 1.5% during In 2000, for the first time, regulations in all 50 states and DC required the 2008-2009 (2008 rate: 788.3 cases per 100,000 population).3, 20
reporting of chlamydia cases. Trends in chlamydia case reporting from many states and areas are more re flective of changes in testing, diagnosis, and • In 2009, the chlamydia rate among AI/AN women in the U.S. (1,214.9 reporting of cases, rather than actual trends in disease incidence. Because cases per 100,000 females) was nearly 4 times higher than the rate among of this limitation, the CDC primarily monitors chlamydia trends not by AI/AN men (323.8 cases per 100,000 males), likely re flecting a greater rates (number of positive cases/population), but by positivity or estimated number of women screened for this infection.3,20 This rate ratio was slightly prevalence (number of positive cases/number tested). Only chlamydia rates are higher than the rate ratio by sex in the total U.S. (592.2 cases per 100,000 shown in this report. females and 219.3 cases per 100,000 males; female to male rate ratio of
2.7).3,20
In 2009, 1,244,180 chlamydia infections were reported in the U.S. This case count corresponds to a rate of 409.2 cases per 100,000 population, a 2.8% • Among AI/AN women, the highest age-speci fic rates of reported increase from 2008 (398.1 cases per 100,000 population).3,20 chlamydia in 2009 were among 20- to 24-year-olds (5,104.4 per 100,000
females) and 15- to 19-year-olds (4,619.3 per 100,000 females).3,19 These two age groups also represented the highest age speci fic rates among all women in the U.S. (15-19 years: 3,329.3 per 100,000 females and 20-24 years: 3,273.9 per 100,000 females).3,20
• Age-speci fic rates among AI/AN men, while substantially lower than the rates in AI/AN women in 2009, were highest among 20 to 24-year-olds (1,367.0 cases per 100,000 males).3,19 This age group also had the highest rates among all men in the U.S. (1,120.6 cases per 100,000 males).3,20
Sexually Transm
itted Diseases 2009
Indian Health S
urveillance Report
18
United States
150
350
600
900
Reference: Tables 1A, 1B, 2A, 2B
Total Chlamydia Rates, U.S.
450
400
Rat
e (p
er 1
00,0
00 p
opul
atio
n)
300
250
200
100
0
50
1996 1997 1998 1999 2000 2001 2002 2003 2004 2005 2006 2007 2008 2009
Chlamydia Rates by Race and Ethnicity
1,800
1,500
Rate
s (pe
r 100
,000
pop
ulaƟ
on)
1,200
300
0
1996 1997 1998 1999 2000 2001 2002 2003 2004 2005 2006 2007 2008 2009
White NH Asian NH Hispanic AI/AN NH Black NH
About these graphs: • Exclusions: States with • AI/AN rates (and rates for >50% cases with unknown
other race/ ethnicities) based race/ethnicity excluded for on national populations given years
• AI/AN rates based on • Adjustments: States with AI/AN non-Hispanics <50% cases with unknown only; AI/AN Hispanics race/ethnicity have cases included in Hispanic rates redistributed
• Data source: STDSS
American Indians / Alaska Natives
Reference: Tables 2A, 2B, 3A, 3B
Total Chlamydia Rates, AI/AN Non-Hispanic and U.S.
900
750
Rat
es (p
er 1
00,0
00 p
opul
atio
n)
600
450
300
150
0
1996 1997 1998 1999 2000 2001 2002 2003 2004 2005 2006 2007 2008 2009
AI/AN Non-Hispanic U.S.
Chlamydia Rates by Sex, AI/AN Non-Hispanic
1,500
1,250
Rat
es (p
er 1
00,0
00 p
opul
atio
n)
1,000
750
500
250
0
1996 1997 1998 1999 2000 2001 2002 2003 2004 2005 2006 2007 2008 2009
Male Female
Chlamydia Rates by Sex and Age, AI/AN Non-Hispanic, 2009 Male Female
10-14
15-19
20-24
25-29
30-34
35-39
40-44
55-64
65+
Total
45-54
6000 5000 4000 3000 2000 1000 0 1000 2000 3000 4000 5000 6000
Rate (per 100,000 population)
National S
TD P
role fi
19
Gonorrhea
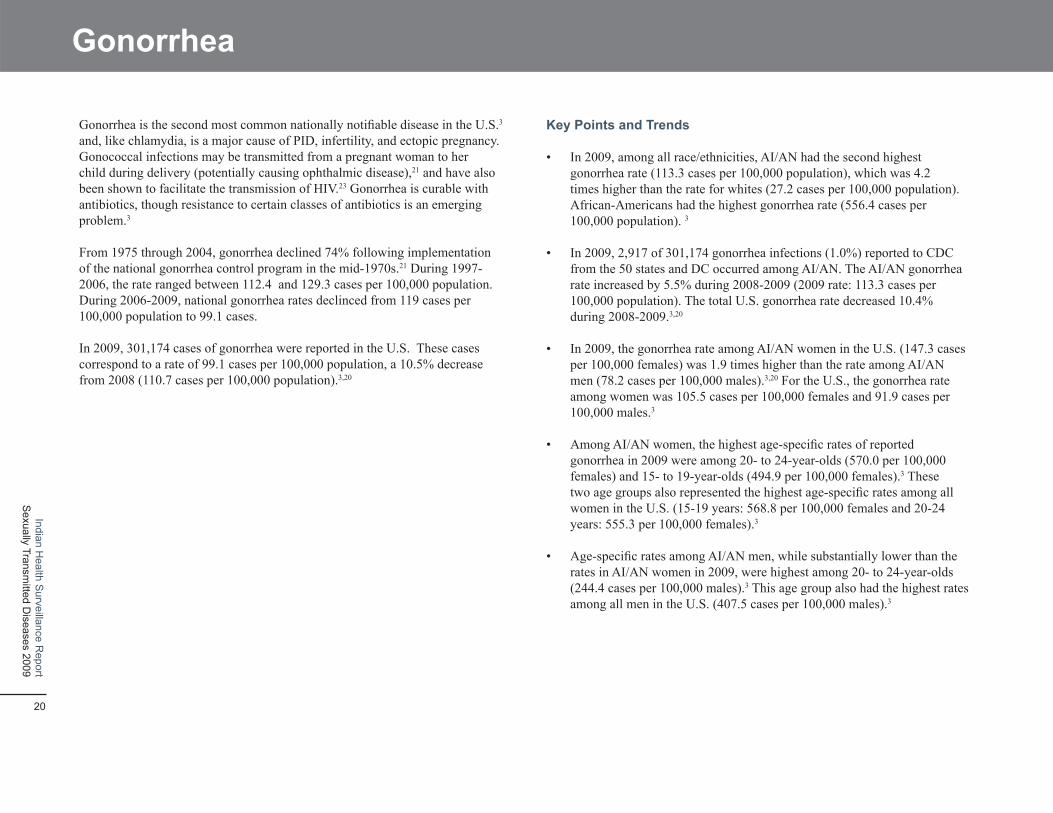
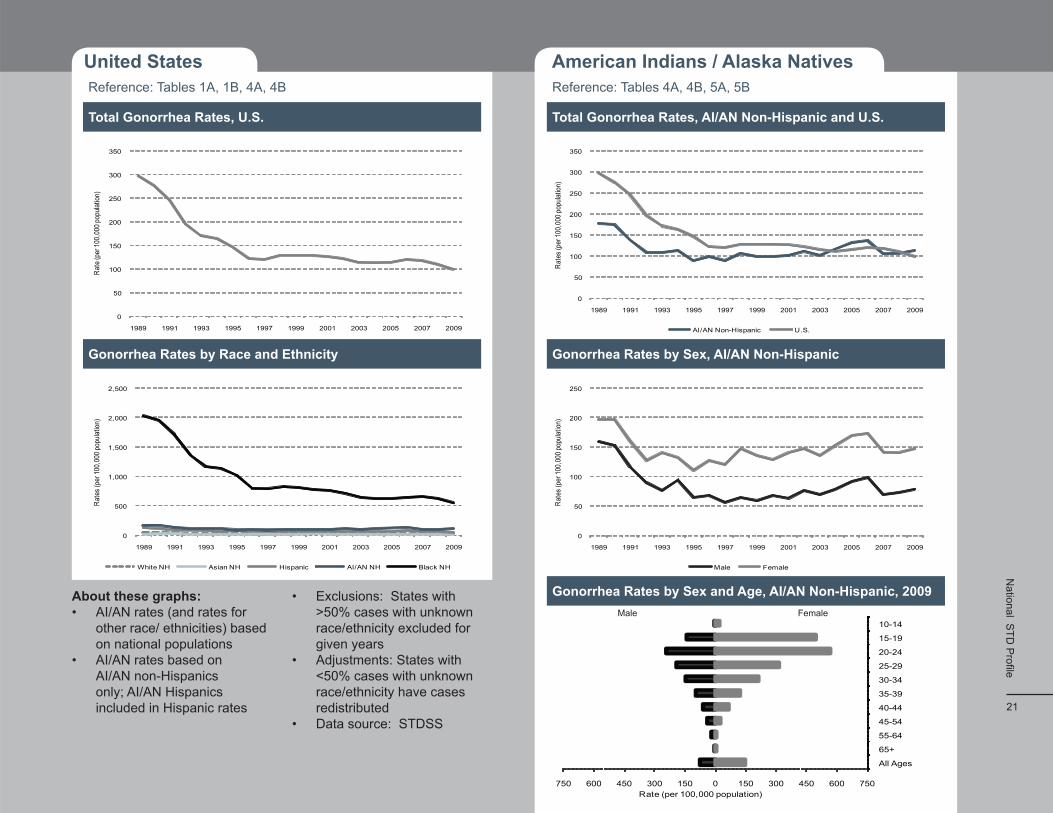
Gonorrhea is the second most common nationally noti fiable disease in the U.S.3 Key Points and Trendsand, like chlamydia, is a major cause of PID, infertility, and ectopic pregnancy. Gonococcal infections may be transmitted from a pregnant woman to her • In 2009, among all race/ethnicities, AI/AN had the second highest child during delivery (potentially causing ophthalmic disease),21 and have also gonorrhea rate (113.3 cases per 100,000 population), which was 4.2 been shown to facilitate the transmission of HIV.23 Gonorrhea is curable with times higher than the rate for whites (27.2 cases per 100,000 population). antibiotics, though resistance to certain classes of antibiotics is an emerging African-Americans had the highest gonorrhea rate (556.4 cases per problem.3 100,000 population). 3
From 1975 through 2004, gonorrhea declined 74% following implementation • In 2009, 2,917 of 301,174 gonorrhea infections (1.0%) reported to CDC of the national gonorrhea control program in the mid-1970s.21 During 1997- from the 50 states and DC occurred among AI/AN. The AI/AN gonorrhea 2006, the rate ranged between 112.4 and 129.3 cases per 100,000 population. rate increased by 5.5% during 2008-2009 (2009 rate: 113.3 cases per During 2006-2009, national gonorrhea rates declinced from 119 cases per 100,000 population). The total U.S. gonorrhea rate decreased 10.4% 100,000 population to 99.1 cases. during 2008-2009.3,20
In 2009, 301,174 cases of gonorrhea were reported in the U.S. These cases • In 2009, the gonorrhea rate among AI/AN women in the U.S. (147.3 cases correspond to a rate of 99.1 cases per 100,000 population, a 10.5% decrease per 100,000 females) was 1.9 times higher than the rate among AI/AN from 2008 (110.7 cases per 100,000 population).3,20 men (78.2 cases per 100,000 males).3,20 For the U.S., the gonorrhea rate
among women was 105.5 cases per 100,000 females and 91.9 cases per 100,000 males.3
• Among AI/AN women, the highest age-speci fic rates of reported gonorrhea in 2009 were among 20- to 24-year-olds (570.0 per 100,000 females) and 15- to 19-year-olds (494.9 per 100,000 females).3 These two age groups also represented the highest age-speci fic rates among all women in the U.S. (15-19 years: 568.8 per 100,000 females and 20-24 years: 555.3 per 100,000 females).3
• Age-speci fic rates among AI/AN men, while substantially lower than the rates in AI/AN women in 2009, were highest among 20- to 24-year-olds (244.4 cases per 100,000 males).3 This age group also had the highest rates among all men in the U.S. (407.5 cases per 100,000 males).3
Sexually Transm
itted Diseases 2009
Indian Health S
urveillance Report
20
United States
Total Gonorrhea Rates, U.S.
Gonorrhea Rates by Race and Ethnicity
Reference: Tables 1A, 1B, 4A, 4B
0
500
1,000
1,500
2,000
2,500
1989 1991 1993 1995 1997 1999 2001 2003 2005 2007 2009
Rate
s (pe
r 100
,000
popu
lation
)
White NH Asian NH Hispanic AI/AN NH Black NH
0
50
100
150
200
250
300
350
1989 1991 1993 1995 1997 1999 2001 2003 2005 2007 2009
Rate
(per
100,
000 p
opula
tion)
About these graphs: • Exclusions: States with • AI/AN rates (and rates for >50% cases with unknown
other race/ ethnicities) based race/ethnicity excluded for on national populations given years
• AI/AN rates based on • Adjustments: States with AI/AN non-Hispanics <50% cases with unknown only; AI/AN Hispanics race/ethnicity have cases included in Hispanic rates redistributed
• Data source: STDSS
American Indians / Alaska Natives
Gonorrhea Rates by Sex and Age, AI/AN Non-Hispanic, 2009
Gonorrhea Rates by Sex, AI/AN Non-Hispanic
Total Gonorrhea Rates, AI/AN Non-Hispanic and U.S.
Reference: Tables 4A, 4B, 5A, 5B
0
50
100
150
200
250
300
350
1989 1991 1993 1995 1997 1999 2001 2003 2005 2007 2009
Rate
s (pe
r 100
,000
popu
lation
)
AI/AN Non-Hispanic U.S.
0
50
100
150
200
250
1989 1991 1993 1995 1997 1999 2001 2003 2005 2007 2009
Rate
s (pe
r 100
,000
popu
lation
)Male Female
750 600 450 300 150 0 150 300 450 600 750
10-14
15-19
20-24
25-29
30-34
35-39
40-44
45-54
55-64
65+
All Ages
Rate (per 100,000 population)
Male Female
National S
TD P
rofi le
21
Primary and Secondary Syphilis (P&S)
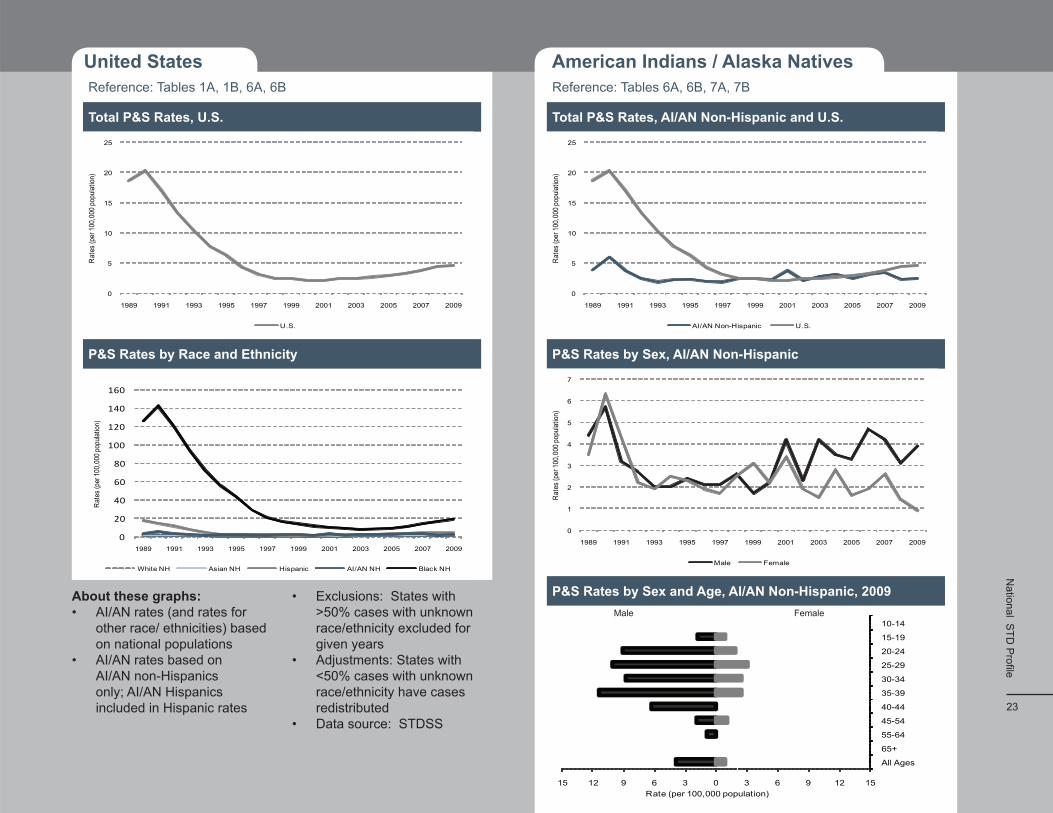
Syphilis, in its primary and secondary stages, is a highly infectious, but Key Points and Trendseasily curable, STD. However, if untreated, it can lead to serious long-term complications, including stroke, heart disease, and death. Syphilis can be • In 2009, among all race/ethnicities, AI/AN had the third highest P&S transmitted from untreated mothers to their fetuses, potentially leading to rate (2.4 cases per 100,000 population), which was similar to the rate for stillbirths and congenital deformities.24 In addition, syphilis has been shown to whites (2.1 cases per 100,000 population). African-Americans (19.2 cases increase the rate of HIV transmission by two- to fi ve-fold.23 For these reasons, per 100,000) and Hispanics (4.5 cases per 100,000 population) had higher syphilis prevention and control is a public health priority. rates than AI/AN.3
The rate of P&S decreased during the 1990s and reached an all-time low • In 2009, 61 of 13,997 P&S cases (0.4%) reported to CDC from the 50 in 2000 (2.1 cases per 100,000 population).3 The low rate of infectious states and DC occurred among AI/AN.3 The AI/AN P&S rate increased syphilis and the concentration of the majority of syphilis in a small number slightly to 2.4 cases per 100,000 population during 2008-2009 (2008 rate: of geographic areas in the U.S. led to the development of the CDC’s National 2.3 cases per 100,000 population).3,20
Plan to Eliminate Syphilis in October 1999.25 Since 2000, P&S rates in the U.S. have increased, with increases primarily occurring among men who have sex • In 2009, the male-to-female P&S rate ratio among AI/AN increase to with men (MSM).3 4:1, indicating more cases being diagnosed among men than women.3
Similarly, for the total U.S., the male-to-female P&S rate ratio has risen In 2009, 13,997 P&S cases were reported in the U.S. This case count steadily since 1996 to 6:1 in 2009, re flecting an increase in syphilis among corresponds to a rate of 4.6 cases per 100,000 population, an 4.5% increase men-who-have-sex-with-men (MSM) during this time.3 from 2008 (4.4 cases per 100,000 population).
• In 2009, among AI/AN, the age-speci fic P&S syphilis rates were highest among women aged 25-29 years (3.1 cases per 100,000 population) and among men aged 35-39 years (11.4 cases per 100,000 population).3 For the total U.S., the highest age-speci fic P&S rates were reported among 20-24 year olds for both women and men (5.6 and 20.7 cases per 100,000 population, respectively).3 In previous years, the highest age group among U.S. men was 35-39 years.
Sexually Transm
itted Diseases 2009
Indian Health S
urveillance Report
22
United States
Total P&S Rates, U.S.
P&S Rates by Race and Ethnicity
Reference: Tables 1A, 1B, 6A, 6B
0
5
10
15
20
25
1989 1991 1993 1995 1997 1999 2001 2003 2005 2007 2009
Rate
s (pe
r 100
,000
popu
lation
)
U.S.
0
20
40
60
80
100
120
140
160
1989 1991 1993 1995 1997 1999 2001 2003 2005 2007 2009
Rate
s (pe
r 100
,000
popu
lation
)
White NH Asian NH Hispanic AI/AN NH Black NH
• Exclusions: States with • AI/AN rates (and rates for >50% cases with unknown
other race/ ethnicities) based race/ethnicity excluded for on national populations given years
• AI/AN rates based on • Adjustments: States with AI/AN non-Hispanics <50% cases with unknown only; AI/AN Hispanics race/ethnicity have cases included in Hispanic rates redistributed
• Data source: STDSS
American Indians / Alaska Natives
P&S Rates by Sex and Age, AI/AN Non-Hispanic, 2009
P&S Rates by Sex, AI/AN Non-Hispanic
Total P&S Rates, AI/AN Non-Hispanic and U.S.
Reference: Tables 6A, 6B, 7A, 7B
0
5
10
15
20
25
1989 1991 1993 1995 1997 1999 2001 2003 2005 2007 2009
Rate
s (pe
r 100
,000
popu
lation
)
AI/AN Non-Hispanic U.S.
0
1
2
3
4
5
6
7
1989 1991 1993 1995 1997 1999 2001 2003 2005 2007 2009
Rate
s (pe
r 100
,000
popu
lation
)Male Female
15 12 9 6 3 0 3 6 9 12 15
10-14
15-19
20-24
25-29
30-34
35-39
40-44
45-54
55-64
65+
All Ages
Rate (per 100,000 population)
FemaleMale
About these graphs:
National S
TD P
rofi le
23

IHS Area STD Profi les Aberdeen / Alaska / AlbuquerqueBemidji / Billings / CaliforniaNashville / Navajo / Oklahoma CityPhoenix / Portland / Tucson
Indian Health Service
The IHS service area is comprised Notes for the STD graphs:of 625 service counties in 35 • IHS rates based on AI/AN states. The IHS service popula- living in service countiestion is estimated by enumerating • U.S. rates based on all races AI/AN who live in service counties. and ethnicities
• Exclusions: States with Geography: >50% of cases with unknown • States: 35 (AL, AZ, CA, CO, race excluded
CT, FL, ID, IN, IA, KS, LA, • Adjustments: States ME, MA,MI,MN, MS, MT, NE, with <50% of cases with NV, NM, NY, NC, ND, OK, unknown race have cases OR, PA, RI, SC, SD, TX, UT, redistributedWA, WI, WY) • Cases from partial IHS
• Counties: 625 Area service counties are • IHS 12Areas: redistributed
• IHS data source: NETSSTribes: 562 • U.S. data source: STDSS
2009 IHS Service Population (est.): 1,909,550
Sexually Transm
itted Diseases 2009
Indian Health S
urveillance Report
26
Chlamydia
Reference: Tables 8A, 8B, 9A, 9B
Chlamydia Rates by IHS Area, 2009
0 500 1,000 1,500 2,000 2,500
Alaska
Aberdeen
Billings
Navajo
Total IHS
Phoenix
Tucson
Portland
Bemidji
Oklahoma City
Albuquerque
U.S.
Nashville
California
Rate (per 100,000 population)
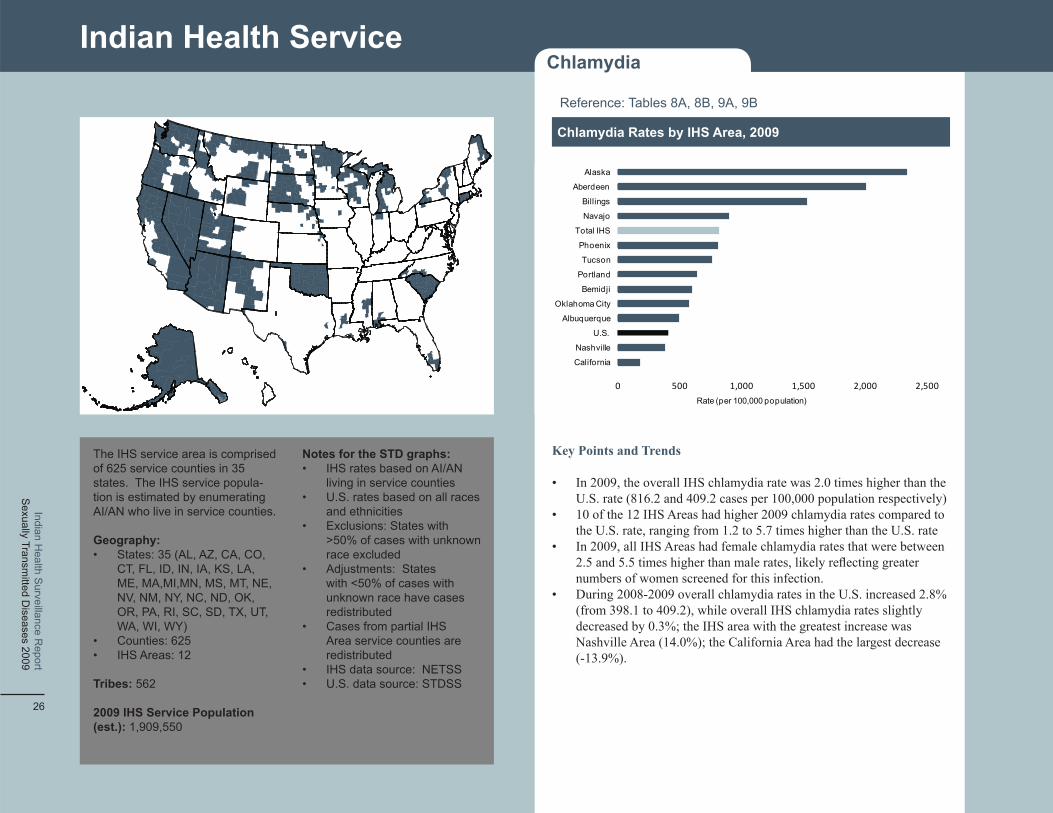
Key Points and Trends
• In 2009, the overall IHS chlamydia rate was 2.0 times higher than the U.S. rate (816.2 and 409.2 cases per 100,000 population respectively)
• 10 of the 12 IHS Areas had higher 2009 chlamydia rates compared to the U.S. rate, ranging from 1.2 to 5.7 times higher than the U.S. rate
• In 2009, all IHS Areas had female chlamydia rates that were between 2.5 and 5.5 times higher than male rates, likely refl ecting greater numbers of women screened for this infection.
• During 2008-2009 overall chlamydia rates in the U.S. increased 2.8% (from 398.1 to 409.2), while overall IHS chlamydia rates slightly decreased by 0.3%; the IHS area with the greatest increase was Nashville Area (14.0%); the California Area had the largest decrease (-13.9%).
Gonorrhea
Reference: Tables 10A, 10B, 11A, 11B
Gonorrhea Rates by IHS Area, 2009
O
0 100 200 300 400 500 600 700
AlaskaAberdeen
BemidjiOklahoma City
Total IHSU.S.
PhoenixNashville
TucsonNavajo
AlbuquerquePortlandBillings
California
Rate (per 100,000 population)
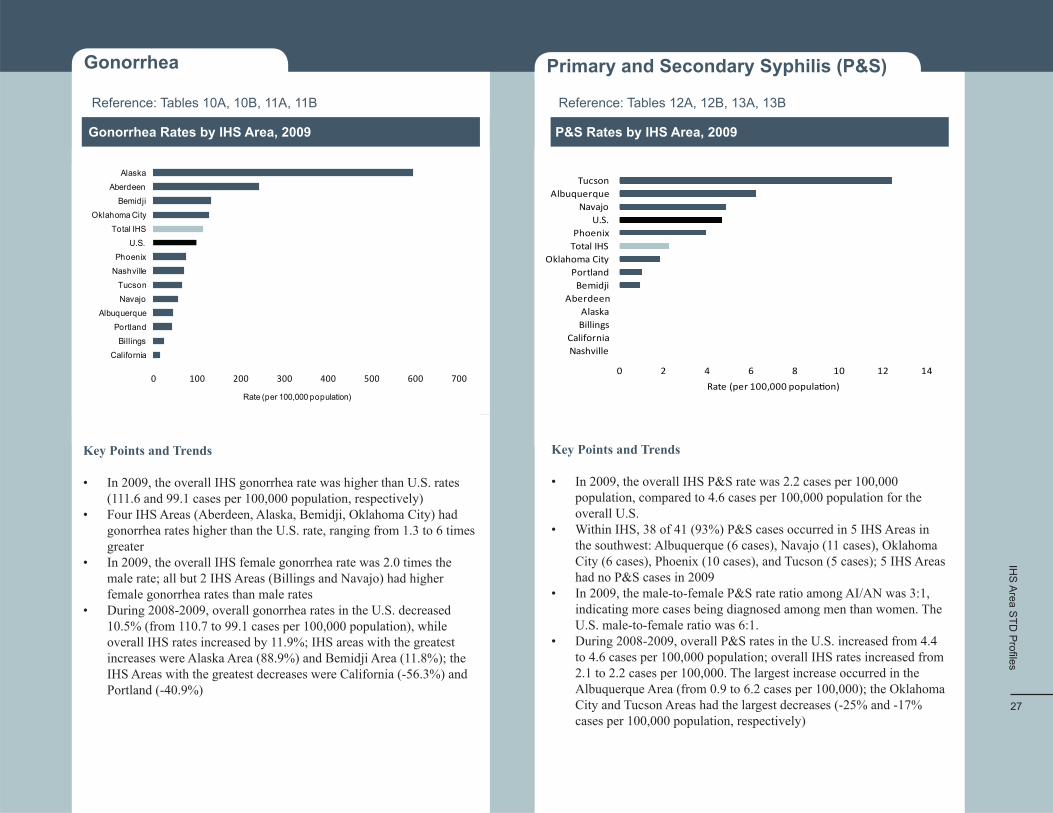
Key Points and Trends
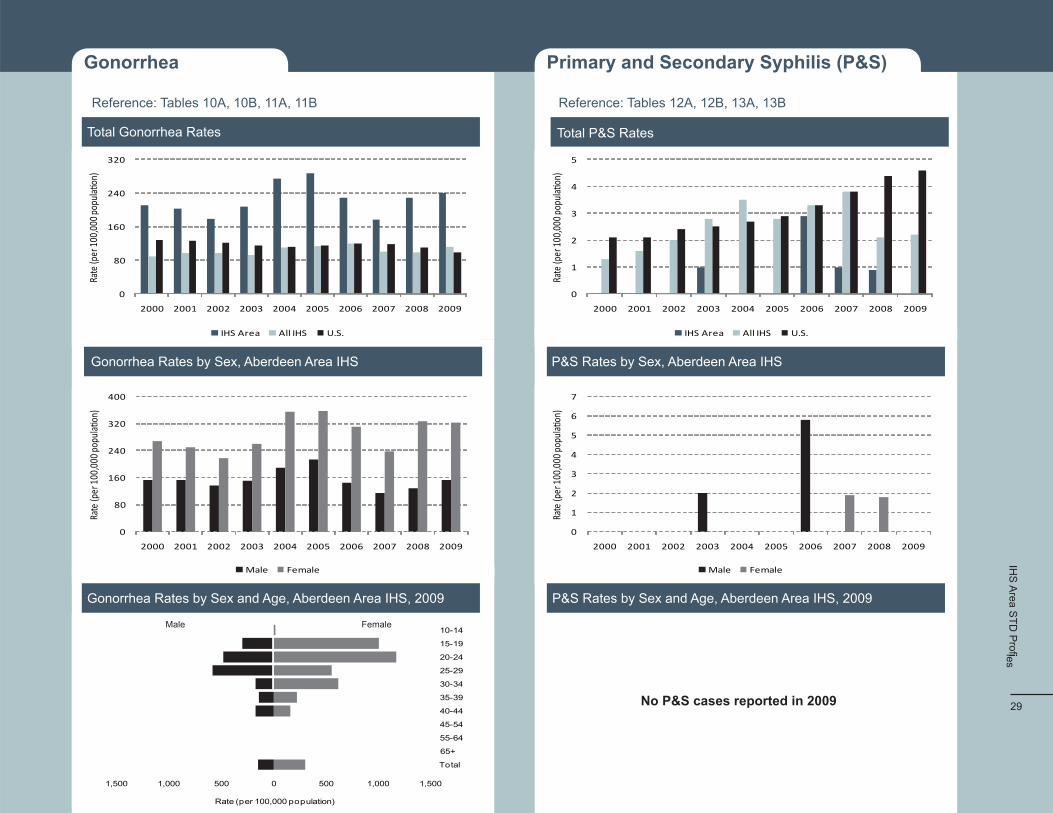
• In 2009, the overall IHS gonorrhea rate was higher than U.S. rates (111.6 and 99.1 cases per 100,000 population, respectively)
• Four IHS Areas (Aberdeen, Alaska, Bemidji, Oklahoma City) had gonorrhea rates higher than the U.S. rate, ranging from 1.3 to 6 times greater
• In 2009, the overall IHS female gonorrhea rate was 2.0 times the male rate; all but 2 IHS Areas (Billings and Navajo) had higher female gonorrhea rates than male rates
• During 2008-2009, overall gonorrhea rates in the U.S. decreased 10.5% (from 110.7 to 99.1 cases per 100,000 population), while overall IHS rates increased by 11.9%; IHS areas with the greatest increases were Alaska Area (88.9%) and Bemidji Area (11.8%); the IHS Areas with the greatest decreases were California (-56.3%) and Portland (-40.9%)
Primary and Secondary Syphilis (P&S)
Reference: Tables 12A, 12B, 13A, 13B
P&S Rates by IHS Area, 2009
0 2 4 6 8 10 12 14
NashvilleCalifornia
BillingsAlaska
AberdeenBemidji
Portlandklahoma City
Total IHSPhoenix
U.S.Navajo
AlbuquerqueTucson
Rate (per 100,000 popula on)
Key Points and Trends
• In 2009, the overall IHS P&S rate was 2.2 cases per 100,000 population, compared to 4.6 cases per 100,000 population for the overall U.S.
• Within IHS, 38 of 41 (93%) P&S cases occurred in 5 IHS Areas in the southwest: Albuquerque (6 cases), Navajo (11 cases), Oklahoma City (6 cases), Phoenix (10 cases), and Tucson (5 cases); 5 IHS Areas had no P&S cases in 2009
• In 2009, the male-to-female P&S rate ratio among AI/AN was 3:1, indicating more cases being diagnosed among men than women. The U.S. male-to-female ratio was 6:1.
• During 2008-2009, overall P&S rates in the U.S. increased from 4.4 to 4.6 cases per 100,000 population; overall IHS rates increased from 2.1 to 2.2 cases per 100,000. The largest increase occurred in the Albuquerque Area (from 0.9 to 6.2 cases per 100,000); the Oklahoma City and Tucson Areas had the largest decreases (-25% and -17% cases per 100,000 population, respectively)
IHS
Area S
TD P
rofi les
27
Aberdeen Area IHS
Aberdeen Area IHS Service County
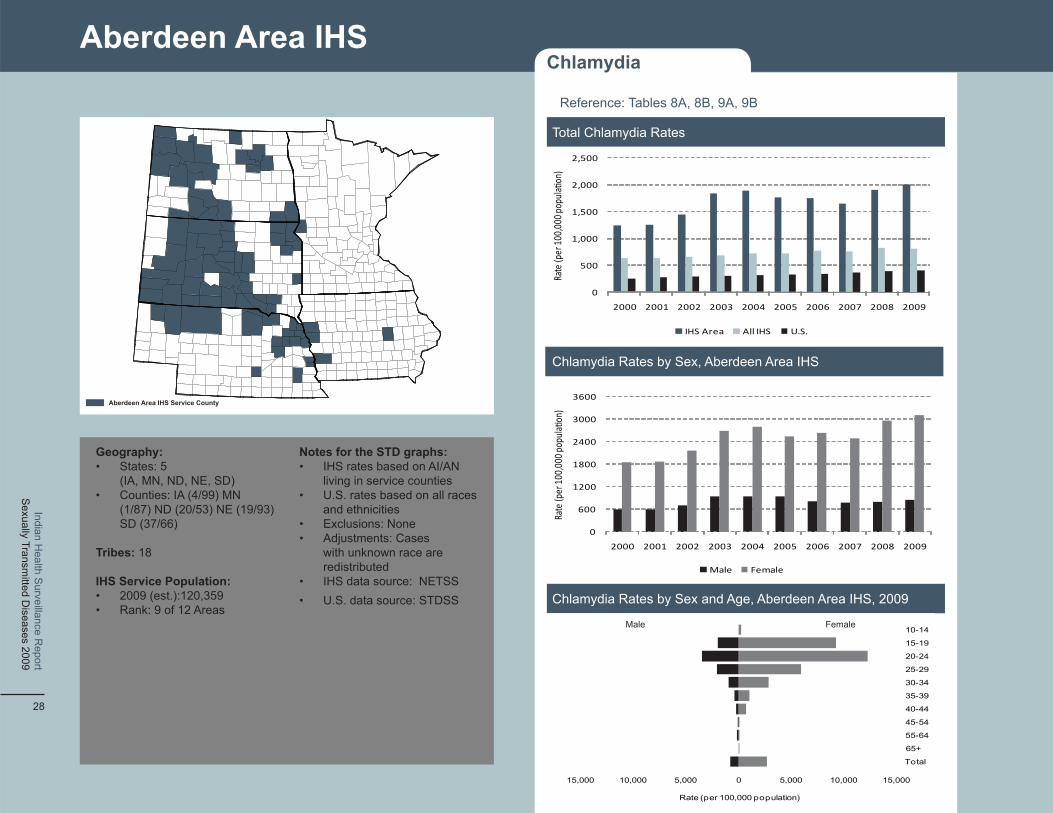
Geography: Notes for the STD graphs: • States: 5 • IHS rates based on AI/AN
(IA, MN, ND, NE, SD) living in service counties• Counties: IA (4/99) MN • U.S. rates based on all races
(1/87) ND (20/53) NE (19/93) and ethnicitiesSD (37/66) • Exclusions: None
• Adjustments: Cases Tribes: 18 with unknown race are
redistributedIHS Service Population: • IHS data source: NETSS• 2009 (est.):120,359 • U.S. data source: STDSS• Rank: 9 of 12 Areas
Sexually Transm
itted Diseases 2009
Indian Health S
urveillance Report
28
Chlamydia
Reference: Tables 8A, 8B, 9A, 9B
Total Chlamydia Rates
Chlamydia Rates by Sex, Aberdeen Area IHS
Chlamydia Rates by Sex and Age, Aberdeen Area IHS, 2009
0
500
1,000
1,500
2,000
2,500
2000 2001 2002 2003 2004 2005 2006 2007 2008 2009
Rate
(per
100,0
00 po
pula
on)
IHS Area All IHS U.S.
15,000 10,000 5,000 0 5,000 10,000 15,000
10-14
15-19
20-24
25-29
30-34
35-39
40-44
45-54
55-64
65+
Total
Rate (per 100,000 population)
0
600
1200
1800
2400
3000
3600
2000 2001 2002 2003 2004 2005 2006 2007 2008 2009Ra
te (p
er 10
0,00
0 pop
ula
on)
Male Female
Male Female
Gonorrhea
0
80
160
240
320
0
80
160
240
320
400
Reference: Tables 10A, 10B, 11A, 11B
Total Gonorrhea Rates
Rate
(per
100,0
00 po
pulaƟ
on)
2000 2001 2002 2003 2004 2005 2006 2007 2008 2009
IHS Area All IHS U.S.
Gonorrhea Rates by Sex, Aberdeen Area IHS
Rate
(per
100,
000 p
opul
aƟon
)
2000 2001 2002 2003 2004 2005 2006 2007 2008 2009
Male Female
Gonorrhea Rates by Sex and Age, Aberdeen Area IHS, 2009
Male Female 10-14
15-19
20-24
25-29
30-34
35-39
40-44
45-54
55-64
65+
Total
1,500 1,000 500 0 500 1,000 1,500
Rate (per 100,000 population)
Primary and Secondary Syphilis (P&S)
Reference: Tables 12A, 12B, 13A, 13B
Total P&S Rates
5
2000 2001 2002 2003 2004 2005 2006 2007 2008 2009
Rate
(per
100,0
00 po
pulaƟ
on)
4
3
2
1
0
IHS Area All IHS U.S.
P&S Rates by Sex, Aberdeen Area IHS
7
Rate
(per
100,
000 p
opul
aƟon
)
6
5
4
3
2
0
2000 2001 2002 2003 2004 2005 2006 2007 2008 2009
Male Female
1
P&S Rates by Sex and Age, Aberdeen Area IHS, 2009
No P&S cases reported in 2009
IHS
Area S
TD P
roles fi
29
Reference: Tables 8A, 8B, 9A, 9B
Total Chlamydia Rates 2,500
Rate
(per
100,0
00 po
pulaƟ
on)
2,000
1,500
1,000
500
0
2000 2001 2002 2003 2004 2005 2006 2007 2008 2009
IHS Area All IHS U.S.
Chlamydia Rates by Sex, Alaska Area IHS, 2009
3600
Rate
(per
100
,000
pop
ulatio
n)
3000
2400
1800
1200
600
0 2000 2001 2002 2003 2004 2005 2006 2007 2008 2009
Male Female
Chlamydia Rates by Sex and Age, Alaska Area IHS, 2009 Male Female
10-14
15-19
20-24
25-29
30-34
35-39
40-44
45-54
55-64
65+
Total
15,000 10,000 5,000 0 5,000 10,000 15,000
Rate (per 100,000 population)
Alaska Area IHS
Alaska Area IHS Service County
Sexually Transm
itted Diseases 2009
Indian Health S
urveillance Report
30
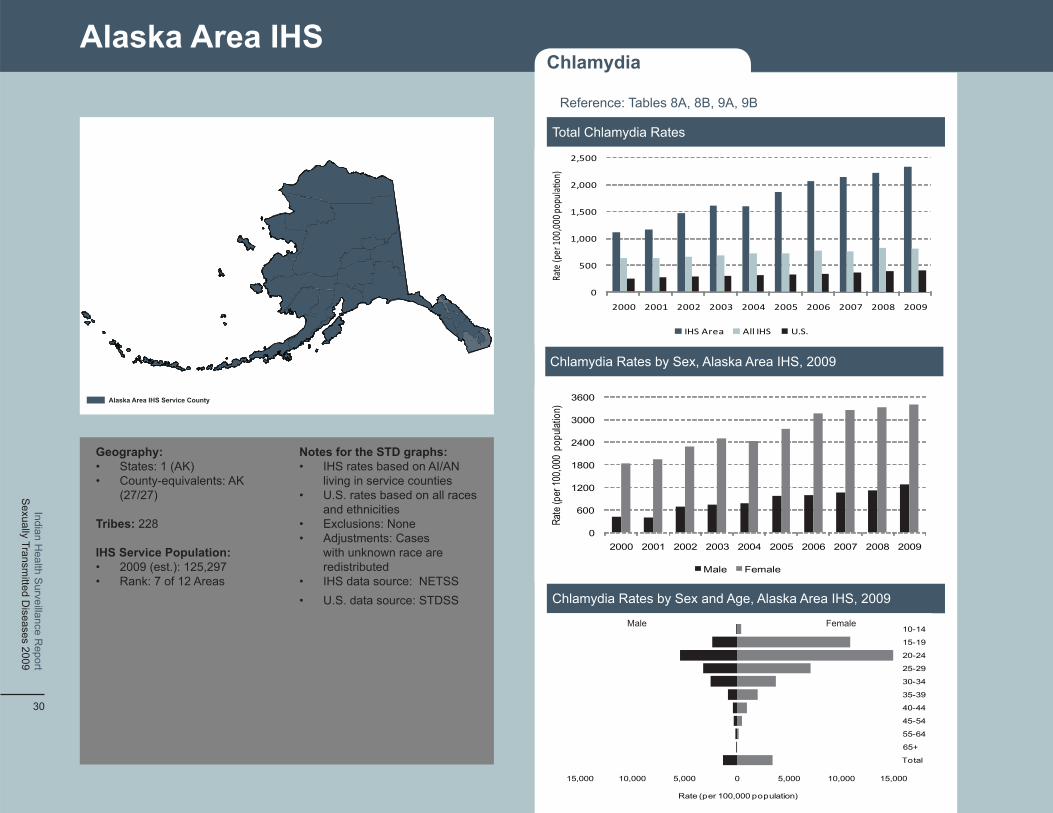
Geography: Notes for the STD graphs: • States: 1 (AK) • IHS rates based on AI/AN • County-equivalents: AK living in service counties
(27/27) • U.S. rates based on all races and ethnicities
Tribes: 228 • Exclusions: None • Adjustments: Cases
IHS Service Population: with unknown race are • 2009 (est.): 125,297 redistributed • Rank: 7 of 12 Areas • IHS data source: NETSS
• U.S. data source: STDSS
Chlamydia

Gonorrhea
0
150
300
450
600
750
Reference: Tables 10A, 10B, 11A, 11B
Total Gonorrhea Rates
Rate
(per
100,0
00 po
pulaƟ
on)
2000 2001 2002 2003 2004 2005 2006 2007 2008 2009
IHS Area All IHS U.S.
Gonorrhea Rates by Sex, Alaska Area IHS
0
150
300
450
600
750
Rate
(per
100
,000
pop
ulatio
n)
2000 2001 2002 2003 2004 2005 2006 2007 2008 2009
Male Female
Gonorrhea Rates by Sex and Age, Alaska Area IHS, 2009
Male 10-14
15-19
20-24
25-29
30-34
35-39
40-44
Female
45-54
55-64
65+
Total
3,000 2,400 1,800 1,200 600 0 600 1,200 1,800 2,400 3,000
Rate (per 100,000 population)
Primary and Secondary Syphilis (P&S)
Reference: Tables 12A, 12B, 13A, 13B
Total P&S Rates
5
Rate
(per
100,0
00 po
pulaƟ
on)
4
3
2
1
2000 2001 2002 2003 2004 2005 2006 2007 2008 2009
0
IHS Area All IHS U.S.
P&S Rates by Sex, Alaska Area IHS
0
1
2
3
4
5
Rate
(per
100
,000
pop
ulatio
n)
2000 2001 2002 2003 2004 2005 2006 2007 2008 2009
Male Female
P&S Rates by Sex and Age, Alaska Area IHS, 2009
No P&S cases reported in 2009
IHS
Area S
TD P
roles fi
31
Albuquerque Area IHS
Albuquerque Area IHS Service County
Partial Albuquerque Area IHS Service County
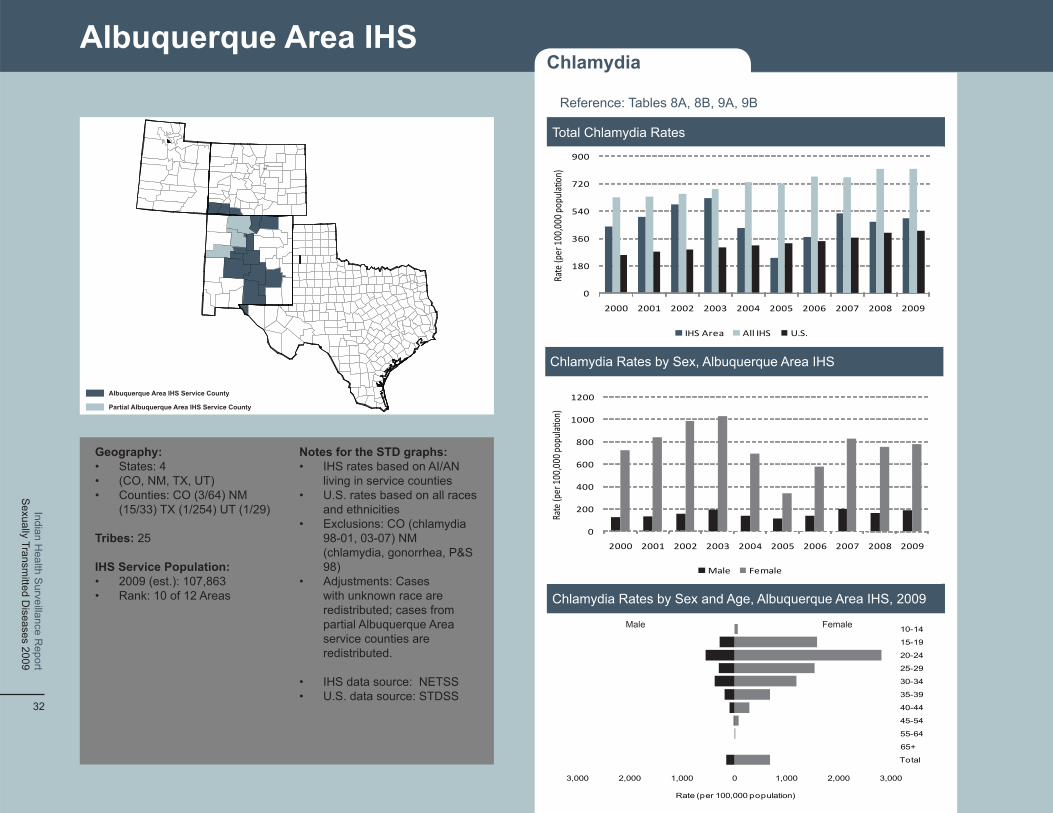
Geography: Notes for the STD graphs: 4• States: • IHS rates based on AI/AN • (CO, NM, TX, UT) living in service counties• Counties: CO (3/64) NM • U.S. rates based on all races
(15/33) TX (1/254) UT (1/29) and ethnicities• Exclusions: CO (chlamydia
Tribes: 25 98-01, 03-07) NM (chlamydia, gonorrhea, P&S
IHS Service Population: 98) • 2009 (est.): 107,863 • Adjustments: Cases • Rank: 10 of 12 Areas with unknown race are
redistributed; cases from partial Albuquerque Area service counties are redistributed.
• IHS data source: NETSS• U.S. data source: STDSS
Sexually Transm
itted Diseases 2009
Indian Health S
urveillance Report
32
Chlamydia
Reference: Tables 8A, 8B, 9A, 9B
0
180
360
540
720
900
2000 2001 2002 2003 2004 2005 2006 2007 2008 2009
Rate
(per
100,0
00 po
pula
on)
IHS Area All IHS U.S.
Total Chlamydia Rates
Chlamydia Rates by Sex, Albuquerque Area IHS
Chlamydia Rates by Sex and Age, Albuquerque Area IHS, 2009
0
200
400
600
800
1000
1200
2000 2001 2002 2003 2004 2005 2006 2007 2008 2009Ra
te (p
er 10
0,000
popu
laon
)Male Female
3,000 2,000 1,000 0 1,000 2,000 3,000
10-14
15-19
20-24
25-29
30-34
35-39
40-44
45-54
55-64
65+
Total
Rate (per 100,000 population)
Male Female
Gonorrhea
0
40
80
120
160
200
75
Reference: Tables 10A, 10B, 11A, 11B
Total Gonorrhea Rates
Rate
(per
100,0
00 po
pulaƟ
on)
2000 2001 2002 2003 2004 2005 2006 2007 2008 2009
IHS Area All IHS U.S.
Gonorrhea Rates by Sex, Albuquerque Area IHS
0
15
30
45
60
Rate
(per
100,0
00 po
pulaƟ
on)
2000 2001 2002 2003 2004 2005 2006 2007 2008 2009
Male Female
Gonorrhea Rates by Sex and Age, Albuquerque Area IHS, 2009
Male Female 10-14
15-19
20-24
25-29
30-34
35-39
40-44
45-54
55-64
65+
Total
400 300 200 100 0 100 200 300 400
Rate (per 100,000 population)
Primary and Secondary Syphilis (P&S)
Reference: Tables 12A, 12B, 13A, 13B
Total P&S Rates
12
Rate
(per
100,0
00 po
pulaƟ
on)
10
8
6
4
2
0
2000 2001 2002 2003 2004 2005 2006 2007 2008 2009
IHS Area All IHS U.S.
P&S Rates by Sex, Albuquerque Area IHS
14
0
2
4
6
8
10
12
Rate
(per
100,0
00 po
pulaƟ
on)
2000 2001 2002 2003 2004 2005 2006 2007 2008 2009
Male Female
P&S Rates by Sex and Age, Albuquerque Area IHS, 2009
Male Female 10-14
15-19
20-24
25-29
30-34
35-39
40-44
45-54
55-64
65+
Total
80 60 40 20 0 20 40 60
Rate (per 100,000 population)
80
IHS
Area S
TD P
roles fi
33
Bemidji Area IHS
Bemidji Area IHS Service County
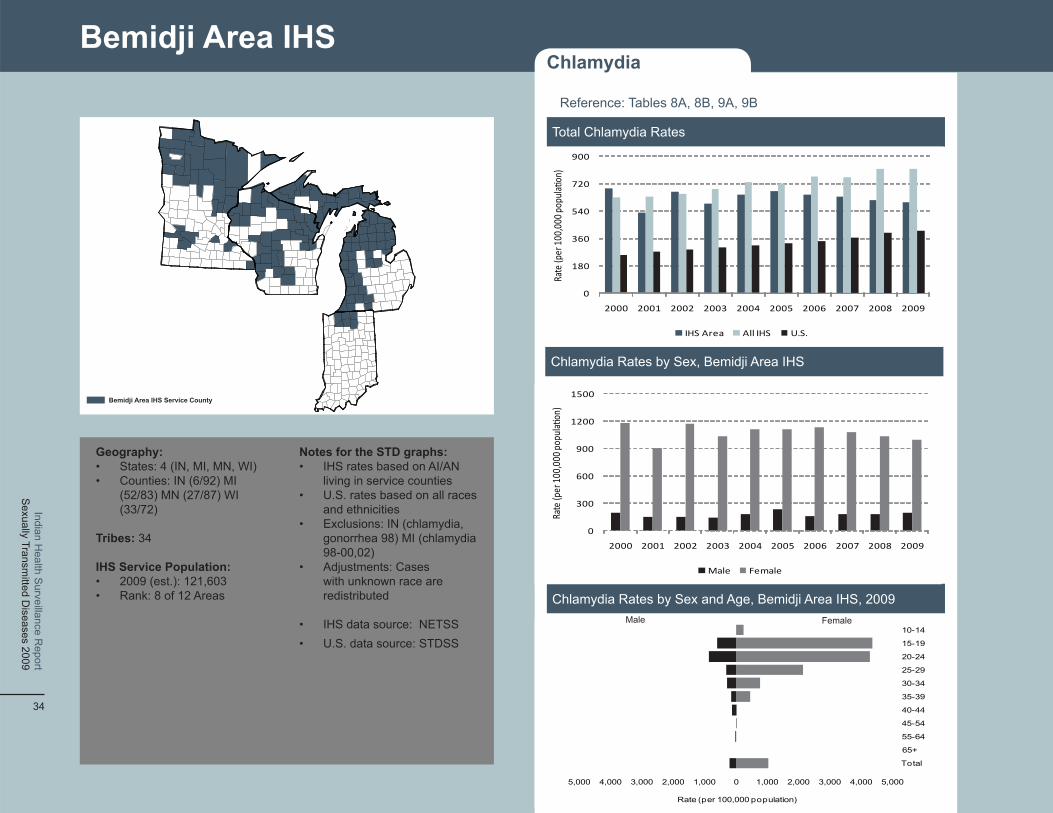
Geography: Notes for the STD graphs:• States: 4 (IN, MI, MN, WI) • IHS rates based on AI/AN • Counties: IN (6/92) MI living in service counties
(52/83) MN (27/87) WI • U.S. rates based on all races (33/72) and ethnicities
• Exclusions: IN (chlamydia, Tribes: 34 gonorrhea 98) MI (chlamydia
98-00,02)IHS Service Population: • Adjustments: Cases • 2009 (est.): 121,603 with unknown race are • Rank: 8 of 12 Areas redistributed
• IHS data source: NETSS• U.S. data source: STDSS
Sexually Transm
itted Diseases 2009
Indian Health S
urveillance Report
34
Chlamydia
Reference: Tables 8A, 8B, 9A, 9B
0
180
360
540
720
900
2000 2001 2002 2003 2004 2005 2006 2007 2008 2009
Rate
(per
100,0
00 po
pula
on)
IHS Area All IHS U.S.
Total Chlamydia Rates
Chlamydia Rates by Sex, Bemidji Area IHS
Chlamydia Rates by Sex and Age, Bemidji Area IHS, 2009
0
300
600
900
1200
1500
2000 2001 2002 2003 2004 2005 2006 2007 2008 2009Ra
te (p
er 10
0,000
popu
laon
)Male Female
5,000 4,000 3,000 2,000 1,000 0 1,000 2,000 3,000 4,000 5,000
10-14
15-19
20-24
25-29
30-34
35-39
40-44
45-54
55-64
65+
Total
Rate (per 100,000 population)
Male Female
Gonorrhea
0
40
80
120
160
200
Reference: Tables 10A, 10B, 11A, 11B
Total Gonorrhea Rates
Rate
(per
100,0
00 po
pulaƟ
on)
2000 2001 2002 2003 2004 2005 2006 2007 2008 2009
IHS Area All IHS U.S.
Gonorrhea Rates by Sex, Bemidji Area IHS
0
80
160
240
320
2000 2001 2002 2003 2004 2005 2006 2007 2008 2009
Rate
(per
100,0
00 po
pulaƟ
on)
Male Female
Gonorrhea Rates by Sex and Age, Bemidji Area IHS, 2009 Male Female
10-14
15-19
20-24
25-29
30-34
35-39
40-44
45-54
55-64
65+
Total
1,200 900 600 300 0 300 600 900 1,200
Rate (per 100,000 population)
Primary and Secondary Syphilis (P&S)
Reference: Tables 12A, 12B, 13A, 13B
Total P&S Rates
5
Rate
(per
100,0
00 po
pulaƟ
on)
4
3
2
1
0
2000 2001 2002 2003 2004 2005 2006 2007 2008 2009
IHS Area All IHS U.S.
P&S Rates by Sex, Bemidji Area IHS
5
4
3
2
1
0
2000 2001 2002 2003 2004 2005 2006 2007 2008 2009
Male Female Ra
te (p
er 10
0,000
popu
laƟon
)
P&S Rates by Sex and Age, Bemidji Area IHS, 2009 Male Female
10-14
15-19
20-24
25-29
30-34
35-39
40-44
45-54
55-64
65+
Total
20 15 10 5 0 5 10 15 20
Rate (per 100,000 population)
IHS
Area S
TD P
roles fi
35
Billings Area IHS Service County
Reference: Tables 8A, 8B, 9A, 9B
Total Chlamydia Rates
2,500
2,000
1,500
1,000
500
0
IHS Area All IHS U.S.
Chlamydia Rates by Sex, Billings Area IHS
Rate
(per
100,0
00 po
pulaƟ
on)
Rate
(per
100,0
00 po
pulaƟ
on)
2000 2001 2002 2003 2004 2005 2006 2007 2008 2009
3000
2400
1800
1200
600
0
2000 2001 2002 2003 2004 2005 2006 2007 2008 2009
Male Female
Chlamydia Rates by Sex and Age, Billings Area IHS, 2009 Male
15-19
Female 10-14
20-24
25-29
30-34
35-39
40-44
45-54
55-64
65+
Total
12,000 8,000 4,000 0 4,000 8,000 12,000
Rate (per 100,000 population)
ChlamydiaBillings Area IHS
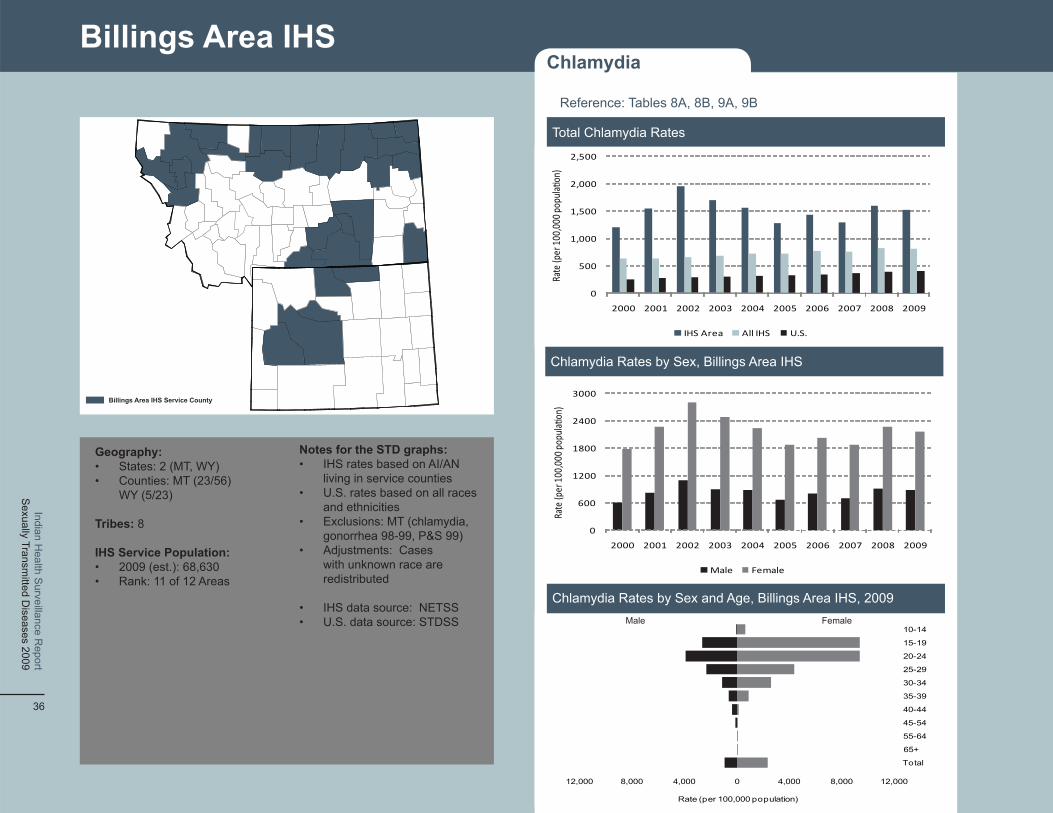
Geography: Notes for the STD graphs:
• States: 2 (MT, WY) • IHS rates based on AI/AN • Counties: MT (23/56) living in service counties
WY (5/23) • U.S. rates based on all races and ethnicities
Tribes: 8 • Exclusions: MT (chlamydia, gonorrhea 98-99, P&S 99)
IHS Service Population: • Adjustments: Cases • 2009 (est.): 68,630 with unknown race are • Rank: 11 of 12 Areas redistributed
• IHS data source: NETSS • U.S. data source: STDSS
Sexually Transm
itted Diseases 2009
Indian Health S
urveillance Report
36
Gonorrhea
Reference: Tables 10A, 10B, 11A, 11B
0
40
80
120
160
200
Total Gonorrhea Rates
Rate
(per
100,0
00 po
pulaƟ
on)
2000 2001 2002 2003 2004 2005 2006 2007 2008 2009
IHS Area All IHS U.S.
Gonorrhea Rates by Sex, Billings Area IHS
160
120
80
40
0
Male Female
Rate
(per
100,0
00 po
pulaƟ
on)
2000 2001 2002 2003 2004 2005 2006 2007 2008 2009
Gonorrhea Rates by Sex and Age, Billings Area IHS, 2009 Male Female
10-14
15-19
20-24
25-29
30-34
35-39
40-44
45-54
55-64
65+
Total
200 150 100 50 0 50 100 150 200
Rate (per 100,000 population)
Primary and Secondary Syphilis (P&S)
Reference: Tables 12A, 12B, 13A, 13B
Total P&S Rates
5
Rate
(per
100,0
00 po
pulaƟ
on)
4
3
2
1
0
2000 2001 2002 2003 2004 2005 2006 2007 2008 2009
IHS Area All IHS U.S.
P&S Rates by Sex, Billings Area IHS
No P&S cases reported in 2009
P&S Rates by Sex and Age, Billings Area IHS, 2009
No P&S cases reported in 2009
IHS
Area S
TD P
roles fi
37
California Area IHS Service County
Partial California Area IHS Service County
California Area IHS
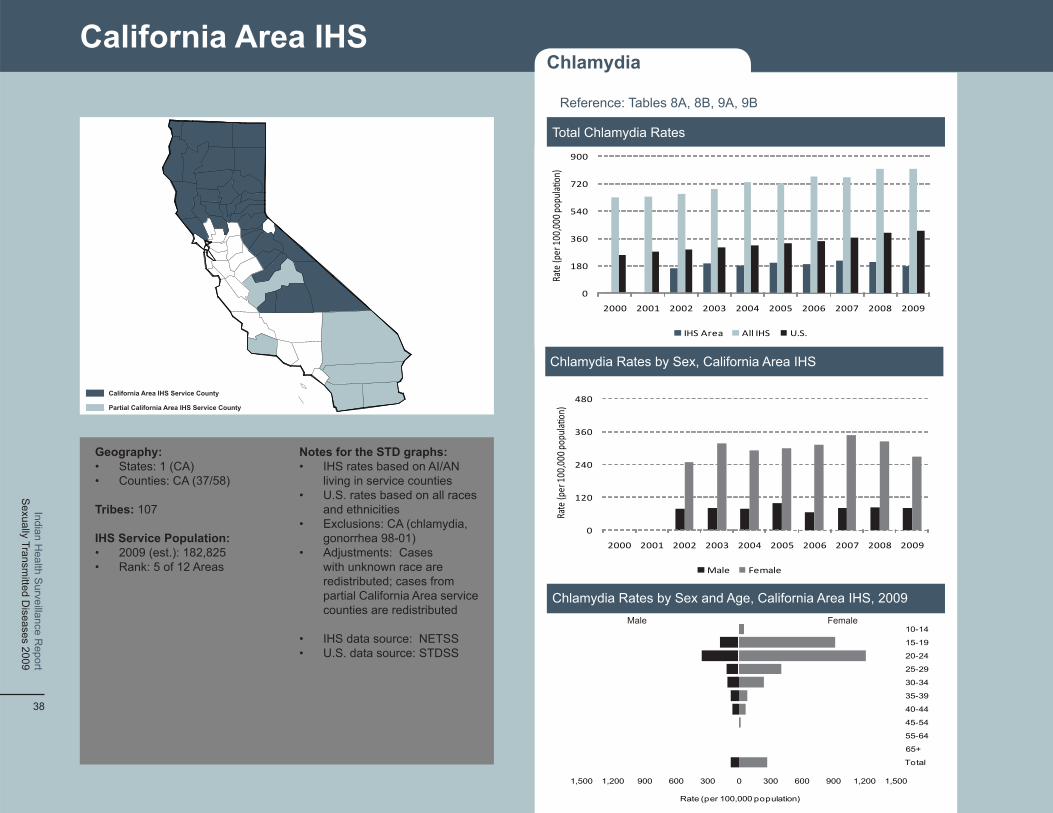
Geography: Notes for the STD graphs: • States: 1 (CA) • IHS rates based on AI/AN • Counties: CA (37/58) living in service counties
• U.S. rates based on all races Tribes: 107 and ethnicities
• Exclusions: CA (chlamydia, IHS Service Population: gonorrhea 98-01) • 2009 (est.): 182,825 • Adjustments: Cases • Rank: 5 of 12 Areas with unknown race are
redistributed; cases from partial California Area service counties are redistributed
• IHS data source: NETSS • U.S. data source: STDSS
Sexually Transm
itted Diseases 2009
Indian Health S
urveillance Report
38
Chlamydia
Reference: Tables 8A, 8B, 9A, 9B
Total Chlamydia Rates
Chlamydia Rates by Sex, California Area IHS
Rate
(per
100,0
00 po
pulaƟ
on)
Rate
(per
100,0
00 po
pulaƟ
on)
900
720
540
360
180
0
480
360
240
120
0
2000 2001 2002 2003 2004 2005 2006 2007 2008 2009
IHS Area All IHS U.S.
2000 2001 2002 2003 2004 2005 2006 2007 2008 2009
Male Female
Chlamydia Rates by Sex and Age, California Area IHS, 2009 Male Female
10-14
15-19
20-24
25-29
30-34
35-39
40-44
45-54
55-64
65+
Total
1,500 1,200 900 600 300 0 300 600 900 1,200 1,500
Rate (per 100,000 population)

Gonorrhea
Reference: Tables 10A, 10B, 11A, 11B
0
40
80
120
160
200
80
Total Gonorrhea Rates
Rate
(per
100,0
00 po
pulaƟ
on)
2000 2001 2002 2003 2004 2005 2006 2007 2008 2009
IHS Area All IHS U.S.
Gonorrhea Rates by Sex, California Area IHS
0
20
40
60
Rate
(per
100,0
00 po
pulaƟ
on)
2000 2001 2002 2003 2004 2005 2006 2007 2008 2009
Male Female
Gonorrhea Rates by Sex and Age, California Area IHS, 2009 Male Female
10-14
15-19
20-24
25-29
30-34
35-39
40-44
45-54
55-64
65+
Total
100 80 60 40 20 0 20 40 60 80 100
Rate (per 100,000 population)
Primary and Secondary Syphilis (P&S)
Reference: Tables 12A, 12B, 13A, 13B
Total P&S Rates
5
Rate
(per
100,0
00 po
pulaƟ
on)
4
3
2
1
0
2000 2001 2002 2003 2004 2005 2006 2007 2008 2009
IHS Area All IHS U.S.
P&S Rates by Sex, California Area IHS
4
0
1
2
3
Rate
(per
100,0
00 po
pulaƟ
on)
2000 2001 2002 2003 2004 2005 2006 2007 2008 2009
Male Female
P&S Rates by Sex and Age, California Area IHS, 2009
No P&S cases reported in 2009
IHS
Area S
TD P
roles fi
39
Nashville Area IHS
Nashville Area IHS Service County
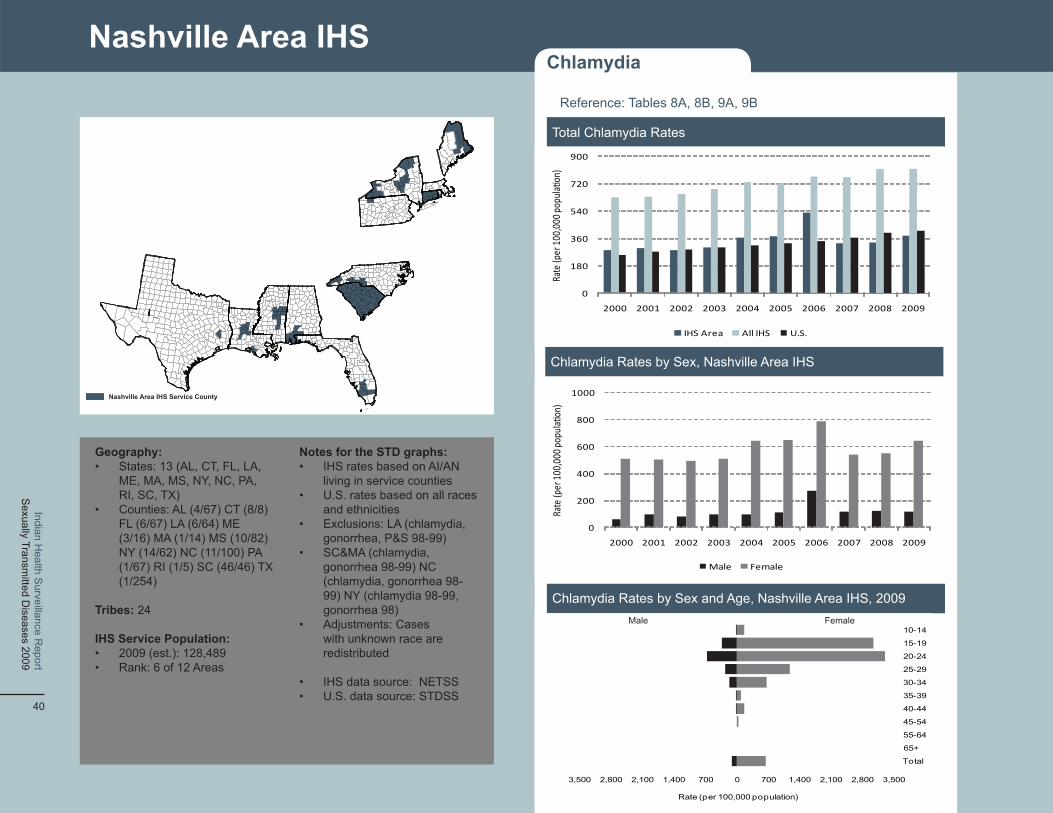
Geography: Notes for the STD graphs: • States: 13 (AL, CT, FL, LA, • IHS rates based on AI/AN
ME, MA, MS, NY, NC, PA, living in service counties RI, SC, TX) • U.S. rates based on all races
• Counties: AL (4/67) CT (8/8) and ethnicities FL (6/67) LA (6/64) ME • Exclusions: LA (chlamydia, (3/16) MA (1/14) MS (10/82) gonorrhea, P&S 98-99) NY (14/62) NC (11/100) PA • SC&MA (chlamydia, (1/67) RI (1/5) SC (46/46) TX gonorrhea 98-99) NC (1/254) (chlamydia, gonorrhea 98-
99) NY (chlamydia 98-99, Tribes: 24 gonorrhea 98)
• Adjustments: Cases IHS Service Population: with unknown race are • 2009 (est.): 128,489 redistributed • Rank: 6 of 12 Areas
• IHS data source: NETSS • U.S. data source: STDSS
Sexually Transm
itted Diseases 2009
Indian Health S
urveillance Report
40
Chlamydia
Reference: Tables 8A, 8B, 9A, 9B
Total Chlamydia Rates 900
Rate
(per
100,0
00 po
pulaƟ
on)
720
540
360
180
0
2000 2001 2002 2003 2004 2005 2006 2007 2008 2009
IHS Area All IHS U.S.
Chlamydia Rates by Sex, Nashville Area IHS
1000
Rate
(per
100,0
00 po
pulaƟ
on)
800
600
400
200
0
2000 2001 2002 2003 2004 2005 2006 2007 2008 2009
Male Female
Chlamydia Rates by Sex and Age, Nashville Area IHS, 2009 Male Female
10-14
15-19
20-24
25-29
30-34
35-39
40-44
45-54
55-64
65+
Total
3,500 2,800 2,100 1,400 700 0 700 1,400 2,100 2,800 3,500
Rate (per 100,000 population)
Total P&S Rates
5
Rate
(per
100,0
00 po
pulaƟ
on)
4
3
2
1
0
2000 2001 2002 2003 2004 2005 2006 2007 2008 2009
IHS Area All IHS U.S.
P&S Rates by Sex, Nashville Area IHS
0
1
2
3
4
5
Rate
(per
100,0
00 po
pulaƟ
on)
2000 2001 2002 2003 2004 2005 2006 2007 2008 2009
Male Female
P&S Rates by Sex and Age, Nashville Area IHS, 2009
No P&S cases reported in 2009
0
40
80
120
160
200
Total Gonorrhea Rates
Rate
(per
100,0
00 po
pulaƟ
on)
2000 2001 2002 2003 2004 2005 2006 2007 2008 2009
IHS Area All IHS U.S.
Gonorrhea Rates by Sex, Nashville Area IHS
0
40
80
120
160
200
240
Rate
(per
100,0
00 po
pulaƟ
on)
2000 2001 2002 2003 2004 2005 2006 2007 2008 2009
Male Female
Gonorrhea Rates by Sex and Age, Nashville Area IHS, 2009
10-14
15-19
20-24
25-29
30-34
35-39
Male Female
40-44
45-54
55-64
65+
Total
500 400 300 200 100 0 100 200 300 400 500
Rate (per 100,000 population)
Primary and Secondary Syphilis (P&S)Gonorrhea
Reference: Tables 10A, 10B, 11A, 11B Reference: Tables 12A, 12B, 13A, 13B
IHS
Area S
TD P
roles fi
41

Navajo Area IHS Service County Partial Navajo Area IHS Service County
Navajo Area IHS
Geography: Notes for the STD graphs: • States: 3 (AZ, NM, UT) • IHS rates based on AI/AN • Counties: AZ (3/15) NM living in service counties
(5/33) UT (2/29) • U.S. rates based on all races and ethnicities
Tribes: 2 • Exclusions: NM (chlamydia, gonorrhea, P&S 98)
IHS Service Population: • Adjustments: Cases • 2009 (est.): 245,831 with unknown race are • Rank: 2 of 12 Areas redistributed; cases from
partial Navajo Area service counties are redistributed
• IHS data source: NETSS • U.S. data source: STDSS
Sexually Transm
itted Diseases 2009
Indian Health S
urveillance Report
42
Chlamydia
Reference: Tables 8A, 8B, 9A, 9B
Total Chlamydia Rates
1,000
800
600
400
200
0
1600
1400
1200
1000
800
600
400
200
0
5,000
Chlamydia Rates by Sex, Navajo Area IHS
Rate
(per
100,0
00 po
pulaƟ
on)
Rate
(per
100,0
00 po
pulaƟ
on)
2000 2001 2002 2003 2004 2005 2006 2007 2008 2009
IHS Area All IHS U.S.
2000 2001 2002 2003 2004 2005 2006 2007 2008 2009
Male Female
Chlamydia Rates by Sex and Age, Navajo Area IHS, 2009 Male
15-19
Female 10-14
20-24
25-29
30-34
35-39
40-44
45-54
55-64
65+
Total
4,000 3,000 2,000 1,000 0 1,000 2,000 3,000 4,000 5,000
Rate (per 100,000 population)

Gonorrhea
Reference: Tables 10A, 10B, 11A, 11B
0
40
80
120
160
200
0
40
80
120
Total Gonorrhea Rates
Rate
(per
100,0
00 po
pulaƟ
on)
2000 2001 2002 2003 2004 2005 2006 2007 2008 2009
IHS Area All IHS U.S.
Gonorrhea Rates by Sex, Navajo Area IHS
Rate
(per
100,0
00 po
pulaƟ
on)
2000 2001 2002 2003 2004 2005 2006 2007 2008 2009
Male Female
Gonorrhea Rates by Sex and Age, Navajo Area IHS, 2009
10-14
15-19
20-24
25-29
30-34
35-39
Male Female
40-44
45-54
55-64
65+
Total
250 200 150 100 50 0 50 100 150 200 250
Rate (per 100,000 population)
Primary and Secondary Syphilis (P&S)
Reference: Tables 12A, 12B, 13A, 13B
Total P&S Rates
18
Rate
(per
100,0
00 po
pulaƟ
on)
15
12
9
6
3
2000 2001 2002 2003 2004 2005 2006 2007 2008 2009
0
IHS Area All IHS U.S.
P&S Rates by Sex, Navajo Area IHS
18
Rate
(per
100,0
00 po
pulaƟ
on)
15
12
9
6
3
0
2000 2001 2002 2003 2004 2005 2006 2007 2008 2009
Male Female
P&S Rates by Sex and Age, Navajo Area IHS, 2009 Male Female
10-14
15-19
20-24
25-29
30-34
35-39
40-44
45-54
55-64
65+
Total
60 40 20 0 20 40
Rate (per 100,000 population)
60
IHS
Area S
TD P
roles fi
43
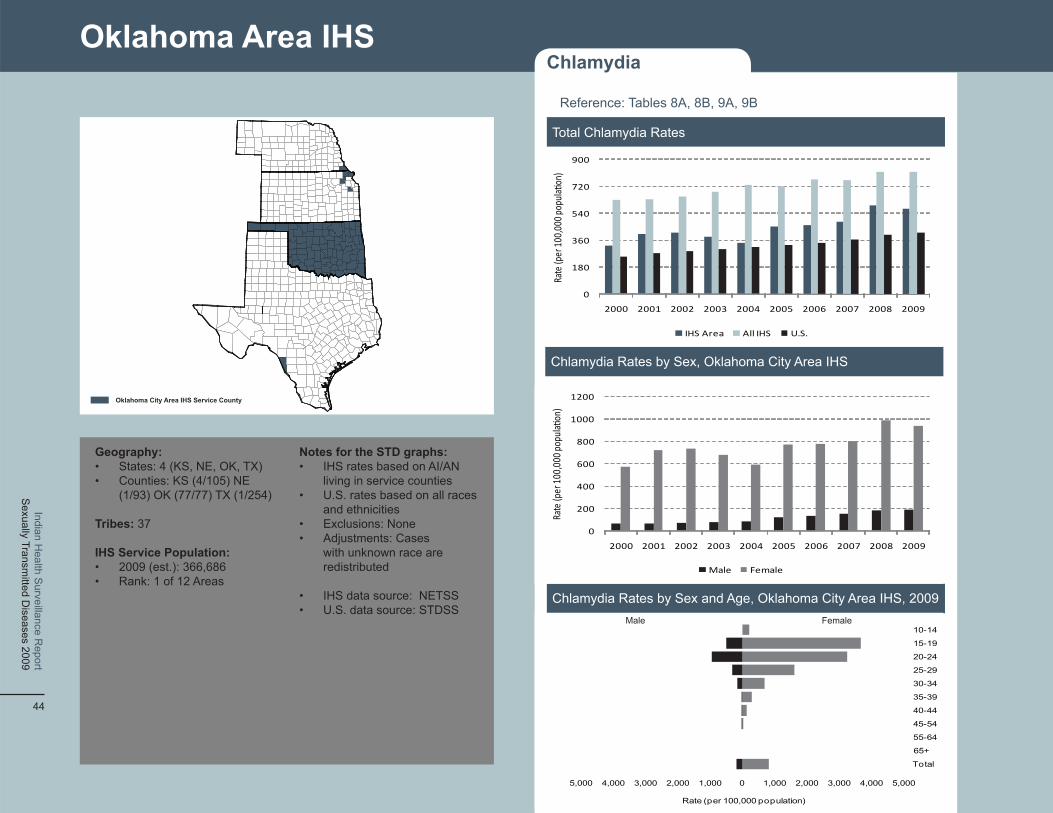
Oklahoma Area IHS
Oklahoma City Area IHS Service County
Geography: Notes for the STD graphs: • States: 4 (KS, NE, OK, TX) • IHS rates based on AI/AN • Counties: KS (4/105) NE living in service counties
(1/93) OK (77/77) TX (1/254) • U.S. rates based on all races and ethnicities
Tribes: 37 • Exclusions: None • Adjustments: Cases
IHS Service Population: with unknown race are • 2009 (est.): 366,686 redistributed • Rank: 1 of 12 Areas
• IHS data source: NETSS • U.S. data source: STDSS
Sexually Transm
itted Diseases 2009
Indian Health S
urveillance Report
44
Chlamydia
Reference: Tables 8A, 8B, 9A, 9B
Total Chlamydia Rates 900
Rate
(per
100,0
00 po
pulaƟ
on)
720
540
360
180
0
2000 2001 2002 2003 2004 2005 2006 2007 2008 2009
IHS Area All IHS U.S.
Chlamydia Rates by Sex, Oklahoma City Area IHS
1200
Rate
(per
100,0
00 po
pulaƟ
on)
1000
800
600
400
200
0
2000 2001 2002 2003 2004 2005 2006 2007 2008 2009
Male Female
Chlamydia Rates by Sex and Age, Oklahoma City Area IHS, 2009 Male Female
10-14
15-19
20-24
25-29
30-34
35-39
40-44
45-54
55-64
65+
Total
5,000 4,000 3,000 2,000 1,000 0 1,000 2,000 3,000 4,000 5,000
Rate (per 100,000 population)
Gonorrhea
Reference: Tables 10A, 10B, 11A, 11B
0
40
80
120
160
200
120
160
200
Total Gonorrhea Rates
Rate
(per
100,0
00 po
pulaƟ
on)
2000 2001 2002 2003 2004 2005 2006 2007 2008 2009
IHS Area All IHS U.S.
Gonorrhea Rates by Sex, Oklahoma City Area IHS
Rate
(per
100,0
00 po
pulaƟ
on)
80
40
0
2000 2001 2002 2003 2004 2005 2006 2007 2008 2009
Male Female
Gonorrhea Rates by Sex and Age, Oklahoma City Area IHS, 2009 Male Female
10-14
15-19
20-24
25-29
30-34
35-39
40-44
45-54
55-64
65+
Total
800 600 400 200 0 200 400 600 800
Rate (per 100,000 population)
Primary and Secondary Syphilis (P&S)
Reference: Tables 12A, 12B, 13A, 13B
Total P&S Rates
5
2000 2001 2002 2003 2004 2005 2006 2007 2008 2009
Rate
per (
100,0
00 po
pulaƟ
on)
4
3
2
1
0
IHS Area All IHS U.S.
P&S Rates by Sex, Oklahoma City Area IHS
4
Rate
(per
100,0
00 po
pulaƟ
on)
3
2
1
0
2000 2001 2002 2003 2004 2005 2006 2007 2008 2009
Male Female
P&S Rates by Sex and Age, Oklahoma City Area IHS, 2009 Male Female
10-14
15-19
20-24
25-29
30-34
35-39
40-44
45-54
55-64
65+
Total
30 20 10 0 10 20
Rate (per 100,000 population)
30
IHS
Area S
TD P
roles fi
45
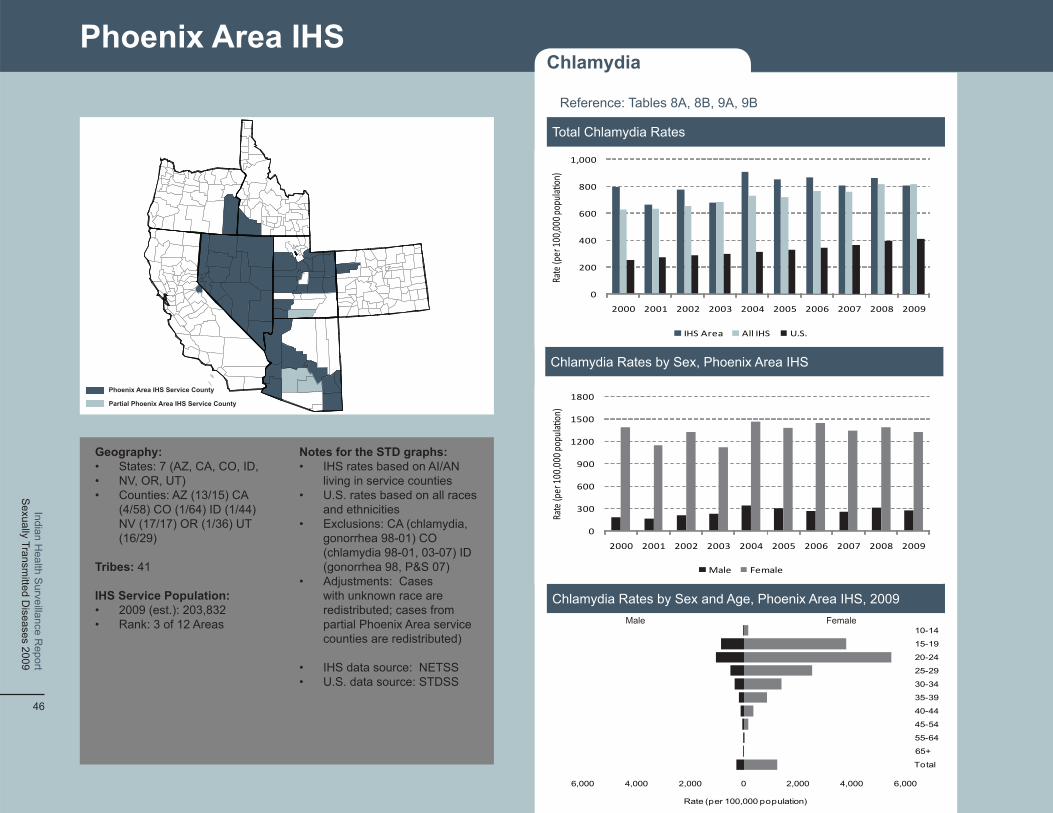
Phoenix Area IHS
Phoenix Area IHS Service County
Partial Phoenix Area IHS Service County
Geography: Notes for the STD graphs: • States: 7 (AZ, CA, CO, ID, • IHS rates based on AI/AN • NV, OR, UT) living in service counties• Counties: AZ (13/15) CA • U.S. rates based on all races
(4/58) CO (1/64) ID (1/44) and ethnicitiesNV (17/17) OR (1/36) UT • Exclusions: CA (chlamydia, (16/29) gonorrhea 98-01) CO
(chlamydia 98-01, 03-07) ID Tribes: 41 (gonorrhea 98, P&S 07)
• Adjustments: Cases IHS Service Population: with unknown race are • 2009 (est.): 203,832 redistributed; cases from • Rank: 3 of 12 Areas partial Phoenix Area service
counties are redistributed)
• IHS data source: NETSS• U.S. data source: STDSS
Sexually Transm
itted Diseases 2009
Indian Health S
urveillance Report
46
Chlamydia
Reference: Tables 8A, 8B, 9A, 9B
0
200
400
600
800
1,000
2000 2001 2002 2003 2004 2005 2006 2007 2008 2009
Rate
(per
100,0
00 po
pula
on)
IHS Area All IHS U.S.
0
300
600
900
1200
1500
1800
2000 2001 2002 2003 2004 2005 2006 2007 2008 2009Ra
te (p
er 10
0,000
popu
laon
)Male Female
6,000 4,000 2,000 0 2,000 4,000 6,000
10-14
15-19
20-24
25-29
30-34
35-39
40-44
45-54
55-64
65+
Total
Rate (per 100,000 population)
Chlamydia Rates by Sex and Age, Phoenix Area IHS, 2009
Chlamydia Rates by Sex, Phoenix Area IHS
Total Chlamydia Rates
FemaleMale
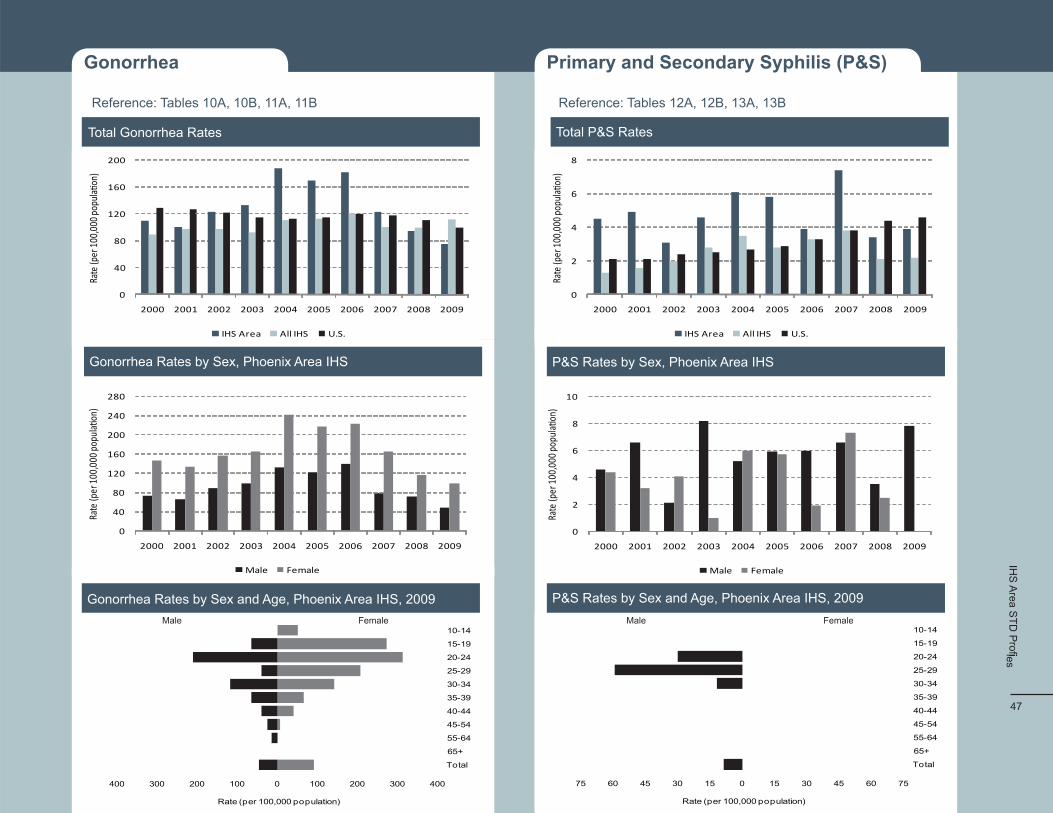
Gonorrhea
Reference: Tables 10A, 10B, 11A, 11B
40
80
120
160
200
240
280
Total Gonorrhea Rates
Rate
(per
100,0
00 po
pulaƟ
on)
0
2000 2001 2002 2003 2004 2005 2006 2007 2008 2009
IHS Area All IHS U.S.
Gonorrhea Rates by Sex, Phoenix Area IHS
Rate
(per
100,0
00 po
pulaƟ
on)
200
160
120
80
40
0
2000 2001 2002 2003 2004 2005 2006 2007 2008 2009
Male Female
Gonorrhea Rates by Sex and Age, Phoenix Area IHS, 2009 Male Female
10-14
15-19
20-24
25-29
30-34
35-39
40-44
45-54
55-64
65+
Total
400 300 200 100 0 100 200 300 400
Rate (per 100,000 population)
Primary and Secondary Syphilis (P&S)
Reference: Tables 12A, 12B, 13A, 13B
Total P&S Rates
8
Rate
(per
100,0
00 po
pulaƟ
on)
6
4
2
0
2000 2001 2002 2003 2004 2005 2006 2007 2008 2009
IHS Area All IHS U.S.
P&S Rates by Sex, Phoenix Area IHS
10
2000 2001 2002 2003 2004 2005 2006 2007 2008 2009 Ra
te (p
er 10
0,000
popu
laƟon
)
8
6
4
2
0
Male Female
P&S Rates by Sex and Age, Phoenix Area IHS, 2009 Male Female
10-14
15-19
20-24
25-29
30-34
35-39
40-44
45-54
55-64
65+
Total
75 60 45 30 15 0 15 30 45 60
Rate (per 100,000 population)
75
IHS
Area S
TD P
roles fi
47
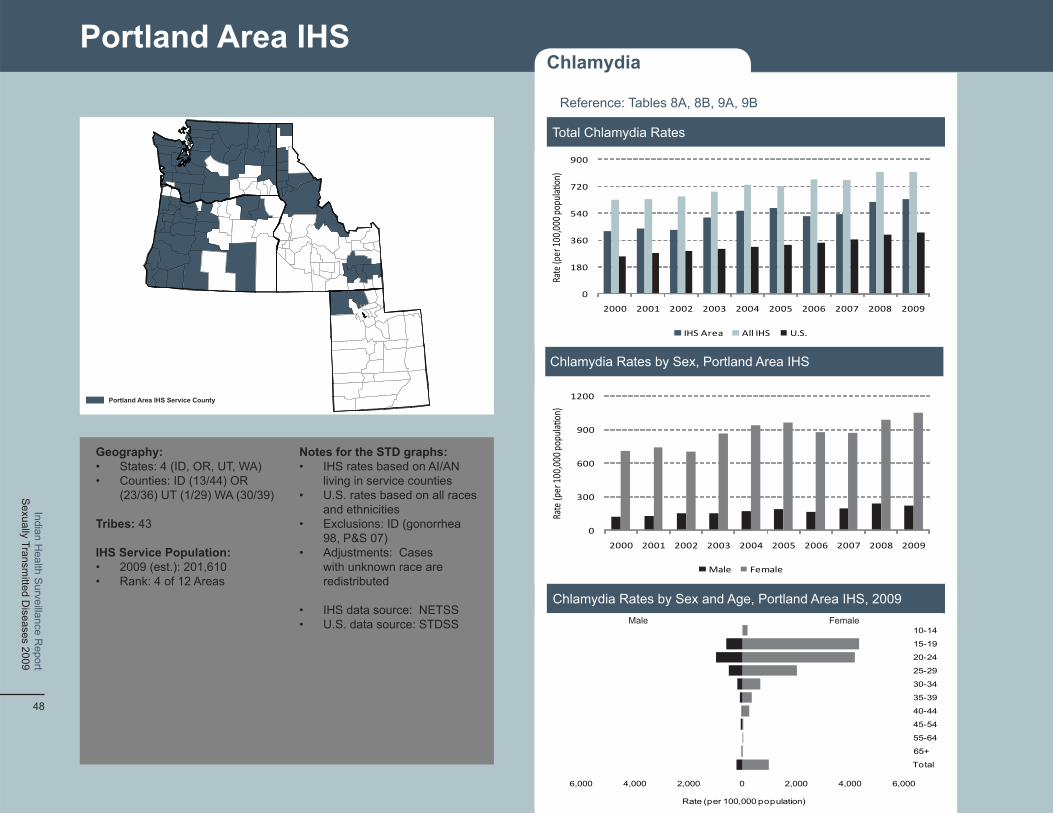
Portland Area IHS
Portland Area IHS Service County
Geography: Notes for the STD graphs: • States: 4 (ID, OR, UT, WA) • IHS rates based on AI/AN • Counties: ID (13/44) OR living in service counties
(23/36) UT (1/29) WA (30/39) • U.S. rates based on all races and ethnicities
Tribes: 43 • Exclusions: ID (gonorrhea 98, P&S 07)
IHS Service Population: • Adjustments: Cases • 2009 (est.): 201,610 with unknown race are • Rank: 4 of 12 Areas redistributed
• IHS data source: NETSS• U.S. data source: STDSS
Sexually Transm
itted Diseases 2009
Indian Health S
urveillance Report
48
Chlamydia
Reference: Tables 8A, 8B, 9A, 9B
0
180
360
540
720
900
2000 2001 2002 2003 2004 2005 2006 2007 2008 2009
Rate
(per
100,0
00 po
pula
on)
IHS Area All IHS U.S.
0
300
600
900
1200
2000 2001 2002 2003 2004 2005 2006 2007 2008 2009Ra
te (p
er 10
0,000
popu
laon
)Male Female
6,000 4,000 2,000 0 2,000 4,000 6,000
10-14
15-19
20-24
25-29
30-34
35-39
40-44
45-54
55-64
65+
Total
Rate (per 100,000 population)
Chlamydia Rates by Sex and Age, Portland Area IHS, 2009
Chlamydia Rates by Sex, Portland Area IHS
Total Chlamydia Rates
Male Female
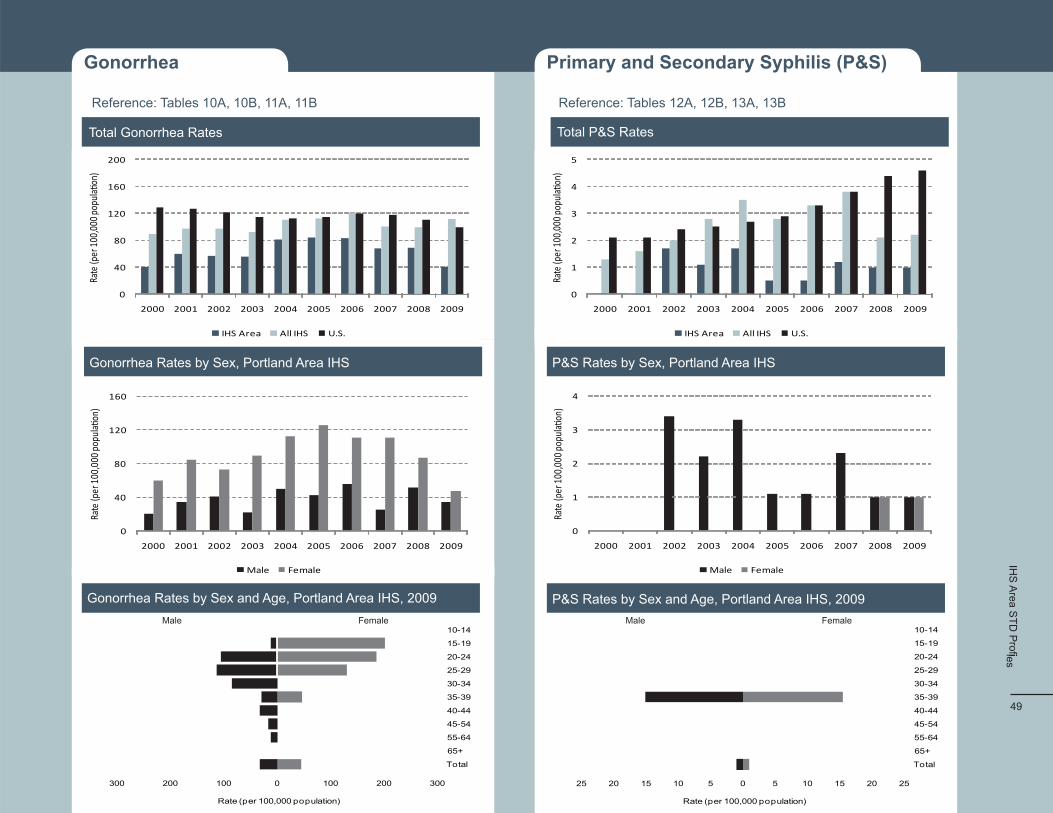
Gonorrhea
Reference: Tables 10A, 10B, 11A, 11B
0
40
80
120
160
200
0
40
80
120
160
Total Gonorrhea Rates
Rate
(per
100,0
00 po
pulaƟ
on)
2000 2001 2002 2003 2004 2005 2006 2007 2008 2009
IHS Area All IHS U.S.
Gonorrhea Rates by Sex, Portland Area IHS
Rate
(per
100,0
00 po
pulaƟ
on)
2000 2001 2002 2003 2004 2005 2006 2007 2008 2009
Male Female
Gonorrhea Rates by Sex and Age, Portland Area IHS, 2009 Male Female
10-14
15-19
20-24
25-29
30-34
35-39
40-44
45-54
55-64
65+
Total
300 200 100 0 100 200 300
Rate (per 100,000 population)
Primary and Secondary Syphilis (P&S)
Reference: Tables 12A, 12B, 13A, 13B
Total P&S Rates
5
Rate
(per
100,0
00 po
pulaƟ
on)
4
3
2
1
0
2000 2001 2002 2003 2004 2005 2006 2007 2008 2009
IHS Area All IHS U.S.
P&S Rates by Sex, Portland Area IHS
4
Rate
(per
100,0
00 po
pulaƟ
on)
3
2
0
2000 2001 2002 2003 2004 2005 2006 2007 2008 2009
Male Female
1
P&S Rates by Sex and Age, Portland Area IHS, 2009 Male Female
10-14
15-19
20-24
25-29
30-34
35-39
40-44
45-54
55-64
65+
Total
25 20 15 10 5 0 5 10 15 20
Rate (per 100,000 population)
25
IHS
Area S
TD P
roles fi
49
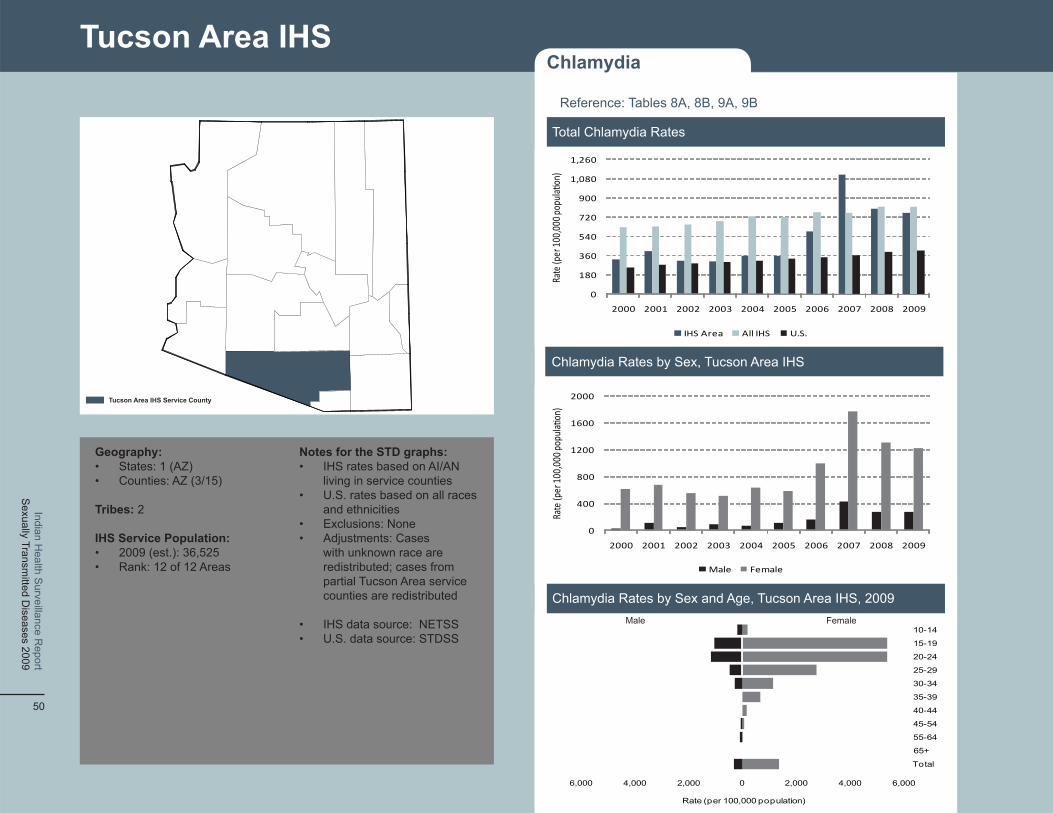
Tucson Area IHS Service County
Tucson Area IHS
Geography: Notes for the STD graphs: • States: 1 (AZ) • IHS rates based on AI/AN • Counties: AZ (3/15) living in service counties
• U.S. rates based on all races Tribes: 2 and ethnicities
• Exclusions: None IHS Service Population: • Adjustments: Cases • 2009 (est.): 36,525 with unknown race are • Rank: 12 of 12 Areas redistributed; cases from partial Tucson Area service
counties are redistributed
• IHS data source: NETSS • U.S. data source: STDSS
Sexually Transm
itted Diseases 2009
Indian Health S
urveillance Report
50
Chlamydia
Reference: Tables 8A, 8B, 9A, 9B
Total Chlamydia Rates
1,260
1,080
900
720
540
360
180
0
IHS Area All IHS U.S.
Chlamydia Rates by Sex, Tucson Area IHS
Rate
(per
100,0
00 po
pulaƟ
on)
Rate
(per
100,0
00 po
pulaƟ
on)
2000 2001 2002 2003 2004 2005 2006 2007 2008 2009
2000
1600
1200
800
400
0
2000 2001 2002 2003 2004 2005 2006 2007 2008 2009
Male Female
Chlamydia Rates by Sex and Age, Tucson Area IHS, 2009 Male Female
10-14
15-19
20-24
25-29
30-34
35-39
40-44
45-54
55-64
65+
Total
6,000 4,000 2,000 0 2,000 4,000 6,000
Rate (per 100,000 population)
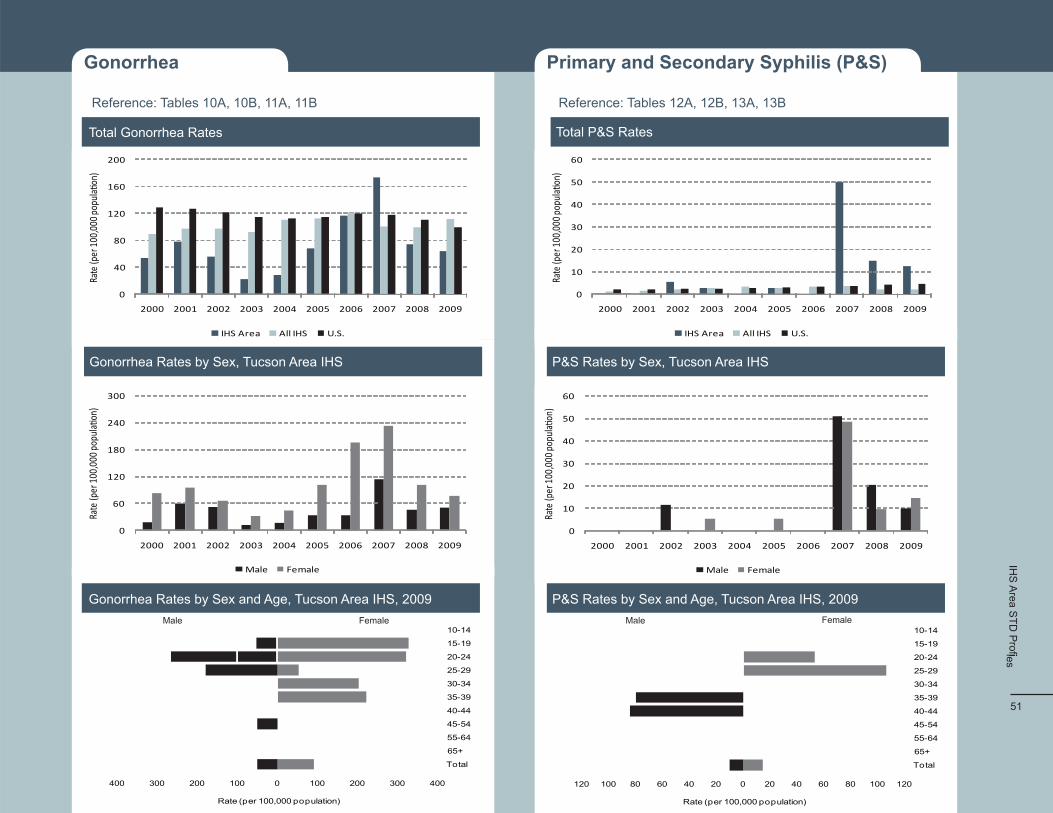
Gonorrhea
Reference: Tables 10A, 10B, 11A, 11B
0
40
80
120
160
200
0
60
120
180
240
300
Total Gonorrhea Rates
Rate
(per
100,0
00 po
pulaƟ
on)
2000 2001 2002 2003 2004 2005 2006 2007 2008 2009
IHS Area All IHS U.S.
Gonorrhea Rates by Sex, Tucson Area IHS
Rate
(per
100,0
00 po
pulaƟ
on)
2000 2001 2002 2003 2004 2005 2006 2007 2008 2009
Male Female
Gonorrhea Rates by Sex and Age, Tucson Area IHS, 2009 Male Female
10-14
15-19
20-24
25-29
30-34
35-39
40-44
45-54
55-64
65+
Total
400 300 200 100 0 100 200 300 400
Rate (per 100,000 population)
Primary and Secondary Syphilis (P&S)
Reference: Tables 12A, 12B, 13A, 13B
Total P&S Rates
60
Rate
(per
100,0
00 po
pulaƟ
on)
50
40
30
20
10
0
2000 2001 2002 2003 2004 2005 2006 2007 2008 2009
IHS Area All IHS U.S.
P&S Rates by Sex, Tucson Area IHS
60
Rate
(per
100,0
00 po
pulaƟ
on)
50
40
30
20
10
0
2000 2001 2002 2003 2004 2005 2006 2007 2008 2009
Male Female
40-44
45-54
55-64
65+
Total
P&S Rates by Sex and Age, Tucson Area IHS, 2009 Male Female
10-14
15-19
20-24
25-29
30-34
35-39
120 100 80 60 40 20 0 20 40 60 80 100 120
Rate (per 100,000 population)
IHS
Area S
TD P
roles fi
51

Tables National Tables
IHS Area Tables
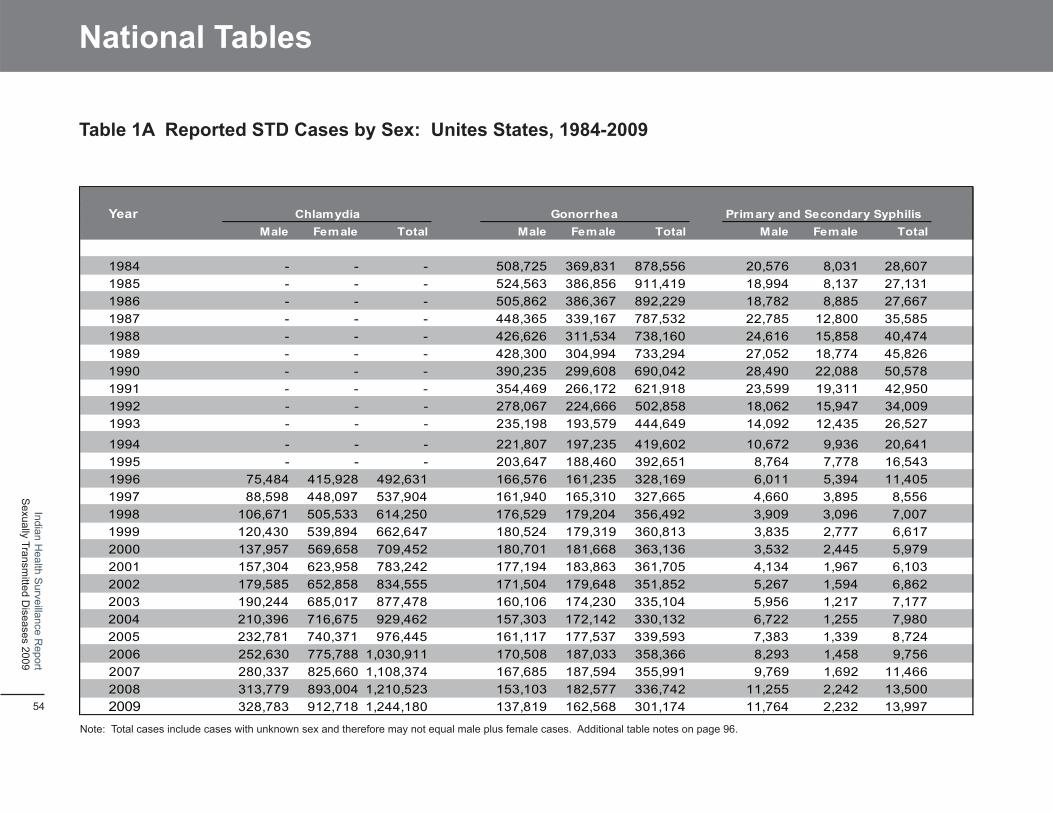
National Tables
Table 1A Reported STD Cases by Sex: Unites States, 1984-2009
Year ChlamydiaMale Female Total
GonorrheaMale Female
Primary and Secondary SyphilisTotal Male Female Total
1984 - - - 508,725 369,831 878,556 20,576 8,031 28,6071985 - - - 524,563 386,856 911,419 18,994 8,137 27,1311986 - - - 505,862 386,367 892,229 18,782 8,885 27,6671987 - - - 448,365 339,167 787,532 22,785 12,800 35,5851988 - - - 426,626 311,534 738,160 24,616 15,858 40,4741989 - - - 428,300 304,994 733,294 27,052 18,774 45,8261990 - - - 390,235 299,608 690,042 28,490 22,088 50,5781991 - - - 354,469 266,172 621,918 23,599 19,311 42,9501992 - - - 278,067 224,666 502,858 18,062 15,947 34,0091993 - - - 235,198 193,579 444,649 14,092 12,435 26,527
1994 - - - 221,807 197,235 419,602 10,672 9,936 20,6411995 - - - 203,647 188,460 392,651 8,764 7,778 16,5431996 75,484 415,928 492,631 166,576 161,235 328,169 6,011 5,394 11,4051997 88,598 448,097 537,904 161,940 165,310 327,665 4,660 3,895 8,5561998 106,671 505,533 614,250 176,529 179,204 356,492 3,909 3,096 7,0071999 120,430 539,894 662,647 180,524 179,319 360,813 3,835 2,777 6,6172000 137,957 569,658 709,452 180,701 181,668 363,136 3,532 2,445 5,9792001 157,304 623,958 783,242 177,194 183,863 361,705 4,134 1,967 6,1032002 179,585 652,858 834,555 171,504 179,648 351,852 5,267 1,594 6,8622003 190,244 685,017 877,478 160,106 174,230 335,104 5,956 1,217 7,1772004 210,396 716,675 929,462 157,303 172,142 330,132 6,722 1,255 7,9802005 232,781 740,371 976,445 161,117 177,537 339,593 7,383 1,339 8,7242006 252,630 775,788 1,030,911 170,508 187,033 358,366 8,293 1,458 9,7562007 280,337 825,660 1,108,374 167,685 187,594 355,991 9,769 1,692 11,4662008 313,779 893,004 1,210,523 153,103 182,577 336,742 11,255 2,242 13,5002009 328,783 912,718 1,244,180 137,819 162,568 301,174 11,764 2,232 13,997
Note: Total cases include cases with unknown sex and therefore may not equal male plus female cases. Additional table notes on page 96.
Sexually Transm
itted Diseases 2009
Indian Health S
urveillance Report
54
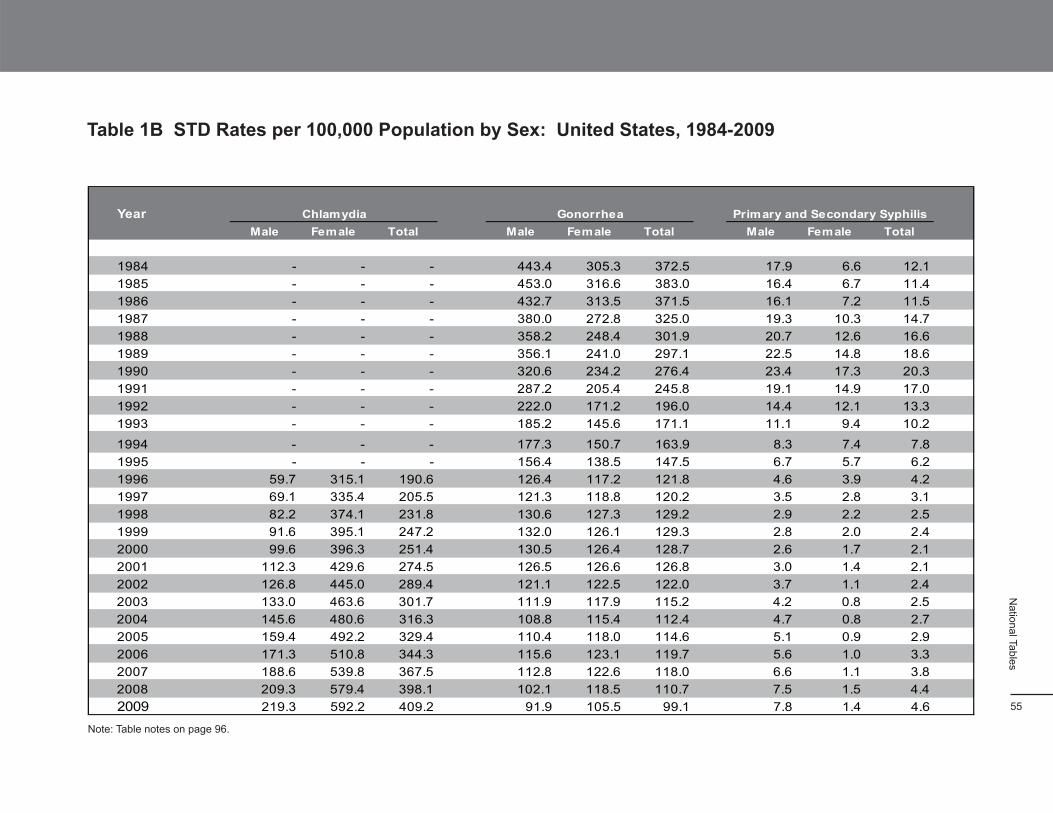
Table 1B STD Rates per 100,000 Population by Sex: United States, 1984-2009
Year Male Female
Chlamydia Total Male Female
Gonorrhea Total Male Female Total
Primary and Secondary Syphilis
1984 - - - 443.4 305.3 372.5 17.9 6.6 12.1
1985 - - - 453.0 316.6 383.0 16.4 6.7 11.4
1986 - - - 432.7 313.5 371.5 16.1 7.2 11.5
1987 - - - 380.0 272.8 325.0 19.3 10.3 14.7
1988 - - - 358.2 248.4 301.9 20.7 12.6 16.6
1989 - - - 356.1 241.0 297.1 22.5 14.8 18.6
1990 - - - 320.6 234.2 276.4 23.4 17.3 20.3
1991 - - - 287.2 205.4 245.8 19.1 14.9 17.0
1992 - - - 222.0 171.2 196.0 14.4 12.1 13.3
1993 - - - 185.2 145.6 171.1 11.1 9.4 10.2
1994 - - - 177.3 150.7 163.9 8.3 7.4 7.8
1995 - - - 156.4 138.5 147.5 6.7 5.7 6.2
1996 59.7 315.1 190.6 126.4 117.2 121.8 4.6 3.9 4.2
1997 69.1 335.4 205.5 121.3 118.8 120.2 3.5 2.8 3.1
1998 82.2 374.1 231.8 130.6 127.3 129.2 2.9 2.2 2.5
1999 91.6 395.1 247.2 132.0 126.1 129.3 2.8 2.0 2.4
2000 99.6 396.3 251.4 130.5 126.4 128.7 2.6 1.7 2.1
2001 112.3 429.6 274.5 126.5 126.6 126.8 3.0 1.4 2.1
2002 126.8 445.0 289.4 121.1 122.5 122.0 3.7 1.1 2.4
2003 133.0 463.6 301.7 111.9 117.9 115.2 4.2 0.8 2.5
2004 145.6 480.6 316.3 108.8 115.4 112.4 4.7 0.8 2.7
2005 159.4 492.2 329.4 110.4 118.0 114.6 5.1 0.9 2.9
2006 171.3 510.8 344.3 115.6 123.1 119.7 5.6 1.0 3.3
2007 188.6 539.8 367.5 112.8 122.6 118.0 6.6 1.1 3.8
2008 209.3 579.4 398.1 102.1 118.5 110.7 7.5 1.5 4.4
2009 219.3 592.2 409.2 91.9 105.5 99.1 7.8 1.4 4.6
National Tables
Note: Table notes on page 96.
55
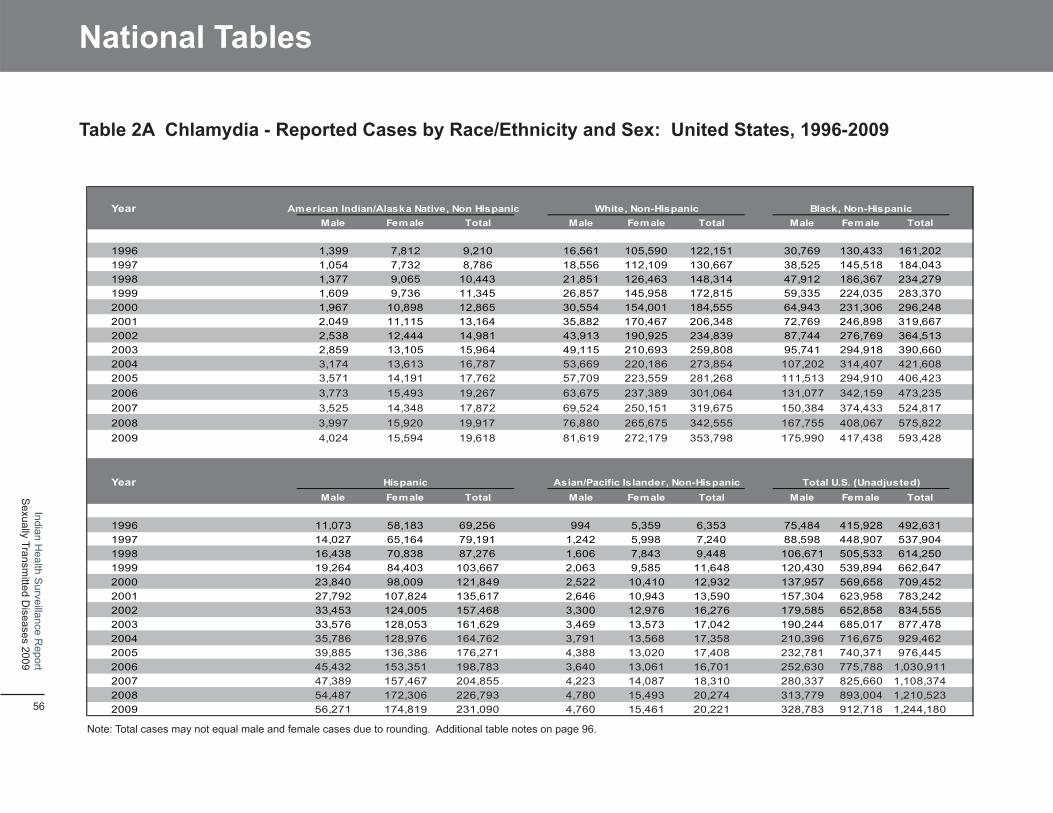
National Tables
Table 2A Chlamydia - Reported Cases by Race/Ethnicity and Sex: United States, 1996-2009
Year American Indian/Alaska Native, Non Hispanic White, Non-Hispanic Black, Non-HispanicMale Female Total Male Female Total Male Female Total
1996 1,399 7,812 9,210 16,561 105,590 122,151 30,769 130,433 161,2021997 1,054 7,732 8,786 18,556 112,109 130,667 38,525 145,518 184,0431998 1,377 9,065 10,443 21,851 126,463 148,314 47,912 186,367 234,2791999 1,609 9,736 11,345 26,857 145,958 172,815 59,335 224,035 283,3702000 1,967 10,898 12,865 30,554 154,001 184,555 64,943 231,306 296,2482001 2,049 11,115 13,164 35,882 170,467 206,348 72,769 246,898 319,6672002 2,538 12,444 14,981 43,913 190,925 234,839 87,744 276,769 364,5132003 2,859 13,105 15,964 49,115 210,693 259,808 95,741 294,918 390,6602004 3,174 13,613 16,787 53,669 220,186 273,854 107,202 314,407 421,6082005 3,571 14,191 17,762 57,709 223,559 281,268 111,513 294,910 406,4232006 3,773 15,493 19,267 63,675 237,389 301,064 131,077 342,159 473,2352007 3,525 14,348 17,872 69,524 250,151 319,675 150,384 374,433 524,8172008 3,997 15,920 19,917 76,880 265,675 342,555 167,755 408,067 575,8222009 4,024 15,594 19,618 81,619 272,179 353,798 175,990 417,438 593,428
Year Hispanic Asian/Pacific Islander, Non-HispanicMale Female Total
Total U.S. (Unadjusted)Male Female TotalMale Female Total
1996 11,073 58,183 69,256 994 5,359 6,353 75,484 415,928 492,6311997 14,027 65,164 79,191 1,242 5,998 7,240 88,598 448,907 537,9041998 16,438 70,838 87,276 1,606 7,843 9,448 106,671 505,533 614,2501999 19,264 84,403 103,667 2,063 9,585 11,648 120,430 539,894 662,6472000 23,840 98,009 121,849 2,522 10,410 12,932 137,957 569,658 709,4522001 27,792 107,824 135,617 2,646 10,943 13,590 157,304 623,958 783,2422002 33,453 124,005 157,468 3,300 12,976 16,276 179,585 652,858 834,5552003 33,576 128,053 161,629 3,469 13,573 17,042 190,244 685,017 877,4782004 35,786 128,976 164,762 3,791 13,568 17,358 210,396 716,675 929,4622005 39,885 136,386 176,271 4,388 13,020 17,408 232,781 740,371 976,4452006 45,432 153,351 198,783 3,640 13,061 16,701 252,630 775,788 1,030,9112007 47,389 157,467 204,855 4,223 14,087 18,310 280,337 825,660 1,108,3742008 54,487 172,306 226,793 4,780 15,493 20,274 313,779 893,004 1,210,5232009 56,271 174,819 231,090 4,760 15,461 20,221 328,783 912,718 1,244,180
Note: Total cases may not equal male and female cases due to rounding. Additional table notes on page 96.
Sexually Transm
itted Diseases 2009
Indian Health S
urveillance Report
56
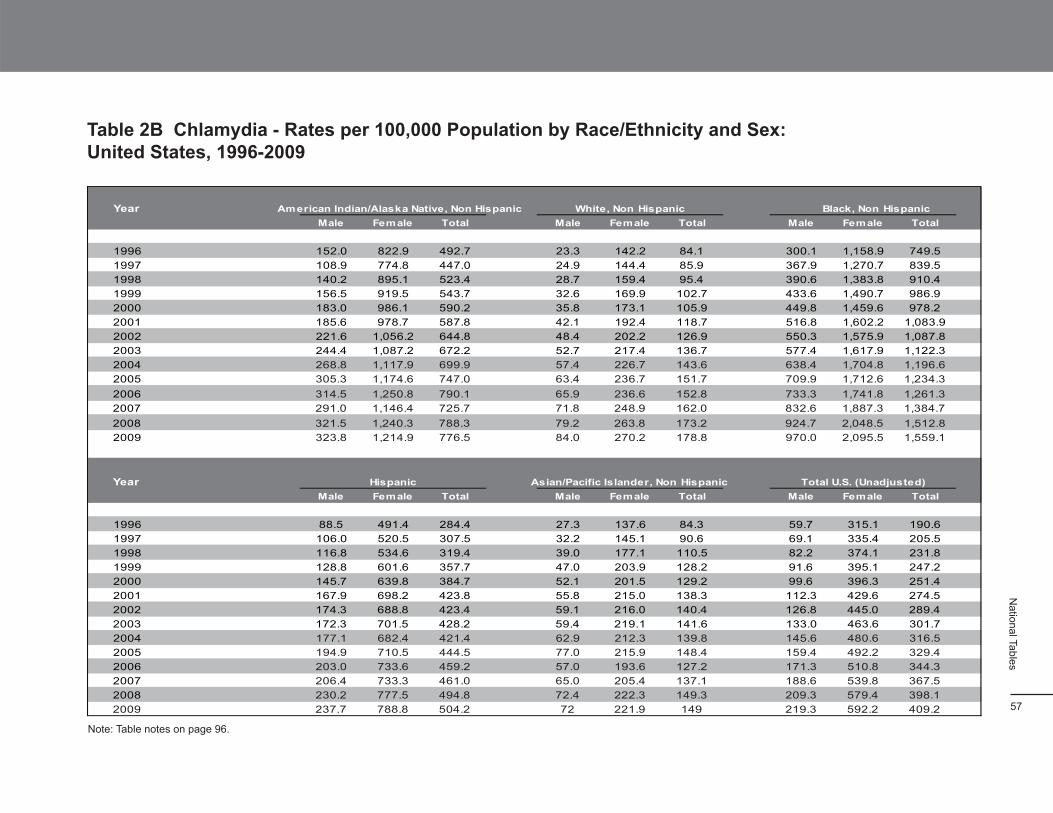
- -
-
Table 2B Chlamydia - Rates per 100,000 Population by Race/Ethnicity and Sex: United States, 1996-2009
Year American Indian/Alaska Native, Non Hispanic White, Non Hispanic Black, Non Hispanic Male Fem ale Total Male Fem ale Total Male Female Total
1996 152.0 822.9 492.7 23.3 142.2 84.1 300.1 1,158.9 749.5
1997 108.9 774.8 447.0 24.9 144.4 85.9 367.9 1,270.7 839.5
1998 140.2 895.1 523.4 28.7 159.4 95.4 390.6 1,383.8 910.4
1999 156.5 919.5 543.7 32.6 169.9 102.7 433.6 1,490.7 986.9
2000 183.0 986.1 590.2 35.8 173.1 105.9 449.8 1,459.6 978.2
2001 185.6 978.7 587.8 42.1 192.4 118.7 516.8 1,602.2 1,083.9
2002 221.6 1,056.2 644.8 48.4 202.2 126.9 550.3 1,575.9 1,087.8
2003 244.4 1,087.2 672.2 52.7 217.4 136.7 577.4 1,617.9 1,122.3
2004 268.8 1,117.9 699.9 57.4 226.7 143.6 638.4 1,704.8 1,196.6
2005 305.3 1,174.6 747.0 63.4 236.7 151.7 709.9 1,712.6 1,234.3
2006 314.5 1,250.8 790.1 65.9 236.6 152.8 733.3 1,741.8 1,261.3
2007 291.0 1,146.4 725.7 71.8 248.9 162.0 832.6 1,887.3 1,384.7
2008 321.5 1,240.3 788.3 79.2 263.8 173.2 924.7 2,048.5 1,512.8
2009 323.8 1,214.9 776.5 84.0 270.2 178.8 970.0 2,095.5 1,559.1
Year Hispanic Asian/Pacific Islander, Non Hispanic Total U.S. (Unadjusted) Male Female Total Male Female Total Male Female Total
1996 88.5 491.4 284.4 27.3 137.6 84.3 59.7 315.1 190.6
1997 106.0 520.5 307.5 32.2 145.1 90.6 69.1 335.4 205.5
1998 116.8 534.6 319.4 39.0 177.1 110.5 82.2 374.1 231.8
1999 128.8 601.6 357.7 47.0 203.9 128.2 91.6 395.1 247.2
2000 145.7 639.8 384.7 52.1 201.5 129.2 99.6 396.3 251.4
2001 167.9 698.2 423.8 55.8 215.0 138.3 112.3 429.6 274.5
2002 174.3 688.8 423.4 59.1 216.0 140.4 126.8 445.0 289.4
2003 172.3 701.5 428.2 59.4 219.1 141.6 133.0 463.6 301.7
2004 177.1 682.4 421.4 62.9 212.3 139.8 145.6 480.6 316.5
2005 194.9 710.5 444.5 77.0 215.9 148.4 159.4 492.2 329.4
2006 203.0 733.6 459.2 57.0 193.6 127.2 171.3 510.8 344.3
2007 206.4 733.3 461.0 65.0 205.4 137.1 188.6 539.8 367.5
2008 230.2 777.5 494.8 72.4 222.3 149.3 209.3 579.4 398.1
2009 237.7 788.8 504.2 72 221.9 149 219.3 592.2 409.2
National Tables
Note: Table notes on page 96.
57

National Tables
Sexually Transm
itted Diseases 2009
Indian Health S
urveillance Report
58
Table 3A Chlamydia - Reported Cases by Race/Ethnicity, Age Group, and Sex: United States, 2009
Age Group American Indian/Alaska Native, Non HispanicMale Female Total
White, Non-HispanicMale Female Total
Black, Non-HispanicMale Female Total
10-14 21 214 235 124 2,355 2,479 1,003 7,550 8,55315-19 971 5,156 6,127 14,452 98,442 112,894 51,652 177,487 229,13920-24 1,527 5,517 7,044 32,450 108,326 140,776 62,987 146,159 209,14625-29 744 2,562 3,306 17,291 38,348 55,639 30,062 52,082 82,14430-34 371 1,070 1,442 7,333 13,588 20,922 13,867 19,069 32,93635-39 158 550 708 3,836 5,707 9,543 7,402 7,679 15,08240-44 102 264 367 2,429 2,629 5,058 4,289 3,360 7,64845-54 91 196 287 2,719 1,970 4,689 3,582 2,812 6,39455-64 20 42 61 709 427 1,136 773 628 1,40165+ 7 9 16 190 131 321 175 196 371All Ages 4,024 15,594 19,618 81,619 272,179 353,798 175,990 417,438 593,428
Age Group HispanicMale Female Total
Asian/Pacific Islander, Non-HispanicMale Female Total
Total U.S. (Adjusted)Male Female Total
10-14 242 2,098 2,340 8 83 91 1,414 12,520 13,93415-19 12,231 57,998 70,229 542 3,590 4,132 81,110 349,145 430,25520-24 20,465 61,771 82,236 1,531 5,443 6,975 121,536 334,382 455,91825-29 12,080 29,195 41,275 1,065 2,976 4,041 62,721 128,249 190,97030-34 5,624 12,841 18,465 572 1,490 2,062 28,481 49,325 77,80635-39 2,761 6,109 8,869 421 845 1,266 14,930 21,450 36,38040-44 1,526 2,572 4,098 263 476 739 8,796 9,514 18,31145-54 1,032 1,670 2,701 251 407 658 7,856 7,216 15,07255-64 188 337 524 68 118 186 1,795 1,579 3,37465+ 60 98 158 33 29 62 475 474 948All Ages 56,271 174,819 231,090 4,760 15,461 20,221 329,490 914,690 1,244,180
Note: Total cases may not equal male and female cases due to rounding. Additional table notes on page 96.
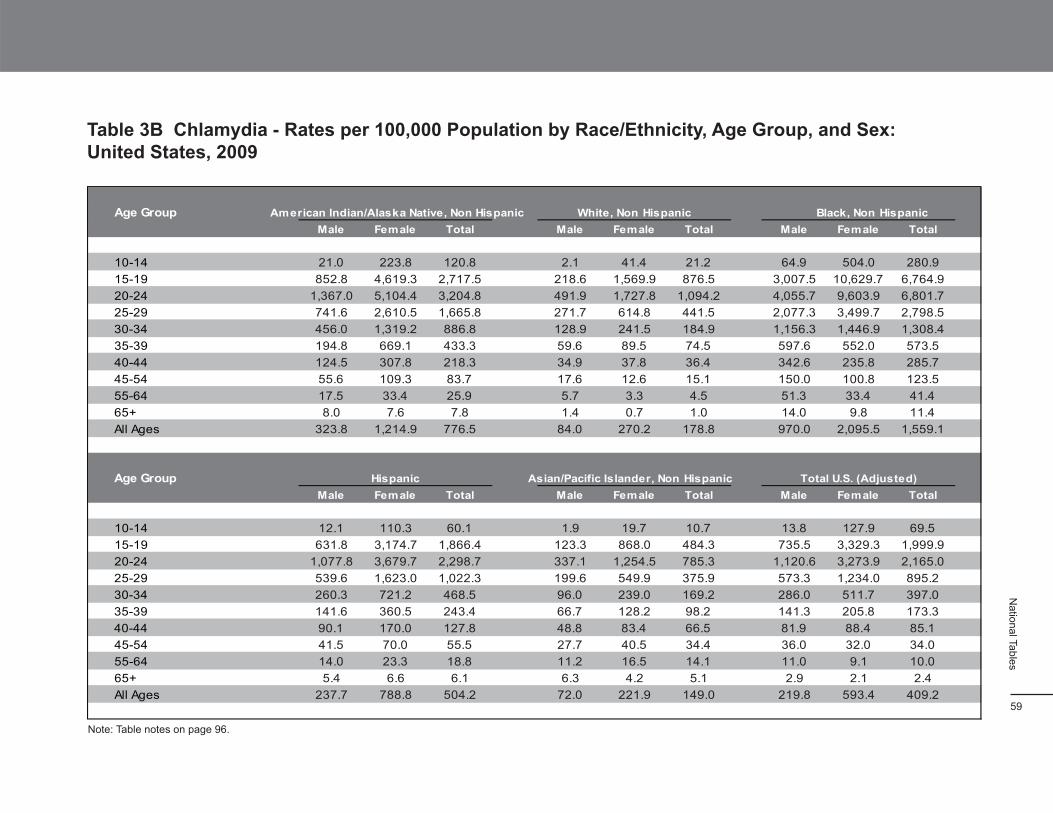
- -
-
Table 3B Chlamydia - Rates per 100,000 Population by Race/Ethnicity, Age Group, and Sex: United States, 2009
Age Group American Indian/Alaska Native, Non Hispanic White, Non Hispanic Black, Non Hispanic Male Fem ale Total Male Female Total Male Female Total
10-14 21.0 223.8 120.8 2.1 41.4 21.2 64.9 504.0 280.9 15-19 852.8 4,619.3 2,717.5 218.6 1,569.9 876.5 3,007.5 10,629.7 6,764.9 20-24 1,367.0 5,104.4 3,204.8 491.9 1,727.8 1,094.2 4,055.7 9,603.9 6,801.7 25-29 741.6 2,610.5 1,665.8 271.7 614.8 441.5 2,077.3 3,499.7 2,798.5 30-34 456.0 1,319.2 886.8 128.9 241.5 184.9 1,156.3 1,446.9 1,308.4 35-39 194.8 669.1 433.3 59.6 89.5 74.5 597.6 552.0 573.5 40-44 124.5 307.8 218.3 34.9 37.8 36.4 342.6 235.8 285.7 45-54 55.6 109.3 83.7 17.6 12.6 15.1 150.0 100.8 123.5 55-64 17.5 33.4 25.9 5.7 3.3 4.5 51.3 33.4 41.4 65+ 8.0 7.6 7.8 1.4 0.7 1.0 14.0 9.8 11.4 All Ages 323.8 1,214.9 776.5 84.0 270.2 178.8 970.0 2,095.5 1,559.1
Age GroupMale Female Total
Hispanic Asian/Pacific Islander, Non Hispanic Male Female Total Male Fem ale Total
Total U.S. (Adjusted)
10-14 12.1 110.3 60.1 1.9 19.7 10.7 13.8 127.9 69.5 15-19 631.8 3,174.7 1,866.4 123.3 868.0 484.3 735.5 3,329.3 1,999.9 20-24 1,077.8 3,679.7 2,298.7 337.1 1,254.5 785.3 1,120.6 3,273.9 2,165.0 25-29 539.6 1,623.0 1,022.3 199.6 549.9 375.9 573.3 1,234.0 895.2 30-34 260.3 721.2 468.5 96.0 239.0 169.2 286.0 511.7 397.0 35-39 141.6 360.5 243.4 66.7 128.2 98.2 141.3 205.8 173.3 40-44 90.1 170.0 127.8 48.8 83.4 66.5 81.9 88.4 85.1 45-54 41.5 70.0 55.5 27.7 40.5 34.4 36.0 32.0 34.0 55-64 14.0 23.3 18.8 11.2 16.5 14.1 11.0 9.1 10.0 65+ 5.4 6.6 6.1 6.3 4.2 5.1 2.9 2.1 2.4 All Ages 237.7 788.8 504.2 72.0 221.9 149.0 219.8 593.4 409.2
National Tables
Note: Table notes on page 96.
59
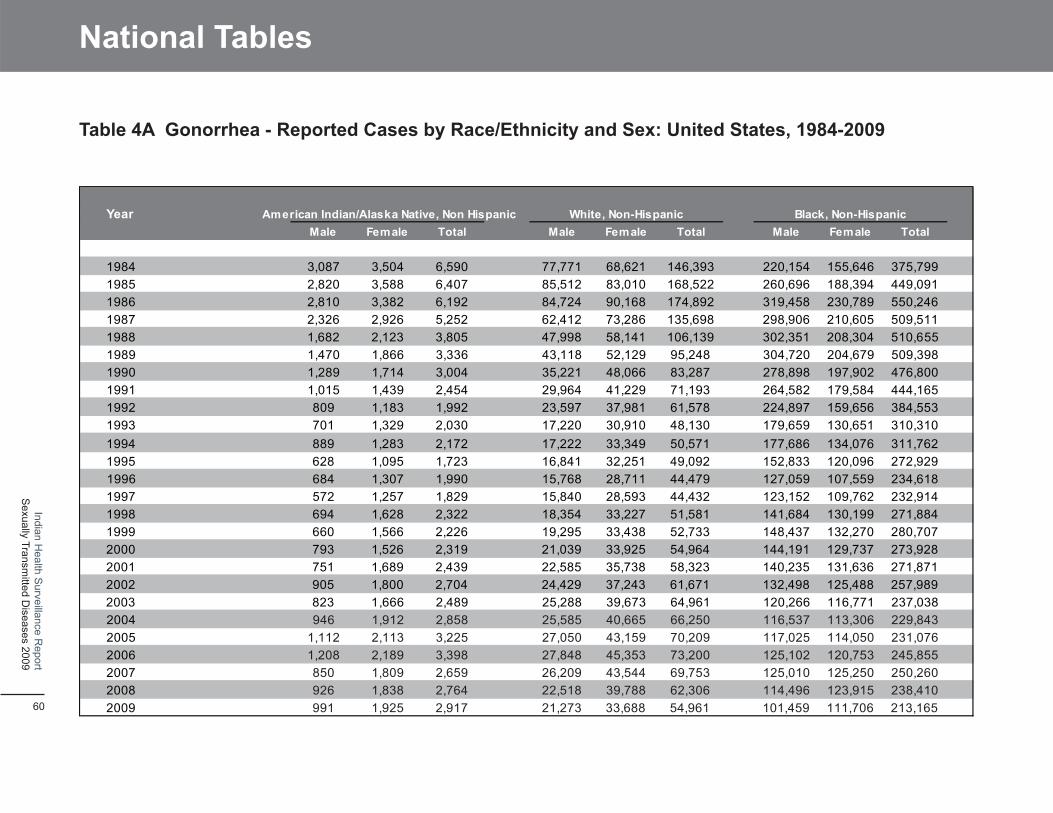
National Tables
60
Indian Health S
urveillance Report
Sexually Transm
itted Diseases 2009
Table 4A Gonorrhea - Reported Cases by Race/Ethnicity and Sex: United States, 1984-2009
Year American Indian/Alaska Native, Non Hispanic White, Non-Hispanic Black, Non-HispanicMale Female Total Male Female Total Male Female Total
1984 3,087 3,504 6,590 77,771 68,621 146,393 220,154 155,646 375,7991985 2,820 3,588 6,407 85,512 83,010 168,522 260,696 188,394 449,0911986 2,810 3,382 6,192 84,724 90,168 174,892 319,458 230,789 550,2461987 2,326 2,926 5,252 62,412 73,286 135,698 298,906 210,605 509,5111988 1,682 2,123 3,805 47,998 58,141 106,139 302,351 208,304 510,6551989 1,470 1,866 3,336 43,118 52,129 95,248 304,720 204,679 509,3981990 1,289 1,714 3,004 35,221 48,066 83,287 278,898 197,902 476,8001991 1,015 1,439 2,454 29,964 41,229 71,193 264,582 179,584 444,1651992 809 1,183 1,992 23,597 37,981 61,578 224,897 159,656 384,5531993 701 1,329 2,030 17,220 30,910 48,130 179,659 130,651 310,3101994 889 1,283 2,172 17,222 33,349 50,571 177,686 134,076 311,7621995 628 1,095 1,723 16,841 32,251 49,092 152,833 120,096 272,9291996 684 1,307 1,990 15,768 28,711 44,479 127,059 107,559 234,6181997 572 1,257 1,829 15,840 28,593 44,432 123,152 109,762 232,9141998 694 1,628 2,322 18,354 33,227 51,581 141,684 130,199 271,8841999 660 1,566 2,226 19,295 33,438 52,733 148,437 132,270 280,7072000 793 1,526 2,319 21,039 33,925 54,964 144,191 129,737 273,9282001 751 1,689 2,439 22,585 35,738 58,323 140,235 131,636 271,8712002 905 1,800 2,704 24,429 37,243 61,671 132,498 125,488 257,9892003 823 1,666 2,489 25,288 39,673 64,961 120,266 116,771 237,0382004 946 1,912 2,858 25,585 40,665 66,250 116,537 113,306 229,8432005 1,112 2,113 3,225 27,050 43,159 70,209 117,025 114,050 231,0762006 1,208 2,189 3,398 27,848 45,353 73,200 125,102 120,753 245,8552007 850 1,809 2,659 26,209 43,544 69,753 125,010 125,250 250,2602008 926 1,838 2,764 22,518 39,788 62,306 114,496 123,915 238,4102009 991 1,925 2,917 21,273 33,688 54,961 101,459 111,706 213,165
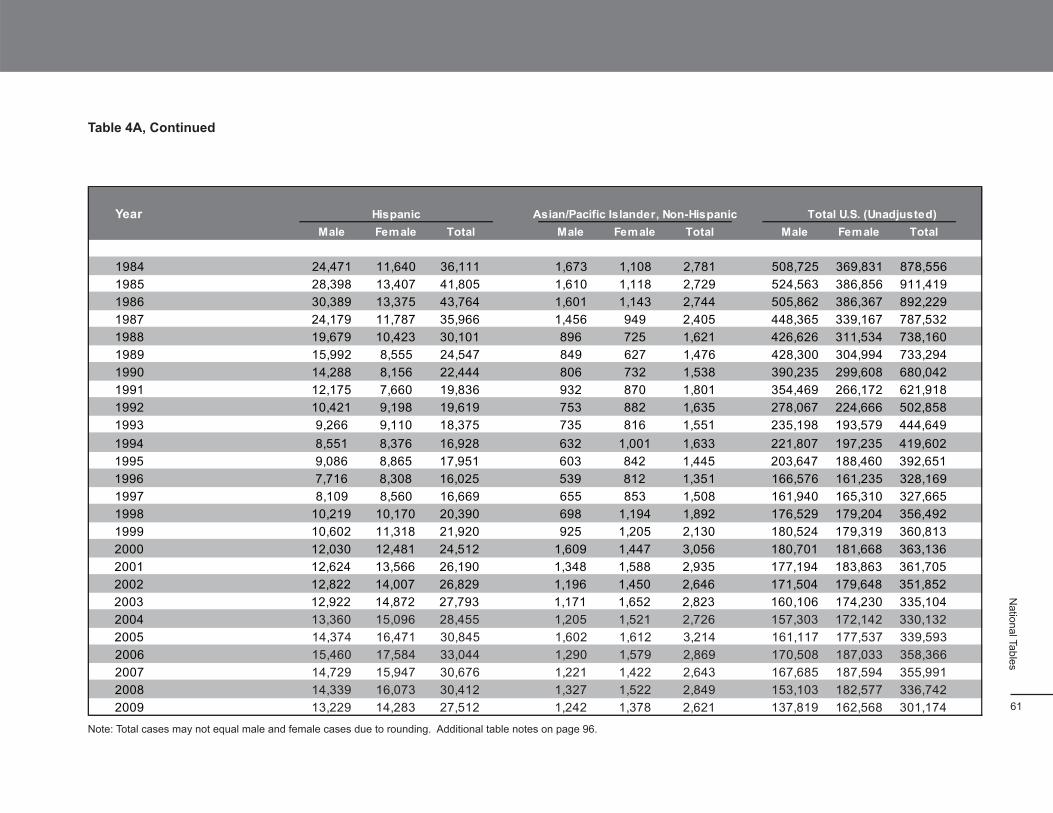
Table 4A, Continued
Year Male
Hispanic Female Total
Asian/Pacific Islander, Non-Hispanic Male Female Total
Total U.S. (Unadjusted) Male Female Total
1984 24,471 11,640 36,111 1,673 1,108 2,781 508,725 369,831 878,556
1985 28,398 13,407 41,805 1,610 1,118 2,729 524,563 386,856 911,419
1986 30,389 13,375 43,764 1,601 1,143 2,744 505,862 386,367 892,229
1987 24,179 11,787 35,966 1,456 949 2,405 448,365 339,167 787,532
1988 19,679 10,423 30,101 896 725 1,621 426,626 311,534 738,160
1989 15,992 8,555 24,547 849 627 1,476 428,300 304,994 733,294
1990 14,288 8,156 22,444 806 732 1,538 390,235 299,608 680,042
1991 12,175 7,660 19,836 932 870 1,801 354,469 266,172 621,918
1992 10,421 9,198 19,619 753 882 1,635 278,067 224,666 502,858
1993 9,266 9,110 18,375 735 816 1,551 235,198 193,579 444,649
1994 8,551 8,376 16,928 632 1,001 1,633 221,807 197,235 419,602
1995 9,086 8,865 17,951 603 842 1,445 203,647 188,460 392,651
1996 7,716 8,308 16,025 539 812 1,351 166,576 161,235 328,169
1997 8,109 8,560 16,669 655 853 1,508 161,940 165,310 327,665
1998 10,219 10,170 20,390 698 1,194 1,892 176,529 179,204 356,492
1999 10,602 11,318 21,920 925 1,205 2,130 180,524 179,319 360,813
2000 12,030 12,481 24,512 1,609 1,447 3,056 180,701 181,668 363,136
2001 12,624 13,566 26,190 1,348 1,588 2,935 177,194 183,863 361,705
2002 12,822 14,007 26,829 1,196 1,450 2,646 171,504 179,648 351,852
2003 12,922 14,872 27,793 1,171 1,652 2,823 160,106 174,230 335,104
2004 13,360 15,096 28,455 1,205 1,521 2,726 157,303 172,142 330,132
2005 14,374 16,471 30,845 1,602 1,612 3,214 161,117 177,537 339,593
2006 15,460 17,584 33,044 1,290 1,579 2,869 170,508 187,033 358,366
2007 14,729 15,947 30,676 1,221 1,422 2,643 167,685 187,594 355,991
2008 14,339 16,073 30,412 1,327 1,522 2,849 153,103 182,577 336,742
2009 13,229 14,283 27,512 1,242 1,378 2,621 137,819 162,568 301,174
National Tables
Note: Total cases may not equal male and female cases due to rounding. Additional table notes on page 96.
61
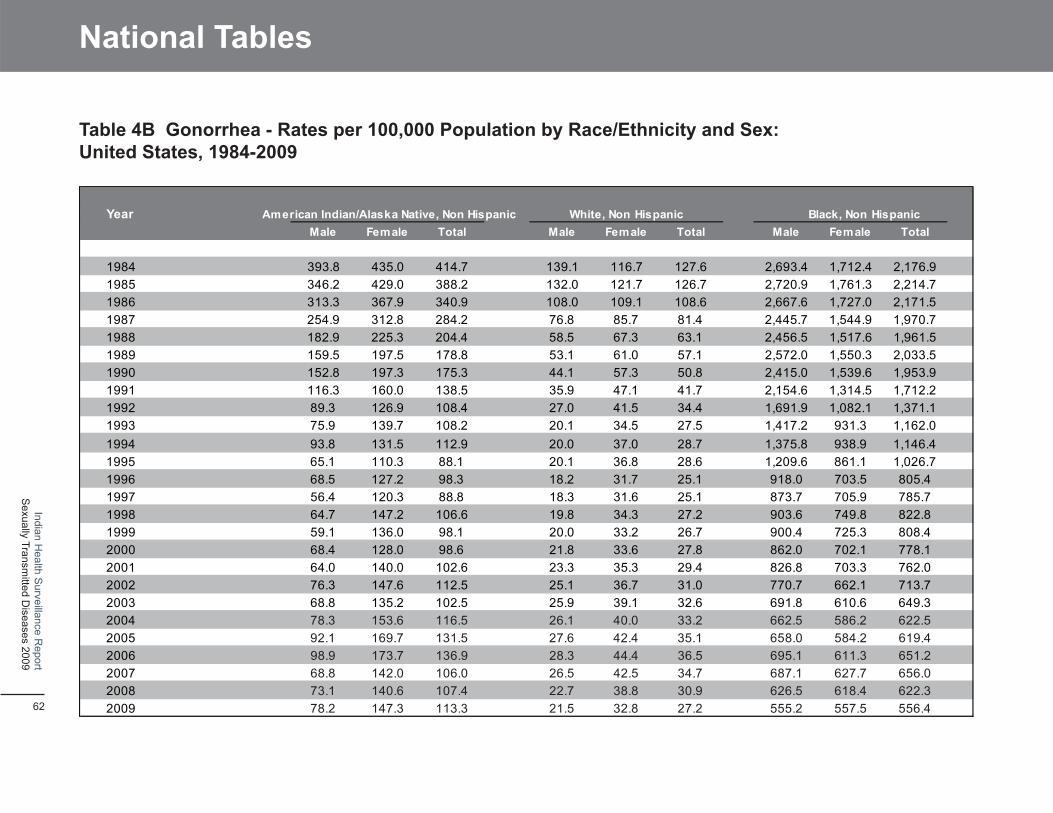
- -
National Tables
Table 4B Gonorrhea - Rates per 100,000 Population by Race/Ethnicity and Sex: United States, 1984-2009
Year American Indian/Alaska Native, Non Hispanic White, Non Hispanic Black, Non Hispanic Male Fem ale Total Male Female Total Male Fem ale Total
1984 393.8 435.0 414.7 139.1 116.7 127.6 2,693.4 1,712.4 2,176.9
1985 346.2 429.0 388.2 132.0 121.7 126.7 2,720.9 1,761.3 2,214.7
1986 313.3 367.9 340.9 108.0 109.1 108.6 2,667.6 1,727.0 2,171.5
1987 254.9 312.8 284.2 76.8 85.7 81.4 2,445.7 1,544.9 1,970.7
1988 182.9 225.3 204.4 58.5 67.3 63.1 2,456.5 1,517.6 1,961.5
1989 159.5 197.5 178.8 53.1 61.0 57.1 2,572.0 1,550.3 2,033.5
1990 152.8 197.3 175.3 44.1 57.3 50.8 2,415.0 1,539.6 1,953.9
1991 116.3 160.0 138.5 35.9 47.1 41.7 2,154.6 1,314.5 1,712.2
1992 89.3 126.9 108.4 27.0 41.5 34.4 1,691.9 1,082.1 1,371.1
1993 75.9 139.7 108.2 20.1 34.5 27.5 1,417.2 931.3 1,162.0
1994 93.8 131.5 112.9 20.0 37.0 28.7 1,375.8 938.9 1,146.4
1995 65.1 110.3 88.1 20.1 36.8 28.6 1,209.6 861.1 1,026.7
1996 68.5 127.2 98.3 18.2 31.7 25.1 918.0 703.5 805.4
1997 56.4 120.3 88.8 18.3 31.6 25.1 873.7 705.9 785.7
1998 64.7 147.2 106.6 19.8 34.3 27.2 903.6 749.8 822.8
1999 59.1 136.0 98.1 20.0 33.2 26.7 900.4 725.3 808.4
2000 68.4 128.0 98.6 21.8 33.6 27.8 862.0 702.1 778.1
2001 64.0 140.0 102.6 23.3 35.3 29.4 826.8 703.3 762.0
2002 76.3 147.6 112.5 25.1 36.7 31.0 770.7 662.1 713.7
2003 68.8 135.2 102.5 25.9 39.1 32.6 691.8 610.6 649.3
2004 78.3 153.6 116.5 26.1 40.0 33.2 662.5 586.2 622.5
2005 92.1 169.7 131.5 27.6 42.4 35.1 658.0 584.2 619.4
2006 98.9 173.7 136.9 28.3 44.4 36.5 695.1 611.3 651.2
2007 68.8 142.0 106.0 26.5 42.5 34.7 687.1 627.7 656.0
2008 73.1 140.6 107.4 22.7 38.8 30.9 626.5 618.4 622.3
2009 78.2 147.3 113.3 21.5 32.8 27.2 555.2 557.5 556.4
Indian Health S
urveillance Report
Sexually Transm
itted Diseases 2009
62
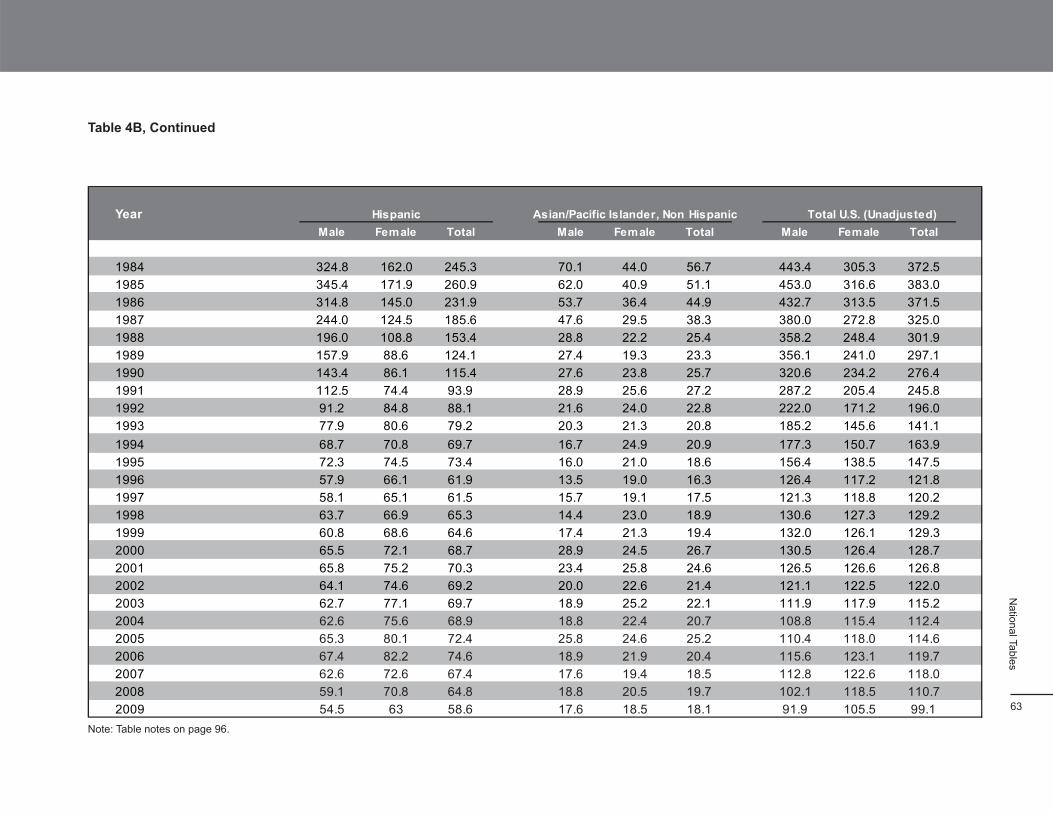
-
Table 4B, Continued
Year Male
Hispanic Fem ale Total
Asian/Pacific Islander, Non Hispanic Male Female Total
Total U.S. (Unadjusted) Male Fem ale Total
1984 324.8 162.0 245.3 70.1 44.0 56.7 443.4 305.3 372.5
1985 345.4 171.9 260.9 62.0 40.9 51.1 453.0 316.6 383.0
1986 314.8 145.0 231.9 53.7 36.4 44.9 432.7 313.5 371.5
1987 244.0 124.5 185.6 47.6 29.5 38.3 380.0 272.8 325.0
1988 196.0 108.8 153.4 28.8 22.2 25.4 358.2 248.4 301.9
1989 157.9 88.6 124.1 27.4 19.3 23.3 356.1 241.0 297.1
1990 143.4 86.1 115.4 27.6 23.8 25.7 320.6 234.2 276.4
1991 112.5 74.4 93.9 28.9 25.6 27.2 287.2 205.4 245.8
1992 91.2 84.8 88.1 21.6 24.0 22.8 222.0 171.2 196.0
1993 77.9 80.6 79.2 20.3 21.3 20.8 185.2 145.6 141.1
1994 68.7 70.8 69.7 16.7 24.9 20.9 177.3 150.7 163.9
1995 72.3 74.5 73.4 16.0 21.0 18.6 156.4 138.5 147.5
1996 57.9 66.1 61.9 13.5 19.0 16.3 126.4 117.2 121.8
1997 58.1 65.1 61.5 15.7 19.1 17.5 121.3 118.8 120.2
1998 63.7 66.9 65.3 14.4 23.0 18.9 130.6 127.3 129.2
1999 60.8 68.6 64.6 17.4 21.3 19.4 132.0 126.1 129.3
2000 65.5 72.1 68.7 28.9 24.5 26.7 130.5 126.4 128.7
2001 65.8 75.2 70.3 23.4 25.8 24.6 126.5 126.6 126.8
2002 64.1 74.6 69.2 20.0 22.6 21.4 121.1 122.5 122.0
2003 62.7 77.1 69.7 18.9 25.2 22.1 111.9 117.9 115.2
2004 62.6 75.6 68.9 18.8 22.4 20.7 108.8 115.4 112.4
2005 65.3 80.1 72.4 25.8 24.6 25.2 110.4 118.0 114.6
2006 67.4 82.2 74.6 18.9 21.9 20.4 115.6 123.1 119.7
2007 62.6 72.6 67.4 17.6 19.4 18.5 112.8 122.6 118.0
2008 59.1 70.8 64.8 18.8 20.5 19.7 102.1 118.5 110.7
2009 54.5 63 58.6 17.6 18.5 18.1 91.9 105.5 99.1
National Tables
Note: Table notes on page 96.
63
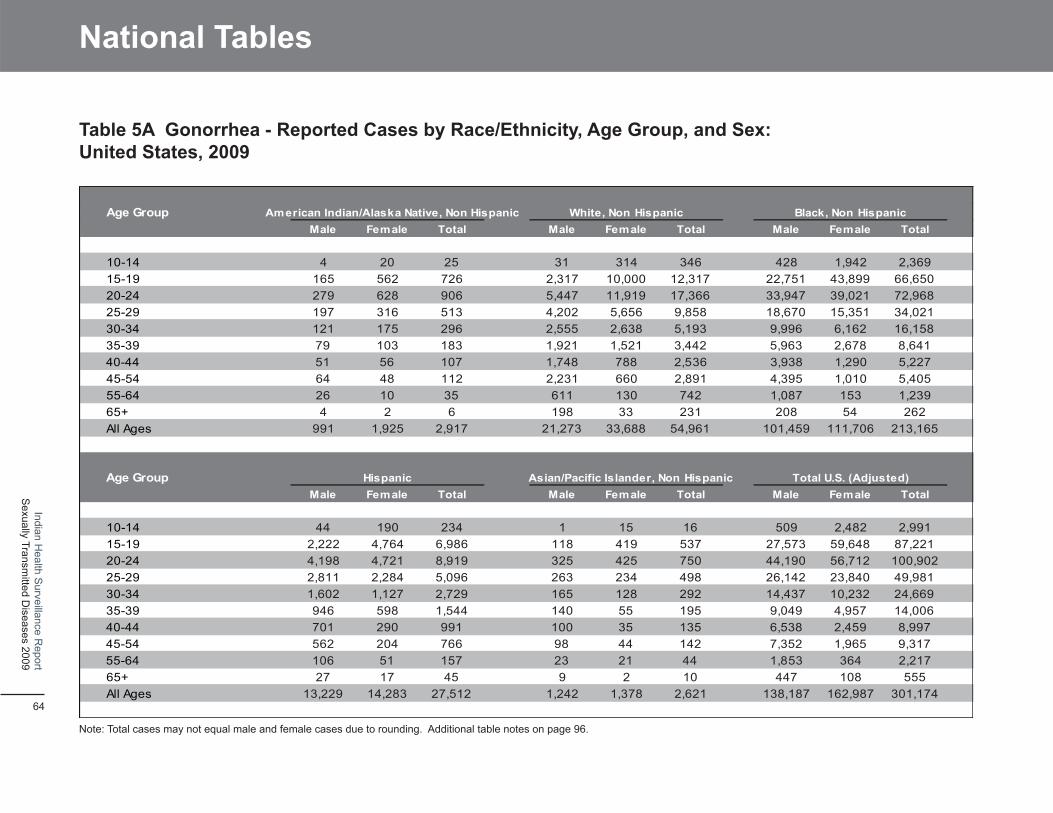
-
--
National Tables
Table 5A Gonorrhea - Reported Cases by Race/Ethnicity, Age Group, and Sex: United States, 2009
Age Group American Indian/Alaska Native, Non Hispanic White, Non Hispanic Black, Non Hispanic Male Fem ale Total Male Female Total Male Fem ale Total
10-14 4 20 25 31 314 346 428 1,942 2,369 15-19 165 562 726 2,317 10,000 12,317 22,751 43,899 66,650 20-24 279 628 906 5,447 11,919 17,366 33,947 39,021 72,968 25-29 197 316 513 4,202 5,656 9,858 18,670 15,351 34,021 30-34 121 175 296 2,555 2,638 5,193 9,996 6,162 16,158 35-39 79 103 183 1,921 1,521 3,442 5,963 2,678 8,641 40-44 51 56 107 1,748 788 2,536 3,938 1,290 5,227 45-54 64 48 112 2,231 660 2,891 4,395 1,010 5,405 55-64 26 10 35 611 130 742 1,087 153 1,239 65+ 4 2 6 198 33 231 208 54 262 All Ages 991 1,925 2,917 21,273 33,688 54,961 101,459 111,706 213,165
Age GroupMale Female Total
Hispanic Asian/Pacific Islander, Non Hispanic Male Female Total Male Fem ale Total
Total U.S. (Adjusted)
10-14 44 190 234 1 15 16 509 2,482 2,991 15-19 2,222 4,764 6,986 118 419 537 27,573 59,648 87,221 20-24 4,198 4,721 8,919 325 425 750 44,190 56,712 100,902 25-29 2,811 2,284 5,096 263 234 498 26,142 23,840 49,981 30-34 1,602 1,127 2,729 165 128 292 14,437 10,232 24,669 35-39 946 598 1,544 140 55 195 9,049 4,957 14,006 40-44 701 290 991 100 35 135 6,538 2,459 8,997 45-54 562 204 766 98 44 142 7,352 1,965 9,317 55-64 106 51 157 23 21 44 1,853 364 2,217 65+ 27 17 45 9 2 10 447 108 555 All Ages 13,229 14,283 27,512 1,242 1,378 2,621 138,187 162,987 301,174
Indian Health S
urveillance Report
Sexually Transm
itted Diseases 2009
Note: Total cases may not equal male and female cases due to rounding. Additional table notes on page 96.
64
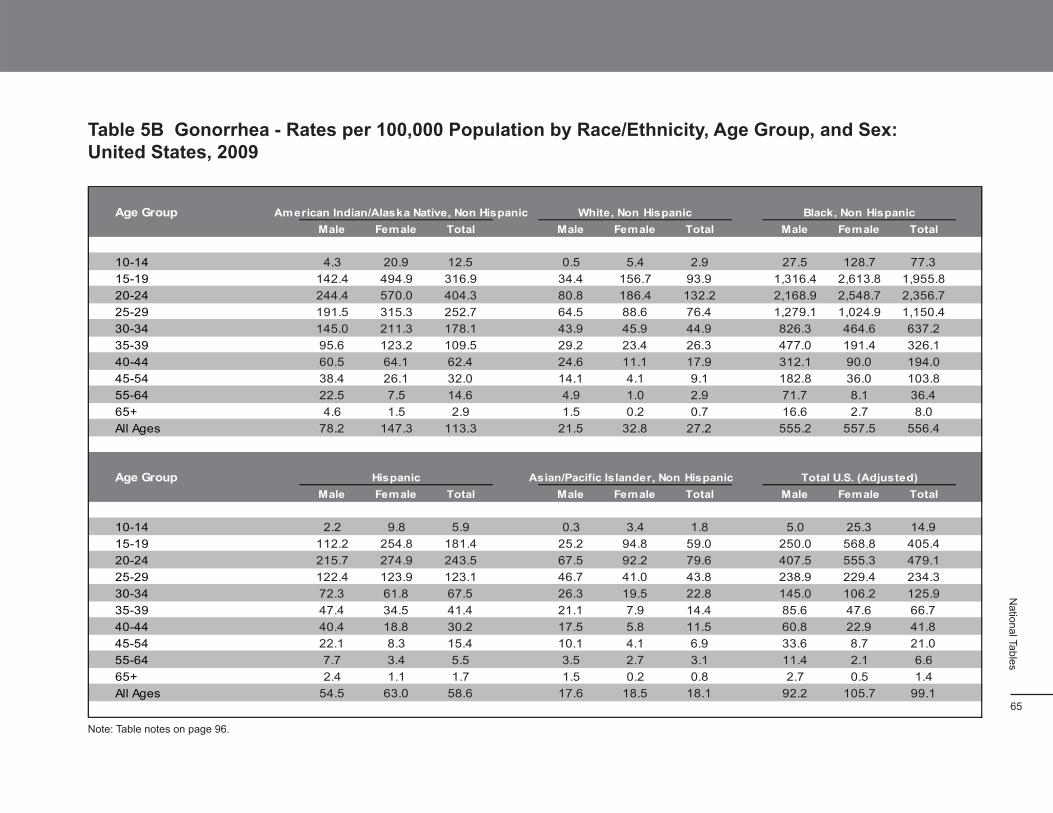
-
- -
Table 5B Gonorrhea - Rates per 100,000 Population by Race/Ethnicity, Age Group, and Sex: United States, 2009
Age Group American Indian/Alaska Native, Non Hispanic White, Non Hispanic Black, Non Hispanic Male Fem ale Total Male Female Total Male Fem ale Total
10-14 4.3 20.9 12.5 0.5 5.4 2.9 27.5 128.7 77.3 15-19 142.4 494.9 316.9 34.4 156.7 93.9 1,316.4 2,613.8 1,955.8 20-24 244.4 570.0 404.3 80.8 186.4 132.2 2,168.9 2,548.7 2,356.7 25-29 191.5 315.3 252.7 64.5 88.6 76.4 1,279.1 1,024.9 1,150.4 30-34 145.0 211.3 178.1 43.9 45.9 44.9 826.3 464.6 637.2 35-39 95.6 123.2 109.5 29.2 23.4 26.3 477.0 191.4 326.1 40-44 60.5 64.1 62.4 24.6 11.1 17.9 312.1 90.0 194.0 45-54 38.4 26.1 32.0 14.1 4.1 9.1 182.8 36.0 103.8 55-64 22.5 7.5 14.6 4.9 1.0 2.9 71.7 8.1 36.4 65+ 4.6 1.5 2.9 1.5 0.2 0.7 16.6 2.7 8.0 All Ages 78.2 147.3 113.3 21.5 32.8 27.2 555.2 557.5 556.4
Age Group Asian/Pacific Islander, Non Hispanic Male Female Total Male Female Total
Hispanic Male Fem ale Total
Total U.S. (Adjusted)
10-14 2.2 9.8 5.9 0.3 3.4 1.8 5.0 25.3 14.9 15-19 112.2 254.8 181.4 25.2 94.8 59.0 250.0 568.8 405.4 20-24 215.7 274.9 243.5 67.5 92.2 79.6 407.5 555.3 479.1 25-29 122.4 123.9 123.1 46.7 41.0 43.8 238.9 229.4 234.3 30-34 72.3 61.8 67.5 26.3 19.5 22.8 145.0 106.2 125.9 35-39 47.4 34.5 41.4 21.1 7.9 14.4 85.6 47.6 66.7 40-44 40.4 18.8 30.2 17.5 5.8 11.5 60.8 22.9 41.8 45-54 22.1 8.3 15.4 10.1 4.1 6.9 33.6 8.7 21.0 55-64 7.7 3.4 5.5 3.5 2.7 3.1 11.4 2.1 6.6 65+ 2.4 1.1 1.7 1.5 0.2 0.8 2.7 0.5 1.4 All Ages 54.5 63.0 58.6 17.6 18.5 18.1 92.2 105.7 99.1
National Tables
Note: Table notes on page 96.
65
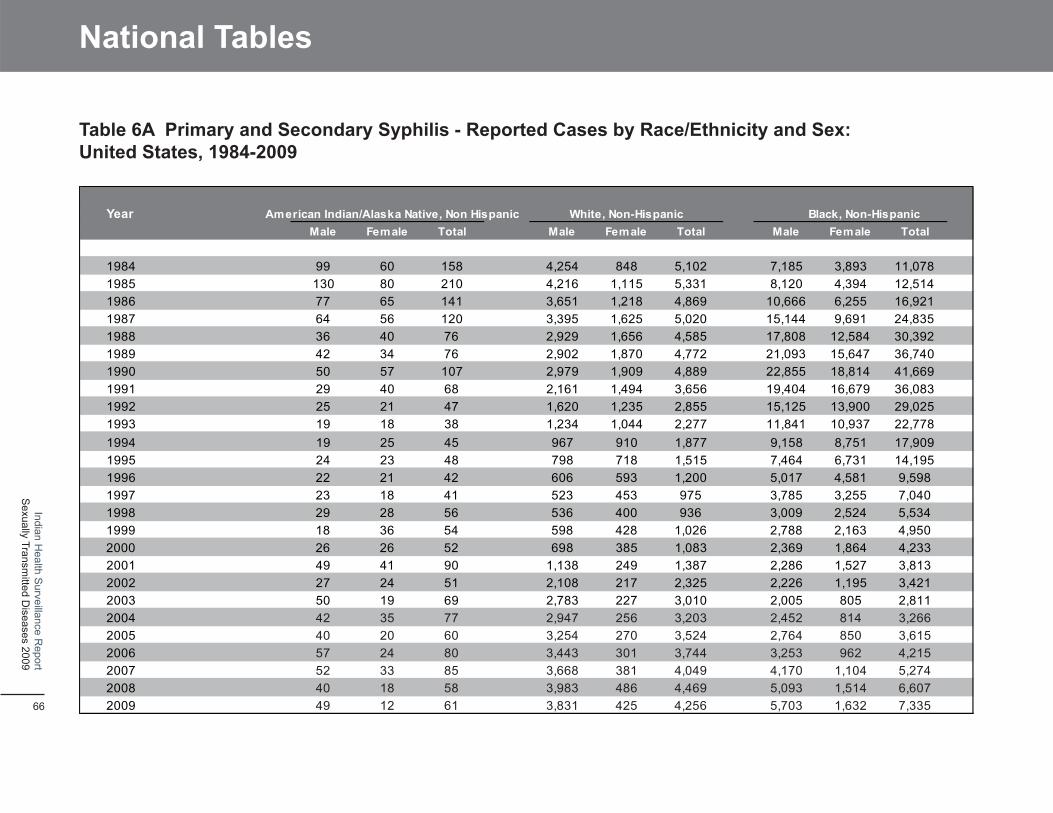
National Tables
Table 6A Primary and Secondary Syphilis - Reported Cases by Race/Ethnicity and Sex: United States, 1984-2009
Year American Indian/Alaska Native, Non Hispanic White, Non-Hispanic Black, Non-HispanicMale Female Total Male Female Total Male Female Total
1984 99 60 158 4,254 848 5,102 7,185 3,893 11,0781985 130 80 210 4,216 1,115 5,331 8,120 4,394 12,5141986 77 65 141 3,651 1,218 4,869 10,666 6,255 16,9211987 64 56 120 3,395 1,625 5,020 15,144 9,691 24,8351988 36 40 76 2,929 1,656 4,585 17,808 12,584 30,3921989 42 34 76 2,902 1,870 4,772 21,093 15,647 36,7401990 50 57 107 2,979 1,909 4,889 22,855 18,814 41,6691991 29 40 68 2,161 1,494 3,656 19,404 16,679 36,0831992 25 21 47 1,620 1,235 2,855 15,125 13,900 29,0251993 19 18 38 1,234 1,044 2,277 11,841 10,937 22,7781994 19 25 45 967 910 1,877 9,158 8,751 17,9091995 24 23 48 798 718 1,515 7,464 6,731 14,1951996 22 21 42 606 593 1,200 5,017 4,581 9,5981997 23 18 41 523 453 975 3,785 3,255 7,0401998 29 28 56 536 400 936 3,009 2,524 5,5341999 18 36 54 598 428 1,026 2,788 2,163 4,9502000 26 26 52 698 385 1,083 2,369 1,864 4,2332001 49 41 90 1,138 249 1,387 2,286 1,527 3,8132002 27 24 51 2,108 217 2,325 2,226 1,195 3,4212003 50 19 69 2,783 227 3,010 2,005 805 2,8112004 42 35 77 2,947 256 3,203 2,452 814 3,2662005 40 20 60 3,254 270 3,524 2,764 850 3,6152006 57 24 80 3,443 301 3,744 3,253 962 4,2152007 52 33 85 3,668 381 4,049 4,170 1,104 5,2742008 40 18 58 3,983 486 4,469 5,093 1,514 6,6072009 49 12 61 3,831 425 4,256 5,703 1,632 7,335
Sexually Transm
itted Diseases 2009
Indian Health S
urveillance Report
66
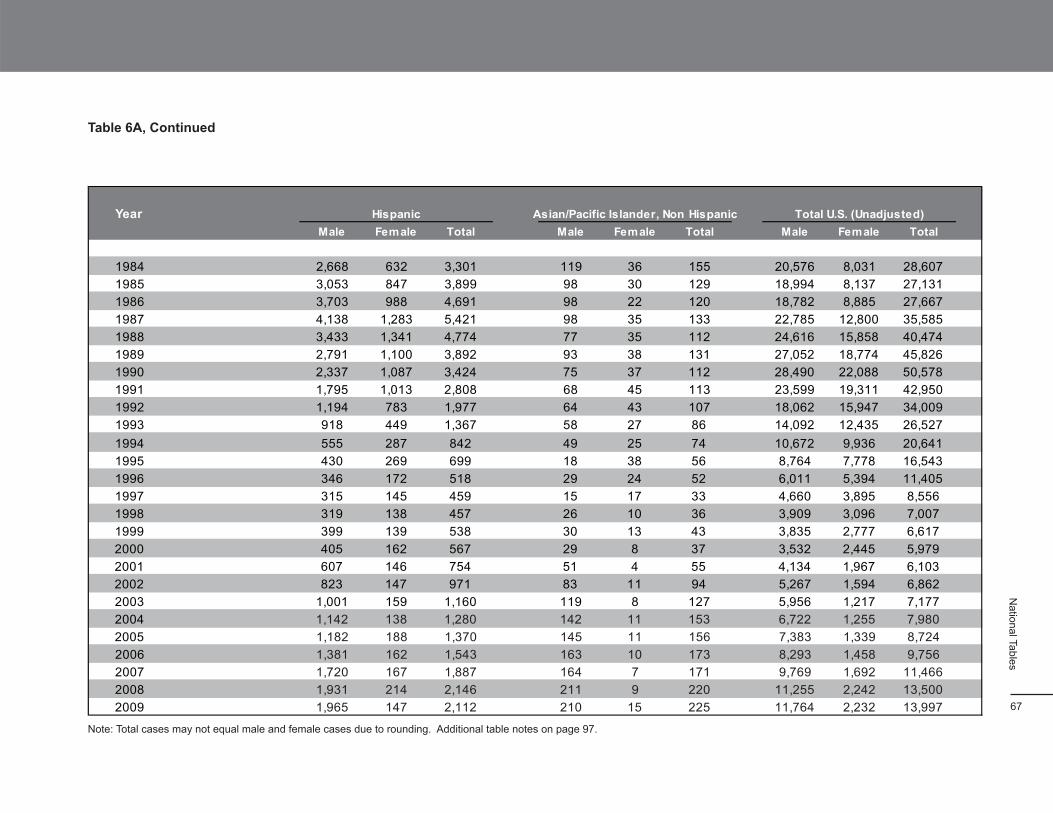
-
Table 6A, Continued
Year Male Fem ale
Hispanic Total
Asian/Pacific Islander, Non Hispanic Male Female Total Male Fem ale Total
Total U.S. (Unadjusted)
1984 2,668 632 3,301 119 36 155 20,576 8,031 28,607
1985 3,053 847 3,899 98 30 129 18,994 8,137 27,131
1986 3,703 988 4,691 98 22 120 18,782 8,885 27,667
1987 4,138 1,283 5,421 98 35 133 22,785 12,800 35,585
1988 3,433 1,341 4,774 77 35 112 24,616 15,858 40,474
1989 2,791 1,100 3,892 93 38 131 27,052 18,774 45,826
1990 2,337 1,087 3,424 75 37 112 28,490 22,088 50,578
1991 1,795 1,013 2,808 68 45 113 23,599 19,311 42,950
1992 1,194 783 1,977 64 43 107 18,062 15,947 34,009
1993 918 449 1,367 58 27 86 14,092 12,435 26,527
1994 555 287 842 49 25 74 10,672 9,936 20,641
1995 430 269 699 18 38 56 8,764 7,778 16,543
1996 346 172 518 29 24 52 6,011 5,394 11,405
1997 315 145 459 15 17 33 4,660 3,895 8,556
1998 319 138 457 26 10 36 3,909 3,096 7,007
1999 399 139 538 30 13 43 3,835 2,777 6,617
2000 405 162 567 29 8 37 3,532 2,445 5,979
2001 607 146 754 51 4 55 4,134 1,967 6,103
2002 823 147 971 83 11 94 5,267 1,594 6,862
2003 1,001 159 1,160 119 8 127 5,956 1,217 7,177
2004 1,142 138 1,280 142 11 153 6,722 1,255 7,980
2005 1,182 188 1,370 145 11 156 7,383 1,339 8,724
2006 1,381 162 1,543 163 10 173 8,293 1,458 9,756
2007 1,720 167 1,887 164 7 171 9,769 1,692 11,466
2008 1,931 214 2,146 211 9 220 11,255 2,242 13,500
2009 1,965 147 2,112 210 15 225 11,764 2,232 13,997
National Tables
Note: Total cases may not equal male and female cases due to rounding. Additional table notes on page 97.
67
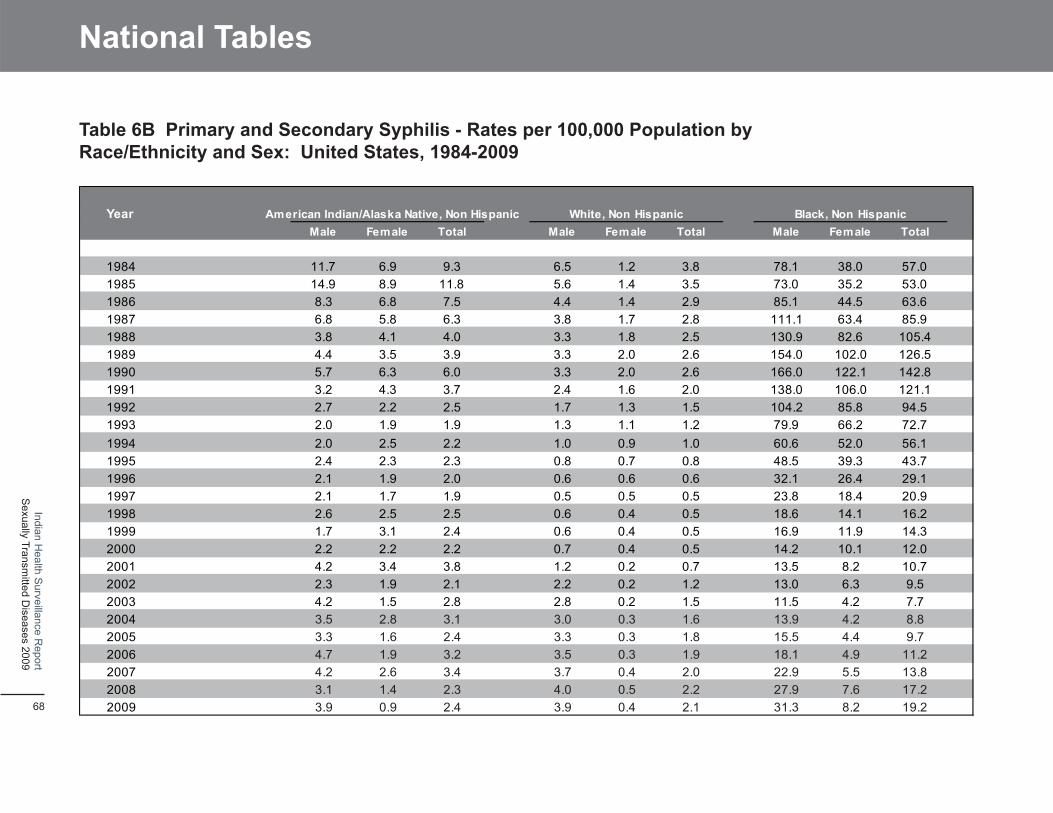
- -
National Tables
Table 6B Primary and Secondary Syphilis - Rates per 100,000 Population by Race/Ethnicity and Sex: United States, 1984-2009
Year American Indian/Alaska Native, Non Hispanic White, Non Hispanic Black, Non Hispanic Male Fem ale Total Male Female Total Male Fem ale Total
1984 11.7 6.9 9.3 6.5 1.2 3.8 78.1 38.0 57.0
1985 14.9 8.9 11.8 5.6 1.4 3.5 73.0 35.2 53.0
1986 8.3 6.8 7.5 4.4 1.4 2.9 85.1 44.5 63.6
1987 6.8 5.8 6.3 3.8 1.7 2.8 111.1 63.4 85.9
1988 3.8 4.1 4.0 3.3 1.8 2.5 130.9 82.6 105.4
1989 4.4 3.5 3.9 3.3 2.0 2.6 154.0 102.0 126.5
1990 5.7 6.3 6.0 3.3 2.0 2.6 166.0 122.1 142.8
1991 3.2 4.3 3.7 2.4 1.6 2.0 138.0 106.0 121.1
1992 2.7 2.2 2.5 1.7 1.3 1.5 104.2 85.8 94.5
1993 2.0 1.9 1.9 1.3 1.1 1.2 79.9 66.2 72.7
1994 2.0 2.5 2.2 1.0 0.9 1.0 60.6 52.0 56.1
1995 2.4 2.3 2.3 0.8 0.7 0.8 48.5 39.3 43.7
1996 2.1 1.9 2.0 0.6 0.6 0.6 32.1 26.4 29.1
1997 2.1 1.7 1.9 0.5 0.5 0.5 23.8 18.4 20.9
1998 2.6 2.5 2.5 0.6 0.4 0.5 18.6 14.1 16.2
1999 1.7 3.1 2.4 0.6 0.4 0.5 16.9 11.9 14.3
2000 2.2 2.2 2.2 0.7 0.4 0.5 14.2 10.1 12.0
2001 4.2 3.4 3.8 1.2 0.2 0.7 13.5 8.2 10.7
2002 2.3 1.9 2.1 2.2 0.2 1.2 13.0 6.3 9.5
2003 4.2 1.5 2.8 2.8 0.2 1.5 11.5 4.2 7.7
2004 3.5 2.8 3.1 3.0 0.3 1.6 13.9 4.2 8.8
2005 3.3 1.6 2.4 3.3 0.3 1.8 15.5 4.4 9.7
2006 4.7 1.9 3.2 3.5 0.3 1.9 18.1 4.9 11.2
2007 4.2 2.6 3.4 3.7 0.4 2.0 22.9 5.5 13.8
2008 3.1 1.4 2.3 4.0 0.5 2.2 27.9 7.6 17.2
2009 3.9 0.9 2.4 3.9 0.4 2.1 31.3 8.2 19.2
Indian Health S
urveillance Report
Sexually Transm
itted Diseases 2009
68
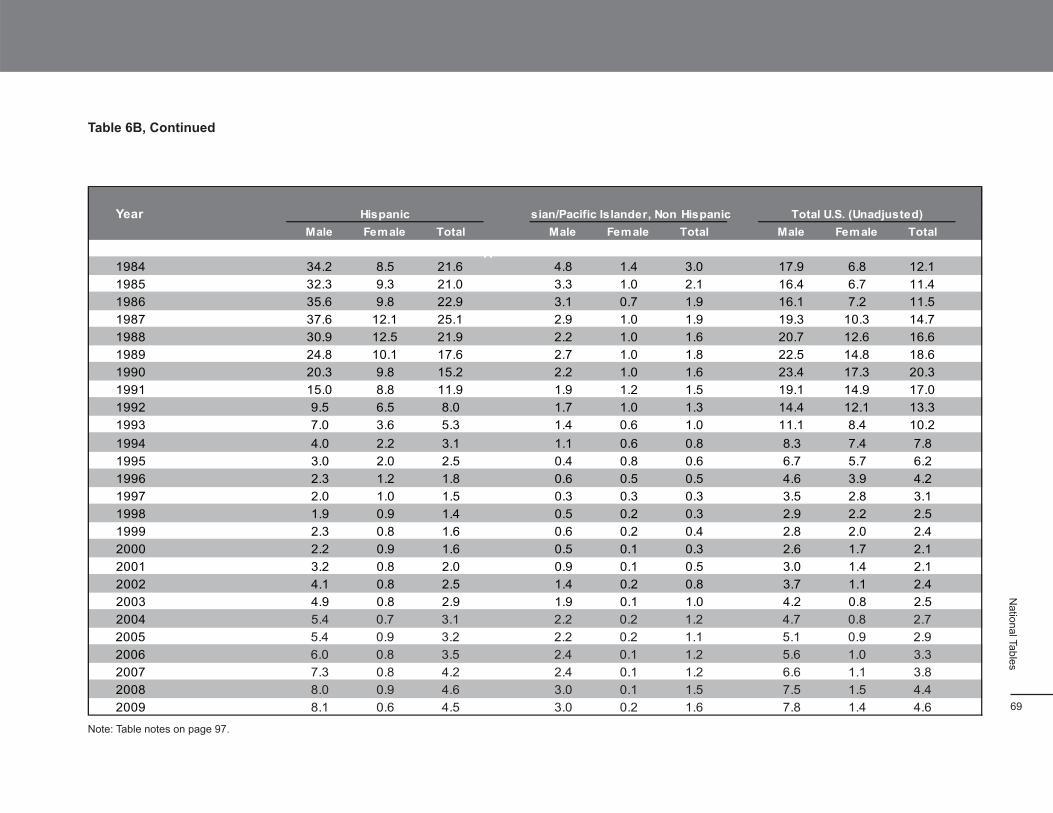
-
Table 6B, Continued
Year Hispanic
A
sian/Pacific Islander, Non Hispanic Total U.S. (Unadjusted) Male Female Total Male Female Total Male Female Total
1984 34.2 8.5 21.6 4.8 1.4 3.0 17.9 6.8 12.1
1985 32.3 9.3 21.0 3.3 1.0 2.1 16.4 6.7 11.4
1986 35.6 9.8 22.9 3.1 0.7 1.9 16.1 7.2 11.5
1987 37.6 12.1 25.1 2.9 1.0 1.9 19.3 10.3 14.7
1988 30.9 12.5 21.9 2.2 1.0 1.6 20.7 12.6 16.6
1989 24.8 10.1 17.6 2.7 1.0 1.8 22.5 14.8 18.6
1990 20.3 9.8 15.2 2.2 1.0 1.6 23.4 17.3 20.3
1991 15.0 8.8 11.9 1.9 1.2 1.5 19.1 14.9 17.0
1992 9.5 6.5 8.0 1.7 1.0 1.3 14.4 12.1 13.3
1993 7.0 3.6 5.3 1.4 0.6 1.0 11.1 8.4 10.2
1994 4.0 2.2 3.1 1.1 0.6 0.8 8.3 7.4 7.8
1995 3.0 2.0 2.5 0.4 0.8 0.6 6.7 5.7 6.2
1996 2.3 1.2 1.8 0.6 0.5 0.5 4.6 3.9 4.2
1997 2.0 1.0 1.5 0.3 0.3 0.3 3.5 2.8 3.1
1998 1.9 0.9 1.4 0.5 0.2 0.3 2.9 2.2 2.5
1999 2.3 0.8 1.6 0.6 0.2 0.4 2.8 2.0 2.4
2000 2.2 0.9 1.6 0.5 0.1 0.3 2.6 1.7 2.1
2001 3.2 0.8 2.0 0.9 0.1 0.5 3.0 1.4 2.1
2002 4.1 0.8 2.5 1.4 0.2 0.8 3.7 1.1 2.4
2003 4.9 0.8 2.9 1.9 0.1 1.0 4.2 0.8 2.5
2004 5.4 0.7 3.1 2.2 0.2 1.2 4.7 0.8 2.7
2005 5.4 0.9 3.2 2.2 0.2 1.1 5.1 0.9 2.9
2006 6.0 0.8 3.5 2.4 0.1 1.2 5.6 1.0 3.3
2007 7.3 0.8 4.2 2.4 0.1 1.2 6.6 1.1 3.8
2008 8.0 0.9 4.6 3.0 0.1 1.5 7.5 1.5 4.4
2009 8.1 0.6 4.5 3.0 0.2 1.6 7.8 1.4 4.6
National Tables
Note: Table notes on page 97.
69
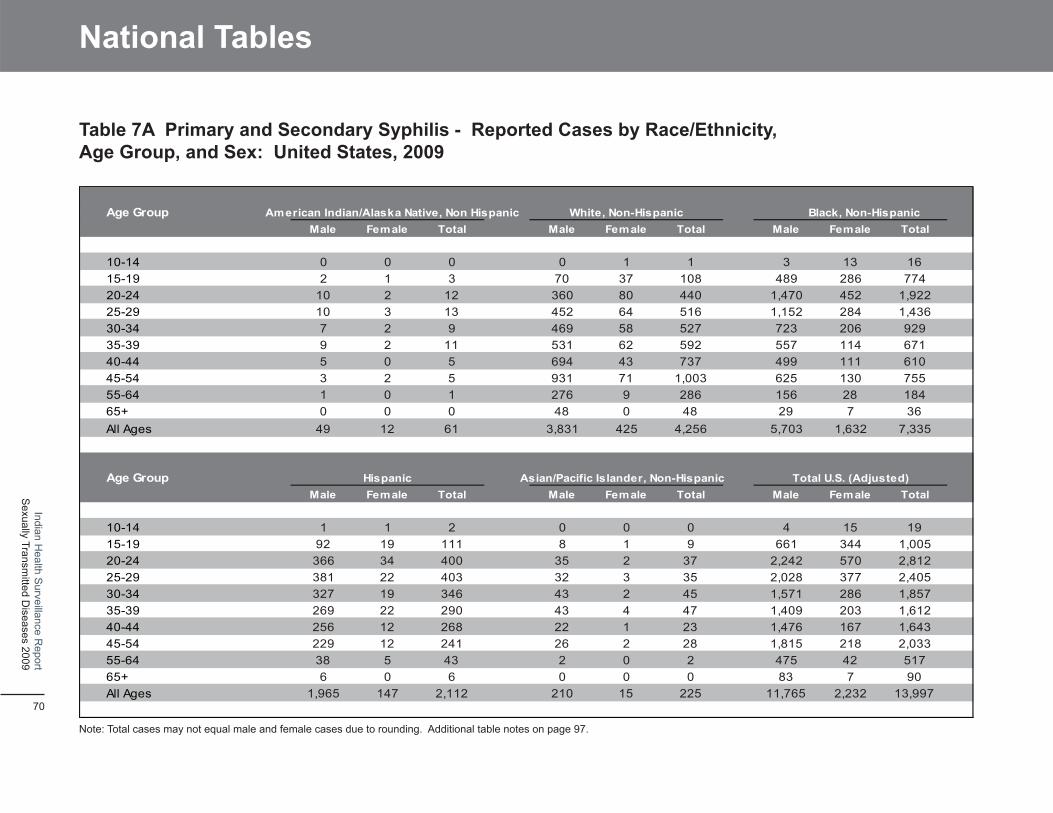
National Tables
Table 7A Primary and Secondary Syphilis - Reported Cases by Race/Ethnicity, Age Group, and Sex: United States, 2009
Age Group American Indian/Alaska Native, Non Hispanic White, Non-Hispanic Black, Non-HispanicMale Female Total Male Female Total Male Female Total
10-14 0 0 0 0 1 1 3 13 1615-19 2 1 3 70 37 108 489 286 77420-24 10 2 12 360 80 440 1,470 452 1,92225-29 10 3 13 452 64 516 1,152 284 1,43630-34 7 2 9 469 58 527 723 206 92935-39 9 2 11 531 62 592 557 114 67140-44 5 0 5 694 43 737 499 111 61045-54 3 2 5 931 71 1,003 625 130 75555-64 1 0 1 276 9 286 156 28 18465+ 0 0 0 48 0 48 29 7 36All Ages 49 12 61 3,831 425 4,256 5,703 1,632 7,335
Age Group Hispanic Asian/Pacific Islander, Non-HispanicMale Female Total
Total U.S. (Adjusted)Male Female TotalMale Female Total
10-14 1 1 2 0 0 0 4 15 1915-19 92 19 111 8 1 9 661 344 1,00520-24 366 34 400 35 2 37 2,242 570 2,81225-29 381 22 403 32 3 35 2,028 377 2,40530-34 327 19 346 43 2 45 1,571 286 1,85735-39 269 22 290 43 4 47 1,409 203 1,61240-44 256 12 268 22 1 23 1,476 167 1,64345-54 229 12 241 26 2 28 1,815 218 2,03355-64 38 5 43 2 0 2 475 42 51765+ 6 0 6 0 0 0 83 7 90All Ages 1,965 147 2,112 210 15 225 11,765 2,232 13,997
Note: Total cases may not equal male and female cases due to rounding. Additional table notes on page 97.
Sexually Transm
itted Diseases 2009
Indian Health S
urveillance Report
70
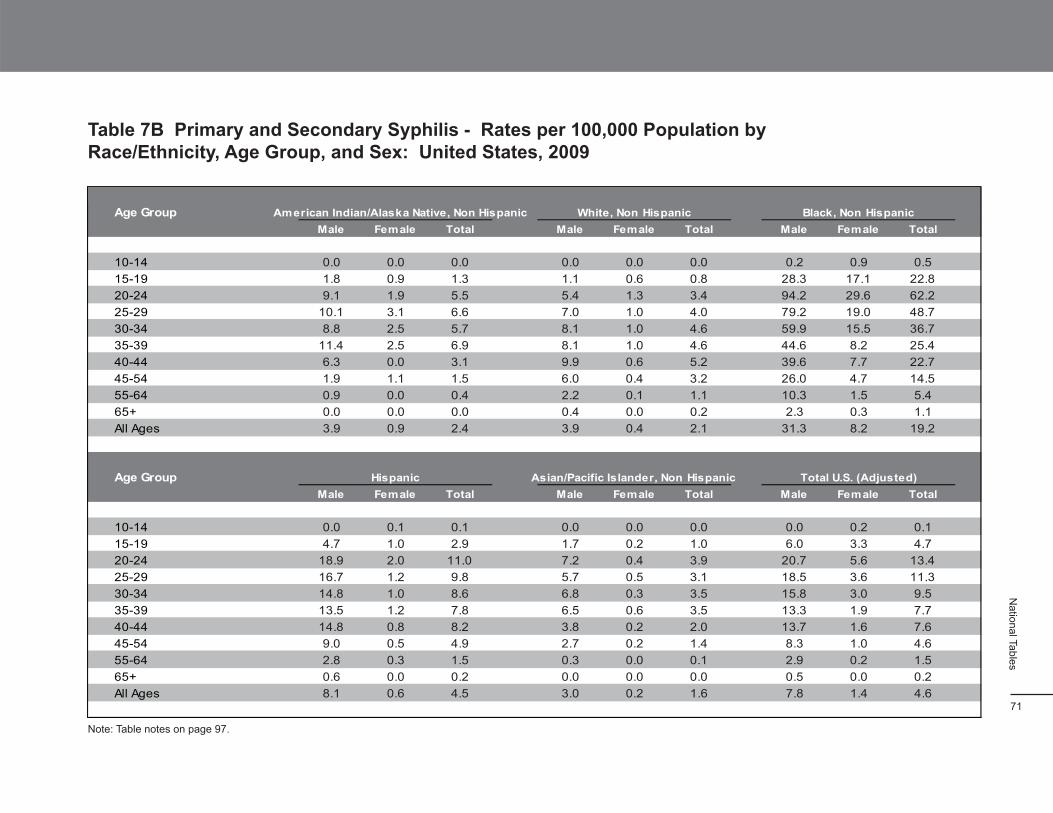
-
- -
Table 7B Primary and Secondary Syphilis - Rates per 100,000 Population by Race/Ethnicity, Age Group, and Sex: United States, 2009
Age Group American Indian/Alaska Native, Non Hispanic White, Non Hispanic Black, Non Hispanic Male Fem ale Total Male Female Total Male Female Total
10-14 0.0 0.0 0.0 0.0 0.0 0.0 0.2 0.9 0.5 15-19 1.8 0.9 1.3 1.1 0.6 0.8 28.3 17.1 22.8 20-24 9.1 1.9 5.5 5.4 1.3 3.4 94.2 29.6 62.2 25-29 10.1 3.1 6.6 7.0 1.0 4.0 79.2 19.0 48.7 30-34 8.8 2.5 5.7 8.1 1.0 4.6 59.9 15.5 36.7 35-39 11.4 2.5 6.9 8.1 1.0 4.6 44.6 8.2 25.4 40-44 6.3 0.0 3.1 9.9 0.6 5.2 39.6 7.7 22.7 45-54 1.9 1.1 1.5 6.0 0.4 3.2 26.0 4.7 14.5 55-64 0.9 0.0 0.4 2.2 0.1 1.1 10.3 1.5 5.4 65+ 0.0 0.0 0.0 0.4 0.0 0.2 2.3 0.3 1.1 All Ages 3.9 0.9 2.4 3.9 0.4 2.1 31.3 8.2 19.2
Age GroupMale Female Total
Hispanic Asian/Pacific Islander, Non Hispanic Male Female Total Male Fem ale Total
Total U.S. (Adjusted)
10-14 0.0 0.1 0.1 0.0 0.0 0.0 0.0 0.2 0.1 15-19 4.7 1.0 2.9 1.7 0.2 1.0 6.0 3.3 4.7 20-24 18.9 2.0 11.0 7.2 0.4 3.9 20.7 5.6 13.4 25-29 16.7 1.2 9.8 5.7 0.5 3.1 18.5 3.6 11.3 30-34 14.8 1.0 8.6 6.8 0.3 3.5 15.8 3.0 9.5 35-39 13.5 1.2 7.8 6.5 0.6 3.5 13.3 1.9 7.7 40-44 14.8 0.8 8.2 3.8 0.2 2.0 13.7 1.6 7.6 45-54 9.0 0.5 4.9 2.7 0.2 1.4 8.3 1.0 4.6 55-64 2.8 0.3 1.5 0.3 0.0 0.1 2.9 0.2 1.5 65+ 0.6 0.0 0.2 0.0 0.0 0.0 0.5 0.0 0.2 All Ages 8.1 0.6 4.5 3.0 0.2 1.6 7.8 1.4 4.6
National Tables
Note: Table notes on page 97.
71
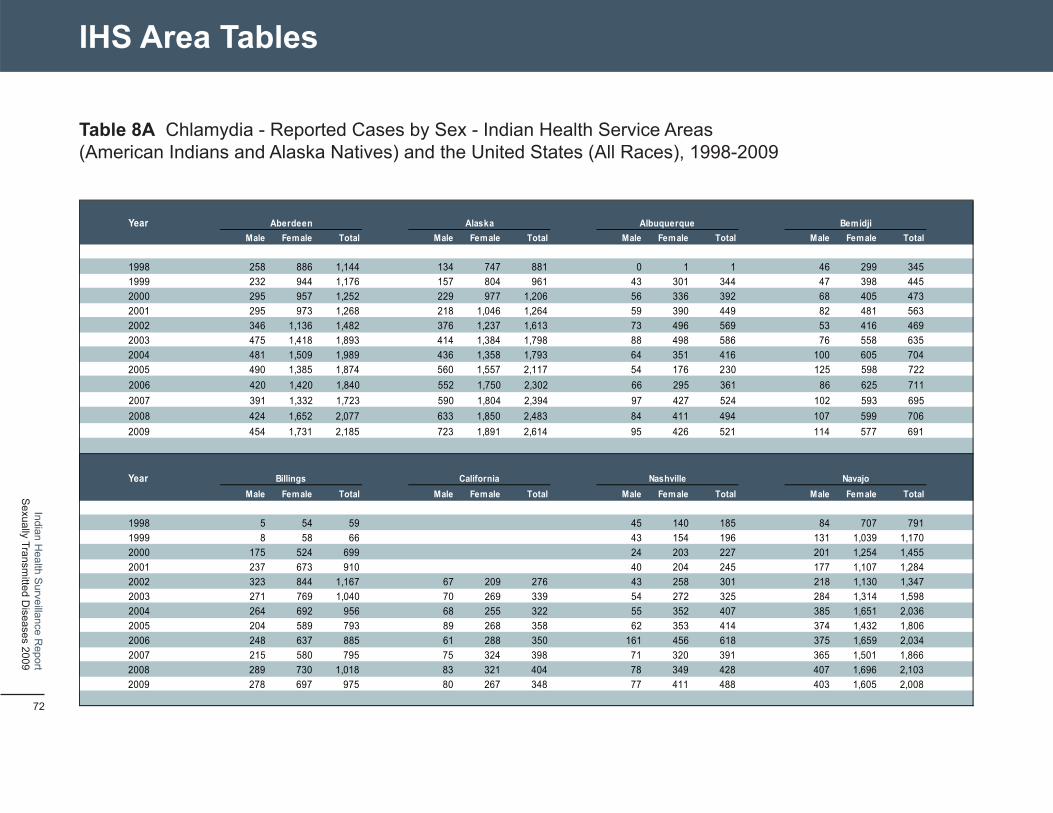
IHS Area Tables
Table 8A Chlamydia - Reported Cases by Sex - Indian Health Service Areas (American Indians and Alaska Natives) and the United States (All Races), 1998-2009
Year
Male Fem ale
Aberdeen
Total Male Fem ale
Alaska
Total Male Fem ale
Albuquerque
Total Male Fem ale
Bem idji Total
1998 258 886 1,144 134 747 881 0 1 1 46 299 345
1999 232 944 1,176 157 804 961 43 301 344 47 398 445
2000 295 957 1,252 229 977 1,206 56 336 392 68 405 473
2001 295 973 1,268 218 1,046 1,264 59 390 449 82 481 563
2002 346 1,136 1,482 376 1,237 1,613 73 496 569 53 416 469
2003 475 1,418 1,893 414 1,384 1,798 88 498 586 76 558 635
2004 481 1,509 1,989 436 1,358 1,793 64 351 416 100 605 704
2005 490 1,385 1,874 560 1,557 2,117 54 176 230 125 598 722
2006 420 1,420 1,840 552 1,750 2,302 66 295 361 86 625 711
2007 391 1,332 1,723 590 1,804 2,394 97 427 524 102 593 695
2008 424 1,652 2,077 633 1,850 2,483 84 411 494 107 599 706
2009 454 1,731 2,185 723 1,891 2,614 95 426 521 114 577 691
Year
Male Fem ale
Billings
Total Male Fem ale
California
Total Male Fem ale
Nashville
Total Male Fem ale
Navajo
Total
1998 5 54 59 45 140 185 84 707 791
1999 8 58 66 43 154 196 131 1,039 1,170
2000 175 524 699 24 203 227 201 1,254 1,455
2001 237 673 910 40 204 245 177 1,107 1,284
2002 323 844 1,167 67 209 276 43 258 301 218 1,130 1,347
2003 271 769 1,040 70 269 339 54 272 325 284 1,314 1,598
2004 264 692 956 68 255 322 55 352 407 385 1,651 2,036
2005 204 589 793 89 268 358 62 353 414 374 1,432 1,806
2006 248 637 885 61 288 350 161 456 618 375 1,659 2,034
2007 215 580 795 75 324 398 71 320 391 365 1,501 1,866
2008 289 730 1,018 83 321 404 78 349 428 407 1,696 2,103
2009 278 697 975 80 267 348 77 411 488 403 1,605 2,008
Indian Health S
urveillance Report
Sexually Transm
itted Diseases 2009
72
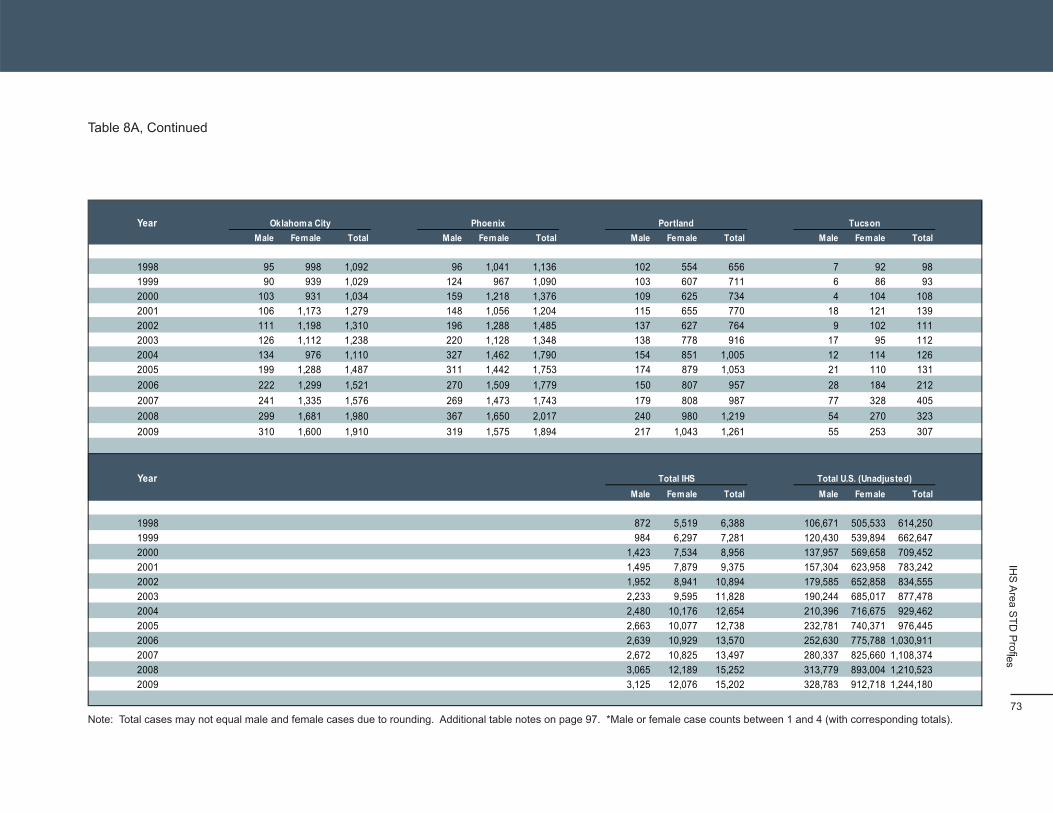
Table 8A, Continued
Year Male Female
Oklahoma City Total Male Female
Phoenix Total Male Female
Portland Total Male Female Total
Tucson
1998 95 998 1,092 96 1,041 1,136 102 554 656 7 92 98
1999 90 939 1,029 124 967 1,090 103 607 711 6 86 93
2000 103 931 1,034 159 1,218 1,376 109 625 734 4 104 108
2001 106 1,173 1,279 148 1,056 1,204 115 655 770 18 121 139
2002 111 1,198 1,310 196 1,288 1,485 137 627 764 9 102 111
2003 126 1,112 1,238 220 1,128 1,348 138 778 916 17 95 112
2004 134 976 1,110 327 1,462 1,790 154 851 1,005 12 114 126
2005 199 1,288 1,487 311 1,442 1,753 174 879 1,053 21 110 131
2006 222 1,299 1,521 270 1,509 1,779 150 807 957 28 184 212
2007 241 1,335 1,576 269 1,473 1,743 179 808 987 77 328 405
2008 299 1,681 1,980 367 1,650 2,017 240 980 1,219 54 270 323
2009 310 1,600 1,910 319 1,575 1,894 217 1,043 1,261 55 253 307
Year Male Female
Total IHS Total Male Female Total
Total U.S. (Unadjusted)
1998 872 5,519 6,388 106,671 505,533 614,250
1999 984 6,297 7,281 120,430 539,894 662,647
2000 1,423 7,534 8,956 137,957 569,658 709,452
2001 1,495 7,879 9,375 157,304 623,958 783,242
2002 1,952 8,941 10,894 179,585 652,858 834,555
2003 2,233 9,595 11,828 190,244 685,017 877,478
2004 2,480 10,176 12,654 210,396 716,675 929,462
2005 2,663 10,077 12,738 232,781 740,371 976,445
2006 2,639 10,929 13,570 252,630 775,788 1,030,911
2007 2,672 10,825 13,497 280,337 825,660 1,108,374
2008 3,065 12,189 15,252 313,779 893,004 1,210,523
2009 3,125 12,076 15,202 328,783 912,718 1,244,180
IHS
Area S
TD P
rofiles
Note: Total cases may not equal male and female cases due to rounding. Additional table notes on page 97. *Male or female case counts between 1 and 4 (with corresponding totals). 73
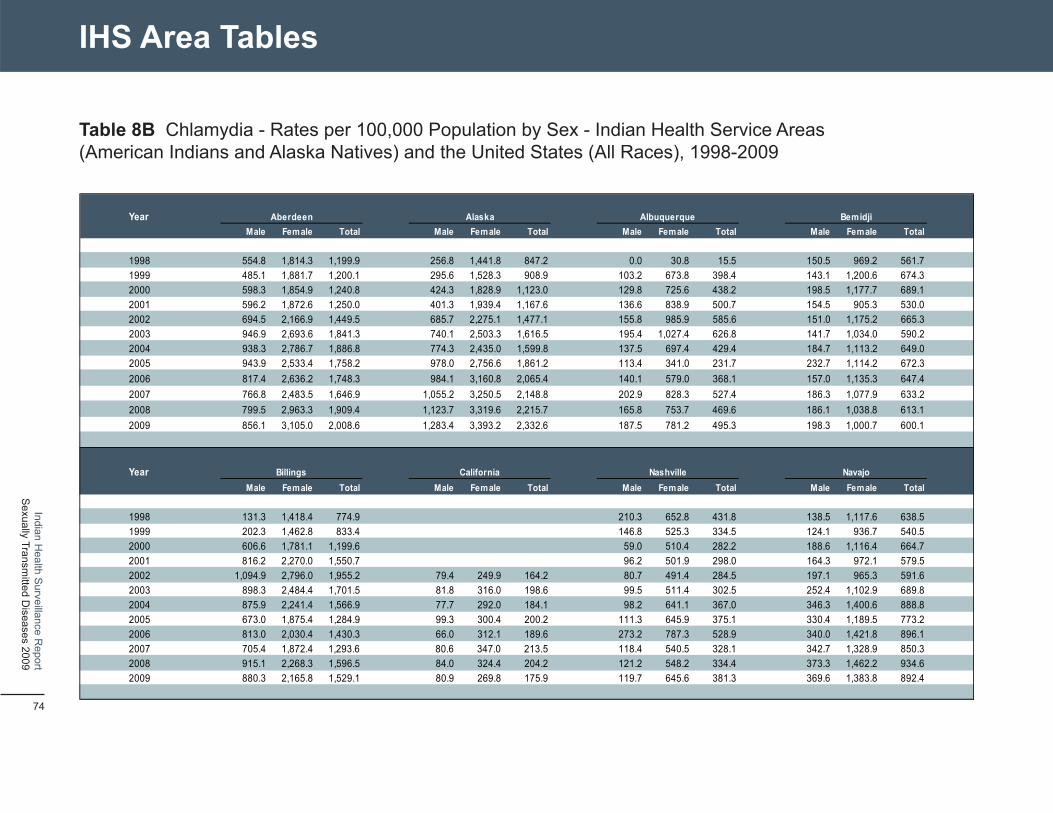
IHS Area Tables
Table 8B Chlamydia - Rates per 100,000 Population by Sex - Indian Health Service Areas (American Indians and Alaska Natives) and the United States (All Races), 1998-2009
Year
Male Fem ale
Aberdeen
Total Male Fem ale
Alaska
Total Male Fem ale
Albuquerque
Total Male Fem ale
Bemidji Total
1998 554.8 1,814.3 1,199.9 256.8 1,441.8 847.2 0.0 30.8 15.5 150.5 969.2 561.7
1999 485.1 1,881.7 1,200.1 295.6 1,528.3 908.9 103.2 673.8 398.4 143.1 1,200.6 674.3
2000 598.3 1,854.9 1,240.8 424.3 1,828.9 1,123.0 129.8 725.6 438.2 198.5 1,177.7 689.1
2001 596.2 1,872.6 1,250.0 401.3 1,939.4 1,167.6 136.6 838.9 500.7 154.5 905.3 530.0
2002 694.5 2,166.9 1,449.5 685.7 2,275.1 1,477.1 155.8 985.9 585.6 151.0 1,175.2 665.3
2003 946.9 2,693.6 1,841.3 740.1 2,503.3 1,616.5 195.4 1,027.4 626.8 141.7 1,034.0 590.2
2004 938.3 2,786.7 1,886.8 774.3 2,435.0 1,599.8 137.5 697.4 429.4 184.7 1,113.2 649.0
2005 943.9 2,533.4 1,758.2 978.0 2,756.6 1,861.2 113.4 341.0 231.7 232.7 1,114.2 672.3
2006 817.4 2,636.2 1,748.3 984.1 3,160.8 2,065.4 140.1 579.0 368.1 157.0 1,135.3 647.4
2007 766.8 2,483.5 1,646.9 1,055.2 3,250.5 2,148.8 202.9 828.3 527.4 186.3 1,077.9 633.2
2008 799.5 2,963.3 1,909.4 1,123.7 3,319.6 2,215.7 165.8 753.7 469.6 186.1 1,038.8 613.1
2009 856.1 3,105.0 2,008.6 1,283.4 3,393.2 2,332.6 187.5 781.2 495.3 198.3 1,000.7 600.1
Year
Male Fem ale
Billings
Total Male Fem ale
California
Total Male Fem ale
Nashville
Total Male Fem ale
Navajo
Total
1998 131.3 1,418.4 774.9 210.3 652.8 431.8 138.5 1,117.6 638.5
1999 202.3 1,462.8 833.4 146.8 525.3 334.5 124.1 936.7 540.5
2000 606.6 1,781.1 1,199.6 59.0 510.4 282.2 188.6 1,116.4 664.7
2001 816.2 2,270.0 1,550.7 96.2 501.9 298.0 164.3 972.1 579.5
2002 1,094.9 2,796.0 1,955.2 79.4 249.9 164.2 80.7 491.4 284.5 197.1 965.3 591.6
2003 898.3 2,484.4 1,701.5 81.8 316.0 198.6 99.5 511.4 302.5 252.4 1,102.9 689.8
2004 875.9 2,241.4 1,566.9 77.7 292.0 184.1 98.2 641.1 367.0 346.3 1,400.6 888.8
2005 673.0 1,875.4 1,284.9 99.3 300.4 200.2 111.3 645.9 375.1 330.4 1,189.5 773.2
2006 813.0 2,030.4 1,430.3 66.0 312.1 189.6 273.2 787.3 528.9 340.0 1,421.8 896.1
2007 705.4 1,872.4 1,293.6 80.6 347.0 213.5 118.4 540.5 328.1 342.7 1,328.9 850.3
2008 915.1 2,268.3 1,596.5 84.0 324.4 204.2 121.2 548.2 334.4 373.3 1,462.2 934.6
2009 880.3 2,165.8 1,529.1 80.9 269.8 175.9 119.7 645.6 381.3 369.6 1,383.8 892.4
Indian Health S
urveillance Report
Sexually Transm
itted Diseases 2009
74

Table 8B, Continued
Year Male Female
Oklahoma City Total Male Female
Phoenix Total Male Female
Portland Total Male Female Total
Tucson
1998 63.1 639.4 356.1 121.8 1,281.4 709.9 123.0 660.3 393.2 46.1 576.7 314.7
1999 58.5 588.2 328.1 151.2 1,146.7 655.3 121.1 704.4 415.3 38.4 524.2 290.4
2000 66.1 576.6 325.8 186.8 1,390.2 796.7 125.6 711.2 420.2 24.7 612.1 325.5
2001 67.8 725.1 402.1 166.4 1,151.0 666.2 131.2 738.8 436.8 106.8 681.2 401.5
2002 70.5 736.0 409.2 208.4 1,323.7 776.0 155.1 701.8 430.0 52.1 559.0 312.6
2003 79.8 680.8 385.4 226.6 1,121.1 681.9 154.6 862.1 510.2 95.9 511.2 308.5
2004 84.0 590.8 341.8 337.3 1,459.9 908.2 171.3 940.8 557.3 69.5 633.7 357.4
2005 123.6 770.7 453.1 307.0 1,376.7 850.9 191.0 961.3 576.8 116.4 586.5 356.0
2006 138.2 775.5 463.5 268.3 1,447.2 868.2 163.9 879.5 522.2 159.0 998.8 588.3
2007 151.0 805.5 484.4 254.2 1,344.9 809.4 194.3 870.1 533.5 435.9 1,771.6 1,119.4
2008 182.1 987.2 592.0 318.6 1,389.5 862.2 243.2 987.4 615.8 273.4 1,307.9 799.7
2009 188.8 939.6 571.1 276.9 1,326.3 809.6 219.9 1,050.9 637.0 278.5 1,225.6 760.1
Year Male Female
Total IHS Total Male Female Total
Total U.S. (Unadjusted)
1998 159.8 984.8 577.5 82.2 374.1 231.8
1999 151.2 938.0 550.7 91.6 395.1 247.2
2000 203.1 1,044.7 629.8 99.6 396.3 251.4
2001 205.3 1,051.1 634.4 112.3 429.6 274.5
2002 237.6 1,059.9 654.3 126.8 445.0 289.4
2003 263.0 1,100.9 687.4 133.0 463.6 301.7
2004 289.5 1,157.2 728.9 145.6 480.6 316.3
2005 305.8 1,127.0 721.7 159.4 492.2 329.4
2006 302.7 1,220.5 767.8 171.3 510.8 344.3
2007 305.5 1,204.3 761.0 188.6 539.8 367.5
2008 333.5 1,292.1 818.9 209.3 579.4 398.1
2009 340.0 1,280.1 816.2 219.3 592.2 409.2
IHS
Area S
TD P
rofiles
Note: Table notes on page 97. 75
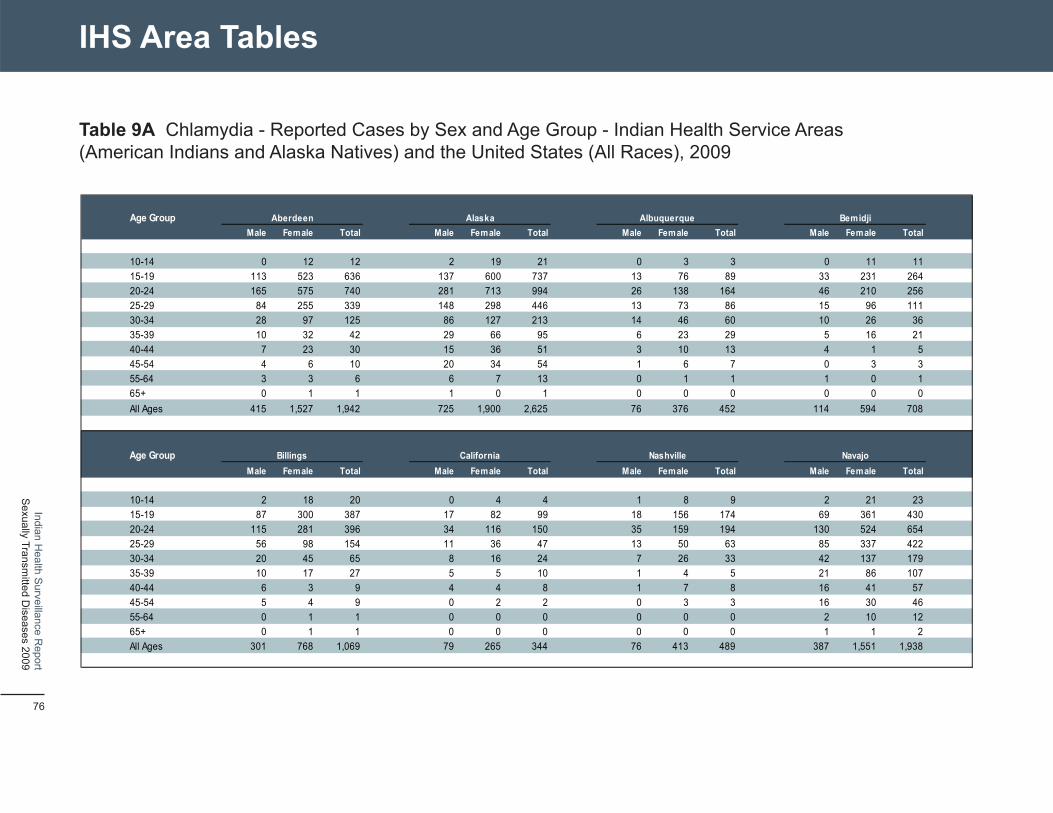
IHS Area Tables
Table 9A Chlamydia - Reported Cases by Sex and Age Group - Indian Health Service Areas (American Indians and Alaska Natives) and the United States (All Races), 2009
Age Group Male Female
Aberdeen Total Male Female
Alaska Total Male Fem ale
Albuquerque Total Male Female
Bemidji Total
10-14 0 12 12 2 19 21 0 3 3 0 11 11 15-19 113 523 636 137 600 737 13 76 89 33 231 264 20-24 165 575 740 281 713 994 26 138 164 46 210 256 25-29 84 255 339 148 298 446 13 73 86 15 96 111 30-34 28 97 125 86 127 213 14 46 60 10 26 36 35-39 10 32 42 29 66 95 6 23 29 5 16 21 40-44 7 23 30 15 36 51 3 10 13 4 1 5 45-54 4 6 10 20 34 54 1 6 7 0 3 3 55-64 3 3 6 6 7 13 0 1 1 1 0 1 65+ 0 1 1 1 0 1 0 0 0 0 0 0 All Ages 415 1,527 1,942 725 1,900 2,625 76 376 452 114 594 708
Age Group Male Female
Billings Total Male Female
California Total Male Female
Nashville Total Male Female
Navajo Total
10-14 2 18 20 0 4 4 1 8 9 2 21 23 15-19 87 300 387 17 82 99 18 156 174 69 361 430 20-24 115 281 396 34 116 150 35 159 194 130 524 654 25-29 56 98 154 11 36 47 13 50 63 85 337 422 30-34 20 45 65 8 16 24 7 26 33 42 137 179 35-39 10 17 27 5 5 10 1 4 5 21 86 107 40-44 6 3 9 4 4 8 1 7 8 16 41 57 45-54 5 4 9 0 2 2 0 3 3 16 30 46 55-64 0 1 1 0 0 0 0 0 0 2 10 12 65+ 0 1 1 0 0 0 0 0 0 1 1 2 All Ages 301 768 1,069 79 265 344 76 413 489 387 1,551 1,938
Indian Health S
urveillance Report
Sexually Transm
itted Diseases 2009
76
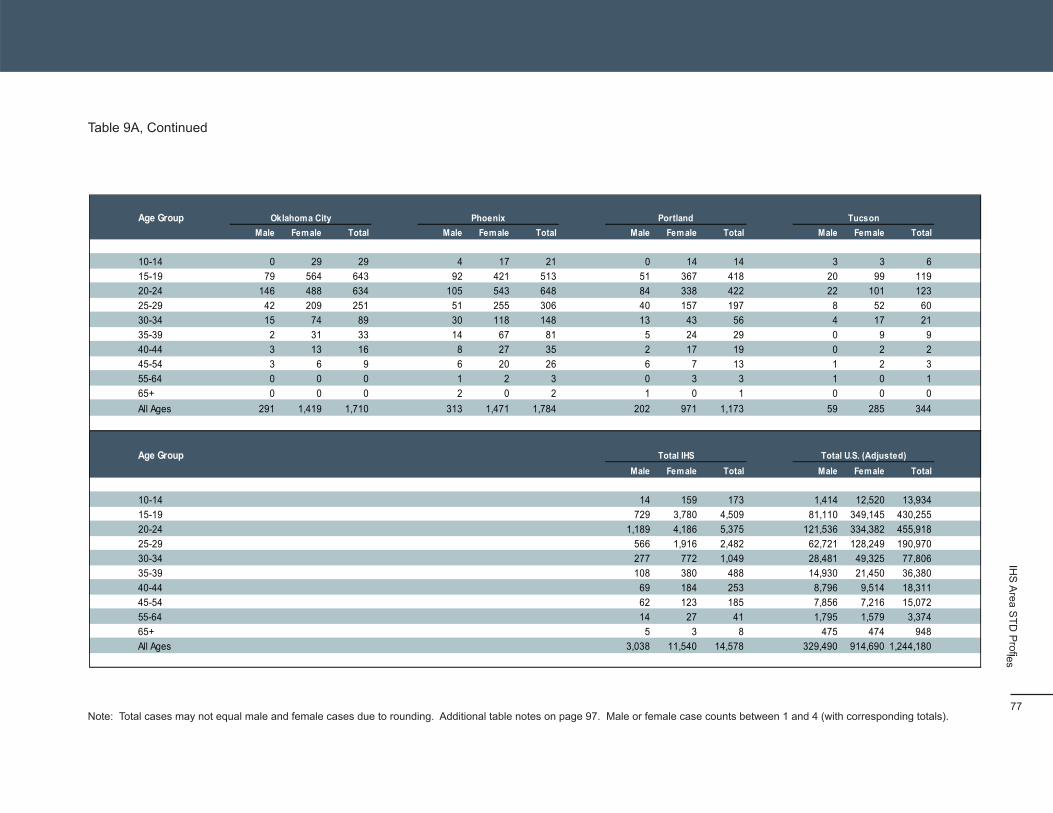
Table 9A, Continued
Age Group Male Female
Oklahoma City Total Male Female
Phoenix Total Male Female
Portland Total Male Female Total
Tucson
10-14 0 29 29 4 17 21 0 14 14 3 3 6 15-19 79 564 643 92 421 513 51 367 418 20 99 119 20-24 146 488 634 105 543 648 84 338 422 22 101 123 25-29 42 209 251 51 255 306 40 157 197 8 52 60 30-34 15 74 89 30 118 148 13 43 56 4 17 21 35-39 2 31 33 14 67 81 5 24 29 0 9 9 40-44 3 13 16 8 27 35 2 17 19 0 2 2 45-54 3 6 9 6 20 26 6 7 13 1 2 3 55-64 0 0 0 1 2 3 0 3 3 1 0 1 65+ 0 0 0 2 0 2 1 0 1 0 0 0 All Ages 291 1,419 1,710 313 1,471 1,784 202 971 1,173 59 285 344
Age Group Male Female
Total IHS Total Male Female Total
Total U.S. (Adjusted)
10-14 14 159 173 1,414 12,520 13,934 15-19 729 3,780 4,509 81,110 349,145 430,255 20-24 1,189 4,186 5,375 121,536 334,382 455,918 25-29 566 1,916 2,482 62,721 128,249 190,970 30-34 277 772 1,049 28,481 49,325 77,806 35-39 108 380 488 14,930 21,450 36,380 40-44 69 184 253 8,796 9,514 18,311 45-54 62 123 185 7,856 7,216 15,072 55-64 14 27 41 1,795 1,579 3,374 65+ 5 3 8 475 474 948 All Ages 3,038 11,540 14,578 329,490 914,690 1,244,180
IHS
Area S
TD P
rofiles
Note: Total cases may not equal male and female cases due to rounding. Additional table notes on page 97. Male or female case counts between 1 and 4 (with corresponding totals). 77
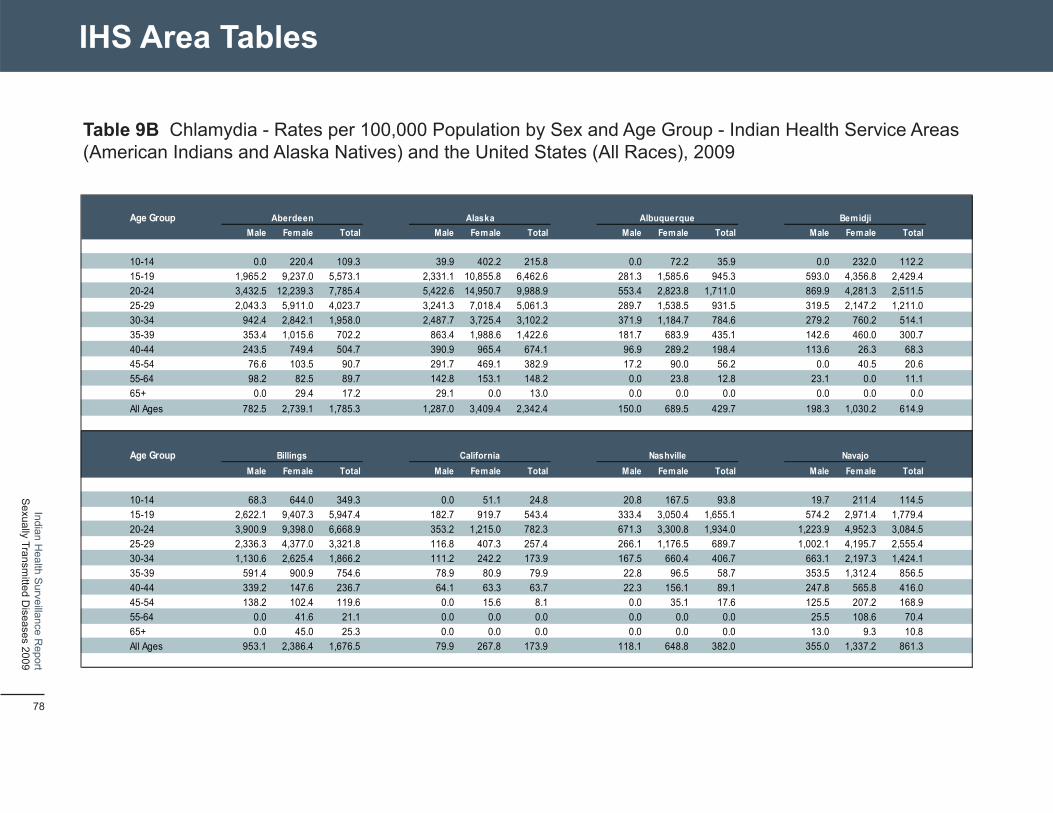
IHS Area Tables
Table 9B Chlamydia - Rates per 100,000 Population by Sex and Age Group - Indian Health Service Areas (American Indians and Alaska Natives) and the United States (All Races), 2009
Age Group Male Female
Aberdeen Total Male Female
Alaska Total Male Fem ale
Albuquerque Total Male Female
Bemidji Total
10-14 0.0 220.4 109.3 39.9 402.2 215.8 0.0 72.2 35.9 0.0 232.0 112.2 15-19 1,965.2 9,237.0 5,573.1 2,331.1 10,855.8 6,462.6 281.3 1,585.6 945.3 593.0 4,356.8 2,429.4 20-24 3,432.5 12,239.3 7,785.4 5,422.6 14,950.7 9,988.9 553.4 2,823.8 1,711.0 869.9 4,281.3 2,511.5 25-29 2,043.3 5,911.0 4,023.7 3,241.3 7,018.4 5,061.3 289.7 1,538.5 931.5 319.5 2,147.2 1,211.0 30-34 942.4 2,842.1 1,958.0 2,487.7 3,725.4 3,102.2 371.9 1,184.7 784.6 279.2 760.2 514.1 35-39 353.4 1,015.6 702.2 863.4 1,988.6 1,422.6 181.7 683.9 435.1 142.6 460.0 300.7 40-44 243.5 749.4 504.7 390.9 965.4 674.1 96.9 289.2 198.4 113.6 26.3 68.3 45-54 76.6 103.5 90.7 291.7 469.1 382.9 17.2 90.0 56.2 0.0 40.5 20.6 55-64 98.2 82.5 89.7 142.8 153.1 148.2 0.0 23.8 12.8 23.1 0.0 11.1 65+ 0.0 29.4 17.2 29.1 0.0 13.0 0.0 0.0 0.0 0.0 0.0 0.0 All Ages 782.5 2,739.1 1,785.3 1,287.0 3,409.4 2,342.4 150.0 689.5 429.7 198.3 1,030.2 614.9
Age Group Male Female
Billings Total Male Female
California Total Male Fem ale
Nashville Total Male Female
Navajo Total
10-14 68.3 644.0 349.3 0.0 51.1 24.8 20.8 167.5 93.8 19.7 211.4 114.5 15-19 2,622.1 9,407.3 5,947.4 182.7 919.7 543.4 333.4 3,050.4 1,655.1 574.2 2,971.4 1,779.4 20-24 3,900.9 9,398.0 6,668.9 353.2 1,215.0 782.3 671.3 3,300.8 1,934.0 1,223.9 4,952.3 3,084.5 25-29 2,336.3 4,377.0 3,321.8 116.8 407.3 257.4 266.1 1,176.5 689.7 1,002.1 4,195.7 2,555.4 30-34 1,130.6 2,625.4 1,866.2 111.2 242.2 173.9 167.5 660.4 406.7 663.1 2,197.3 1,424.1 35-39 591.4 900.9 754.6 78.9 80.9 79.9 22.8 96.5 58.7 353.5 1,312.4 856.5 40-44 339.2 147.6 236.7 64.1 63.3 63.7 22.3 156.1 89.1 247.8 565.8 416.0 45-54 138.2 102.4 119.6 0.0 15.6 8.1 0.0 35.1 17.6 125.5 207.2 168.9 55-64 0.0 41.6 21.1 0.0 0.0 0.0 0.0 0.0 0.0 25.5 108.6 70.4 65+ 0.0 45.0 25.3 0.0 0.0 0.0 0.0 0.0 0.0 13.0 9.3 10.8 All Ages 953.1 2,386.4 1,676.5 79.9 267.8 173.9 118.1 648.8 382.0 355.0 1,337.2 861.3
Indian Health S
urveillance Report
Sexually Transm
itted Diseases 2009
78
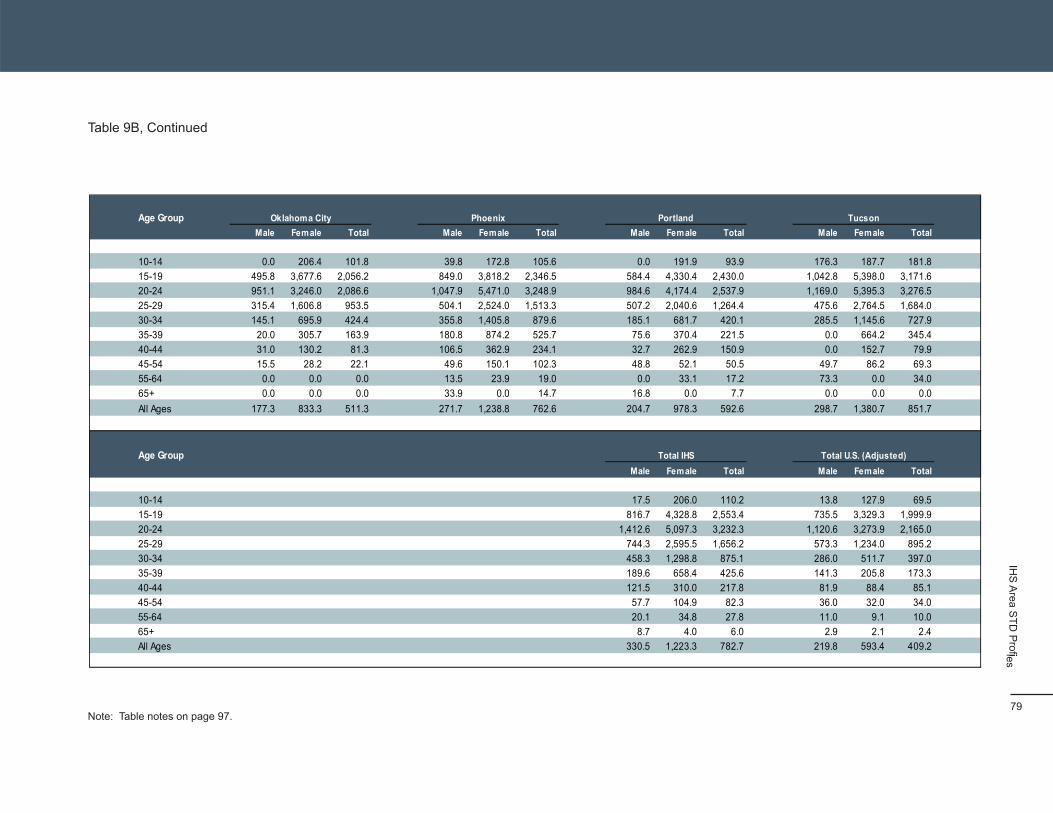
Table 9B, Continued
Age Group Male Female
Oklahoma City Total Male Female
Phoenix Total Male Female
Portland Total Male Female Total
Tucson
10-14 0.0 206.4 101.8 39.8 172.8 105.6 0.0 191.9 93.9 176.3 187.7 181.8 15-19 495.8 3,677.6 2,056.2 849.0 3,818.2 2,346.5 584.4 4,330.4 2,430.0 1,042.8 5,398.0 3,171.6 20-24 951.1 3,246.0 2,086.6 1,047.9 5,471.0 3,248.9 984.6 4,174.4 2,537.9 1,169.0 5,395.3 3,276.5 25-29 315.4 1,606.8 953.5 504.1 2,524.0 1,513.3 507.2 2,040.6 1,264.4 475.6 2,764.5 1,684.0 30-34 145.1 695.9 424.4 355.8 1,405.8 879.6 185.1 681.7 420.1 285.5 1,145.6 727.9 35-39 20.0 305.7 163.9 180.8 874.2 525.7 75.6 370.4 221.5 0.0 664.2 345.4 40-44 31.0 130.2 81.3 106.5 362.9 234.1 32.7 262.9 150.9 0.0 152.7 79.9 45-54 15.5 28.2 22.1 49.6 150.1 102.3 48.8 52.1 50.5 49.7 86.2 69.3 55-64 0.0 0.0 0.0 13.5 23.9 19.0 0.0 33.1 17.2 73.3 0.0 34.0 65+ 0.0 0.0 0.0 33.9 0.0 14.7 16.8 0.0 7.7 0.0 0.0 0.0 All Ages 177.3 833.3 511.3 271.7 1,238.8 762.6 204.7 978.3 592.6 298.7 1,380.7 851.7
Age Group Male Female
Total IHS Total Male Female Total
Total U.S. (Adjusted)
10-14 17.5 206.0 110.2 13.8 127.9 69.5 15-19 816.7 4,328.8 2,553.4 735.5 3,329.3 1,999.9 20-24 1,412.6 5,097.3 3,232.3 1,120.6 3,273.9 2,165.0 25-29 744.3 2,595.5 1,656.2 573.3 1,234.0 895.2 30-34 458.3 1,298.8 875.1 286.0 511.7 397.0 35-39 189.6 658.4 425.6 141.3 205.8 173.3 40-44 121.5 310.0 217.8 81.9 88.4 85.1 45-54 57.7 104.9 82.3 36.0 32.0 34.0 55-64 20.1 34.8 27.8 11.0 9.1 10.0 65+ 8.7 4.0 6.0 2.9 2.1 2.4 All Ages 330.5 1,223.3 782.7 219.8 593.4 409.2
IHS
Area S
TD P
rofiles
Note: Table notes on page 97. 79
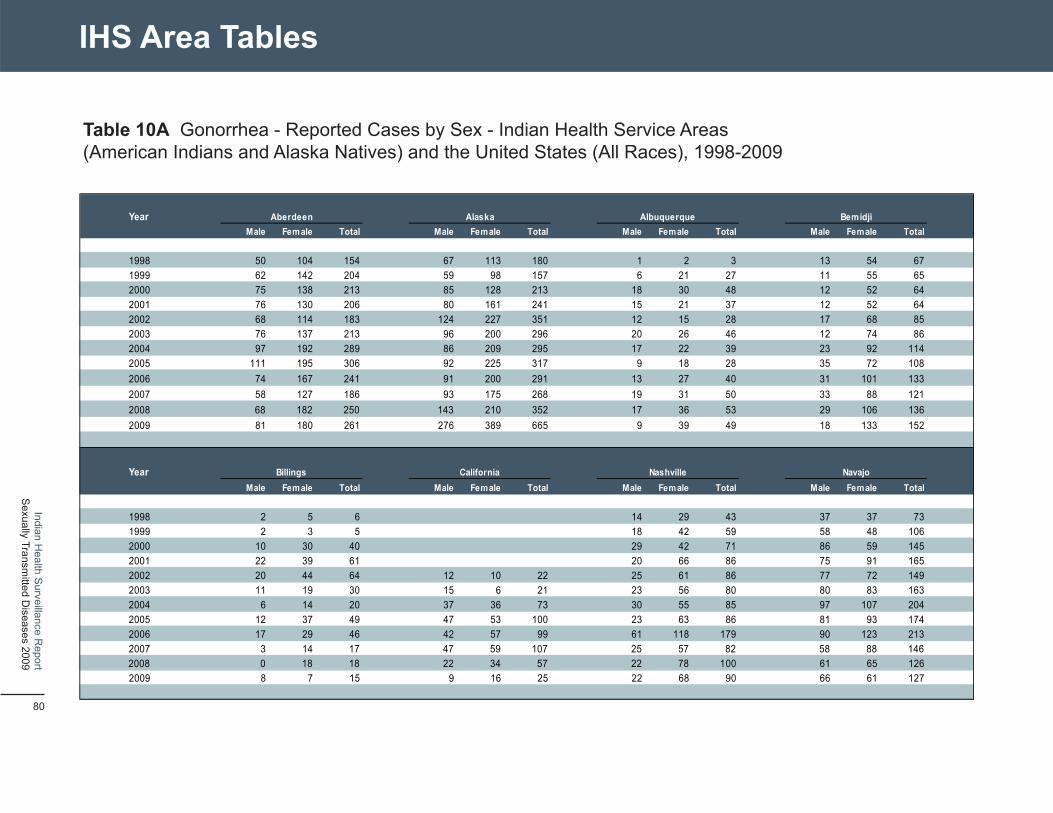
IHS Area Tables
Table 10A Gonorrhea - Reported Cases by Sex - Indian Health Service Areas (American Indians and Alaska Natives) and the United States (All Races), 1998-2009
Year
Male Fem ale
Aberdeen
Total Male Fem ale
Alaska
Total Male Fem ale
Albuquerque
Total Male Fem ale
Bemidji Total
1998 50 104 154 67 113 180 1 2 3 13 54 67
1999 62 142 204 59 98 157 6 21 27 11 55 65
2000 75 138 213 85 128 213 18 30 48 12 52 64
2001 76 130 206 80 161 241 15 21 37 12 52 64
2002 68 114 183 124 227 351 12 15 28 17 68 85
2003 76 137 213 96 200 296 20 26 46 12 74 86
2004 97 192 289 86 209 295 17 22 39 23 92 114
2005 111 195 306 92 225 317 9 18 28 35 72 108
2006 74 167 241 91 200 291 13 27 40 31 101 133
2007 58 127 186 93 175 268 19 31 50 33 88 121
2008 68 182 250 143 210 352 17 36 53 29 106 136
2009 81 180 261 276 389 665 9 39 49 18 133 152
Year
Male Fem ale
Billings
Total Male Fem ale
California
Total Male Fem ale
Nashville
Total Male Fem ale
Navajo
Total
1998 2 5 6 14 29 43 37 37 73
1999 2 3 5 18 42 59 58 48 106
2000 10 30 40 29 42 71 86 59 145
2001 22 39 61 20 66 86 75 91 165
2002 20 44 64 12 10 22 25 61 86 77 72 149
2003 11 19 30 15 6 21 23 56 80 80 83 163
2004 6 14 20 37 36 73 30 55 85 97 107 204
2005 12 37 49 47 53 100 23 63 86 81 93 174
2006 17 29 46 42 57 99 61 118 179 90 123 213
2007 3 14 17 47 59 107 25 57 82 58 88 146
2008 0 18 18 22 34 57 22 78 100 61 65 126
2009 8 7 15 9 16 25 22 68 90 66 61 127
Indian Health S
urveillance Report
Sexually Transm
itted Diseases 2009
80
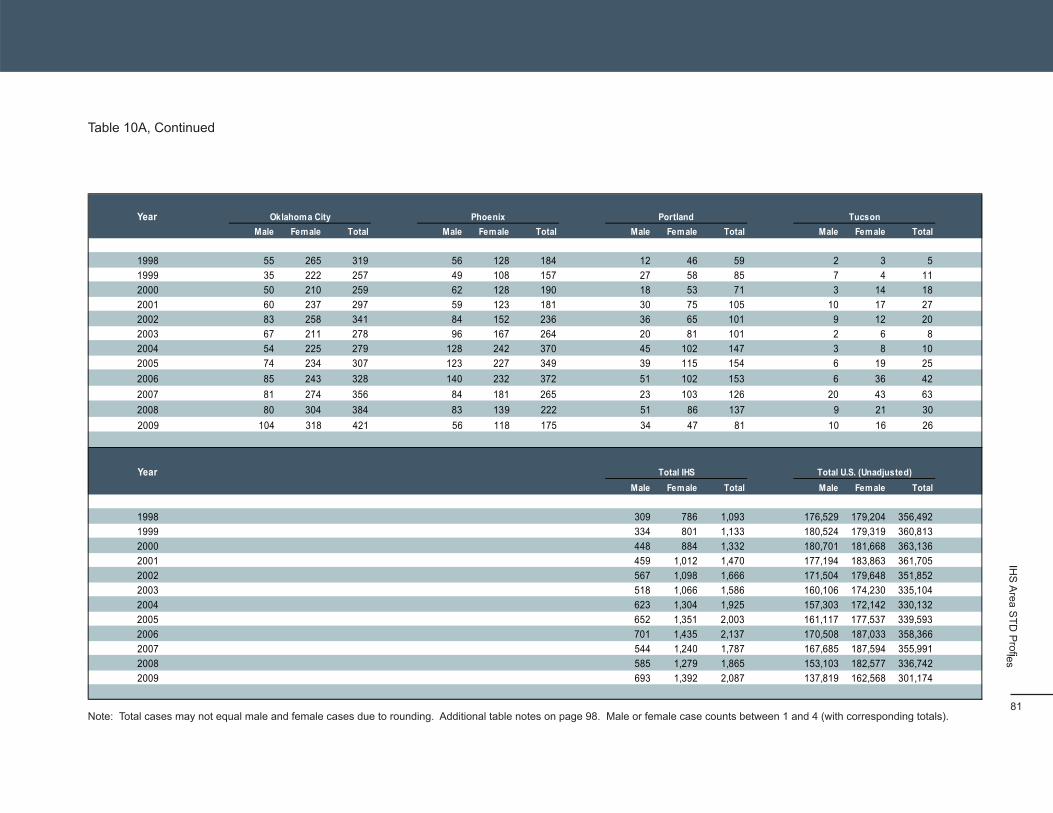
Table 10A, Continued
Year Male Female
Oklahoma City Total Male Female
Phoenix Total Male Female
Portland Total Male Female Total
Tucson
1998 55 265 319 56 128 184 12 46 59 2 3 5
1999 35 222 257 49 108 157 27 58 85 7 4 11
2000 50 210 259 62 128 190 18 53 71 3 14 18
2001 60 237 297 59 123 181 30 75 105 10 17 27
2002 83 258 341 84 152 236 36 65 101 9 12 20
2003 67 211 278 96 167 264 20 81 101 2 6 8
2004 54 225 279 128 242 370 45 102 147 3 8 10
2005 74 234 307 123 227 349 39 115 154 6 19 25
2006 85 243 328 140 232 372 51 102 153 6 36 42
2007 81 274 356 84 181 265 23 103 126 20 43 63
2008 80 304 384 83 139 222 51 86 137 9 21 30
2009 104 318 421 56 118 175 34 47 81 10 16 26
Year Male Female
Total IHS Total Male Female Total
Total U.S. (Unadjusted)
1998 309 786 1,093 176,529 179,204 356,492
1999 334 801 1,133 180,524 179,319 360,813
2000 448 884 1,332 180,701 181,668 363,136
2001 459 1,012 1,470 177,194 183,863 361,705
2002 567 1,098 1,666 171,504 179,648 351,852
2003 518 1,066 1,586 160,106 174,230 335,104
2004 623 1,304 1,925 157,303 172,142 330,132
2005 652 1,351 2,003 161,117 177,537 339,593
2006 701 1,435 2,137 170,508 187,033 358,366
2007 544 1,240 1,787 167,685 187,594 355,991
2008 585 1,279 1,865 153,103 182,577 336,742
2009 693 1,392 2,087 137,819 162,568 301,174
IHS
Area S
TD P
rofiles
Note: Total cases may not equal male and female cases due to rounding. Additional table notes on page 98. Male or female case counts between 1 and 4 (with corresponding totals). 81

IHS Area Tables
Table 10B Gonorrhea - Rates per 100,000 Population by Sex - Indian Health Service Areas (American Indians and Alaska Natives) and the United States (All Races), 1998-2009
Year
Male Fem ale
Aberdeen
Total Male Fem ale
Alaska
Total Male Fem ale
Albuquerque
Total Male Fem ale
Bemidji Total
1998 107.5 213.0 161.5 128.4 218.1 173.1 16.9 33.0 25.0 27.1 112.0 69.7
1999 129.6 283.1 208.2 111.1 186.3 148.5 13.5 44.1 29.3 21.6 107.5 63.7
2000 152.1 267.5 211.1 157.5 239.6 198.3 39.2 61.0 50.5 22.7 98.7 60.7
2001 153.6 250.2 203.1 147.3 298.5 222.6 32.7 42.6 38.9 22.6 97.9 60.3
2002 136.5 217.5 179.0 226.1 417.5 321.4 25.6 29.8 28.8 31.8 126.8 79.4
2003 151.5 260.2 207.2 171.6 361.7 266.1 41.9 50.7 46.4 22.4 137.1 79.9
2004 189.2 354.6 274.2 152.7 374.8 263.2 34.4 41.3 38.0 42.5 169.3 105.1
2005 213.8 356.7 287.1 160.7 398.3 278.7 17.8 33.0 26.6 65.2 134.1 100.6
2006 144.0 310.0 229.0 162.2 361.2 261.1 25.8 49.8 38.2 56.6 183.5 121.1
2007 113.8 236.8 177.8 166.3 315.3 240.5 37.0 56.3 47.0 60.3 160.0 110.2
2008 128.2 326.5 229.8 253.8 376.8 314.1 31.2 61.7 47.0 50.4 183.8 118.1
2009 152.7 322.9 239.9 489.9 698.0 593.4 16.5 66.8 43.5 31.3 230.7 132.0
Year
Male Fem ale
Billings
Total Male Fem ale
California
Total Male Fem ale
Nashville
Total Male Fem ale
Navajo
Total
1998 52.5 131.3 78.8 65.4 135.2 100.4 61.0 58.5 58.9
1999 50.6 75.7 63.1 44.6 102.9 72.6 54.9 43.3 49.0
2000 34.7 102.0 68.6 56.5 83.1 69.7 80.7 52.5 66.2
2001 75.8 131.5 103.9 38.2 128.1 82.8 69.6 79.9 74.5
2002 67.8 145.8 107.2 14.2 12.0 13.1 46.9 116.2 81.3 69.6 61.5 65.4
2003 36.5 61.4 49.1 17.5 7.0 12.3 42.4 105.3 74.5 71.1 69.7 70.4
2004 19.9 45.3 32.8 42.3 41.2 41.7 53.6 100.2 76.6 87.2 90.8 89.1
2005 39.6 117.8 79.4 52.5 59.4 55.9 41.3 115.3 77.9 71.6 77.3 74.5
2006 55.7 92.4 74.3 45.5 61.8 53.6 103.5 203.7 153.2 81.6 105.4 93.8
2007 9.8 45.2 27.7 50.5 63.2 57.4 41.7 96.3 68.8 54.5 77.9 66.5
2008 0.0 55.9 28.2 22.3 34.4 28.8 34.2 122.5 78.1 55.9 56.0 56.0
2009 25.3 21.8 23.5 9.1 16.2 12.6 34.2 106.8 70.3 60.5 52.6 56.4
Indian Health S
urveillance Report
Sexually Transm
itted Diseases 2009
82
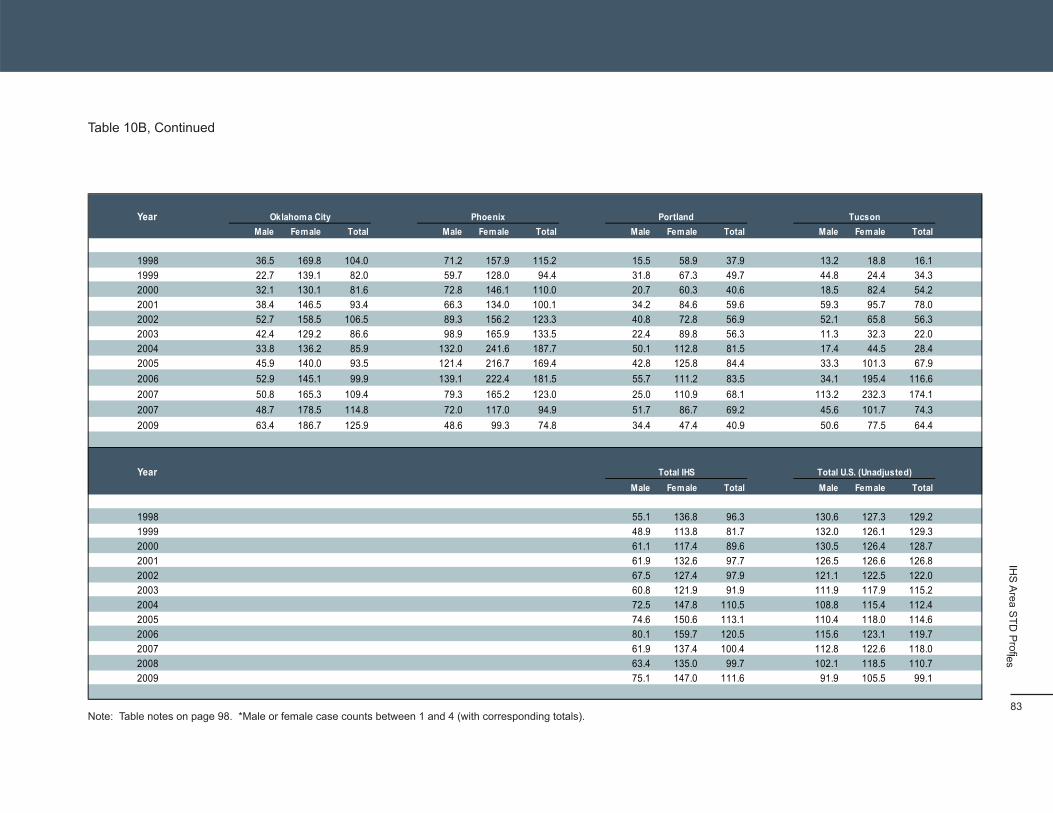
Table 10B, Continued
Year Male Female
Oklahoma City Total Male Female
Phoenix Total Male Female
Portland Total Male Female Total
Tucson
1998 36.5 169.8 104.0 71.2 157.9 115.2 15.5 58.9 37.9 13.2 18.8 16.1
1999 22.7 139.1 82.0 59.7 128.0 94.4 31.8 67.3 49.7 44.8 24.4 34.3
2000 32.1 130.1 81.6 72.8 146.1 110.0 20.7 60.3 40.6 18.5 82.4 54.2
2001 38.4 146.5 93.4 66.3 134.0 100.1 34.2 84.6 59.6 59.3 95.7 78.0
2002 52.7 158.5 106.5 89.3 156.2 123.3 40.8 72.8 56.9 52.1 65.8 56.3
2003 42.4 129.2 86.6 98.9 165.9 133.5 22.4 89.8 56.3 11.3 32.3 22.0
2004 33.8 136.2 85.9 132.0 241.6 187.7 50.1 112.8 81.5 17.4 44.5 28.4
2005 45.9 140.0 93.5 121.4 216.7 169.4 42.8 125.8 84.4 33.3 101.3 67.9
2006 52.9 145.1 99.9 139.1 222.4 181.5 55.7 111.2 83.5 34.1 195.4 116.6
2007 50.8 165.3 109.4 79.3 165.2 123.0 25.0 110.9 68.1 113.2 232.3 174.1
2007 48.7 178.5 114.8 72.0 117.0 94.9 51.7 86.7 69.2 45.6 101.7 74.3
2009 63.4 186.7 125.9 48.6 99.3 74.8 34.4 47.4 40.9 50.6 77.5 64.4
Year Male Female
Total IHS Total Male Female Total
Total U.S. (Unadjusted)
1998 55.1 136.8 96.3 130.6 127.3 129.2
1999 48.9 113.8 81.7 132.0 126.1 129.3
2000 61.1 117.4 89.6 130.5 126.4 128.7
2001 61.9 132.6 97.7 126.5 126.6 126.8
2002 67.5 127.4 97.9 121.1 122.5 122.0
2003 60.8 121.9 91.9 111.9 117.9 115.2
2004 72.5 147.8 110.5 108.8 115.4 112.4
2005 74.6 150.6 113.1 110.4 118.0 114.6
2006 80.1 159.7 120.5 115.6 123.1 119.7
2007 61.9 137.4 100.4 112.8 122.6 118.0
2008 63.4 135.0 99.7 102.1 118.5 110.7
2009 75.1 147.0 111.6 91.9 105.5 99.1
IHS
Area S
TD P
rofiles
Note: Table notes on page 98. *Male or female case counts between 1 and 4 (with corresponding totals). 83
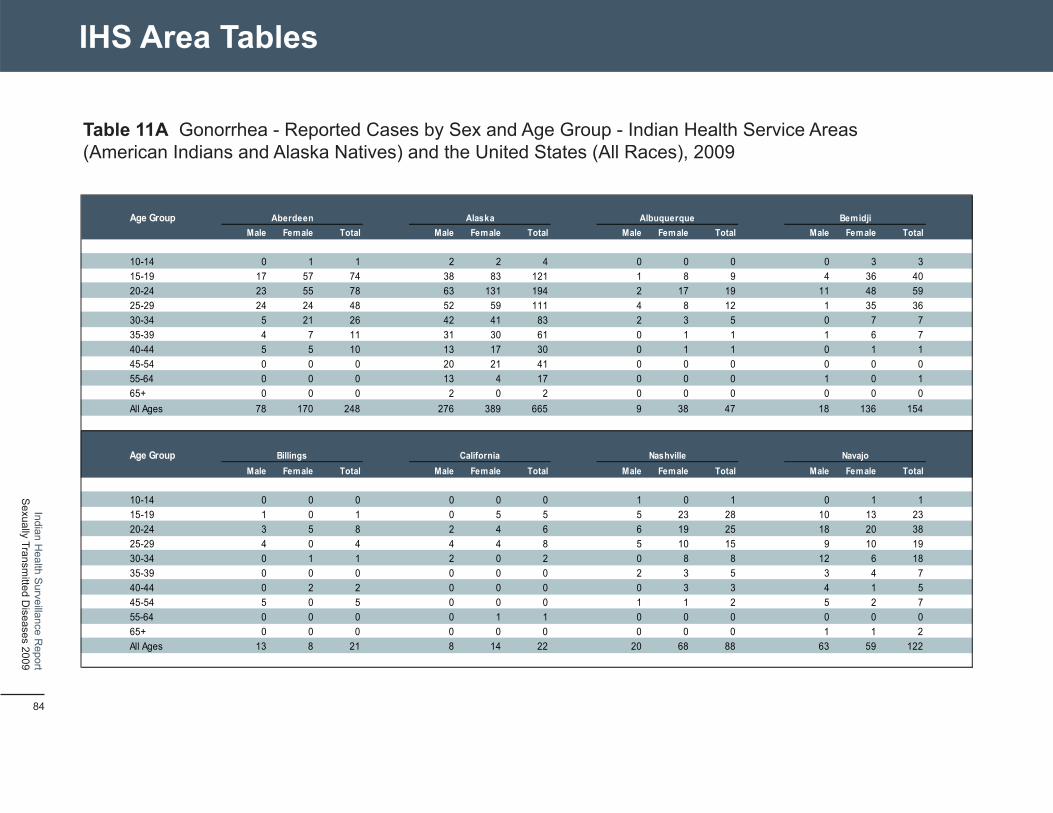
IHS Area Tables
Table 11A Gonorrhea - Reported Cases by Sex and Age Group - Indian Health Service Areas (American Indians and Alaska Natives) and the United States (All Races), 2009
Age Group Male Female
Aberdeen Total Male Female
Alaska Total Male Fem ale
Albuquerque Total Male Female
Bemidji Total
10-14 0 1 1 2 2 4 0 0 0 0 3 3 15-19 17 57 74 38 83 121 1 8 9 4 36 40 20-24 23 55 78 63 131 194 2 17 19 11 48 59 25-29 24 24 48 52 59 111 4 8 12 1 35 36 30-34 5 21 26 42 41 83 2 3 5 0 7 7 35-39 4 7 11 31 30 61 0 1 1 1 6 7 40-44 5 5 10 13 17 30 0 1 1 0 1 1 45-54 0 0 0 20 21 41 0 0 0 0 0 0 55-64 0 0 0 13 4 17 0 0 0 1 0 1 65+ 0 0 0 2 0 2 0 0 0 0 0 0 All Ages 78 170 248 276 389 665 9 38 47 18 136 154
Age Group Male Female
Billings Total Male Female
California Total Male Fem ale
Nashville Total Male Female
Navajo Total
10-14 0 0 0 0 0 0 1 0 1 0 1 1 15-19 1 0 1 0 5 5 5 23 28 10 13 23 20-24 3 5 8 2 4 6 6 19 25 18 20 38 25-29 4 0 4 4 4 8 5 10 15 9 10 19 30-34 0 1 1 2 0 2 0 8 8 12 6 18 35-39 0 0 0 0 0 0 2 3 5 3 4 7 40-44 0 2 2 0 0 0 0 3 3 4 1 5 45-54 5 0 5 0 0 0 1 1 2 5 2 7 55-64 0 0 0 0 1 1 0 0 0 0 0 0 65+ 0 0 0 0 0 0 0 0 0 1 1 2 All Ages 13 8 21 8 14 22 20 68 88 63 59 122
Indian Health S
urveillance Report
Sexually Transm
itted Diseases 2009
84
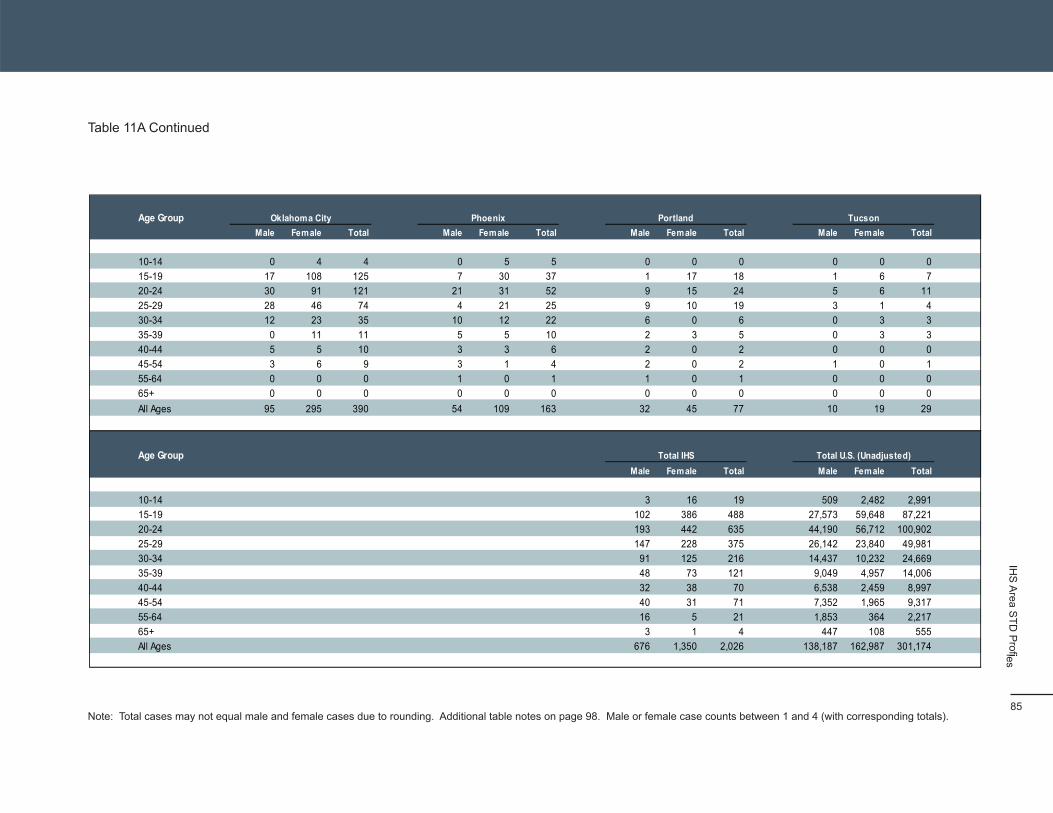
Table 11A Continued
Age Group Male Female
Oklahoma City Total Male Female
Phoenix Total Male Female
Portland Total Male Female Total
Tucson
10-14 0 4 4 0 5 5 0 0 0 0 0 0 15-19 17 108 125 7 30 37 1 17 18 1 6 7 20-24 30 91 121 21 31 52 9 15 24 5 6 11 25-29 28 46 74 4 21 25 9 10 19 3 1 4 30-34 12 23 35 10 12 22 6 0 6 0 3 3 35-39 0 11 11 5 5 10 2 3 5 0 3 3 40-44 5 5 10 3 3 6 2 0 2 0 0 0 45-54 3 6 9 3 1 4 2 0 2 1 0 1 55-64 0 0 0 1 0 1 1 0 1 0 0 0 65+ 0 0 0 0 0 0 0 0 0 0 0 0 All Ages 95 295 390 54 109 163 32 45 77 10 19 29
Age Group Male Female
Total IHS Total Male Female Total
Total U.S. (Unadjusted)
10-14 3 16 19 509 2,482 2,991 15-19 102 386 488 27,573 59,648 87,221 20-24 193 442 635 44,190 56,712 100,902 25-29 147 228 375 26,142 23,840 49,981 30-34 91 125 216 14,437 10,232 24,669 35-39 48 73 121 9,049 4,957 14,006 40-44 32 38 70 6,538 2,459 8,997 45-54 40 31 71 7,352 1,965 9,317 55-64 16 5 21 1,853 364 2,217 65+ 3 1 4 447 108 555 All Ages 676 1,350 2,026 138,187 162,987 301,174
IHS
Area S
TD P
rofiles
Note: Total cases may not equal male and female cases due to rounding. Additional table notes on page 98. Male or female case counts between 1 and 4 (with corresponding totals). 85
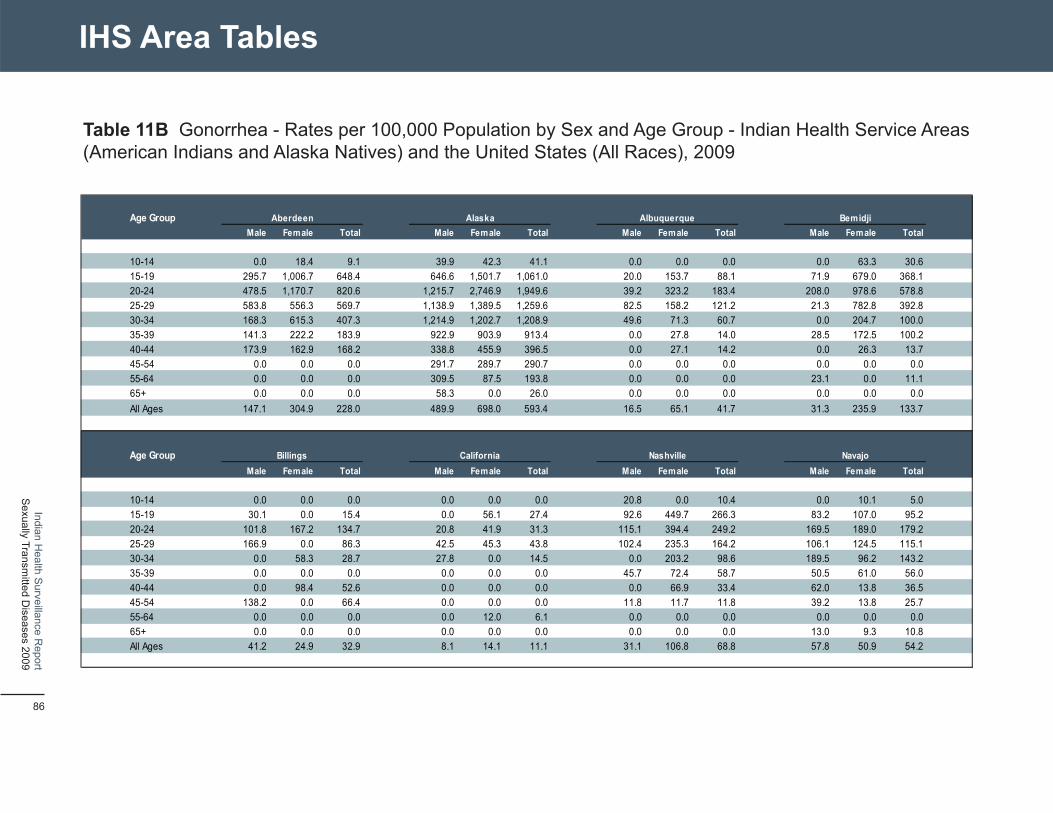
IHS Area Tables
Table 11B Gonorrhea - Rates per 100,000 Population by Sex and Age Group - Indian Health Service Areas (American Indians and Alaska Natives) and the United States (All Races), 2009
Age Group Male Female
Aberdeen Total Male Female
Alaska Total Male Fem ale
Albuquerque Total Male Female
Bemidji Total
10-14 0.0 18.4 9.1 39.9 42.3 41.1 0.0 0.0 0.0 0.0 63.3 30.6 15-19 295.7 1,006.7 648.4 646.6 1,501.7 1,061.0 20.0 153.7 88.1 71.9 679.0 368.1 20-24 478.5 1,170.7 820.6 1,215.7 2,746.9 1,949.6 39.2 323.2 183.4 208.0 978.6 578.8 25-29 583.8 556.3 569.7 1,138.9 1,389.5 1,259.6 82.5 158.2 121.2 21.3 782.8 392.8 30-34 168.3 615.3 407.3 1,214.9 1,202.7 1,208.9 49.6 71.3 60.7 0.0 204.7 100.0 35-39 141.3 222.2 183.9 922.9 903.9 913.4 0.0 27.8 14.0 28.5 172.5 100.2 40-44 173.9 162.9 168.2 338.8 455.9 396.5 0.0 27.1 14.2 0.0 26.3 13.7 45-54 0.0 0.0 0.0 291.7 289.7 290.7 0.0 0.0 0.0 0.0 0.0 0.0 55-64 0.0 0.0 0.0 309.5 87.5 193.8 0.0 0.0 0.0 23.1 0.0 11.1 65+ 0.0 0.0 0.0 58.3 0.0 26.0 0.0 0.0 0.0 0.0 0.0 0.0 All Ages 147.1 304.9 228.0 489.9 698.0 593.4 16.5 65.1 41.7 31.3 235.9 133.7
Age Group Male Female
Billings Total Male Female
California Total Male Fem ale
Nashville Total Male Female
Navajo Total
10-14 0.0 0.0 0.0 0.0 0.0 0.0 20.8 0.0 10.4 0.0 10.1 5.0 15-19 30.1 0.0 15.4 0.0 56.1 27.4 92.6 449.7 266.3 83.2 107.0 95.2 20-24 101.8 167.2 134.7 20.8 41.9 31.3 115.1 394.4 249.2 169.5 189.0 179.2 25-29 166.9 0.0 86.3 42.5 45.3 43.8 102.4 235.3 164.2 106.1 124.5 115.1 30-34 0.0 58.3 28.7 27.8 0.0 14.5 0.0 203.2 98.6 189.5 96.2 143.2 35-39 0.0 0.0 0.0 0.0 0.0 0.0 45.7 72.4 58.7 50.5 61.0 56.0 40-44 0.0 98.4 52.6 0.0 0.0 0.0 0.0 66.9 33.4 62.0 13.8 36.5 45-54 138.2 0.0 66.4 0.0 0.0 0.0 11.8 11.7 11.8 39.2 13.8 25.7 55-64 0.0 0.0 0.0 0.0 12.0 6.1 0.0 0.0 0.0 0.0 0.0 0.0 65+ 0.0 0.0 0.0 0.0 0.0 0.0 0.0 0.0 0.0 13.0 9.3 10.8 All Ages 41.2 24.9 32.9 8.1 14.1 11.1 31.1 106.8 68.8 57.8 50.9 54.2
Indian Health S
urveillance Report
Sexually Transm
itted Diseases 2009
86

Table 11B Continued
Age Group Male Female
Oklahoma City Total Male Female
Phoenix Total Male Female
Portland Total Male Female Total
Tucson
10-14 0.0 28.5 14.0 0.0 50.8 25.1 0.0 0.0 0.0 0.0 0.0 0.0 15-19 106.7 704.2 399.7 64.6 272.1 169.2 11.5 200.6 104.6 52.1 327.2 186.6 20-24 195.4 605.3 398.2 209.5 312.2 260.6 105.5 185.3 144.3 265.7 320.5 293.0 25-29 210.3 353.7 281.1 39.5 207.7 123.6 114.1 130.0 122.0 178.4 53.2 112.3 30-34 116.1 216.3 166.9 118.6 142.9 130.7 85.4 0.0 45.0 0.0 202.2 104.0 35-39 0.0 108.5 54.6 64.5 65.2 64.9 30.2 46.3 38.2 0.0 221.4 115.1 40-44 51.6 50.1 50.8 39.9 40.3 40.1 32.7 0.0 15.9 0.0 0.0 0.0 45-54 15.5 28.2 22.1 24.8 7.5 15.7 16.3 0.0 7.8 49.7 0.0 23.1 55-64 0.0 0.0 0.0 13.5 0.0 6.3 11.9 0.0 5.7 0.0 0.0 0.0 65+ 0.0 0.0 0.0 0.0 0.0 0.0 0.0 0.0 0.0 0.0 0.0 0.0 All Ages 57.9 173.2 116.6 46.9 91.8 69.7 32.4 45.3 38.9 50.6 92.0 71.8
Age Group Male Female
Total IHS Total Male Female Total
Total U.S. (Unadjusted)
10-14 3.7 20.6 12.1 5.0 25.3 14.9 15-19 113.8 440.0 275.1 250.0 568.8 405.4 20-24 228.2 535.8 380.1 407.5 555.3 479.1 25-29 192.4 307.5 249.1 238.9 229.4 234.3 30-34 149.9 209.1 179.3 145.0 106.2 125.9 35-39 83.9 126.0 105.1 85.6 47.6 66.7 40-44 56.1 63.8 60.0 60.8 22.9 41.8 45-54 37.1 26.3 31.5 33.6 8.7 21.0 55-64 22.9 6.4 14.2 11.4 2.1 6.6 65+ 5.2 1.3 3.0 2.7 0.5 1.4 All Ages 73.2 142.5 108.3 92.2 105.7 99.1
IHS
Area S
TD P
rofiles
Note: Table notes on page 98. 87
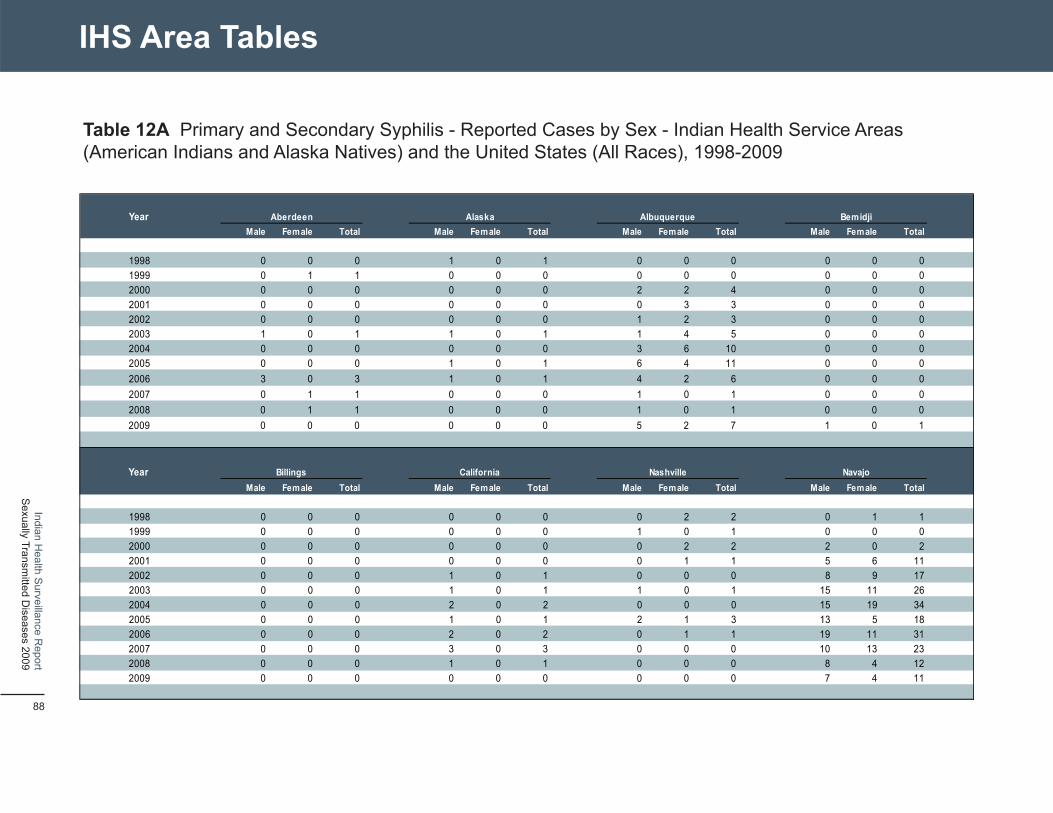
IHS Area Tables
Table 12A Primary and Secondary Syphilis - Reported Cases by Sex - Indian Health Service Areas (American Indians and Alaska Natives) and the United States (All Races), 1998-2009
Year
Male Fem ale
Aberdeen
Total Male Fem ale
Alaska
Total Male Fem ale
Albuquerque
Total Male Fem ale
Bemidji Total
1998 0 0 0 1 0 1 0 0 0 0 0 0
1999 0 1 1 0 0 0 0 0 0 0 0 0
2000 0 0 0 0 0 0 2 2 4 0 0 0
2001 0 0 0 0 0 0 0 3 3 0 0 0
2002 0 0 0 0 0 0 1 2 3 0 0 0
2003 1 0 1 1 0 1 1 4 5 0 0 0
2004 0 0 0 0 0 0 3 6 10 0 0 0
2005 0 0 0 1 0 1 6 4 11 0 0 0
2006 3 0 3 1 0 1 4 2 6 0 0 0
2007 0 1 1 0 0 0 1 0 1 0 0 0
2008 0 1 1 0 0 0 1 0 1 0 0 0
2009 0 0 0 0 0 0 5 2 7 1 0 1
Year
Male Fem ale
Billings
Total Male Fem ale
California
Total Male Fem ale
Nashville
Total Male Fem ale
Navajo
Total
1998 0 0 0 0 0 0 0 2 2 0 1 1
1999 0 0 0 0 0 0 1 0 1 0 0 0
2000 0 0 0 0 0 0 0 2 2 2 0 2
2001 0 0 0 0 0 0 0 1 1 5 6 11
2002 0 0 0 1 0 1 0 0 0 8 9 17
2003 0 0 0 1 0 1 1 0 1 15 11 26
2004 0 0 0 2 0 2 0 0 0 15 19 34
2005 0 0 0 1 0 1 2 1 3 13 5 18
2006 0 0 0 2 0 2 0 1 1 19 11 31
2007 0 0 0 3 0 3 0 0 0 10 13 23
2008 0 0 0 1 0 1 0 0 0 8 4 12
2009 0 0 0 0 0 0 0 0 0 7 4 11
Indian Health S
urveillance Report
Sexually Transm
itted Diseases 2009
88
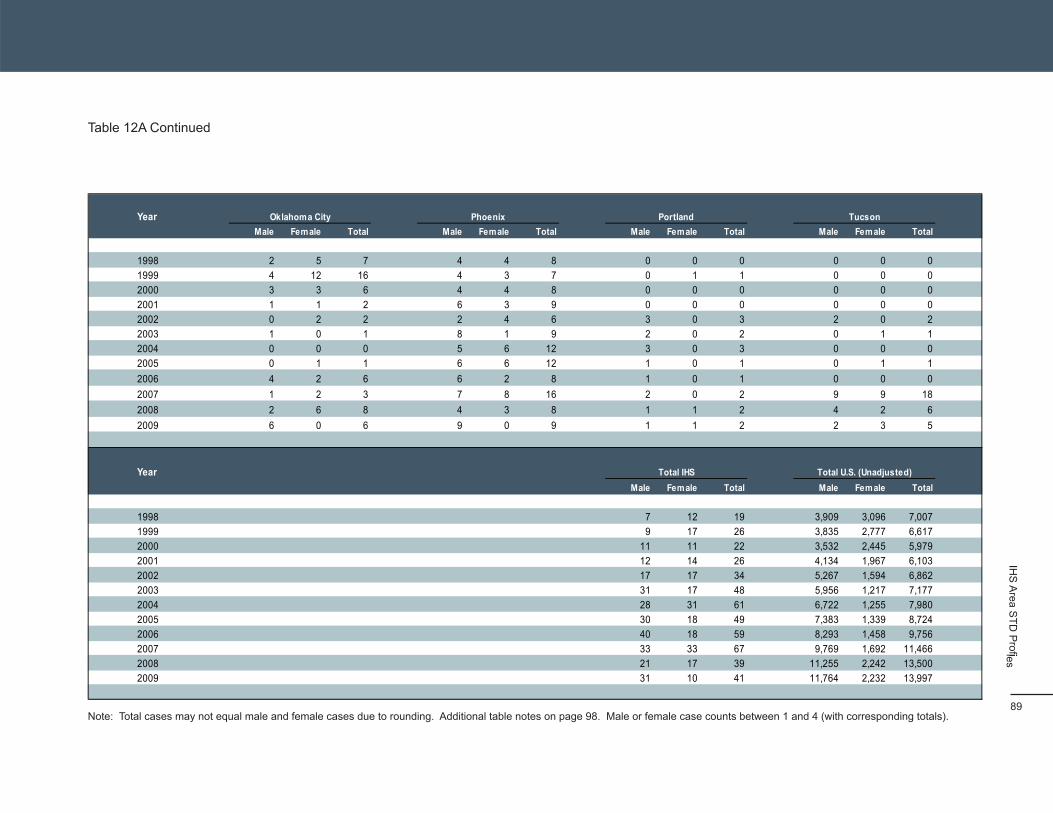
Table 12A Continued
Year Male Female
Oklahoma City Total Male Female
Phoenix Total Male Female
Portland Total Male Female Total
Tucson
1998 2 5 7 4 4 8 0 0 0 0 0 0
1999 4 12 16 4 3 7 0 1 1 0 0 0
2000 3 3 6 4 4 8 0 0 0 0 0 0
2001 1 1 2 6 3 9 0 0 0 0 0 0
2002 0 2 2 2 4 6 3 0 3 2 0 2
2003 1 0 1 8 1 9 2 0 2 0 1 1
2004 0 0 0 5 6 12 3 0 3 0 0 0
2005 0 1 1 6 6 12 1 0 1 0 1 1
2006 4 2 6 6 2 8 1 0 1 0 0 0
2007 1 2 3 7 8 16 2 0 2 9 9 18
2008 2 6 8 4 3 8 1 1 2 4 2 6
2009 6 0 6 9 0 9 1 1 2 2 3 5
Year Male Female
Total IHS Total Male Female Total
Total U.S. (Unadjusted)
1998 7 12 19 3,909 3,096 7,007
1999 9 17 26 3,835 2,777 6,617
2000 11 11 22 3,532 2,445 5,979
2001 12 14 26 4,134 1,967 6,103
2002 17 17 34 5,267 1,594 6,862
2003 31 17 48 5,956 1,217 7,177
2004 28 31 61 6,722 1,255 7,980
2005 30 18 49 7,383 1,339 8,724
2006 40 18 59 8,293 1,458 9,756
2007 33 33 67 9,769 1,692 11,466
2008 21 17 39 11,255 2,242 13,500
2009 31 10 41 11,764 2,232 13,997
IHS
Area S
TD P
rofiles
Note: Total cases may not equal male and female cases due to rounding. Additional table notes on page 98. Male or female case counts between 1 and 4 (with corresponding totals). 89
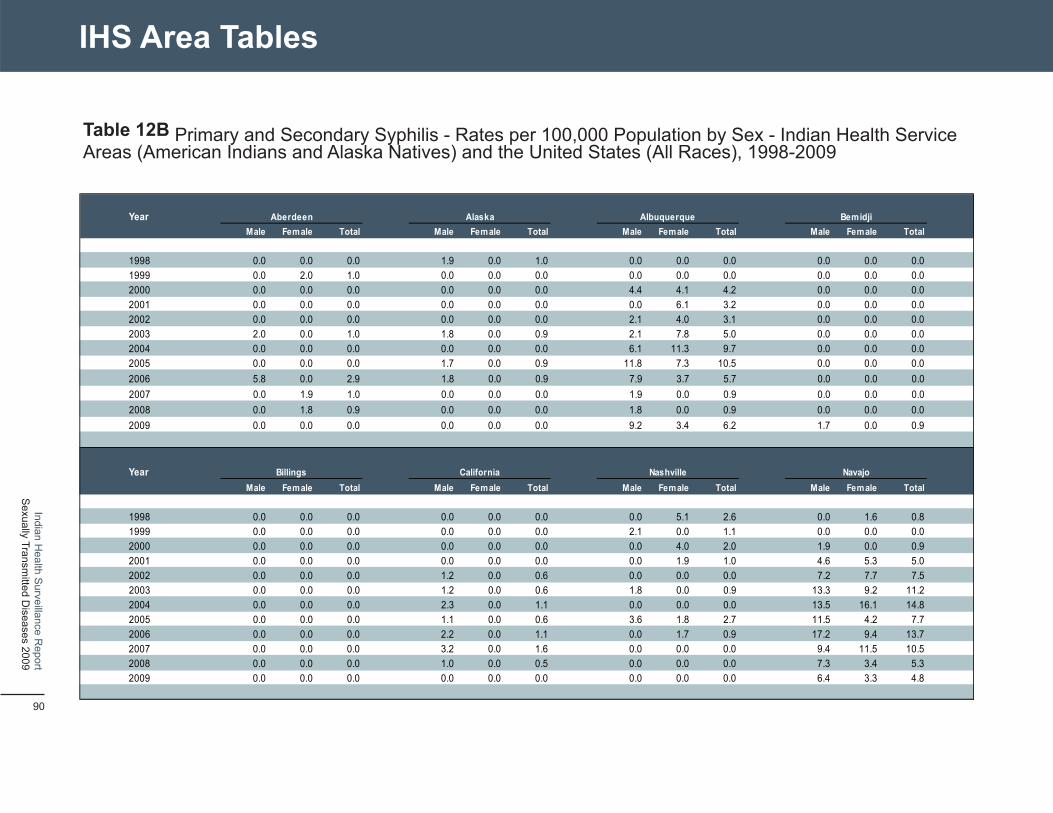
IHS Area Tables
Table 12B Primary and Secondary Syphilis - Rates per 100,000 Population by Sex - Indian Health Service Areas (American Indians and Alaska Natives) and the United States (All Races), 1998-2009
Year
Male Fem ale
Aberdeen
Total Male Fem ale
Alaska
Total Male Fem ale
Albuquerque
Total Male Fem ale
Bem idji Total
1998 0.0 0.0 0.0 1.9 0.0 1.0 0.0 0.0 0.0 0.0 0.0 0.0
1999 0.0 2.0 1.0 0.0 0.0 0.0 0.0 0.0 0.0 0.0 0.0 0.0
2000 0.0 0.0 0.0 0.0 0.0 0.0 4.4 4.1 4.2 0.0 0.0 0.0
2001 0.0 0.0 0.0 0.0 0.0 0.0 0.0 6.1 3.2 0.0 0.0 0.0
2002 0.0 0.0 0.0 0.0 0.0 0.0 2.1 4.0 3.1 0.0 0.0 0.0
2003 2.0 0.0 1.0 1.8 0.0 0.9 2.1 7.8 5.0 0.0 0.0 0.0
2004 0.0 0.0 0.0 0.0 0.0 0.0 6.1 11.3 9.7 0.0 0.0 0.0
2005 0.0 0.0 0.0 1.7 0.0 0.9 11.8 7.3 10.5 0.0 0.0 0.0
2006 5.8 0.0 2.9 1.8 0.0 0.9 7.9 3.7 5.7 0.0 0.0 0.0
2007 0.0 1.9 1.0 0.0 0.0 0.0 1.9 0.0 0.9 0.0 0.0 0.0
2008 0.0 1.8 0.9 0.0 0.0 0.0 1.8 0.0 0.9 0.0 0.0 0.0
2009 0.0 0.0 0.0 0.0 0.0 0.0 9.2 3.4 6.2 1.7 0.0 0.9
Year
Male Fem ale
Billings
Total Male Fem ale
California
Total Male Fem ale
Nashville
Total Male Fem ale
Navajo
Total
1998 0.0 0.0 0.0 0.0 0.0 0.0 0.0 5.1 2.6 0.0 1.6 0.8
1999 0.0 0.0 0.0 0.0 0.0 0.0 2.1 0.0 1.1 0.0 0.0 0.0
2000 0.0 0.0 0.0 0.0 0.0 0.0 0.0 4.0 2.0 1.9 0.0 0.9
2001 0.0 0.0 0.0 0.0 0.0 0.0 0.0 1.9 1.0 4.6 5.3 5.0
2002 0.0 0.0 0.0 1.2 0.0 0.6 0.0 0.0 0.0 7.2 7.7 7.5
2003 0.0 0.0 0.0 1.2 0.0 0.6 1.8 0.0 0.9 13.3 9.2 11.2
2004 0.0 0.0 0.0 2.3 0.0 1.1 0.0 0.0 0.0 13.5 16.1 14.8
2005 0.0 0.0 0.0 1.1 0.0 0.6 3.6 1.8 2.7 11.5 4.2 7.7
2006 0.0 0.0 0.0 2.2 0.0 1.1 0.0 1.7 0.9 17.2 9.4 13.7
2007 0.0 0.0 0.0 3.2 0.0 1.6 0.0 0.0 0.0 9.4 11.5 10.5
2008 0.0 0.0 0.0 1.0 0.0 0.5 0.0 0.0 0.0 7.3 3.4 5.3
2009 0.0 0.0 0.0 0.0 0.0 0.0 0.0 0.0 0.0 6.4 3.3 4.8
Indian Health S
urveillance Report
Sexually Transm
itted Diseases 2009
90
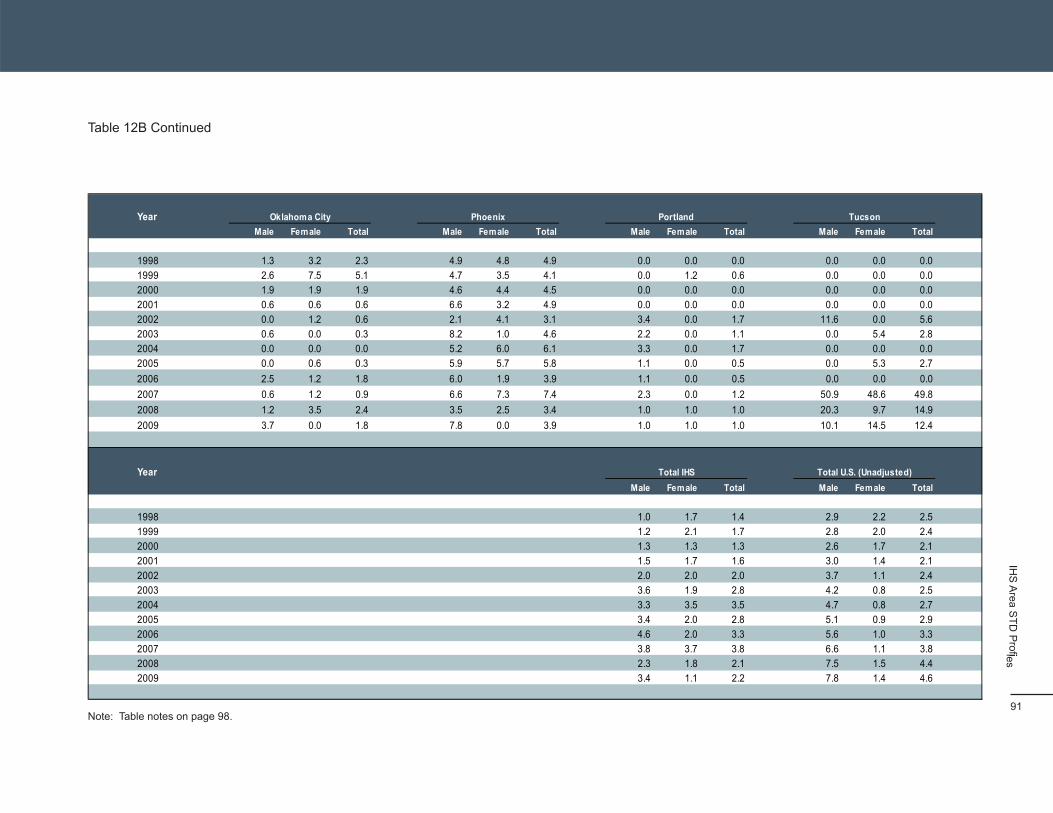
Table 12B Continued
Year Male Female
Oklahoma City Total Male Female
Phoenix Total Male Female
Portland Total Male Female Total
Tucson
1998 1.3 3.2 2.3 4.9 4.8 4.9 0.0 0.0 0.0 0.0 0.0 0.0
1999 2.6 7.5 5.1 4.7 3.5 4.1 0.0 1.2 0.6 0.0 0.0 0.0
2000 1.9 1.9 1.9 4.6 4.4 4.5 0.0 0.0 0.0 0.0 0.0 0.0
2001 0.6 0.6 0.6 6.6 3.2 4.9 0.0 0.0 0.0 0.0 0.0 0.0
2002 0.0 1.2 0.6 2.1 4.1 3.1 3.4 0.0 1.7 11.6 0.0 5.6
2003 0.6 0.0 0.3 8.2 1.0 4.6 2.2 0.0 1.1 0.0 5.4 2.8
2004 0.0 0.0 0.0 5.2 6.0 6.1 3.3 0.0 1.7 0.0 0.0 0.0
2005 0.0 0.6 0.3 5.9 5.7 5.8 1.1 0.0 0.5 0.0 5.3 2.7
2006 2.5 1.2 1.8 6.0 1.9 3.9 1.1 0.0 0.5 0.0 0.0 0.0
2007 0.6 1.2 0.9 6.6 7.3 7.4 2.3 0.0 1.2 50.9 48.6 49.8
2008 1.2 3.5 2.4 3.5 2.5 3.4 1.0 1.0 1.0 20.3 9.7 14.9
2009 3.7 0.0 1.8 7.8 0.0 3.9 1.0 1.0 1.0 10.1 14.5 12.4
Year Male Female
Total IHS Total Male Female Total
Total U.S. (Unadjusted)
1998 1.0 1.7 1.4 2.9 2.2 2.5
1999 1.2 2.1 1.7 2.8 2.0 2.4
2000 1.3 1.3 1.3 2.6 1.7 2.1
2001 1.5 1.7 1.6 3.0 1.4 2.1
2002 2.0 2.0 2.0 3.7 1.1 2.4
2003 3.6 1.9 2.8 4.2 0.8 2.5
2004 3.3 3.5 3.5 4.7 0.8 2.7
2005 3.4 2.0 2.8 5.1 0.9 2.9
2006 4.6 2.0 3.3 5.6 1.0 3.3
2007 3.8 3.7 3.8 6.6 1.1 3.8
2008 2.3 1.8 2.1 7.5 1.5 4.4
2009 3.4 1.1 2.2 7.8 1.4 4.6
IHS
Area S
TD P
rofiles
Note: Table notes on page 98. 91
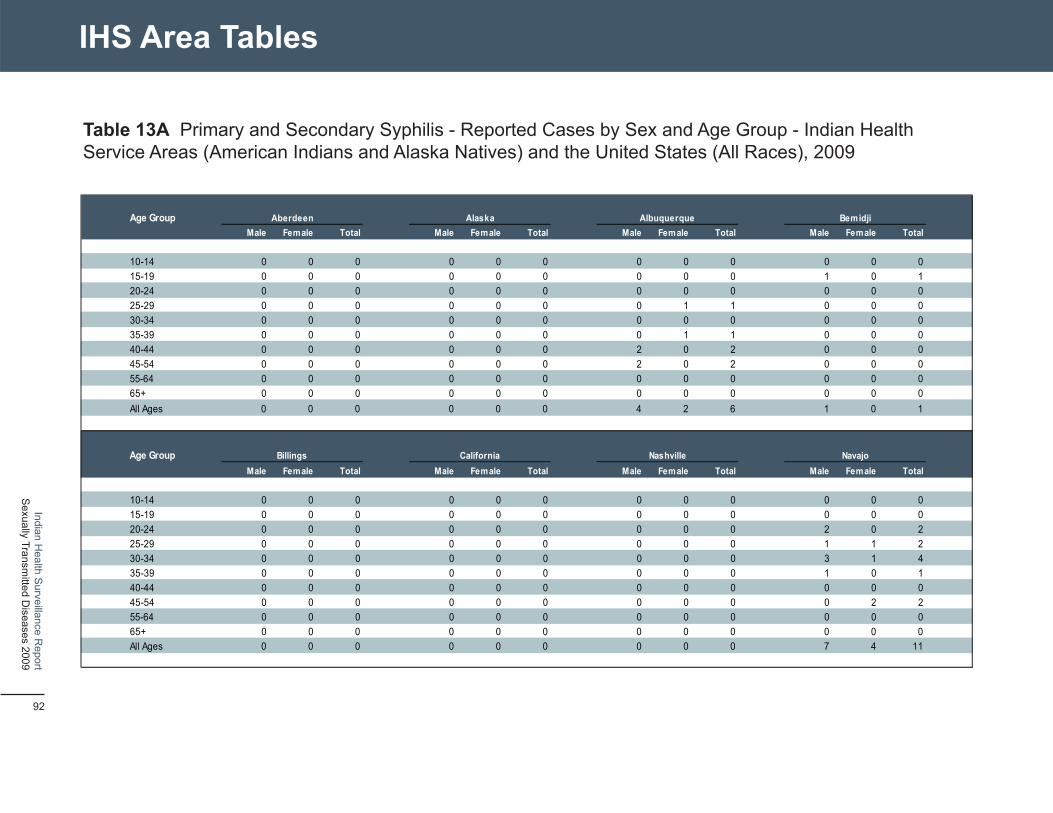
IHS Area Tables
Table 13A Primary and Secondary Syphilis - Reported Cases by Sex and Age Group - Indian Health Service Areas (American Indians and Alaska Natives) and the United States (All Races), 2009
Age Group Male Female
Aberdeen Total Male Female
Alaska Total Male Fem ale
Albuquerque Total Male Female
Bemidji Total
10-14 0 0 0 0 0 0 0 0 0 0 0 0 15-19 0 0 0 0 0 0 0 0 0 1 0 1 20-24 0 0 0 0 0 0 0 0 0 0 0 0 25-29 0 0 0 0 0 0 0 1 1 0 0 0 30-34 0 0 0 0 0 0 0 0 0 0 0 0 35-39 0 0 0 0 0 0 0 1 1 0 0 0 40-44 0 0 0 0 0 0 2 0 2 0 0 0 45-54 0 0 0 0 0 0 2 0 2 0 0 0 55-64 0 0 0 0 0 0 0 0 0 0 0 0 65+ 0 0 0 0 0 0 0 0 0 0 0 0 All Ages 0 0 0 0 0 0 4 2 6 1 0 1
Age Group Male Female
Billings Total Male Female
California Total Male Fem ale
Nashville Total Male Female
Navajo Total
10-14 0 0 0 0 0 0 0 0 0 0 0 0 15-19 0 0 0 0 0 0 0 0 0 0 0 0 20-24 0 0 0 0 0 0 0 0 0 2 0 2 25-29 0 0 0 0 0 0 0 0 0 1 1 2 30-34 0 0 0 0 0 0 0 0 0 3 1 4 35-39 0 0 0 0 0 0 0 0 0 1 0 1 40-44 0 0 0 0 0 0 0 0 0 0 0 0 45-54 0 0 0 0 0 0 0 0 0 0 2 2 55-64 0 0 0 0 0 0 0 0 0 0 0 0 65+ 0 0 0 0 0 0 0 0 0 0 0 0 All Ages 0 0 0 0 0 0 0 0 0 7 4 11
Indian Health S
urveillance Report
Sexually Transm
itted Diseases 2009
92

Table 13A Continued
Age Group Male Female
Oklahoma City Total Male Female
Phoenix Total Male Female
Portland Total Male Female Total
Tucson
10-14 0 0 0 0 0 0 0 0 0 0 0 0 15-19 0 0 0 0 0 0 0 0 0 0 0 0 20-24 1 0 1 3 0 3 0 0 0 0 1 1 25-29 1 0 1 6 0 6 0 0 0 0 2 2 30-34 2 0 2 1 0 1 0 0 0 0 0 0 35-39 2 0 2 0 0 0 1 1 2 1 0 1 40-44 0 0 0 0 0 0 0 0 0 1 0 1 45-54 0 0 0 0 0 0 0 0 0 0 0 0 55-64 0 0 0 0 0 0 0 0 0 0 0 0 65+ 0 0 0 0 0 0 0 0 0 0 0 0 All Ages 6 0 6 10 0 10 1 1 2 2 3 5
Age Group Male Female
Total IHS Total Male Female Total
Total U.S. (Unadjusted)
10-14 0 0 0 4 15 19 15-19 1 0 1 661 344 1,005 20-24 6 1 7 2,242 570 2,812 25-29 8 4 12 2,028 377 2,405 30-34 6 1 7 1,571 286 1,857 35-39 5 2 7 1,409 203 1,612 40-44 3 0 3 1,476 167 1,643 45-54 2 2 4 1,815 218 2,033 55-64 0 0 0 475 42 517 65+ 0 0 0 83 7 90 All Ages 31 10 41 11,765 2,232 13,997
IHS
Area S
TD P
rofiles
Note: Total cases may not equal male and female cases due to rounding. Additional table notes on page 98. 93

IHS Area Tables
Table 13B Primary and Secondary Syphilis - Rates per 100,000 Population by Sex and Age Group - Indian Health Service Areas (American Indians and Alaska Natives) and the United States (All Races), 2009
Age Group Male Female
Aberdeen Total Male Female
Alaska Total Male Fem ale
Albuquerque Total Male Female
Bemidji Total
10-14 0.0 0.0 0.0 0.0 0.0 0.0 0.0 0.0 0.0 0.0 0.0 0.0 15-19 0.0 0.0 0.0 0.0 0.0 0.0 0.0 0.0 0.0 18.0 0.0 9.2 20-24 0.0 0.0 0.0 0.0 0.0 0.0 0.0 0.0 0.0 0.0 0.0 0.0 25-29 0.0 0.0 0.0 0.0 0.0 0.0 0.0 19.8 10.1 0.0 0.0 0.0 30-34 0.0 0.0 0.0 0.0 0.0 0.0 0.0 0.0 0.0 0.0 0.0 0.0 35-39 0.0 0.0 0.0 0.0 0.0 0.0 0.0 27.8 14.0 0.0 0.0 0.0 40-44 0.0 0.0 0.0 0.0 0.0 0.0 59.9 0.0 28.5 0.0 0.0 0.0 45-54 0.0 0.0 0.0 0.0 0.0 0.0 32.5 0.0 15.1 0.0 0.0 0.0 55-64 0.0 0.0 0.0 0.0 0.0 0.0 0.0 0.0 0.0 0.0 0.0 0.0 65+ 0.0 0.0 0.0 0.0 0.0 0.0 0.0 0.0 0.0 0.0 0.0 0.0 All Ages 0.0 0.0 0.0 0.0 0.0 0.0 7.4 3.4 5.3 1.7 0.0 0.9
Age Group Male Female
Billings Total Male Female
California Total Male Fem ale
Nashville Total Male Female
Navajo Total
10-14 0.0 0.0 0.0 0.0 0.0 0.0 0.0 0.0 0.0 0.0 0.0 0.0 15-19 0.0 0.0 0.0 0.0 0.0 0.0 0.0 0.0 0.0 0.0 0.0 0.0 20-24 0.0 0.0 0.0 0.0 0.0 0.0 0.0 0.0 0.0 18.8 0.0 9.4 25-29 0.0 0.0 0.0 0.0 0.0 0.0 0.0 0.0 0.0 11.8 12.5 12.1 30-34 0.0 0.0 0.0 0.0 0.0 0.0 0.0 0.0 0.0 47.4 16.0 31.8 35-39 0.0 0.0 0.0 0.0 0.0 0.0 0.0 0.0 0.0 16.8 0.0 8.0 40-44 0.0 0.0 0.0 0.0 0.0 0.0 0.0 0.0 0.0 0.0 0.0 0.0 45-54 0.0 0.0 0.0 0.0 0.0 0.0 0.0 0.0 0.0 0.0 10.2 6.2 55-64 0.0 0.0 0.0 0.0 0.0 0.0 0.0 0.0 0.0 0.0 0.0 0.0 65+ 0.0 0.0 0.0 0.0 0.0 0.0 0.0 0.0 0.0 0.0 0.0 0.0 All Ages 0.0 0.0 0.0 0.0 0.0 0.0 0.0 0.0 0.0 6.4 3.3 4.8
Indian Health S
urveillance Report
Sexually Transm
itted Diseases 2009
94
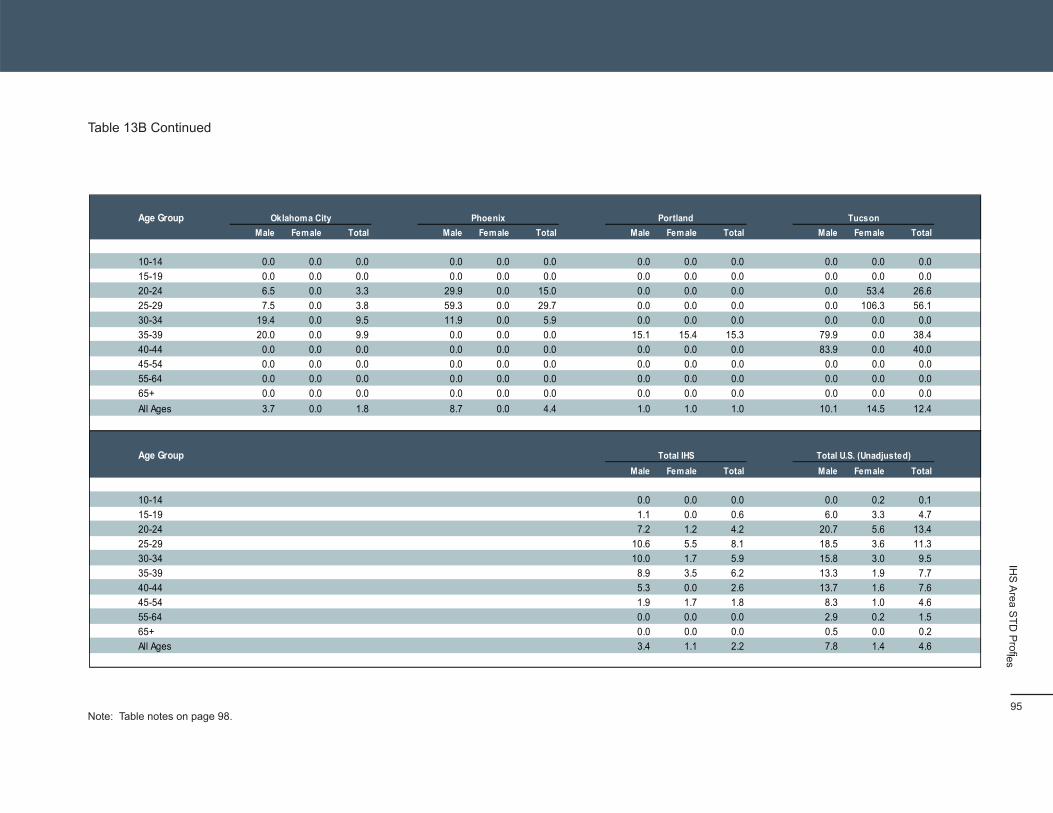
Table 13B Continued
Age Group Male Female
Oklahoma City Total Male Female
Phoenix Total Male Female
Portland Total Male Female Total
Tucson
10-14 0.0 0.0 0.0 0.0 0.0 0.0 0.0 0.0 0.0 0.0 0.0 0.0 15-19 0.0 0.0 0.0 0.0 0.0 0.0 0.0 0.0 0.0 0.0 0.0 0.0 20-24 6.5 0.0 3.3 29.9 0.0 15.0 0.0 0.0 0.0 0.0 53.4 26.6 25-29 7.5 0.0 3.8 59.3 0.0 29.7 0.0 0.0 0.0 0.0 106.3 56.1 30-34 19.4 0.0 9.5 11.9 0.0 5.9 0.0 0.0 0.0 0.0 0.0 0.0 35-39 20.0 0.0 9.9 0.0 0.0 0.0 15.1 15.4 15.3 79.9 0.0 38.4 40-44 0.0 0.0 0.0 0.0 0.0 0.0 0.0 0.0 0.0 83.9 0.0 40.0 45-54 0.0 0.0 0.0 0.0 0.0 0.0 0.0 0.0 0.0 0.0 0.0 0.0 55-64 0.0 0.0 0.0 0.0 0.0 0.0 0.0 0.0 0.0 0.0 0.0 0.0 65+ 0.0 0.0 0.0 0.0 0.0 0.0 0.0 0.0 0.0 0.0 0.0 0.0 All Ages 3.7 0.0 1.8 8.7 0.0 4.4 1.0 1.0 1.0 10.1 14.5 12.4
Age Group Male Female
Total IHS Total Male Female Total
Total U.S. (Unadjusted)
10-14 0.0 0.0 0.0 0.0 0.2 0.1 15-19 1.1 0.0 0.6 6.0 3.3 4.7 20-24 7.2 1.2 4.2 20.7 5.6 13.4 25-29 10.6 5.5 8.1 18.5 3.6 11.3 30-34 10.0 1.7 5.9 15.8 3.0 9.5 35-39 8.9 3.5 6.2 13.3 1.9 7.7 40-44 5.3 0.0 2.6 13.7 1.6 7.6 45-54 1.9 1.7 1.8 8.3 1.0 4.6 55-64 0.0 0.0 0.0 2.9 0.2 1.5 65+ 0.0 0.0 0.0 0.5 0.0 0.2 All Ages 3.4 1.1 2.2 7.8 1.4 4.6
IHS
Area S
TD P
rofiles
Note: Table notes on page 98. 95

Table Notes
Table 1A Data source: STDSS Morbidity file, unadjusted • Cases with unknown sex are included in the Totals STD source: 2009 CDC STD Surveillance Report, Tables 1, 3-5, 13-15, 25-27
Table 1B Data source: STDSS Morbidity file, unadjusted • Population source: NCHS bridged-race file of the U.S. Census population (2000-2008); U.S. Census Bureau estimates (2000) • 2009 rates are computed using 2008 populations to be consistent with the 2009 CDC STD Surveillance Report STD source: 2009 CDC STD Surveillance Report, Tables 1, 3-5, 13-15, 25-27
Table 2A Data source: STDSS Age-Race/Ethnicity-Sex fi les, 1996-2009 and STDSS Morbidity file • All races, including AI/ANs, are non-Hispanic; Hispanics, in total, are shown as a separate race group • States with >50% unknown race/ethnicity values are excluded • Cases with unknown race/ethnicity and sex values are re-distributed to known categories based on percent-age of cases in each sex and race group • Total cases may not equal male plus female cases because of rounding in the re-distribution process • Total U.S. cases are unadjusted (no exclusions or re-distributions) and match National Table 1A • Total U.S. cases with unknown sex are included in the Totals STD source: 2009 CDC STD Surveillance Report, Table 11A (cases by race/ethnicity group) and Tables 1, 3-5 (Total U.S.)
Table 2B Data source: STDSS Age-Race/Ethnicity-Sex fi les with exclusions and re-distributions (race/ethnicity rates) and unadjusted STDSS Morbidity file (Total U.S.) • Population source: NCHS bridged-race file of the U.S. Census 2000 population with exclusions (rates of race/ethnicity groups) or no exclusions (Total U.S.) • 2009 rates are computed using 2008 populations STD source: 2009 CDC STD Surveillance Report, Table 11B (rates by race/ethnicity group) and Tables 1, 3-5 (Total U.S.)
Table 3A Data source: STDSS Age-Race/Ethnicity-Sex fi les, 2009 and STDSS Morbidity file • All races, including AI/ANs, are non-Hispanic; Hispanics, in total, are shown as a separate race group • No states are excluded • Cases with unknown race/ethnicity and sex values are re-distributed to known categories based on percentage of cases in each sex and race group • Total cases may not equal male plus female cases because of rounding in the re-distribution process • Total U.S. cases are adjusted (no exclusions or re-distributions) and match National Table 1A • Total U.S. cases with unknown sex are included in the Totals STD source: 2009 CDC STD Surveillance Report, Table 10, 11A and 11B (cases by race/ethnicity group) and Tables 1, 3-5 (Total U.S.)
Table 3B Data source: STDSS Age-Race/Ethnicity-Sex fi les with exclusions and re-distributions (race/ethnicity rates) and adjusted STDSS Morbidity file (Total U.S.) • Population source: NCHS bridged-race file of the U.S. Census 2000 population with exclusions (rates of race/ethnicity groups) or no exclusions (Total U.S.) • Rates among persons 0-9 years of age are not shown as an age group but are included in the All Ages Total • 2009 rates are computed using 2008 populations STD source: 2009 CDC STD Surveillance Report, Table 10, 11A and 11B (rates by race/ethnicity group) and Tables 10 (Total U.S.)
Table 4A Data source: STDSS Age-Race/Ethnicity-Sex fi les, 1984-2009 and STDSS Morbidity file • All races, including AI/ANs, are non-Hispanic; Hispanics, in total, are shown as a separate race group • States with >50% unknown race/ethnicity values are excluded • Cases with unknown race/ethnicity and sex values are re-distributed to known categories based on percent-age of cases in each sex and race group • Total cases may not equal male plus female cases because of rounding in the re-distribution process • Total U.S. cases are unadjusted (no exclusions or re-distributions) and match National Table 1A • Total U.S. cases with unknown sex are included in the Totals STD source: 2009 CDC STD Surveillance Report, Table 21A (cases by race/ethnicity group) and Tables 1, 13-15 (Total U.S.)
Table 4B Data source: STDSS Age-Race/Ethnicity-Sex fi les with exclusions and re-distributions (race/ethnicity rates) and un-adjusted STDSS Morbidity file (Total U.S.) • Population source: NCHS bridged-race file of the U.S. Census 2000 population with exclusions, 1990-1998 (rates of race/ ethnicity groups) or no exclusions (Total U.S.) • 2009 rates are computed using 2008 populations STD source: 2009 CDC STD Surveillance Report, Table 21B (rates by race/ethnicity group) and Tables 1, 13-15 (Total U.S.)
Table 5A Data source: STDSS Age-Race/Ethnicity-Sex files, 2009 • All races, including AI/ANs, are non-Hispanics, Hispanics, in total, are shown as a separate race group • No states are excluded • Cases with unknown race/ethnicity and sex values are redistributed to known categories based on percentage of cases in each sex and race group • Total cases may not equal male plus female cases because of rounding in the re-distribution process • Cases among persons 0-9 years of age are not shown as an age group but are included in the All Ages Total • Total U.S. cases are adjusted (no exclusions but cases of unknown sex and age are re-distributed to known age and sex groups) STD source: 2009 CDC STD Surveillance Report, Table 21B (cases by race/ethnicity group) and Table 20 (Total U.S.)
Table 5B Data source: STDSS Age-Race/Ethnicity-Sex fi les, 2009 with exclusions and re-distributions (race/ethnicity rates) and unadjusted STDSS Morbidity file (Total U.S.) • Population source: NCHS bridged-race file of the U.S. Census 2000 population with exclusions (rates of race/ethnicity groups) or no exclusions (Total U.S.) • Rates among persons 0-9 years of age are not shown as an age group but are included in the All Ages Total • 2009 rates are computed using 2008 populations STD source: 2009 CDC STD Surveillance Report, Table 21B (rates by race/ethnicity group) and Tables 20 (Total U.S.)
Indian Health S
urveillance Report
Sexually Transm
itted Diseases 2009
96

Table 6A Data source: STDSS Age-Race/Ethnicity-Sex fi les, 1996-2009 and STDSS Morbidity file • All races, including AI/ANs, are non-Hispanic; Hispanics, in total, are shown as a separate race group • States with >50% unknown race/ethnicity values are excluded • Cases with unknown race/ethnicity and sex values are re-distributed to known categories based on percentage of cases in each sex and race group • Total cases may not equal male plus female cases because of rounding in the re-distribution process • Total U.S. cases are unadjusted (no exclusions or re-distributions) and match National Table 1A • Total U.S. cases with unknown sex are included in the Totals STD source: 2009 CDC STD Surveillance Report, Table 33A (cases by race/ethnicity group) and Tables 1, 25-27 (Total U.S.)
Table 6B Data source: STDSS Age-Race/Ethnicity-Sex fi les with exclusions and re-distributions (race/ethnicity rates) and unadjusted STDSS Morbidity file (Total U.S.) • Population source: NCHS bridged-race file of the U.S. Census 2000 population with exclusions, 1990-1989 (rates of race/ ethnicity groups) or no exclusions (Total U.S.) • 2009 rates are computed using 2008 populations STD source: 2009 CDC STD Surveillance Report, Table 33B (rates by race/ethnicity group) and Tables 1, 25-27 (Total U.S.)
Table 7A Data source: STDSS Age-Race/Ethnicity-Sex files, 2009 • All races, including AI/ANs, are non-Hispanics, Hispanics, in total, are shown as a separate race group • No states are excluded • Cases with unknown age, race/ethnicity and sex values are redistributed to known categories based on percentage of cases in each age, race and sex group • Total cases may not equal male plus female cases because of rounding in the redistribution process • Cases among persons 0-9 years of age are not shown as an age group but are included in the All Ages Total • Total U.S. cases are adjusted (no exclusions but cases of unknown sex and age are re-distributed to known age and sex groups) STD source: 2009 CDC STD Surveillance Report, Table 33A (cases by race/ethnicity group) and Table 33 (Total U.S.)
Table 7B Data source: STDSS Age-Race/Ethnicity-Sex fi les, 2009 with redistributions for race/ethnicity rates and Total U.S. rate Population source: NCHS bridged-race file of the U.S. Census 2000 population (rates of race/ethnicity groups) or no exclusions (Total U.S.) • Rates among persons 0-9 years of age are not shown as an age group but are included in the All Ages Total • 2009 rates are computed using 2008 populations STD source: 2009 CDC STD Surveillance Report, Table 33B (rates by race/ethnicity group) and Table 32 (Total U.S.)
Table 8A: IHS Area—Chlamydia cases by year Data source: NETSS, 1998-2009 (IHS cases) and STDSS Morbidity file (U.S. Total cases) • AI/AN cases include AI/AN Hispanics • IHS cases are all AI/AN cases reported from IHS service counties. If counties are split between IHS Areas, the cases are proportioned to each IHS Area based on established percentages (Appendix B). • States with >50% unknown race/ethnicity values are excluded (see the IHS Area STD Profiles section for details) • Cases with unknown age, race/ethnicity and sex values are re-distributed to known categories based on percentage of cases in each race group • Total cases may not equal male plus female cases because of rounding in the redistribution process • Total U.S. cases are unadjusted and match IHS National Table 1A. STD source for Total U.S. cases: 2009 CDC STD Surveillance Report, Tables 1 and 3-5
Table 8B: IHS Area—Chlamydia rates by year Population source: NCHS bridged-race file of the U.S. Census 2000 population with exclusions for IHS • AI/ AN Hispanics are included in the AI/AN populations • IHS populations are based on AI/AN living in IHS service counties. If counties are split between IHS Areas, the populations are proportioned based on established percentages (Appendix B) • Total U.S. rates are unadjusted • 2009 Total U.S. rates are computed using 2008 populations STD source for Total U.S. rates: 2009 CDC Surveillance Report, Tables 1 and 3-5
Table 9A: IHS Area—Chlamydia cases by age group Data source: NETSS, 1998-2009 (IHS cases) and STDSS Age-Race/Ethnicity-Sex file, 2009 (U.S. Total cases) • AI/ AN cases include AI/AN Hispanics • IHS cases are all AI/ AN cases reported from IHS service counties. If counties are split between IHS Areas, the cases are proportioned to each IHS Area based on established percentages (Appendix B) • No states are excluded • Cases with unknown age, race/ ethnicity values are re-distributed to known categories based on percentage of cases in each race group • Cases among persons 0-9 years of age are not shown as an age group but are included in the All Ages Total • Total cases may not equal male plus female cases because of rounding in the re-distribution process • Adjusted Total U.S. cases have no exclusions but age and sex unknowns are re-distributed. STD source for Total U.S. cases: 2009 CDC STD Surveillance Report, Table 10
Table 9B: IHS Area—Chlamydia rates by age group Population source: NCHS bridged-race file of the U.S. Census 2000 population with exclusions for IHS • AI/ AN Hispanics are included in the AI/AN populations • IHS populations are based on AI/AN living in IHS service counties. If counties are split between IHS Areas, the populations are proportioned based on established percentages (Appendix B) • Rates among persons 0-9 years of age are not shown as an age group but are included in the All Ages Total • 2009 Total U.S. rates are computed using 2008 populations. STD source for Total U.S. rates: 2009 CDC STD Surveillance Report, Table 10
Table 10A: IHS Area—Gonorrhea cases by year Data source: NETSS, 1998-2009 (IHS cases) and STDSS Morbidity file (U.S. Total cases) • AI/AN cases include AI/ AN Hispanics • IHS cases are all AI/AN cases reported from IHS service counties. If counties are split between IHS Areas, the cases are proportioned to each IHS Area based on established percentages (Appendix B). • States with >50% unknown race/ethnicity values are excluded (see the IHS Area STD Profiles section for details) • Cases with unknown age, race/ethnicity and sex values are re-distributed to known categories based on percentage of cases in each race group • Total U.S. cases are unadjusted and match IHS National Table 1A STD source for Total U.S. cases: 2009 CDC STD Surveillance Report, Tables 1 and 13-15
Table Notes
97
Table 10B: IHS Area—Gonorrhea cases by year Population source: NCHS bridged-race file of the U.S. Census 2000 population with exclusions for IHS • AI/AN Hispanics are included in the AI/AN populations • IHS populations are based on AI/AN living in IHS service counties. If counties are split between IHS Areas, the populations are proportioned based on established percentages (Appendix B) • Total U.S. rates are unadjusted and match National Table 1B • 2009 Total U.S. rates are computed using 2008 populations. STD source for Total U.S. rates: 2009 CDC Surveillance Report, Tables 1 and 13-15
Table 11A: IHS Area—Gonorrhea cases by age group Data source: NETSS, 1998-2009 (IHS cases) and STDSS Age Race/Ethnicity-Sex file, 2009 (U.S. Total cases) • AI/ AN cases include AI/AN Hispanics • IHS cases are all AI/AN cases reported from IHS service counties. If counties are split between IHS Areas, the cases are proportioned to each IHS Area based on established percentages (Appendix B) • No states are excluded • Cases with unknown age, race/ethnicity and sex values are re-distributed to known categories based on percentage of cases in each race group • Total cases may not equal male plus female cases because of rounding in the redistribution process • Cases among persons 0-9 years of age are not shown as an age group but are included in the All Ages Total • Adjusted Total U.S. cases by sex and age have no exclusions but age and sex unknowns are re-distributed STD source for Total U.S. cases: 2009 CDC STD Surveillance Report, Table 20
Table 11B: IHS Area—Gonorrhea rates by age group Population source: NCHS bridged-race file of the U.S. Census 2000 population with exclusions for IHS • AI/AN Hispanics are included in the AI/AN populations • IHS Populations are based on AI/ANs living in IHS service counties. If counties are split between IHS Areas, the populations are proportioned based on established percentages (Appendix B) • Rates among persons 0-9 years of age are not shown as an age group but are included in the All Ages Total • 2009 Total U.S. rates are computed using 2008 populations. STD source for Total U.S. rates: 2009 CDC STD Surveillance Report, Table 20
Table 12A: IHS Area—P&S cases by year Data source: NETSS, 1998-2009 (IHS cases) and STDSS Morbidity file (U.S. Total cases) • AI/AN cases include AI/ AN Hispanics • IHS cases are all AI/AN cases reported from IHS service counties. If counties are split between IHS Areas, the cases are proportioned to each IHS Area based on established percentages (Appendix B). • States with >50% unknown race/ethnicity values are excluded (see the IHS Area STD Profiles section for details) • Cases with unknown age, race/ethnicity and sex values are re-distributed to known categories based on percentage of cases in each race group • Total U.S. cases are unadjusted and match IHS National Table 1A STD source for Total U.S. cases: 2009 CDC STD Surveillance Report, Tables 1 and 26-28
Table 12B: IHS Area—P&S rates by year Population source: NCHS bridged-race file of the U.S. Census 2000 population with exclusions for IHS • AI/AN Hispanics are included in the AI/AN populations • IHS Populations are based on AI/ANs living in IHS service counties. If counties are split between IHS Areas, the populations are proportioned based on established percentages (Appendix B) • Total U.S. rates are unadjusted and match National Table 1B • 2009 Total U.S. rates are computed using 2008 populations. STD source for Total U.S. rates: 2009 CDC Surveillance Report, Tables 1 and 26-28
Table 13A: IHS Area—P&S cases by age group Data source: NETSS, 1998-2009 (IHS cases) and STDSS Age-Race/Ethnicity-Sex file, 2009 (U.S. Total cases) • AI/ AN cases include AI/AN Hispanics • IHS cases are all AI/ AN cases reported from IHS service counties. If counties are split between IHS Areas, the cases are proportioned to each IHS Area based on established percentages (Appendix B) • No states are excluded • Cases with unknown age, race/ ethnicity values are redistributed to known categories based on percentage of cases in each race group • Cases among persons 0-9 years of age are not shown as an age group but are included in the All Ages Total • Total cases may not equal male plus female cases because of rounding in the re-distribution process • Adjusted Total U.S. cases by sex and age have no exclusions but are redistributed. STD source for Total U.S. cases: 2009 CDC STD Surveillance Report, Table 33
Table 13B: IHS Area—P&S rates by age group Population source: NCHS bridged-race file of the U.S. Census 2000 population with exclusions for IHS • AI/AN Hispanics are included in the AI/AN populations • IHS Populations are based on AI/ANs living in IHS service counties. If counties are split between IHS Areas, the populations are proportioned based on established percentages (Appendix B) • Rates among persons 0-9 years of age are not shown as an age group but are included in the All Ages Total • 2009 Total U.S. rates are computed using 2008 populations. STD source for Total U.S. rates: 2009 CDC STD Surveillance Report, Table 33
Indian Health S
urveillance Report
Sexually Transm
itted Diseases 2009
98
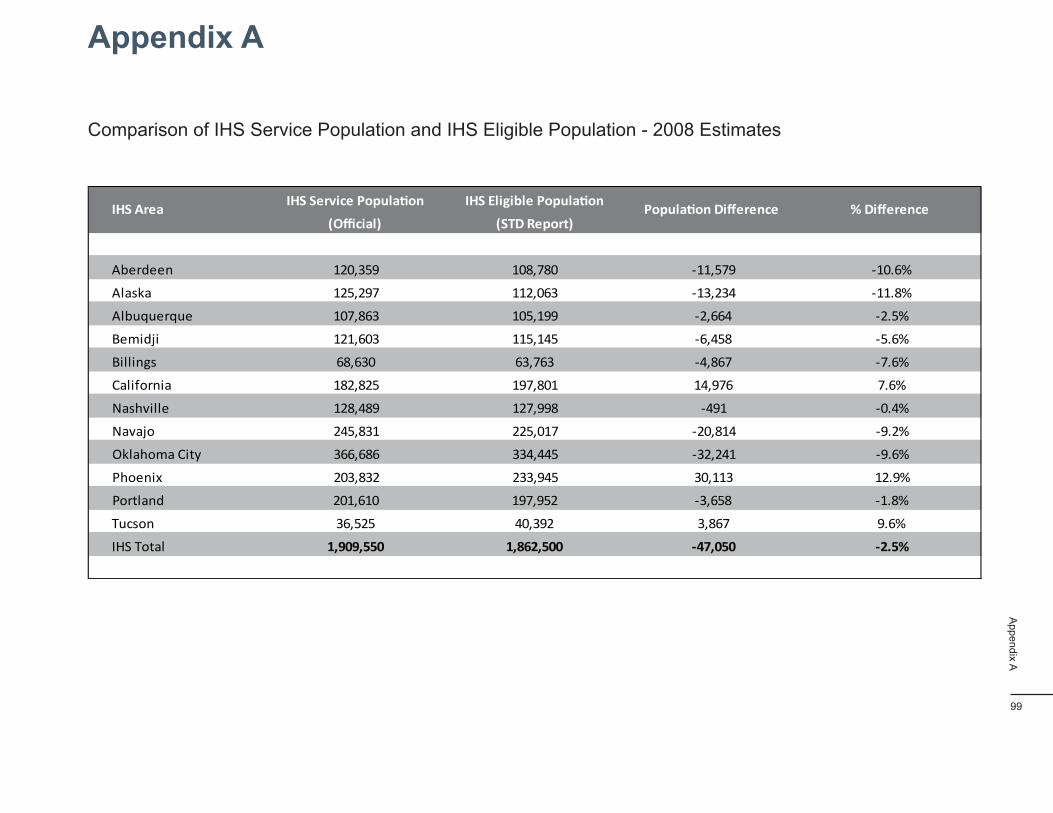
Appendix A
Comparison of IHS Service Population and IHS Eligible Population - 2008 Estimates
IHS Area IHS Service PopulaƟon
(Oĸcial)
IHS Eligible PopulaƟon
(STD Report) PopulaƟon Diīerence % Diīerence
Aberdeen 120,359 108,780 -11,579 -10.6%
Alaska 125,297 112,063 -13,234 -11.8%
Albuquerque 107,863 105,199 -2,664 -2.5%
Bemidji 121,603 115,145 -6,458 -5.6%
Billings 68,630 63,763 -4,867 -7.6%
California 182,825 197,801 14,976 7.6%
Nashville 128,489 127,998 -491 -0.4%
Navajo 245,831 225,017 -20,814 -9.2%
Oklahoma City 366,686 334,445 -32,241 -9.6%
Phoenix 203,832 233,945 30,113 12.9%
Portland 201,610 197,952 -3,658 -1.8%
Tucson 36,525 40,392 3,867 9.6%
IHS Total 1,909,550 1,862,500 -47,050 -2.5%
Appendix A
99
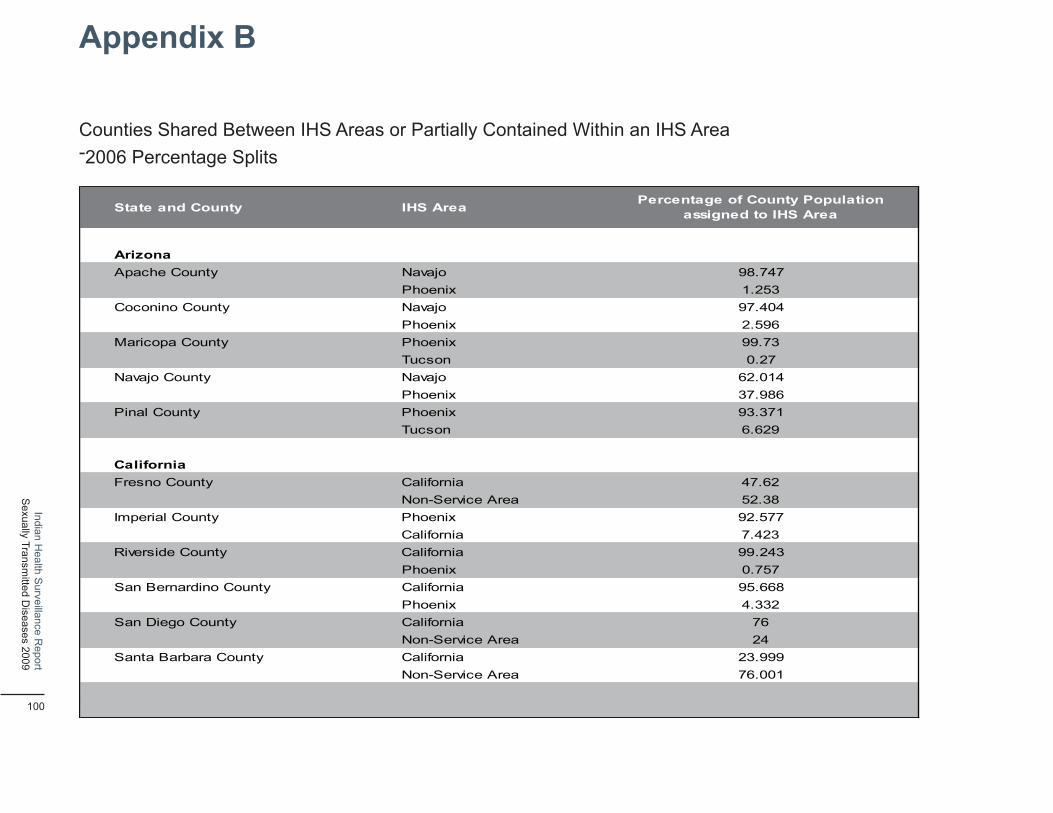
Appendix B
Indian Health S
urveillance Report
Sexually Transm
itted Diseases 2009
Counties Shared Between IHS Areas or Partially Contained Within an IHS Area -2006 Percentage Splits
State and County IHS Area Percentage of County Population assigned to IHS Area
Arizona Apache County Navajo
Phoenix 98.747 1.253
Coconino County Navajo Phoenix
97.404 2.596
Maricopa County Phoenix Tucson
99.73 0.27
Navajo County Navajo Phoenix
62.014 37.986
Pinal County Phoenix Tucson
93.371 6.629
California Fresno County California
Non-Service Area 47.62 52.38
Imperial County Phoenix California
92.577 7.423
Riverside County California Phoenix
99.243 0.757
San Bernardino County California Phoenix
95.668 4.332
San Diego County California Non-Service Area
76 24
Santa Barbara County California Non-Service Area
23.999 76.001
100
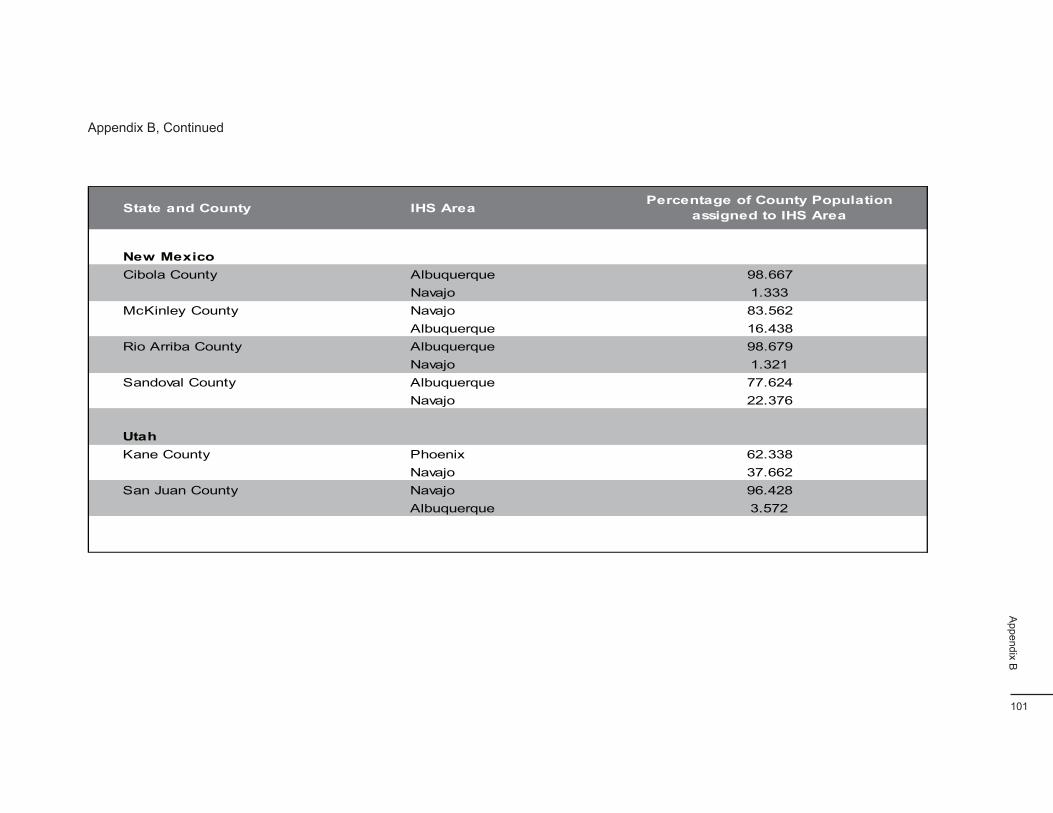
Appendix B, Continued
State and County IHS Area Percentage of County Population assigned to IHS Area
New Mexico Cibola County Albuquerque
Navajo 98.667 1.333
McKinley County Navajo Albuquerque
83.562 16.438
Rio Arriba County Albuquerque Navajo
98.679 1.321
Sandoval County Albuquerque Navajo
77.624 22.376
Utah Kane County Phoenix
Navajo 62.338 37.662
San Juan County Navajo Albuquerque
96.428 3.572
Appendix B
101
References
Indian Health S
urveillance Report
Sexually Transm
itted Diseases 2009
1. Indian Health Service. Regional Differences in Indian Health, 2002-2003 Edition. Washington, DC: U.S. Department of Health and Human Services, 2008. 2. Indian Health Service. Trends in Indian Health, 2002-2003 Edition. Washington, DC: U.S. Department of Health and Human Services, February, 2009. 3. Centers for Disease Control and Prevention. Sexually Transmitted Disease Surveillance, 2009. Atlanta, GA: U.S. Department of Health and Human
Services, November, 2010. 4. Wong D, Swint E, Paisano, EL, Cheek JE. Indian Health Surveillance Report—Sexually Transmitted Diseases 2004. Atlanta, GA: U.S. Department of
Health and Human Services, Centers for Disease Control and Prevention and Indian Health Service, November 2006. 5. Centers for Disease Control and Prevention and the Indian Health Service. Indian Health Surveillance Report—Sexually Transmitted Diseases 2007.
Atlanta, GA: U.S. Department of Health and Human Services, September 2009. 6. Indian Health Service. Projected American Indian and Alaska Native IHS Service Population by Area, 2009, December 2010 7. Centers for Disease Control and Prevention. Summary of Notifiable Diseases—United States, 2009. Morbidity and Mortality Weekly Report. May 13,
2011;58(53):1-100. 8. National Center for Health Statistics. Data Files and Documentation: Vintage 2007 Bridged-Race Postcensal Population Estimates. Assessed at http://www.
cdc.gov/nchs/about/major/dvs/popbridge/datadoc.htm 9. Office of Management and Budget. Revisions to the Standards for the Classification of Federal Data on Race and Ethnicity. Washington, DC. October 1997.
Accessed at http://www.whitehouse.gov/omb/fedreg/ombdir15.html 10. Centers for Disease Control, CDC Wonder: Intercensal Population Estimates, Bureau of the Census, Ethnicity, 1981-1989. Accessed at http://wonder.cdc.
gov/wonder/sci_data/census/inter/type_txt/i8189eth.asp 11. Indian Health Service. Geographic Composition of the Contract Health Service Deliver Areas (CHSDA) and Service Delivery Areas (SDA) of the Indian
Health Service. 72 Federal Register 119 (31 June 2007), p. 34262. Accessed at http://www.ihs.gov/nonmedicalprograms/chs/documents/chsda_federal_ register_notice_june_21_2007.doc
12. U.S. Department of Health and Human Services. Healthy People 2010. 2nd Ed. Understanding and Improving Health and Objectives for Improving Health. 2 vols. Washington, DC: U.S. Government Printing Office, November 2000.
13. Indian Health Service. Adjusting for miscoding of Indian race on state death certificates. (Report) Rockville, MD: US Public Health Service; 1996. 14. Thoroughman DA, Frederickson D, Cameron HD, Shelby LK, Cheek JE. Racial misclassification of American Indians in Oklahoma State surveillance data
for sexually transmitted diseases. American Journal of Epidemiology. 2002;155(12):1137-41. 15. Centers for Disease Control and Prevention. Case definitions for infectious conditions under public health surveillance, 1997;46 (No. RR-10;1). 16. Dicker LW, Mosure DJ, Levine WC. Chlamydia positivity versus prevalence: what’s the difference? Sexually Transmitted Diseases. 1998;25:251-3.
102
17. Weinstock H, Berman S, Cates W. Sexually transmitted diseases among American youth: incidence and prevalence estimates, 2000. Perspectives on Sexual and Reproductive Health. 2004;36(1):6-10.
18. Chesson HW, Blandford JM, Gift TL, Tao G, Irwin KL. The estimated direct medical cost of Sexually Transmitted Diseases among American youth, 2000. Perspectives on Sexual and Reproductive Health. 2004;36(1):11-19.
19. U.S. Census Bureau. The American Indian and Alaska Native Population 2000—Census 2000 Brief. Washington, DC:U.S. Census Bureau, February 2002.
20. Centers for Disease Control and Prevention. Sexually Transmitted Disease Surveillance, 2008. Atlanta, GA: U.S. Department of Health and Human Services, November, 2009.
21. Division of STD Prevention. Tracking the Hidden Epidemics: Trends in STDs in the United States 2000. Atlanta, GA: Department of Health and Human Services; 2000:1-33.
22. Cates W Jr, Wasserheit JN. Genital chlamydial infections: epidemiology and reproductive sequelae. American Journal of Obstetrics and Gynecology. 1991;164:1771-81.
23. Fleming DT, Wasserheit JN. From epidemiological synergy to public health policy and practice: The contribution of other sexually transmitted diseases to sexual transmission of HIV infection. Sexually Transmitted Infections. 1999;75:3-17.
24. Holmes KK, Mardh PA, Sparling PF, et al. Sexually Transmitted Diseases, 3rd Edition, McGraw Hill. 1999. p1165-89. 25. Divisions of STD Prevention. The National Plan to Eliminate Syphilis from the United States. National Center of HIV, STD, and TB Prevention, Centers
for Disease Control and Prevention, 1999. 26. Centers for Disease Control and Prevention. Primary and Secondary Syphilis—United States, 2003-2004. MMWR. 2006;55(10): 269-273.
References
103

U.S. DEPARTMENT OF HEALTH AND HUMAN SERVICES Centers for Disease Control and Prevention Indian Health Service
January 2012