indian and ramona warehouse - .net framework
TRANSCRIPT

Indian and Ramona Warehouse AIR QUALITY IMPACT ANALYSIS CITY OF PERRIS
PREPARED BY: Haseeb Qureshi, MES [email protected] (949) 336-5987 Alyssa Tamase [email protected] (949) 336-5988 FEBRUARY 13, 2019 (REVISED) NOVEMBER 1, 2018 11705-05 AQ Report


Indian and Ramona Warehouse Air Quality Impact Analysis
11705-05 AQ Report
i
TABLE OF CONTENTS
TABLE OF CONTENTS ........................................................................................................................... I APPENDICES ....................................................................................................................................... I LIST OF EXHIBITS ................................................................................................................................. I LIST OF TABLES ................................................................................................................................... I LIST OF ABBREVIATED TERMS ............................................................................................................. II EXECUTIVE SUMMARY ....................................................................................................................... 1 1 INTRODUCTION ......................................................................................................................... 3
1.1 Site Location .................................................................................................................................. 3 1.2 Project Description ........................................................................................................................ 3 1.3 PVCC SP EIR Mitigation Measures ................................................................................................. 6 1.4 Construction-Source and Operational-Source Mitigation Measures ......................................... 10
2 AIR QUALITY SETTING .............................................................................................................. 12
2.1 South Coast Air Basin .................................................................................................................. 12 2.2 Regional Climate ......................................................................................................................... 12 2.3 Wind Patterns and Project Location ........................................................................................... 14 2.4 Existing Air Quality ...................................................................................................................... 14 2.5 Regional Air Quality .................................................................................................................... 17 2.6 Local Air Quality .......................................................................................................................... 17 2.7 Regulatory Background ............................................................................................................... 22 2.8 Regional Air Quality Improvement ............................................................................................. 24 2.9 Existing Project Site Air Quality Conditions ................................................................................ 34
3 PROJECT AIR QUALITY IMPACT ................................................................................................ 36
3.1 Introduction ................................................................................................................................ 36 3.2 Standards of Significance ............................................................................................................ 36 3.3 California Emissions Estimator Model™ Employed to Estimate AQ Emissions .......................... 36 3.4 Construction Emissions ............................................................................................................... 37 3.5 Operational Emissions ................................................................................................................ 40 3.6 Localized Significance - Construction Activity ............................................................................. 44 3.7 Localized Significance – Long-Term Operational Activity ........................................................... 49 3.8 CO “Hot Spot” Analysis ............................................................................................................... 50 3.9 Air Quality Management Planning .............................................................................................. 52 3.10 Potential Impacts to Sensitive Receptors ................................................................................... 54 3.11 Odors ........................................................................................................................................... 54 3.12 Cumulative Impacts .................................................................................................................... 55
4 FINDINGS & CONCLUSIONS ...................................................................................................... 57
Construction-Source Emissions ............................................................................................................. 57 Operational-Source Emissions ............................................................................................................... 57
5 REFERENCES ............................................................................................................................ 59 6 CERTIFICATION ........................................................................................................................ 62

Indian and Ramona Warehouse Air Quality Impact Analysis
11705-05 AQ Report
i
APPENDICES
APPENDIX 2.1: STATE/FEDERAL ATTAINMENT STATUS OF CRITERIA POLLUTANTS APPENDIX 3.1: CALEEMOD CONSTRUCTION (UNMITIGATED) EMISSIONS MODEL OUTPUTS APPENDIX 3.2: CALEEMOD OPERATIONAL EMISSIONS MODEL OUTPUTS APPENDIX 3.3: LST THRESHOLDS
LIST OF EXHIBITS
EXHIBIT 1-A: LOCATION MAP ............................................................................................................. 4 EXHIBIT 1-B: SITE PLAN ...................................................................................................................... 5 EXHIBIT 2-A: CALIFORNIA TOXIC AIR CONTAMINANT SITES ............................................................... 32 EXHIBIT 2-B: DIESEL PARTICULATE MATTER AND DIESEL VEHICLE MILES TREND ................................. 33 EXHIBIT 3-A: SENSITIVE RECEPTOR LOCATIONS ................................................................................ 47
LIST OF TABLES
TABLE ES-1: SUMMARY OF CEQA SIGNIFICANCE FINDINGS ................................................................. 1 TABLE 2-1: AMBIENT AIR QUALITY STANDARDS (1 OF 2).................................................................... 15 TABLE 2-1: AMBIENT AIR QUALITY STANDARDS (2 OF 2).................................................................... 16 TABLE 2-2: ATTAINMENT STATUS OF CRITERIA POLLUTANTS IN THE SOUTH COAST AIR BASIN (SCAB) 17 TABLE 2-3: PROJECT AREA AIR QUALITY MONITORING SUMMARY 2014-2016.................................... 18 TABLE 2-4: SOUTH COAST AIR BASIN OZONE TREND.......................................................................... 25 TABLE 2-5: SOUTH COAST AIR BASIN (NATIONAL 24-HOUR AVERAGE) PM10 TREND1 .......................... 26 TABLE 2-6: SOUTH COAST AIR BASIN (STATE 24-HOUR AVERAGE) PM10 TREND1 ................................. 26 TABLE 2-7: SOUTH COAST AIR BASIN (NATIONAL 24-HOUR AVERAGE) PM2.5 TREND1 .......................... 27 TABLE 2-8: SOUTH COAST AIR BASIN (STATE 24-HOUR AVERAGE) PM2.5 TREND1 ................................ 27 TABLE 2-9: SOUTH COAST AIR BASIN (NATIONAL 24-HOUR AVERAGE) CARBON MONOXIDE TREND ... 29 TABLE 2-10: SOUTH COAST AIR BASIN (STATE 24-HOUR AVERAGE) CARBON MONOXIDE TREND ........ 29 TABLE 2-11: SOUTH COAST AIR BASIN (NATIONAL 24-HOUR AVERAGE) NITROGEN DIOXIDE TREND ... 30 TABLE 2-12: SOUTH COAST AIR BASIN (STATE 24-HOUR AVERAGE) NITROGEN DIOXIDE TREND .......... 31 TABLE 3-1: MAXIMUM DAILY EMISSIONS THRESHOLDSA ................................................................... 37 TABLE 3-2: CONSTRUCTION DURATION ............................................................................................. 38 TABLE 3-3: CONSTRUCTION EQUIPMENT ASSUMPTIONS ................................................................... 39 TABLE 3-4: MAXIMUM DAILY PEAK CONSTRUCTION EMISSIONS SUMMARY ...................................... 40 (WITH NO MITIGATION EXCEPT FOR PVCC SP MITIGATION) .............................................................. 40 TABLE 3-5: MAXIMUM OPERATIONAL EMISSIONS SUMMARY ........................................................... 43 TABLE 3-6: MAXIMUM DAILY DISTURBED-ACREAGE .......................................................................... 45 TABLE 3-7: LOCALIZED SIGNIFICANCE SUMMARY OF CONSTRUCTION ................................................ 49 TABLE 3-8: LOCALIZED SIGNIFICANCE SUMMARY OF OPERATIONS .................................................... 50 TABLE 3-9: CO MODEL RESULTS ........................................................................................................ 50 TABLE 3-10: TRAFFIC VOLUMES ........................................................................................................ 52 TABLE 3-11: PROJECT PEAK TRAFFIC VOLUMES ................................................................................. 52

Indian and Ramona Warehouse Air Quality Impact Analysis
11705-05 AQ Report
ii
LIST OF ABBREVIATED TERMS
(1) Reference
µg/m3 Microgram per Cubic Meter
AADT Annual Average Daily Trips
AQIA Air Quality Impact Analysis
AQMD Air Quality Management District
AQMP Air Quality Management Plan
ARB California Air Resources Board
BACMs Best Available Control Measures
BMPs Best Management Practices
CAA Federal Clean Air Act
CAAQS California Ambient Air Quality Standards
CalEEMod California Emissions Estimator Model
Caltrans California Department of Transportation
CAPCOA California Air Pollution Control Officers Association
CARB California Air Resources Board
CCR California Code of Regulations
CEQA California Environmental Quality Act
CFR Code of Federal Regulations
CO Carbon Monoxide
DPM Diesel Particulate Matter
EPA Environmental Protection Agency
LST Localized Significance Threshold
MMs Mitigation Measures
NAAQS National Ambient Air Quality Standards
NO2 Nitrogen Dioxide
NOx Oxides of Nitrogen
Pb Lead
PM10 Particulate Matter 10 microns in diameter or less
PM2.5 Particulate Matter 2.5 microns in diameter or less
PPM Parts Per Million
Project Indian and Ramona Warehouse
PVCC SP Perris Valley Commerce Center Specific Plan
PVCC SP EIR Perris Valley Commerce Center Specific Plan
Environmental Impact Report
ROG Reactive Organic Gases
SCAB South Coast Air Basin

Indian and Ramona Warehouse Air Quality Impact Analysis
11705-05 AQ Report
iii
SCAQMD South Coast Air Quality Management District
SIPs State Implementation Plans
SRA Source Receptor Area
TAC Toxic Air Contaminant
TIA Traffic Impact Analysis
TOG Total Organic Gases
VMT Vehicle Miles Traveled
VOC Volatile Organic Compounds

Indian and Ramona Warehouse Air Quality Impact Analysis
11705-05 AQ Report
iv

Indian and Ramona Warehouse Air Quality Impact Analysis
11705-05 AQ Report 1
EXECUTIVE SUMMARY
The results of this Indian and Ramona Warehouse Air Quality Impact Analysis are summarized below based on the significance criteria in Section 3 of this report consistent with Appendix G of the California Environmental Quality Act (CEQA) Guidelines. (1). Table ES-1 shows the findings of significance for each potential air quality impact under CEQA. The Project is required to incorporate applicable mitigation measures from the Perris Valley Commerce Center Specific Plan (PVCCSP) Environmental Impact Report (EIR). Because these measures are a requirement for implementing projects within the PVCCSP, they are not considered to be project-specific mitigation measures.
TABLE ES-1: SUMMARY OF CEQA SIGNIFICANCE FINDINGS
Analysis Report Section
Significance Findings
Unmitigated Mitigated
Regional Construction Emissions 3.4 Less Than Significant n/a
Localized Construction Emissions 3.6 Less Than Significant n/a
Regional Operational Emissions 3.5 Less Than Significant n/a
Localized Operational Emissions 3.6 Less Than Significant n/a
CO “Hot Spot” Analysis 3.8 Less Than Significant n/a
Air Quality Management Plan 3.9 Less Than Significant n/a
Sensitive Receptors 3.10 Less Than Significant n/a
Odors 3.11 Less Than Significant n/a
Cumulative Impacts 3.12 Less Than Significant n/a

Indian and Ramona Warehouse Air Quality Impact Analysis
11705-05 AQ Report 2
This page intentionally left blank

Indian and Ramona Warehouse Air Quality Impact Analysis
11705-05 AQ Report
3
1 INTRODUCTION
This report presents the results of the air quality impact analysis (AQIA) prepared by Urban Crossroads, Inc., for the proposed Indian and Ramona Warehouse (“Project”). The purpose of this AQIA is to evaluate the potential impacts to air quality associated with construction and operation of the proposed Project and recommend measures to mitigate impacts considered potentially significant in comparison to thresholds established by the South Coast Air Quality Management District (SCAQMD).
1.1 SITE LOCATION
The proposed Indian and Ramona Warehouse site is located in the City of Perris on the northwest corner of Indian Avenue and Ramona Expressway within the Perris Valley Commerce Center Specific Plan (PVCC SP), as shown on Exhibit 1-A.
1.2 PROJECT DESCRIPTION
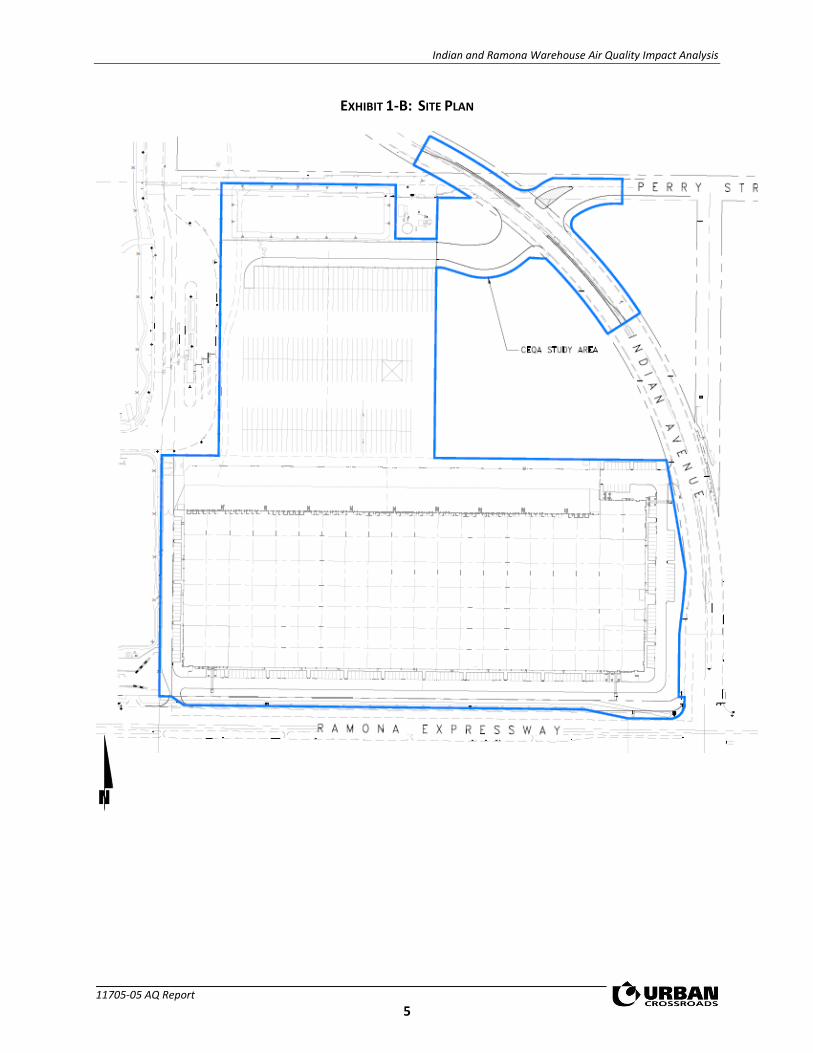
The Project is proposed to consist of a single high-cube transload and short-term storage warehouse building at approximately 428,730 square feet, as shown on Exhibit 1-B. Due to the location of the Project site in relation to APZ I and APZ II of the MARB/JPA, the Project has significant restrictions on its occupancy. At the time this air quality analysis was prepared, the future tenants of the proposed Project were unknown. To present the potential worst-case conditions, this analysis assumes the Project would be operational 24 hours per day, seven days per week. It is expected that the Project business operations would primarily be conducted within the enclosed buildings, except for traffic movement, parking, as well as loading and unloading of trucks at designated loading bays. This air quality analysis is intended to describe emission impacts associated with the expected typical industrial warehouse activities at the Project site. At the time of this analysis, no cold storage was planned at the Project site, and therefore is not analyzed in this report.
According to the Indian and Ramona Warehouse Traffic Impact Analysis prepared by Urban Crossroads, Inc., the Project is expected to generate a total of approximately 600 trip-ends per day (actual vehicles). (2) The Project trip generation includes 407 passenger cars and 193 truck trip-ends per day from Project operations within the Project site. This air study relies on the Project trips to accurately account for the effect of individual passenger car and truck trips on the study area roadway network.

Indian and Ramona Warehouse Air Quality Impact Analysis
11705-05 AQ Report
4
EXHIBIT 1-A: LOCATION MAP
Indian and Ramona Warehouse Air Quality Impact Analysis
11705-05 AQ Report
5
EXHIBIT 1-B: SITE PLAN

Indian and Ramona Warehouse Air Quality Impact Analysis
11705-05 AQ Report
6
1.3 PVCC SP EIR MITIGATION MEASURES
The PVCC SP EIR mitigation measures for air quality are shown below; the Project is required to comply with all of these mitigation measures.
MM Air 1
To identify potential implementing development project-specific impacts resulting from construction activities, proposed development projects that are subject to CEQA shall have construction-related air quality impacts analyzed using the latest available URBEMIS model, or other analytical method determined in conjunction with the SCAQMD. The results of the construction-related air quality impacts analysis shall be included in the development project’s CEQA documentation. To address potential localized impacts, the air quality analysis may incorporate SCAQMD’s Localized Significance Threshold analysis or other appropriate analyses as determined in conjunction with SCAQMD. If such analyses identify potentially significant regional or local air quality impacts, the City shall require the incorporation of appropriate mitigation to reduce such impacts. This mitigation measure was completed with preparation of this report.
MM Air 2
Each individual implementing development project shall submit a traffic control plan prior to the issuance of a grading permit. The traffic control plan shall describe in detail safe detours and provide temporary traffic control during construction activities for that project. To reduce traffic congestion, the plan shall include, as necessary, appropriate, and practicable, the following: temporary traffic controls such as a flag person during all phases of construction to maintain smooth traffic flow, dedicated turn lanes for movement of construction trucks and equipment on- and off-site, scheduling of construction activities that affect traffic flow on the arterial system to off-peak hour, consolidating truck deliveries, rerouting of construction trucks away from congested streets or sensitive receptors, and/or signal synchronization to improve traffic flow.
MM Air 3
To reduce fugitive dust emissions, the development of each individual implementing development project shall comply with SCAQMD Rule 403. The developer of each implementing project shall provide the City of Perris with the SCAQMD-approved dust control plan, or other sufficient proof of compliance with Rule 403, prior to grading permit issuance. Dust control measures shall include, but are not limited to:
• requiring the application of non-toxic soil stabilizers according to manufacturers’ specifications to all inactive construction areas (previously graded areas inactive for 20 days or more, assuming no rain),
• keeping disturbed/loose soil moist at all times,
• requiring trucks entering or leaving the site hauling dirt, sand, or soil, or other loose materials on public roads to be covered,
• installation of wheel washers or gravel construction entrances where vehicles enter and exit unpaved roads onto paved roads, or wash off trucks and any equipment leaving the site each trip,

Indian and Ramona Warehouse Air Quality Impact Analysis
11705-05 AQ Report
7
• posting and enforcement of traffic speed limits of 15 miles per hour or less on all unpaved potions of the project site,
• suspending all excavating and grading operations when wind gusts (as instantaneous gust) exceed 25 miles per hour,
• appointment of a construction relations officer to act as a community liaison concerning on-site construction activity including resolution of issues related to PM10 generation,
• sweeping streets at the end of the day if visible soil material is carried onto adjacent paved public roads and use of SCAQMD Rule 1186 and 1186.1 certified street sweepers or roadway washing trucks when sweeping streets to remove visible soil materials,
• replacement of ground cover in disturbed areas as quickly as possible.
MM Air 4
Building and grading permits shall include a restriction that limits idling of construction equipment on site to no more than five minutes.
MM Air 5
Electricity from power poles shall be used instead of temporary diesel or gasoline-powered generators to reduce the associated emissions. Approval will be required by the City of Perris’ Building Division prior to issuance of grading permits.
MM Air 6
The developer of each implementing development project shall require, by contract specifications, the use of alternative fueled off-road construction equipment, the use of construction equipment that demonstrates early compliance with off-road equipment with the CARB in-use off-road diesel vehicle regulation (SCAQMD Rule 2449) and/or meets or exceeds Tier 3 standards with available CARB verified or USEPA certified technologies. Diesel equipment shall use water emulsified diesel fuel such as PuriNOX unless it is unavailable in Riverside County at the time of project construction activities. Contract specifications shall be included in project construction documents, which shall be reviewed by the City of Perris’ Building Division prior to issuance of a grading permit.
MM Air 7
During construction, ozone precursor emissions from mobile construction equipment shall be controlled by maintaining equipment engines in good condition and in proper tune per manufacturers’ specifications to the satisfaction of the City of Perris’ Building Division. Equipment maintenance records and equipment design specification data sheets shall be kept on-site during construction. Compliance with this measure shall be subject to periodic inspections by the City of Perris’ Building Division.
MM Air 8
Each individual implementing development project shall apply paints using either high volume low pressure (HVLP) spray equipment with a minimum transfer efficiency of at least 50 percent or other application techniques with equivalent or higher transfer efficiency.

Indian and Ramona Warehouse Air Quality Impact Analysis
11705-05 AQ Report
8
MM Air 9
To reduce VOC emissions associated with architectural coating, the project designer and contractor shall reduce the use of paints and solvents by utilizing pre-coated materials (e.g., bathroom stall dividers, metal awnings), materials that do not require painting, and require coatings and solvents with a VOC content lower than required under Rule 1113 to be utilized. The construction contractor shall be required to utilize “Super-Compliant” VOC paints, which are defined in SCAQMD’s Rule 1113. Construction specifications shall be included in building specifications that assure these requirements are implemented. The specifications for each implementing development project shall be reviewed by the City of Perris’ Building Division for compliance with this mitigation measure prior to issuance of a building permit for that project.
MM Air 10
To identify potential implementing development project-specific impacts resulting from operational activities, proposed development projects that are subject to CEQA shall have long-term operational-related air quality impacts analyzed using the latest available URBEMIS model, or other analytical method determined by the City of Perris as lead agency in conjunction with the SCAQMD. The results of the operational-related air quality impacts analysis shall be included in the development project’s CEQA documentation. To address potential localized impacts, the air quality analysis may incorporate SCAQMD’s Localized Significance Threshold analysis, CO Hot Spot analysis, or other appropriate analyses as determined by the City of Perris in conjunction with SCAQMD. If such analyses identify potentially significant regional or local air quality impacts, the City shall require the incorporation of appropriate mitigation to reduce such impacts.
A project-specific analysis addressing these topical areas is presented in Section 3.0 of this report.
MM Air 11
Signage shall be posted at loading docks and all entrances to loading areas prohibiting all on-site truck idling in excess of five minutes.
MM Air 13
In order to promote alternative fuels, and help support “clean” truck fleets, the developer/successor-in-interest shall provide building occupants and businesses with information related to SCAQMD’s Carl Moyer Program, or other state programs that restrict operations to “clean” trucks, such as 2007 or newer model year or 2010 compliant vehicles and information including, but not limited to, the health effect of diesel particulates, benefits of reduced idling time, CARB regulations, and importance of not parking in residential areas. If trucks older than 2007 model year would be used at a facility with three or more dock-high doors, the developer/successor-in-interest shall require, within one year of signing a lease, future tenants to apply in good-faith for funding for diesel truck replacement/retrofit through grant programs such as the Carl Moyer, Prop 1B, VIP [On-road Heavy Duty Voucher Incentive Program], HVIP [Hybrid and Zero-Emission Truck and Bus Voucher Incentive Project], and SOON [Surplus Off-Road Opt-in for NOX] funding programs, as identified on SCAQMD’s website (http://www.aqmd.gov). Tenants would be required to use those funds, if awarded.

Indian and Ramona Warehouse Air Quality Impact Analysis
11705-05 AQ Report
9
MM Air 14
Each implementing development project shall designate parking spaces for high-occupancy vehicles and provide larger parking spaces to accommodate vans used for ride sharing. Proof of compliance would be required prior to the issuance of occupancy permits.
MM Air 15
To identify potential implementing development project-specific impacts resulting from the use of diesel trucks, proposed implementing development projects that include an excess of 10 dock doors for a single building, a minimum of 100 truck trips per day, 40 truck trips with TRUs [Transport Refrigeration Units] per day, or TRU operations exceeding 300 hours per week, and that are subject to CEQA and are located adjacent to sensitive land uses; shall have a facility-specific Health Risk Assessment performed to assess the diesel particulate matter impacts from mobile-source traffic generated by that implementing development project. The results of the Health Risk Assessment shall be included in the CEQA documentation for each implementing development project.
A project-specific Health Risk Assessment has been prepared under separate cover.
MM Air 18
Prior to the approval of each implementing development project, the Riverside Transit Agency (RTA) shall be contacted to determine if the RTA has plans for the future provision of bus routing within any street that is adjacent to the implementing development project that would require bus stops at the project access points. If the RTA has future plans for the establishment of a bus route that will serve the implementing development project, road improvements adjacent to the project site shall be designed to accommodate future bus turnouts at locations established through consultation with the RTA. RTA shall be responsible for the construction and maintenance of the bus stop facilities. The area set aside for bus turnouts shall conform to RTA design standards, including the design of the contact between sidewalks and curb and gutter at bus stops and the use of ADA-compliant paths to the major building entrances in the project.
MM Air 19
In order to reduce energy consumption from the individual implementing development projects, applicable plans (e.g., electrical plans, improvement maps) submitted to the City shall include the installation of energy-efficient street lighting throughout the project site. These plans shall be reviewed and approved by the applicable City Department (e.g., City of Perris’ Building Division) prior to conveyance of applicable streets.
MM Air 20
Each implementing development project shall be encouraged to implement, at a minimum, an increase in each building’s energy efficiency 15 percent beyond Title 24 and reduce indoor water use by 25 percent. All reductions would be documented through a checklist to be submitted prior to issuance of building permits for the implementing development project with building plans and calculations.

Indian and Ramona Warehouse Air Quality Impact Analysis
11705-05 AQ Report
10
1.4 CONSTRUCTION-SOURCE AND OPERATIONAL-SOURCE MITIGATION MEASURES
The Project would not exceed any thresholds of significance for construction or operational-source emissions. It should be noted that the Project is required to comply with the applicable Perris Valley Commerce Center Specific Plan Environmental Impact Report (PVCC SP EIR) SCH No. 2009081086 (3) mitigation measures as identified in Section 1.3. As such, a less than significant impact would occur for Project-related construction and operational-source emissions and no mitigation beyond what those identified in the PVCC SP EIR would be required.

Indian and Ramona Warehouse Air Quality Impact Analysis
11705-05 AQ Report
11
This page intentionally left blank

Indian and Ramona Warehouse Air Quality Impact Analysis
11705-05 AQ Report
12
2 AIR QUALITY SETTING
This section provides an overview of the existing air quality conditions in the Project area and region. The air quality conditions in the Project area and region have not materially changed since the PVCC SP EIR was certified.
2.1 SOUTH COAST AIR BASIN
The Project site is located in the South Coast Air Basin (SCAB) within the jurisdiction of SCAQMD (4). The SCAQMD was created by the 1977 Lewis-Presley Air Quality Management Act, which merged four county air pollution control bodies into one regional district. Under the Act, the SCAQMD is responsible for bringing air quality in areas under its jurisdiction into conformity with federal and state air quality standards. As discussed above, the Project site is located within the South Coast Air Basin, a 6,745-square mile subregion of the SCAQMD, which includes portions of Los Angeles, Riverside, and San Bernardino Counties, and all of Orange County. The larger South Coast district boundary includes 10,743 square miles.
The SCAB is bounded by the Pacific Ocean to the west and the San Gabriel, San Bernardino, and San Jacinto Mountains to the north and east. The Los Angeles County portion of the Mojave Desert Air Basin is bounded by the San Gabriel Mountains to the south and west, the Los Angeles / Kern County border to the north, and the Los Angeles / San Bernardino County border to the east. The Riverside County portion of the Salton Sea Air Basin is bounded by the San Jacinto Mountains in the west and spans eastward up to the Palo Verde Valley.
2.2 REGIONAL CLIMATE
The regional climate has a substantial influence on air quality in the SCAB. In addition, the temperature, wind, humidity, precipitation, and amount of sunshine influence the air quality.
The annual average temperatures throughout the SCAB vary from the low to middle 60s (degrees Fahrenheit). Due to a decreased marine influence, the eastern portion of the SCAB shows greater variability in average annual minimum and maximum temperatures. January is the coldest month throughout the SCAB, with average minimum temperatures of 47°F in downtown Los Angeles and 36°F in San Bernardino. All portions of the SCAB have recorded maximum temperatures above 100°F.
Although the climate of the SCAB can be characterized as semi-arid, the air near the land surface is quite moist on most days because of the presence of a marine layer. This shallow layer of sea air is an important modifier of SCAB climate. Humidity restricts visibility in the SCAB, and the conversion of sulfur dioxide to sulfates is heightened in air with high relative humidity. The marine layer provides an environment for that conversion process, especially during the spring and summer months. The annual average relative humidity within the SCAB is 71 percent along the coast and 59 percent inland. Since the ocean effect is dominant, periods of heavy early morning fog are frequent and low stratus clouds are a characteristic feature. These effects decrease with distance from the coast.

Indian and Ramona Warehouse Air Quality Impact Analysis
11705-05 AQ Report
13
More than 90 percent of the SCAB’s rainfall occurs from November through April. The annual average rainfall varies from approximately nine inches in Riverside to fourteen inches in downtown Los Angeles. Monthly and yearly rainfall totals are extremely variable. Summer rainfall usually consists of widely scattered thunderstorms near the coast and slightly heavier shower activity in the eastern portion of the SCAB with frequency being higher near the coast.
Due to its generally clear weather, about three-quarters of available sunshine is received in the SCAB. The remaining one-quarter is absorbed by clouds. The ultraviolet portion of this abundant radiation is a key factor in photochemical reactions. On the shortest day of the year, there are approximately 10 hours of possible sunshine, and on the longest day of the year there are approximately 14½ hours of possible sunshine.
The importance of wind to air pollution is considerable. The direction and speed of the wind determines the horizontal dispersion and transport of the air pollutants. During the late autumn to early spring rainy season, the SCAB is subjected to wind flows associated with the traveling storms moving through the region from the northwest. This period also brings five to ten periods of strong, dry offshore winds, locally termed “Santa Anas” each year. During the dry season, which coincides with the months of maximum photochemical smog concentrations, the wind flow is bimodal, typified by a daytime onshore sea breeze and a nighttime offshore drainage wind. Summer wind flows are created by the pressure differences between the relatively cold ocean and the unevenly heated and cooled land surfaces that modify the general northwesterly wind circulation over southern California. Nighttime drainage begins with the radiational cooling of the mountain slopes. Heavy, cool air descends the slopes and flows through the mountain passes and canyons as it follows the lowering terrain toward the ocean. Another characteristic wind regime in the SCAB is the “Catalina Eddy,” a low level cyclonic (counterclockwise) flow centered over Santa Catalina Island which results in an offshore flow to the southwest. On most spring and summer days, some indication of an eddy is apparent in coastal sections.
In the SCAB, there are two distinct temperature inversion structures that control vertical mixing of air pollution. During the summer, warm high-pressure descending (subsiding) air is undercut by a shallow layer of cool marine air. The boundary between these two layers of air is a persistent marine subsidence/inversion. This boundary prevents vertical mixing which effectively acts as an impervious lid to pollutants over the entire SCAB. The mixing height for the inversion structure is normally situated 1,000 to 1,500 feet above mean sea level.
A second inversion-type forms in conjunction with the drainage of cool air off the surrounding mountains at night followed by the seaward drift of this pool of cool air. The top of this layer forms a sharp boundary with the warmer air aloft and creates nocturnal radiation inversions. These inversions occur primarily in the winter, when nights are longer and onshore flow is weakest. They are typically only a few hundred feet above mean sea level. These inversions effectively trap pollutants, such as NOx and CO from vehicles, as the pool of cool air drifts seaward. Winter is therefore a period of high levels of primary pollutants along the coastline.

Indian and Ramona Warehouse Air Quality Impact Analysis
11705-05 AQ Report
14
2.3 WIND PATTERNS AND PROJECT LOCATION
The distinctive climate of the Project area and the SCAB is determined by its terrain and geographical location. The Basin is located in a coastal plain with connecting broad valleys and low hills, bounded by the Pacific Ocean in the southwest quadrant with high mountains forming the remainder of the perimeter.
Wind patterns across the south coastal region are characterized by westerly and southwesterly on-shore winds during the day and easterly or northeasterly breezes at night. Winds are characteristically light although the speed is somewhat greater during the dry summer months than during the rainy winter season.
2.4 EXISTING AIR QUALITY
Existing air quality is measured at established SCAQMD air quality monitoring stations. Monitored air quality is evaluated and in the context of ambient air quality standards. These standards are the levels of air quality that are considered safe, with an adequate margin of safety, to protect the public health and welfare. National Ambient Air Quality Standards (NAAQS) and California Ambient Air Quality Standards (CAAQS) currently in effect are shown in Table 2-1 (5).
The determination of whether a region’s air quality is healthful or unhealthful is determined by comparing contaminant levels in ambient air samples to the state and federal standards presented in Table 2-1. The air quality in a region is considered to be in attainment by the state if the measured ambient air pollutant levels for O3, CO, SO2, NO2, PM10, and PM2.5 are not equaled or exceeded at any time in any consecutive three-year period; and the federal standards (other than O3, PM10, PM2.5, and those based on annual averages or arithmetic mean) are not exceeded more than once per year. The O3 standard is attained when the fourth highest eight-hour concentration in a year, averaged over three years, is equal to or less than the standard. For PM10, the 24-hour standard is attained when 99 percent of the daily concentrations, averaged over three years, are equal to or less than the standard.

Indian and Ramona Warehouse Air Quality Impact Analysis
11705-05 AQ Report
15
TABLE 2-1: AMBIENT AIR QUALITY STANDARDS (1 OF 2)

Indian and Ramona Warehouse Air Quality Impact Analysis
11705-05 AQ Report
16
TABLE 2-1: AMBIENT AIR QUALITY STANDARDS (2 OF 2)

Indian and Ramona Warehouse Air Quality Impact Analysis
11705-05 AQ Report
17
2.5 REGIONAL AIR QUALITY
The SCAQMD monitors levels of various criteria pollutants at 38 permanent monitoring stations and 5 single-pollutant source Lead (Pb) air monitoring sites throughout the air district (6). In 2015, the federal and state ambient air quality standards (NAAQS and CAAQS) were exceeded on one or more days for ozone, PM10, and PM2.5 at most monitoring locations (7). No areas of the SCAB exceeded federal or state standards for NO2, SO2, CO, sulfates or lead. See Table 2-2, for attainment designations for the SCAB (8) (9). Appendix 2.1 provides geographic representation of the state and federal attainment status for applicable criteria pollutants within the SCAB.
TABLE 2-2: ATTAINMENT STATUS OF CRITERIA POLLUTANTS IN THE SOUTH COAST AIR BASIN (SCAB)
Criteria Pollutant State Designation Federal Designation
Ozone - 1hour standard Nonattainment Nonattainment (“Extreme”)
Ozone - 8 hour standard Nonattainment Nonattainment (“Extreme”)
PM10 Nonattainment Attainment (Maintenance)
PM2.5 Nonattainment Nonattainment (“Serious”)
Carbon Monoxide Attainment Attainment (Maintenance)
Nitrogen Dioxide Attainment Unclassifiable/Attainment
Sulfur Dioxide Attainment Unclassifiable/Attainment
Lead1 Attainment Nonattainment (Partial)
Source: State/Federal designations were taken from http://www.arb.ca.gov/desig/adm/adm.htm Note: See Appendix 2.1 for a detailed map of State/National Area Designations within the South Coast Air Basin
2.6 LOCAL AIR QUALITY
Relative to the Project site, the nearest long-term air quality monitoring site for Ozone (O3) and Particulate Matter ≤ 10 Microns (PM10) is the South Coast Air Quality Management District Perris monitoring station (SRA 24), located approximately 3.17 miles south of the Project site (10). Data for Carbon Monoxide (CO), Nitrogen Dioxide (NO2), Ultra-Fine Particulates (PM2.5), and Sulfur Dioxide (SO2) was obtained from the Metropolitan Riverside County 1 monitoring station (SRA 23), located approximately 11.69 miles northwest of the Project site, respectively. It should be noted that the Metropolitan Riverside County 1, station was utilized in lieu of the Perris monitoring station only where data was not available from the nearest monitoring site. The most recent three (3) years of data available is shown on Table 2-3 and identifies the number of days ambient air quality standards were exceeded for the study area, which is was considered to be representative of the local air quality at the Project site (11) (12).
1 The Federal nonattainment designation for lead is only applicable towards the Los Angeles County portion of the SCAB.

Indian and Ramona Warehouse Air Quality Impact Analysis
11705-05 AQ Report
18
TABLE 2-3: PROJECT AREA AIR QUALITY MONITORING SUMMARY 2014-2016
POLLUTANT STANDARD YEAR
2014 2015 2016
Ozone (O3)
Maximum 1-Hour Concentration (ppm) 0.117 0.124 0.131
Maximum 8-Hour Concentration (ppm) 0.094 0.102 0.098
Number of Days Exceeding State 1-Hour Standard > 0.09 ppm 16 25 23
Number of Days Exceeding State 8-Hour Standard > 0.07 ppm 63 50 56
Number of Days Exceeding Federal 1-Hour Standard > 0.12 ppm 0 0 1
Number of Days Exceeding Federal 8-Hour Standard > 0.075 ppm 38 31 30
Number of Days Exceeding Health Advisory ≥ 0.15 ppm -- -- --
Carbon Monoxide (CO)
Maximum 1-Hour Concentration (ppm) 2.0 2.5 1.7
Maximum 8-Hour Concentration (ppm) 1.9 1.7 1.3
Nitrogen Dioxide (NO2)
Maximum 1-Hour Concentration (ppm) 0.060 0.057 0.073
Annual Arithmetic Mean Concentration (ppm) 0.015 0.014 0.015
Number of Days Exceeding State 1-Hour Standard > 0.18 ppm 0 0 0
Sulfur Dioxide (SO2)
Maximum 1-Hour Concentration (ppm) 0.056 0.019 0.056
Particulate Matter ≤ 10 Microns (PM10)
Maximum 24-Hour Concentration (µg/m3) 100 107 82
Annual Arithmetic Mean (µg/m3) 42.0 37.1 36.9
Number of Samples 361 355 302
Number of Samples Exceeding State Standard > 50 µg/m3 101 68 58
Number of Samples Exceeding Federal Standard > 150 µg/m3 0 0 0
Particulate Matter ≤ 2.5 Microns (PM2.5)
Maximum 24-Hour Concentration (µg/m3) 48.9 54.7 39.1
Annual Arithmetic Mean (µg/m3) 12.5 11.9 12.5
Number of Samples Exceeding Federal 24-Hour Standard > 35 µg/m3 5 9 4 -- = data not available from SCAQMD or ARB
Criteria pollutants are pollutants that are regulated through the development of human health
based and/or environmentally based criteria for setting permissible levels. Criteria pollutants,
their typical sources, and health effects are identified below (13):
• Carbon Monoxide (CO): Is a colorless, odorless gas produced by the incomplete combustion of carbon-containing fuels, such as gasoline or wood. CO concentrations tend to be the highest during the winter morning, when little to no wind and surface-based inversions trap the pollutant

Indian and Ramona Warehouse Air Quality Impact Analysis
11705-05 AQ Report
19
at ground levels. Because CO is emitted directly from internal combustion engines, unlike ozone, motor vehicles operating at slow speeds are the primary source of CO in the Basin. The highest ambient CO concentrations are generally found near congested transportation corridors and intersections.
• Sulfur Dioxide (SO2): Is a colorless, extremely irritating gas or liquid. It enters the atmosphere as a pollutant mainly as a result of burning high sulfur-content fuel oils and coal and from chemical processes occurring at chemical plants and refineries. When SO2 oxidizes in the atmosphere, it forms sulfates (SO4). Collectively, these pollutants are referred to as sulfur oxides (SOX).
• Nitrogen Oxides (Oxides of Nitrogen, or NOx): Nitrogen oxides (NOx) consist of nitric oxide (NO), nitrogen dioxide (NO2) and nitrous oxide (N2O) and are formed when nitrogen (N2) combines with oxygen (O2). Their lifespan in the atmosphere ranges from one to seven days for nitric oxide and nitrogen dioxide, to 170 years for nitrous oxide. Nitrogen oxides are typically created during combustion processes, and are major contributors to smog formation and acid deposition. NO2 is a criteria air pollutant, and may result in numerous adverse health effects; it absorbs blue light, resulting in a brownish-red cast to the atmosphere and reduced visibility. Of the seven types of nitrogen oxide compounds, NO2 is the most abundant in the atmosphere. As ambient concentrations of NO2 are related to traffic density, commuters in heavy traffic may be exposed to higher concentrations of NO2 than those indicated by regional monitors.
• Ozone (O3): Is a highly reactive and unstable gas that is formed when volatile organic compounds (VOCs) and nitrogen oxides (NOX), both byproducts of internal combustion engine exhaust, undergo slow photochemical reactions in the presence of sunlight. Ozone concentrations are generally highest during the summer months when direct sunlight, light wind, and warm temperature conditions are favorable to the formation of this pollutant.
• PM10 (Particulate Matter less than 10 microns): A major air pollutant consisting of tiny solid or liquid particles of soot, dust, smoke, fumes, and aerosols. The size of the particles (10 microns or smaller, about 0.0004 inches or less) allows them to easily enter the lungs where they may be deposited, resulting in adverse health effects. PM10 also causes visibility reduction and is a criteria air pollutant.
• PM2.5 (Particulate Matter less than 2.5 microns): A similar air pollutant consisting of tiny solid or liquid particles which are 2.5 microns or smaller (which is often referred to as fine particles). These particles are formed in the atmosphere from primary gaseous emissions that include sulfates formed from SO2 release from power plants and industrial facilities and nitrates that are formed from NOX release from power plants, automobiles and other types of combustion sources. The chemical composition of fine particles highly depends on location, time of year, and weather conditions. PM2.5 is a criteria air pollutant.
• Volatile Organic Compounds (VOC): Volatile organic compounds are hydrocarbon compounds (any compound containing various combinations of hydrogen and carbon atoms) that exist in the ambient air. VOCs contribute to the formation of smog through atmospheric photochemical reactions and/or may be toxic. Compounds of carbon (also known as organic compounds) have different levels of reactivity; that is, they do not react at the same speed or do not form ozone to the same extent when exposed to photochemical processes. VOCs often have an odor, and some examples include gasoline, alcohol, and the solvents used in paints. Exceptions to the VOC designation include: carbon monoxide, carbon dioxide, carbonic acid, metallic carbides or carbonates, and ammonium carbonate. VOCs are a criteria pollutant since they are a precursor to O3, which is a criteria pollutant. The SCAQMD uses the terms VOC and ROG (see below) interchangeably.

Indian and Ramona Warehouse Air Quality Impact Analysis
11705-05 AQ Report
20
• Reactive Organic Gases (ROG): Similar to VOC, Reactive Organic Gases (ROG) are also precursors in forming ozone and consist of compounds containing methane, ethane, propane, butane, and longer chain hydrocarbons, which are typically the result of some type of combustion/decomposition process. Smog is formed when ROG and nitrogen oxides react in the presence of sunlight. ROGs are a criteria pollutant since they are a precursor to O3, which is a criteria pollutant. The SCAQMD uses the terms ROG and VOC (see previous) interchangeably.
• Lead (Pb): Lead is a heavy metal that is highly persistent in the environment. In the past, the primary source of lead in the air was emissions from vehicles burning leaded gasoline. As a result of the removal of lead from gasoline, there have been no violations at any of the SCAQMD’s regular air monitoring stations since 1982. Currently, emissions of lead are largely limited to stationary sources such as lead smelters. It should be noted that the Project is not anticipated to generate a quantifiable amount of lead emissions. Lead is a criteria air pollutant.
Health Effects of Air Pollutants
Ozone
Individuals exercising outdoors, children, and people with preexisting lung disease, such as asthma and chronic pulmonary lung disease, are considered to be the most susceptible sub-groups for ozone effects. Short-term exposure (lasting for a few hours) to ozone at levels typically observed in Southern California can result in breathing pattern changes, reduction of breathing capacity, increased susceptibility to infections, inflammation of the lung tissue, and some immunological changes. Elevated ozone levels are associated with increased school absences. In recent years, a correlation between elevated ambient ozone levels and increases in daily hospital admission rates, as well as mortality, has also been reported. An increased risk for asthma has been found in children who participate in multiple sports and live in communities with high ozone levels.
Ozone exposure under exercising conditions is known to increase the severity of the responses described above. Animal studies suggest that exposure to a combination of pollutants that includes ozone may be more toxic than exposure to ozone alone. Although lung volume and resistance changes observed after a single exposure diminish with repeated exposures, biochemical and cellular changes appear to persist, which can lead to subsequent lung structural changes.
Carbon Monoxide
Individuals with a deficient blood supply to the heart are the most susceptible to the adverse effects of CO exposure. The effects observed include earlier onset of chest pain with exercise, and electrocardiograph changes indicative of decreased oxygen supply to the heart. Inhaled CO has no direct toxic effect on the lungs, but exerts its effect on tissues by interfering with oxygen transport and competing with oxygen to combine with hemoglobin present in the blood to form carboxyhemoglobin (COHb). Hence, conditions with an increased demand for oxygen supply can be adversely affected by exposure to CO. Individuals most at risk include fetuses, patients with diseases involving heart and blood vessels, and patients with chronic hypoxemia (oxygen deficiency) as seen at high altitudes.

Indian and Ramona Warehouse Air Quality Impact Analysis
11705-05 AQ Report
21
Reduction in birth weight and impaired neurobehavioral development have been observed in animals chronically exposed to CO, resulting in COHb levels similar to those observed in smokers. Recent studies have found increased risks for adverse birth outcomes with exposure to elevated CO levels; these include pre-term births and heart abnormalities.
Particulate Matter
A consistent correlation between elevated ambient fine particulate matter (PM10 and PM2.5) levels and an increase in mortality rates, respiratory infections, number and severity of asthma attacks and the number of hospital admissions has been observed in different parts of the United States and various areas around the world. In recent years, some studies have reported an association between long-term exposure to air pollution dominated by fine particles and increased mortality, reduction in life-span, and an increased mortality from lung cancer.
Daily fluctuations in PM2.5 concentration levels have also been related to hospital admissions for acute respiratory conditions in children, to school and kindergarten absences, to a decrease in respiratory lung volumes in normal children, and to increased medication use in children and adults with asthma. Recent studies show lung function growth in children is reduced with long term exposure to particulate matter.
The elderly, people with pre-existing respiratory or cardiovascular disease, and children appear to be more susceptible to the effects of high levels of PM10 and PM2.5.
Nitrogen Dioxide
Population-based studies suggest that an increase in acute respiratory illness, including infections and respiratory symptoms in children (not infants), is associated with long-term exposure to NO2 at levels found in homes with gas stoves, which are higher than ambient levels found in Southern California. Increase in resistance to air flow and airway contraction is observed after short-term exposure to NO2 in healthy subjects. Larger decreases in lung functions are observed in individuals with asthma or chronic obstructive pulmonary disease (e.g., chronic bronchitis, emphysema) than in healthy individuals, indicating a greater susceptibility of these sub-groups.
In animals, exposure to levels of NO2 considerably higher than ambient concentrations results in increased susceptibility to infections, possibly due to the observed changes in cells involved in maintaining immune functions. The severity of lung tissue damage associated with high levels of ozone exposure increases when animals are exposed to a combination of ozone and NO2.
Sulfur Dioxide
A few minutes of exposure to low levels of SO2 can result in airway constriction in some asthmatics, all of whom are sensitive to its effects. In asthmatics, increase in resistance to air flow, as well as reduction in breathing capacity leading to severe breathing difficulties, are observed after acute exposure to SO2. In contrast, healthy individuals do not exhibit similar acute responses even after exposure to higher concentrations of SO2.
Animal studies suggest that despite SO2 being a respiratory irritant, it does not cause substantial lung injury at ambient concentrations. However, very high levels of exposure can cause lung

Indian and Ramona Warehouse Air Quality Impact Analysis
11705-05 AQ Report
22
edema (fluid accumulation), lung tissue damage, and sloughing off of cells lining the respiratory tract.
Some population-based studies indicate that the mortality and morbidity effects associated with fine particles show a similar association with ambient SO2 levels. In these studies, efforts to separate the effects of SO2 from those of fine particles have not been successful. It is not clear whether the two pollutants act synergistically or one pollutant alone is the predominant factor.
Lead
Fetuses, infants, and children are more sensitive than others to the adverse effects of Pb exposure. Exposure to low levels of Pb can adversely affect the development and function of the central nervous system, leading to learning disorders, distractibility, inability to follow simple commands, and lower intelligence quotient. In adults, increased Pb levels are associated with increased blood pressure.
Pb poisoning can cause anemia, lethargy, seizures, and death; although it appears that there are no direct effects of Pb on the respiratory system. Pb can be stored in the bone from early age environmental exposure, and elevated blood Pb levels can occur due to breakdown of bone tissue during pregnancy, hyperthyroidism (increased secretion of hormones from the thyroid gland) and osteoporosis (breakdown of bony tissue). Fetuses and breast-fed babies can be exposed to higher levels of Pb because of previous environmental Pb exposure of their mothers.
Odors
The science of odor as a health concern is still new. Merely identifying the hundreds of VOCs that cause odors poses a big challenge. Offensive odors can potentially affect human health in several ways. First, odorant compounds can irritate the eye, nose, and throat, which can reduce respiratory volume. Second, studies have shown that the VOCs that cause odors can stimulate sensory nerves to cause neurochemical changes that might influence health, for instance, by compromising the immune system. Finally, unpleasant odors can trigger memories or attitudes linked to unpleasant odors, causing cognitive and emotional effects such as stress.
2.7 REGULATORY BACKGROUND
Existing regulations have not materially changed since the PVCC SP EIR was prepared, as described below.
2.7.1 FEDERAL REGULATIONS
The U.S. EPA is responsible for setting and enforcing the NAAQS for O3, CO, NOx, SO2, PM10, and lead (14). The U.S. EPA has jurisdiction over emissions sources that are under the authority of the federal government including aircraft, locomotives, and emissions sources outside state waters (Outer Continental Shelf). The U.S. EPA also establishes emission standards for vehicles sold in states other than California. Automobiles sold in California must meet the stricter emission requirements of the CARB.

Indian and Ramona Warehouse Air Quality Impact Analysis
11705-05 AQ Report
23
The Federal Clean Air Act (CAA) was first enacted in 1955, and has been amended numerous times in subsequent years (1963, 1965, 1967, 1970, 1977, and 1990). The CAA establishes the federal air quality standards, the NAAQS, and specifies future dates for achieving compliance (15). The CAA also mandates that states submit and implement State Implementation Plans (SIPs) for local areas not meeting these standards. These plans must include pollution control measures that demonstrate how the standards will be met.
The 1990 amendments to the CAA that identify specific emission reduction goals for areas not meeting the NAAQS require a demonstration of reasonable further progress toward attainment and incorporate additional sanctions for failure to attain or to meet interim milestones. The sections of the CAA most directly applicable to the development of the Project site include Title I (Non-Attainment Provisions) and Title II (Mobile Source Provisions). Title I provisions were established with the goal of attaining the NAAQS for the following criteria pollutants O3, NO2, SO2, PM10, CO, PM2.5, and lead. The NAAQS were amended in July 1997 to include an additional standard for O3 and to adopt a NAAQS for PM2.5. Table 3-1 (previously presented) provides the NAAQS within the basin.
Mobile source emissions are regulated in accordance with Title II provisions. These provisions require the use of cleaner burning gasoline and other cleaner burning fuels such as methanol and natural gas. Automobile manufacturers are also required to reduce tailpipe emissions of hydrocarbons and nitrogen oxides (NOx). NOx is a collective term that includes all forms of nitrogen oxides (NO, NO2, NO3) which are emitted as byproducts of the combustion process.
2.7.2 CALIFORNIA REGULATIONS
The CARB, which became part of the California EPA in 1991, is responsible for ensuring implementation of the California Clean Air Act (AB 2595), responding to the federal CAA, and for regulating emissions from consumer products and motor vehicles. The California CAA mandates achievement of the maximum degree of emissions reductions possible from vehicular and other mobile sources in order to attain the state ambient air quality standards by the earliest practical date. The CARB established the CAAQS for all pollutants for which the federal government has NAAQS and, in addition, establishes standards for sulfates, visibility, hydrogen sulfide, and vinyl chloride. However at this time, hydrogen sulfide and vinyl chloride are not measured at any monitoring stations in the SCAB because they are not considered to be a regional air quality problem. Generally, the CAAQS are more stringent than the NAAQS (16) (14).
Local air quality management districts, such as the SCAQMD, regulate air emissions from stationary sources such as commercial and industrial facilities. All air pollution control districts have been formally designated as attainment or non-attainment for each CAAQS.
Serious non-attainment areas are required to prepare air quality management plans that include specified emission reduction strategies in an effort to meet clean air goals. These plans are required to include:
• Application of Best Available Retrofit Control Technology to existing sources;
• Developing control programs for area sources (e.g., architectural coatings and solvents) and indirect sources (e.g. motor vehicle use generated by residential and commercial development);

Indian and Ramona Warehouse Air Quality Impact Analysis
11705-05 AQ Report
24
• A District permitting system designed to allow no net increase in emissions from any new or modified permitted sources of emissions;
• Implementing reasonably available transportation control measures and assuring a substantial reduction in growth rate of vehicle trips and miles traveled;
• Significant use of low emissions vehicles by fleet operators;
• Sufficient control strategies to achieve a five percent or more annual reduction in emissions or 15 percent or more in a period of three years for ROGs, NOx, CO and PM10. However, air basins may use alternative emission reduction strategy that achieves a reduction of less than five percent per year under certain circumstances.
2.7.3 AIR QUALITY MANAGEMENT PLANNING
Currently, the NAAQS and CAAQS are exceeded in most parts of the SCAB for PM10, PM2.5, and ozone. In response, the SCAQMD has adopted a series of Air Quality Management Plans (AQMPs) to meet the state and federal ambient air quality standards (17). AQMPs are updated regularly in order to more effectively reduce emissions, accommodate growth, and to minimize any negative fiscal impacts of air pollution control on the economy. A detailed discussion on the AQMP and Project consistency with the AQMP is provided in Section 3.9.
2.8 REGIONAL AIR QUALITY IMPROVEMENT
The Project is within the jurisdiction of the SCAQMD. In 1976, California adopted the Lewis Air Quality Management Act which created SCAQMD from a voluntary association of air pollution control districts in Los Angeles, Orange, Riverside, and San Bernardino counties. The geographic area of which SCAQMD consists is known as the Basin. SCAQMD develops comprehensive plans and regulatory programs for the region to attain federal standards by dates specified in federal law. The agency is also responsible for meeting state standards by the earliest date achievable, using reasonably available control measures.
SCAQMD rule development through the 1970s and 1980s resulted in dramatic improvement in Basin air quality. Nearly all control programs developed through the early 1990s relied on (i) the development and application of cleaner technology; (ii) add-on emission controls, and (iii) uniform CEQA review throughout the Basin. Industrial emission sources have been significantly reduced by this approach and vehicular emissions have been reduced by technologies implemented at the state level by CARB.
As discussed above, the SCAQMD is the lead agency charged with regulating air quality emission reductions for the entire Basin. SCAQMD created AQMPs which represent a regional blueprint for achieving healthful air on behalf of the 16 million residents of the South Coast Basin. The 2012 AQMP states, “the remarkable historical improvement in air quality since the 1970’s is the direct result of Southern California’s comprehensive, multiyear strategy of reducing air pollution from all sources as outlined in its AQMPs,” (18).
Ozone, NOx, VOC, and CO have been decreasing in the Basin since 1975 and are projected to continue to decrease through 2020 (19). These decreases result primarily from motor vehicle controls and reductions in evaporative emissions. Although vehicle miles traveled in the Basin

Indian and Ramona Warehouse Air Quality Impact Analysis
11705-05 AQ Report
25
continue to increase, NOx and VOC levels are decreasing because of the mandated controls on motor vehicles and the replacement of older polluting vehicles with lower-emitting vehicles. NOx emissions from electric utilities have also decreased due to use of cleaner fuels and renewable energy. Ozone contour maps show that the number of days exceeding the national 8-hour standard has decreased between 1997 and 2007. In the 2007 period, there was an overall decrease in exceedance days compared with the 1997 period. Ozone levels in the SCAB have decreased substantially over the last 30 years as shown in Table 2-4 (20). Today, the maximum measured concentrations are approximately one-third of concentrations within the late 70’s.
TABLE 2-4: SOUTH COAST AIR BASIN OZONE TREND
Source: Air Quality Management District
The overall trends of PM10 and PM2.5 in the air (not emissions) show an overall improvement since 1975. Direct emissions of PM10 have remained somewhat constant in the Basin and direct emissions of PM2.5 have decreased slightly since 1975. Area wide sources (fugitive dust from roads, dust from construction and demolition, and other sources) contribute the greatest amount of direct particulate matter emissions.
As with other pollutants, the most recent PM10 statistics and also show overall improvement as illustrated in Tables 2-5 and 2-6. During the period for which data are available, the 24-hour national annual average concentration for PM10 decreased by approximately 44 percent, from 103.7 µg/m³ in 1988 to 58.2 µg/m³ in 2017 (21). Although the values are below the federal standard, it should be noted that there are days within the year where the concentrations will exceed the threshold. The 24-hour state annual average for emissions for PM10, have decreased by approximately 56 percent since 1988 (21). Although data in the late 1990’s show some variability, this is probably due to meteorology rather than a change in emissions. Similar to the

Indian and Ramona Warehouse Air Quality Impact Analysis
11705-05 AQ Report
26
ambient concentrations, the calculated number of days above the 24-hour PM10 standards has also shown an overall drop.
TABLE 2-5: SOUTH COAST AIR BASIN (NATIONAL 24-HOUR AVERAGE) PM10 TREND1
Source: California Air Resource Board 1
Some year have been omitted from the table as insufficient data (or no) data has been reported. Years with reported value of “0” have also been omitted.
TABLE 2-6: SOUTH COAST AIR BASIN (STATE 24-HOUR AVERAGE) PM10 TREND1
Source: California Air Resource Board 1
Some year have been omitted from the table as insufficient data (or no) data has been reported. Years with reported value of “0” have also been omitted.
0.0
20.0
40.0
60.0
80.0
100.0
120.0
140.0
160.0
180.0
200.01
98
8
19
89
19
90
19
91
19
92
19
93
19
94
19
95
19
96
19
97
19
98
19
99
20
00
20
01
20
02
20
03
20
04
20
05
20
06
20
07
20
08
20
09
20
10
20
11
20
12
20
13
20
14
20
15
20
16
20
17
PM
10
(µg/
m3 )
Year
National 24-Hour Average Federal Standard
0.010.020.030.040.050.060.070.080.090.0
100.0
19
89
19
90
19
91
19
92
19
93
19
94
19
95
19
96
19
97
19
98
19
99
20
00
20
01
20
02
20
03
20
04
20
05
20
06
20
07
20
08
20
09
20
10
20
11
20
12
20
13
20
14
20
15
20
17
PM
10
(µg/
m3)
Year1
State Annual Average State Standard

Indian and Ramona Warehouse Air Quality Impact Analysis
11705-05 AQ Report
27
Table 2-7 shows the most recent 24-hour average PM2.5 concentrations in the SCAB from 1999 through 2017. Overall, the national and state annual average concentrations have decreased by almost 52 percent and 30 percent respectively (21). The SCAB is currently designated as nonattainment for the State and national PM2.5 standards.
TABLE 2-7: SOUTH COAST AIR BASIN (NATIONAL 24-HOUR AVERAGE) PM2.5 TREND1
Source: California Air Resource Board 1
Some year have been omitted from the table as insufficient data (or no) data has been reported. Years with reported value of “0” have also been omitted.
TABLE 2-8: SOUTH COAST AIR BASIN (STATE 24-HOUR AVERAGE) PM2.5 TREND1
Source: California Air Resource Board 1
Some year have been omitted from the table as insufficient data (or no) data has been reported. Years with reported value of “0” have also been omitted.
0.0
5.0
10.0
15.0
20.0
25.0
30.0
35.0
40.0
45.0
50.0
19
99
20
00
20
01
20
02
20
03
20
04
20
05
20
06
20
07
20
08
20
09
20
10
20
11
20
12
20
13
20
15
20
16
20
17
PM
10
(µg/
m3 )
Year1
Federal 24-Hour Average Federal Standard
0.0
5.0
10.0
15.0
20.0
25.0
30.0
20
00
20
01
20
02
20
03
20
04
20
05
20
06
20
07
20
08
20
09
20
10
20
11
20
12
20
13
20
14
20
15
20
16
20
17
PM
10
(µg/
m3 )
Year1
State Annual Average State Standard

Indian and Ramona Warehouse Air Quality Impact Analysis
11705-05 AQ Report
28
While the 2012 AQMP PM10 attainment demonstration and the 2015 associated supplemental SIP submission indicated that attainment of the 24-hour standard was predicted to occur by the end of 2015, it could not anticipate the effect of the ongoing drought on the measured PM2.5.
The 2006 to 2010 base period used for the 2012 attainment demonstration had near-normal rainfall. While the trend of PM2.5- equivalent emission reductions continued through 2015, the severe drought conditions contributed to the PM2.5 increases observed after 2012. As a result of the disrupted progress toward attainment of the federal 24-hour PM2.5 standard, SCAQMD submitted a request and the U.S. EPA approved, in January 2016, a “bump up” to the nonattainment classification from “moderate” to “serious,” with a new attainment deadline as soon as practicable, but not beyond December 31, 2019.
In March 2017, the AQMD released the Final 2016 AQMP. The 2016 AQMP continues to evaluate current integrated strategies and control measures to meet the NAAQS, as well as, explore new and innovative methods to reach its goals. Some of these approaches include utilizing incentive programs, recognizing existing co-benefit programs from other sectors, and developing a strategy with fair-share reductions at the federal, state, and local levels (22). Similar to the 2012 AQMP, the 2016 AQMP incorporates scientific and technological information and planning assumptions, including the 2016 RTP/SCS and updated emission inventory methodologies for various source categories (23).
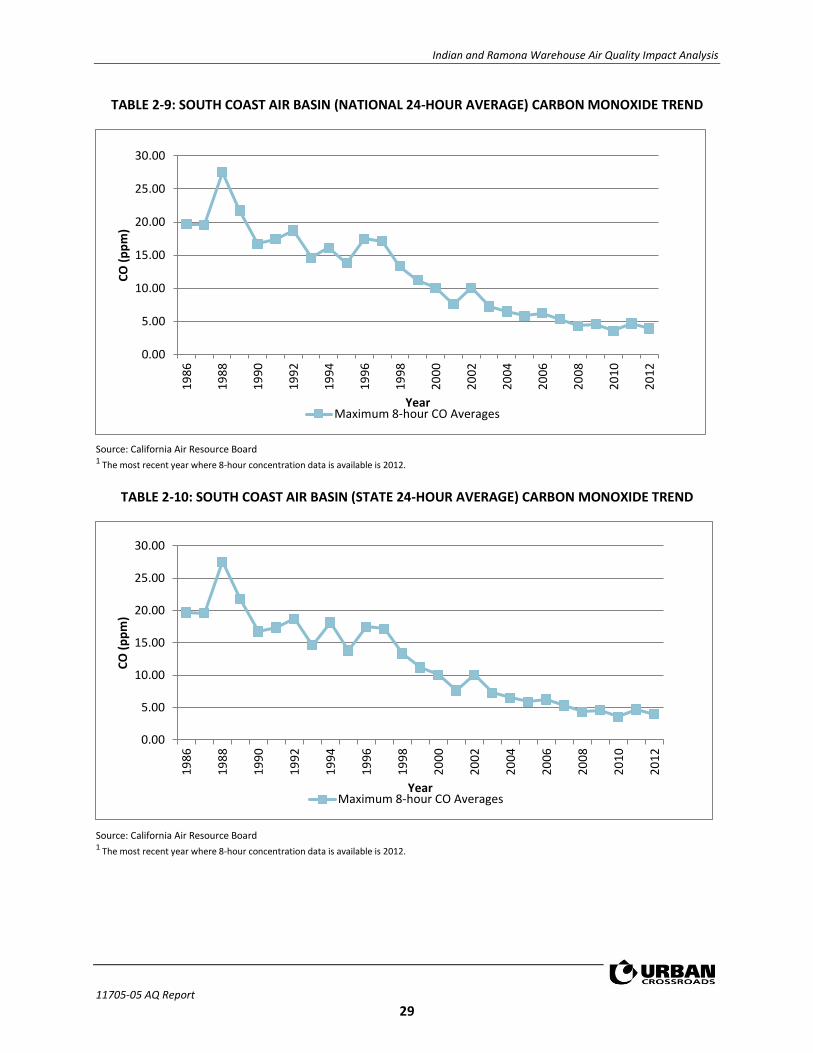
The most recent CO concentrations in the SCAB are shown in Tables 2-9 and 2-10 (21). CO concentrations in the SCAB have decreased markedly — a total decrease of more about 80 percent in the peak 8-hour concentration since 1986. It should be noted 2012 is the most recent year where 8-hour CO averages and related statistics are available in the South Coast Air Basin. The number of exceedance days has also declined. The entire SCAB is now designated as attainment for both the state and national CO standards. Ongoing reductions from motor vehicle control programs should continue the downward trend in ambient CO concentrations.
Part of the control process of the SCAQMD’s duty to greatly improve the air quality in the Basin is the uniform CEQA review procedures required by SCAQMD’s CEQA Handbook (24). The single threshold of significance used to assess Project direct and cumulative impacts has in fact “worked” as evidenced by the track record of the air quality in the Basin dramatically improving over the course of the past decades. As stated by the SCAQMD, the District’s thresholds of significance are based on factual and scientific data and are therefore appropriate thresholds of significance to use for this Project.
Indian and Ramona Warehouse Air Quality Impact Analysis
11705-05 AQ Report
29
TABLE 2-9: SOUTH COAST AIR BASIN (NATIONAL 24-HOUR AVERAGE) CARBON MONOXIDE TREND
Source: California Air Resource Board 1
The most recent year where 8-hour concentration data is available is 2012.
TABLE 2-10: SOUTH COAST AIR BASIN (STATE 24-HOUR AVERAGE) CARBON MONOXIDE TREND
Source: California Air Resource Board 1
The most recent year where 8-hour concentration data is available is 2012.
0.00
5.00
10.00
15.00
20.00
25.00
30.00
19
86
19
88
19
90
19
92
19
94
19
96
19
98
20
00
20
02
20
04
20
06
20
08
20
10
20
12
CO
(p
pm
)
YearMaximum 8-hour CO Averages
0.00
5.00
10.00
15.00
20.00
25.00
30.00
19
86
19
88
19
90
19
92
19
94
19
96
19
98
20
00
20
02
20
04
20
06
20
08
20
10
20
12
CO
(p
pm
)
YearMaximum 8-hour CO Averages
Indian and Ramona Warehouse Air Quality Impact Analysis
11705-05 AQ Report
30
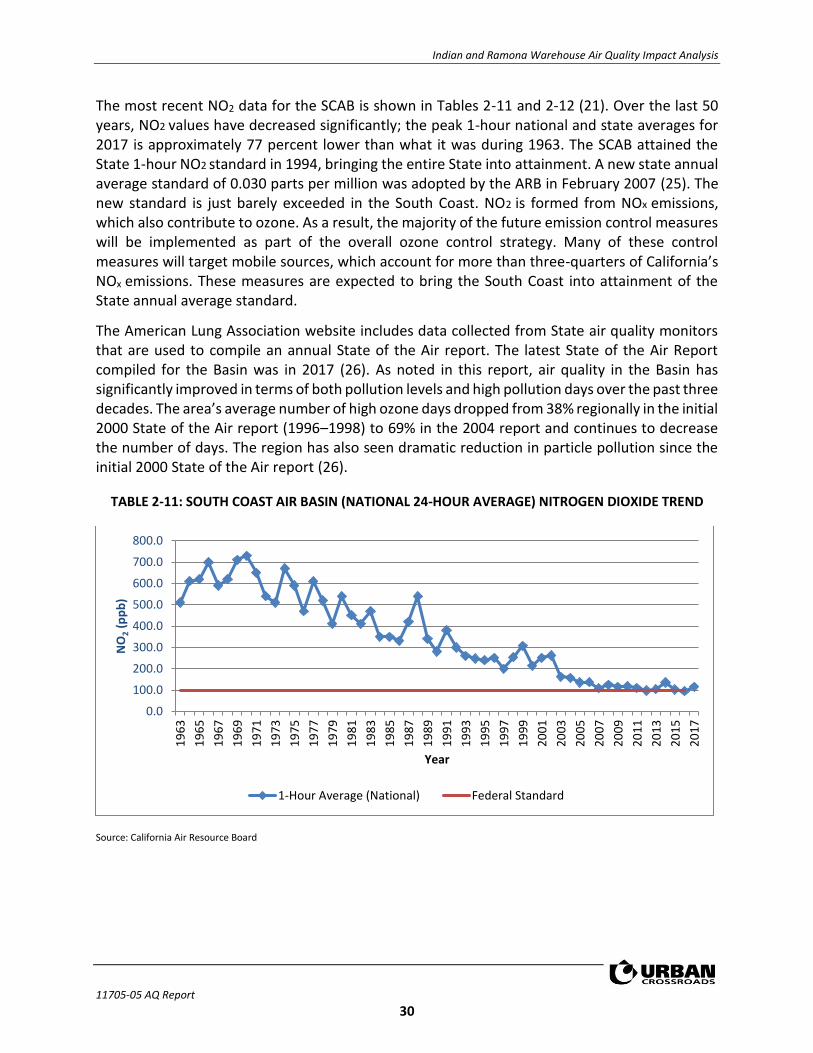
The most recent NO2 data for the SCAB is shown in Tables 2-11 and 2-12 (21). Over the last 50 years, NO2 values have decreased significantly; the peak 1-hour national and state averages for 2017 is approximately 77 percent lower than what it was during 1963. The SCAB attained the State 1-hour NO2 standard in 1994, bringing the entire State into attainment. A new state annual average standard of 0.030 parts per million was adopted by the ARB in February 2007 (25). The new standard is just barely exceeded in the South Coast. NO2 is formed from NOx emissions, which also contribute to ozone. As a result, the majority of the future emission control measures will be implemented as part of the overall ozone control strategy. Many of these control measures will target mobile sources, which account for more than three-quarters of California’s NOx emissions. These measures are expected to bring the South Coast into attainment of the State annual average standard.
The American Lung Association website includes data collected from State air quality monitors that are used to compile an annual State of the Air report. The latest State of the Air Report compiled for the Basin was in 2017 (26). As noted in this report, air quality in the Basin has significantly improved in terms of both pollution levels and high pollution days over the past three decades. The area’s average number of high ozone days dropped from 38% regionally in the initial 2000 State of the Air report (1996–1998) to 69% in the 2004 report and continues to decrease the number of days. The region has also seen dramatic reduction in particle pollution since the initial 2000 State of the Air report (26).
TABLE 2-11: SOUTH COAST AIR BASIN (NATIONAL 24-HOUR AVERAGE) NITROGEN DIOXIDE TREND
Source: California Air Resource Board
0.0
100.0
200.0
300.0
400.0
500.0
600.0
700.0
800.0
19
63
19
65
19
67
19
69
19
71
19
73
19
75
19
77
19
79
19
81
19
83
19
85
19
87
19
89
19
91
19
93
19
95
19
97
19
99
20
01
20
03
20
05
20
07
20
09
20
11
20
13
20
15
20
17
NO
2(p
pb
)
Year
1-Hour Average (National) Federal Standard

Indian and Ramona Warehouse Air Quality Impact Analysis
11705-05 AQ Report
31
TABLE 2-12: SOUTH COAST AIR BASIN (STATE 24-HOUR AVERAGE) NITROGEN DIOXIDE TREND
Source: California Air Resource Board
TOXIC AIR CONTAMINANTS (TACS) TRENDS
In 1984, as a result of public concern for exposure to airborne carcinogens, the CARB adopted regulations to reduce the amount of air toxic contaminant emissions resulting from mobile and area sources, such as cars, trucks, stationary products, and consumer products. According to the Ambient and Emission Trends of Toxic Air Contaminants in California journal article (27) which was prepared for CARB, results show that between 1990-2012, ambient concentration and emission trends for the seven TACs responsible for most of the known cancer risk associated with airborne exposure in California have declined significantly (between 1990 and 2012). The seven TACs studied include those that are derived from mobile sources: diesel particulate matter (DPM), benzene, and 1,3-butadiene; those that are derived from stationary sources: perchloroethylene and hexavalent chromium; and those derived from photochemical reactions of emitted VOCs: formaldehyde and acetaldehyde2. TACs data was gathered at monitoring sites from both the Bay Area and South Coast Air Basins, as shown on Exhibit 2-A; Several of the sites in the SCAB include Reseda, Compton, Rubidoux, Burbank, and Fontana. The decline in ambient concentration and emission trends of these TACs are a result of various regulations CARB has implemented to address cancer risk.
2 It should be noted that ambient DPM concentrations are not measured directly. Rather, a surrogate method using the
coefficient of haze (COH) and elemental carbon (EC) is used to estimate DPM concentrations.
0.0
100.0
200.0
300.0
400.0
500.0
600.0
700.0
800.0
19
63
19
65
19
67
19
69
19
71
19
73
19
75
19
77
19
79
19
81
19
83
19
85
19
87
19
89
19
91
19
93
19
95
19
97
19
99
20
01
20
03
20
05
20
07
20
09
20
11
20
13
20
15
20
17
NO
2(p
pb
)
Year
1-hour average (State) State Standard
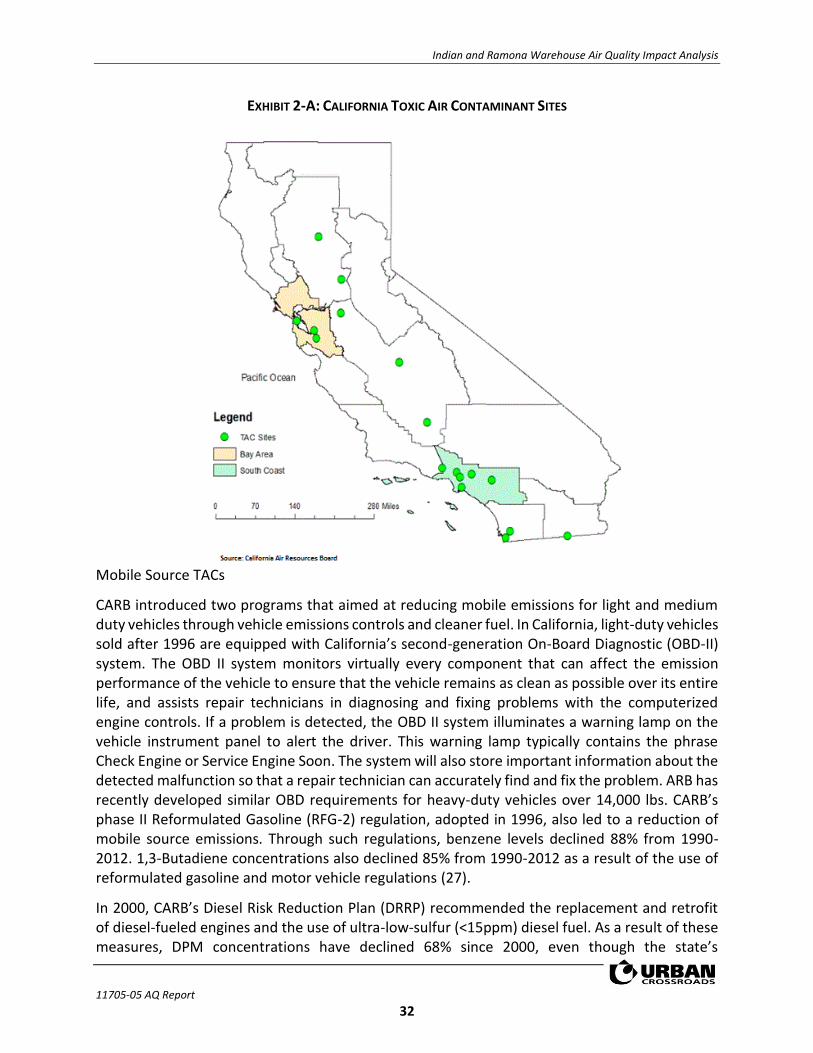
Indian and Ramona Warehouse Air Quality Impact Analysis
11705-05 AQ Report
32
EXHIBIT 2-A: CALIFORNIA TOXIC AIR CONTAMINANT SITES
Mobile Source TACs
CARB introduced two programs that aimed at reducing mobile emissions for light and medium duty vehicles through vehicle emissions controls and cleaner fuel. In California, light-duty vehicles sold after 1996 are equipped with California’s second-generation On-Board Diagnostic (OBD-II) system. The OBD II system monitors virtually every component that can affect the emission performance of the vehicle to ensure that the vehicle remains as clean as possible over its entire life, and assists repair technicians in diagnosing and fixing problems with the computerized engine controls. If a problem is detected, the OBD II system illuminates a warning lamp on the vehicle instrument panel to alert the driver. This warning lamp typically contains the phrase Check Engine or Service Engine Soon. The system will also store important information about the detected malfunction so that a repair technician can accurately find and fix the problem. ARB has recently developed similar OBD requirements for heavy-duty vehicles over 14,000 lbs. CARB’s phase II Reformulated Gasoline (RFG-2) regulation, adopted in 1996, also led to a reduction of mobile source emissions. Through such regulations, benzene levels declined 88% from 1990-2012. 1,3-Butadiene concentrations also declined 85% from 1990-2012 as a result of the use of reformulated gasoline and motor vehicle regulations (27).
In 2000, CARB’s Diesel Risk Reduction Plan (DRRP) recommended the replacement and retrofit of diesel-fueled engines and the use of ultra-low-sulfur (<15ppm) diesel fuel. As a result of these measures, DPM concentrations have declined 68% since 2000, even though the state’s

Indian and Ramona Warehouse Air Quality Impact Analysis
11705-05 AQ Report
33
population increased 31% and the amount of diesel vehicles miles traveled increased 81%, as shown on Exhibit 2-B. With the implementation of these diesel-related control regulations, ARB expects a DPM decline of 71% for 2000-2020.
EXHIBIT 2-B: DIESEL PARTICULATE MATTER AND DIESEL VEHICLE MILES TREND
Source: California Air Resources Board
DIESEL REGULATIONS
The CARB and the Ports of Los Angeles and Long Beach have adopted several iterations of regulations for diesel trucks that are aimed at reducing diesel particulate matter (DPM). More specifically, the CARB Drayage Truck Regulation (28), the CARB statewide On-road Truck and Bus Regulation (29), and the Ports of Los Angeles and Long Beach “Clean Truck Program” (CTP) require accelerated implementation of “clean trucks” into the statewide truck fleet (30). In other words, older more polluting trucks will be replaced with newer, cleaner trucks as a function of these regulatory requirements.
Moreover, the average statewide DPM emissions for Heavy Duty Trucks (HDT), in terms of grams of DPM generated per mile traveled, will dramatically be reduced due to the aforementioned regulatory requirements.
Diesel emissions identified in this analysis would therefore overstate future DPM emissions since not all the regulatory requirements are reflected in the modeling.
CANCER RISK TRENDS
Based on information available from CARB, overall cancer risk throughout the basin has had a declining trend since 1990. In 1998, following an exhaustive 10-year scientific assessment

Indian and Ramona Warehouse Air Quality Impact Analysis
11705-05 AQ Report
34
process, the State of California Air Resources Board (ARB) identified particulate matter from diesel-fueled engines as a toxic air contaminant. The SCAQMD initiated a comprehensive urban toxic air pollution study, called MATES-II (for Multiple Air Toxics Exposure Study). Diesel particulate matter (DPM) accounts for more than 70 percent of the cancer risk.
In 2008 the SCAQMD prepared an update to the MATES-II study, referred to as MATES-III. MATES-III estimates the average excess cancer risk level from exposure to TACs is an approximately 17% decrease in comparison to the MATES-II study.
Nonetheless, the SCAQMD’s most recent in-depth analysis of the toxic air contaminants and their resulting health risks for all of Southern California was from the Multiple Air Toxics Exposure Study in the South Coast Air Basin, MATES IV,” which shows that cancer risk has decreased more than 55% between MATES III (2005) and MATES IV (2012) (25).
MATES-IV study represents the baseline health risk for a cumulative analysis. MATES-IV calculated cancer risks based on monitoring data collected at ten fixed sites within the South Coast Air Basin (SCAB). None of the fixed monitoring sites are within the local area of the Project site. However, MATES-IV has extrapolated the excess cancer risk levels throughout the basin by modeling the specific grids. MATES-IV modeling predicted an excess cancer risk of 497.35 in one million for the Project area. DPM is included in this cancer risk along with all other TAC sources. DPM accounts for 68% of the total risk shown in MATES-IV. Cumulative Project generated TACs are limited to DPM.
2.9 EXISTING PROJECT SITE AIR QUALITY CONDITIONS
The Project site is presently vacant and does not support any uses that generate emissions on a regular basis. Emissions are only generated on an occasional basis when the site is disked by a tractor for vegetation control. Existing air quality conditions at the Project site would generally reflect ambient monitored conditions previously presented previously at Table 2-3.

Indian and Ramona Warehouse Air Quality Impact Analysis
11705-05 AQ Report
35
This page intentionally left blank

Indian and Ramona Warehouse Air Quality Impact Analysis
11705-05 AQ Report
36
3 PROJECT AIR QUALITY IMPACT
3.1 INTRODUCTION
The Project has been evaluated to determine if it will violate an air quality standard or contribute to an existing or projected air quality violation. Additionally, the Project has been evaluated to determine if it will result in a cumulatively considerable net increase of a criteria pollutant for which the SCAB is non-attainment under an applicable federal or state ambient air quality standard. The significance of these potential impacts is described in the following section.
3.2 STANDARDS OF SIGNIFICANCE
The SCAQMD has developed regional and localized significance thresholds for regulated pollutants, as summarized at Table 3-1 (31). The SCAQMD’s CEQA Air Quality Significance Thresholds (March 2015) indicate that any projects in the SCAB with daily emissions that exceed any of the indicated thresholds should be considered as having an individually and cumulatively significant air quality impact. It should be noted that the SCAQMD provides a threshold for emissions of lead, however for purposes of this analysis no lead emissions are calculated as there are no substantive sources of lead emissions. Additionally, the air quality modeling program (discussed below) does not calculate any emissions of lead from typical construction or operational activities.
3.3 CALIFORNIA EMISSIONS ESTIMATOR MODEL™ EMPLOYED TO ESTIMATE AQ EMISSIONS
Land uses such as the Project affect air quality through construction-source and operational-source emissions.
On October 17, 2017, the SCAQMD in conjunction with the California Air Pollution Control Officers Association (CAPCOA) and other California air districts, released the latest version of the California Emissions Estimator Model™ (CalEEMod™) v2016.3.2. The purpose of this model is to calculate construction-source and operational-source criteria pollutant (NOx, VOC, PM10, PM2.5, SOx, and CO) and greenhouse gas (GHG) emissions from direct and indirect sources; and quantify applicable air quality and GHG reductions achieved from mitigation measures (32). Accordingly, the latest version of CalEEMod™ has been used for this Project to determine construction and operational air quality emissions. Output from the model runs for both construction and operational activity are provided in Appendix 3.1 to 3.3.

Indian and Ramona Warehouse Air Quality Impact Analysis
11705-05 AQ Report
37
TABLE 3-1: MAXIMUM DAILY EMISSIONS THRESHOLDSA
Pollutant Construction Operations
Regional ThresholdsA
NOx 100 lbs/day 55 lbs/day
VOC 75 lbs/day 55 lbs/day
PM10 150 lbs/day 150 lbs/day
PM2.5 55 lbs/day 55 lbs/day
SOx 150 lbs/day 150 lbs/day
CO 550 lbs/day 550 lbs/day
Lead 3 lbs/day 3 lbs/day
Localized ThresholdsB
NOx 220 lbs/day (Site Preparation)
270 lbs/day 237 lbs/day (Grading)
CO 1,230 lbs/day (Site Preparation)
1,577 lbs/day 1,345 lbs/day (Grading)
PM10 33 lbs/day (Site Preparation)
11 lbs/day 36 lbs/day (Grading)
PM2.5 9 lbs/day (Site Preparation)
3 lbs/day 9 lbs/day (Grading)
A: Based on SCAQMD Air Quality Significance Thresholds, March 2015; B: Based on SCAQMD lookup tables.
3.4 CONSTRUCTION EMISSIONS
Construction activities associated with the Project will result in emissions of VOCs, NOx, SOx, CO, PM10, and PM2.5. Construction related emissions are expected from the following construction activities:
• Site Preparation
• Grading
• Building Construction
• Paving
• Architectural Coating
Construction is expected to commence in January 2019 and will last through August 2020. The construction schedule utilized in the analysis, shown in Table 3-2, represents a “worst-case” analysis scenario should construction occur any time after the respective dates since emission factors for construction decrease as time passes and the analysis year increases due to emission

Indian and Ramona Warehouse Air Quality Impact Analysis
11705-05 AQ Report
38
regulations becoming more stringent.3 The duration of construction activity was based upon information provided by the Project applicant and a 2020 opening year. A detailed summary of construction equipment, shown in Table 3-3. The site specific construction fleet may vary due to specific project needs at the time of construction. The duration of construction activity and associated equipment both represent a reasonable approximation of the expected construction fleet as required per CEQA guidelines. Please refer to specific detailed modeling inputs/outputs contained in Appendix 3.1 and 3.3 of this analysis.
Dust is typically a major concern during rough grading activities. Because such emissions are not amenable to collection and discharge through a controlled source, they are called “fugitive emissions”. Fugitive dust emissions rates vary as a function of many parameters (soil silt, soil moisture, wind speed, area disturbed, number of vehicles, depth of disturbance or excavation, etc.). The CalEEMod model was utilized to calculate fugitive dust emissions resulting from this phase of activity. It is our understanding the Project site will not require any demolition. Additionally, based on consultation with the Project applicant, the Project site is expected require 10,000 cubic yards of soil import. This analysis includes the projected impacts associated with an importation of 10,000 cubic yards of soil. A CalEEMod default 20-mile one-way trip length for hauling activity was used since the borrow site is unknown at this time.
Construction emissions for construction worker vehicles traveling to and from the Project site, as well as vendor trips (construction materials delivered to the Project site) were estimated based on information from the Project applicant and the CalEEMod model.
TABLE 3-2: CONSTRUCTION DURATION
Phase Name Start Date End Date Days
Site Preparation 01/01/2019 01/14/2019 10
Grading 01/15/2019 03/04/2019 35
Building Construction 03/05/2019 08/03/2020 370
Architectural Coating 07/07/2020 08/31/2020 40
Paving 08/04/2020 08/31/2020 20
Source: Construction activity based upon information provided by the Project applicant.
3 As shown in the California Emissions Estimator Model (CalEEMod) User’s Guide Version 2016.3.2, Section 4.3 “OFFROAD Equipment” as the
analysis year increases, emission factors for the same equipment pieces decrease due to the natural turnover of older equipment being replaced by newer less polluting equipment and new regulatory requirements.

Indian and Ramona Warehouse Air Quality Impact Analysis
11705-05 AQ Report
39
TABLE 3-3: CONSTRUCTION EQUIPMENT ASSUMPTIONS
Activity Equipment Amount Hours Per Day
Site Preparation Crawler Tractors 4 8
Rubber Tired Dozers 3 8
Grading
Crawler Tractors 2 8
Excavators 2 8
Graders 1 8
Rubber Tired Dozers 1 8
Scrapers 2 8
Building Construction
Cranes 1 8
Crawler Tractors 3 8
Forklifts 3 8
Generator Sets 1 8
Welders 1 8
Paving
Pavers 2 8
Paving Equipment 2 8
Rollers 2 8
Architectural Coating Air Compressors 1 8
Source: Construction equipment based on CalEEMod defaults.
3.4.1 CONSTRUCTION EMISSIONS SUMMARY
Impacts With No Mitigation Except For PVCC SP Mitigation
The estimated maximum daily construction emissions are summarized in Table 3-4. Detailed construction model outputs are presented in Appendix 3.1. It should be noted that the Project is required to comply with the applicable PVCC SP EIR mitigation measures as identified in Section 1.3. As shown, Project construction-source emissions would not exceed the numerical thresholds of significance established by the SCAQMD for any criteria pollutant. Thus, a less than significant impact would occur for Project-related construction-source emissions and no additional mitigation is required.

Indian and Ramona Warehouse Air Quality Impact Analysis
11705-05 AQ Report
40
TABLE 3-4: MAXIMUM DAILY PEAK CONSTRUCTION EMISSIONS SUMMARY (WITH NO MITIGATION EXCEPT FOR PVCC SP MITIGATION)
Year Emissions (pounds per day)
VOC NOx CO SOx PM10 PM2.5
2019 6.69 75.12 42.78 0.14 11.05 6.75
2020 58.81 58.55 46.06 0.15 9.06 3.73
Maximum Daily Emissions 58.81 75.12 42.78 0.15 11.05 6.75
SCAQMD Regional Threshold 75 100 550 150 150 55
Threshold Exceeded? NO NO NO NO NO NO
Source: CalEEMod construction-source emissions are presented in Appendix 3.1.
3.5 OPERATIONAL EMISSIONS
Operational activities associated with the proposed Project will result in emissions of VOCs, NOx, SOx, CO, PM10, and PM2.5. Operational emissions would be expected from the following primary sources:
• Area Source Emissions
• Energy Source Emissions
• Mobile Source Emissions
3.5.1 AREA SOURCE EMISSIONS
Architectural Coatings
Over a period of time, the buildings that are part of this Project will be subject to emissions resulting from the evaporation of solvents contained in paints, varnishes, primers, and other surface coatings as part of Project maintenance. The emissions associated with architectural coatings were calculated using the CalEEMod model.
Consumer Products
Consumer products include, but are not limited to detergents, cleaning compounds, polishes, personal care products, and lawn and garden products. Many of these products contain organic compounds which when released in the atmosphere can react to form ozone and other photochemically reactive pollutants. The emissions associated with use of consumer products were calculated based on assumptions provided in the CalEEMod model. In the case of the industrial uses proposed by the Project, no substantive on-site use of consumer products is anticipated.
Landscape Maintenance Equipment
Landscape maintenance equipment would generate emissions from fuel combustion and evaporation of unburned fuel. Equipment in this category would include lawnmowers, shedders/grinders, blowers, trimmers, chain saws, and hedge trimmers used to maintain the

Indian and Ramona Warehouse Air Quality Impact Analysis
11705-05 AQ Report
41
landscaping of the Project. The emissions associated with landscape maintenance equipment were calculated based on assumptions provided in the CalEEMod model.
3.5.2 ENERGY SOURCE EMISSIONS
Combustion Emissions Associated with Natural Gas and Electricity
Electricity and natural gas are used by almost every project. Criteria pollutant emissions are emitted through the generation of electricity and consumption of natural gas. However, because electrical generating facilities for the Project area are located either outside the region (state) or offset through the use of pollution credits (RECLAIM) for generation within the SCAB, criteria pollutant emissions from offsite generation of electricity is generally excluded from the evaluation of significance and only natural gas use is considered. The emissions associated with natural gas use were calculated using the CalEEMod model.
3.5.3 MOBILE SOURCE EMISSIONS
Vehicles
Project-related operational air quality impacts derive predominantly from mobile sources. In this regard, approximately 85 percent (by weight) of all Project operational-source emissions would be generated by mobile sources (vehicles). Neither the Project applicant nor the City has any regulatory control over these tail pipe emissions. Rather, vehicle tail pipe source emissions are regulated by CARB and USEPA. As summarized previously herein, as the result of CARB and USEPA actions, Basin-wide vehicular-source emissions have been reduced dramatically over the past years and are expected to further decline as clean vehicle and fuel technologies improve.
Project mobile source air quality impacts are dependent on both overall daily vehicle trip generation and the effect of the Project on peak hour traffic volumes and traffic operations in the vicinity of the Project. The Project related operational air quality impacts derive primarily from vehicle trips generated by the Project. Trip characteristics available from the report, Indian and Ramona Warehouse Traffic Impact Analysis (Urban Crossroads) 2018 were utilized in this analysis (33). It should be noted that the Project’s traffic study presents the total Project vehicle trips in terms of Passenger Car Equivalents (PCEs) in an effort to recognize and acknowledge the effects of heavy vehicles at the study area intersections. Notwithstanding, for purposes of the air quality study, the PCE trips were not used. Rather, to more accurately estimate and model vehicular-source emissions, the actual number of vehicles, by vehicle classification (e.g., passenger cars (including light trucks), and heavy trucks) were used in the analysis.
The trip generation rates used for this analysis are based upon information collected by the Institute of Transportation Engineers (ITE) as provided in their Trip Generation manual, 10th Edition, 2017, for warehouse (ITE Land Use Code 154). (34) Total vehicle mix percentages were obtained from High Cube Transload and Short-Term Storage Warehouse Trip Generation Analysis (October 2016), as identified in the Project’s TIA. The High Cube Warehouse Vehicle Trip Generation provides vehicle mix for Short-Term Storage, Transload & Cold Storage, which consists of 32.2% trucks for daily trips.

Indian and Ramona Warehouse Air Quality Impact Analysis
11705-05 AQ Report
42
The vehicle fleet mix, in terms of passenger cars and actual trucks, as derived from the traffic study for the Project, is comprised of the following: 67.81% Passenger Cars, 5.38% Light-Heavy-Duty (LHD)/2-axle, 6.67% Medium-Heavy-Duty (MHD)/3-axle, 20.13% Heavy-Heavy-Duty (HHD)/4+-axle trucks.
3.5.3.1 Trip Length
Provided below is a summary of the VMT recommendations of the SCAQMD and SCAG, followed by a description of the methodology used to calculate the VMT rates used in this AQIA.
SCAQMD Recommendation
In the last five years, the SCAQMD has provided numerous comments on the trip length for warehouse/distribution and industrial land use projects (35). The SCAQMD asserts that the model-default trip length in CalEEMod™ and the URBan EMISsions (URBEMIS) 2007 model (version 9.2.4) would underestimate emissions. The SCAQMD asserts that for warehouse, distribution center, and industrial land use projects, most of the heavy-duty trucks would be hauling consumer goods, often from the Ports of Long Beach and Los Angeles (POLA and POLB) and/or to destinations outside of California. The SCAQMD states that for this reason, the CalEEMod™ and the URBan EMISsions model default trip length (approximately 12.6 miles) would not be representative of activities at like facilities. The SCAQMD generally recommends the use of a 40-mile one-way trip length.
Southern California Association of Government (SCAG) Heavy Duty Truck Model
SCAG is comprised of six counties (Imperial, Los Angeles, Orange, Riverside, San Bernardino, and Ventura) and 190 cities in Southern California, and is the organization charged with addressing and resolving short- and long-term regional policy issues. The SCAG region also consists of 14 subregional entities recognized by the Regional Council as partners in the regional policy planning process. The SCAG region has more than 19 million residents and encompasses more than 38,000 square miles, representing the largest and most diverse region in the country.
SCAG maintains a regional transportation model. In its most recent (2008) transportation validation for the 2003 Regional Model, SCAG indicates the average internal truck trip length for the SCAG region is 5.92 miles for Light Duty Trucks, 13.06 miles for Medium Duty Trucks, and 24.11 miles for Heavy Duty Trucks.
Approach for Analysis of the Project
Trip lengths and VMT estimates employed in this AQIA report generate vehicular-source emissions that would represent a maximum impact scenario Other Environmental Impact Reports (EIRs) for similar land use projects within the region have utilized these same or similar estimates (36). To maintain analytic consistency and establish the maximum impact scenario noted above, the following approach has been utilized in calculating emissions associated with vehicles accessing the Project.
For passenger car trips, the Riverside County CalEEMod default for a one-way trip length of 16.6 miles was assumed. For heavy duty trucks, Light-Heavy-Duty (LHD)/2-axle, Medium-Heavy-Duty (MHD)/3-axle, and Heavy-Heavy-Duty (HHD)/4+-axle trucks would travel a distance of 60 miles.

Indian and Ramona Warehouse Air Quality Impact Analysis
11705-05 AQ Report
43
One model run was utilized in order to determine emissions resulting from vehicle operations. This run analyzed mobile-source emissions based on a trip length of 30.57 miles for both passenger cars and trucks. The trip length was determined by weighting the default trip length of 16.6 miles for passenger cars within Riverside County and a fleet mix of 67.81% Light-Duty-Auto vehicles (LDA) and the average truck trip length of 60 miles and a fleet mix of 5.38% LHD, 6.67% MHD, and 20.13% HHD. The estimated emissions resulting from vehicle operations are summarized in Section 3.5.4 (presented later in this report.) Detailed emission calculations are provided in Appendix 3.3.
Fugitive Dust Related to Vehicular Travel
Vehicles traveling on paved roads would be a source of fugitive emissions due to the generation of road dust inclusive of tire wear particulates. The emissions estimates for travel on paved roads were calculated using the CalEEMod model.
3.5.4 OPERATIONAL EMISSIONS SUMMARY
Operational-source emissions are summarized on Table 3-5. It should be noted that the Project is required to comply with the applicable PVCC SP EIR mitigation measures as identified in Sections 1.3. As indicated, the Project would not exceed regional thresholds of significance established by the SCAQMD for emissions of any criteria pollutant. Thus, a less than significant impact would occur for Project-related operational-source emissions and no additional mitigation is required.
TABLE 3-5: MAXIMUM OPERATIONAL EMISSIONS SUMMARY
Operational Activities – Summer Scenario
Emissions (pounds per day)
VOC NOx CO SOx PM10 PM2.5
Area Source 9.89 4.2E-04 0.05 -- 1.6E-04 1.6E-04
Energy Source 0.03 0.23 0.20 1.40E-03 0.02 0.02
Mobile 2.04 48.49 30.96 0.25 15.08 4.34
Total Maximum Daily Emissions 11.95 48.72 31.20 0.25 15.10 4.35
SCAQMD Regional Threshold 55 55 550 150 150 55
Threshold Exceeded? NO NO NO NO NO NO
Operational Activities – Winter Scenario
Emissions (pounds per day)
VOC NOx CO SOx PM10 PM2.5
Area Source 9.89 4.2E-04 0.05 -- 1.6E-04 1.6E-04
Energy Source 0.03 0.23 0.20 1.40E-03 0.02 0.02
Mobile 1.92 49.68 26.86 0.24 15.09 4.34
Total Maximum Daily Emissions 11.84 49.91 27.10 0.24 15.10 4.36
SCAQMD Regional Threshold 55 55 550 150 150 55
Threshold Exceeded? NO NO NO NO NO NO
Source: CalEEMod operational-source emissions are presented in Appendix 3.2. Note: Totals obtained from CalEEMod™ and may not total 100% due to rounding.

Indian and Ramona Warehouse Air Quality Impact Analysis
11705-05 AQ Report
44
3.6 LOCALIZED SIGNIFICANCE - CONSTRUCTION ACTIVITY
BACKGROUND ON LOCALIZED SIGNIFICANCE THRESHOLD (LST) DEVELOPMENT
The analysis makes use of methodology included in the SCAQMD Final Localized Significance Threshold Methodology (Methodology) (19). The SCAQMD has established that impacts to air quality are significant if there is a potential to contribute or cause localized exceedances of the federal and/or state ambient air quality standards (NAAQS/CAAQS). Collectively, these are referred to as Localized Significance Thresholds (LSTs).
The significance of localized emissions impacts depends on whether ambient levels in the vicinity of any given project are above or below State standards. In the case of CO and NO2, if ambient levels are below the standards, a project is considered to have a significant impact if project emissions result in an exceedance of one or more of these standards. If ambient levels already exceed a state or federal standard, then project emissions are considered significant if they increase ambient concentrations by a measurable amount. This would apply to PM10 and PM2.5; both of which are non-attainment pollutants.
The SCAQMD established LSTs in response to the SCAQMD Governing Board’s Environmental Justice Initiative I-4. LSTs represent the maximum emissions from a project that will not cause or contribute to an exceedance of the most stringent applicable federal or state ambient air quality standard at the nearest residence or sensitive receptor. The SCAQMD states that lead agencies can use the LSTs as another indicator of significance in its air quality impact analyses.
LSTs were developed in response to environmental justice and health concerns raised by the public regarding exposure of individuals to criteria pollutants in local communities. To address the issue of localized significance, the SCAQMD adopted LSTs that show whether a project would cause or contribute to localized air quality impacts and thereby cause or contribute to potential localized adverse health effects. The analysis makes use of methodology included in the SCAQMD Final Localized Significance Threshold Methodology (LST Methodology) (37).
APPLICABILITY OF LSTS FOR THE PROJECT
For this Project, the appropriate Source Receptor Area (SRA) for the LST analysis is the Perris Valley monitoring station (SRA 24). LSTs apply to carbon monoxide (CO), nitrogen dioxide (NO2), particulate matter ≤ 10 microns (PM10), and particulate matter ≤ 2.5 microns (PM2.5). The SCAQMD produced look-up tables for projects less than or equal to 5 acres in size.
In order to determine the appropriate methodology for determining localized impacts that could occur as a result of Project-related construction, the following process is undertaken:
• CalEEMod is utilized to determine the maximum daily on-site emissions that will occur during construction activity.
• The SCAQMD’s Fact Sheet for Applying CalEEMod to Localized Significance Thresholds (38) is used to determine the maximum site acreage that is actively disturbed based on the construction equipment fleet and equipment hours as estimated in CalEEMod.

Indian and Ramona Warehouse Air Quality Impact Analysis
11705-05 AQ Report
45
• If the total acreage disturbed is less than or equal to five acres per day, then the SCAQMD’s screening look-up tables are utilized to determine if a Project has the potential to result in a significant impact. The look-up tables establish a maximum daily emissions threshold in pounds per day that can be compared to CalEEMod outputs.
• If the total acreage disturbed is greater than five acres per day then LST impacts are appropriately evaluated through dispersion modeling.
EMISSIONS CONSIDERED
SCAQMD’s Methodology clearly states that “off-site mobile emissions from the Project should not be included in the emissions compared to LSTs (39).” Therefore, for purposes of the construction LST analysis only emissions included in the CalEEMod “on-site” emissions outputs were considered.
MAXIMUM DAILY DISTURBED ACREAGE
Table 3-6 is used to determine the maximum daily disturbed-acreage for use in determining the applicability of the SCAQMD’s LST look-up tables. Based on Table 3-6, the proposed Project could actively disturb approximately 3.5 acres per day for the site preparation phase and 4.0 acres per day for the grading phase of construction. The acres disturbed is based on the equipment list and days in grading or site preparation phase according to the anticipated maximum number of acres a given piece of equipment can pass over in an 8-hour workday (as shown on Table 3-6). The equipment-specific grading rates are summarized in the CalEEMod user’s guide, Appendix A: Calculation Details for CalEEMod (October 2017).
TABLE 3-6: MAXIMUM DAILY DISTURBED-ACREAGE
Construction Activity
Equipment Type Equipment Quantity
Acres graded per 8 hour day
Operating Hours per Day
Acres graded per day
Site Preparation Crawler Tractors 4 0.5 8 2
Rubber Tired Dozers 3 0.5 8 1.5
Total acres disturbed per day during Site Preparation 3.5
Construction Activity
Equipment Type Equipment Quantity
Acres graded per 8 hour day
Operating Hours per Day
Acres graded per day
Grading
Crawler Tractors 2 0.5 8 1
Graders 1 0.5 8 0.5
Rubber Tired Dozers 1 0.5 8 0.5
Scrapers 2 1 8 2
Total acres disturbed per day during Grading 4.0
Source: Maximum daily disturbed acreage based on equipment list presented in Appendix 3.1.
Sensitive Receptors

Indian and Ramona Warehouse Air Quality Impact Analysis
11705-05 AQ Report
46
Some people are especially sensitive to air pollution and are given special consideration when evaluating air quality impacts from projects. These groups of people include children, the elderly, individuals with pre-existing respiratory or cardiovascular illness, and athletes and others who engage in frequent exercise. Structures that house these persons or places where they gather to exercise are defined as “sensitive receptors”; they are also known to be locations where an individual can remain for 24 hours.
Sensitive receptors in the Project study include existing residential homes and school uses, as described below, at locations R1 to R5, as illustrated on Exhibit 3-A. The nearest sensitive receptor to the Project site where an individual could remain for 24-hours, is R1, which represents existing residential homes located approximately 187 feet/57 meters east of the project site.
The Methodology explicitly states that “LSTs based on shorter averaging periods, such as the NO2 and CO LSTs, could also be applied to receptors such as industrial or commercial facilities since it is reasonable to assume that a worker at these sites could be present for periods of one to eight hours (40).” Consistent with the SCAQMD’s Final LST Methodology, the nearest industrial or commercial use to the Project site will be used to determine impacts from emissions of NO2 and CO.
The Methodology also explicitly states that “It is possible that a project may have receptors closer than 25 meters. Projects with boundaries located closer than 25 meters to the nearest receptor should use the LSTs for receptors located at 25 meters (40).”

Indian and Ramona Warehouse Air Quality Impact Analysis
11705-05 AQ Report
47
EXHIBIT 3-A: SENSITIVE RECEPTOR LOCATIONS

Indian and Ramona Warehouse Air Quality Impact Analysis
11705-05 AQ Report
48
The nearest industrial or commercial uses are located immediately adjacent to the Project site. As such, a 25-meter receptor distance is utilized as a screening threshold to determine LSTs for emissions of NO2 and CO and a 57-meter receptor distance is utilized for PM10 and PM2.5.
R1: Location R1 represents existing residential homes located approximately 187 feet east of the Project site.
R2: Location R2 represents existing residential homes located approximately 1,218 feet east of the Project site near existing industrial uses.
R3: Location R3 represents existing residential homes located approximately 1,815 feet southeast of the Project site.
R4: Location R4 represents existing residential homes located approximately 1,513 feet northwest of the Project site.
R5: Location R5 represents existing residential homes located approximately 1,936 feet west of the Project site.
CONSTRUCTION-SOURCE EMISSIONS LST ANALYSIS
Since the total acreage disturbed is less than five acres per day for the site preparation phase and the grading phase, the SCAQMD’s screening look-up tables are utilized in determining impacts. It should be noted that since the look-up tables identifies thresholds at only 1 acre, 2 acres, and 5 acres, linear regression has been utilized, consistent with SCAQMD guidance, in order to interpolate the threshold values for the other disturbed acreage and distances not identified in the look-up tables. Linear regression, as recommended by SCAQMD has been utilized to interpolate the thresholds at the 187 feet/57 meters receptor distance since the look-up tables identifies thresholds at 25 meters, 50 meters, 100 meters, 200 meters, and 500 meters. Calculations for LST thresholds are provided in Appendix 3.3.
Impacts without Mitigation
Table 3-7 identifies the localized impacts at the nearest receptor location in the vicinity of the Project. Outputs from the model runs for construction LSTs are provided in Appendix 3.1. It should be noted that the Project is required to comply with the applicable PVCC SP EIR mitigation measures as identified in Sections 1.4. As shown, Project construction-source emissions would not exceed the numerical thresholds of significance established by the SCAQMD for any criteria pollutant. Thus, a less than significant impact would occur for Project-related construction-source emissions and no additional mitigation is required.

Indian and Ramona Warehouse Air Quality Impact Analysis
11705-05 AQ Report
49
TABLE 3-7: LOCALIZED SIGNIFICANCE SUMMARY OF CONSTRUCTION
On-Site Site Preparation Emissions Emissions (pounds per day)
NOx CO PM10 PM2.5
Maximum Daily Emissions 68.19 23.17 10.85 6.69
SCAQMD Localized Threshold 220 1,230 33 9
Threshold Exceeded? NO NO NO NO
On-Site Grading Emissions Emissions (pounds per day)
NOx CO PM10 PM2.5
Maximum Daily Emissions 65.83 33.93 6.48 3.91
SCAQMD Localized Threshold 237 1,345 36 9
Threshold Exceeded? NO NO NO NO
Source: CalEEMod localized construction-source emissions are presented in Appendix 3.1.
3.7 LOCALIZED SIGNIFICANCE – LONG-TERM OPERATIONAL ACTIVITY
Table 3-8 shows the calculated emissions for the Project’s operational activities compared with the applicable LSTs. Additional information concerning the Project’s impacts on sensitive receptors is found in the Project’s health risk assessment. The LST analysis includes on-site sources only; however, the CalEEMod outputs do not separate on-site and off-site emissions from mobile sources. In an effort to establish a maximum potential impact scenario for analytic purposes, the emissions shown on Table 3-8 represent all on-site Project-related stationary (area) sources and five percent (5%) of the Project-related mobile sources. Considering that the weighted trip length used in CalEEMod for the Project is approximately 30.57 miles, 5% of this total would represent an on-site travel distance for each car and truck of approximately 1.53 miles/8,078.4 feet, thus the 5% assumption is conservative and would tend to overstate the actual impact. The mobile source emissions also include any potential on-site idling that would occur since CalEEMod calculations are inclusive of on-site idling. Modeling based on these assumptions demonstrates that even within broad encompassing parameters, Project operational-source emissions would not exceed applicable LSTs. As shown below, emissions during operational activity would not exceed the SCAQMD’s localized significance thresholds for any criteria pollutant and a less than significant impact would occur.
As previously noted, a 25-meter receptor distance is utilized as a screening threshold to determine LSTs for emissions of NO2 and CO and a 57-meter receptor distance is utilized for PM10 and PM2.5.

Indian and Ramona Warehouse Air Quality Impact Analysis
11705-05 AQ Report
50
TABLE 3-8: LOCALIZED SIGNIFICANCE SUMMARY OF OPERATIONS
Operational Activity Emissions (pounds per day)
NOx CO PM10 PM2.5
Maximum Daily Emissions 2.71 1.80 0.77 0.24
SCAQMD Localized Significance Threshold 270 1,577 11 3
Threshold Exceeded? NO NO NO NO
Source: CalEEMod localized operational-source emissions are presented in Appendix 3.2.
3.8 CO “HOT SPOT” ANALYSIS
As discussed below, the Project would not result in potentially adverse CO concentrations or “hot spots.” Further, detailed modeling of Project-specific carbon monoxide (CO) “hot spots” is not needed to reach this conclusion.
An adverse CO concentration, known as a “hot spot”, would occur if an exceedance of the state one-hour standard of 20 ppm or the eight-hour standard of 9 ppm were to occur. At the time of the 1993 Handbook, the SCAB was designated nonattainment under the California AAQS and National AAQS for CO (41).
It has long been recognized that CO hotspots are caused by vehicular emissions, primarily when idling at congested intersections. In response, vehicle emissions standards have become increasingly stringent in the last twenty years. Currently, the allowable CO emissions standard in California is a maximum of 3.4 grams/mile for passenger cars (there are requirements for certain vehicles that are more stringent). With the turnover of older vehicles, introduction of cleaner fuels, and implementation of increasingly sophisticated and efficient emissions control technologies, CO concentration in the SCAB is now designated as attainment, as previously noted in Table 2-2. Also, CO concentrations in the Project vicinity have steadily declined, as indicated by historical emissions data presented previously at Table 2-3.
To establish a more accurate record of baseline CO concentrations affecting the SCAB, a CO “hot spot” analysis was conducted in 2003 for four busy intersections in Los Angeles at the peak morning and afternoon time periods. This “hot spot” analysis did not predict any violation of CO standards, as shown on Table 3-9.
TABLE 3-9: CO MODEL RESULTS
Intersection Location Carbon Monoxide Concentrations (parts per million)
Morning 1-hour Afternoon 1-hour 8-hour
Wilshire-Veteran 4.6 3.5 3.7
Sunset-Highland 4 4.5 3.5
La Cienega-Century 3.7 3.1 5.2
Long Beach-Imperial 3 3.1 8.4 Source: 2003 AQMP, Appendix V: Modeling and Attainment Demonstrations Notes: Federal 1-hour standard is 35 ppm and the deferral 8-hour standard is 9.0 ppm.
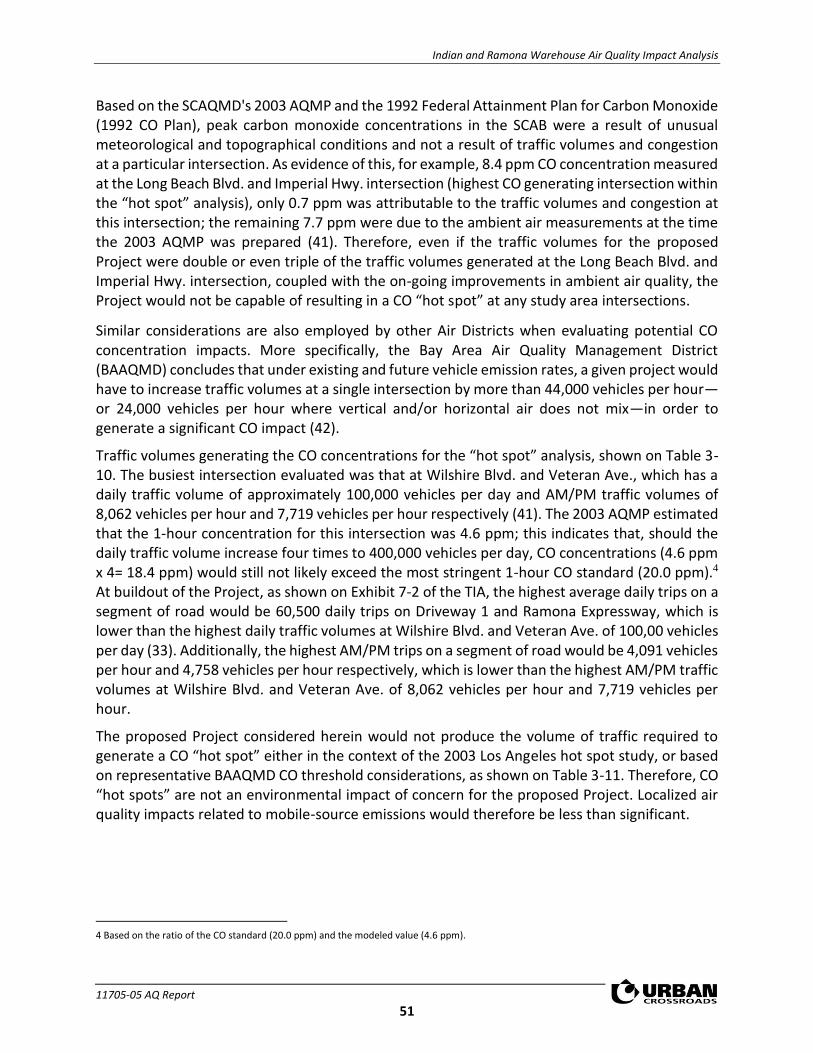
Indian and Ramona Warehouse Air Quality Impact Analysis
11705-05 AQ Report
51
Based on the SCAQMD's 2003 AQMP and the 1992 Federal Attainment Plan for Carbon Monoxide (1992 CO Plan), peak carbon monoxide concentrations in the SCAB were a result of unusual meteorological and topographical conditions and not a result of traffic volumes and congestion at a particular intersection. As evidence of this, for example, 8.4 ppm CO concentration measured at the Long Beach Blvd. and Imperial Hwy. intersection (highest CO generating intersection within the “hot spot” analysis), only 0.7 ppm was attributable to the traffic volumes and congestion at this intersection; the remaining 7.7 ppm were due to the ambient air measurements at the time the 2003 AQMP was prepared (41). Therefore, even if the traffic volumes for the proposed Project were double or even triple of the traffic volumes generated at the Long Beach Blvd. and Imperial Hwy. intersection, coupled with the on-going improvements in ambient air quality, the Project would not be capable of resulting in a CO “hot spot” at any study area intersections.
Similar considerations are also employed by other Air Districts when evaluating potential CO concentration impacts. More specifically, the Bay Area Air Quality Management District (BAAQMD) concludes that under existing and future vehicle emission rates, a given project would have to increase traffic volumes at a single intersection by more than 44,000 vehicles per hour—or 24,000 vehicles per hour where vertical and/or horizontal air does not mix—in order to generate a significant CO impact (42).
Traffic volumes generating the CO concentrations for the “hot spot” analysis, shown on Table 3-10. The busiest intersection evaluated was that at Wilshire Blvd. and Veteran Ave., which has a daily traffic volume of approximately 100,000 vehicles per day and AM/PM traffic volumes of 8,062 vehicles per hour and 7,719 vehicles per hour respectively (41). The 2003 AQMP estimated that the 1-hour concentration for this intersection was 4.6 ppm; this indicates that, should the daily traffic volume increase four times to 400,000 vehicles per day, CO concentrations (4.6 ppm x 4= 18.4 ppm) would still not likely exceed the most stringent 1-hour CO standard (20.0 ppm).4 At buildout of the Project, as shown on Exhibit 7-2 of the TIA, the highest average daily trips on a segment of road would be 60,500 daily trips on Driveway 1 and Ramona Expressway, which is lower than the highest daily traffic volumes at Wilshire Blvd. and Veteran Ave. of 100,00 vehicles per day (33). Additionally, the highest AM/PM trips on a segment of road would be 4,091 vehicles per hour and 4,758 vehicles per hour respectively, which is lower than the highest AM/PM traffic volumes at Wilshire Blvd. and Veteran Ave. of 8,062 vehicles per hour and 7,719 vehicles per hour.
The proposed Project considered herein would not produce the volume of traffic required to generate a CO “hot spot” either in the context of the 2003 Los Angeles hot spot study, or based on representative BAAQMD CO threshold considerations, as shown on Table 3-11. Therefore, CO “hot spots” are not an environmental impact of concern for the proposed Project. Localized air quality impacts related to mobile-source emissions would therefore be less than significant.
4 Based on the ratio of the CO standard (20.0 ppm) and the modeled value (4.6 ppm).

Indian and Ramona Warehouse Air Quality Impact Analysis
11705-05 AQ Report
52
TABLE 3-10: TRAFFIC VOLUMES
Intersection Location
Peak Traffic Volumes (vehicles per hour)
Eastbound (AM/PM)
Westbound (AM/PM)
Southbound (AM/PM)
Northbound (AM/PM)
Total (AM/PM)
Wilshire-Veteran 4,954/2,069 1,830/3,317 721/1,400 560/933 8,062/7,719
Sunset-Highland 1,417/1,764 1,342/1,540 2,304/1,832 1,551/2,238 6,614/5,374
La Cienega-Century 2,540/2,243 1,890/2,728 1,384/2,029 821/1,674 6,634/8,674
Long Beach-Imperial 1,217/2,020 1,760/1,400 479/944 756/1,150 4,212/5,514 Source: 2003 AQMP
TABLE 3-11: PROJECT PEAK TRAFFIC VOLUMES
Intersection Location Peak Traffic Volumes (vph)
Northbound (AM/PM)
Southbound (AM/PM)
Eastbound (AM/PM)
Westbound (AM/PM)
Total (AM/PM)
Driveway 1/Ramona Expressway 0/0 4/19 1,542/2,126 1,999/1,715 3,546/3,860
Indian Avenue/Driveway 2 7/18 0/0 311/562 585/794 903/1,375
Indian Avenue/Perry Street 603/794 291/555 0/0 3/6 896/1,355
Indian Avenue/Ramona Expressway 294/411 287/557 1,542/2,126 1,969/1,663 4,091/4,758
Source: Indian and Ramona Warehouse Traffic Impact Analysis (Urban Crossroads, 2018).
3.9 AIR QUALITY MANAGEMENT PLANNING
The Project site is located within the SCAB, which is characterized by relatively poor air quality. The SCAQMD has jurisdiction over an approximately 10,743 square-mile area consisting of the four-county Basin and the Los Angeles County and Riverside County portions of what use to be referred to as the Southeast Desert Air Basin. In these areas, the SCAQMD is principally responsible for air pollution control, and works directly with the Southern California Association of Governments (SCAG), county transportation commissions, local governments, as well as state and federal agencies to reduce emissions from stationary, mobile, and indirect sources to meet state and federal ambient air quality standards.
Currently, these state and federal air quality standards are exceeded in most parts of the Basin. In response, the SCAQMD has adopted a series of Air Quality Management Plans (AQMPs) to meet the state and federal ambient air quality standards. AQMPs are updated regularly in order to more effectively reduce emissions, accommodate growth, and to minimize any negative fiscal impacts of air pollution control on the economy.
In March 2017, the AQMD released the Final 2016 AQMP. The 2016 AQMP continues to evaluate current integrated strategies and control measures to meet the NAAQS, as well as, explore new and innovative methods to reach its goals. Some of these approaches include utilizing incentive programs, recognizing existing co-benefit programs from other sectors, and developing a strategy with fair-share reductions at the federal, state, and local levels (22). Similar to the 2012 AQMP, the 2016 AQMP incorporates scientific and technological information and planning assumptions, including the 2016 RTP/SCS and updated emission inventory methodologies for various source

Indian and Ramona Warehouse Air Quality Impact Analysis
11705-05 AQ Report
53
categories (43). The Project’s consistency with the AQMP will be determined using the 2016 AQMP as discussed below.
Criteria for determining consistency with the AQMP are defined in Chapter 12, Section 12.2 and Section 12.3 of the SCAQMD’s CEQA Air Quality Handbook (1993) (24). These indicators are discussed below:
• Consistency Criterion No. 1: The proposed Project will not result in an increase in the frequency or severity of existing air quality violations or cause or contribute to new violations, or delay the timely attainment of air quality standards or the interim emissions reductions specified in the AQMP.
Construction Impacts
The violations that Consistency Criterion No. 1 refers to are the CAAQS and NAAQS. CAAQS and NAAQS violations would occur if localized significance thresholds (LSTs) or regional significance thresholds were exceeded. The Project would not exceed the applicable LST thresholds or regional significance thresholds for construction activity as described in Section 3.6. Therefore, the Project would not conflict with the AQMP according to this criterion.
Operational Impacts
The Project would not exceed the applicable LST or regional significance thresholds for operational activity as described in Section 3.7. Therefore, the Project would not conflict with the AQMP according to this criterion.
On the basis of the preceding discussion, the Project is consistent with the first criterion.
• Consistency Criterion No. 2: The Project will not exceed the assumptions in the AQMP based on the years of Project build-out phase.
Overview
The 2016 AQMP demonstrates that the applicable ambient air quality standards can be achieved within the timeframes required under federal law. Growth projections from local general plans adopted by cities in the district are provided to the Southern California Association of Governments (SCAG), which develops regional growth forecasts, which are then used to develop future air quality forecasts for the AQMP. Development consistent with the growth projections in City of Perris General Plan is considered to be consistent with the AQMP.
Construction Impacts
Peak day emissions generated by construction activities are largely independent of land use assignments, but rather are a function of development scope and maximum area of disturbance. Irrespective of the site’s land use designation, development of the site to its maximum potential would likely occur, with disturbance of the entire site occurring during construction activities.
Operational Impacts
The City of Perris General Plan land use and Zoning designation for the Project site is “PVCC SP”. The PVCC SP land use designation for the Project site is “Light Industrial (LI)”. The LI land use

Indian and Ramona Warehouse Air Quality Impact Analysis
11705-05 AQ Report
54
designation provides for light industrial uses and related activities including manufacturing, research, warehouse and distribution, assembly of non-hazardous materials and retail related to manufacturing. Additionally, the Project is located within the Airport Overlay Zone - Accident Potential Zone I (APZ-I) and Accident Potential Zone II (APZ-II). APZ-I and APZ-II prohibit many uses that involve hazardous materials (such as gas stations), and those uses that have higher densities of people per acre. Both APZ-I and APZ-II prohibit new residential development, schools or churches. Non-residential development within APZ-I, will be limited to those uses that have not more than 25 persons per acre such as office parks, warehouses and distribution centers or similar uses. Non-residential development within APZ-II, will be limited to those uses that have not more than 50 persons per acre at any time, including hotels and motels (44). The Project is proposed to consist of a single warehouse building at approximately 428,730 square feet, which is consistent with the site’s PVCC SP designation.
AQMP Consistency Conclusion
The Project would not result in or cause NAAQS or CAAQS violations. The Project’s proposed land use designation for the subject site is consistent with the development intensities as reflected in the adopted General Plan. The Project is therefore considered to be consistent with the AQMP.
3.10 POTENTIAL IMPACTS TO SENSITIVE RECEPTORS
The potential impact of Project-generated air pollutant emissions at sensitive receptors has also been considered. Sensitive receptors can include uses such as long term health care facilities, rehabilitation centers, and retirement homes. Residences, schools, playgrounds, child care centers, and athletic facilities can also be considered as sensitive receptors.
Results of the LST analysis indicate that, the Project would not exceed the SCAQMD localized significance thresholds during construction. Therefore, sensitive receptors would not be exposed to
substantial pollutant concentrations during Project construction.
Results of the LST analysis indicate that the Project would not exceed the SCAQMD localized significance thresholds during operational activity. Further Project traffic would not create or result in a CO “hotspot.” Therefore, sensitive receptors would not be exposed to substantial pollutant concentrations as the result of Project operations. In addition, Urban Crossroads has prepared, under separate cover, a health risk assessment, which further analyzes the Project's Impacts on sensitive receptors. 3.11 ODORS
The potential for the Project to generate objectionable odors has also been considered. Land uses generally associated with odor complaints include:
• Agricultural uses (livestock and farming)
• Wastewater treatment plants
• Food processing plants
• Chemical plants
• Composting operations
• Refineries

Indian and Ramona Warehouse Air Quality Impact Analysis
11705-05 AQ Report
55
• Landfills
• Dairies
• Fiberglass molding facilities
The Project does not contain land uses typically associated with emitting objectionable odors. Potential odor sources associated with the proposed Project may result from construction equipment exhaust and the application of asphalt and architectural coatings during construction activities and the temporary storage of typical solid waste (refuse) associated with the proposed Project’s (long-term operational) uses. Standard construction requirements would minimize odor impacts from construction. The construction odor emissions would be temporary, short-term, and intermittent in nature and would cease upon completion of the respective phase of construction and is thus considered less than significant. It is expected that Project-generated refuse would be stored in covered containers and removed at regular intervals in compliance with the City’s solid waste regulations. The proposed Project would also be required to comply with SCAQMD Rule 402 to prevent occurrences of public nuisances (45). Therefore, odors associated with the proposed Project construction and operations would be less than significant and no mitigation is required.
3.12 CUMULATIVE IMPACTS
The Project area is designated as an extreme non‐attainment area for ozone, and a non‐attainment area for PM10, PM2.5, and lead.
The AQMD has published a report on how to address cumulative impacts from air pollution: White Paper on Potential Control Strategies to Address Cumulative Impacts from Air Pollution (46). In this report the AQMD clearly states (Page D-3):
“…the AQMD uses the same significance thresholds for project specific and cumulative impacts for all environmental topics analyzed in an Environmental Assessment or EIR. The only case where the significance thresholds for project specific and cumulative impacts differ is the Hazard Index (HI) significance threshold for toxic air contaminant (TAC) emissions. The project specific (project increment) significance threshold is HI > 1.0 while the cumulative (facility-wide) is HI > 3.0. It should be noted that the HI is only one of three TAC emission significance thresholds considered (when applicable) in a CEQA analysis. The other two are the maximum individual cancer risk (MICR) and the cancer burden, both of which use the same significance thresholds (MICR of 10 in 1 million and cancer burden of 0.5) for project specific and cumulative impacts.
Projects that exceed the project-specific significance thresholds are considered by the SCAQMD to be cumulatively considerable. This is the reason project-specific and cumulative significance thresholds are the same. Conversely, projects that do not exceed the project-specific thresholds are generally not considered to be cumulatively significant.”
Therefore, this analysis assumes that individual projects that do not generate operational or construction emissions that exceed the SCAQMD’s recommended daily thresholds for project-specific impacts would also not cause a cumulatively considerable increase in emissions for those pollutants for which the Basin is in nonattainment, and, therefore, would not be considered to

Indian and Ramona Warehouse Air Quality Impact Analysis
11705-05 AQ Report
56
have a significant, adverse air quality impact. Alternatively, individual project-related construction and operational emissions that exceed SCAQMD thresholds for project-specific impacts would be considered cumulatively considerable.
Construction Impacts
The Project‐specific evaluation of emissions presented in the preceding analysis demonstrates that Project construction-source air pollutant emissions would not result in exceedances of regional thresholds. Therefore, Project construction-source emissions would be considered less than significant on a project-specific and cumulative basis.
Operational Impacts
Project operational‐source emissions would not exceed applicable SCAQMD regional thresholds. Therefore, Project operational-source emissions would be considered less than significant on a project-specific and cumulative basis.

Indian and Ramona Warehouse Air Quality Impact Analysis
11705-05 AQ Report
57
4 FINDINGS & CONCLUSIONS
CONSTRUCTION-SOURCE EMISSIONS
REGIONAL IMPACTS
For regional emissions, the Project would not exceed the numerical thresholds of significance established by the SCAQMD for any criteria pollutant. It should be noted that the Project is required to comply with the applicable Perris Valley Commerce Center Specific Plan
Environmental Impact Report (PVCC SP EIR) SCH No. 2009081086 (3) mitigation measures as identified in Sections 1.3. As such, a less than significant impact would occur for Project-related construction-source emissions and no mitigation beyond what those identified in the PVCC SP EIR would be required.
LOCALIZED IMPACTS
For localized emissions, the Project would not exceed the SCAQMD’s localized significance threshold for any criteria pollutant. Therefore, a less than significant impact would occur.
ODORS
Established requirements addressing construction equipment operations, and construction material use, storage, and disposal requirements act to minimize odor impacts that may result from construction activities. Moreover, construction-source odor emissions would be temporary, short-term, and intermittent in nature and would not result in persistent impacts that would affect substantial numbers of people. Potential construction-source odor impacts are therefore considered less than significant.
OPERATIONAL-SOURCE EMISSIONS
REGIONAL IMPACTS
For regional emissions, the Project would not exceed the numerical thresholds of significance established by the SCAQMD for any criteria pollutant. It should be noted that the Project is required to comply with the applicable PVCC SP EIR mitigation measures as identified in Section 1.3. As such, a less than significant impact would occur for Project-related operational-source emissions and no mitigation beyond what those identified in the PVCC SP EIR would be required.
LOCALIZED IMPACTS
Project operational-source emissions would not result in or cause a significant localized air quality impact as discussed in the operational LSTs section of this report. The proposed Project would not result in a significant CO “hotspot” as a result of Project related traffic during ongoing operations, nor would the Project result in a significant adverse health impact, thus a less than significant impact to sensitive receptors during operational activity is expected.
Indian and Ramona Warehouse Air Quality Impact Analysis
11705-05 AQ Report
58
ODORS
Substantial odor-generating sources include land uses such as agricultural activities, feedlots, wastewater treatment facilities, landfills or various heavy industrial uses. The Project does not propose any such uses or activities that would result in potentially significant operational-source odor impacts. Potential sources of operational odors generated by the Project would include disposal of miscellaneous refuse. Moreover, SCAQMD Rule 402 acts to prevent occurrences of odor nuisances (45). Consistent with City requirements, all Project-generated refuse would be stored in covered containers and removed at regular intervals in compliance with solid waste regulations. Potential operational-source odor impacts are therefore considered less than significant.

Indian and Ramona Warehouse Air Quality Impact Analysis
11705-05 AQ Report
59
5 REFERENCES
1. State of California. California Environmental Quality Act, Appendix G. 2016.
2. Urban Crossroads, Inc. Indian and Ramona Warehouse Traffic Impact Analysis. August 2018.
3. City of Perris. Draft Perris Valley Commerce Center Environmental Impact Report. Perris : s.n., 2011.
4. South Coast Air Quality Management District. Southern California Air Basins. [Online] [Cited: November 13, 2013.] http://www.aqmd.gov/map/mapaqmd1.pdf.
5. California Air Resources Board. Ambient Air Quality Standards (AAQS). [Online] 2013. [Cited: April 6, 2015.] http://www.arb.ca.gov/research/aaqs/aaqs2.pdf.
6. South Coast Air Quality Management District. Annual Air Quality Monitoring Network Plan. [Online] July 2016. http://www.aqmd.gov/docs/default-source/clean-air-plans/air-quality-monitoring-network-plan/annual-air-quality-monitoring-network-plan-v2.pdf?sfvrsn=2.
7. Environmental Protection Agency. Monitor Values Report. [Online] https://www.epa.gov/outdoor-air-quality-data/monitor-values-report.
8. Air Resources Board. Air Quality Standards and Area Designations. [Online] 2013. [Cited: September 17, 2014.] http://www.arb.ca.gov/desig/desig.htm.
9. South Coast Air Quality Management District. National Ambient Air Qualirt Standards (NAQS) and California Ambient Air Quality Standards (CAAQS) Attainment Status for South Coast Air Basin. AQMD. [Online] February 2016. http://www.aqmd.gov/docs/default-source/clean-air-plans/air-quality-management-plans/naaqs-caaqs-feb2016.pdf?sfvrsn=2.
10. —. Air Quality Reporting. [pdf] Diamond Bar : Sierra Wade Associates, 1999.
11. Environmental Protection Agency. Monitor Values Report. [Online] [Cited: November 13, 2013.] http://www.epa.gov/airdata/ad_rep_mon.html.
12. Air Resources Board. [Online] [Cited: November 13, 2013.] http://www.arb.ca.gov/adam/select8/sc8start.php.
13. South Coast Air Quality Management District. Guidance Document for Addressing Air Quality Issues in General Plans and Local Planning. 2005.
14. Environmental Protection Agency. National Ambient Air Quality Standards (NAAQS). [Online] 1990. [Cited: April 16, 2018.] https://www.epa.gov/environmental-topics/air-topics.
15. —. Air Pollution and the Clean Air Act. [Online] [Cited: November 13, 2013.] http://www.epa.gov/air/caa/.
16. Air Resources Board. California Ambient Air Quality Standards (CAAQS). [Online] 2009. [Cited: April 16, 2018.] http://www.arb.ca.gov/research/aaqs/caaqs/caaqs.htm.
17. South Coast Air Quality Management District. 2012 Air Quality Management Plan (AQMP). [Online] 2012. [Cited: November 13, 2013.] http://www.aqmd.gov/aqmp/2012aqmp/draft/index.html.
18. —. Air Quality Management Plan. 2012.
19. California Air Resources Board. The California Almanac of Emissions and Air Quality. 2013.
20. South Coast AQMD. South Coast Air Basin Ozone Trend. [Online] http://www.aqmd.gov/docs/default-source/air-quality/south-coast-air-basin-smog-trend-ozone-chart.pdf.
21. California Air Resources Board. iADAM: Air Quality Data Statistics. [Online]

Indian and Ramona Warehouse Air Quality Impact Analysis
11705-05 AQ Report
60
22. South Coast Air Quality Management District. Final 2016 Air Quality Management Plan (AQMP). [Online] March 2017. http://www.aqmd.gov/docs/default-source/clean-air-plans/air-quality-management-plans/2016-air-quality-management-plan/final-2016-aqmp/final2016aqmp.pdf?sfvrsn=11.
23. Southern California Association of Governments. 2016-2040 Regional Transportation Plan/Sustainable Communities Strategy. [Online] April 2016. [Cited: April 16, 2018.] http://scagrtpscs.net/Documents/2016/final/f2016RTPSCS.pdf.
24. South coast Air Quality Management District. CEQA Air Quality Handbook (1993). [Online] 1993. [Cited: November 13, 2013.] http://www.aqmd.gov/ceqa/oldhdbk.html.
25. California Environmental Protection Agency Air Resources Board. Nitrogen Dioxide- Overview. [Online] [Cited: April 16, 2018.] http://www.arb.ca.gov/research/aaqs/caaqs/no2-1/no2-1.htm.
26. American Lung Association. State of the Air Southern California Regional Summary. [Online] [Cited: April 16, 2018.] http://www.lung.org/local-content/california/documents/state-of-the-air/2017/sota-2017_southernca-fact.pdf.
27. Ralph Propper, Patrick Wong, Son Bui, Jeff Austin, William Vance, Alvaro Alvarado, Bart Croes, and Dongmin Luo. Ambient and Emission Trends of Toxic Air Contaminants in California. American Chemical Society: Environmental Science & Technology. 2015.
28. Air Resources Board. ARB's Drayage Truck Regulatory Activities. [Online] http://www.arb.ca.gov/msprog/onroad/porttruck/porttruck.htm.
29. —. Truck and Bus Regulation. On-Road Heavy-Duty Diesel Vehicles (In-Use) Regulation. [Online] http://www.arb.ca.gov/msprog/onrdiesel/onrdiesel.htm.
30. The Port of Los Angeles. Clean Truck Program. [Online] http://www.portoflosangeles.org/ctp/idx_ctp.asp.
31. South Coast Air Quality Management District (SCAQMD). SCAQMD Air Quality Significance Thresholds. [Online] [Cited: November 2, 2017.] http://www.aqmd.gov/docs/default-source/ceqa/handbook/scaqmd-air-quality-significance-thresholds.pdf?sfvrsn=2.
32. California Air Pollution Control Officers Association (CAPCOA). California Emissions Estimator Model (CalEEMod). [Online] September 2016. www.caleemod.com.
33. Urban Crossroads, Inc. Indian and Ramona Warehouse Traffic Impact Analysis. Costa Mesa : s.n., 2018.
34. Institute of Transportation Engineers. Trip Generation, 10th Edition. 2017.
35. South Coast Air Quality Management District. Review of the Draft Environmental Impact Report (Draft EIR) for the Oakmount Olive Grove Project. [Online] June 2, 2010. http://www.aqmd.gov/ceqa/igr/2010/June/DEIROakmont.pdf.
36. Urban Crossroads, Inc. Perric Circle 3 Air Quality Impact Analysis. 2018.
37. Lake Environmental. US EPA Models. Lake Environmental. [Online] http://www.weblakes.com/download/us_epa.html.
38. South Coast Air Quality Management District. Fact Sheet for Applying CalEEMod to Localized Significance Thresholds. [Online] [Cited: December 9, 2013.] http://aqmd.gov/ceqa/handbook/LST/CalEEModguidance.pdf.
39. —. Localized Significance Thresholds Methodology. s.l. : South Coast Air Quality Managment District, 2003.

Indian and Ramona Warehouse Air Quality Impact Analysis
11705-05 AQ Report
61
40. —. Localized Significance Thresholds Methodology. s.l. : South Coast Air Quality Managment District, 2003.
41. —. 2003 Air Quality Management Plan. [Online] 2003. http://www.aqmd.gov/docs/default-source/clean-air-plans/air-quality-management-plans/2003-air-quality-management-plan/2003-aqmp-appendix-v.pdf.
42. Bay Area Air Quality Management District. [Online] http://www.baaqmd.gov/.
43. Southern California Association of Governments. 2016-2040 Regional Transportation Plan/Sustainable Communities Strategy. [Online] April 2016. http://scagrtpscs.net/Documents/2016/final/f2016RTPSCS.pdf.
44. City of Perris. Perris Valley Commerce Center Specific Plan. 2012.
45. South Coast Air Quality Management District. RULE 402. Nuisance. [Online] May 7, 1976. [Cited: November 13, 2013.] http://www.aqmd.gov/rules/reg/reg04/r402.pdf.
46. Goss, Tracy A and Kroeger, Amy. White Paper on Potential Control Strategies to Address Cumulative Impacts from Air Pollution. [Online] South Coast Air Quality Management District, 2003. http://www.aqmd.gov/rules/ciwg/final_white_paper.pdf.

Indian and Ramona Warehouse Air Quality Impact Analysis
11705-05 AQ Report
62
6 CERTIFICATION
The contents of this air study report represent an accurate depiction of the environmental impacts associated with the proposed Indian and Ramona Warehouse Project. The information contained in this air quality impact report is based on the best available data at the time of preparation. If you have any questions, please contact me directly at (949) 336-5987.
Haseeb Qureshi Senior Associate URBAN CROSSROADS, INC. 260 E. Baker Street, Suite 200 Costa Mesa, CA 92626 (949) 336-5987 [email protected]
EDUCATION
Master of Science in Environmental Studies California State University, Fullerton • May, 2010
Bachelor of Arts in Environmental Analysis and Design University of California, Irvine • June, 2006
PROFESSIONAL AFFILIATIONS AEP – Association of Environmental Planners AWMA – Air and Waste Management Association ASTM – American Society for Testing and Materials
PROFESSIONAL CERTIFICATIONS
Environmental Site Assessment – American Society for Testing and Materials • June, 2013 Planned Communities and Urban Infill – Urban Land Institute • June, 2011 Indoor Air Quality and Industrial Hygiene – EMSL Analytical • April, 2008 Principles of Ambient Air Monitoring – California Air Resources Board • August, 2007 AB2588 Regulatory Standards – Trinity Consultants • November, 2006 Air Dispersion Modeling – Lakes Environmental • June, 2006

Indian and Ramona Warehouse Air Quality Impact Analysis
11705-05 AQ Report
This page intentionally left blank
Indian and Ramona Warehouse Air Quality Impact Analysis
11705-05 AQ Report
APPENDIX 2.1:
STATE/FEDERAL ATTAINMENT STATUS OF CRITERIA POLLUTANTS

Final 2016 AQMP
TABLE 2-3 National Ambient Air Quality Standards (NAAQS) Attainment Status - South Coast Air Basin
Criteria Pollutant
Averaging Time Designationa Attainment Dateb
Ozone (O3)
(1979) 1-Hour (0.12 ppm)c Nonattainment (“extreme”) 2/26/2023 (revised deadline)
(2015) 8-Hour (0.070 ppm)d Pending – Expect Nonattainment (“extreme”) Pending
(beyond 2032)
(2008) 8-Hour (0.075 ppm)d Nonattainment (“extreme”) 7/20/2032
(1997) 8-Hour (0.08 ppm)d Nonattainment (“extreme”) 6/15/2024
PM2.5e
(2006) 24-Hour (35 µg/m3) Nonattainment (“serious”) 12/31/2019
(2012) Annual (12.0 µg/m3) Nonattainment (“moderate”) 12/31/2021
(1997) Annual (15.0 µg/m3) Attainment (final determination pending) 4/5/2015
(attained 2013)
PM10f (1987) 24-hour (150 µg/m3) Attainment (Maintenance) 7/26/2013 (attained)
Lead (Pb)g (2008) 3-Months Rolling (0.15 µg/m3)
Nonattainment (Partial) (Attainment determination to be requested) 12/31/2015
CO (1971) 1-Hour (35 ppm) Attainment (Maintenance) 6/11/2007 (attained)
(1971) 8-Hour (9 ppm) Attainment (Maintenance) 6/11/2007 (attained)
NO2h (2010) 1-Hour (100 ppb) Unclassifiable/Attainment N/A (attained)
(1971) Annual (0.053 ppm) Attainment (Maintenance) 9/22/1998 (attained)
SO2i (2010) 1-Hour (75 ppb)
Designations Pending (expect Unclassifiable/Attainment)
N/A (attained)
(1971) 24-Hour (0.14 ppm) (1971) Annual (0.03 ppm)
Unclassifiable/Attainment 3/19/1979 (attained)
a) U.S. EPA often only declares Nonattainment areas; everywhere else is listed as Unclassifiable/Attainment or Unclassifiable b) A design value below the NAAQS for data through the full year or smog season prior to the attainment date is typically required for an attainment
demonstration c) The 1979 1-hour ozone NAAQS (0.12 ppm) was revoked, effective 6/15/05 ; however, the Basin has not attained this standard and therefore has
some continuing obligations with respect to the revoked standard; original attainment date was 11/15/2010; the revised attainment date is 2/6/23 d) The 2008 8-hour ozone NAAQS (0.075 ppm) was revised to 0.070 ppm, effective 12/28/15 with classifications and implementation goals to be
finalized by 10/1/17; the 1997 8-hour ozone NAAQS (0.08 ppm) was revoked in the 2008 ozone NAAQS implementation rule, effective 4/6/15; there are continuing obligations under the revoked 1997 and revised 2008 ozone NAAQS until they are attained
e) The attainment deadline for the 2006 24-hour PM2.5 NAAQS was 12/31/15 for the former “moderate” classification; U.S.EPA approved reclassification to “serious,” effective 2/12/16 with an attainment deadline of 12/31/2019; the 2012 (proposal year) annual PM2.5 NAAQS was revised on 1/15/13, effective 3/18/13, from 15 to 12 µg/m3; new annual designations were final 1/15/15, effective 4/15/15; on July 25, 2016 U.S. EPA finalized a determination that the Basin attained the 1997 annual (15.0 µg/m3) and 24-hour PM2.5 (65 µg/m3) NAAQS, effective August 24, 2016
f) The annual PM10 NAAQS was revoked, effective 12/18/06; the 24-hour PM10 NAAQS deadline was 12/31/2006; the Basin’s Attainment Re-designation Request and PM10 Maintenance Plan was approved by U.S. EPA on 6/26/13, effective 7/26/13
g) Partial Nonattainment designation – Los Angeles County portion of the Basin only for near-source monitors; expect to remain in attainment based on current monitoring data; attainment re-designation request pending
h) New 1-hour NO2 NAAQS became effective 8/2/10, with attainment designations 1/20/12; annual NO2 NAAQS retained i) The 1971 annual and 24-hour SO2 NAAQS were revoked, effective 8/23/10; however, these 1971 standards will remain in effect until one year after
U.S. EPA promulgates area designations for the 2010 SO2 1-hour NAAQS; final area designations expected by 12/31/20 due to new source-specific monitoring requirements; Basin expected to be in attainment due to ongoing clean data
2-8

Chapter 2: Air Quality and Health Effects
TABLE 2-4
National Ambient Air Quality Standards (NAAQS) Attainment Status Coachella Valley Portion of the Salton Sea Air Basin
Criteria Pollutant
Averaging Time Designationa Attainment Dateb
Ozone (O3)
(1979) 1-Hour (0.12 ppm)c Attainment 11/15/2007 (attained 12/31/2013)
(2015) 8-Hour (0.070 ppm)d Pending – Expect
Nonattainment (Severe) Pending
(2008) 8-Hour (0.075 ppm)d Nonattainment (Severe-15) 7/20/2027
(1997) 8-Hour (0.08 ppm)d Nonattainment (Severe-15) 6/15/2019
PM2.5e (2006) 24-Hour (35 µg/m3) Unclassifiable/Attainment N/A (attained)
(2012) Annual (12.0 µg/m3) Unclassifiable/Attainment N/A (attained) (1997) Annual (15.0 µg/m3) Unclassifiable/Attainment N/A (attained)
PM10f (1987) 24-hour (150 µg/m3) Nonattainment (“serious”) 12/31/2006
Lead (Pb) (2008) 3-Months Rolling (0.15 µg/m3)
Unclassifiable/Attainment Unclassifiable/ Attainment
CO (1971) 1-Hour (35 ppm) Unclassifiable/Attainment N/A (attained)
(1971) 8-Hour (9 ppm) Unclassifiable/Attainment N/A (attained)
NO2g
(2010) 1-Hour (100 ppb) Unclassifiable/Attainment N/A (attained)
(1971) Annual (0.053 ppm) Unclassifiable/Attainment N/A (attained)
SO2h
(2010) 1-Hour (75 ppb) Designations Pending N/A
(1971) 24-Hour (0.14 ppm) (1971) Annual (0.03 ppm)
Unclassifiable/Attainment Unclassifiable/
Attainment a) U.S. EPA often only declares Nonattainment areas; everywhere else is listed as Unclassifiable/Attainment or Unclassifiable b) A design value below the NAAQS for data through the full year or smog season prior to the attainment date is typically required for an
attainment demonstration c) The 1979 1-hour ozone NAAQS (0.12 ppm) was revoked, effective 6/15/05; the Southeast Desert Modified Air Quality Management Area,
including the Coachella Valley, had not timely attained this standard by the 11/15/07 “severe-17” deadline, based on 2005-2007 data; on 8/25/14, U.S. EPA proposed a clean data finding based on 2011–2013 data and a determination of attainment for the former 1-hour ozone NAAQS for the Southeast Desert nonattainment area; this rule was finalized by U.S. EPA on 4/15/15, effective 5/15/15, that included preliminary 2014 data
d) The 2008 8-hour ozone NAAQS (0.075 ppm) was revised to 0.070 ppm, effective 12/28/15 with classifications and implementation goals to be finalized by 10/1/17; the 1997 8-hour ozone NAAQS (0.08 ppm) was revoked in the 2008 ozone NAAQS implementation rule, effective 4/6/15; there are continuing obligations under the 1997 and 2008 ozone NAAQS until they are attained
e) The annual PM2.5 standard was revised on 1/15/13, effective 3/18/13, from 15 to 12 µg/m3 f) The annual PM10 standard was revoked, effective 12/18/06; the 24-hour PM10 NAAQS attainment deadline was 12/31/2006; the Coachella
Valley Attainment Re-designation Request and PM10 Maintenance Plan was postponed by U.S. EPA pending additional monitoring and analysis in the southeastern Coachella Valley
g) New 1-hour NO2 NAAQS became effective 8/2/10; attainment designations 1/20/12; annual NO2 NAAQS retained h) The 1971 Annual and 24-hour SO2 NAAQS were revoked, effective 8/23/10; however, these 1971 standards will remain in effect until one
year after U.S. EPA promulgates area designations for the 2010 SO2 1-hour standard; final area designations expected by 12/31/2020 with SSAB expected to be designated Unclassifiable/Attainment
2-9

Final 2016 AQMP
The current status of CAAQS attainment for the pollutants with State standards is presented in Table 2-5 for the Basin and the Riverside County portion of the SSAB (Coachella Valley).
TABLE 2-5
California Ambient Air Quality Standards (CAAQS) Attainment Status South Coast Air Basin and Coachella Valley portion of Salton Sea Air Basin
Pollutant Averaging Time
and Levelb
Designationa
South Coast Air Basin
Coachella Valley
Ozone (O3) 1-Hour (0.09 ppm)c Nonattainment Nonattainment
8-Hour (0.070 ppm)d Nonattainment Nonattainment
PM2.5 Annual (12.0 µg/m3) Nonattainment Attainment
PM10 24-Hour (50 µg/m3) Nonattainment Nonattainment
Annual (20 µg/m3) Nonattainment Nonattainment
Lead (Pb) 30-Day Average (1.5 µg/m3)
Attainment Attainment
CO 1-Hour (20 ppm) Attainment Attainment
8-Hour (9.0 ppm) Attainment Attainment
NO2 1-Hour (0.18 ppm) Attainment Attainment
Annual (0.030 ppm) Attainment Attainment
SO2 1-Hour (0.25 ppm) Attainment Attainment
24-Hour (0.04 ppm) Attainment Attainment
Sulfates 24-Hour (25 µg/m3) Attainment Attainment
H2Sc 1-Hour (0.03 ppm) Unclassified Unclassified c) a) CA State designations shown were updated by CARB in 2016, based on the 2013–2015 3-year period; stated designations are based on a
3-year data period after consideration of outliers and exceptional events; Source: http://www.arb.ca.gov/desig/statedesig.htm#current b) CA State standards, or CAAQS, for ozone, CO, SO2, NO2, PM10 and PM2.5 are values not to be exceeded; lead, sulfates, and H2S
standards are values not to be equaled or exceeded; CAAQS are listed in the Table of Standards in Section 70200 of Title 17 of the California Code of Regulations
c) SCAQMD began monitoring H2S in the southeastern Coachella Valley in November 2013 due to odor events related to the Salton Sea; three full years of data are not yet available for a State designation, but nonattainment is anticipated for the H2S CAAQS in at least part of the Coachella Valley
The 1979 federal 1-hour ozone standard (0.12 ppm) was revoked by the U.S. EPA and replaced by the 8-hour average ozone standard (0.08 ppm), effective June 15, 2005. However, the Basin and the former Southeast Desert Modified Air Quality Management Area (which included the Coachella Valley) had not attained the 1-hour federal ozone NAAQS by the attainment dates in 2010 and 2007, respectively, and, therefore, had continuing obligations under the former standard. On August 25, 2014, U.S. EPA
2-10

Indian and Ramona Warehouse Air Quality Impact Analysis
11705-05 AQ Report
This page intentionally left blank

Indian and Ramona Warehouse Air Quality Impact Analysis
11705-05 AQ Report
APPENDIX 3.1:
CALEEMOD CONSTRUCTION (UNMITIGATED) EMISSIONS MODEL OUTPUTS
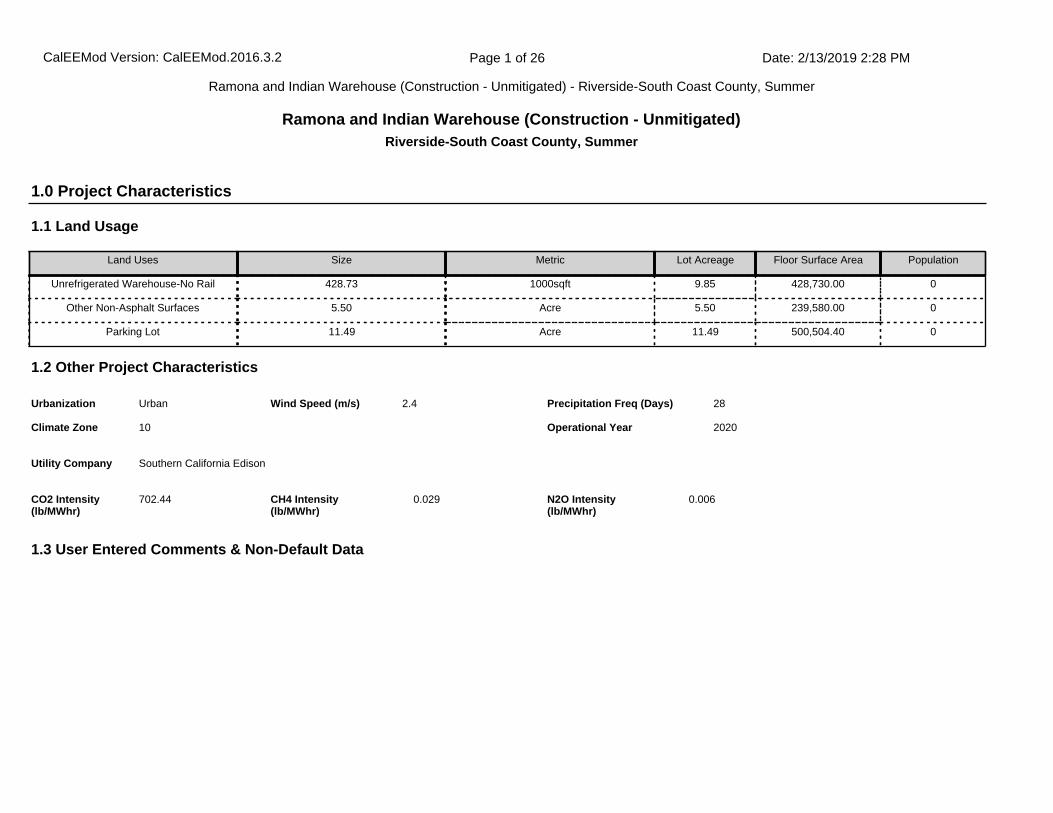
1.1 Land Usage
Land Uses Size Metric Lot Acreage Floor Surface Area Population
Unrefrigerated Warehouse-No Rail 428.73 1000sqft 9.85 428,730.00 0
Other Non-Asphalt Surfaces 5.50 Acre 5.50 239,580.00 0
Parking Lot 11.49 Acre 11.49 500,504.40 0
1.2 Other Project Characteristics
Urbanization
Climate Zone
Urban
10
Wind Speed (m/s) Precipitation Freq (Days)2.4 28
1.3 User Entered Comments & Non-Default Data
1.0 Project Characteristics
Utility Company Southern California Edison
2020Operational Year
CO2 Intensity (lb/MWhr)
702.44 0.029CH4 Intensity (lb/MWhr)
0.006N2O Intensity (lb/MWhr)
Ramona and Indian Warehouse (Construction - Unmitigated)Riverside-South Coast County, Summer
CalEEMod Version: CalEEMod.2016.3.2 Date: 2/13/2019 2:28 PMPage 1 of 26
Ramona and Indian Warehouse (Construction - Unmitigated) - Riverside-South Coast County, Summer

Project Characteristics -
Land Use - Total Site Area is 26.84 acres (24.2 on-site and 2.64 off-site). Per the Site Plan, 9.85 acres is Building, 11.49 acres is Parking.
Construction Phase - Architectural Coating activities will be conducted concurrent with Building Construction and Paving activities.
Off-road Equipment - Hours are based on an 8-hour workday.
Off-road Equipment - Crawler Tractors used in lieu of Tractors/Loaders/Backhoes.
Off-road Equipment - Crawler Tractors used in lieu of Tractors/Loaders/Backhoes.
Off-road Equipment -
Off-road Equipment - Crawler Tractors used in lieu of Tractors/Loaders/Backhoes.
Trips and VMT -
Grading -
Architectural Coating - Rule 1113
Vehicle Trips - Construction Run Only.
Area Coating -
Energy Use - Construction Run Only.
Water And Wastewater - Construction Run Only.
Solid Waste - Construction Run Only.
Construction Off-road Equipment Mitigation -
Fleet Mix -
Table Name Column Name Default Value New Value
tblArchitecturalCoating EF_Nonresidential_Exterior 100.00 50.00
tblArchitecturalCoating EF_Nonresidential_Interior 100.00 50.00
tblArchitecturalCoating EF_Parking 100.00 50.00
tblConstructionPhase NumDays 20.00 40.00
tblEnergyUse LightingElect 0.35 0.00
tblEnergyUse LightingElect 1.17 0.00
tblEnergyUse NT24E 0.82 0.00
CalEEMod Version: CalEEMod.2016.3.2 Date: 2/13/2019 2:28 PMPage 2 of 26
Ramona and Indian Warehouse (Construction - Unmitigated) - Riverside-South Coast County, Summer

2.0 Emissions Summary
tblEnergyUse NT24NG 0.03 0.00
tblEnergyUse T24E 0.37 0.00
tblEnergyUse T24NG 2.00 0.00
tblGrading MaterialImported 0.00 10,000.00
tblLandUse LotAcreage 9.84 9.85
tblOffRoadEquipment OffRoadEquipmentUnitAmount 3.00 0.00
tblOffRoadEquipment OffRoadEquipmentUnitAmount 2.00 0.00
tblOffRoadEquipment OffRoadEquipmentUnitAmount 4.00 0.00
tblOffRoadEquipment UsageHours 6.00 8.00
tblOffRoadEquipment UsageHours 7.00 8.00
tblOffRoadEquipment UsageHours 7.00 8.00
tblSolidWaste SolidWasteGenerationRate 403.01 0.00
tblVehicleTrips CC_TL 8.40 0.00
tblVehicleTrips CNW_TL 6.90 0.00
tblVehicleTrips CNW_TTP 41.00 0.00
tblVehicleTrips CW_TL 16.60 0.00
tblVehicleTrips CW_TTP 59.00 0.00
tblVehicleTrips DV_TP 5.00 0.00
tblVehicleTrips PB_TP 3.00 0.00
tblVehicleTrips PR_TP 92.00 0.00
tblVehicleTrips ST_TR 1.68 0.00
tblVehicleTrips SU_TR 1.68 0.00
tblVehicleTrips WD_TR 1.68 0.00
tblWater IndoorWaterUseRate 99,143,812.50 0.00
CalEEMod Version: CalEEMod.2016.3.2 Date: 2/13/2019 2:28 PMPage 3 of 26
Ramona and Indian Warehouse (Construction - Unmitigated) - Riverside-South Coast County, Summer

2.1 Overall Construction (Maximum Daily Emission)
ROG NOx CO SO2 Fugitive PM10
Exhaust PM10
PM10 Total
Fugitive PM2.5
Exhaust PM2.5
PM2.5 Total Bio- CO2 NBio- CO2 Total CO2 CH4 N2O CO2e
Year lb/day lb/day
2019 6.6936 75.0247 42.7805 0.1403 20.3885 2.9733 23.3617 10.2131 2.7354 12.9485 0.0000 14,136.4287
14,136.4287
2.4273 0.0000 14,178.1096
2020 58.8099 58.5473 46.0576 0.1522 7.1342 1.9241 9.0583 1.9175 1.8084 3.7259 0.0000 15,235.7435
15,235.7435
1.6703 0.0000 15,277.5014
Maximum 58.8099 75.0247 46.0576 0.1522 20.3885 2.9733 23.3617 10.2131 2.7354 12.9485 0.0000 15,235.7435
15,235.7435
2.4273 0.0000 15,277.5014
Unmitigated Construction
ROG NOx CO SO2 Fugitive PM10
Exhaust PM10
PM10 Total
Fugitive PM2.5
Exhaust PM2.5
PM2.5 Total Bio- CO2 NBio- CO2 Total CO2 CH4 N2O CO2e
Year lb/day lb/day
2019 6.6936 75.0247 42.7805 0.1403 8.0742 2.9733 11.0475 4.0156 2.7354 6.7510 0.0000 14,136.4287
14,136.4287
2.4273 0.0000 14,178.1096
2020 58.8099 58.5473 46.0576 0.1522 7.1342 1.9241 9.0583 1.9175 1.8084 3.7259 0.0000 15,235.7435
15,235.7435
1.6703 0.0000 15,277.5014
Maximum 58.8099 75.0247 46.0576 0.1522 8.0742 2.9733 11.0475 4.0156 2.7354 6.7510 0.0000 15,235.7435
15,235.7435
2.4273 0.0000 15,277.5014
Mitigated Construction
ROG NOx CO SO2 Fugitive PM10
Exhaust PM10
PM10 Total
Fugitive PM2.5
Exhaust PM2.5
PM2.5 Total
Bio- CO2 NBio-CO2 Total CO2 CH4 N20 CO2e
Percent Reduction
0.00 0.00 0.00 0.00 44.74 0.00 37.98 51.09 0.00 37.17 0.00 0.00 0.00 0.00 0.00 0.00
CalEEMod Version: CalEEMod.2016.3.2 Date: 2/13/2019 2:28 PMPage 4 of 26
Ramona and Indian Warehouse (Construction - Unmitigated) - Riverside-South Coast County, Summer

2.2 Overall Operational
ROG NOx CO SO2 Fugitive PM10
Exhaust PM10
PM10 Total
Fugitive PM2.5
Exhaust PM2.5
PM2.5 Total Bio- CO2 NBio- CO2 Total CO2 CH4 N2O CO2e
Category lb/day lb/day
Area 9.8928 4.2000e-004
0.0458 0.0000 1.6000e-004
1.6000e-004
1.6000e-004
1.6000e-004
0.0976 0.0976 2.6000e-004
0.1041
Energy 0.0000 0.0000 0.0000 0.0000 0.0000 0.0000 0.0000 0.0000 0.0000 0.0000 0.0000 0.0000 0.0000
Mobile 0.0000 0.0000 0.0000 0.0000 0.0000 0.0000 0.0000 0.0000 0.0000 0.0000 0.0000 0.0000 0.0000 0.0000
Total 9.8928 4.2000e-004
0.0458 0.0000 0.0000 1.6000e-004
1.6000e-004
0.0000 1.6000e-004
1.6000e-004
0.0976 0.0976 2.6000e-004
0.0000 0.1041
Unmitigated Operational
ROG NOx CO SO2 Fugitive PM10
Exhaust PM10
PM10 Total
Fugitive PM2.5
Exhaust PM2.5
PM2.5 Total Bio- CO2 NBio- CO2 Total CO2 CH4 N2O CO2e
Category lb/day lb/day
Area 9.8928 4.2000e-004
0.0458 0.0000 1.6000e-004
1.6000e-004
1.6000e-004
1.6000e-004
0.0976 0.0976 2.6000e-004
0.1041
Energy 0.0000 0.0000 0.0000 0.0000 0.0000 0.0000 0.0000 0.0000 0.0000 0.0000 0.0000 0.0000 0.0000
Mobile 0.0000 0.0000 0.0000 0.0000 0.0000 0.0000 0.0000 0.0000 0.0000 0.0000 0.0000 0.0000 0.0000 0.0000
Total 9.8928 4.2000e-004
0.0458 0.0000 0.0000 1.6000e-004
1.6000e-004
0.0000 1.6000e-004
1.6000e-004
0.0976 0.0976 2.6000e-004
0.0000 0.1041
Mitigated Operational
CalEEMod Version: CalEEMod.2016.3.2 Date: 2/13/2019 2:28 PMPage 5 of 26
Ramona and Indian Warehouse (Construction - Unmitigated) - Riverside-South Coast County, Summer

3.0 Construction Detail
Construction Phase
Phase Number
Phase Name Phase Type Start Date End Date Num Days Week
Num Days Phase Description
1 Site Preparation Site Preparation 1/1/2019 1/14/2019 5 10
2 Grading Grading 1/15/2019 3/4/2019 5 35
3 Building Construction Building Construction 3/5/2019 8/3/2020 5 370
4 Architectural Coating Architectural Coating 7/7/2020 8/31/2020 5 40
5 Paving Paving 8/4/2020 8/31/2020 5 20
OffRoad Equipment
ROG NOx CO SO2 Fugitive PM10
Exhaust PM10
PM10 Total
Fugitive PM2.5
Exhaust PM2.5
PM2.5 Total
Bio- CO2 NBio-CO2 Total CO2 CH4 N20 CO2e
Percent Reduction
0.00 0.00 0.00 0.00 0.00 0.00 0.00 0.00 0.00 0.00 0.00 0.00 0.00 0.00 0.00 0.00
Residential Indoor: 0; Residential Outdoor: 0; Non-Residential Indoor: 643,095; Non-Residential Outdoor: 214,365; Striped Parking Area: 38,303 (Architectural Coating – sqft)
Acres of Grading (Site Preparation Phase): 20
Acres of Grading (Grading Phase): 122.5
Acres of Paving: 16.99
CalEEMod Version: CalEEMod.2016.3.2 Date: 2/13/2019 2:28 PMPage 6 of 26
Ramona and Indian Warehouse (Construction - Unmitigated) - Riverside-South Coast County, Summer

Phase Name Offroad Equipment Type Amount Usage Hours Horse Power Load Factor
Site Preparation Crawler Tractors 4 8.00 212 0.43
Site Preparation Rubber Tired Dozers 3 8.00 247 0.40
Site Preparation Tractors/Loaders/Backhoes 0 8.00 97 0.37
Grading Crawler Tractors 2 8.00 212 0.43
Grading Excavators 2 8.00 158 0.38
Grading Graders 1 8.00 187 0.41
Grading Rubber Tired Dozers 1 8.00 247 0.40
Grading Scrapers 2 8.00 367 0.48
Grading Tractors/Loaders/Backhoes 0 8.00 97 0.37
Building Construction Cranes 1 8.00 231 0.29
Building Construction Crawler Tractors 3 8.00 212 0.43
Building Construction Forklifts 3 8.00 89 0.20
Building Construction Generator Sets 1 8.00 84 0.74
Building Construction Tractors/Loaders/Backhoes 0 8.00 97 0.37
Building Construction Welders 1 8.00 46 0.45
Architectural Coating Air Compressors 1 8.00 78 0.48
Paving Pavers 2 8.00 130 0.42
Paving Paving Equipment 2 8.00 132 0.36
Paving Rollers 2 8.00 80 0.38
Trips and VMT
CalEEMod Version: CalEEMod.2016.3.2 Date: 2/13/2019 2:28 PMPage 7 of 26
Ramona and Indian Warehouse (Construction - Unmitigated) - Riverside-South Coast County, Summer

3.2 Site Preparation - 2019
ROG NOx CO SO2 Fugitive PM10
Exhaust PM10
PM10 Total
Fugitive PM2.5
Exhaust PM2.5
PM2.5 Total Bio- CO2 NBio- CO2 Total CO2 CH4 N2O CO2e
Category lb/day lb/day
Fugitive Dust 20.1873 0.0000 20.1873 10.1597 0.0000 10.1597 0.0000 0.0000
Off-Road 5.8450 68.1996 23.1708 0.0570 2.9720 2.9720 2.7343 2.7343 5,645.4173
5,645.4173
1.7862 5,690.0710
Total 5.8450 68.1996 23.1708 0.0570 20.1873 2.9720 23.1593 10.1597 2.7343 12.8940 5,645.4173
5,645.4173
1.7862 5,690.0710
Unmitigated Construction On-Site
3.1 Mitigation Measures Construction
Water Exposed Area
Phase Name Offroad Equipment Count
Worker Trip Number
Vendor Trip Number
Hauling Trip Number
Worker Trip Length
Vendor Trip Length
Hauling Trip Length
Worker Vehicle Class
Vendor Vehicle Class
Hauling Vehicle Class
Site Preparation 7 18.00 0.00 0.00 14.70 6.90 20.00 LD_Mix HDT_Mix HHDT
Grading 8 20.00 0.00 1,250.00 14.70 6.90 20.00 LD_Mix HDT_Mix HHDT
Building Construction 9 448.00 175.00 0.00 14.70 6.90 20.00 LD_Mix HDT_Mix HHDT
Architectural Coating 1 90.00 0.00 0.00 14.70 6.90 20.00 LD_Mix HDT_Mix HHDT
Paving 6 15.00 0.00 0.00 14.70 6.90 20.00 LD_Mix HDT_Mix HHDT
CalEEMod Version: CalEEMod.2016.3.2 Date: 2/13/2019 2:28 PMPage 8 of 26
Ramona and Indian Warehouse (Construction - Unmitigated) - Riverside-South Coast County, Summer

3.2 Site Preparation - 2019
ROG NOx CO SO2 Fugitive PM10
Exhaust PM10
PM10 Total
Fugitive PM2.5
Exhaust PM2.5
PM2.5 Total Bio- CO2 NBio- CO2 Total CO2 CH4 N2O CO2e
Category lb/day lb/day
Hauling 0.0000 0.0000 0.0000 0.0000 0.0000 0.0000 0.0000 0.0000 0.0000 0.0000 0.0000 0.0000 0.0000 0.0000
Vendor 0.0000 0.0000 0.0000 0.0000 0.0000 0.0000 0.0000 0.0000 0.0000 0.0000 0.0000 0.0000 0.0000 0.0000
Worker 0.0991 0.0608 0.7997 2.0600e-003
0.2012 1.2400e-003
0.2024 0.0534 1.1400e-003
0.0545 204.7540 204.7540 5.7300e-003
204.8973
Total 0.0991 0.0608 0.7997 2.0600e-003
0.2012 1.2400e-003
0.2024 0.0534 1.1400e-003
0.0545 204.7540 204.7540 5.7300e-003
204.8973
Unmitigated Construction Off-Site
ROG NOx CO SO2 Fugitive PM10
Exhaust PM10
PM10 Total
Fugitive PM2.5
Exhaust PM2.5
PM2.5 Total Bio- CO2 NBio- CO2 Total CO2 CH4 N2O CO2e
Category lb/day lb/day
Fugitive Dust 7.8730 0.0000 7.8730 3.9623 0.0000 3.9623 0.0000 0.0000
Off-Road 5.8450 68.1996 23.1708 0.0570 2.9720 2.9720 2.7343 2.7343 0.0000 5,645.4173
5,645.4173
1.7862 5,690.0710
Total 5.8450 68.1996 23.1708 0.0570 7.8730 2.9720 10.8451 3.9623 2.7343 6.6965 0.0000 5,645.4173
5,645.4173
1.7862 5,690.0710
Mitigated Construction On-Site
CalEEMod Version: CalEEMod.2016.3.2 Date: 2/13/2019 2:28 PMPage 9 of 26
Ramona and Indian Warehouse (Construction - Unmitigated) - Riverside-South Coast County, Summer
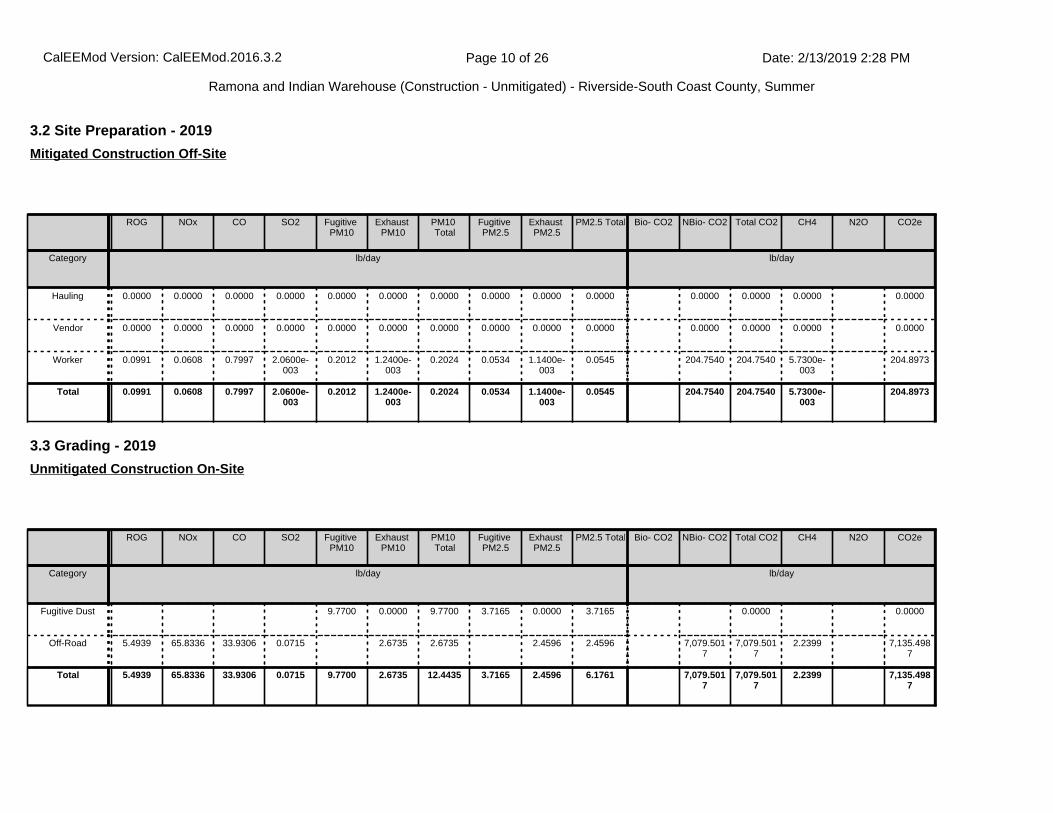
3.2 Site Preparation - 2019
ROG NOx CO SO2 Fugitive PM10
Exhaust PM10
PM10 Total
Fugitive PM2.5
Exhaust PM2.5
PM2.5 Total Bio- CO2 NBio- CO2 Total CO2 CH4 N2O CO2e
Category lb/day lb/day
Hauling 0.0000 0.0000 0.0000 0.0000 0.0000 0.0000 0.0000 0.0000 0.0000 0.0000 0.0000 0.0000 0.0000 0.0000
Vendor 0.0000 0.0000 0.0000 0.0000 0.0000 0.0000 0.0000 0.0000 0.0000 0.0000 0.0000 0.0000 0.0000 0.0000
Worker 0.0991 0.0608 0.7997 2.0600e-003
0.2012 1.2400e-003
0.2024 0.0534 1.1400e-003
0.0545 204.7540 204.7540 5.7300e-003
204.8973
Total 0.0991 0.0608 0.7997 2.0600e-003
0.2012 1.2400e-003
0.2024 0.0534 1.1400e-003
0.0545 204.7540 204.7540 5.7300e-003
204.8973
Mitigated Construction Off-Site
3.3 Grading - 2019
ROG NOx CO SO2 Fugitive PM10
Exhaust PM10
PM10 Total
Fugitive PM2.5
Exhaust PM2.5
PM2.5 Total Bio- CO2 NBio- CO2 Total CO2 CH4 N2O CO2e
Category lb/day lb/day
Fugitive Dust 9.7700 0.0000 9.7700 3.7165 0.0000 3.7165 0.0000 0.0000
Off-Road 5.4939 65.8336 33.9306 0.0715 2.6735 2.6735 2.4596 2.4596 7,079.5017
7,079.5017
2.2399 7,135.4987
Total 5.4939 65.8336 33.9306 0.0715 9.7700 2.6735 12.4435 3.7165 2.4596 6.1761 7,079.5017
7,079.5017
2.2399 7,135.4987
Unmitigated Construction On-Site
CalEEMod Version: CalEEMod.2016.3.2 Date: 2/13/2019 2:28 PMPage 10 of 26
Ramona and Indian Warehouse (Construction - Unmitigated) - Riverside-South Coast County, Summer

3.3 Grading - 2019
ROG NOx CO SO2 Fugitive PM10
Exhaust PM10
PM10 Total
Fugitive PM2.5
Exhaust PM2.5
PM2.5 Total Bio- CO2 NBio- CO2 Total CO2 CH4 N2O CO2e
Category lb/day lb/day
Hauling 0.2006 9.1236 1.0972 0.0275 0.6248 0.0330 0.6578 0.1713 0.0315 0.2028 2,914.2562
2,914.2562
0.1811 2,918.7828
Vendor 0.0000 0.0000 0.0000 0.0000 0.0000 0.0000 0.0000 0.0000 0.0000 0.0000 0.0000 0.0000 0.0000 0.0000
Worker 0.1101 0.0676 0.8885 2.2900e-003
0.2236 1.3800e-003
0.2249 0.0593 1.2700e-003
0.0606 227.5045 227.5045 6.3700e-003
227.6637
Total 0.3107 9.1912 1.9857 0.0298 0.8484 0.0344 0.8827 0.2306 0.0328 0.2634 3,141.7607
3,141.7607
0.1874 3,146.4465
Unmitigated Construction Off-Site
ROG NOx CO SO2 Fugitive PM10
Exhaust PM10
PM10 Total
Fugitive PM2.5
Exhaust PM2.5
PM2.5 Total Bio- CO2 NBio- CO2 Total CO2 CH4 N2O CO2e
Category lb/day lb/day
Fugitive Dust 3.8103 0.0000 3.8103 1.4494 0.0000 1.4494 0.0000 0.0000
Off-Road 5.4939 65.8336 33.9306 0.0715 2.6735 2.6735 2.4596 2.4596 0.0000 7,079.5017
7,079.5017
2.2399 7,135.4987
Total 5.4939 65.8336 33.9306 0.0715 3.8103 2.6735 6.4838 1.4494 2.4596 3.9090 0.0000 7,079.5017
7,079.5017
2.2399 7,135.4987
Mitigated Construction On-Site
CalEEMod Version: CalEEMod.2016.3.2 Date: 2/13/2019 2:28 PMPage 11 of 26
Ramona and Indian Warehouse (Construction - Unmitigated) - Riverside-South Coast County, Summer

3.3 Grading - 2019
ROG NOx CO SO2 Fugitive PM10
Exhaust PM10
PM10 Total
Fugitive PM2.5
Exhaust PM2.5
PM2.5 Total Bio- CO2 NBio- CO2 Total CO2 CH4 N2O CO2e
Category lb/day lb/day
Hauling 0.2006 9.1236 1.0972 0.0275 0.6248 0.0330 0.6578 0.1713 0.0315 0.2028 2,914.2562
2,914.2562
0.1811 2,918.7828
Vendor 0.0000 0.0000 0.0000 0.0000 0.0000 0.0000 0.0000 0.0000 0.0000 0.0000 0.0000 0.0000 0.0000 0.0000
Worker 0.1101 0.0676 0.8885 2.2900e-003
0.2236 1.3800e-003
0.2249 0.0593 1.2700e-003
0.0606 227.5045 227.5045 6.3700e-003
227.6637
Total 0.3107 9.1912 1.9857 0.0298 0.8484 0.0344 0.8827 0.2306 0.0328 0.2634 3,141.7607
3,141.7607
0.1874 3,146.4465
Mitigated Construction Off-Site
3.4 Building Construction - 2019
ROG NOx CO SO2 Fugitive PM10
Exhaust PM10
PM10 Total
Fugitive PM2.5
Exhaust PM2.5
PM2.5 Total
Bio- CO2 NBio- CO2 Total CO2 CH4 N2O CO2e
Category lb/day lb/day
Off-Road 3.6440 39.6763 19.1447 0.0430 1.8165 1.8165 1.6972 1.6972 4,187.5330
4,187.5330
1.1363 4,215.9399
Total 3.6440 39.6763 19.1447 0.0430 1.8165 1.8165 1.6972 1.6972 4,187.5330
4,187.5330
1.1363 4,215.9399
Unmitigated Construction On-Site
CalEEMod Version: CalEEMod.2016.3.2 Date: 2/13/2019 2:28 PMPage 12 of 26
Ramona and Indian Warehouse (Construction - Unmitigated) - Riverside-South Coast County, Summer

3.4 Building Construction - 2019
ROG NOx CO SO2 Fugitive PM10
Exhaust PM10
PM10 Total
Fugitive PM2.5
Exhaust PM2.5
PM2.5 Total Bio- CO2 NBio- CO2 Total CO2 CH4 N2O CO2e
Category lb/day lb/day
Hauling 0.0000 0.0000 0.0000 0.0000 0.0000 0.0000 0.0000 0.0000 0.0000 0.0000 0.0000 0.0000 0.0000 0.0000
Vendor 0.5829 19.9209 3.7331 0.0461 1.1207 0.1513 1.2720 0.3227 0.1448 0.4674 4,852.7957
4,852.7957
0.3883 4,862.5030
Worker 2.4667 1.5138 19.9026 0.0512 5.0076 0.0309 5.0385 1.3280 0.0285 1.3565 5,096.1000
5,096.1000
0.1427 5,099.6667
Total 3.0496 21.4346 23.6358 0.0972 6.1283 0.1822 6.3105 1.6507 0.1732 1.8239 9,948.8957
9,948.8957
0.5310 9,962.1697
Unmitigated Construction Off-Site
ROG NOx CO SO2 Fugitive PM10
Exhaust PM10
PM10 Total
Fugitive PM2.5
Exhaust PM2.5
PM2.5 Total Bio- CO2 NBio- CO2 Total CO2 CH4 N2O CO2e
Category lb/day lb/day
Off-Road 3.6440 39.6763 19.1447 0.0430 1.8165 1.8165 1.6972 1.6972 0.0000 4,187.5330
4,187.5330
1.1363 4,215.9399
Total 3.6440 39.6763 19.1447 0.0430 1.8165 1.8165 1.6972 1.6972 0.0000 4,187.5330
4,187.5330
1.1363 4,215.9399
Mitigated Construction On-Site
CalEEMod Version: CalEEMod.2016.3.2 Date: 2/13/2019 2:28 PMPage 13 of 26
Ramona and Indian Warehouse (Construction - Unmitigated) - Riverside-South Coast County, Summer

3.4 Building Construction - 2019
ROG NOx CO SO2 Fugitive PM10
Exhaust PM10
PM10 Total
Fugitive PM2.5
Exhaust PM2.5
PM2.5 Total Bio- CO2 NBio- CO2 Total CO2 CH4 N2O CO2e
Category lb/day lb/day
Hauling 0.0000 0.0000 0.0000 0.0000 0.0000 0.0000 0.0000 0.0000 0.0000 0.0000 0.0000 0.0000 0.0000 0.0000
Vendor 0.5829 19.9209 3.7331 0.0461 1.1207 0.1513 1.2720 0.3227 0.1448 0.4674 4,852.7957
4,852.7957
0.3883 4,862.5030
Worker 2.4667 1.5138 19.9026 0.0512 5.0076 0.0309 5.0385 1.3280 0.0285 1.3565 5,096.1000
5,096.1000
0.1427 5,099.6667
Total 3.0496 21.4346 23.6358 0.0972 6.1283 0.1822 6.3105 1.6507 0.1732 1.8239 9,948.8957
9,948.8957
0.5310 9,962.1697
Mitigated Construction Off-Site
3.4 Building Construction - 2020
ROG NOx CO SO2 Fugitive PM10
Exhaust PM10
PM10 Total
Fugitive PM2.5
Exhaust PM2.5
PM2.5 Total
Bio- CO2 NBio- CO2 Total CO2 CH4 N2O CO2e
Category lb/day lb/day
Off-Road 3.3632 36.6770 18.6286 0.0430 1.6373 1.6373 1.5290 1.5290 4,114.5597 4,114.5597 1.1279 4,142.7566
Total 3.3632 36.6770 18.6286 0.0430 1.6373 1.6373 1.5290 1.5290 4,114.5597
4,114.5597
1.1279 4,142.7566
Unmitigated Construction On-Site
CalEEMod Version: CalEEMod.2016.3.2 Date: 2/13/2019 2:28 PMPage 14 of 26
Ramona and Indian Warehouse (Construction - Unmitigated) - Riverside-South Coast County, Summer

3.4 Building Construction - 2020
ROG NOx CO SO2 Fugitive PM10
Exhaust PM10
PM10 Total
Fugitive PM2.5
Exhaust PM2.5
PM2.5 Total Bio- CO2 NBio- CO2 Total CO2 CH4 N2O CO2e
Category lb/day lb/day
Hauling 0.0000 0.0000 0.0000 0.0000 0.0000 0.0000 0.0000 0.0000 0.0000 0.0000 0.0000 0.0000 0.0000 0.0000
Vendor 0.4878 18.0061 3.2941 0.0457 1.1206 0.1024 1.2231 0.3227 0.0980 0.4206 4,819.3412
4,819.3412
0.3615 4,828.3780
Worker 2.2798 1.3483 18.0640 0.0496 5.0076 0.0303 5.0379 1.3280 0.0279 1.3560 4,935.1435
4,935.1435
0.1265 4,938.3060
Total 2.7675 19.3543 21.3581 0.0953 6.1282 0.1327 6.2610 1.6507 0.1259 1.7766 9,754.4847
9,754.4847
0.4880 9,766.6840
Unmitigated Construction Off-Site
ROG NOx CO SO2 Fugitive PM10
Exhaust PM10
PM10 Total
Fugitive PM2.5
Exhaust PM2.5
PM2.5 Total Bio- CO2 NBio- CO2 Total CO2 CH4 N2O CO2e
Category lb/day lb/day
Off-Road 3.3632 36.6770 18.6286 0.0430 1.6373 1.6373 1.5290 1.5290 0.0000 4,114.5597 4,114.5597
1.1279 4,142.7566
Total 3.3632 36.6770 18.6286 0.0430 1.6373 1.6373 1.5290 1.5290 0.0000 4,114.5597
4,114.5597
1.1279 4,142.7566
Mitigated Construction On-Site
CalEEMod Version: CalEEMod.2016.3.2 Date: 2/13/2019 2:28 PMPage 15 of 26
Ramona and Indian Warehouse (Construction - Unmitigated) - Riverside-South Coast County, Summer

3.4 Building Construction - 2020
ROG NOx CO SO2 Fugitive PM10
Exhaust PM10
PM10 Total
Fugitive PM2.5
Exhaust PM2.5
PM2.5 Total Bio- CO2 NBio- CO2 Total CO2 CH4 N2O CO2e
Category lb/day lb/day
Hauling 0.0000 0.0000 0.0000 0.0000 0.0000 0.0000 0.0000 0.0000 0.0000 0.0000 0.0000 0.0000 0.0000 0.0000
Vendor 0.4878 18.0061 3.2941 0.0457 1.1206 0.1024 1.2231 0.3227 0.0980 0.4206 4,819.3412
4,819.3412
0.3615 4,828.3780
Worker 2.2798 1.3483 18.0640 0.0496 5.0076 0.0303 5.0379 1.3280 0.0279 1.3560 4,935.1435
4,935.1435
0.1265 4,938.3060
Total 2.7675 19.3543 21.3581 0.0953 6.1282 0.1327 6.2610 1.6507 0.1259 1.7766 9,754.4847
9,754.4847
0.4880 9,766.6840
Mitigated Construction Off-Site
3.5 Architectural Coating - 2020
ROG NOx CO SO2 Fugitive PM10
Exhaust PM10
PM10 Total
Fugitive PM2.5
Exhaust PM2.5
PM2.5 Total Bio- CO2 NBio- CO2 Total CO2 CH4 N2O CO2e
Category lb/day lb/day
Archit. Coating 51.8983 0.0000 0.0000 0.0000 0.0000 0.0000 0.0000
Off-Road 0.3229 2.2451 2.4419 3.9600e-003
0.1479 0.1479 0.1479 0.1479 375.2641 375.2641 0.0291 375.9904
Total 52.2212 2.2451 2.4419 3.9600e-003
0.1479 0.1479 0.1479 0.1479 375.2641 375.2641 0.0291 375.9904
Unmitigated Construction On-Site
CalEEMod Version: CalEEMod.2016.3.2 Date: 2/13/2019 2:28 PMPage 16 of 26
Ramona and Indian Warehouse (Construction - Unmitigated) - Riverside-South Coast County, Summer

3.5 Architectural Coating - 2020
ROG NOx CO SO2 Fugitive PM10
Exhaust PM10
PM10 Total
Fugitive PM2.5
Exhaust PM2.5
PM2.5 Total Bio- CO2 NBio- CO2 Total CO2 CH4 N2O CO2e
Category lb/day lb/day
Hauling 0.0000 0.0000 0.0000 0.0000 0.0000 0.0000 0.0000 0.0000 0.0000 0.0000 0.0000 0.0000 0.0000 0.0000
Vendor 0.0000 0.0000 0.0000 0.0000 0.0000 0.0000 0.0000 0.0000 0.0000 0.0000 0.0000 0.0000 0.0000 0.0000
Worker 0.4580 0.2709 3.6289 9.9500e-003
1.0060 6.0900e-003
1.0121 0.2668 5.6100e-003
0.2724 991.4351 991.4351 0.0254 992.0704
Total 0.4580 0.2709 3.6289 9.9500e-003
1.0060 6.0900e-003
1.0121 0.2668 5.6100e-003
0.2724 991.4351 991.4351 0.0254 992.0704
Unmitigated Construction Off-Site
ROG NOx CO SO2 Fugitive PM10
Exhaust PM10
PM10 Total
Fugitive PM2.5
Exhaust PM2.5
PM2.5 Total Bio- CO2 NBio- CO2 Total CO2 CH4 N2O CO2e
Category lb/day lb/day
Archit. Coating 51.8983 0.0000 0.0000 0.0000 0.0000 0.0000 0.0000
Off-Road 0.3229 2.2451 2.4419 3.9600e-003
0.1479 0.1479 0.1479 0.1479 0.0000 375.2641 375.2641 0.0291 375.9904
Total 52.2212 2.2451 2.4419 3.9600e-003
0.1479 0.1479 0.1479 0.1479 0.0000 375.2641 375.2641 0.0291 375.9904
Mitigated Construction On-Site
CalEEMod Version: CalEEMod.2016.3.2 Date: 2/13/2019 2:28 PMPage 17 of 26
Ramona and Indian Warehouse (Construction - Unmitigated) - Riverside-South Coast County, Summer

3.5 Architectural Coating - 2020
ROG NOx CO SO2 Fugitive PM10
Exhaust PM10
PM10 Total
Fugitive PM2.5
Exhaust PM2.5
PM2.5 Total Bio- CO2 NBio- CO2 Total CO2 CH4 N2O CO2e
Category lb/day lb/day
Hauling 0.0000 0.0000 0.0000 0.0000 0.0000 0.0000 0.0000 0.0000 0.0000 0.0000 0.0000 0.0000 0.0000 0.0000
Vendor 0.0000 0.0000 0.0000 0.0000 0.0000 0.0000 0.0000 0.0000 0.0000 0.0000 0.0000 0.0000 0.0000 0.0000
Worker 0.4580 0.2709 3.6289 9.9500e-003
1.0060 6.0900e-003
1.0121 0.2668 5.6100e-003
0.2724 991.4351 991.4351 0.0254 992.0704
Total 0.4580 0.2709 3.6289 9.9500e-003
1.0060 6.0900e-003
1.0121 0.2668 5.6100e-003
0.2724 991.4351 991.4351 0.0254 992.0704
Mitigated Construction Off-Site
3.6 Paving - 2020
ROG NOx CO SO2 Fugitive PM10
Exhaust PM10
PM10 Total
Fugitive PM2.5
Exhaust PM2.5
PM2.5 Total Bio- CO2 NBio- CO2 Total CO2 CH4 N2O CO2e
Category lb/day lb/day
Off-Road 1.3566 14.0656 14.6521 0.0228 0.7528 0.7528 0.6926 0.6926 2,207.7334
2,207.7334
0.7140 2,225.5841
Paving 1.5052 0.0000 0.0000 0.0000 0.0000 0.0000 0.0000
Total 2.8617 14.0656 14.6521 0.0228 0.7528 0.7528 0.6926 0.6926 2,207.7334
2,207.7334
0.7140 2,225.5841
Unmitigated Construction On-Site
CalEEMod Version: CalEEMod.2016.3.2 Date: 2/13/2019 2:28 PMPage 18 of 26
Ramona and Indian Warehouse (Construction - Unmitigated) - Riverside-South Coast County, Summer

3.6 Paving - 2020
ROG NOx CO SO2 Fugitive PM10
Exhaust PM10
PM10 Total
Fugitive PM2.5
Exhaust PM2.5
PM2.5 Total Bio- CO2 NBio- CO2 Total CO2 CH4 N2O CO2e
Category lb/day lb/day
Hauling 0.0000 0.0000 0.0000 0.0000 0.0000 0.0000 0.0000 0.0000 0.0000 0.0000 0.0000 0.0000 0.0000 0.0000
Vendor 0.0000 0.0000 0.0000 0.0000 0.0000 0.0000 0.0000 0.0000 0.0000 0.0000 0.0000 0.0000 0.0000 0.0000
Worker 0.0763 0.0451 0.6048 1.6600e-003
0.1677 1.0200e-003
0.1687 0.0445 9.3000e-004
0.0454 165.2392 165.2392 4.2400e-003
165.3451
Total 0.0763 0.0451 0.6048 1.6600e-003
0.1677 1.0200e-003
0.1687 0.0445 9.3000e-004
0.0454 165.2392 165.2392 4.2400e-003
165.3451
Unmitigated Construction Off-Site
ROG NOx CO SO2 Fugitive PM10
Exhaust PM10
PM10 Total
Fugitive PM2.5
Exhaust PM2.5
PM2.5 Total Bio- CO2 NBio- CO2 Total CO2 CH4 N2O CO2e
Category lb/day lb/day
Off-Road 1.3566 14.0656 14.6521 0.0228 0.7528 0.7528 0.6926 0.6926 0.0000 2,207.7334
2,207.7334
0.7140 2,225.5841
Paving 1.5052 0.0000 0.0000 0.0000 0.0000 0.0000 0.0000
Total 2.8617 14.0656 14.6521 0.0228 0.7528 0.7528 0.6926 0.6926 0.0000 2,207.7334
2,207.7334
0.7140 2,225.5841
Mitigated Construction On-Site
CalEEMod Version: CalEEMod.2016.3.2 Date: 2/13/2019 2:28 PMPage 19 of 26
Ramona and Indian Warehouse (Construction - Unmitigated) - Riverside-South Coast County, Summer

4.0 Operational Detail - Mobile
4.1 Mitigation Measures Mobile
3.6 Paving - 2020
ROG NOx CO SO2 Fugitive PM10
Exhaust PM10
PM10 Total
Fugitive PM2.5
Exhaust PM2.5
PM2.5 Total Bio- CO2 NBio- CO2 Total CO2 CH4 N2O CO2e
Category lb/day lb/day
Hauling 0.0000 0.0000 0.0000 0.0000 0.0000 0.0000 0.0000 0.0000 0.0000 0.0000 0.0000 0.0000 0.0000 0.0000
Vendor 0.0000 0.0000 0.0000 0.0000 0.0000 0.0000 0.0000 0.0000 0.0000 0.0000 0.0000 0.0000 0.0000 0.0000
Worker 0.0763 0.0451 0.6048 1.6600e-003
0.1677 1.0200e-003
0.1687 0.0445 9.3000e-004
0.0454 165.2392 165.2392 4.2400e-003
165.3451
Total 0.0763 0.0451 0.6048 1.6600e-003
0.1677 1.0200e-003
0.1687 0.0445 9.3000e-004
0.0454 165.2392 165.2392 4.2400e-003
165.3451
Mitigated Construction Off-Site
CalEEMod Version: CalEEMod.2016.3.2 Date: 2/13/2019 2:28 PMPage 20 of 26
Ramona and Indian Warehouse (Construction - Unmitigated) - Riverside-South Coast County, Summer

ROG NOx CO SO2 Fugitive PM10
Exhaust PM10
PM10 Total
Fugitive PM2.5
Exhaust PM2.5
PM2.5 Total Bio- CO2 NBio- CO2 Total CO2 CH4 N2O CO2e
Category lb/day lb/day
Mitigated 0.0000 0.0000 0.0000 0.0000 0.0000 0.0000 0.0000 0.0000 0.0000 0.0000 0.0000 0.0000 0.0000 0.0000
Unmitigated 0.0000 0.0000 0.0000 0.0000 0.0000 0.0000 0.0000 0.0000 0.0000 0.0000 0.0000 0.0000 0.0000 0.0000
4.2 Trip Summary Information
4.3 Trip Type Information
Average Daily Trip Rate Unmitigated Mitigated
Land Use Weekday Saturday Sunday Annual VMT Annual VMT
Other Non-Asphalt Surfaces 0.00 0.00 0.00
Parking Lot 0.00 0.00 0.00
Unrefrigerated Warehouse-No Rail 0.00 0.00 0.00
Total 0.00 0.00 0.00
Miles Trip % Trip Purpose %
Land Use H-W or C-W H-S or C-C H-O or C-NW H-W or C-W H-S or C-C H-O or C-NW Primary Diverted Pass-by
Other Non-Asphalt Surfaces 16.60 8.40 6.90 0.00 0.00 0.00 0 0 0
Parking Lot 16.60 8.40 6.90 0.00 0.00 0.00 0 0 0
Unrefrigerated Warehouse-No Rail
0.00 0.00 0.00 0.00 0.00 0.00 0 0 0
4.4 Fleet Mix
CalEEMod Version: CalEEMod.2016.3.2 Date: 2/13/2019 2:28 PMPage 21 of 26
Ramona and Indian Warehouse (Construction - Unmitigated) - Riverside-South Coast County, Summer

5.0 Energy Detail
ROG NOx CO SO2 Fugitive PM10
Exhaust PM10
PM10 Total
Fugitive PM2.5
Exhaust PM2.5
PM2.5 Total Bio- CO2 NBio- CO2 Total CO2 CH4 N2O CO2e
Category lb/day lb/day
NaturalGas Mitigated
0.0000 0.0000 0.0000 0.0000 0.0000 0.0000 0.0000 0.0000 0.0000 0.0000 0.0000 0.0000 0.0000
NaturalGas Unmitigated
0.0000 0.0000 0.0000 0.0000 0.0000 0.0000 0.0000 0.0000 0.0000 0.0000 0.0000 0.0000 0.0000
5.1 Mitigation Measures Energy
Land Use LDA LDT1 LDT2 MDV LHD1 LHD2 MHD HHD OBUS UBUS MCY SBUS MH
Other Non-Asphalt Surfaces 0.538064 0.038449 0.184390 0.122109 0.017402 0.005339 0.017250 0.067711 0.001365 0.001213 0.004629 0.000959 0.001120
Parking Lot 0.538064 0.038449 0.184390 0.122109 0.017402 0.005339 0.017250 0.067711 0.001365 0.001213 0.004629 0.000959 0.001120
Unrefrigerated Warehouse-No Rail
0.538064 0.038449 0.184390 0.122109 0.017402 0.005339 0.017250 0.067711 0.001365 0.001213 0.004629 0.000959 0.001120
Historical Energy Use: N
CalEEMod Version: CalEEMod.2016.3.2 Date: 2/13/2019 2:28 PMPage 22 of 26
Ramona and Indian Warehouse (Construction - Unmitigated) - Riverside-South Coast County, Summer

5.2 Energy by Land Use - NaturalGas
NaturalGas Use
ROG NOx CO SO2 Fugitive PM10
Exhaust PM10
PM10 Total
Fugitive PM2.5
Exhaust PM2.5
PM2.5 Total Bio- CO2 NBio- CO2 Total CO2 CH4 N2O CO2e
Land Use kBTU/yr lb/day lb/day
Other Non-Asphalt Surfaces
0 0.0000 0.0000 0.0000 0.0000 0.0000 0.0000 0.0000 0.0000 0.0000 0.0000 0.0000 0.0000 0.0000
Parking Lot 0 0.0000 0.0000 0.0000 0.0000 0.0000 0.0000 0.0000 0.0000 0.0000 0.0000 0.0000 0.0000 0.0000
Unrefrigerated Warehouse-No
Rail
0 0.0000 0.0000 0.0000 0.0000 0.0000 0.0000 0.0000 0.0000 0.0000 0.0000 0.0000 0.0000 0.0000
Total 0.0000 0.0000 0.0000 0.0000 0.0000 0.0000 0.0000 0.0000 0.0000 0.0000 0.0000 0.0000 0.0000
Unmitigated
NaturalGas Use
ROG NOx CO SO2 Fugitive PM10
Exhaust PM10
PM10 Total
Fugitive PM2.5
Exhaust PM2.5
PM2.5 Total Bio- CO2 NBio- CO2 Total CO2 CH4 N2O CO2e
Land Use kBTU/yr lb/day lb/day
Other Non-Asphalt Surfaces
0 0.0000 0.0000 0.0000 0.0000 0.0000 0.0000 0.0000 0.0000 0.0000 0.0000 0.0000 0.0000 0.0000
Parking Lot 0 0.0000 0.0000 0.0000 0.0000 0.0000 0.0000 0.0000 0.0000 0.0000 0.0000 0.0000 0.0000 0.0000
Unrefrigerated Warehouse-No
Rail
0 0.0000 0.0000 0.0000 0.0000 0.0000 0.0000 0.0000 0.0000 0.0000 0.0000 0.0000 0.0000 0.0000
Total 0.0000 0.0000 0.0000 0.0000 0.0000 0.0000 0.0000 0.0000 0.0000 0.0000 0.0000 0.0000 0.0000
Mitigated
CalEEMod Version: CalEEMod.2016.3.2 Date: 2/13/2019 2:28 PMPage 23 of 26
Ramona and Indian Warehouse (Construction - Unmitigated) - Riverside-South Coast County, Summer

6.1 Mitigation Measures Area
6.0 Area Detail
ROG NOx CO SO2 Fugitive PM10
Exhaust PM10
PM10 Total
Fugitive PM2.5
Exhaust PM2.5
PM2.5 Total Bio- CO2 NBio- CO2 Total CO2 CH4 N2O CO2e
Category lb/day lb/day
Mitigated 9.8928 4.2000e-004
0.0458 0.0000 1.6000e-004
1.6000e-004
1.6000e-004
1.6000e-004
0.0976 0.0976 2.6000e-004
0.1041
Unmitigated 9.8928 4.2000e-004
0.0458 0.0000 1.6000e-004
1.6000e-004
1.6000e-004
1.6000e-004
0.0976 0.0976 2.6000e-004
0.1041
CalEEMod Version: CalEEMod.2016.3.2 Date: 2/13/2019 2:28 PMPage 24 of 26
Ramona and Indian Warehouse (Construction - Unmitigated) - Riverside-South Coast County, Summer

7.0 Water Detail
6.2 Area by SubCategory
ROG NOx CO SO2 Fugitive PM10
Exhaust PM10
PM10 Total
Fugitive PM2.5
Exhaust PM2.5
PM2.5 Total Bio- CO2 NBio- CO2 Total CO2 CH4 N2O CO2e
SubCategory lb/day lb/day
Architectural Coating
1.1375 0.0000 0.0000 0.0000 0.0000 0.0000 0.0000
Consumer Products
8.7510 0.0000 0.0000 0.0000 0.0000 0.0000 0.0000
Landscaping 4.3100e-003
4.2000e-004
0.0458 0.0000 1.6000e-004
1.6000e-004
1.6000e-004
1.6000e-004
0.0976 0.0976 2.6000e-004
0.1041
Total 9.8928 4.2000e-004
0.0458 0.0000 1.6000e-004
1.6000e-004
1.6000e-004
1.6000e-004
0.0976 0.0976 2.6000e-004
0.1041
Unmitigated
ROG NOx CO SO2 Fugitive PM10
Exhaust PM10
PM10 Total
Fugitive PM2.5
Exhaust PM2.5
PM2.5 Total Bio- CO2 NBio- CO2 Total CO2 CH4 N2O CO2e
SubCategory lb/day lb/day
Architectural Coating
1.1375 0.0000 0.0000 0.0000 0.0000 0.0000 0.0000
Consumer Products
8.7510 0.0000 0.0000 0.0000 0.0000 0.0000 0.0000
Landscaping 4.3100e-003
4.2000e-004
0.0458 0.0000 1.6000e-004
1.6000e-004
1.6000e-004
1.6000e-004
0.0976 0.0976 2.6000e-004
0.1041
Total 9.8928 4.2000e-004
0.0458 0.0000 1.6000e-004
1.6000e-004
1.6000e-004
1.6000e-004
0.0976 0.0976 2.6000e-004
0.1041
Mitigated
CalEEMod Version: CalEEMod.2016.3.2 Date: 2/13/2019 2:28 PMPage 25 of 26
Ramona and Indian Warehouse (Construction - Unmitigated) - Riverside-South Coast County, Summer

8.1 Mitigation Measures Waste
7.1 Mitigation Measures Water
7.0 Water Detail
8.0 Waste Detail
11.0 Vegetation
9.0 Operational Offroad
Equipment Type Number Hours/Day Days/Year Horse Power Load Factor Fuel Type
10.0 Stationary Equipment
Fire Pumps and Emergency Generators
Equipment Type Number Hours/Day Hours/Year Horse Power Load Factor Fuel Type
Boilers
Equipment Type Number Heat Input/Day Heat Input/Year Boiler Rating Fuel Type
User Defined Equipment
Equipment Type Number
CalEEMod Version: CalEEMod.2016.3.2 Date: 2/13/2019 2:28 PMPage 26 of 26
Ramona and Indian Warehouse (Construction - Unmitigated) - Riverside-South Coast County, Summer

1.1 Land Usage
Land Uses Size Metric Lot Acreage Floor Surface Area Population
Unrefrigerated Warehouse-No Rail 428.73 1000sqft 9.85 428,730.00 0
Other Non-Asphalt Surfaces 5.50 Acre 5.50 239,580.00 0
Parking Lot 11.49 Acre 11.49 500,504.40 0
1.2 Other Project Characteristics
Urbanization
Climate Zone
Urban
10
Wind Speed (m/s) Precipitation Freq (Days)2.4 28
1.3 User Entered Comments & Non-Default Data
1.0 Project Characteristics
Utility Company Southern California Edison
2020Operational Year
CO2 Intensity (lb/MWhr)
702.44 0.029CH4 Intensity (lb/MWhr)
0.006N2O Intensity (lb/MWhr)
Ramona and Indian Warehouse (Construction - Unmitigated)Riverside-South Coast County, Winter
CalEEMod Version: CalEEMod.2016.3.2 Date: 2/13/2019 2:27 PMPage 1 of 26
Ramona and Indian Warehouse (Construction - Unmitigated) - Riverside-South Coast County, Winter

Project Characteristics -
Land Use - Total Site Area is 26.84 acres (24.2 on-site and 2.64 off-site). Per the Site Plan, 9.85 acres is Building, 11.49 acres is Parking.
Construction Phase - Architectural Coating activities will be conducted concurrent with Building Construction and Paving activities.
Off-road Equipment - Hours are based on an 8-hour workday.
Off-road Equipment - Crawler Tractors used in lieu of Tractors/Loaders/Backhoes.
Off-road Equipment - Crawler Tractors used in lieu of Tractors/Loaders/Backhoes.
Off-road Equipment -
Off-road Equipment - Crawler Tractors used in lieu of Tractors/Loaders/Backhoes.
Trips and VMT -
Grading -
Architectural Coating - Rule 1113
Vehicle Trips - Construction Run Only.
Area Coating -
Energy Use - Construction Run Only.
Water And Wastewater - Construction Run Only.
Solid Waste - Construction Run Only.
Construction Off-road Equipment Mitigation -
Fleet Mix -
Table Name Column Name Default Value New Value
tblArchitecturalCoating EF_Nonresidential_Exterior 100.00 50.00
tblArchitecturalCoating EF_Nonresidential_Interior 100.00 50.00
tblArchitecturalCoating EF_Parking 100.00 50.00
tblConstructionPhase NumDays 20.00 40.00
tblEnergyUse LightingElect 0.35 0.00
tblEnergyUse LightingElect 1.17 0.00
tblEnergyUse NT24E 0.82 0.00
CalEEMod Version: CalEEMod.2016.3.2 Date: 2/13/2019 2:27 PMPage 2 of 26
Ramona and Indian Warehouse (Construction - Unmitigated) - Riverside-South Coast County, Winter

2.0 Emissions Summary
tblEnergyUse NT24NG 0.03 0.00
tblEnergyUse T24E 0.37 0.00
tblEnergyUse T24NG 2.00 0.00
tblGrading MaterialImported 0.00 10,000.00
tblLandUse LotAcreage 9.84 9.85
tblOffRoadEquipment OffRoadEquipmentUnitAmount 3.00 0.00
tblOffRoadEquipment OffRoadEquipmentUnitAmount 2.00 0.00
tblOffRoadEquipment OffRoadEquipmentUnitAmount 4.00 0.00
tblOffRoadEquipment UsageHours 6.00 8.00
tblOffRoadEquipment UsageHours 7.00 8.00
tblOffRoadEquipment UsageHours 7.00 8.00
tblSolidWaste SolidWasteGenerationRate 403.01 0.00
tblVehicleTrips CC_TL 8.40 0.00
tblVehicleTrips CNW_TL 6.90 0.00
tblVehicleTrips CNW_TTP 41.00 0.00
tblVehicleTrips CW_TL 16.60 0.00
tblVehicleTrips CW_TTP 59.00 0.00
tblVehicleTrips DV_TP 5.00 0.00
tblVehicleTrips PB_TP 3.00 0.00
tblVehicleTrips PR_TP 92.00 0.00
tblVehicleTrips ST_TR 1.68 0.00
tblVehicleTrips SU_TR 1.68 0.00
tblVehicleTrips WD_TR 1.68 0.00
tblWater IndoorWaterUseRate 99,143,812.50 0.00
CalEEMod Version: CalEEMod.2016.3.2 Date: 2/13/2019 2:27 PMPage 3 of 26
Ramona and Indian Warehouse (Construction - Unmitigated) - Riverside-South Coast County, Winter

2.1 Overall Construction (Maximum Daily Emission)
ROG NOx CO SO2 Fugitive PM10
Exhaust PM10
PM10 Total
Fugitive PM2.5
Exhaust PM2.5
PM2.5 Total Bio- CO2 NBio- CO2 Total CO2 CH4 N2O CO2e
Year lb/day lb/day
2019 6.6660 75.1190 39.6156 0.1333 20.3885 2.9733 23.3617 10.2131 2.7354 12.9485 0.0000 13,430.8760
13,430.8760
2.4437 0.0000 13,473.1682
2020 58.7799 58.5089 42.4757 0.1444 7.1342 1.9253 9.0595 1.9175 1.8096 3.7271 0.0000 14,444.7806
14,444.7806
1.6912 0.0000 14,487.0613
Maximum 58.7799 75.1190 42.4757 0.1444 20.3885 2.9733 23.3617 10.2131 2.7354 12.9485 0.0000 14,444.7806
14,444.7806
2.4437 0.0000 14,487.0613
Unmitigated Construction
ROG NOx CO SO2 Fugitive PM10
Exhaust PM10
PM10 Total
Fugitive PM2.5
Exhaust PM2.5
PM2.5 Total Bio- CO2 NBio- CO2 Total CO2 CH4 N2O CO2e
Year lb/day lb/day
2019 6.6660 75.1190 39.6156 0.1333 8.0742 2.9733 11.0475 4.0156 2.7354 6.7510 0.0000 13,430.8760
13,430.8760
2.4437 0.0000 13,473.1682
2020 58.7799 58.5089 42.4757 0.1444 7.1342 1.9253 9.0595 1.9175 1.8096 3.7271 0.0000 14,444.7806
14,444.7806
1.6912 0.0000 14,487.0613
Maximum 58.7799 75.1190 42.4757 0.1444 8.0742 2.9733 11.0475 4.0156 2.7354 6.7510 0.0000 14,444.7806
14,444.7806
2.4437 0.0000 14,487.0613
Mitigated Construction
ROG NOx CO SO2 Fugitive PM10
Exhaust PM10
PM10 Total
Fugitive PM2.5
Exhaust PM2.5
PM2.5 Total
Bio- CO2 NBio-CO2 Total CO2 CH4 N20 CO2e
Percent Reduction
0.00 0.00 0.00 0.00 44.74 0.00 37.98 51.09 0.00 37.16 0.00 0.00 0.00 0.00 0.00 0.00
CalEEMod Version: CalEEMod.2016.3.2 Date: 2/13/2019 2:27 PMPage 4 of 26
Ramona and Indian Warehouse (Construction - Unmitigated) - Riverside-South Coast County, Winter

2.2 Overall Operational
ROG NOx CO SO2 Fugitive PM10
Exhaust PM10
PM10 Total
Fugitive PM2.5
Exhaust PM2.5
PM2.5 Total Bio- CO2 NBio- CO2 Total CO2 CH4 N2O CO2e
Category lb/day lb/day
Area 9.8928 4.2000e-004
0.0458 0.0000 1.6000e-004
1.6000e-004
1.6000e-004
1.6000e-004
0.0976 0.0976 2.6000e-004
0.1041
Energy 0.0000 0.0000 0.0000 0.0000 0.0000 0.0000 0.0000 0.0000 0.0000 0.0000 0.0000 0.0000 0.0000
Mobile 0.0000 0.0000 0.0000 0.0000 0.0000 0.0000 0.0000 0.0000 0.0000 0.0000 0.0000 0.0000 0.0000 0.0000
Total 9.8928 4.2000e-004
0.0458 0.0000 0.0000 1.6000e-004
1.6000e-004
0.0000 1.6000e-004
1.6000e-004
0.0976 0.0976 2.6000e-004
0.0000 0.1041
Unmitigated Operational
ROG NOx CO SO2 Fugitive PM10
Exhaust PM10
PM10 Total
Fugitive PM2.5
Exhaust PM2.5
PM2.5 Total
Bio- CO2 NBio- CO2 Total CO2 CH4 N2O CO2e
Category lb/day lb/day
Area 9.8928 4.2000e-004
0.0458 0.0000 1.6000e-004
1.6000e-004
1.6000e-004
1.6000e-004
0.0976 0.0976 2.6000e-004
0.1041
Energy 0.0000 0.0000 0.0000 0.0000 0.0000 0.0000 0.0000 0.0000 0.0000 0.0000 0.0000 0.0000 0.0000
Mobile 0.0000 0.0000 0.0000 0.0000 0.0000 0.0000 0.0000 0.0000 0.0000 0.0000 0.0000 0.0000 0.0000 0.0000
Total 9.8928 4.2000e-004
0.0458 0.0000 0.0000 1.6000e-004
1.6000e-004
0.0000 1.6000e-004
1.6000e-004
0.0976 0.0976 2.6000e-004
0.0000 0.1041
Mitigated Operational
CalEEMod Version: CalEEMod.2016.3.2 Date: 2/13/2019 2:27 PMPage 5 of 26
Ramona and Indian Warehouse (Construction - Unmitigated) - Riverside-South Coast County, Winter

3.0 Construction Detail
Construction Phase
Phase Number
Phase Name Phase Type Start Date End Date Num Days Week
Num Days Phase Description
1 Site Preparation Site Preparation 1/1/2019 1/14/2019 5 10
2 Grading Grading 1/15/2019 3/4/2019 5 35
3 Building Construction Building Construction 3/5/2019 8/3/2020 5 370
4 Architectural Coating Architectural Coating 7/7/2020 8/31/2020 5 40
5 Paving Paving 8/4/2020 8/31/2020 5 20
OffRoad Equipment
ROG NOx CO SO2 Fugitive PM10
Exhaust PM10
PM10 Total
Fugitive PM2.5
Exhaust PM2.5
PM2.5 Total
Bio- CO2 NBio-CO2 Total CO2 CH4 N20 CO2e
Percent Reduction
0.00 0.00 0.00 0.00 0.00 0.00 0.00 0.00 0.00 0.00 0.00 0.00 0.00 0.00 0.00 0.00
Residential Indoor: 0; Residential Outdoor: 0; Non-Residential Indoor: 643,095; Non-Residential Outdoor: 214,365; Striped Parking Area: 38,303 (Architectural Coating – sqft)
Acres of Grading (Site Preparation Phase): 20
Acres of Grading (Grading Phase): 122.5
Acres of Paving: 16.99
CalEEMod Version: CalEEMod.2016.3.2 Date: 2/13/2019 2:27 PMPage 6 of 26
Ramona and Indian Warehouse (Construction - Unmitigated) - Riverside-South Coast County, Winter

Phase Name Offroad Equipment Type Amount Usage Hours Horse Power Load Factor
Site Preparation Crawler Tractors 4 8.00 212 0.43
Site Preparation Rubber Tired Dozers 3 8.00 247 0.40
Site Preparation Tractors/Loaders/Backhoes 0 8.00 97 0.37
Grading Crawler Tractors 2 8.00 212 0.43
Grading Excavators 2 8.00 158 0.38
Grading Graders 1 8.00 187 0.41
Grading Rubber Tired Dozers 1 8.00 247 0.40
Grading Scrapers 2 8.00 367 0.48
Grading Tractors/Loaders/Backhoes 0 8.00 97 0.37
Building Construction Cranes 1 8.00 231 0.29
Building Construction Crawler Tractors 3 8.00 212 0.43
Building Construction Forklifts 3 8.00 89 0.20
Building Construction Generator Sets 1 8.00 84 0.74
Building Construction Tractors/Loaders/Backhoes 0 8.00 97 0.37
Building Construction Welders 1 8.00 46 0.45
Architectural Coating Air Compressors 1 8.00 78 0.48
Paving Pavers 2 8.00 130 0.42
Paving Paving Equipment 2 8.00 132 0.36
Paving Rollers 2 8.00 80 0.38
Trips and VMT
CalEEMod Version: CalEEMod.2016.3.2 Date: 2/13/2019 2:27 PMPage 7 of 26
Ramona and Indian Warehouse (Construction - Unmitigated) - Riverside-South Coast County, Winter

3.2 Site Preparation - 2019
ROG NOx CO SO2 Fugitive PM10
Exhaust PM10
PM10 Total
Fugitive PM2.5
Exhaust PM2.5
PM2.5 Total Bio- CO2 NBio- CO2 Total CO2 CH4 N2O CO2e
Category lb/day lb/day
Fugitive Dust 20.1873 0.0000 20.1873 10.1597 0.0000 10.1597 0.0000 0.0000
Off-Road 5.8450 68.1996 23.1708 0.0570 2.9720 2.9720 2.7343 2.7343 5,645.4173
5,645.4173
1.7862 5,690.0710
Total 5.8450 68.1996 23.1708 0.0570 20.1873 2.9720 23.1593 10.1597 2.7343 12.8940 5,645.4173
5,645.4173
1.7862 5,690.0710
Unmitigated Construction On-Site
3.1 Mitigation Measures Construction
Water Exposed Area
Phase Name Offroad Equipment Count
Worker Trip Number
Vendor Trip Number
Hauling Trip Number
Worker Trip Length
Vendor Trip Length
Hauling Trip Length
Worker Vehicle Class
Vendor Vehicle Class
Hauling Vehicle Class
Site Preparation 7 18.00 0.00 0.00 14.70 6.90 20.00 LD_Mix HDT_Mix HHDT
Grading 8 20.00 0.00 1,250.00 14.70 6.90 20.00 LD_Mix HDT_Mix HHDT
Building Construction 9 448.00 175.00 0.00 14.70 6.90 20.00 LD_Mix HDT_Mix HHDT
Architectural Coating 1 90.00 0.00 0.00 14.70 6.90 20.00 LD_Mix HDT_Mix HHDT
Paving 6 15.00 0.00 0.00 14.70 6.90 20.00 LD_Mix HDT_Mix HHDT
CalEEMod Version: CalEEMod.2016.3.2 Date: 2/13/2019 2:27 PMPage 8 of 26
Ramona and Indian Warehouse (Construction - Unmitigated) - Riverside-South Coast County, Winter

3.2 Site Preparation - 2019
ROG NOx CO SO2 Fugitive PM10
Exhaust PM10
PM10 Total
Fugitive PM2.5
Exhaust PM2.5
PM2.5 Total Bio- CO2 NBio- CO2 Total CO2 CH4 N2O CO2e
Category lb/day lb/day
Hauling 0.0000 0.0000 0.0000 0.0000 0.0000 0.0000 0.0000 0.0000 0.0000 0.0000 0.0000 0.0000 0.0000 0.0000
Vendor 0.0000 0.0000 0.0000 0.0000 0.0000 0.0000 0.0000 0.0000 0.0000 0.0000 0.0000 0.0000 0.0000 0.0000
Worker 0.0968 0.0630 0.6481 1.8400e-003
0.2012 1.2400e-003
0.2024 0.0534 1.1400e-003
0.0545 183.6931 183.6931 4.9800e-003
183.8177
Total 0.0968 0.0630 0.6481 1.8400e-003
0.2012 1.2400e-003
0.2024 0.0534 1.1400e-003
0.0545 183.6931 183.6931 4.9800e-003
183.8177
Unmitigated Construction Off-Site
ROG NOx CO SO2 Fugitive PM10
Exhaust PM10
PM10 Total
Fugitive PM2.5
Exhaust PM2.5
PM2.5 Total Bio- CO2 NBio- CO2 Total CO2 CH4 N2O CO2e
Category lb/day lb/day
Fugitive Dust 7.8730 0.0000 7.8730 3.9623 0.0000 3.9623 0.0000 0.0000
Off-Road 5.8450 68.1996 23.1708 0.0570 2.9720 2.9720 2.7343 2.7343 0.0000 5,645.4173
5,645.4173
1.7862 5,690.0710
Total 5.8450 68.1996 23.1708 0.0570 7.8730 2.9720 10.8451 3.9623 2.7343 6.6965 0.0000 5,645.4173
5,645.4173
1.7862 5,690.0710
Mitigated Construction On-Site
CalEEMod Version: CalEEMod.2016.3.2 Date: 2/13/2019 2:27 PMPage 9 of 26
Ramona and Indian Warehouse (Construction - Unmitigated) - Riverside-South Coast County, Winter

3.2 Site Preparation - 2019
ROG NOx CO SO2 Fugitive PM10
Exhaust PM10
PM10 Total
Fugitive PM2.5
Exhaust PM2.5
PM2.5 Total Bio- CO2 NBio- CO2 Total CO2 CH4 N2O CO2e
Category lb/day lb/day
Hauling 0.0000 0.0000 0.0000 0.0000 0.0000 0.0000 0.0000 0.0000 0.0000 0.0000 0.0000 0.0000 0.0000 0.0000
Vendor 0.0000 0.0000 0.0000 0.0000 0.0000 0.0000 0.0000 0.0000 0.0000 0.0000 0.0000 0.0000 0.0000 0.0000
Worker 0.0968 0.0630 0.6481 1.8400e-003
0.2012 1.2400e-003
0.2024 0.0534 1.1400e-003
0.0545 183.6931 183.6931 4.9800e-003
183.8177
Total 0.0968 0.0630 0.6481 1.8400e-003
0.2012 1.2400e-003
0.2024 0.0534 1.1400e-003
0.0545 183.6931 183.6931 4.9800e-003
183.8177
Mitigated Construction Off-Site
3.3 Grading - 2019
ROG NOx CO SO2 Fugitive PM10
Exhaust PM10
PM10 Total
Fugitive PM2.5
Exhaust PM2.5
PM2.5 Total Bio- CO2 NBio- CO2 Total CO2 CH4 N2O CO2e
Category lb/day lb/day
Fugitive Dust 9.7700 0.0000 9.7700 3.7165 0.0000 3.7165 0.0000 0.0000
Off-Road 5.4939 65.8336 33.9306 0.0715 2.6735 2.6735 2.4596 2.4596 7,079.5017
7,079.5017
2.2399 7,135.4987
Total 5.4939 65.8336 33.9306 0.0715 9.7700 2.6735 12.4435 3.7165 2.4596 6.1761 7,079.5017
7,079.5017
2.2399 7,135.4987
Unmitigated Construction On-Site
CalEEMod Version: CalEEMod.2016.3.2 Date: 2/13/2019 2:27 PMPage 10 of 26
Ramona and Indian Warehouse (Construction - Unmitigated) - Riverside-South Coast County, Winter

3.3 Grading - 2019
ROG NOx CO SO2 Fugitive PM10
Exhaust PM10
PM10 Total
Fugitive PM2.5
Exhaust PM2.5
PM2.5 Total
Bio- CO2 NBio- CO2 Total CO2 CH4 N2O CO2e
Category lb/day lb/day
Hauling 0.2110 9.2155 1.2898 0.0268 0.6248 0.0336 0.6584 0.1713 0.0321 0.2034 2,841.9864
2,841.9864
0.1983 2,846.9427
Vendor 0.0000 0.0000 0.0000 0.0000 0.0000 0.0000 0.0000 0.0000 0.0000 0.0000 0.0000 0.0000 0.0000 0.0000
Worker 0.1076 0.0700 0.7201 2.0500e-003
0.2236 1.3800e-003
0.2249 0.0593 1.2700e-003
0.0606 204.1034 204.1034 5.5400e-003
204.2419
Total 0.3186 9.2854 2.0099 0.0289 0.8484 0.0349 0.8833 0.2306 0.0334 0.2640 3,046.0899
3,046.0899
0.2038 3,051.1846
Unmitigated Construction Off-Site
ROG NOx CO SO2 Fugitive PM10
Exhaust PM10
PM10 Total
Fugitive PM2.5
Exhaust PM2.5
PM2.5 Total
Bio- CO2 NBio- CO2 Total CO2 CH4 N2O CO2e
Category lb/day lb/day
Fugitive Dust 3.8103 0.0000 3.8103 1.4494 0.0000 1.4494 0.0000 0.0000
Off-Road 5.4939 65.8336 33.9306 0.0715 2.6735 2.6735 2.4596 2.4596 0.0000 7,079.5017
7,079.5017
2.2399 7,135.4987
Total 5.4939 65.8336 33.9306 0.0715 3.8103 2.6735 6.4838 1.4494 2.4596 3.9090 0.0000 7,079.5017
7,079.5017
2.2399 7,135.4987
Mitigated Construction On-Site
CalEEMod Version: CalEEMod.2016.3.2 Date: 2/13/2019 2:27 PMPage 11 of 26
Ramona and Indian Warehouse (Construction - Unmitigated) - Riverside-South Coast County, Winter

3.3 Grading - 2019
ROG NOx CO SO2 Fugitive PM10
Exhaust PM10
PM10 Total
Fugitive PM2.5
Exhaust PM2.5
PM2.5 Total
Bio- CO2 NBio- CO2 Total CO2 CH4 N2O CO2e
Category lb/day lb/day
Hauling 0.2110 9.2155 1.2898 0.0268 0.6248 0.0336 0.6584 0.1713 0.0321 0.2034 2,841.9864
2,841.9864
0.1983 2,846.9427
Vendor 0.0000 0.0000 0.0000 0.0000 0.0000 0.0000 0.0000 0.0000 0.0000 0.0000 0.0000 0.0000 0.0000 0.0000
Worker 0.1076 0.0700 0.7201 2.0500e-003
0.2236 1.3800e-003
0.2249 0.0593 1.2700e-003
0.0606 204.1034 204.1034 5.5400e-003
204.2419
Total 0.3186 9.2854 2.0099 0.0289 0.8484 0.0349 0.8833 0.2306 0.0334 0.2640 3,046.0899
3,046.0899
0.2038 3,051.1846
Mitigated Construction Off-Site
3.4 Building Construction - 2019
ROG NOx CO SO2 Fugitive PM10
Exhaust PM10
PM10 Total
Fugitive PM2.5
Exhaust PM2.5
PM2.5 Total
Bio- CO2 NBio- CO2 Total CO2 CH4 N2O CO2e
Category lb/day lb/day
Off-Road 3.6440 39.6763 19.1447 0.0430 1.8165 1.8165 1.6972 1.6972 4,187.5330
4,187.5330
1.1363 4,215.9399
Total 3.6440 39.6763 19.1447 0.0430 1.8165 1.8165 1.6972 1.6972 4,187.5330
4,187.5330
1.1363 4,215.9399
Unmitigated Construction On-Site
CalEEMod Version: CalEEMod.2016.3.2 Date: 2/13/2019 2:27 PMPage 12 of 26
Ramona and Indian Warehouse (Construction - Unmitigated) - Riverside-South Coast County, Winter

3.4 Building Construction - 2019
ROG NOx CO SO2 Fugitive PM10
Exhaust PM10
PM10 Total
Fugitive PM2.5
Exhaust PM2.5
PM2.5 Total Bio- CO2 NBio- CO2 Total CO2 CH4 N2O CO2e
Category lb/day lb/day
Hauling 0.0000 0.0000 0.0000 0.0000 0.0000 0.0000 0.0000 0.0000 0.0000 0.0000 0.0000 0.0000 0.0000 0.0000
Vendor 0.6119 19.8755 4.3404 0.0443 1.1207 0.1532 1.2739 0.3227 0.1466 0.4692 4,671.4262
4,671.4262
0.4314 4,682.2101
Worker 2.4102 1.5671 16.1305 0.0459 5.0076 0.0309 5.0385 1.3280 0.0285 1.3565 4,571.9168
4,571.9168
0.1241 4,575.0182
Total 3.0220 21.4425 20.4709 0.0902 6.1283 0.1841 6.3124 1.6507 0.1750 1.8257 9,243.3430
9,243.3430
0.5554 9,257.2283
Unmitigated Construction Off-Site
ROG NOx CO SO2 Fugitive PM10
Exhaust PM10
PM10 Total
Fugitive PM2.5
Exhaust PM2.5
PM2.5 Total Bio- CO2 NBio- CO2 Total CO2 CH4 N2O CO2e
Category lb/day lb/day
Off-Road 3.6440 39.6763 19.1447 0.0430 1.8165 1.8165 1.6972 1.6972 0.0000 4,187.5330
4,187.5330
1.1363 4,215.9399
Total 3.6440 39.6763 19.1447 0.0430 1.8165 1.8165 1.6972 1.6972 0.0000 4,187.5330
4,187.5330
1.1363 4,215.9399
Mitigated Construction On-Site
CalEEMod Version: CalEEMod.2016.3.2 Date: 2/13/2019 2:27 PMPage 13 of 26
Ramona and Indian Warehouse (Construction - Unmitigated) - Riverside-South Coast County, Winter

3.4 Building Construction - 2019
ROG NOx CO SO2 Fugitive PM10
Exhaust PM10
PM10 Total
Fugitive PM2.5
Exhaust PM2.5
PM2.5 Total Bio- CO2 NBio- CO2 Total CO2 CH4 N2O CO2e
Category lb/day lb/day
Hauling 0.0000 0.0000 0.0000 0.0000 0.0000 0.0000 0.0000 0.0000 0.0000 0.0000 0.0000 0.0000 0.0000 0.0000
Vendor 0.6119 19.8755 4.3404 0.0443 1.1207 0.1532 1.2739 0.3227 0.1466 0.4692 4,671.4262
4,671.4262
0.4314 4,682.2101
Worker 2.4102 1.5671 16.1305 0.0459 5.0076 0.0309 5.0385 1.3280 0.0285 1.3565 4,571.9168
4,571.9168
0.1241 4,575.0182
Total 3.0220 21.4425 20.4709 0.0902 6.1283 0.1841 6.3124 1.6507 0.1750 1.8257 9,243.3430
9,243.3430
0.5554 9,257.2283
Mitigated Construction Off-Site
3.4 Building Construction - 2020
ROG NOx CO SO2 Fugitive PM10
Exhaust PM10
PM10 Total
Fugitive PM2.5
Exhaust PM2.5
PM2.5 Total Bio- CO2 NBio- CO2 Total CO2 CH4 N2O CO2e
Category lb/day lb/day
Off-Road 3.3632 36.6770 18.6286 0.0430 1.6373 1.6373 1.5290 1.5290 4,114.5597 4,114.5597 1.1279 4,142.7566
Total 3.3632 36.6770 18.6286 0.0430 1.6373 1.6373 1.5290 1.5290 4,114.5597
4,114.5597
1.1279 4,142.7566
Unmitigated Construction On-Site
CalEEMod Version: CalEEMod.2016.3.2 Date: 2/13/2019 2:27 PMPage 14 of 26
Ramona and Indian Warehouse (Construction - Unmitigated) - Riverside-South Coast County, Winter

3.4 Building Construction - 2020
ROG NOx CO SO2 Fugitive PM10
Exhaust PM10
PM10 Total
Fugitive PM2.5
Exhaust PM2.5
PM2.5 Total Bio- CO2 NBio- CO2 Total CO2 CH4 N2O CO2e
Category lb/day lb/day
Hauling 0.0000 0.0000 0.0000 0.0000 0.0000 0.0000 0.0000 0.0000 0.0000 0.0000 0.0000 0.0000 0.0000 0.0000
Vendor 0.5145 17.9118 3.8570 0.0440 1.1206 0.1036 1.2243 0.3227 0.0991 0.4218 4,638.2483
4,638.2483
0.4022 4,648.3044
Worker 2.2326 1.3948 14.6126 0.0444 5.0076 0.0303 5.0379 1.3280 0.0279 1.3560 4,427.2964
4,427.2964
0.1100 4,430.0455
Total 2.7471 19.3066 18.4696 0.0884 6.1282 0.1339 6.2622 1.6507 0.1271 1.7777 9,065.5447
9,065.5447
0.5122 9,078.3498
Unmitigated Construction Off-Site
ROG NOx CO SO2 Fugitive PM10
Exhaust PM10
PM10 Total
Fugitive PM2.5
Exhaust PM2.5
PM2.5 Total Bio- CO2 NBio- CO2 Total CO2 CH4 N2O CO2e
Category lb/day lb/day
Off-Road 3.3632 36.6770 18.6286 0.0430 1.6373 1.6373 1.5290 1.5290 0.0000 4,114.5597 4,114.5597
1.1279 4,142.7566
Total 3.3632 36.6770 18.6286 0.0430 1.6373 1.6373 1.5290 1.5290 0.0000 4,114.5597
4,114.5597
1.1279 4,142.7566
Mitigated Construction On-Site
CalEEMod Version: CalEEMod.2016.3.2 Date: 2/13/2019 2:27 PMPage 15 of 26
Ramona and Indian Warehouse (Construction - Unmitigated) - Riverside-South Coast County, Winter

3.4 Building Construction - 2020
ROG NOx CO SO2 Fugitive PM10
Exhaust PM10
PM10 Total
Fugitive PM2.5
Exhaust PM2.5
PM2.5 Total Bio- CO2 NBio- CO2 Total CO2 CH4 N2O CO2e
Category lb/day lb/day
Hauling 0.0000 0.0000 0.0000 0.0000 0.0000 0.0000 0.0000 0.0000 0.0000 0.0000 0.0000 0.0000 0.0000 0.0000
Vendor 0.5145 17.9118 3.8570 0.0440 1.1206 0.1036 1.2243 0.3227 0.0991 0.4218 4,638.2483
4,638.2483
0.4022 4,648.3044
Worker 2.2326 1.3948 14.6126 0.0444 5.0076 0.0303 5.0379 1.3280 0.0279 1.3560 4,427.2964
4,427.2964
0.1100 4,430.0455
Total 2.7471 19.3066 18.4696 0.0884 6.1282 0.1339 6.2622 1.6507 0.1271 1.7777 9,065.5447
9,065.5447
0.5122 9,078.3498
Mitigated Construction Off-Site
3.5 Architectural Coating - 2020
ROG NOx CO SO2 Fugitive PM10
Exhaust PM10
PM10 Total
Fugitive PM2.5
Exhaust PM2.5
PM2.5 Total Bio- CO2 NBio- CO2 Total CO2 CH4 N2O CO2e
Category lb/day lb/day
Archit. Coating 51.8983 0.0000 0.0000 0.0000 0.0000 0.0000 0.0000
Off-Road 0.3229 2.2451 2.4419 3.9600e-003
0.1479 0.1479 0.1479 0.1479 375.2641 375.2641 0.0291 375.9904
Total 52.2212 2.2451 2.4419 3.9600e-003
0.1479 0.1479 0.1479 0.1479 375.2641 375.2641 0.0291 375.9904
Unmitigated Construction On-Site
CalEEMod Version: CalEEMod.2016.3.2 Date: 2/13/2019 2:27 PMPage 16 of 26
Ramona and Indian Warehouse (Construction - Unmitigated) - Riverside-South Coast County, Winter

3.5 Architectural Coating - 2020
ROG NOx CO SO2 Fugitive PM10
Exhaust PM10
PM10 Total
Fugitive PM2.5
Exhaust PM2.5
PM2.5 Total Bio- CO2 NBio- CO2 Total CO2 CH4 N2O CO2e
Category lb/day lb/day
Hauling 0.0000 0.0000 0.0000 0.0000 0.0000 0.0000 0.0000 0.0000 0.0000 0.0000 0.0000 0.0000 0.0000 0.0000
Vendor 0.0000 0.0000 0.0000 0.0000 0.0000 0.0000 0.0000 0.0000 0.0000 0.0000 0.0000 0.0000 0.0000 0.0000
Worker 0.4485 0.2802 2.9356 8.9300e-003
1.0060 6.0900e-003
1.0121 0.2668 5.6100e-003
0.2724 889.4122 889.4122 0.0221 889.9645
Total 0.4485 0.2802 2.9356 8.9300e-003
1.0060 6.0900e-003
1.0121 0.2668 5.6100e-003
0.2724 889.4122 889.4122 0.0221 889.9645
Unmitigated Construction Off-Site
ROG NOx CO SO2 Fugitive PM10
Exhaust PM10
PM10 Total
Fugitive PM2.5
Exhaust PM2.5
PM2.5 Total Bio- CO2 NBio- CO2 Total CO2 CH4 N2O CO2e
Category lb/day lb/day
Archit. Coating 51.8983 0.0000 0.0000 0.0000 0.0000 0.0000 0.0000
Off-Road 0.3229 2.2451 2.4419 3.9600e-003
0.1479 0.1479 0.1479 0.1479 0.0000 375.2641 375.2641 0.0291 375.9904
Total 52.2212 2.2451 2.4419 3.9600e-003
0.1479 0.1479 0.1479 0.1479 0.0000 375.2641 375.2641 0.0291 375.9904
Mitigated Construction On-Site
CalEEMod Version: CalEEMod.2016.3.2 Date: 2/13/2019 2:27 PMPage 17 of 26
Ramona and Indian Warehouse (Construction - Unmitigated) - Riverside-South Coast County, Winter

3.5 Architectural Coating - 2020
ROG NOx CO SO2 Fugitive PM10
Exhaust PM10
PM10 Total
Fugitive PM2.5
Exhaust PM2.5
PM2.5 Total Bio- CO2 NBio- CO2 Total CO2 CH4 N2O CO2e
Category lb/day lb/day
Hauling 0.0000 0.0000 0.0000 0.0000 0.0000 0.0000 0.0000 0.0000 0.0000 0.0000 0.0000 0.0000 0.0000 0.0000
Vendor 0.0000 0.0000 0.0000 0.0000 0.0000 0.0000 0.0000 0.0000 0.0000 0.0000 0.0000 0.0000 0.0000 0.0000
Worker 0.4485 0.2802 2.9356 8.9300e-003
1.0060 6.0900e-003
1.0121 0.2668 5.6100e-003
0.2724 889.4122 889.4122 0.0221 889.9645
Total 0.4485 0.2802 2.9356 8.9300e-003
1.0060 6.0900e-003
1.0121 0.2668 5.6100e-003
0.2724 889.4122 889.4122 0.0221 889.9645
Mitigated Construction Off-Site
3.6 Paving - 2020
ROG NOx CO SO2 Fugitive PM10
Exhaust PM10
PM10 Total
Fugitive PM2.5
Exhaust PM2.5
PM2.5 Total
Bio- CO2 NBio- CO2 Total CO2 CH4 N2O CO2e
Category lb/day lb/day
Off-Road 1.3566 14.0656 14.6521 0.0228 0.7528 0.7528 0.6926 0.6926 2,207.7334
2,207.7334
0.7140 2,225.5841
Paving 1.5052 0.0000 0.0000 0.0000 0.0000 0.0000 0.0000
Total 2.8617 14.0656 14.6521 0.0228 0.7528 0.7528 0.6926 0.6926 2,207.7334
2,207.7334
0.7140 2,225.5841
Unmitigated Construction On-Site
CalEEMod Version: CalEEMod.2016.3.2 Date: 2/13/2019 2:27 PMPage 18 of 26
Ramona and Indian Warehouse (Construction - Unmitigated) - Riverside-South Coast County, Winter

3.6 Paving - 2020
ROG NOx CO SO2 Fugitive PM10
Exhaust PM10
PM10 Total
Fugitive PM2.5
Exhaust PM2.5
PM2.5 Total Bio- CO2 NBio- CO2 Total CO2 CH4 N2O CO2e
Category lb/day lb/day
Hauling 0.0000 0.0000 0.0000 0.0000 0.0000 0.0000 0.0000 0.0000 0.0000 0.0000 0.0000 0.0000 0.0000 0.0000
Vendor 0.0000 0.0000 0.0000 0.0000 0.0000 0.0000 0.0000 0.0000 0.0000 0.0000 0.0000 0.0000 0.0000 0.0000
Worker 0.0748 0.0467 0.4893 1.4900e-003
0.1677 1.0200e-003
0.1687 0.0445 9.3000e-004
0.0454 148.2354 148.2354 3.6800e-003
148.3274
Total 0.0748 0.0467 0.4893 1.4900e-003
0.1677 1.0200e-003
0.1687 0.0445 9.3000e-004
0.0454 148.2354 148.2354 3.6800e-003
148.3274
Unmitigated Construction Off-Site
ROG NOx CO SO2 Fugitive PM10
Exhaust PM10
PM10 Total
Fugitive PM2.5
Exhaust PM2.5
PM2.5 Total Bio- CO2 NBio- CO2 Total CO2 CH4 N2O CO2e
Category lb/day lb/day
Off-Road 1.3566 14.0656 14.6521 0.0228 0.7528 0.7528 0.6926 0.6926 0.0000 2,207.7334
2,207.7334
0.7140 2,225.5841
Paving 1.5052 0.0000 0.0000 0.0000 0.0000 0.0000 0.0000
Total 2.8617 14.0656 14.6521 0.0228 0.7528 0.7528 0.6926 0.6926 0.0000 2,207.7334
2,207.7334
0.7140 2,225.5841
Mitigated Construction On-Site
CalEEMod Version: CalEEMod.2016.3.2 Date: 2/13/2019 2:27 PMPage 19 of 26
Ramona and Indian Warehouse (Construction - Unmitigated) - Riverside-South Coast County, Winter

4.0 Operational Detail - Mobile
4.1 Mitigation Measures Mobile
3.6 Paving - 2020
ROG NOx CO SO2 Fugitive PM10
Exhaust PM10
PM10 Total
Fugitive PM2.5
Exhaust PM2.5
PM2.5 Total Bio- CO2 NBio- CO2 Total CO2 CH4 N2O CO2e
Category lb/day lb/day
Hauling 0.0000 0.0000 0.0000 0.0000 0.0000 0.0000 0.0000 0.0000 0.0000 0.0000 0.0000 0.0000 0.0000 0.0000
Vendor 0.0000 0.0000 0.0000 0.0000 0.0000 0.0000 0.0000 0.0000 0.0000 0.0000 0.0000 0.0000 0.0000 0.0000
Worker 0.0748 0.0467 0.4893 1.4900e-003
0.1677 1.0200e-003
0.1687 0.0445 9.3000e-004
0.0454 148.2354 148.2354 3.6800e-003
148.3274
Total 0.0748 0.0467 0.4893 1.4900e-003
0.1677 1.0200e-003
0.1687 0.0445 9.3000e-004
0.0454 148.2354 148.2354 3.6800e-003
148.3274
Mitigated Construction Off-Site
CalEEMod Version: CalEEMod.2016.3.2 Date: 2/13/2019 2:27 PMPage 20 of 26
Ramona and Indian Warehouse (Construction - Unmitigated) - Riverside-South Coast County, Winter

ROG NOx CO SO2 Fugitive PM10
Exhaust PM10
PM10 Total
Fugitive PM2.5
Exhaust PM2.5
PM2.5 Total Bio- CO2 NBio- CO2 Total CO2 CH4 N2O CO2e
Category lb/day lb/day
Mitigated 0.0000 0.0000 0.0000 0.0000 0.0000 0.0000 0.0000 0.0000 0.0000 0.0000 0.0000 0.0000 0.0000 0.0000
Unmitigated 0.0000 0.0000 0.0000 0.0000 0.0000 0.0000 0.0000 0.0000 0.0000 0.0000 0.0000 0.0000 0.0000 0.0000
4.2 Trip Summary Information
4.3 Trip Type Information
Average Daily Trip Rate Unmitigated Mitigated
Land Use Weekday Saturday Sunday Annual VMT Annual VMT
Other Non-Asphalt Surfaces 0.00 0.00 0.00
Parking Lot 0.00 0.00 0.00
Unrefrigerated Warehouse-No Rail 0.00 0.00 0.00
Total 0.00 0.00 0.00
Miles Trip % Trip Purpose %
Land Use H-W or C-W H-S or C-C H-O or C-NW H-W or C-W H-S or C-C H-O or C-NW Primary Diverted Pass-by
Other Non-Asphalt Surfaces 16.60 8.40 6.90 0.00 0.00 0.00 0 0 0
Parking Lot 16.60 8.40 6.90 0.00 0.00 0.00 0 0 0
Unrefrigerated Warehouse-No Rail
0.00 0.00 0.00 0.00 0.00 0.00 0 0 0
4.4 Fleet Mix
CalEEMod Version: CalEEMod.2016.3.2 Date: 2/13/2019 2:27 PMPage 21 of 26
Ramona and Indian Warehouse (Construction - Unmitigated) - Riverside-South Coast County, Winter

5.0 Energy Detail
ROG NOx CO SO2 Fugitive PM10
Exhaust PM10
PM10 Total
Fugitive PM2.5
Exhaust PM2.5
PM2.5 Total Bio- CO2 NBio- CO2 Total CO2 CH4 N2O CO2e
Category lb/day lb/day
NaturalGas Mitigated
0.0000 0.0000 0.0000 0.0000 0.0000 0.0000 0.0000 0.0000 0.0000 0.0000 0.0000 0.0000 0.0000
NaturalGas Unmitigated
0.0000 0.0000 0.0000 0.0000 0.0000 0.0000 0.0000 0.0000 0.0000 0.0000 0.0000 0.0000 0.0000
5.1 Mitigation Measures Energy
Land Use LDA LDT1 LDT2 MDV LHD1 LHD2 MHD HHD OBUS UBUS MCY SBUS MH
Other Non-Asphalt Surfaces 0.538064 0.038449 0.184390 0.122109 0.017402 0.005339 0.017250 0.067711 0.001365 0.001213 0.004629 0.000959 0.001120
Parking Lot 0.538064 0.038449 0.184390 0.122109 0.017402 0.005339 0.017250 0.067711 0.001365 0.001213 0.004629 0.000959 0.001120
Unrefrigerated Warehouse-No Rail
0.538064 0.038449 0.184390 0.122109 0.017402 0.005339 0.017250 0.067711 0.001365 0.001213 0.004629 0.000959 0.001120
Historical Energy Use: N
CalEEMod Version: CalEEMod.2016.3.2 Date: 2/13/2019 2:27 PMPage 22 of 26
Ramona and Indian Warehouse (Construction - Unmitigated) - Riverside-South Coast County, Winter

5.2 Energy by Land Use - NaturalGas
NaturalGas Use
ROG NOx CO SO2 Fugitive PM10
Exhaust PM10
PM10 Total
Fugitive PM2.5
Exhaust PM2.5
PM2.5 Total
Bio- CO2 NBio- CO2 Total CO2 CH4 N2O CO2e
Land Use kBTU/yr lb/day lb/day
Other Non-Asphalt Surfaces
0 0.0000 0.0000 0.0000 0.0000 0.0000 0.0000 0.0000 0.0000 0.0000 0.0000 0.0000 0.0000 0.0000
Parking Lot 0 0.0000 0.0000 0.0000 0.0000 0.0000 0.0000 0.0000 0.0000 0.0000 0.0000 0.0000 0.0000 0.0000
Unrefrigerated Warehouse-No
Rail
0 0.0000 0.0000 0.0000 0.0000 0.0000 0.0000 0.0000 0.0000 0.0000 0.0000 0.0000 0.0000 0.0000
Total 0.0000 0.0000 0.0000 0.0000 0.0000 0.0000 0.0000 0.0000 0.0000 0.0000 0.0000 0.0000 0.0000
Unmitigated
NaturalGas Use
ROG NOx CO SO2 Fugitive PM10
Exhaust PM10
PM10 Total
Fugitive PM2.5
Exhaust PM2.5
PM2.5 Total Bio- CO2 NBio- CO2 Total CO2 CH4 N2O CO2e
Land Use kBTU/yr lb/day lb/day
Other Non-Asphalt Surfaces
0 0.0000 0.0000 0.0000 0.0000 0.0000 0.0000 0.0000 0.0000 0.0000 0.0000 0.0000 0.0000 0.0000
Parking Lot 0 0.0000 0.0000 0.0000 0.0000 0.0000 0.0000 0.0000 0.0000 0.0000 0.0000 0.0000 0.0000 0.0000
Unrefrigerated Warehouse-No
Rail
0 0.0000 0.0000 0.0000 0.0000 0.0000 0.0000 0.0000 0.0000 0.0000 0.0000 0.0000 0.0000 0.0000
Total 0.0000 0.0000 0.0000 0.0000 0.0000 0.0000 0.0000 0.0000 0.0000 0.0000 0.0000 0.0000 0.0000
Mitigated
CalEEMod Version: CalEEMod.2016.3.2 Date: 2/13/2019 2:27 PMPage 23 of 26
Ramona and Indian Warehouse (Construction - Unmitigated) - Riverside-South Coast County, Winter

6.1 Mitigation Measures Area
6.0 Area Detail
ROG NOx CO SO2 Fugitive PM10
Exhaust PM10
PM10 Total
Fugitive PM2.5
Exhaust PM2.5
PM2.5 Total Bio- CO2 NBio- CO2 Total CO2 CH4 N2O CO2e
Category lb/day lb/day
Mitigated 9.8928 4.2000e-004
0.0458 0.0000 1.6000e-004
1.6000e-004
1.6000e-004
1.6000e-004
0.0976 0.0976 2.6000e-004
0.1041
Unmitigated 9.8928 4.2000e-004
0.0458 0.0000 1.6000e-004
1.6000e-004
1.6000e-004
1.6000e-004
0.0976 0.0976 2.6000e-004
0.1041
CalEEMod Version: CalEEMod.2016.3.2 Date: 2/13/2019 2:27 PMPage 24 of 26
Ramona and Indian Warehouse (Construction - Unmitigated) - Riverside-South Coast County, Winter

7.0 Water Detail
6.2 Area by SubCategory
ROG NOx CO SO2 Fugitive PM10
Exhaust PM10
PM10 Total
Fugitive PM2.5
Exhaust PM2.5
PM2.5 Total Bio- CO2 NBio- CO2 Total CO2 CH4 N2O CO2e
SubCategory lb/day lb/day
Architectural Coating
1.1375 0.0000 0.0000 0.0000 0.0000 0.0000 0.0000
Consumer Products
8.7510 0.0000 0.0000 0.0000 0.0000 0.0000 0.0000
Landscaping 4.3100e-003
4.2000e-004
0.0458 0.0000 1.6000e-004
1.6000e-004
1.6000e-004
1.6000e-004
0.0976 0.0976 2.6000e-004
0.1041
Total 9.8928 4.2000e-004
0.0458 0.0000 1.6000e-004
1.6000e-004
1.6000e-004
1.6000e-004
0.0976 0.0976 2.6000e-004
0.1041
Unmitigated
ROG NOx CO SO2 Fugitive PM10
Exhaust PM10
PM10 Total
Fugitive PM2.5
Exhaust PM2.5
PM2.5 Total Bio- CO2 NBio- CO2 Total CO2 CH4 N2O CO2e
SubCategory lb/day lb/day
Architectural Coating
1.1375 0.0000 0.0000 0.0000 0.0000 0.0000 0.0000
Consumer Products
8.7510 0.0000 0.0000 0.0000 0.0000 0.0000 0.0000
Landscaping 4.3100e-003
4.2000e-004
0.0458 0.0000 1.6000e-004
1.6000e-004
1.6000e-004
1.6000e-004
0.0976 0.0976 2.6000e-004
0.1041
Total 9.8928 4.2000e-004
0.0458 0.0000 1.6000e-004
1.6000e-004
1.6000e-004
1.6000e-004
0.0976 0.0976 2.6000e-004
0.1041
Mitigated
CalEEMod Version: CalEEMod.2016.3.2 Date: 2/13/2019 2:27 PMPage 25 of 26
Ramona and Indian Warehouse (Construction - Unmitigated) - Riverside-South Coast County, Winter

8.1 Mitigation Measures Waste
7.1 Mitigation Measures Water
7.0 Water Detail
8.0 Waste Detail
11.0 Vegetation
9.0 Operational Offroad
Equipment Type Number Hours/Day Days/Year Horse Power Load Factor Fuel Type
10.0 Stationary Equipment
Fire Pumps and Emergency Generators
Equipment Type Number Hours/Day Hours/Year Horse Power Load Factor Fuel Type
Boilers
Equipment Type Number Heat Input/Day Heat Input/Year Boiler Rating Fuel Type
User Defined Equipment
Equipment Type Number
CalEEMod Version: CalEEMod.2016.3.2 Date: 2/13/2019 2:27 PMPage 26 of 26
Ramona and Indian Warehouse (Construction - Unmitigated) - Riverside-South Coast County, Winter

Indian and Ramona Warehouse Air Quality Impact Analysis
11705-05 AQ Report
This page intentionally left blank
Indian and Ramona Warehouse Air Quality Impact Analysis
11705-05 AQ Report
APPENDIX 3.2:
CALEEMOD OPERATIONAL EMISSIONS MODEL OUTPUTS

1.1 Land Usage
Land Uses Size Metric Lot Acreage Floor Surface Area Population
Unrefrigerated Warehouse-No Rail 428.73 1000sqft 9.85 428,730.00 0
Other Non-Asphalt Surfaces 5.50 Acre 5.50 239,580.00 0
Parking Lot 11.49 Acre 11.49 500,504.40 0
1.2 Other Project Characteristics
Urbanization
Climate Zone
Urban
10
Wind Speed (m/s) Precipitation Freq (Days)2.4 28
1.3 User Entered Comments & Non-Default Data
1.0 Project Characteristics
Utility Company Southern California Edison
2020Operational Year
CO2 Intensity (lb/MWhr)
702.44 0.029CH4 Intensity (lb/MWhr)
0.006N2O Intensity (lb/MWhr)
Ramona and Indian Warehouse (Operations)Riverside-South Coast County, Summer
CalEEMod Version: CalEEMod.2016.3.2 Date: 2/13/2019 2:32 PMPage 1 of 15
Ramona and Indian Warehouse (Operations) - Riverside-South Coast County, Summer

Project Characteristics -
Land Use - Total Site Area is 26.84 acres (24.2 on-site and 2.64 off-site). Per the Site Plan, 9.85 acres is Building, 11.49 acres is Parking.
Construction Phase - Operations Run Only.
Off-road Equipment - Operations Run Only.
Trips and VMT - Operations Run Only.
Architectural Coating -
Vehicle Trips - Operations Run Only. Trip Length represents the weighted Trip Length of Passenger Cars and Trucks.
Area Coating -
Energy Use -
Water And Wastewater - Water Demand based on the Generation Rate of 0.75 (Demand/AFY) as per the PVCC SP EIR.
Solid Waste -
Fleet Mix - Fleet Mix based on information provided in the TIA.
CalEEMod Version: CalEEMod.2016.3.2 Date: 2/13/2019 2:32 PMPage 2 of 15
Ramona and Indian Warehouse (Operations) - Riverside-South Coast County, Summer

Table Name Column Name Default Value New Value
tblFleetMix HHD 0.07 0.20
tblFleetMix LDA 0.54 0.68
tblFleetMix LDT1 0.04 0.00
tblFleetMix LDT2 0.18 0.00
tblFleetMix LHD1 0.02 0.05
tblFleetMix LHD2 5.3390e-003 0.00
tblFleetMix MCY 4.6290e-003 0.00
tblFleetMix MDV 0.12 0.00
tblFleetMix MH 1.1200e-003 0.00
tblFleetMix MHD 0.02 0.07
tblFleetMix OBUS 1.3650e-003 0.00
tblFleetMix SBUS 9.5900e-004 0.00
tblFleetMix UBUS 1.2130e-003 0.00
tblLandUse LotAcreage 9.84 9.85
tblOffRoadEquipment OffRoadEquipmentUnitAmount 3.00 0.00
tblOffRoadEquipment OffRoadEquipmentUnitAmount 4.00 0.00
tblVehicleTrips CNW_TTP 41.00 0.00
tblVehicleTrips CW_TL 16.60 30.57
tblVehicleTrips CW_TTP 59.00 100.00
tblVehicleTrips DV_TP 5.00 0.00
tblVehicleTrips PB_TP 3.00 0.00
tblVehicleTrips PR_TP 92.00 100.00
tblVehicleTrips ST_TR 1.68 0.94
tblVehicleTrips SU_TR 1.68 0.87
tblVehicleTrips WD_TR 1.68 1.40
tblWater IndoorWaterUseRate 99,143,812.50 5,914,207.45
CalEEMod Version: CalEEMod.2016.3.2 Date: 2/13/2019 2:32 PMPage 3 of 15
Ramona and Indian Warehouse (Operations) - Riverside-South Coast County, Summer

2.0 Emissions Summary
2.1 Overall Construction (Maximum Daily Emission)
ROG NOx CO SO2 Fugitive PM10
Exhaust PM10
PM10 Total
Fugitive PM2.5
Exhaust PM2.5
PM2.5 Total
Bio- CO2 NBio- CO2 Total CO2 CH4 N2O CO2e
Year lb/day lb/day
2019 0.0000 0.0000 0.0000 0.0000 0.0000 0.0000 0.0000 0.0000 0.0000 0.0000 0.0000 0.0000 0.0000 0.0000 0.0000 0.0000
Maximum 0.0000 0.0000 0.0000 0.0000 0.0000 0.0000 0.0000 0.0000 0.0000 0.0000 0.0000 0.0000 0.0000 0.0000 0.0000 0.0000
Unmitigated Construction
ROG NOx CO SO2 Fugitive PM10
Exhaust PM10
PM10 Total
Fugitive PM2.5
Exhaust PM2.5
PM2.5 Total Bio- CO2 NBio- CO2 Total CO2 CH4 N2O CO2e
Year lb/day lb/day
2019 0.0000 0.0000 0.0000 0.0000 0.0000 0.0000 0.0000 0.0000 0.0000 0.0000 0.0000 0.0000 0.0000 0.0000 0.0000 0.0000
Maximum 0.0000 0.0000 0.0000 0.0000 0.0000 0.0000 0.0000 0.0000 0.0000 0.0000 0.0000 0.0000 0.0000 0.0000 0.0000 0.0000
Mitigated Construction
CalEEMod Version: CalEEMod.2016.3.2 Date: 2/13/2019 2:32 PMPage 4 of 15
Ramona and Indian Warehouse (Operations) - Riverside-South Coast County, Summer

ROG NOx CO SO2 Fugitive PM10
Exhaust PM10
PM10 Total
Fugitive PM2.5
Exhaust PM2.5
PM2.5 Total
Bio- CO2 NBio-CO2 Total CO2 CH4 N20 CO2e
Percent Reduction
0.00 0.00 0.00 0.00 0.00 0.00 0.00 0.00 0.00 0.00 0.00 0.00 0.00 0.00 0.00 0.00
CalEEMod Version: CalEEMod.2016.3.2 Date: 2/13/2019 2:32 PMPage 5 of 15
Ramona and Indian Warehouse (Operations) - Riverside-South Coast County, Summer

2.2 Overall Operational
ROG NOx CO SO2 Fugitive PM10
Exhaust PM10
PM10 Total
Fugitive PM2.5
Exhaust PM2.5
PM2.5 Total Bio- CO2 NBio- CO2 Total CO2 CH4 N2O CO2e
Category lb/day lb/day
Area 9.8928 4.2000e-004
0.0458 0.0000 1.6000e-004
1.6000e-004
1.6000e-004
1.6000e-004
0.0976 0.0976 2.6000e-004
0.1041
Energy 0.0257 0.2338 0.1964 1.4000e-003
0.0178 0.0178 0.0178 0.0178 280.5228 280.5228 5.3800e-003
5.1400e-003
282.1898
Mobile 2.0353 48.4888 30.9628 0.2520 14.7150 0.3694 15.0844 3.9848 0.3517 4.3365 26,124.8131
26,124.8131
0.8678 26,146.5068
Total 11.9539 48.7230 31.2049 0.2534 14.7150 0.3873 15.1023 3.9848 0.3696 4.3544 26,405.4334
26,405.4334
0.8734 5.1400e-003
26,428.8006
Unmitigated Operational
ROG NOx CO SO2 Fugitive PM10
Exhaust PM10
PM10 Total
Fugitive PM2.5
Exhaust PM2.5
PM2.5 Total Bio- CO2 NBio- CO2 Total CO2 CH4 N2O CO2e
Category lb/day lb/day
Area 9.8928 4.2000e-004
0.0458 0.0000 1.6000e-004
1.6000e-004
1.6000e-004
1.6000e-004
0.0976 0.0976 2.6000e-004
0.1041
Energy 0.0257 0.2338 0.1964 1.4000e-003
0.0178 0.0178 0.0178 0.0178 280.5228 280.5228 5.3800e-003
5.1400e-003
282.1898
Mobile 2.0353 48.4888 30.9628 0.2520 14.7150 0.3694 15.0844 3.9848 0.3517 4.3365 26,124.8131
26,124.8131
0.8678 26,146.5068
Total 11.9539 48.7230 31.2049 0.2534 14.7150 0.3873 15.1023 3.9848 0.3696 4.3544 26,405.4334
26,405.4334
0.8734 5.1400e-003
26,428.8006
Mitigated Operational
CalEEMod Version: CalEEMod.2016.3.2 Date: 2/13/2019 2:32 PMPage 6 of 15
Ramona and Indian Warehouse (Operations) - Riverside-South Coast County, Summer

3.0 Construction Detail
3.1 Mitigation Measures Construction
Construction Phase
Phase Number
Phase Name Phase Type Start Date End Date Num Days Week
Num Days Phase Description
1 Site Preparation Site Preparation 1/25/2019 2/7/2019 5 10
OffRoad Equipment
Phase Name Offroad Equipment Type Amount Usage Hours Horse Power Load Factor
Site Preparation Rubber Tired Dozers 0 8.00 247 0.40
Site Preparation Tractors/Loaders/Backhoes 0 8.00 97 0.37
Trips and VMT
Phase Name Offroad Equipment Count
Worker Trip Number
Vendor Trip Number
Hauling Trip Number
Worker Trip Length
Vendor Trip Length
Hauling Trip Length
Worker Vehicle Class
Vendor Vehicle Class
Hauling Vehicle Class
Site Preparation 0 0.00 0.00 0.00 14.70 6.90 20.00 LD_Mix HDT_Mix HHDT
ROG NOx CO SO2 Fugitive PM10
Exhaust PM10
PM10 Total
Fugitive PM2.5
Exhaust PM2.5
PM2.5 Total
Bio- CO2 NBio-CO2 Total CO2 CH4 N20 CO2e
Percent Reduction
0.00 0.00 0.00 0.00 0.00 0.00 0.00 0.00 0.00 0.00 0.00 0.00 0.00 0.00 0.00 0.00
Residential Indoor: 0; Residential Outdoor: 0; Non-Residential Indoor: 0; Non-Residential Outdoor: 0; Striped Parking Area: 0 (Architectural Coating – sqft)
Acres of Grading (Site Preparation Phase): 0
Acres of Grading (Grading Phase): 0
Acres of Paving: 16.99
CalEEMod Version: CalEEMod.2016.3.2 Date: 2/13/2019 2:32 PMPage 7 of 15
Ramona and Indian Warehouse (Operations) - Riverside-South Coast County, Summer

3.2 Site Preparation - 2019
ROG NOx CO SO2 Fugitive PM10
Exhaust PM10
PM10 Total
Fugitive PM2.5
Exhaust PM2.5
PM2.5 Total Bio- CO2 NBio- CO2 Total CO2 CH4 N2O CO2e
Category lb/day lb/day
Fugitive Dust 0.0000 0.0000 0.0000 0.0000 0.0000 0.0000 0.0000 0.0000
Off-Road 0.0000 0.0000 0.0000 0.0000 0.0000 0.0000 0.0000 0.0000 0.0000 0.0000 0.0000 0.0000
Total 0.0000 0.0000 0.0000 0.0000 0.0000 0.0000 0.0000 0.0000 0.0000 0.0000 0.0000 0.0000 0.0000 0.0000
Unmitigated Construction On-Site
ROG NOx CO SO2 Fugitive PM10
Exhaust PM10
PM10 Total
Fugitive PM2.5
Exhaust PM2.5
PM2.5 Total Bio- CO2 NBio- CO2 Total CO2 CH4 N2O CO2e
Category lb/day lb/day
Hauling 0.0000 0.0000 0.0000 0.0000 0.0000 0.0000 0.0000 0.0000 0.0000 0.0000 0.0000 0.0000 0.0000 0.0000
Vendor 0.0000 0.0000 0.0000 0.0000 0.0000 0.0000 0.0000 0.0000 0.0000 0.0000 0.0000 0.0000 0.0000 0.0000
Worker 0.0000 0.0000 0.0000 0.0000 0.0000 0.0000 0.0000 0.0000 0.0000 0.0000 0.0000 0.0000 0.0000 0.0000
Total 0.0000 0.0000 0.0000 0.0000 0.0000 0.0000 0.0000 0.0000 0.0000 0.0000 0.0000 0.0000 0.0000 0.0000
Unmitigated Construction Off-Site
CalEEMod Version: CalEEMod.2016.3.2 Date: 2/13/2019 2:32 PMPage 8 of 15
Ramona and Indian Warehouse (Operations) - Riverside-South Coast County, Summer

4.0 Operational Detail - Mobile
3.2 Site Preparation - 2019
ROG NOx CO SO2 Fugitive PM10
Exhaust PM10
PM10 Total
Fugitive PM2.5
Exhaust PM2.5
PM2.5 Total Bio- CO2 NBio- CO2 Total CO2 CH4 N2O CO2e
Category lb/day lb/day
Fugitive Dust 0.0000 0.0000 0.0000 0.0000 0.0000 0.0000 0.0000 0.0000
Off-Road 0.0000 0.0000 0.0000 0.0000 0.0000 0.0000 0.0000 0.0000 0.0000 0.0000 0.0000 0.0000 0.0000
Total 0.0000 0.0000 0.0000 0.0000 0.0000 0.0000 0.0000 0.0000 0.0000 0.0000 0.0000 0.0000 0.0000 0.0000 0.0000
Mitigated Construction On-Site
ROG NOx CO SO2 Fugitive PM10
Exhaust PM10
PM10 Total
Fugitive PM2.5
Exhaust PM2.5
PM2.5 Total Bio- CO2 NBio- CO2 Total CO2 CH4 N2O CO2e
Category lb/day lb/day
Hauling 0.0000 0.0000 0.0000 0.0000 0.0000 0.0000 0.0000 0.0000 0.0000 0.0000 0.0000 0.0000 0.0000 0.0000
Vendor 0.0000 0.0000 0.0000 0.0000 0.0000 0.0000 0.0000 0.0000 0.0000 0.0000 0.0000 0.0000 0.0000 0.0000
Worker 0.0000 0.0000 0.0000 0.0000 0.0000 0.0000 0.0000 0.0000 0.0000 0.0000 0.0000 0.0000 0.0000 0.0000
Total 0.0000 0.0000 0.0000 0.0000 0.0000 0.0000 0.0000 0.0000 0.0000 0.0000 0.0000 0.0000 0.0000 0.0000
Mitigated Construction Off-Site
CalEEMod Version: CalEEMod.2016.3.2 Date: 2/13/2019 2:32 PMPage 9 of 15
Ramona and Indian Warehouse (Operations) - Riverside-South Coast County, Summer

ROG NOx CO SO2 Fugitive PM10
Exhaust PM10
PM10 Total
Fugitive PM2.5
Exhaust PM2.5
PM2.5 Total
Bio- CO2 NBio- CO2 Total CO2 CH4 N2O CO2e
Category lb/day lb/day
Mitigated 2.0353 48.4888 30.9628 0.2520 14.7150 0.3694 15.0844 3.9848 0.3517 4.3365 26,124.8131
26,124.8131
0.8678 26,146.5068
Unmitigated 2.0353 48.4888 30.9628 0.2520 14.7150 0.3694 15.0844 3.9848 0.3517 4.3365 26,124.8131
26,124.8131
0.8678 26,146.5068
4.1 Mitigation Measures Mobile
4.2 Trip Summary Information
4.3 Trip Type Information
Average Daily Trip Rate Unmitigated Mitigated
Land Use Weekday Saturday Sunday Annual VMT Annual VMT
Other Non-Asphalt Surfaces 0.00 0.00 0.00
Parking Lot 0.00 0.00 0.00
Unrefrigerated Warehouse-No Rail 600.22 403.01 373.00 6,004,247 6,004,247
Total 600.22 403.01 373.00 6,004,247 6,004,247
Miles Trip % Trip Purpose %
Land Use H-W or C-W H-S or C-C H-O or C-NW H-W or C-W H-S or C-C H-O or C-NW Primary Diverted Pass-by
Other Non-Asphalt Surfaces 16.60 8.40 6.90 0.00 0.00 0.00 0 0 0
Parking Lot 16.60 8.40 6.90 0.00 0.00 0.00 0 0 0
Unrefrigerated Warehouse-No Rail
30.57 8.40 6.90 100.00 0.00 0.00 100 0 0
CalEEMod Version: CalEEMod.2016.3.2 Date: 2/13/2019 2:32 PMPage 10 of 15
Ramona and Indian Warehouse (Operations) - Riverside-South Coast County, Summer

5.0 Energy Detail
ROG NOx CO SO2 Fugitive PM10
Exhaust PM10
PM10 Total
Fugitive PM2.5
Exhaust PM2.5
PM2.5 Total Bio- CO2 NBio- CO2 Total CO2 CH4 N2O CO2e
Category lb/day lb/day
NaturalGas Mitigated
0.0257 0.2338 0.1964 1.4000e-003
0.0178 0.0178 0.0178 0.0178 280.5228 280.5228 5.3800e-003
5.1400e-003
282.1898
NaturalGas Unmitigated
0.0257 0.2338 0.1964 1.4000e-003
0.0178 0.0178 0.0178 0.0178 280.5228 280.5228 5.3800e-003
5.1400e-003
282.1898
5.1 Mitigation Measures Energy
4.4 Fleet Mix
Land Use LDA LDT1 LDT2 MDV LHD1 LHD2 MHD HHD OBUS UBUS MCY SBUS MH
Other Non-Asphalt Surfaces 0.538064 0.038449 0.184390 0.122109 0.017402 0.005339 0.017250 0.067711 0.001365 0.001213 0.004629 0.000959 0.001120
Parking Lot 0.538064 0.038449 0.184390 0.122109 0.017402 0.005339 0.017250 0.067711 0.001365 0.001213 0.004629 0.000959 0.001120
Unrefrigerated Warehouse-No Rail
0.678140 0.000000 0.000000 0.000000 0.053810 0.000000 0.066710 0.201340 0.000000 0.000000 0.000000 0.000000 0.000000
Historical Energy Use: N
CalEEMod Version: CalEEMod.2016.3.2 Date: 2/13/2019 2:32 PMPage 11 of 15
Ramona and Indian Warehouse (Operations) - Riverside-South Coast County, Summer
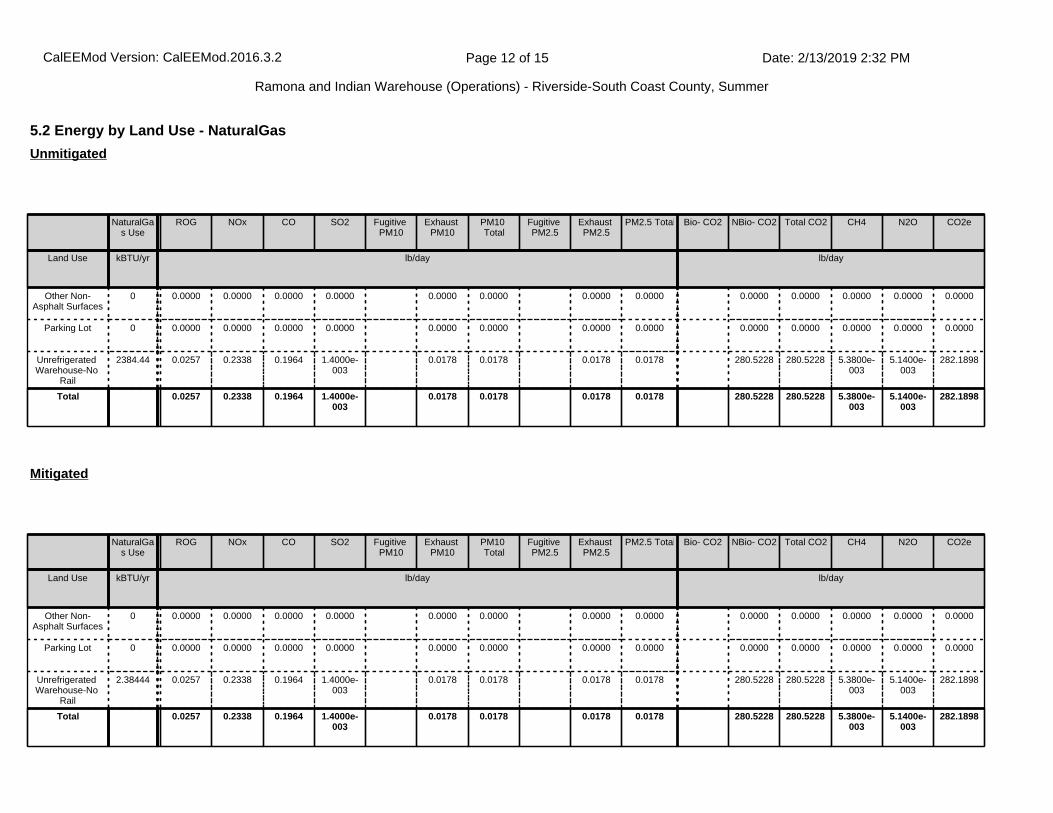
5.2 Energy by Land Use - NaturalGas
NaturalGas Use
ROG NOx CO SO2 Fugitive PM10
Exhaust PM10
PM10 Total
Fugitive PM2.5
Exhaust PM2.5
PM2.5 Total Bio- CO2 NBio- CO2 Total CO2 CH4 N2O CO2e
Land Use kBTU/yr lb/day lb/day
Other Non-Asphalt Surfaces
0 0.0000 0.0000 0.0000 0.0000 0.0000 0.0000 0.0000 0.0000 0.0000 0.0000 0.0000 0.0000 0.0000
Parking Lot 0 0.0000 0.0000 0.0000 0.0000 0.0000 0.0000 0.0000 0.0000 0.0000 0.0000 0.0000 0.0000 0.0000
Unrefrigerated Warehouse-No
Rail
2384.44 0.0257 0.2338 0.1964 1.4000e-003
0.0178 0.0178 0.0178 0.0178 280.5228 280.5228 5.3800e-003
5.1400e-003
282.1898
Total 0.0257 0.2338 0.1964 1.4000e-003
0.0178 0.0178 0.0178 0.0178 280.5228 280.5228 5.3800e-003
5.1400e-003
282.1898
Unmitigated
NaturalGas Use
ROG NOx CO SO2 Fugitive PM10
Exhaust PM10
PM10 Total
Fugitive PM2.5
Exhaust PM2.5
PM2.5 Total Bio- CO2 NBio- CO2 Total CO2 CH4 N2O CO2e
Land Use kBTU/yr lb/day lb/day
Other Non-Asphalt Surfaces
0 0.0000 0.0000 0.0000 0.0000 0.0000 0.0000 0.0000 0.0000 0.0000 0.0000 0.0000 0.0000 0.0000
Parking Lot 0 0.0000 0.0000 0.0000 0.0000 0.0000 0.0000 0.0000 0.0000 0.0000 0.0000 0.0000 0.0000 0.0000
Unrefrigerated Warehouse-No
Rail
2.38444 0.0257 0.2338 0.1964 1.4000e-003
0.0178 0.0178 0.0178 0.0178 280.5228 280.5228 5.3800e-003
5.1400e-003
282.1898
Total 0.0257 0.2338 0.1964 1.4000e-003
0.0178 0.0178 0.0178 0.0178 280.5228 280.5228 5.3800e-003
5.1400e-003
282.1898
Mitigated
CalEEMod Version: CalEEMod.2016.3.2 Date: 2/13/2019 2:32 PMPage 12 of 15
Ramona and Indian Warehouse (Operations) - Riverside-South Coast County, Summer

6.1 Mitigation Measures Area
6.0 Area Detail
ROG NOx CO SO2 Fugitive PM10
Exhaust PM10
PM10 Total
Fugitive PM2.5
Exhaust PM2.5
PM2.5 Total Bio- CO2 NBio- CO2 Total CO2 CH4 N2O CO2e
Category lb/day lb/day
Mitigated 9.8928 4.2000e-004
0.0458 0.0000 1.6000e-004
1.6000e-004
1.6000e-004
1.6000e-004
0.0976 0.0976 2.6000e-004
0.1041
Unmitigated 9.8928 4.2000e-004
0.0458 0.0000 1.6000e-004
1.6000e-004
1.6000e-004
1.6000e-004
0.0976 0.0976 2.6000e-004
0.1041
CalEEMod Version: CalEEMod.2016.3.2 Date: 2/13/2019 2:32 PMPage 13 of 15
Ramona and Indian Warehouse (Operations) - Riverside-South Coast County, Summer

7.0 Water Detail
6.2 Area by SubCategory
ROG NOx CO SO2 Fugitive PM10
Exhaust PM10
PM10 Total
Fugitive PM2.5
Exhaust PM2.5
PM2.5 Total Bio- CO2 NBio- CO2 Total CO2 CH4 N2O CO2e
SubCategory lb/day lb/day
Architectural Coating
1.1375 0.0000 0.0000 0.0000 0.0000 0.0000 0.0000
Consumer Products
8.7510 0.0000 0.0000 0.0000 0.0000 0.0000 0.0000
Landscaping 4.3100e-003
4.2000e-004
0.0458 0.0000 1.6000e-004
1.6000e-004
1.6000e-004
1.6000e-004
0.0976 0.0976 2.6000e-004
0.1041
Total 9.8928 4.2000e-004
0.0458 0.0000 1.6000e-004
1.6000e-004
1.6000e-004
1.6000e-004
0.0976 0.0976 2.6000e-004
0.1041
Unmitigated
ROG NOx CO SO2 Fugitive PM10
Exhaust PM10
PM10 Total
Fugitive PM2.5
Exhaust PM2.5
PM2.5 Total Bio- CO2 NBio- CO2 Total CO2 CH4 N2O CO2e
SubCategory lb/day lb/day
Architectural Coating
1.1375 0.0000 0.0000 0.0000 0.0000 0.0000 0.0000
Consumer Products
8.7510 0.0000 0.0000 0.0000 0.0000 0.0000 0.0000
Landscaping 4.3100e-003
4.2000e-004
0.0458 0.0000 1.6000e-004
1.6000e-004
1.6000e-004
1.6000e-004
0.0976 0.0976 2.6000e-004
0.1041
Total 9.8928 4.2000e-004
0.0458 0.0000 1.6000e-004
1.6000e-004
1.6000e-004
1.6000e-004
0.0976 0.0976 2.6000e-004
0.1041
Mitigated
CalEEMod Version: CalEEMod.2016.3.2 Date: 2/13/2019 2:32 PMPage 14 of 15
Ramona and Indian Warehouse (Operations) - Riverside-South Coast County, Summer

8.1 Mitigation Measures Waste
7.1 Mitigation Measures Water
7.0 Water Detail
8.0 Waste Detail
11.0 Vegetation
9.0 Operational Offroad
Equipment Type Number Hours/Day Days/Year Horse Power Load Factor Fuel Type
10.0 Stationary Equipment
Fire Pumps and Emergency Generators
Equipment Type Number Hours/Day Hours/Year Horse Power Load Factor Fuel Type
Boilers
Equipment Type Number Heat Input/Day Heat Input/Year Boiler Rating Fuel Type
User Defined Equipment
Equipment Type Number
CalEEMod Version: CalEEMod.2016.3.2 Date: 2/13/2019 2:32 PMPage 15 of 15
Ramona and Indian Warehouse (Operations) - Riverside-South Coast County, Summer

1.1 Land Usage
Land Uses Size Metric Lot Acreage Floor Surface Area Population
Unrefrigerated Warehouse-No Rail 428.73 1000sqft 9.85 428,730.00 0
Other Non-Asphalt Surfaces 5.50 Acre 5.50 239,580.00 0
Parking Lot 11.49 Acre 11.49 500,504.40 0
1.2 Other Project Characteristics
Urbanization
Climate Zone
Urban
10
Wind Speed (m/s) Precipitation Freq (Days)2.4 28
1.3 User Entered Comments & Non-Default Data
1.0 Project Characteristics
Utility Company Southern California Edison
2020Operational Year
CO2 Intensity (lb/MWhr)
702.44 0.029CH4 Intensity (lb/MWhr)
0.006N2O Intensity (lb/MWhr)
Ramona and Indian Warehouse (Operations)Riverside-South Coast County, Winter
CalEEMod Version: CalEEMod.2016.3.2 Date: 2/13/2019 2:33 PMPage 1 of 15
Ramona and Indian Warehouse (Operations) - Riverside-South Coast County, Winter

Project Characteristics -
Land Use - Total Site Area is 26.84 acres (24.2 on-site and 2.64 off-site). Per the Site Plan, 9.85 acres is Building, 11.49 acres is Parking.
Construction Phase - Operations Run Only.
Off-road Equipment - Operations Run Only.
Trips and VMT - Operations Run Only.
Architectural Coating -
Vehicle Trips - Operations Run Only. Trip Length represents the weighted Trip Length of Passenger Cars and Trucks.
Area Coating -
Energy Use -
Water And Wastewater - Water Demand based on the Generation Rate of 0.75 (Demand/AFY) as per the PVCC SP EIR.
Solid Waste -
Fleet Mix - Fleet Mix based on information provided in the TIA.
CalEEMod Version: CalEEMod.2016.3.2 Date: 2/13/2019 2:33 PMPage 2 of 15
Ramona and Indian Warehouse (Operations) - Riverside-South Coast County, Winter

Table Name Column Name Default Value New Value
tblFleetMix HHD 0.07 0.20
tblFleetMix LDA 0.54 0.68
tblFleetMix LDT1 0.04 0.00
tblFleetMix LDT2 0.18 0.00
tblFleetMix LHD1 0.02 0.05
tblFleetMix LHD2 5.3390e-003 0.00
tblFleetMix MCY 4.6290e-003 0.00
tblFleetMix MDV 0.12 0.00
tblFleetMix MH 1.1200e-003 0.00
tblFleetMix MHD 0.02 0.07
tblFleetMix OBUS 1.3650e-003 0.00
tblFleetMix SBUS 9.5900e-004 0.00
tblFleetMix UBUS 1.2130e-003 0.00
tblLandUse LotAcreage 9.84 9.85
tblOffRoadEquipment OffRoadEquipmentUnitAmount 3.00 0.00
tblOffRoadEquipment OffRoadEquipmentUnitAmount 4.00 0.00
tblVehicleTrips CNW_TTP 41.00 0.00
tblVehicleTrips CW_TL 16.60 30.57
tblVehicleTrips CW_TTP 59.00 100.00
tblVehicleTrips DV_TP 5.00 0.00
tblVehicleTrips PB_TP 3.00 0.00
tblVehicleTrips PR_TP 92.00 100.00
tblVehicleTrips ST_TR 1.68 0.94
tblVehicleTrips SU_TR 1.68 0.87
tblVehicleTrips WD_TR 1.68 1.40
tblWater IndoorWaterUseRate 99,143,812.50 5,914,207.45
CalEEMod Version: CalEEMod.2016.3.2 Date: 2/13/2019 2:33 PMPage 3 of 15
Ramona and Indian Warehouse (Operations) - Riverside-South Coast County, Winter

2.0 Emissions Summary
2.1 Overall Construction (Maximum Daily Emission)
ROG NOx CO SO2 Fugitive PM10
Exhaust PM10
PM10 Total
Fugitive PM2.5
Exhaust PM2.5
PM2.5 Total Bio- CO2 NBio- CO2 Total CO2 CH4 N2O CO2e
Year lb/day lb/day
2019 0.0000 0.0000 0.0000 0.0000 0.0000 0.0000 0.0000 0.0000 0.0000 0.0000 0.0000 0.0000 0.0000 0.0000 0.0000 0.0000
Maximum 0.0000 0.0000 0.0000 0.0000 0.0000 0.0000 0.0000 0.0000 0.0000 0.0000 0.0000 0.0000 0.0000 0.0000 0.0000 0.0000
Unmitigated Construction
ROG NOx CO SO2 Fugitive PM10
Exhaust PM10
PM10 Total
Fugitive PM2.5
Exhaust PM2.5
PM2.5 Total Bio- CO2 NBio- CO2 Total CO2 CH4 N2O CO2e
Year lb/day lb/day
2019 0.0000 0.0000 0.0000 0.0000 0.0000 0.0000 0.0000 0.0000 0.0000 0.0000 0.0000 0.0000 0.0000 0.0000 0.0000 0.0000
Maximum 0.0000 0.0000 0.0000 0.0000 0.0000 0.0000 0.0000 0.0000 0.0000 0.0000 0.0000 0.0000 0.0000 0.0000 0.0000 0.0000
Mitigated Construction
CalEEMod Version: CalEEMod.2016.3.2 Date: 2/13/2019 2:33 PMPage 4 of 15
Ramona and Indian Warehouse (Operations) - Riverside-South Coast County, Winter

ROG NOx CO SO2 Fugitive PM10
Exhaust PM10
PM10 Total
Fugitive PM2.5
Exhaust PM2.5
PM2.5 Total
Bio- CO2 NBio-CO2 Total CO2 CH4 N20 CO2e
Percent Reduction
0.00 0.00 0.00 0.00 0.00 0.00 0.00 0.00 0.00 0.00 0.00 0.00 0.00 0.00 0.00 0.00
CalEEMod Version: CalEEMod.2016.3.2 Date: 2/13/2019 2:33 PMPage 5 of 15
Ramona and Indian Warehouse (Operations) - Riverside-South Coast County, Winter

2.2 Overall Operational
ROG NOx CO SO2 Fugitive PM10
Exhaust PM10
PM10 Total
Fugitive PM2.5
Exhaust PM2.5
PM2.5 Total Bio- CO2 NBio- CO2 Total CO2 CH4 N2O CO2e
Category lb/day lb/day
Area 9.8928 4.2000e-004
0.0458 0.0000 1.6000e-004
1.6000e-004
1.6000e-004
1.6000e-004
0.0976 0.0976 2.6000e-004
0.1041
Energy 0.0257 0.2338 0.1964 1.4000e-003
0.0178 0.0178 0.0178 0.0178 280.5228 280.5228 5.3800e-003
5.1400e-003
282.1898
Mobile 1.9208 49.6759 26.8579 0.2413 14.7150 0.3708 15.0858 3.9848 0.3530 4.3378 25,045.3626
25,045.3626
0.9022 25,067.9166
Total 11.8394 49.9101 27.1001 0.2427 14.7150 0.3887 15.1037 3.9848 0.3710 4.3558 25,325.9829
25,325.9829
0.9078 5.1400e-003
25,350.2105
Unmitigated Operational
ROG NOx CO SO2 Fugitive PM10
Exhaust PM10
PM10 Total
Fugitive PM2.5
Exhaust PM2.5
PM2.5 Total Bio- CO2 NBio- CO2 Total CO2 CH4 N2O CO2e
Category lb/day lb/day
Area 9.8928 4.2000e-004
0.0458 0.0000 1.6000e-004
1.6000e-004
1.6000e-004
1.6000e-004
0.0976 0.0976 2.6000e-004
0.1041
Energy 0.0257 0.2338 0.1964 1.4000e-003
0.0178 0.0178 0.0178 0.0178 280.5228 280.5228 5.3800e-003
5.1400e-003
282.1898
Mobile 1.9208 49.6759 26.8579 0.2413 14.7150 0.3708 15.0858 3.9848 0.3530 4.3378 25,045.3626
25,045.3626
0.9022 25,067.9166
Total 11.8394 49.9101 27.1001 0.2427 14.7150 0.3887 15.1037 3.9848 0.3710 4.3558 25,325.9829
25,325.9829
0.9078 5.1400e-003
25,350.2105
Mitigated Operational
CalEEMod Version: CalEEMod.2016.3.2 Date: 2/13/2019 2:33 PMPage 6 of 15
Ramona and Indian Warehouse (Operations) - Riverside-South Coast County, Winter

3.0 Construction Detail
3.1 Mitigation Measures Construction
Construction Phase
Phase Number
Phase Name Phase Type Start Date End Date Num Days Week
Num Days Phase Description
1 Site Preparation Site Preparation 1/25/2019 2/7/2019 5 10
OffRoad Equipment
Phase Name Offroad Equipment Type Amount Usage Hours Horse Power Load Factor
Site Preparation Rubber Tired Dozers 0 8.00 247 0.40
Site Preparation Tractors/Loaders/Backhoes 0 8.00 97 0.37
Trips and VMT
Phase Name Offroad Equipment Count
Worker Trip Number
Vendor Trip Number
Hauling Trip Number
Worker Trip Length
Vendor Trip Length
Hauling Trip Length
Worker Vehicle Class
Vendor Vehicle Class
Hauling Vehicle Class
Site Preparation 0 0.00 0.00 0.00 14.70 6.90 20.00 LD_Mix HDT_Mix HHDT
ROG NOx CO SO2 Fugitive PM10
Exhaust PM10
PM10 Total
Fugitive PM2.5
Exhaust PM2.5
PM2.5 Total
Bio- CO2 NBio-CO2 Total CO2 CH4 N20 CO2e
Percent Reduction
0.00 0.00 0.00 0.00 0.00 0.00 0.00 0.00 0.00 0.00 0.00 0.00 0.00 0.00 0.00 0.00
Residential Indoor: 0; Residential Outdoor: 0; Non-Residential Indoor: 0; Non-Residential Outdoor: 0; Striped Parking Area: 0 (Architectural Coating – sqft)
Acres of Grading (Site Preparation Phase): 0
Acres of Grading (Grading Phase): 0
Acres of Paving: 16.99
CalEEMod Version: CalEEMod.2016.3.2 Date: 2/13/2019 2:33 PMPage 7 of 15
Ramona and Indian Warehouse (Operations) - Riverside-South Coast County, Winter

3.2 Site Preparation - 2019
ROG NOx CO SO2 Fugitive PM10
Exhaust PM10
PM10 Total
Fugitive PM2.5
Exhaust PM2.5
PM2.5 Total Bio- CO2 NBio- CO2 Total CO2 CH4 N2O CO2e
Category lb/day lb/day
Fugitive Dust 0.0000 0.0000 0.0000 0.0000 0.0000 0.0000 0.0000 0.0000
Off-Road 0.0000 0.0000 0.0000 0.0000 0.0000 0.0000 0.0000 0.0000 0.0000 0.0000 0.0000 0.0000
Total 0.0000 0.0000 0.0000 0.0000 0.0000 0.0000 0.0000 0.0000 0.0000 0.0000 0.0000 0.0000 0.0000 0.0000
Unmitigated Construction On-Site
ROG NOx CO SO2 Fugitive PM10
Exhaust PM10
PM10 Total
Fugitive PM2.5
Exhaust PM2.5
PM2.5 Total Bio- CO2 NBio- CO2 Total CO2 CH4 N2O CO2e
Category lb/day lb/day
Hauling 0.0000 0.0000 0.0000 0.0000 0.0000 0.0000 0.0000 0.0000 0.0000 0.0000 0.0000 0.0000 0.0000 0.0000
Vendor 0.0000 0.0000 0.0000 0.0000 0.0000 0.0000 0.0000 0.0000 0.0000 0.0000 0.0000 0.0000 0.0000 0.0000
Worker 0.0000 0.0000 0.0000 0.0000 0.0000 0.0000 0.0000 0.0000 0.0000 0.0000 0.0000 0.0000 0.0000 0.0000
Total 0.0000 0.0000 0.0000 0.0000 0.0000 0.0000 0.0000 0.0000 0.0000 0.0000 0.0000 0.0000 0.0000 0.0000
Unmitigated Construction Off-Site
CalEEMod Version: CalEEMod.2016.3.2 Date: 2/13/2019 2:33 PMPage 8 of 15
Ramona and Indian Warehouse (Operations) - Riverside-South Coast County, Winter
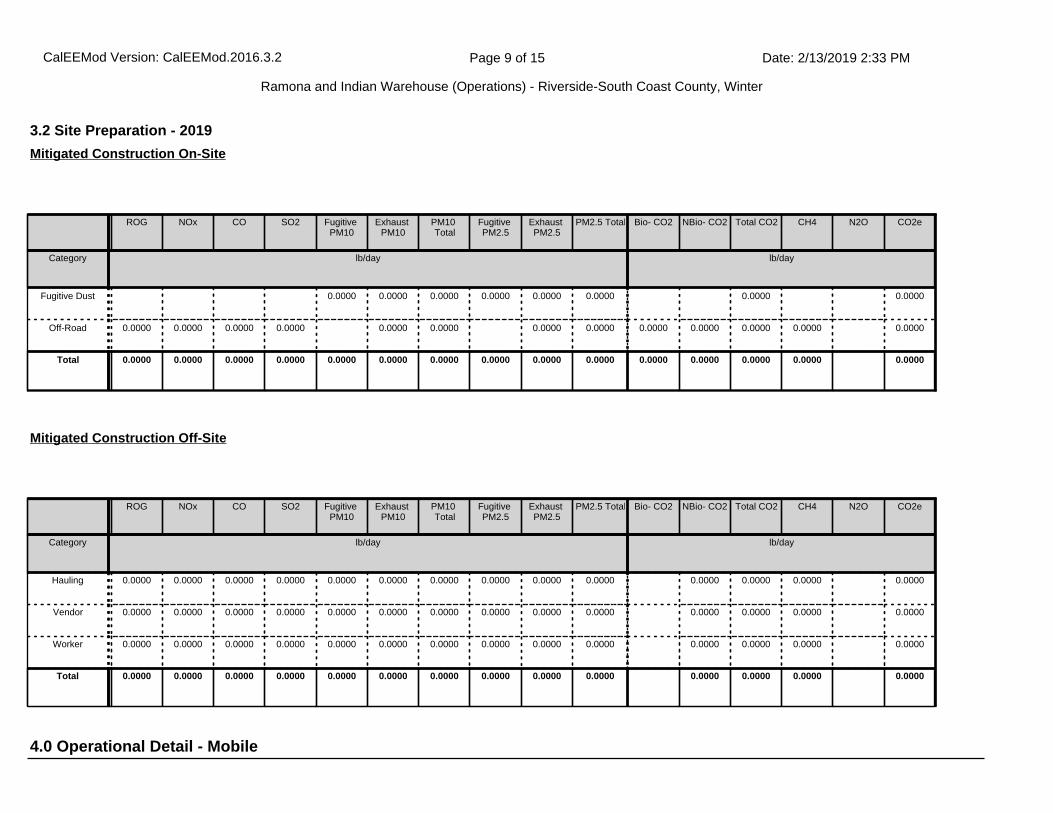
4.0 Operational Detail - Mobile
3.2 Site Preparation - 2019
ROG NOx CO SO2 Fugitive PM10
Exhaust PM10
PM10 Total
Fugitive PM2.5
Exhaust PM2.5
PM2.5 Total Bio- CO2 NBio- CO2 Total CO2 CH4 N2O CO2e
Category lb/day lb/day
Fugitive Dust 0.0000 0.0000 0.0000 0.0000 0.0000 0.0000 0.0000 0.0000
Off-Road 0.0000 0.0000 0.0000 0.0000 0.0000 0.0000 0.0000 0.0000 0.0000 0.0000 0.0000 0.0000 0.0000
Total 0.0000 0.0000 0.0000 0.0000 0.0000 0.0000 0.0000 0.0000 0.0000 0.0000 0.0000 0.0000 0.0000 0.0000 0.0000
Mitigated Construction On-Site
ROG NOx CO SO2 Fugitive PM10
Exhaust PM10
PM10 Total
Fugitive PM2.5
Exhaust PM2.5
PM2.5 Total Bio- CO2 NBio- CO2 Total CO2 CH4 N2O CO2e
Category lb/day lb/day
Hauling 0.0000 0.0000 0.0000 0.0000 0.0000 0.0000 0.0000 0.0000 0.0000 0.0000 0.0000 0.0000 0.0000 0.0000
Vendor 0.0000 0.0000 0.0000 0.0000 0.0000 0.0000 0.0000 0.0000 0.0000 0.0000 0.0000 0.0000 0.0000 0.0000
Worker 0.0000 0.0000 0.0000 0.0000 0.0000 0.0000 0.0000 0.0000 0.0000 0.0000 0.0000 0.0000 0.0000 0.0000
Total 0.0000 0.0000 0.0000 0.0000 0.0000 0.0000 0.0000 0.0000 0.0000 0.0000 0.0000 0.0000 0.0000 0.0000
Mitigated Construction Off-Site
CalEEMod Version: CalEEMod.2016.3.2 Date: 2/13/2019 2:33 PMPage 9 of 15
Ramona and Indian Warehouse (Operations) - Riverside-South Coast County, Winter

ROG NOx CO SO2 Fugitive PM10
Exhaust PM10
PM10 Total
Fugitive PM2.5
Exhaust PM2.5
PM2.5 Total Bio- CO2 NBio- CO2 Total CO2 CH4 N2O CO2e
Category lb/day lb/day
Mitigated 1.9208 49.6759 26.8579 0.2413 14.7150 0.3708 15.0858 3.9848 0.3530 4.3378 25,045.3626
25,045.3626
0.9022 25,067.9166
Unmitigated 1.9208 49.6759 26.8579 0.2413 14.7150 0.3708 15.0858 3.9848 0.3530 4.3378 25,045.3626
25,045.3626
0.9022 25,067.9166
4.1 Mitigation Measures Mobile
4.2 Trip Summary Information
4.3 Trip Type Information
Average Daily Trip Rate Unmitigated Mitigated
Land Use Weekday Saturday Sunday Annual VMT Annual VMT
Other Non-Asphalt Surfaces 0.00 0.00 0.00
Parking Lot 0.00 0.00 0.00
Unrefrigerated Warehouse-No Rail 600.22 403.01 373.00 6,004,247 6,004,247
Total 600.22 403.01 373.00 6,004,247 6,004,247
Miles Trip % Trip Purpose %
Land Use H-W or C-W H-S or C-C H-O or C-NW H-W or C-W H-S or C-C H-O or C-NW Primary Diverted Pass-by
Other Non-Asphalt Surfaces 16.60 8.40 6.90 0.00 0.00 0.00 0 0 0
Parking Lot 16.60 8.40 6.90 0.00 0.00 0.00 0 0 0
Unrefrigerated Warehouse-No Rail
30.57 8.40 6.90 100.00 0.00 0.00 100 0 0
CalEEMod Version: CalEEMod.2016.3.2 Date: 2/13/2019 2:33 PMPage 10 of 15
Ramona and Indian Warehouse (Operations) - Riverside-South Coast County, Winter

5.0 Energy Detail
ROG NOx CO SO2 Fugitive PM10
Exhaust PM10
PM10 Total
Fugitive PM2.5
Exhaust PM2.5
PM2.5 Total Bio- CO2 NBio- CO2 Total CO2 CH4 N2O CO2e
Category lb/day lb/day
NaturalGas Mitigated
0.0257 0.2338 0.1964 1.4000e-003
0.0178 0.0178 0.0178 0.0178 280.5228 280.5228 5.3800e-003
5.1400e-003
282.1898
NaturalGas Unmitigated
0.0257 0.2338 0.1964 1.4000e-003
0.0178 0.0178 0.0178 0.0178 280.5228 280.5228 5.3800e-003
5.1400e-003
282.1898
5.1 Mitigation Measures Energy
4.4 Fleet Mix
Land Use LDA LDT1 LDT2 MDV LHD1 LHD2 MHD HHD OBUS UBUS MCY SBUS MH
Other Non-Asphalt Surfaces 0.538064 0.038449 0.184390 0.122109 0.017402 0.005339 0.017250 0.067711 0.001365 0.001213 0.004629 0.000959 0.001120
Parking Lot 0.538064 0.038449 0.184390 0.122109 0.017402 0.005339 0.017250 0.067711 0.001365 0.001213 0.004629 0.000959 0.001120
Unrefrigerated Warehouse-No Rail
0.678140 0.000000 0.000000 0.000000 0.053810 0.000000 0.066710 0.201340 0.000000 0.000000 0.000000 0.000000 0.000000
Historical Energy Use: N
CalEEMod Version: CalEEMod.2016.3.2 Date: 2/13/2019 2:33 PMPage 11 of 15
Ramona and Indian Warehouse (Operations) - Riverside-South Coast County, Winter

5.2 Energy by Land Use - NaturalGas
NaturalGas Use
ROG NOx CO SO2 Fugitive PM10
Exhaust PM10
PM10 Total
Fugitive PM2.5
Exhaust PM2.5
PM2.5 Total Bio- CO2 NBio- CO2 Total CO2 CH4 N2O CO2e
Land Use kBTU/yr lb/day lb/day
Other Non-Asphalt Surfaces
0 0.0000 0.0000 0.0000 0.0000 0.0000 0.0000 0.0000 0.0000 0.0000 0.0000 0.0000 0.0000 0.0000
Parking Lot 0 0.0000 0.0000 0.0000 0.0000 0.0000 0.0000 0.0000 0.0000 0.0000 0.0000 0.0000 0.0000 0.0000
Unrefrigerated Warehouse-No
Rail
2384.44 0.0257 0.2338 0.1964 1.4000e-003
0.0178 0.0178 0.0178 0.0178 280.5228 280.5228 5.3800e-003
5.1400e-003
282.1898
Total 0.0257 0.2338 0.1964 1.4000e-003
0.0178 0.0178 0.0178 0.0178 280.5228 280.5228 5.3800e-003
5.1400e-003
282.1898
Unmitigated
NaturalGas Use
ROG NOx CO SO2 Fugitive PM10
Exhaust PM10
PM10 Total
Fugitive PM2.5
Exhaust PM2.5
PM2.5 Total Bio- CO2 NBio- CO2 Total CO2 CH4 N2O CO2e
Land Use kBTU/yr lb/day lb/day
Other Non-Asphalt Surfaces
0 0.0000 0.0000 0.0000 0.0000 0.0000 0.0000 0.0000 0.0000 0.0000 0.0000 0.0000 0.0000 0.0000
Parking Lot 0 0.0000 0.0000 0.0000 0.0000 0.0000 0.0000 0.0000 0.0000 0.0000 0.0000 0.0000 0.0000 0.0000
Unrefrigerated Warehouse-No
Rail
2.38444 0.0257 0.2338 0.1964 1.4000e-003
0.0178 0.0178 0.0178 0.0178 280.5228 280.5228 5.3800e-003
5.1400e-003
282.1898
Total 0.0257 0.2338 0.1964 1.4000e-003
0.0178 0.0178 0.0178 0.0178 280.5228 280.5228 5.3800e-003
5.1400e-003
282.1898
Mitigated
CalEEMod Version: CalEEMod.2016.3.2 Date: 2/13/2019 2:33 PMPage 12 of 15
Ramona and Indian Warehouse (Operations) - Riverside-South Coast County, Winter

6.1 Mitigation Measures Area
6.0 Area Detail
ROG NOx CO SO2 Fugitive PM10
Exhaust PM10
PM10 Total
Fugitive PM2.5
Exhaust PM2.5
PM2.5 Total Bio- CO2 NBio- CO2 Total CO2 CH4 N2O CO2e
Category lb/day lb/day
Mitigated 9.8928 4.2000e-004
0.0458 0.0000 1.6000e-004
1.6000e-004
1.6000e-004
1.6000e-004
0.0976 0.0976 2.6000e-004
0.1041
Unmitigated 9.8928 4.2000e-004
0.0458 0.0000 1.6000e-004
1.6000e-004
1.6000e-004
1.6000e-004
0.0976 0.0976 2.6000e-004
0.1041
CalEEMod Version: CalEEMod.2016.3.2 Date: 2/13/2019 2:33 PMPage 13 of 15
Ramona and Indian Warehouse (Operations) - Riverside-South Coast County, Winter

7.0 Water Detail
6.2 Area by SubCategory
ROG NOx CO SO2 Fugitive PM10
Exhaust PM10
PM10 Total
Fugitive PM2.5
Exhaust PM2.5
PM2.5 Total Bio- CO2 NBio- CO2 Total CO2 CH4 N2O CO2e
SubCategory lb/day lb/day
Architectural Coating
1.1375 0.0000 0.0000 0.0000 0.0000 0.0000 0.0000
Consumer Products
8.7510 0.0000 0.0000 0.0000 0.0000 0.0000 0.0000
Landscaping 4.3100e-003
4.2000e-004
0.0458 0.0000 1.6000e-004
1.6000e-004
1.6000e-004
1.6000e-004
0.0976 0.0976 2.6000e-004
0.1041
Total 9.8928 4.2000e-004
0.0458 0.0000 1.6000e-004
1.6000e-004
1.6000e-004
1.6000e-004
0.0976 0.0976 2.6000e-004
0.1041
Unmitigated
ROG NOx CO SO2 Fugitive PM10
Exhaust PM10
PM10 Total
Fugitive PM2.5
Exhaust PM2.5
PM2.5 Total Bio- CO2 NBio- CO2 Total CO2 CH4 N2O CO2e
SubCategory lb/day lb/day
Architectural Coating
1.1375 0.0000 0.0000 0.0000 0.0000 0.0000 0.0000
Consumer Products
8.7510 0.0000 0.0000 0.0000 0.0000 0.0000 0.0000
Landscaping 4.3100e-003
4.2000e-004
0.0458 0.0000 1.6000e-004
1.6000e-004
1.6000e-004
1.6000e-004
0.0976 0.0976 2.6000e-004
0.1041
Total 9.8928 4.2000e-004
0.0458 0.0000 1.6000e-004
1.6000e-004
1.6000e-004
1.6000e-004
0.0976 0.0976 2.6000e-004
0.1041
Mitigated
CalEEMod Version: CalEEMod.2016.3.2 Date: 2/13/2019 2:33 PMPage 14 of 15
Ramona and Indian Warehouse (Operations) - Riverside-South Coast County, Winter

8.1 Mitigation Measures Waste
7.1 Mitigation Measures Water
7.0 Water Detail
8.0 Waste Detail
11.0 Vegetation
9.0 Operational Offroad
Equipment Type Number Hours/Day Days/Year Horse Power Load Factor Fuel Type
10.0 Stationary Equipment
Fire Pumps and Emergency Generators
Equipment Type Number Hours/Day Hours/Year Horse Power Load Factor Fuel Type
Boilers
Equipment Type Number Heat Input/Day Heat Input/Year Boiler Rating Fuel Type
User Defined Equipment
Equipment Type Number
CalEEMod Version: CalEEMod.2016.3.2 Date: 2/13/2019 2:33 PMPage 15 of 15
Ramona and Indian Warehouse (Operations) - Riverside-South Coast County, Winter

Indian and Ramona Warehouse Air Quality Impact Analysis
11705-05 AQ Report
This page intentionally left blank

Indian and Ramona Warehouse Air Quality Impact Analysis
11705-05 AQ Report
APPENDIX 3.3:
LST THRESHOLDS

Acres 2 5 3.5 25
25 170 270 220
50 200 302 251
25 882 1,577 1,230
50 1,262 2,178 1,720
Acres 2 5 3.5 57
50 20 40 30
100 38 59 49
50 6 10 8
100 10 16 13
Acres 2 5 4 25
25 170 270 237
50 200 302 268
25 882 1,577 1,345
50 1,262 2,178 1,873
Acres 2 5 4.0 57
50 20 40 33
100 38 59 52
50 6 10 9
100 10 16 14
Acres 5 25
25 270
50 302
25 1,577
50 2,178
Acres 5 57
50 10
100 14
50 3
100 4
NOX 82 Feet
CO 25 Meters
25 Meters
PM10 187 Feet
PM2.5 57 Meters
57 Meters
Linear Regression Threshold Estimate for Industrial and Commercial
SRA 24
PM10 33
PM2.5 9
Site Preparation
NOX 220
CO 1,230
PM10 36
PM2.5 9
Grading
NOX 237
CO 1,345
Operations
PM10 11
PM2.5 3
NOX 270
CO 1,577
Notes
Nearest Sensitive Receptor Dist.
Receptor Distance Used for LST
Nearest Sensitive Receptor Dist.
Receptor Distance Used for LST
Google Maps
Noise Report