india strategy -...
TRANSCRIPT
Pralay Das •[email protected] • +91 22 4062 6808
Ashish Kumar •[email protected] • +91 22 4062 6836
Glo
bal
Mar
kets
Res
earc
h
Elara Securities (India) Private Limited
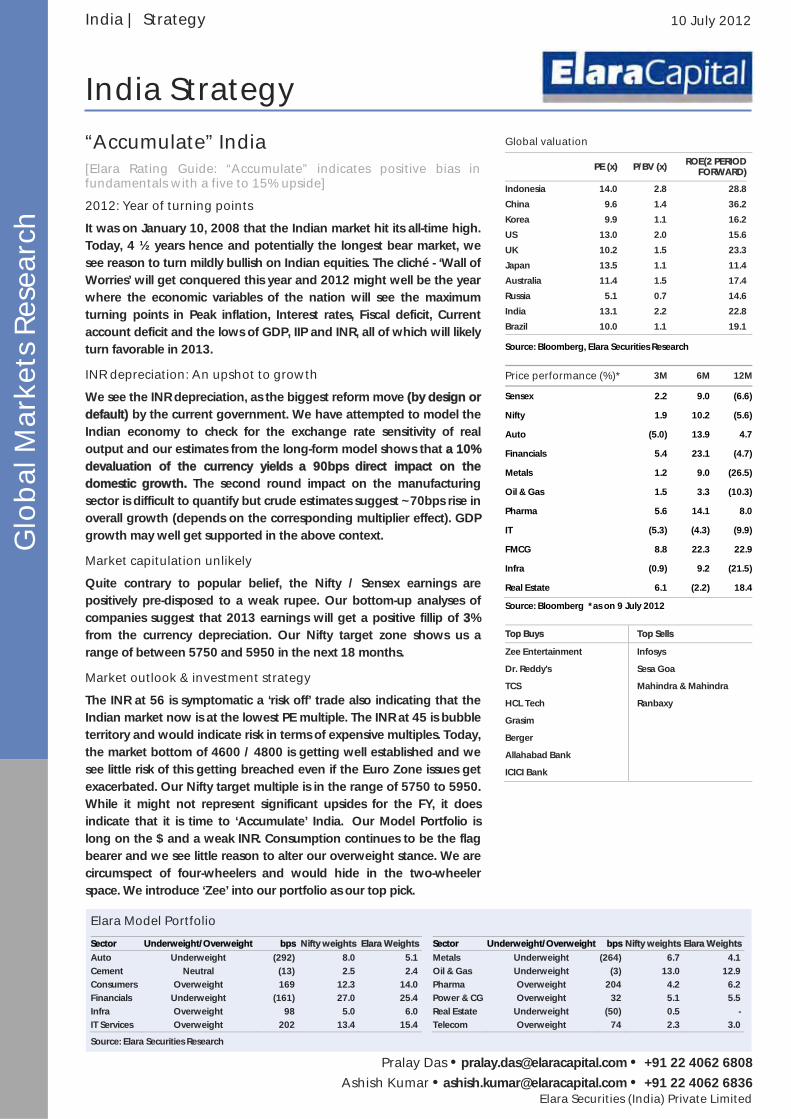
“Accumulate” India [Elara Rating Guide: “Accumulate” indicates positive bias in fundamentals with a five to 15% upside]
2012: Year of turning points
It was on January 10, 2008 that the Indian market hit its all-time high. Today, 4 ½ years hence and potentially the longest bear market, we see reason to turn mildly bullish on Indian equities. The cliché - ‘Wall of Worries’ will get conquered this year and 2012 might well be the year where the economic variables of the nation will see the maximum turning points in Peak inflation, Interest rates, Fiscal deficit, Current account deficit and the lows of GDP, IIP and INR, all of which will likely turn favorable in 2013.
INR depreciation: An upshot to growth
We see the INR depreciation, as the biggest reform move (by design or default) by the current government. We have attempted to model the Indian economy to check for the exchange rate sensitivity of real output and our estimates from the long-form model shows that a 10% devaluation of the currency yields a 90bps direct impact on the domestic growth. The second round impact on the manufacturing sector is difficult to quantify but crude estimates suggest ~70bps rise in overall growth (depends on the corresponding multiplier effect). GDP growth may well get supported in the above context.
Market capitulation unlikely
Quite contrary to popular belief, the Nifty / Sensex earnings are positively pre-disposed to a weak rupee. Our bottom-up analyses of companies suggest that 2013 earnings will get a positive fillip of 3% from the currency depreciation. Our Nifty target zone shows us a range of between 5750 and 5950 in the next 18 months.
Market outlook & investment strategy
The INR at 56 is symptomatic a ‘risk off’ trade also indicating that the Indian market now is at the lowest PE multiple. The INR at 45 is bubble territory and would indicate risk in terms of expensive multiples. Today, the market bottom of 4600 / 4800 is getting well established and we see little risk of this getting breached even if the Euro Zone issues get exacerbated. Our Nifty target multiple is in the range of 5750 to 5950. While it might not represent significant upsides for the FY, it does indicate that it is time to ‘Accumulate’ India. Our Model Portfolio is long on the $ and a weak INR. Consumption continues to be the flag bearer and we see little reason to alter our overweight stance. We are circumspect of four-wheelers and would hide in the two-wheeler space. We introduce ‘Zee’ into our portfolio as our top pick.
India | Strategy 10 July 2012
India Strategy Global valuation
PE (x) P/BV (x) ROE(2 PERIOD FORWARD)
Indonesia 14.0 2.8 28.8
China 9.6 1.4 36.2
Korea 9.9 1.1 16.2
US 13.0 2.0 15.6
UK 10.2 1.5 23.3
Japan 13.5 1.1 11.4
Australia 11.4 1.5 17.4
Russia 5.1 0.7 14.6
India 13.1 2.2 22.8
Brazil 10.0 1.1 19.1
Source: Bloomberg, Elara Securities Research
Price performance (%)* 3M 6M 12M
Sensex 2.2 9.0 (6.6)
Nifty 1.9 10.2 (5.6)
Auto (5.0) 13.9 4.7
Financials 5.4 23.1 (4.7)
Metals 1.2 9.0 (26.5)
Oil & Gas 1.5 3.3 (10.3)
Pharma 5.6 14.1 8.0
IT (5.3) (4.3) (9.9)
FMCG 8.8 22.3 22.9
Infra (0.9) 9.2 (21.5)
Real Estate 6.1 (2.2) 18.4
Source: Bloomberg *as on 9 July 2012
Top Buys Top Sells
Zee Entertainment Infosys
Dr. Reddy's Sesa Goa
TCS Mahindra & Mahindra
HCL Tech Ranbaxy
Grasim
Berger
Allahabad Bank
ICICI Bank
Elara Model Portfolio
Sector Underweight/Overweight bps Nifty weights Elara Weights
Auto Underweight (292) 8.0 5.1
Cement Neutral (13) 2.5 2.4
Consumers Overweight 169 12.3 14.0
Financials Underweight (161) 27.0 25.4
Infra Overweight 98 5.0 6.0
IT Services Overweight 202 13.4 15.4
Sector Underweight/Overweight bps Nifty weights Elara Weights
Metals Underweight (264) 6.7 4.1
Oil & Gas Underweight (3) 13.0 12.9
Pharma Overweight 204 4.2 6.2
Power & CG Overweight 32 5.1 5.5
Real Estate Underweight (50) 0.5 -
Telecom Overweight 74 2.3 3.0
Source: Elara Securities Research

India Strategy
2 Elara Securities (India) Private Limited
India Macro Outlook
Units FY05 FY06 FY07 FY08 FY09 FY10 FY11 FY12 FY13
Real economy
Nominal GDP INR bn 32,422 36,934 42,947 49,871 56,301 64,574 76,741 88,558 101,133
YoY (%) 14.2 13.9 16.3 16.1 12.9 14.7 18.8 15.4 14.2
USD bn 721 834 948 1,239 1,226 1,362 1,684 1,847 1,883
GDP per capita INR 27,286 30,656 35,234 40,264 45,958 52,086 60,339 68,491 77,054
USD 607 692 778 1,001 1,001 1,099 1,324 1,428 1,435
Real GDP YoY (%) 7.0 9.5 9.6 9.3 6.7 8.4 8.4 6.5 6.1
Demand side
Private consumption YoY (%) 5.2 8.6 8.5 9.4 7.2 7.2 8.1 5.5 6.1
Public consumption YoY (%) 4.0 8.9 3.8 9.6 10.4 14.3 7.8 5.1 5.6
Gross capital formation YoY (%) 31.7 16.3 15.3 17.2 (1.6) 11.6 11.1 5.3 7.4
Gross fixed capital formation YoY (%) 24.0 16.2 13.8 16.2 3.5 6.8 7.5 5.5 7.1
Supply side
Agriculture YoY (%) 0.2 5.1 4.2 5.8 0.1 1.0 7.0 2.8 2.5
Industry YoY (%) 9.8 9.7 12.2 9.7 4.4 8.4 7.2 3.4 3.9
Services YoY (%) 8.1 10.9 10.1 10.3 10.0 10.5 9.3 8.9 8.0
Demographics
Population million 1,089 1,106 1,122 1,138 1,154 1,170 1,186 1,202 1,218
YoY (%) 1.6 1.6 1.4 1.4 1.4 1.3 1.4 1.3 1.3
Prices
WPI (annual average) YoY (%) 6.5 4.4 6.5 4.8 8.1 3.6 9.9 8.9 7.7
CPI (annual average) YoY (%) 3.8 4.4 6.7 6.2 9.1 12.4 10.4 8.4 8.9
INR-USD (EOP)
43.8 44.6 43.6 40.0 50.9 45.1 44.7 51.2 54.3
INR-USD (annual average)
44.9 44.3 45.3 40.2 45.9 47.4 45.6 48.0 53.7
Depreciation (%) (2.1) (1.5) 2.3 (11.1) 14.1 3.3 (3.9) 5.2 12.0
Money markets
Credit growth YoY (%) 26.7 39.6 28.5 23.0 17.8 17.1 21.3 16.8 15.1
Deposit growth YoY (%) 10.8 23.4 23.8 22.4 19.9 17.2 15.9 13.5 14.2
Money Supply (M3) YoY (%) 12.3 21.2 21.3 21.4 19.3 16.9 16.1 12.9 14.0
Policy rates
Repo rate (EOP)
6.00 6.50 7.75 7.75 5.00 5.00 6.75 8.50 7.75
Reverse repo rate (EOP)
4.75 5.50 6.00 6.00 3.50 3.50 5.75 7.50 6.75
CRR (EOP)
5.00 5.00 6.00 7.50 5.00 5.75 6.00 4.75 3.50
External interactions
Exports USD bn 85.2 105.2 128.9 166.2 189.0 182.4 250.5 309.8 372.7
YoY (%) 28.5 23.4 22.6 28.9 13.7 (3.5) 37.3 23.7 20.3
Imports USD bn 118.9 157.1 190.7 257.6 308.5 300.6 381.1 499.5 579.5
YoY (%) 48.6 32.1 21.4 35.1 19.8 (2.6) 26.7 31.1 16.0
Trade deficit USD bn (33.7) (51.9) (61.8) (91.5) (119.5) (118.2) (130.6) (189.8) (206.8)
Current account balance USD bn (2.5) (9.9) (9.6) (15.7) (27.9) (38.2) (45.9) (78.2) (74.3)
% to GDP (0.4) (1.2) (1.0) (1.3) (2.3) (2.8) (2.7) (4.2) (3.9)
Capital Account USD bn 28.0 25.5 45.2 106.6 7.4 51.6 62.0 67.8 70.6
% to GDP 3.9 3.0 4.7 8.6 0.5 3.8 3.7 3.6 3.7
Fiscal deficits
Centre % to GDP 3.9 4.0 3.3 2.5 6.0 6.4 4.9 5.9 5.4
State % to GDP 3.2 2.3 1.7 1.7 2.5 3.0 2.7 2.3 2.7
Combined % to GDP 7.1 6.3 5.0 4.3 8.5 9.5 7.6 8.2 8.1
Savings Investments
Savings % to GDP 32.4 33.4 34.6 36.8 32.0 33.8 32.3 33.1 33.4
Capital formation % to GDP 32.5 34.3 35.9 38.0 35.5 36.1 35.8 35.5 36.1
Source: CMIE, CSO, RBI, Ministry of Finance, Elara Securities Research

India Strategy
Stra
teg
y
3 3 Elara Securities (India) Private Limited
FY12: year of turning points Much has been said about the deteriorating macro outlook in the last four quarters. The key question, however, is timing the trough of the current downturn in the business cycle. As some high frequency data suggest, the economy might not be there as yet and stagnancy at current levels cannot be ruled out. However, the current macroeconomic equilibrium suggests that FY13 could indeed be characterized by the year of turning points. Amidst as much pessimism that the street is into right now, we identify sluggishness in key macro variables from present levels as the greater
possibility rather than further deterioration. US economy has shown early signs of a modest recovery and that is a benign sign for the India in view of the strong synchronization with the US business cycle.
On the growth front, our rather morose estimate of FY13 growth at 6.1% could have some downward bias as possibility of a sudden reversal in the policy environment remains low in addition to the risk of a less than normal monsoon. However, FY14 could see some recovery on the back of low base and increased government spending in the run-up to general elections in 2014.
Exhibit 1: Movement in real GDP Exhibit 2: Movement in inflation
Source: CSO, Elara Securities Research Source: Office of Economic Advisor, Elara Securities Research Exhibit 3: Movement in CAD Exhibit 4: Movement in fiscal deficits
Source: CSO, RBI, CMIE, Elara Securities Research Source: CSO, Indiabudget, CMIE, Elara Securities Research
Exhibit 5: Movement in INR-USD exchange rate Exhibit 6: Movement in policy rates
Source: RBI, Elara Securities Research Source: RBI, Elara Securities Research
6.2
6.1
6.7
5.0
5.5
6.0
6.5
7.0
7.5
8.0
8.5
9.0
FY10 FY11 FY12 FY13E FY14E
(%)
7.7
0
2
4
6
8
10
12
FY10 FY11 FY12 FY13E
(%)
3.9
2.0
2.5
3.0
3.5
4.0
4.5
FY09 FY10 FY11 FY12 FY13E
(% to
GD
P)
5.4
3.0
3.5
4.0
4.5
5.0
5.5
6.0
6.5
7.0
FY09 FY10 FY11 FY12 FY13E
(% to
GD
P)
40
44
48
52
56
60
Jan
-09
Jul-0
9
Jan
-10
Jul-1
0
Jan
-11
Jul-1
1
Jan
-12
Jul-1
2
Jan
-13
7.756.75
0
2
4
6
8
10
FY09 FY10 FY11 FY12 FY13E
(%)
Repo Rate Reverse Repo Rate
India Strategy
4 Elara Securities (India) Private Limited
Inflation in India will have to settle at a new tolerance and in this context, our forecast for inflation (FY13E at 7.7% YoY compared to 8.9% YoY in FY12) over FY13 could provide some breather. Inflation is the key concern for the India economy and the solvable part of it can only be addressed through supply side measures. The best contribution that the central bank can make to the India growth story is to deliver a low and stable inflation. There is lot of sense when RBI observes that … there are several factors responsible for the slowdown in activity, particularly in investment, with the role of interest rates being relatively small …
In this context, role of central bank gets limited as significant inflationary risks remaining in the economy. As such, any expectations from monetary policy to stimulate growth are untenable. In our base case, we maintain our stance of no policy rate cut in the rest of CY 2012 as the inflation is likely to inch higher in coming months leaving little space for the central bank to show complacency. On the flip side, the chances of further monetary tightening are less likely now. Left to itself, central bank will hold on rates for CY12 in all likelihood.
On the twin deficits front, current account balance could improve on two counts. With the sharp fall in crude prices (which comprises ~30% of import bill), the dollar bills of imports would see sustained fall. Gold imports have shown early signs of a contraction on the back of recent measures to curb these imports coupled with a depreciating INR. Together, these two factors will likely stem the weakness on the CAD front. We estimate CAD at USD 74.3bn (3.9% of GDP) compared to USD 78.2bn (4.2% of GDP). Ideally, a weak currency should have helped lower the CAD significantly by making exports competitive and imports costlier but due to low elasticity, it could take time to adjust with the new level of INR (which itself is highly volatile for any smooth adjustment). The extent of volatility in the depreciation could also impact incremental inflows that would have come on the back of a weak currency and in turn could lead to extended weakness in the currency. Our 3-, 6-, 9-, 12-month targets (EOP) for the INR-USD exchange rate are at 54.7, 53.9, 53.7 and 54.3.
Further on the fiscal front, there was a low expectation from the government given its historical behavior of fiscal profligacy. However, some development in and post budget 2012 could put the tap on fiscal leakage like FY12. The fuel subsidies have been budgeted at a reasonable level and falling crude prices could only help it contain further. It also depends on the quantum of price transmission that is seen in the fuel prices over coming months. With an already huge borrowing program, a situation of additional borrowing mid-fiscal (like last year) is less likely. We estimate fiscal deficit at
5.4% of GDP over FY12, a slight improvement over the 5.9% in FY12.
INR depreciation: The last lever Misplaced concerns on INR front
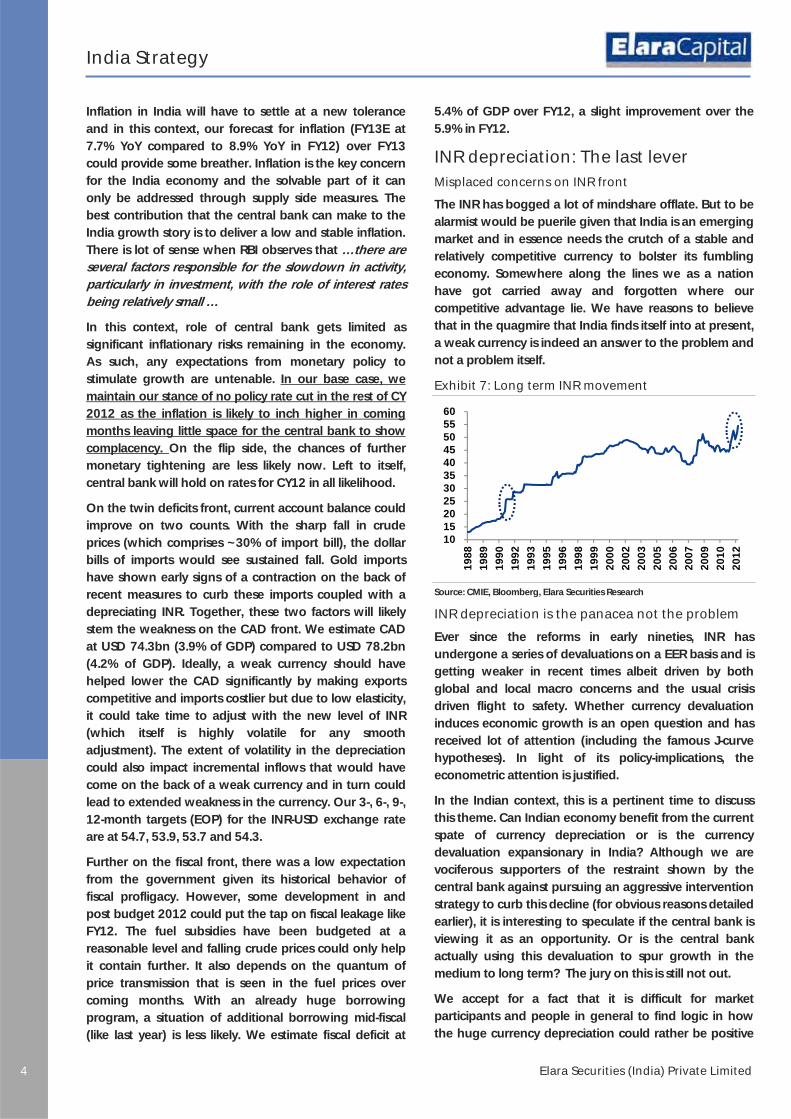
The INR has bogged a lot of mindshare offlate. But to be alarmist would be puerile given that India is an emerging market and in essence needs the crutch of a stable and relatively competitive currency to bolster its fumbling economy. Somewhere along the lines we as a nation have got carried away and forgotten where our competitive advantage lie. We have reasons to believe that in the quagmire that India finds itself into at present, a weak currency is indeed an answer to the problem and not a problem itself.
Exhibit 7: Long term INR movement
Source: CMIE, Bloomberg, Elara Securities Research
INR depreciation is the panacea not the problem
Ever since the reforms in early nineties, INR has undergone a series of devaluations on a EER basis and is getting weaker in recent times albeit driven by both global and local macro concerns and the usual crisis driven flight to safety. Whether currency devaluation induces economic growth is an open question and has received lot of attention (including the famous J-curve hypotheses). In light of its policy-implications, the econometric attention is justified.
In the Indian context, this is a pertinent time to discuss this theme. Can Indian economy benefit from the current spate of currency depreciation or is the currency devaluation expansionary in India? Although we are vociferous supporters of the restraint shown by the central bank against pursuing an aggressive intervention strategy to curb this decline (for obvious reasons detailed earlier), it is interesting to speculate if the central bank is viewing it as an opportunity. Or is the central bank actually using this devaluation to spur growth in the medium to long term? The jury on this is still not out.
We accept for a fact that it is difficult for market participants and people in general to find logic in how the huge currency depreciation could rather be positive
10 15 20 25 30 35 40 45 50 55 60
19
88
19
89
19
90
19
92
19
93
19
95
19
96
19
98
19
99
20
00
20
02
20
03
20
05
20
06
20
07
20
09
20
10
20
12

India Strategy
Stra
teg
y
5 5 Elara Securities (India) Private Limited
for India. It needs to be understood that in the quagmire that India finds itself into at present, a weak currency is indeed an answer to the problem and not a problem itself. Our long term model of the Indian economy finds that all three of the fiscal policy, monetary policy and exchange rate policy are all expansionary in India and can be considered to be effective policy tools. However, given that more popular stabilisation tools like the fiscal and monetary policies often fall prey to political pressures in India; the exchange rate route could in fact be the only growth mechanism left.
India now has a floating ER regime
Exhibit 8: ER regime of the historical INR movement
Source: CMIE, Bloomberg, Elara Securities Research
The de jure ER regime for the INR has been a managed float since 1994. Our analysis suggests that the rupee has seen a bout of inflexibility to greater flexibility. What it means for the real economy is that in INR, India has a currency regime that could adjust to the needs of the
economy. Despite running a large and rising current account deficit (henceforth CAD), the economy as an instrument could help stabilize the CAD. In an economy like India where more popular stabilization tools like the fiscal and monetary policies often fall prey to political pressures, a floating exchange rate mechanism is the best reform to have happened over the last two decades. It provides the much needed stability in the economy in the face of likely slowdown in global demand and trade.
An upshot to growth
Impact of currency devaluation on economic growth is an open question. In the Indian context, this is a relevant theme under present circumstances. We have attempted to model the Indian economy to check for the exchange rate sensitivity of real output and our estimates from the long-form model shows that a 10% devaluation (in REER terms) of the currency yields a 90bps direct impact on the domestic growth. The second round impact on the manufacturing sector is difficult to quantify but crude estimates suggest ~70bps rise in overall growth (depends on the corresponding multiplier effect).
Previous studies on this subject have mixed results and our results are in contrast to Thompson (2010) et al who concluded that there has been no evidence of a J-curve in India and successive devaluations have had no significant long-run effect on the trade balance. In fact, the first major (and notable) devaluation in 1991 although a crisis-induced devaluation, has been
1995 2000 2005 2010
3540
4550
55
INR
-USD
Exhibit 9: Annual cycles of REER and trade balance*
Source: RBI, CMIE, Elara Securities Research * trade balance calculated as ratio of export to import.
Exhibit 10: Annual cycles of REER and GDP
Source: RBI, CSO, Elara Securities Research
(0.20)
(0.10)
0.00
0.10
0.20
(0.15)
(0.10)
(0.05)
0.00
0.05
0.10
1976 1978 1980 1982 1984 1986 1988 1990 1992 1994 1996 1998 2000 2002 2004 2006 2008 2010 2012REER Trade balance
(0.06)
(0.04)
(0.02)
0.00
0.02
0.04
0.06
(0.15)
(0.10)
(0.05)
0.00
0.05
0.10
1976 1978 1980 1982 1984 1986 1988 1990 1992 1994 1996 1998 2000 2002 2004 2006 2008 2010 2012REER Real GDP

India Strategy
6 Elara Securities (India) Private Limited
expansionary in India. The table however turns again to the stalled reforms process. 1991 saw the sharp devaluation of the currency complemented by major reforms which induced a favorable productivity shock in the economy, something whose viability right now looks difficult given the state of affairs in the political circles.
Reminiscences of 1991 mostly exaggerated
India stands nowhere close to the 1991 crisis. On the face of it, some concerns do look similar but a deeper analysis reveals that the current macroeconomic environment is different in some key respects. India is better placed on several counts and these are significant enough to make reminiscences of 1991 look mostly exaggerated.
India now has a floating exchange rate regime and this in turn provides the much needed stabilisation mechanism in the economy in the face of likely slowdown in global demand and trade. In absence of sound fiscal and monetary policies, a floating exchange rate mechanism is the best reform to have happened in the last two decades.
Unlike 1991, there are minimal sovereign risks with only ~7% of government debt placed in overseas markets at present and that limits any fallout on account of a weak currency.
India has a huge firewall in the form of its present stock of foreign reserves at USD291.8bn (including gold worth USD26.6bn), equivalent to 6-7 months of imports cover. With the central bank not very active in the currency market this time for obvious reasons, the leverage for the economy gets extended.
Exhibit 12: Trends in INR and forex reserves
Source: CMIE, Bloomberg, Elara Securities Research
US economy shows early signs of moderate recovery The latest release of GDP numbers of the US economy is encouraging. Overall growth was up 1.9% YoY in the first quarter of CY12. The benign signs emerge from a reviving personal consumption growth, equipment and residential investment. Some weakness was evident in government spending and considering the global environment, was largely anticipated. The adjoining plot shows the real domestic final sales that have slowly settled in the range of 2% YoY growth for the past six quarters. This creates a floor for an underlying forward momentum to the economy, although the pace of revival is smaller in comparison to previous recoveries. Interestingly, the same period has seen consumer spending gains coming steady at 2.0% YoY that suggests a buildup of consumer confidence with the current pace of income and job gains. Clearly, US might not be out of the woods as yet but the worst seems behind it and that is reasonably positive in wake of the gloom in global macroeconomic environment.
35
40
45
50
55
60
0
50
100
150
200
250
300
350
Feb
-00
No
v-00
Au
g-0
1M
ay-0
2Fe
b-0
3N
ov-
03A
ug
-04
May
-05
Feb
-06
No
v-06
Au
g-0
7M
ay-0
8Fe
b-0
9N
ov-
09A
ug
-10
May
-11
Feb
-12
(USD
bn
)
Forex reserves (LHS) INR-USD ER (RHS)
Exhibit 11: INR and CB intervention
Source: RBI, Elara Securities Research
30
35
40
45
50
55
(20)
(15)
(10)
(5)
0
5
10
15 2
00
1
20
01
20
01
20
02
20
02
20
02
20
03
20
03
20
03
20
04
20
04
20
04
20
05
20
05
20
05
20
06
20
06
20
06
20
07
20
07
20
07
20
08
20
08
20
08
20
09
20
09
20
09
20
10
20
10
20
10
20
11
20
11
20
11
20
12
20
12
(USD
bn
)
dollar purchase dollar sales INR-USD ER

India Strategy
Stra
teg
y
7 7 Elara Securities (India) Private Limited
Exhibit 13: Trends in US Real Domestic Final Sales
Source: Bloomberg, Elara Securities Research
Exhibit 14: US growth with NBER dates of recession
Source: Bloomberg, NBER, Elara Securities Research
A new recipe for Indian growth story: A weak rupee and US recovery Countries need to stabilise in response to external shocks. In this context, the floating exchange rate of INR is a big savior. With a weak currency, imports lose their sheen by becoming more expensive. India could witness a revival in the domestic manufacturing sector as demand for foreign goods and services are substituted by domestic supply creation in the medium to long run. In effect, a depreciating rupee makes imports less attractive and exports more competitive, thereby anchoring the domestic demand and giving a fillip to the domestic manufacturing sector. This potential rise in domestic production would result in incremental rise in employment and growth. The pass-through however is dependent on the elasticity of exports and imports. Typically, the effect could be seen only in medium to long term as exports and imports tend to inelastic in the short run.
Although India has never been a part of the popular strategy of currency devaluation led growth revival unlike China. But the current episode of depreciation indeed has a potential to structurally change the growth trajectory in India. Clearly, it could be an opportunity for India to benefit from the current depreciation and follow export led growth in contrast to the consumption led
growth that we usually boast about. Note that a consumption led growth is inherently inflationary in case it is not supplemented by capacity creations. The issue that comes back is where the need to growth lies. If the fiscal side has the will power to push through strong set of reforms and revive the investment cycle, it will result in what is called good growth, an enviable combination where domestic consumption is resilient (and non-inflationary) combined with a rising share of exports in the domestic output. Consequently, it has a potential to revive the manufacturing sector, the capex cycle, employment with low levels of CAD. Clearly, with a competitive currency and a recovering US, if policymakers have the will to govern, the India growth story is here to stay.
Ratings not earnings to set trend Looking to set a FY13 Nifty target Amidst continuing uncertainty on the macro, the consensus estimates for the Nifty and MSCI India has been cut for nearly six consecutive quarters now.
Exhibit 15: Nifty and MSCI India performance (rebased)
Source:
Exhibit 16: MSCI IN premium/discount over MSCI EM
Source: Bloomberg
An obvious fact is that downgrades in GDP have an impact on both the earnings while a reset in the forward GDP estimates has had an impact on the rating accorded to the equity markets.
(8)
(6)
(4)
(2)
0
2
4
6
8
Mar
-96
Mar
-97
Mar
-98
Mar
-99
Mar
-00
Mar
-01
Mar
-02
Mar
-03
Mar
-04
Mar
-05
Mar
-06
Mar
-07
Mar
-08
Mar
-09
Mar
-10
Mar
-11
Mar
-12
yoy
gro
wth
(%
)yo
yg
row
th(%
)
1995 2000 2005 2010
(4)
(2)
02
4
0
100
200
300
400
500
Jan
-00
Jan
-02
Jan
-04
Jan
-06
Jan
-08
Jan
-10
Jan
-12
MSCI IN MSCI EM
(50)
0
50
100
150
Jan
-00
Jan
-02
Jan
-04
Jan
-06
Jan
-08
Jan
-10
Jan
-12
MSCI IN premium/discount over MSCI EM12 yr median5 yr median

India Strategy
8 Elara Securities (India) Private Limited
Exhibit 17: GDP growth rate vs PE rating of MSCI India
Source: Elara Securities Research
Now, with the GDP numbers for the year ahead being reset, the rating for India comes into question.
Exhibit 18: FY13 GDP estimate movement
Note: Government estimates standing March 2012, RBI estimates at April 2012 and Consensus at June 2012
Source: RBI, CSO, Bloomberg and Elara Securities Estimates
We believe that the outlook now shifts to ratings rather than earnings as earnings estimates for India have possibly already taken into account the sluggish GDP numbers driven by government lethargy on policy as well as macro variables.
Exhibit 19: Growth threshold lowered
Source: Elara Securities Estimates
Exhibit 20: …as growth inflation tradeoff gets stark
Source: Elara Securities Research
Confidence on ratings lower On a relative scale, we think that after this quarter’s negative yoy growth in operating profit and PAT for the Nifty universe of stocks, consensus estimates will be closer to the bottom. While FY13 EPS numbers for the Nifty still show a 11.6% growth, (down from the estimate of 20% estimate at the beginning of 2011). The FY14 estimate (growth over FY13 numbers) stands at around 8%.
Exhibit 21: Growth rate estimates for Nifty (%)
Source: Bloomberg, Elara Securities Research
Fall in the MSCI India has been led by earnings so far
MSCI IN estimates have so far been led by earnings estimate fall rather than a fall in the ratings.
Exhibit 22: 2011 fall: earnings vs rating contribution
Source: Bloomberg
0
2
4
6
8
10
12
Mar
-96
0
5
10
15
20
GDP growth MSCI P/E (RHS)
Sep
-00
Mar
-02
Sep
-03
Mar
-05
Sep
-06
Mar
-08
Sep
-09
Mar
-11
(%)
7.67.3 7.2
6.1
5
6
7
8
Government RBI Consensus Elara
(FY1
3 g
row
th e
stim
ates
)
2
3
4
5
6
7
8
9
10
19
93
19
95
19
97
19
99
20
01
20
03
20
05
20
07
20
09
20
11
20
13
(%)
0
2
4
6
8
10
12
14
0
2
4
6
8
10
12
19
94
19
96
19
98
20
00
20
02
20
04
20
06
20
08
20
10
20
12
(%)
(%)
Real GDP growth (LHS) WPI inflation (RHS)
9.8
14.8
0
5
10
15
20
25
30
CY11
EPS estimate drop for FY13/ FY10 Rating led drop
Nifty fall 24.6%
370380390400410420430440450460
340
350
360
370
380
390
400
Jul-1
0
Sep
-10
No
v-10
Jan
-11
Mar
-11
May
-11
Jul-1
1
Sep
-11
No
v-11
Jan
-12
Mar
-12
FY12 (LHS) FY13 (RHS)
10.3% fall from CY11

India Strategy
Stra
teg
y
9 9 Elara Securities (India) Private Limited
Analyst estimates typically lag while liquidity leads
While the ratings will be a function of the global liquidity situation and some orderly form of default in Europe, a directional change in the earnings estimates will be more dependent on local factors. What are the factors that could possibly drive an uptick in the FY13/FY14 estimates? To our mind there are three broad things that could change the direction of Indian earnings estimates: 1) timing of the signaling of a change in direction of the interest rate cycle 2) proactive stance on the regulatory/fiscal stance adopted by the government, 3) continued strength in consumption through consumer staples, small ticket consumer durables and reversal of the weak trends in rate sensitive autos.
Also, as seen from the previous cycles, the impact of the rate cuts on the earnings estimates as well as the ratings in gradual and on an average it takes three cuts for the ratings / EPS to show an upward trajectory. The impending round of cuts will curtail the fall in earnings which will establish the bottom for the market.
Exhibit 23: Impact of rate cut on earnings estimates
Source: Elara Securities Research
Exhibit 24: Impact of rate cut on earnings estimates (08/09 cycle)
Source: Elara Securities Research
Exhibit 25: Impact of rate cut on earnings estimates (06/07 midcycle)
Source: Elara Securities Research
While the exhibit above shows that the impact of the cut in rates is not immediate, either on ratings or on estimates. As such, the recovery is likely to be very gradual from both the ratings perspective as well as the estimates.
Market valuations A weak INR is indicative of a risk-off trade and tight liquidity conditions. This leads to contraction in market multiples. We are of the view that Indian markets present extremely low downsides at INR 55 than at INR 44. A market at INR 44 would mean bubble valuations fuelled by high liquidity. If one were to make an assumption that the rupee has bottomed out (our in-house view is an avg of 51 in 2014) it makes a good case for foreign investors to look to ‘Accumulate’ Indian stocks sooner than later.
Exhibit 26: Market Cap to GDP ratio
Source: Bloomberg, Elara Securities Research
Valuations at 2002 trough levels
Trying to time a market bottom based on PE multiples would be risky as seen in 2008. This is a moving variable and as much dependent on ‘E’ than the ‘P’ in the equation. Infact, the ‘E’ is always a difficult to variable to pin down when the macro is constantly evolving. We are more comfortable with the Market-Cap to GDP approach
0
5
10
15
20
25
30
35
Jan
-00
Jan
-01
Jan
-02
Jan
-03
Jan
-04
Jan
-05
Jan
-06
Jan
-07
Jan
-08
Jan
-09
Jan
-10
Jan
-11
Jan
-12
Rate cut Rate cut
240250260270280290300310320330
Jan
-08
Feb
-08
Mar
-08
Ap
r-0
8
May
-08
Jun
-08
Jul-0
8
Au
g-0
8
Sep
-08
Oct
-08
No
v-08
Dec
-08
Jan
-09
First rate cut behind other Central banks
Third in the cycle
Second rate cut but estimates still falling
180
190
200
210
220
230
Jan
-06
Feb
-06
Mar
-06
Ap
r-0
6
May
-06
Jun
-06
Jul-0
6
Au
g-0
6
Sep
-06
Oct
-06
No
v-06
Dec
-06
Jan
-07
Feb
-07
Rate cycle pauses
Rates hiked
1,000
2,000
3,000
4,000
5,000
6,000
7,000
0
50
100
150
200
Sep
-03
May
-04
Jan
-05
Sep
-05
May
-06
Jan
-07
Sep
-07
May
-08
Jan
-09
Sep
-09
May
-10
Jan
-11
Sep
-11
May
-12
(%)
Market Capitalization to GDP ratio for India (LHS)Nifty (RHS)
India Strategy
10 Elara Securities (India) Private Limited
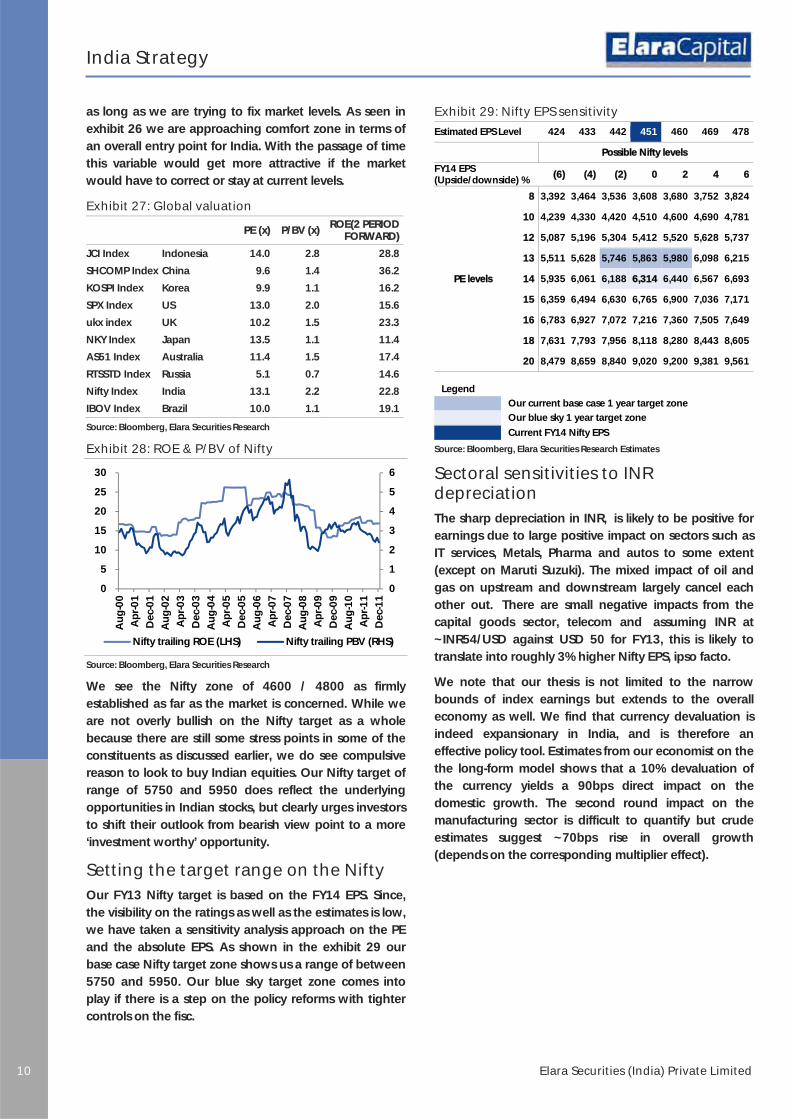
as long as we are trying to fix market levels. As seen in exhibit 26 we are approaching comfort zone in terms of an overall entry point for India. With the passage of time this variable would get more attractive if the market would have to correct or stay at current levels.
Exhibit 27: Global valuation
PE (x) P/BV (x) ROE(2 PERIOD
FORWARD)
JCI Index Indonesia 14.0 2.8 28.8
SHCOMP Index China 9.6 1.4 36.2
KOSPI Index Korea 9.9 1.1 16.2
SPX Index US 13.0 2.0 15.6
ukx index UK 10.2 1.5 23.3
NKY Index Japan 13.5 1.1 11.4
AS51 Index Australia 11.4 1.5 17.4
RTSSTD Index Russia 5.1 0.7 14.6
Nifty Index India 13.1 2.2 22.8
IBOV Index Brazil 10.0 1.1 19.1
Source: Bloomberg, Elara Securities Research
Exhibit 28: ROE & P/BV of Nifty
Source: Bloomberg, Elara Securities Research
We see the Nifty zone of 4600 / 4800 as firmly established as far as the market is concerned. While we are not overly bullish on the Nifty target as a whole because there are still some stress points in some of the constituents as discussed earlier, we do see compulsive reason to look to buy Indian equities. Our Nifty target of range of 5750 and 5950 does reflect the underlying opportunities in Indian stocks, but clearly urges investors to shift their outlook from bearish view point to a more ‘investment worthy’ opportunity.
Setting the target range on the Nifty Our FY13 Nifty target is based on the FY14 EPS. Since, the visibility on the ratings as well as the estimates is low, we have taken a sensitivity analysis approach on the PE and the absolute EPS. As shown in the exhibit 29 our base case Nifty target zone shows us a range of between 5750 and 5950. Our blue sky target zone comes into play if there is a step on the policy reforms with tighter controls on the fisc.
Exhibit 29: Nifty EPS sensitivity
Estimated EPS Level 424 433 442 451 460 469 478
Possible Nifty levels
FY14 EPS (Upside/downside) % (6) (4) (2) 0 2 4 6
PE levels
8 3,392 3,464 3,536 3,608 3,680 3,752 3,824
10 4,239 4,330 4,420 4,510 4,600 4,690 4,781
12 5,087 5,196 5,304 5,412 5,520 5,628 5,737
13 5,511 5,628 5,746 5,863 5,980 6,098 6,215
14 5,935 6,061 6,188 6,314 6,440 6,567 6,693
15 6,359 6,494 6,630 6,765 6,900 7,036 7,171
16 6,783 6,927 7,072 7,216 7,360 7,505 7,649
18 7,631 7,793 7,956 8,118 8,280 8,443 8,605
20 8,479 8,659 8,840 9,020 9,200 9,381 9,561
Legend Our current base case 1 year target zone
Our blue sky 1 year target zone
Current FY14 Nifty EPS
Source: Bloomberg, Elara Securities Research Estimates
Sectoral sensitivities to INR depreciation The sharp depreciation in INR, is likely to be positive for earnings due to large positive impact on sectors such as IT services, Metals, Pharma and autos to some extent (except on Maruti Suzuki). The mixed impact of oil and gas on upstream and downstream largely cancel each other out. There are small negative impacts from the capital goods sector, telecom and assuming INR at ~INR54/USD against USD 50 for FY13, this is likely to translate into roughly 3% higher Nifty EPS, ipso facto.
We note that our thesis is not limited to the narrow bounds of index earnings but extends to the overall economy as well. We find that currency devaluation is indeed expansionary in India, and is therefore an effective policy tool. Estimates from our economist on the the long-form model shows that a 10% devaluation of the currency yields a 90bps direct impact on the domestic growth. The second round impact on the manufacturing sector is difficult to quantify but crude estimates suggest ~70bps rise in overall growth (depends on the corresponding multiplier effect).
0
1
2
3
4
5
6
0
5
10
15
20
25
30
Au
g-0
0
Ap
r-0
1
Dec
-01
Au
g-0
2
Ap
r-0
3
Dec
-03
Au
g-0
4
Ap
r-0
5
Dec
-05
Au
g-0
6
Ap
r-0
7
Dec
-07
Au
g-0
8
Ap
r-0
9
Dec
-09
Au
g-1
0
Ap
r-1
1
Dec
-11
Nifty trailing ROE (LHS) Nifty trailing PBV (RHS)

India Strategy
Stra
teg
y
11 11 Elara Securities (India) Private Limited
Exhibit 30: Sector wise breakup of impact of depreciation on earnings
Sector Comments
Metals In non ferrous, realizations pegged to LME linked pricing, a direct beneficiary of the currency while majority of the costs denominated in INR, hence EBITDA margins might expand on depreciation. Most of the companies have capex planned within the country, hence there is little pressure on cash flows on account of currency movements. While, the Indian steel players would suffer on rupee depreciation as a major component of their costs are denominated in USD (coking coal imports). While their realizations are denominated in INR and have been decoupled to an extent from the global steel prices, due to lower capacity utilizations. On a net basis, metals will have a slightly positive impact as far as Nifty composition goes.
Oil and gas Oil and gas has an outright positive impact as all the constituents (barring the PSU OMCs), integrated player RIL, upstream plays of Cairn and ONGC. If INR averages 55/60 for the whole FY13, the EPS upside can be 13/19%. Weaker INR will also help in higher gas realisations in INR terms for RIL and upstream PSUs. Cairn will have a positive EPS impact of 16%/30% on FY13 EPS in case of INR55/60. Currently, Cairn is factoring in USD95/bbl LT oil price For BPCL, the only Nifty oil and gas stock with a negative impact due to weak INR, though the under-recoveries will mount, the actual impact will be more through the interim stress on the B/S and high interest costs. On an overall level, the sectoral impact is positive.
Pharma Pharmaceuticals have a general positive impact because of its business model whereby there is foreign currency denominated exports improve on exchange rate. Cipla and Sun Pharma have the maximum positive earnings impact while other stocks in the Nifty basket also have a positive impact
Auto Other than Maruti's, it is net importer to the tune of ~22% of net sales and has its FY13E and FY14E exposure largely unhedged), all other auto stocks in the Nifty have a positive impact from depreciation. While Bajaj Auto has substantial exports revenues, it has already hedged 70%-85% of its exports at INR51 for FY13E and INR54-55 for FY14E. Tata Motors will impact from the currency translation.
FMCG The biggest beneficiaries of INR depreciation are Dabur and marginally ITC while losers are HUL and Asian Paints. However, simultaneous correction in commodities which are $ denominated like crude and its derivatives (palm oil, chemicals) negates the impact of INR depreciation (Scenario playing out currently). However, FMCG companies often hedge/cover their payables/receivables and also transactions are across currencies/geographies - not always US$ denominated. Hence, impact may not exactly play out as illustrated above (have assumed all transactions as US$ denominated for simplicity purpose). Also, FMCG companies manage such impact via price hikes/ cost efficiencies and hence, the negative transmission of depreciation will be negated.
IT services Every percentage depreciation on the INR impacts the margins of the IT services Companies anywhere between 25 to 40bps. Moving the INR USD assumption for FY13 from 50 to 54 impacts the FY13 EPS positively by around 18%, the highest within our coverage universe. The next highest beneficiary is Infosys is around 12% closely followed by TCS and Wipro. However, there is a negative impact on the USD revenue reporting as the USD has been strong against corresponding currencies like EUR, AUD, and GBP. The least amount of positive impact within our coverage universe is on Mphasis (INR denominated rate card billing and demestic revenue) and Tech Mahindra. Over the longer term however (2 to 4 years), there might be some adjustment in the billing rates if the depreciation persists, particularly if the poor demand outlook in the developed world remains.
Source: NSE, Elara Securities Research

India Strategy
12 Elara Securities (India) Private Limited
Elara Model Portfolio Getting more selective We hold on to the same set of guideposts for our model portfolio in the sense that we limit ourselves to non-Nifty names that are above a certain size in free float market capitalization. On the macro front, though we are looking at a mild recovery in 2HFY13, we think that select financials might just have run ahead of themselves with RBI having limited headroom to further cut rates. The only interest sensitive we are keeping in our portfolio are autos where we are banking on MSIL, Tata Motors and HMCL. On the domestic demand front, we have stayed OW on certain media names and consumption names, select infrastructure names with a bottom up story rather than banking on a tide that will lift all.
Autos
In the consumer discretionary segment, we would still side with the two wheelers ahead of the four wheeler story as we think that the inflation upcycle has been pushed out further and given the subsidies number, a another couple of rounds of fuel price hikes are in order. Given that 70% of two wheelers are owned in cash, fuel price hikes will be likely to impact the four wheeler segment more. However, within this broad macro overlay, we have a preference for Hero Honda as we have more comfort with volumes. We see some pressures on domestic demand for Bajaj Auto. New launches will drive 76% of the volumes for MSIL in FY13. Margin levers will work for MSIL and Tata Motors based on operating levers kicking in while Mahindra and Mahindra stands to lose on margins as automotive segment gains in the product mix. MSIL and Tata Motors also benefits from a weak currency, the base case in our assumptions. However, we have a negative view on Europe and with China headline numbers coming off, we marginally UW Tata Motors. We choose to do away with Mahindra and Mahindra altogether from the portfolio as low demand headroom on tractor sales and peaking out of the drivers put a cap on tractor demand.
Exhibit 31: Maruti makes the highest EBIT margin gains
Source: Elara Securities Estimates
Consumption
We do not expect the macro backdrop of high revenue expenditure and a weak investment cycle to change course in the next 18 months. The upwards revisions in MSPs, impending state elections in 2012 and general elections in 2014 would mean that India’s economic construct will remain unaltered for some time now making a bull-case for consumption-led stocks. However, we note that valuations are full in the three Nifty names in consumption. From a bottom up view, we play the consumption story through Berger Paints and Zee. Berger’s consistent performance, margin improvement through mix changes and overall market share gain support the story.
Metals
We choose to stay underweight on the sector as we look to steer clear of any and all stocks that are a contingent play on the government getting its act together. On Hindalco, however, we have visibility on capacity additions in aluminum which makes us keep a positive view. In JSP as well, linkages for existing power plants (13,000 MW) and poor state of power industry in general, makes us cautious. We have chosen not to keep SAIL, Sesa Goa and Sterlite in our portfolio. Execution and regulation and sundry other uncertainties dog these stocks. While Sesa Goa is facing an export ban, SAIL’s expansion plans are either delayed or cancelled. Uncertainty on the Sterlite consolidation will create visibility issues for the stock. We include Hindustan Zinc (non Nifty) on strong volume visibility and lower cost of operations.
Oil and Gas
We stay very close to the index weights in the sector. While we see incremental hikes in petrol and diesel prices going forward, any expectations of a big bang approach are likely to be disappointed. Our UW stance on Cairn is led by our concerns on global demand led by Europe and China and we work with a base case of weak Brent prices. We are UW on RIL as fundamentals of both E&P and refineries stay weak. Similarly, we maintain a marginal UW on GAIL on flattish earnings and lack of volume growth due to stagnant demand. ONGC is also an UW as concerns on high under-recoveries, under-funding in the budget and concerns on OVL and the recent runup. Among the downstream players, we remain positive on BPCL but based on high potential E&P block in Mozambique/Brazil which we believe, will be valued by the Street over an extended period of 4 quarters.
313
16
(20)(50)0
50 100 150 200 250 300 350
Maruti JLR M&M

India Strategy
Stra
teg
y
13 13 Elara Securities (India) Private Limited
Banking
Since the last three months or so, there has been a major downgrade in both the growth and monetary policy expectations. The hope for banks was that asset quality issues would be offset by growth in the economy which has been now belied. With the macro looking worse, the asset cycle turnaround has definitely been pushed out. We expect a downgrade in the consensus earnings for FY13 after the Q4FY13 results. On an overall basis, we stick to our preference for private banks over public ones on better earnings visibility, limited downside on the asset cycle and higher risk adjusted spreads (over PSUs).
Exhibit 32: Private banks have higher risk adjusted spreads
Source: Company data
In the Nifty basket our major OW is ICICI Bank where our analyst is positive on the return ratios getting back into double digits for FY13. The bank is trading at the lower end of the 5 year historical range in terms of valuations. Among the larger PSUs, SBIN has regained in the last 6 months the underperformance its showed in first half of the fiscal. The valuations do not completely reflect the potential risks from continued asset quality deterioration and related costs. Inspite of its strong franchise HDFC Bank remains an UW on valuations as we look to add some beta in the finacials part of our portfolio. Axis Bank remains another OW with its we expect increasing retail contribution will help Axis Bank post class-leading RoA’s of 1.7% in FY13E & FY14E and marked under performance over Bankex in the last 3 months. We have chosen to stay out of KMB and IDFC (on their exposure to power and infrastructure). On the non-Nifty banks Allahabad Bank and Bank of India are stocks we introduce in the portfolio. Indusind is a strong management driven franchise which has effected an impressive improvement in ROA, a story set to continue into FY14. Indusind Bank, a play on good asset quality inspite of negative asset quality cycles, is on our watchlist and the only reason it is not included for now is its strong stock price performance lately.
IT Services
IT services is more of a default overweight in our portfolio for the want of choices. The tepid view in absolute terms is borne out by current premium valuations over the market, imminent rhetoric on outsourcing as the US presidential election campaign gains momentum and an overall cut in spending in the key vertical of BFSI. While our negative calls on Infosys and Wipro have mostly played out, we are confident of our FY13 estimates and valuations on these estimates do not warrant a change in stance to bullish one. However, even in the case of Infosys (the best play on currency), we stay rather close to market weight given that our base case is that of a weak currency for some time. We remain positive on TCS on its cost takeout franchise, low discretionary exposure and a scale player set to benefit from Infosys’ woes. However, our OW on TCS is tempered by current valuations. HCL Tech is however, an aggressive OW as they look to execute deal wins in the next two quarters and a see it shifting track to Tier-1 valuations on the lines of CTSH over the next 5 years.
Pharmaceuticals
Pharma remains one of our biggest overweights with a huge number approvals slated to be coming on in 2012 as a number of blockbuster drugs are going off patent with a market size of around USD 40bn to USD 50bn. Cipla remains our biggest overweight though our analyst expects most of the approvals to come in the back half of the year. Dr. Reddy’s has run up lately but we still choose to stay positive on the back of very strong pipeline. We are equal weight on Sun Pharma as after the run-up, most positives and approvals are already in the price. We exclude Ranbaxy from the portfolio as stiff valuations factor in a recovery in the core segment, which we believe is going to get pushed out. We include a non Nifty name in Glenmark, as core business visibility in US is strong.
Cement
We are OW on cement mainly through our exposure in Grasim. We find the valuations attractive while VSF prices have bottomed out. Strong cement demand is also likely to positively impact the stock. We stay out of Ambuja on premium valuations. On ACC, we are OW inspite of high valuations on higher presence in the eastern region. Demand supply in the eastern segment is favorable for ACC with a few competitor plants shut for competitive reasons.
7
8
9
10
11
12
13
FY0
6
FY0
7
FY0
8
FY0
9
FY1
0
FY1
1
FY1
2E
FY1
3E
FY1
4E
PSU banks Private banks

India Strategy
14 Elara Securities (India) Private Limited
Exhibit 33: Elara Model Portfolio Company Nifty weights Elara Weights Prices (9 July, 2012) Bajaj Auto 1.3 - 1,506 Hero Honda 1.2 1.5 2,027 Mahindra & Mahindra 2.0 - 730 Maruti Suzuki 0.9 1.5 1,188 Tata Motors
2.6 2.1 241
Auto Total Underweight
8.0 5.1
ACC 0.7 0.7 1,280 Ambuja 0.8 168 Grasim 1.0 1.7 2,634 Cement Total Neutral 2.5 2.4 Hindustan Unilever
2.9 3.0 444
ITC
8.4 8.0 252 Zee 2.0 145 Berger Paints 1.0 133 Asian Paints 1.1 3,683 Consumers Total Overweight 12.3 14.0 Bank of Baroda
0.8 - 710
Axis Bank
1.6 3.0 1,036 HDFC 5.9 6.1 676 HDFC Bank 6.1 5.5 578 ICICI Bank 6.2 7.0 930 IDFC 1.0 - 140 Kotak Mahindra Bank
1.3 - 597
PNB
0.6 - 837 State Bank of India 3.4 2.8 2,209 Allahabad Bank - 1.0 146 Financials Total Underweight 27.0 25.4 JP Associates 0.5 - 75 L&T 4.5 5.0 1,389 IRB
1.0 133
Infra Total Overweight
5.0 6.0
HCL Technologies 0.7 2.4 487 Infosys 7.5 7.5 2,438 TCS 3.9 5.5 1,259 Wipro 1.3 386 IT Services Total Overweight
13.4 15.4
Hindalco
0.9 0.8 124
Jindal Steel and Power 1.0 443 SAIL 0.3 0.5 93 Sesa Goa 0.5 196 Sterlite 0.9 106 Tata Steel
1.8 1.8 438
Coal India
1.4
351 Hindustan Zinc 1.0 119 Metals Total Underweight 6.7 4.1 BPCL 0.6 1.6 763 Cairn 0.8 309 GAIL
1.0 1.2 351
ONGC
3.0 2.5 278 Reliance Industries 7.6 7.6 732 Oil & Gas Total Underweight 13.0 12.9 Cipla 1.0 1.4 323 Dr Reddys 1.3 2.3 1,640 Ranbaxy
0.5
491
Sun Pharma
1.5 1.5 625 Glenmark 1.0 384 Pharma Total Overweight 4.2 6.2 BHEL 1.1 1.5 234 NTPC 1.2 1.3 160 Power Grid
1.0 1.0 113
Reliance Infrastructure
0.5
551 Siemens 0.4 722 Tata Power 1.0 1.7 101 Power & CG Total Overweight 5.1 5.5 DLF 0.4 214 Real Estate Total Underweight
0.5 -
Bharti Airtel
2.3 3.0 317
Telecom Total Overweight 2.3 3.0 Total 100.0 100.0
Source: NSE, Elara Securities Research

Glo
bal
Mar
kets
Res
earc
h
15 15 Elara Securities (India) Private Limited15
In INR mn
No. Name of company CMP
5 July 2012
Current Mkt Cap
(INR mn) Target Price Recomm.
Net Sales EBIDTA PAT EPS ROE (%) ROCE (%)
FY11 FY12 FY13E FY14E FY11 FY12 FY13E FY14E FY11 FY12 FY13E FY14E FY11 FY12 FY13E FY14E FY11 FY12 FY13E FY14E FY11 FY12 FY13E FY14E
Automobiles
1 Hero Motocop 2,121 423,567 2,424 Accumulate 193,979 235,790 260,356 292,112 26,132 36,048 39,829 45,994 20,077 23,782 27,698 30,260 100.5 119.1 138.7 151.5 62.5 65.6 56.9 53.8 59.3 55.8 57.0 62.7
2 Bajaj Auto 1,556 450,241 1,580 Reduce 165,263 195,290 221,077 253,503 32,856 36,706 41,005 48,021 25,985 30,886 32,469 37,608 90.4 108.4 113.9 131.7 66.7 57.3 48.1 43.7 65.8 60.3 55.1 51.5
3 TVS Motors 37 17,578 38 Accumulate 62,891 71,262 76,858 84,998 3,927 4,694 4,381 4,792 1,962 2,491 2,032 2,270 4.1 5.2 4.3 4.8 21.0 23.0 16.4 16.4 14.8 19.1 16.9 17.4
4 Maruti Suzuki 1,240 358,335 1330 Accumulate 370,211 358,195 437,366 495,352 36,455 25,705 37,961 43,784 22,887 15,603 21,635 25,113 79.2 54.0 74.9 86.9 17.8 10.7 13.4 13.8 19.4 9.2 13.7 14.6
5 Mahindra & Mahindra 722 443,325 703 Accumulate 243,003 313,811 356,522 401,936 43,577 41,613 46,850 52,356 33,058 28,888 30,556 34,466 53.8 47.1 49.8 56.1 29.3 19.9 16.8 17.6 24.3 18.2 17.8 18.7
6 Tata Motors 240 704,687 286 Accumulate 1,231,333 1,656,545 1,878,936 2,139,258 168,175 223,112 229,842 260,364 89,898 144,055 133,433 152,403 27.4 38.7 40.7 46.4 65.7 55.1 34.1 29.4 24.9 28.7 23.3 22.4
Banking
7 Allahabad Bank 153 76,504 235 Buy 40,225 51,627 59,649 73,660 14,231 18,668 20,162 24,364 32 39 42 51 18.7 19.6 18.1 19.1 8 AXIS Bank 1,044 432,520 1,398 Buy 65,630 80,178 96,293 115,877 33,885 42,422 52,797 63,792 80 102 128 155 19.3 22.0 21.1 21.4 9 Bank of Baroda 733 287,003 925 Buy 88,022 103,170 107,954 121,603 42,417 50,070 48,600 54,243 116 128 124 138 23.5 23.3 16.5 16.0
10 Bank of India 355 203,462 405 Accumulate 78,107 83,134 92,598 109,928 24,887 26,775 37,231 45,569 44 49 68 83 15.8 15.4 17.1 18.6 11 DCB 46 11,023 60 Buy 1,891 2,277 2,769 3,359
214 551 773 1,073 1 2 3 4 3.5 7.4 8.6 10.8
12 HDFC Bank 584 1,376,092 536 Reduce 105,431 122,968 147,945 178,314 39,264 51,671 67,660 85,973 16 22 28 36 16.7 14.6 17.3 19.4 13 ICICI Bank 921 1,058,415 1,206 Buy 90,169 107,342 139,154 162,031 51,514 64,653 80,503 98,915 43 56 70 86 9.7 11.7 12.8 14.4 14 Indusind Bank 348 162,932 371 Accumulate 13,765 17,043 21,920 27,819 5,773 8,026 10,559 14,207 12 17 22 30 17.9 12.4 20.4 23.0 15 Punjab National Bank 846 286,826 1,026 Buy 118,073 134,143 145,180 168,718 44,335 48,842 55,427 65,066 141 154 175 205 22.6 24.1 19.1 19.8 16 State Bank of India 2,233 1,498,745 2,221 Accumulate 325,264 432,911 454,575 489,841 82,645 117,073 124,074 139,221 130 184 195 219 12.6 16.2 14.0 14.0 17 Union Bank of India 213 117,267 275 Buy 62,162 59,089 67,971 75,416
20,820 17,871 21,383 26,776 40 34 41 51 18.0 14.3 14.1 16.1
18 Yes Bank 358 126,575 371 Reduce 12,469 16,156 20,060 23,816 7,271 9,770 12,172 15,346 20 27 35 44 21.1 23.1 23.5 24.2 19 Andhra Bank 119 66,730 130 Accumulate 32,223 37,593 42,441 51,270 12,678 13,447 15,059 18,185 23 24 27 30 23.2 19.2 18.8 18.9 20 City Union Bank 54 21,941 62 Buy 4,200 4,998 6,329 8,081 2,151 2,803 3,384 4,261 5 7 7 8 23.5 24.9 22.9 21.0 21 Dena Bank 102 35,636 120 Buy 17,634 21,010 26,491 34,177 6,116 8,032 8,711 11,680 21 23 25 31 20.9 20.8 18.8 20.4 22 J&K bank 968 46,924 1,200 Buy 15,439 18,384 22,447 26,891 6,154 8,033 9,651 10,880 127 166 199 224 19.0 21.2 21.6 20.7 23 Indian Bank 192 82,688 210 Accumulate 40,362 44,180 49,110 58,325
17,141 17,470 19,190 22,795 40 41 45 53 22.3 19.5 18.5 18.9
24 Karur Vysya 430 46,104 480 Buy 7,669 9,171 12,186 15,221 4,156 5,017 5,810 7,152 45 47 54 61 22.1 20.7 19.9 20.2
Cement
25 JK Lakshmi 82 10,009 83 Buy 13,188 17,111 20,709 24,328 1,832 3,209 3,793 5,570 591 1,480 1,949 2,856 5 12 16 23 5.9 13.9 15.9 20.4 5.8 8.3 14.0 17.9
26 JK Cement 204 14,248 180 Buy 20,831 20,831 20,831 20,831 2,639 5,077 5,689 6,683 580 2,021 2,412 3,192 8 29 34 46 5.2 14.6 17.6 20.0 7.0 15.0 18.1 21.1
27 Orient paper 64 13,153 75 Buy 19,590 24,507 27,319 32,992 2,951 3,871 5,018 5,996 1,431 2,123 2,693 3,169 7 10 13 15 17.2 21.2 21.9 21.1 18.5 24.6 27.5 27.4
28 Shree Cement* 3,074 107,100 2,875 Accumulate 35,119 58,651 57,187 66,150 8,856 14,887 14,700 19,641 2,440 3,039 6,561 10,007 70 88 188 287 12.8 11.5 25.9 31.1 8.3 12.0 23.7 33.4
29 India Cements 86 26,525 103 Accumulate 36,224 46,309 48,667 53,205 4,344 9,423 10,452 11,880 639 2,627 3,240 4,345 2 8 11 14 1.9 7.7 9.6 7.7 3.7 10.4 10.6 10.4
30 ACC 1,297 243,459 1,370 Accumulate 77,173 94,387 116,738 134,897 16,251 16,991 21,831 28,677 10,425 10,204 13,545 18,505 55 55 72 98 16.7 15.3 18.2 22.2 21.3 20.0 35.4 30.6
31 Ambuja 175 269,099 159 Reduce 73,902 85,145 101,127 118,486 18,236 19,180 24,411 31,372 12,350 12,613 15,834 20,268 8 8 10 13 17.9 16.4 18.9 22.3 31.2 31.2 31.2 31.2
32 UltraTech 1,543 422,980 1,620 Accumulate 136,912 190,856 225,321 263,467 25,705 40,438 47,862 56,992 13,674 22,982 28,553 34,369 57 84 105 126 17.8 19.5 20.3 20.2 18.2 20.5 21.8 22.9
33 Grasim Industries 2,664 244,305 2,950 Buy 212,690 249,872 290,188 337,707 46,832 53,134 61,145 72,583 22,789 25,841 27,773 33,109 248 282 303 361 16.9 16.8 15.2 15.7 16.5 17.4 17.8 18.4
*FY12 for 15 months Crop Protection
34 Rallis India 139 26,983 146 Buy 10,862 12,749 14,628 17,021 1,915 2,030 2,294 2,736 1,245 1,162 1,576 1,972 6.4 6.0 8.1 10.1 26.9 22.3 26.9 29.4 33.1 25.9 26.4 30.1
35 PI Industries 493 12,344 637 Buy 7,186 8,750 10,844 13,413 1,225 1,389 1,841 2,417 641 702 1,040 1,451 25.6 28.0 41.5 57.9 35.3 26.2 28.1 30.3 26.1 22.5 24.7 27.6
36 Dhanuka Agritech 97 4,847 118 Buy 4,910 5,292 6,310 7,553 759 794 956 1,155 511 571 699 844 10.2 11.4 14.0 16.9 38.2 29.7 29.0 28.1 36.5 30.6 32.2 32.9
FMCG
37 Hindustan Unilever 441 953,027 NA NA 193,810 217,356 246,146 281,006 23,239 29,106 34,926 41,131 20,992 25,725 30,578 35,850 9.7 11.9 14.1 16.6 80.1 83.4 78.2 74.9 74.2 70.6 68.9 67.5
38 ITC 251 1,959,297 NA NA 211,676 247,984 284,489 327,732 71,534 84,732 99,010 115,184 49,876 61,624 70,475 81,125 6.4 7.9 9.0 10.4 33.2 36.3 36.6 37.2 40.8 43.4 45.1 46.7
39 Nestle*(Y/E Dec) 4,460 429,990 NA NA 62,548 74,908 87,909 102,975 12,497 15,528 18,695 22,608 8,370 10,188 11,565 14,135 86.8 105.7 119.9 146.6 116.5 95.7 77.4 70.9 149.4 88.1 64.5 67.6
40 Colgate 1,183 160,900 NA NA 22,206 26,238 30,301 34,778 4,507 5,174 6,179 7,147 4,026 4,547 5,227 5,886 29.6 33.4 38.4 43.3 113.4 109.0 109.9 105.7 122.5 120.9 124.3 121.6
India
Elara Coverage Universe

Glo
bal
Mar
kets
Res
earc
h
16 16 Elara Securities (India) Private Limited16
No. Name of company CMP
5 July 2012
Current Mkt Cap
(INR mn) Target Price Recomm.
Net Sales EBIDTA PAT EPS ROE (%) ROCE (%)
FY11 FY12 FY13E FY14E FY11 FY12 FY13E FY14E FY11 FY12 FY13E FY14E FY11 FY12 FY13E FY14E FY11 FY12 FY13E FY14E FY11 FY12 FY13E FY14E
41 Godrej Con. Products 580 197,441 NA NA 36,763 48,509 63,709 77,584 6,358 8,402 11,414 14,360 4,736 5,266 7,495 9,195 14.6 15.5 22.0 27.0 38.4 32.0 24.5 25.3 24.8 18.9 22.9 26.6
42 Dabur 115 200,429 NA NA 40,774 52,832 61,491 71,070 7,547 8,679 10,236 12,220 5,689 6,460 7,743 9,353 3.3 3.7 4.4 5.4 48.9 41.5 40.2 39.0 37.5 28.9 30.9 33.3
43 Marico 183 118,044 NA NA 31,283 39,968 47,174 54,809 4,097 4,741 6,362 7,169 2,375 3,189 4,433 5,035 3.9 5.2 7.2 8.2 36.5 30.2 32.1 27.9 24.0 21.8 25.9 24.6
Hospitality
44 EIH 82 47,012 86 Accumulate 11,263 13,923 15,648 17,226 1,396 3,158 3,798 4,394 (23) 1,161 1,702 2,189 (0) 2 3 4 (0.1) 4.5 6.4 8.0 5.3 7.5 9.4 11.4
45 IHCL 63 48,151 58 Reduce 28,625 34,327 38,462 42,298 4,379 5,457 6,252 7,450 (964) 34 1,038 1,668 (1) 0 1 2 (3.6) 0.1 3.1 4.8 3.5 4.4 4.7 6.1
Infrastructure
46 HCC 22 13,285 18 Sell 40,932 39,915 42,309 47,387 5,434 4,335 4,654 5,260 650 (1,158) (1,232) (113) 1.1 (1.9) (2.0) (0.2) 4.3 (8.2) (9.9) (1.0) 9.1 6.7 6.4 7.4
47 Simplex Infra 229 11,339 246 Accumulate 46,980 59,068 66,714 75,638 4,850 5,369 6,204 7,186 1,232 892 1,061 1,272 24.8 18.0 21.4 25.6 12.0 7.8 8.4 9.3 13.1 11.7 11.5 11.7
48 IRB 136 45,035 160 Buy 24,381 31,307 35,642 37,760 10,939 13,735 14,896 17,190 4,524 4,960 4,560 4,052 13.6 14.9 13.7 12.2 20.2 18.8 15.0 11.9 21.5 19.5 15.1 13.2
49 ITNL 185 35,940 251 Buy 40,482 56,056 60,803 75,849 11,549 14,656 18,435 21,412 4,329 4,970 5,604 7,468 22.3 25.6 28.8 38.4 21.3 19.5 18.7 21.0 17.9 15.9 15.3 12.9
50 NCC 45 11,559 34 Accumulate 50,737 52,505 57,333 63,902 4,876 3,993 4,759 5,432 1,635 360 659 855 6.4 1.4 2.6 3.3 7.1 1.5 2.7 3.4 10.1 9.2 10.1 9.8
51 IVRCL Infra 54 14,539 39 Sell 56,515 49,709 59,430 71,065 5,146 3,771 4,933 6,112 1,579 241 503 922 5.9 0.9 1.9 3.5 8.2 1.2 2.5 4.4 12.0 6.9 8.2 9.1
52 Sadbhav 144 21,608 156 Buy 22,094 26,755 25,525 29,486 2,376 2,903 2,757 3,243 1,196 1,406 1,180 1,481 8.0 9.3 7.8 9.8 23.5 20.3 14.1 15.1 24.6 24.2 18.1 17.9
53 Madhucon 41 3,037 78 Buy 17,129 18,025 21,880 26,832 1,723 2,040 2,407 3,005 324 365 395 574 4.4 4.9 5.3 7.7 5.5 5.8 6.0 8.1 11.6 11.2 10.8 11.5
54 J Kumar 153 4,240 217 Buy 9,492 9,316 11,300 13,944 1,434 1,467 1,695 2,015 739 698 758 829 26.6 25.1 27.3 29.8 21.4 17.1 16.0 15.2 31.3 26.1 24.6 22.5
IT Services
55 Infosys 2,480 1,424,235 2,400 Reduce 275,010 337,340 386,060 424,948 89,785 107,080 119,227 126,490 68,230 83,160 92,671 101,941 119.4 145.5 162.2 178.4 27.8 30.0 29.6 29.1 35.9 39.7 39.4 38.8
56 TCS 1,241 2,428,128 1,300 Buy 386,807 488,938 605,447 696,798 115,653 144,353 176,970 199,515 90,751 104,457 129,315 143,149 46.4 53.4 66.1 73.1 42.0 36.8 35.4 31.1 50.8 48.1 46.9 42.1
57 Wipro 396 973,301 410 Reduce 310,542 371,971 434,523 499,049 65,803 75,570 86,106 98,893 44,099 56,591 65,733 75,290 21.6 23.0 26.8 30.7 21.0 21.3 20.1 19.0 21.4 21.8 21.5 20.7
58 HCL Tech 492 341,323 560 Buy 160,343 205,082 242,447 283,811 27,490 36,627 41,150 47,622 17,094 22,789 26,982 31,022 24.6 32.5 38.5 44.2 21.7 23.0 21.8 20.3 21.6 25.9 25.8 26.9
59 Tech Mahindra 737 93,938 600 Sell 51,520 54,998 61,868 65,532 9,739 9,371 10,313 10,657 7,076 5,559 7,579 7,743 54.2 42.1 57.4 58.7 21.8 17.4 16.7 14.6 21.6 20.1 20.8 18.7
60 Mphasis 392 82,276 360 Sell 50,366 50,851 53,825 54,646 12,649 9,806 10,120 10,129 10,907 7,734 7,227 7,337 51.8 36.4 33.7 34.5 38.6 21.2 16.7 13.8 38.3 21.3 16.3 27.9
61 Persistent Systems 395 15,810 440 Buy 7,758 10,003 11,023 13,178 1,583 2,091 1,929 2,763 1,393 1,418 1,231 1,885 34.8 35.4 41.3 46.0 21.7 18.7 19.1 18.5 16.5 18.1 18.5 18.2
Media
62 Den Networks 104 13,857 130 Buy 10,221 11,736 12,105 12,127 914 1,604 1,487 1,198 375 410 154 (361) 2.8 3.1 1.2 (2.7) 5.0 5.2 2.0 (5.0) 8.8 12.8 7.4 (1.4)
63 Dish TV 69 73,260 65 Accumulate 14,366 19,578 22,206 26,967 2,389 4,984 5,923 6,907 (1,898) (1,545) (1,460) (1,319) (1.8) (1.5) (1.4) (1.2) NA NA 186.6 62.8 (8.6) 1.5 (0.6) 1.2
64 Network 18 37 5,393 26 Accumulate 11,115 12,174 14,469 16,989 1,323 311 1,988 3,001 219 (656) 981 1,917 0.6 (2.2) 0.8 1.6 3.8 (10.9) 10.3 17.5 6.7 (0.1) 6.9 10.2
65 Sun TV Network 318 125,260 287 Accumulate 20,135 18,484 20,915 24,052 15,779 14,177 16,020 18,420 7,698 6,944 7,545 8,714 19.5 17.6 19.1 22.1 37.7 30.7 31.3 35.0 52.2 42.2 44.6 50.0
66 Zee Entertainment 149 142,713 150 Buy 29,436 30,406 33,723 38,857 7,566 7,395 8,803 10,309 5,213 5,907 6,709 7,981 5.6 6.1 7.0 8.3 12.7 17.0 19.2 19.5 12.7 16.6 16.1 17.1
Metals
67 JSW Steel 723 161,258 570 Sell 238,406 341,237 354,775 405,127 46,627 61,019 62,647 66,840 17,540 20,730 16,635 17,432 78.6 92.9 74.6 78.1 13.0 12.5 9.1 8.4 11.3 12.6 11.7 11.8
68 SAIL 94 389,509 95 Reduce 426,871 456,848 478,100 544,844 74,400 61,057 66,498 70,571 47,558 38,072 27,738 22,863 11.5 9.2 6.7 5.5 13.5 9.9 6.8 5.4 17.3 10.0 8.4 6.8
69 Tata Steel 452 438,600 500 Buy 1,151,449 1,322,574 1,311,526 1,402,156 159,956 124,168 161,371 203,805 66,725 20,279 58,157 88,913 65.3 19.8 56.9 87.0 20.6 4.6 12.1 16.7 19.2 11.3 14.3 17.6
70 Hindustan Zinc 125 528,376 165 Buy 99,121 112,551 133,585 145,563 54,956 60,695 79,085 88,815 46,576 55,692 73,220 85,759 11.0 13.2 17.3 20.3 22.9 22.5 24.5 23.6 64.7 58.8 75.7 89.9
71 Sterlite Industries 110 368,155 120 Accumulate 302,481 409,668 453,279 508,832 79,782 98,013 124,734 140,654 44,394 54,507 63,966 74,684 13.2 16.2 19.0 22.2 9.1 9.9 13.3 19.1 18.4 17.9 21.7 23.7
72 Hindalco Industries 125 240,179 130 Accumulate 718,008 803,930 916,179 968,524 80,017 81,894 92,362 97,480 24,564 33,969 28,508 24,420 11.9 16.5 13.8 11.8 9.0 10.5 8.0 6.4 12.1 10.4 8.8 7.5
73 National Aluminum 62 159,273 60 Reduce 59,646 65,003 70,557 75,175 15,941 11,449 15,993 19,935 10,262 8,714 10,762 14,281 4.0 3.4 4.2 5.5 9.5 7.6 8.8 10.6 17.0 9.2 12.1 14.3
Midcap
74 Piramal_Glass 107 8,626 186 Buy 12,185 13,924 16,664 19,072 2,786 3,064 3,687 4,450 930 942 1,154 1,582 12 12 14 20 24.2 20.6 20.6 22.2 13.5 11.2 15.2 17.7
75 TTK Prestige 3,396 38,443 3,472 Buy 7,636 11,034 14,212 18,082 1,217 1,713 2,204 2,878 838 1,133 1,441 1,947 74 100 127 165 43.7 39.7 35.7 34.9 58.6 52.3 49.8 47.8
76 ENIL 215 10,235 260 Buy 2,800 3,014 3,394 3,874 910 1,007 1,083 1,282 522 565 691 900 11 12 14 19 10.3 12.8 13.6 15.0 14.6 15.2 14.8 16.0
77 ESS DEE 153 4,918 143.67 Buy 6,807 6,591 7,314 9,086 1,706 1,471 1,726 2,207 1,180 681 880 1,178 37 21 27 37 16.9 9.0 10.5 12.4 16.5 11.2 12.2 13.8
78 Navneet Publication 58 13,697 80 Buy 5,494 6,097 7,338 8,725 1,261 1,403 1,721 2,093 781 836 1,032 1,274 3 4 4 5 24.1 22.6 24.3 25.9 29.9 28.6 30.6 32.8
79 Techno Electric & Egg. 199 11,341 246 Buy 7,166 8,196 8,930 9,290 1,635 2,243 2,868 2,951 1,128 1,262 1,445 1,661 20 21 25 29 20.1 18.8 18.0 17.5 15.6 12.6 15.9 15.1
Oil & Gas
80 Oil India 500 300,388 540 Accumulate 83,034 97,741 102,904 114,709 41,706 46,001 45,680 52,134 29,686 34,469 32,317 37,397 48.0 57.3 53.8 62.2 18.5 19.4 16.4 17.0 26.5 28.8 24.5 25.3
81 ONGC 278 2,382,276 265 Reduce 1,176,106 1,516,077 1,684,924 1,637,848 484,363 581,092 587,670 573,067 224,559 312,939 277,859 258,759 26.2 36.6 32.5 30.2 19.5 22.9 18.0 15.2 28.1 29.6 26.2 22.3

Glo
bal
Mar
kets
Res
earc
h
17 17 Elara Securities (India) Private Limited17
No. Name of company CMP
5 July 2012
Current Mkt Cap
(INR mn) Target Price Recomm.
Net Sales EBIDTA PAT EPS ROE (%) ROCE (%)
FY11 FY12 FY13E FY14E FY11 FY12 FY13E FY14E FY11 FY12 FY13E FY14E FY11 FY12 FY13E FY14E FY11 FY12 FY13E FY14E FY11 FY12 FY13E FY14E
82 Reliance Industries 739 2,418,911 700 Reduce 2,658,110 3,585,010 3,751,586 3,376,427 389,610 348,170 325,406 312,276 192,498 196,400 198,475 200,007 64.8 66.2 60.9 61.3 12.5 11.6 10.7 9.9 11.1 11.2 11.5 10.7
83 Cairn India 315 600,693 350 Accumulate 102,779 131,130 204,658 200,800 83,562 105,067 136,122 132,588 63,344 79,378 99,969 98,845 33.2 41.6 52.4 51.8 15.8 16.4 17.9 15.6 17.0 19.4 21.1 17.6
84 Essar Oil 59 79,892 125 Buy 469,882 573,150 822,896 883,214 24,255 6,550 39,580 46,414 6,539 (41,990) 4,069 7,735 4.9 (30.8) 3.0 5.7 11.1 (94.6) 16.0 24.7 10.5 (89.9) 15.2 23.5
85 MRPL 59 104,104 65 Accumulate 390,074 537,935 581,336 594,670 20,480 16,388 11,284 22,185 11,762 9,086 6,397 11,416 6.2 4.9 3.5 6.2 18.0 12.6 8.3 13.3 22.8 11.8 9.9 15.1
86 Chennai Petroleum 126 18,815 120 Reduce 331,078 407,962 429,762 418,845 12,164 3,803 10,323 10,746 5,115 618 2,628 2,706 34.4 4.2 17.7 18.2 13.6 1.6 6.6 6.5 12.7 1.3 8.6 8.2
87 Aban Offshore 423 18,394 350 Sell 33,472 31,629 36,543 35,654 20,573 18,404 20,987 19,876 1,449 3,215 4,123 2,780 103.4 67.7 94.8 63.9 24.6 13.4 16.0 12.0 23.4 12.7 15.2 11.4
88 Shiv-Vani Oil & Gas 161 7,445 255 Buy 14,622 14,801 15,087 15,219 6,872 6,772 6,892 6,849 2,294 2,102 2,059 2,098 44.2 38.0 39.7 45.3 16.1 12.9 11.3 10.8 12.3 12.8 13.1 12.8
89 Bharat Petroleum 758 274,157 890 Buy 1,536,450 2,119,638 2,331,602 2,448,182 42,612 46,369 52,040 57,892 16,350 7,808 11,490 15,000 45.2 21.6 31.8 41.5 10.7 4.9 6.9 8.5 9.9 8.5 9.4 10.3
90 Hindustan Petroleum 342 115,692 320 Accumulate 1,350,085 1,801,192 1,932,241 1,970,887 35,161 40,868 44,235 45,187 15,544 9,205 10,945 11,883 46.2 27.2 32.3 35.1 13.0 7.2 8.7 9.4 5.6 5.3 5.7 6.6
91 Indian Oil Corporation 265 644,500 300 Accumulate 3,106,254 4,089,240 4,553,561 4,696,728 150,243 197,108 185,561 191,692 78,307 42,260 74,202 76,137 32.3 17.4 30.6 31.4 13.6 7.0 11.4 10.9 11.2 12.8 11.3 11.2
92 JBF Industries 136 9,772 160 Buy 64,711 71,793 77,679 80,677 9,585 7,137 7,282 7,631 5,461 2,230 3,120 3,566 78.2 30.7 43.5 49.7 46.9 14.1 17.1 17.1 26.0 15.6 11.0 9.0
93 GAIL 361 457,984 326 Reduce 352,189 441,821 514,469 541,177 66,196 72,800 83,991 90,347 40,210 44,436 44,414 46,090 31.7 35.0 35.0 36.3 19.0 18.2 16.2 15.1 20.4 16.3 15.3 15.6
94 Petronet LNG 149 111,638 160 Accumulate 131,973 226,959 251,092 266,465 12,306 18,292 19,722 21,959 6,196 10,575 10,760 11,861 8.3 14.1 14.3 15.8 23.1 30.1 24.6 22.4 20.9 25.6 24.1 24.1
95 Indraprastha Gas 250 35,007 200 Sell 17,505 25,192 28,792 33,406 4,987 6,362 5,489 6,373 2,598 3,072 2,156 2,599 18.6 21.9 15.4 18.6 25.9 25.3 15.8 16.9 29.3 26.5 18.6 20.1
96 Gujarat State Petronet 73 41,330 70 Reduce 10,465 11,233 11,577 11,906 9,694 10,321 10,632 10,934 5,064 5,221 5,299 5,651 9.0 9.3 9.4 10.0 25.3 21.2 18.1 16.6 24.1 23.8 22.5 21.3
97 Gujarat Gas Com.* 316 40,469 266 Sell 24,186 29,601 32,801 34,624 3,970 3,386 3,640 4,816 2,735 2,164 2,286 3,053 21.2 16.9 17.8 23.8 34.3 26.7 27.9 36.2 31.9 25.5 26.9 36.4
* CY11=FY12, CY12=FY13, CY13=FY14 for Gujarat Gas
Paints
98 Asian Paints 3,781 362,687 3,837 Accumulate 77,062 95,983 112,842 131,814 13,130 14,749 18,681 22,465 8,432 9,887 12,321 14,721 87.9 103.1 128.5 153.5 43.3 40.1 40.0 38.5 51.0 45.6 47.5 47.2
99 Kansai Nerolac 950 51,205 1,015 Accumulate 21,387 25,859 29,939 35,000 2,905 3,226 3,762 4,670 1,806 2,159 2,448 3,038 33.5 40.1 45.4 56.4 21.4 21.8 21.4 22.8 26.0 25.2 25.7 28.2
100 Berger Paints 137 47,459 162 Buy 20,962 26,517 31,827 37,537 2,128 2,672 3,341 4,218 1,483 1,774 2,203 2,796 4.3 5.1 6.4 8.1 22.0 22.6 24.1 25.9 24.9 25.0 26.4 29.6
101 Akzo Nobel India 869 41,697 886 Reduce 10,876 13,421 15,564 18,099 1,239 1,172 1,564 1,979 1,431 1,535 1,875 2,237 29.9 32.0 39.1 46.7 13.7 13.7 15.7 17.6 9.8 8.1 10.5 12.4
102 HSIL 161 10,624 229 Buy 10,353 13,229 16,910 20,863 1,961 2,363 3,232 4,096 875 1,103 1,474 1,978 13.3 16.7 22.3 30.0 14.7 12.9 13.7 16.3 13.0 11.9 12.4 14.8
Pharmaceuticals
103 Aurobindo Pharma 115 33,537 100 Reduce 43,815 43,120 47,822 52,097 9,804 5,346 5,801 6,475 5,635 136 2,438 2,760 18 8 8 9 23.0 0.6 9.6 10.2 19.7 9.5 9.6 10.0
104 Cadilla healthcare 765 156,632 683 Reduce 44,647 54,507 65,303 74,846 8,633 10,629 13,387 16,316 7,110 7,759 10,366 12,480 34 38 51 61 32.7 30.1 28.8 26.8 25.0 25.2 27.4 27.0
105 Cipla 324 260,508 346 Accumulate 63,346 69,946 79,183 89,261 14,096 14,766 17,791 20,816 9,896 9,853 12,116 14,366 12 12 15 18 14.5 13.3 14.3 14.8 18.9 17.4 18.9 19.5
106 Dr. Reddy's 1,629 276,306 1,866 Accumulate 74,233 86,551 91,982 101,525 14,999 18,980 20,093 22,900 9,989 12,944 13,646 15,974 59 76 81 94 24.8 24.9 21.2 20.2 23.5 28.4 25.6 25.1
107 Glenmark 375 101,494 403 Buy 29,491 40,206 44,803 52,377 5,923 8,461 8,826 10,737 4,578 4,604 5,415 7,069 17 17 20 26 22.5 19.2 15.7 17.3 13.7 18.2 14.9 16.6
108 Lupin 540 241,455 467 Reduce 58,069 69,467 82,999 96,970 11,761 14,408 17,442 20,558 8,626 10,011 13,119 15,609 19 22 29 35 26.0 24.0 24.6 23.2 25.2 26.7 27.6 26.1
109 Ranbaxy* 511 215,868 370 Sell 89,608 101,612 127,004 101,251 19,209 24,261 28,842 14,128 14,968 (28,997) 21,759 9,148 7 10 15 15 16.7 12.0 12.8 15.9 19.2 32.6 29.8 13.3
110 Sun pharma 636 654,814 510 Sell 57,214 75,688 88,373 101,430 19,720 29,862 34,879 39,558 17,408 24,115 28,578 32,710 17 18 23 29 18.4 20.9 20.5 19.4 19.0 23.1 22.0 20.5
111 Jubilant Life Sciences 174 27,635 206 Accumulate 5,607 8,242 9,552 10,371 5,607 8,242 9,552 10,371 2,297 146 3,566 3,995 136 146 153 174 (21.8) 23.9 13.5 12.0 12.4 16.9 14.7 14.4
*Y/E Dec Print Media
112 DB Corp 204 37,427 221 Accumulate 12,652 14,636 16,417 18,505 4,030 3,553 3,996 4,556 2,354 2,043 2,319 2,671 13.0 11.3 12.8 14.7 31.9 22.7 21.8 21.4 36.3 28.0 27.4 27.3
113 HMVL 122 8,954 141 Accumulate 5,204 6,008 6,661 7,285 893 963 1,166 1,232 536 656 774 809 7.3 8.9 10.5 10.9 22.6 15.2 15.4 13.9 23.9 17.8 18.2 16.2
114 Jagran Prakashan 88 27,863 110 Buy 12,211 13,556 15,104 16,937 3,567 3,215 3,587 4,119 2,103 1,782 1,971 2,310 6.6 5.6 6.2 7.3 33.8 26.2 25.5 27.2 40.0 31.2 31.4 33.8
115 HT Media 100 23,467 125 Accumulate 12,142 13,257 14,365 15,618 2,825 2,412 2,663 2,896 1,776 1,578 1,737 1,908 7.6 6.7 7.4 8.1 16.3 12.6 12.3 12.1 17.4 12.0 12.0 11.9
Tours & Travels
116 Cox & Kings 135 18,424 240 Buy 4,967 8,449 17,535 19,732 2,301 1,543 7,619 8,780 1,291 (670) 3,523 4,808 9 (5) 26 35 12.8 2.6 25.1 26.6 14.7 3.6 12.6 14.4
117 Mahindra Holidays 294 24,785 289 Reduce 5,004 5,781 6,367 7,140 1,257 954 1,054 1,194 1,003 1,023 985 1,116 12 12 12 13 21.4 19.2 16.7 17.2 28.9 25.0 22.7 23.4

Elara Securities (India) Private Limited
18
Disclosures & Confidentiality for non U.S. Investors The Note is based on our estimates and is being provided to you (herein referred to as the “Recipient”) only for information purposes. The sole purpose of this Note is to provide preliminary information on the business activities of the company and the projected financial statements in order to assist the recipient in understanding / evaluating the Proposal. Nothing in this document should be construed as an advice to buy or sell or solicitation to buy or sell the securities of companies referred to in this document. Each recipient of this document should make such investigations as it deems necessary to arrive at an independent evaluation of an investment in the securities of companies referred to in this document (including the merits and risks involved) and should consult its own advisors to determine the merits and risks of such an investment. Nevertheless, Elara or any of its affiliates is committed to provide independent and transparent recommendation to its client and would be happy to provide any information in response to specific client queries. Elara or any of its affiliates have not independently verified all the information given in this Note and expressly disclaim all liability for any errors and/or omissions, representations or warranties, expressed or implied as contained in this Note. The user assumes the entire risk of any use made of this information. Elara or any of its affiliates, their directors and the employees may from time to time, effect or have effected an own account transaction in or deal as principal or agent in or for the securities mentioned in this document. They may perform or seek to perform investment banking or other services for or solicit investment banking or other business from any company referred to in this Note. Each of these entities functions as a separate, distinct and independent of each other. This Note is strictly confidential and is being furnished to you solely for your information. This Note should not be reproduced or redistributed or passed on directly or indirectly in any form to any other person or published, copied, in whole or in part, for any purpose. This Note is not directed or intended for distribution to, or use by, any person or entity who is a citizen or resident of or located in any locality, state, country or other jurisdiction, where such distribution, publication, availability or use would be contrary to law, regulation or which would subject Elara or any of its affiliates to any registration or licensing requirements within such jurisdiction. The distribution of this document in certain jurisdictions may be restricted by law, and persons in whose possession this document comes, should inform themselves about and observe, any such restrictions. Upon request, the Recipient will promptly return all material received from the company and/or the Advisors without retaining any copies thereof. The Information given in this document is as of the date of this report and there can be no assurance that future results or events will be consistent with this information. This Information is subject to change without any prior notice. Elara or any of its affiliates reserves the right to make modifications and alterations to this statement as may be required from time to time. However, Elara is under no obligation to update or keep the information current. Neither Elara nor any of its affiliates, group companies, directors, employees, agents or representatives shall be liable for any damages whether direct, indirect, special or consequential including lost revenue or lost profits that may arise from or in connection with the use of the information. This Note should not be deemed an indication of the state of affairs of the company nor shall it constitute an indication that there has been no change in the business or state of affairs of the company since the date of publication of this Note. The disclosures of interest statements incorporated in this document are provided solely to enhance the transparency and should not be treated as endorsement of the views expressed in the report. Elara Securities (India) Private Limited generally prohibits its analysts, persons reporting to analysts and their family members from maintaining a financial interest in the securities or derivatives of any companies that the analysts cover. The analyst for this report certifies that all of the views expressed in this report accurately reflect his or her personal views about the subject company or companies and its or their securities, and no part of his or her compensation was, is or will be, directly or indirectly related to specific recommendations or views expressed in this report.
Any clarifications / queries on the proposal as well as any future communication regarding the proposal should be addressed to Elara Securities (India) Private Limited / the company.
Disclaimer for non U.S. Investors
The information contained in this note is of a general nature and is not intended to address the circumstances of any particular individual or entity. Although we endeavor to provide accurate and timely information, there can be no guarantee that such information is accurate as of the date it is received or that it will continue to be accurate in the future. No one should act on such information without appropriate professional advice after a thorough examination of the particular situation.

Elara Securities (India) Private Limited
Glo
bal
Mar
kets
Res
earc
h
19 19
Disclaimer for U.S. Investors
This material is based upon information that we consider to be reliable, but Elara Capital Inc. does not warrant its completeness, accuracy or adequacy and it should not be relied upon as such.
This material is not intended as an offer or solicitation for the purchase or sale of any security or other financial instrument. Securities, financial instruments or strategies mentioned herein may not be suitable for all investors. Any opinions expressed herein are given in good faith, are subject to change without notice, and are only correct as of the stated date of their issue. Prices, values or income from any securities or investments mentioned in this report may fall against the interests of the investor and the investor may get back less than the amount invested. Where an investment is described as being likely to yield income, please note that the amount of income that the investor will receive from such an investment may fluctuate. Where an investment or security is denominated in a different currency to the investor’s currency of reference, changes in rates of exchange may have an adverse effect on the value, price or income of or from that investment to the investor. The information contained in this report does not constitute advice on the tax consequences of making any particular investment decision. This material does not take into account your particular investment objectives, financial situations or needs and is not intended as a recommendation of particular securities, financial instruments or strategies to you. Before acting on any recommendation in this material, you should consider whether it is suitable for your particular circumstances and, if necessary, seek professional advice.
Certain statements in this report, including any financial projections, may constitute “forward-looking statements.” These “forward-looking statements” are not guarantees of future performance and are based on numerous current assumptions that are subject to significant uncertainties and contingencies. Actual future performance could differ materially from these “forward-looking statements” and financial information.

Elara Securities (India) Private Limited
20
India Elara Securities (India) Pvt. Ltd. Kalpataru Synergy,6th Level,East Wing, Opp Grand Hyatt, Santacruz East, Mumbai – 400 055, India Tel : +91 22 4062 6868
Europe Elara Capital Plc. 29 Marylebone Road, London NW1 5JX, United Kingdom Tel : +4420 7486 9733
USA Elara Securities Inc. 477 Madison Avenue, 220, New York, NY 10022, USA Tel :212-430-5870
Asia / Pacific Elara Capital (Singapore) Pte.Ltd. 30 Raffles Place #20-03, Chevron House Singapore 048622 Tel : +65 6536 6267
Harendra Kumar Managing Director [email protected] +91 22 4062 6871
Sales
Anuja Sarda London +44 77 3819 6256 [email protected] +44 20 7299 2577
David Somekh New York +1 646 808 9217 [email protected] +1 212 430 5872
Nikhil Bhatnagar New York +1 718 501 2504 [email protected] +1 212 430 5876
Amit Mamgain India +91 98676 96661 [email protected] +91 22 4062 6843
Himani Singh India +91 99875 56244 [email protected] +91 22 4062 6801
Prashin Lalvani India +91 98334 77685 [email protected] +91 22 4062 6844
Saira Ansari India +91 98198 10166 [email protected] +91 22 4062 6812
Sales Trading & Dealing
Ananthanarayan Iyer India +91 98334 99217 [email protected] +91 22 4062 6856
Dharmesh Desai India +91 98211 93333 [email protected] +91 22 4062 6852
Manoj Murarka India +91 99675 31422 [email protected] +91 22 4062 6851
Vishal Thakkar India +91 98694 07973 [email protected] +91 22 4062 6857
Research
Abhinav Bhandari Analyst Construction, Infrastructure [email protected] +91 22 4062 6807
Aliasgar Shakir Analyst Mid caps [email protected] +91 22 4062 6816
Alok Deshpande Analyst Oil & Gas [email protected] +91 22 4062 6804
Anand Shah Analyst FMCG, Paints & Agri [email protected] +91 22 4062 6821
Ashish Kumar Economist
[email protected] +91 22 4062 6836
Henry Burrows Analyst Derivative Strategist [email protected] +91 22 4062 6854
Koushik Vasudevan, CFA Analyst Power & Utilities [email protected] +91 22 4062 6841
Mohan Lal Analyst Media , Automobiles [email protected] +91 22 4062 6802
Mona Khetan, FRM Analyst Banking & Financials, Strategy [email protected] +91 22 4062 6814
Pankaj Balani Analyst Derivative Strategist [email protected] +91 22 4062 6811
Parees Purohit, CFA Analyst Banking & Financials [email protected] +91 22 4062 6859
Pralay Das Analyst Information Technology, Strategy [email protected] +91 22 4062 6808
Ravindra Deshpande, ACA, ACS, Analyst Metals & Cement [email protected] +91 22 4062 6805
Ravi Sodah Analyst Cement [email protected] +91 22 4062 6817
Sumant Kumar Analyst Travel & Hospitality, Mid caps [email protected] +91 22 4062 6803
Surajit Pal Analyst Pharmaceuticals, Real Estate [email protected] +91 22 4062 6810
Pooja Sharma Associate Automobiles [email protected] +91 22 4062 6819
Stuart Murray Associate Oil & Gas [email protected] +91 22 4062 6898
Access our reports on Bloomberg: Type ESEC <GO>
Also available on Thomson & Reuters
Member (NSE, BSE) Regn Nos: CAPITAL MARKET SEBI REGN. NO.: BSE: INB 011289833, NSE: INB231289837 DERIVATIVES SEBI REGN. NO.: NSE: INF 231289837
CLEARING CODE: M51449. Website: www.elaracapital.com Investor Grievance Email ID: [email protected]