india | pharma | coverage initiationjmflresearch.com › jmnew › jmcrm › analystreports › pdf...
TRANSCRIPT


Anmol Ganjoo
Tel: (91 22) 66303056
Shashank Krishnakumar
[email protected] Tel: (91 22) 62241878
TABLE OF CONTENTS
03 Introduction
04 Focus Charts
05 Investment Thesis
06 The Story So Far
07 Domestic Formulations: The bedrock of stable growth
08 Domestic Oncology: Surface barely scratched
11 Gastro Hepatology: Focus shifts to international markets
14 Cardiology and Diabetology: Poised to achieve scale
15 Brazil & Canada: The new frontiers
16 Agrochem Foray: Entry into niche molecules to bear fruit
17 Natco’s Para IV opportunities: US pipeline underappreciated
23 Natco’s R&D Capabilities: A Class Apart
24 Financial Analysis
26 Valuation
28 Company Background & Management Profile
30 Key Risks to our thesis
31 Financial Tables
RECENT REPORTS
Rural Safari IX Chalet Hotels
Limited
What killed India’s food inflation?
India Road Sector India Specialty Chemicals
JM Financial Institutional Securities Limited Page 2
11 June 2019
INDIA | PHARMA | COVERAGE INITIATION

11 June 2019
INDIA | PHARMA | COVERAGE INITIATION
Natco Pharma
Strategic Reset Underway: Compelling Investment Case
Strategic reset & diversification to aid earnings stability: Natco has embarked on a new path to reduce its reliance on big-ticket US launches and achieve a more stable revenue mix. Natco is now focusing on leveraging its strong portfolio for rapid growth in Brazil & Canada besides the domestic market. Natco entered the high-growth chronic therapeutic areas of cardiology & diabetology
in the domestic market in 2017 and should achieve reasonable scale over the next two years. Natco’s agrochem venture complements its differentiated R&D-driven approach and will be a key growth lever post-FY21.
First generic launches of Tamiflu & Copaxone 40 mg/ml validate R&D capabilities: After being the first to launch gTamiflu, Natco became the first to launch gCopaxone 40mg/mL, beating the likes
of Sandoz and Dr Reddy’s to it, which validates its R&D strengths. Natco has 20 Para IV opportunities in its pipeline, including
gRevlimid, which is its largest opportunity to date and is expected to contribute peak sales of c. USD 280 mn and support its strong growth in the US beyond FY22.
Market leader in domestic Oncology & Gastro Hepatology: Natco is the market leader in the domestic oncology segment with over 20% market share. The under-penetration in the segment provides Natco with a long runway for growth. Natco was among the first few players to introduce generic Hepatitis C drugs licensed from Gilead Sciences in the domestic market and currently occupies the top spot across the Hepatitis C class of drugs in India.
Rewards meaningfully exceed risks @ CMP: At c.16x FY20E
earnings, Natco is trading at c.40% discount to its 5-year average trading range. We believe that the current valuations barely price in the base earnings with the value of Natco’s US portfolio and
pipeline with strong launch and earnings visibility not factored in. Given Natco’s strong domestic business, robust balance sheet, increasing focus in new markets and maturing R&D pipeline, risk-
reward is extremely favourable. Initiate with BUY with a Mar’20 TP of INR 640.
We initiate coverage on Natco Pharma with a BUY rating
and a target price of INR 640. Natco has embarked on a
new journey in our view. Natco 2.0 intends to rely increasingly on a more diversified earnings stream. Reduced
volatility and low vulnerability to large US opportunities seem to be the thrust of current management initiatives. While remaining sharply focused on monetizing large
opportunities in the US, Natco in its new avatar will be relying on multiple pillars of growth.
Natco is an outlier among peers on multiple fronts: a) Best-in-class margin profile (FY20E EBITDA Margin & Net Profit
Margin at 33.6% & 28.1%) b) A risk mitigated business
model with its marketing partner in US being responsible for litigations and ANDA filing & c) Strong balance sheet
Natco has delivered an impressive performance in the last 5 years with FY14-FY19 Revenue/EBITDA/PAT CAGR at
23%/35%/44% on the back of robust growth in the
domestic Hepatitis C franchise and contribution from
gTamiflu, gCopaxone & gDoxil. While growth in FY20 is
expected to be muted, multiple near-term catalysts
including the much-awaited approval for gRevlimid,
favourable outcomes in litigations involving domestic
launches of Valsac (c. INR 1200 mn) & gBrilinta (c. INR 1500
mn) and strong offtake of first generic launches in key
international markets (Brazil & Canada) pose significant upside risks. Given Natco’s strong pipeline in high-barrier
complex generics and track record of identifying and exploiting niche opportunities so often, we believe that the
CMP does not capture any potential upside to Natco’s base earnings (Earnings excluding profit share from niche US
launches) and offers an attractive entry point.
Recommendation and Price Target Financial Summary (INR mn)
Current Reco BUY Y/E March FY17A FY18A FY19A FY20E FY21E
Current Price Target (12M) 640 Net Sales 20,650 22,020 20,945 22,259 25,021
Upside/(Downside) 17% Sales Growth (%) 80.9 6.6 -4.9 6.3 12.4
EBITDA 6,834 9,284 7,948 7,486 8,796
EBITDA Margin (%) 33.1 42.2 37.9 33.6 35.2
Key Data – NTCPH IN Adjusted Net Profit 4,861 6,962 6,444 6,265 7,305
Current Market Price INR318 INR547 Diluted EPS (INR) 27.9 38.8 35.0 34.3 40.0
Market cap (bn) INR65.3/$1.0 INR100.1/US$1.4 Diluted EPS Growth (%) 206.4 38.9 -9.6 -2.0 16.6
Free Float 28.59% 44% ROIC (%) 31.1 32.3 21.8 17.4 18.3
Shares in issue (mn) 205.0 179.7 ROE (%) 33.0 29.5 19.6 16.7 16.9
Diluted share (mn) 205.0 182.5 P/E (x) 19.6 14.1 15.6 15.9 13.7
3-mon avg daily val (mn) NA INR172.4/US$2.5 P/B (x) 5.8 3.2 2.9 2.5 2.2
52-week range 347/250 849/480 EV/EBITDA (x) 14.6 9.9 11.5 12.0 9.9
Sensex/Nifty 38,095/11,462 39,785/11,923 Dividend Yield (%) 1.2 1.5 1.2 0.9 0.9
INR/US 68.5 69.7 Source: Company data, JM Financial. Note: Valuations as of 10/Jun/2019
Price Performance JM Financial Research is also available on: Bloomberg - JMFR <GO>, Thomson Publisher & Reuters, S&P Capital IQ, FactSet & Visible Alpha
You can also access our portal: www.jmflresearch.com Please see Appendix I at the end of this report for Important Disclosures and Disclaimers and Research Analyst
Certification.
% 1M 6M 12M
Absolute 1.0 -21.2 -30.5
Relative* -4.9 -30.8 -38.0
*To the BSE Sensex
JM Financial Institutional Securities Limited Page 3

Natco Pharma 11 June 2019
JM Financial Institutional Securities Limited Page 4
Focus Charts
Sustained double-digit growth in domestic oncology Exhibit 1.
Source: Company, JM Financial
Mylan-Natco gaining market share in gCopaxone 40 mg/ml Exhibit 2.
Source: Bloomberg, JM Financial
Best-in-class Margin Profile Exhibit 3.
Source: Company, JM Financial
Strong Balance Sheet Exhibit 4.
Source: Company, JM Financial
Brazil & Canada set to witness rapid expansion Exhibit 5.
Source: Company, JM Financial
Valuations more attractive than ever Exhibit 6.
Source: Bloomberg, JM Financial
1572
1947
2526
3224 3335
3968
4558
5205
0
1,000
2,000
3,000
4,000
5,000
6,000
FY14 FY15 FY16 FY17 FY18 FY19 FY20E FY21E
INR m
n
20%
28%
2%
2%
78% 70%
0%
10%
20%
30%
40%
50%
60%
70%
80%
90%
100%
Aug-18 Sep-18 Oct-18 Nov-18 Dec-18 Jan-19 Feb-19 Mar-19 Apr-19
Mylan Sandoz Teva
33.1%
42.2%
37.9%
33.6%
35.2%
23.5%
31.6%30.8%
28.1%29.2%
20.0%
25.0%
30.0%
35.0%
40.0%
45.0%
FY17 FY18 FY19 FY20E FY21E
EBITDA Margin Net Profit Margin
-0.4
-0.3
-0.2
-0.1
0.0
0.1
0.0%
2.0%
4.0%
6.0%
8.0%
10.0%
12.0%
FY17 FY18 FY19 FY20E FY21E
FCFE Yield Net Debt/Equity (RHS)
188 221
628
10571290
2320
3900
0
500
1000
1500
2000
2500
3000
3500
4000
4500
FY15 FY16 FY17 FY18 FY19 FY20E FY21E
INR m
n
Revenue from Brazil & Canada
0
5
10
15
20
25
30
35
40
45
50
10-yr Average
5-yr Average
-1 SD
+1 SD
+1 SD

Natco Pharma 11 June 2019
JM Financial Institutional Securities Limited Page 5
Investment Thesis
Long-term focus on sustainable earnings streams: Natco’s earnings have reflected
volatility over the past 3 years owing to the reliance on a few major Para IV & Para III
opportunities in the US. In its post-Tamiflu & post-Copaxone avatar, which collectively
accounted for c.25% of overall revenue in FY19, Natco has embarked on a new path by
increasing focus on international markets (Brazil & Canada) and by diversifying into the
niche agrichemical business. In the long-term, Natco is expected to achieve a more stable
revenue mix with domestic formulations, ROW brand formulations, API and the
agrichemical business collectively accounting for c.80% of overall revenue. We expect
c.70% of Natco’s FY21E revenue to be generated outside the US.
Clinical focus on limited competition opportunities: Natco is not a me-too Indian pharma
firm and has adopted a differentiated path unlike its peers by focusing on limited
competition opportunities. After being the first to launch gTamiflu in US, Natco became
the first to launch gCopaxone 40mg/mL, beating the likes of Sandoz and Dr Reddy’s to it,
which validates its R&D strengths. Natco’s model of risk-sharing by forging front-end
partnerships with the larger players in the US and its ability to successfully challenge
innovators in the domestic market have enabled it to stay away from commoditized
generics and single-mindedly focus on high-margin opportunities. Natco needs to be
looked at afresh given its credible technology platform, differentiated R&D-driven
approach and its strategy of combining niche opportunites and high value bets with
sustainable earnings streams in new markets.
Strong US pipeline offers significant upside potential: Natco has 20 Para IV opportunities
in its pipeline, including gRevlimid, which is its largest opportunity to date and is expected
to contribute peak sales of USD 283mn and support its strong growth in the US beyond
FY22. Natco does not have the baggage of a large base business in the US and its
pipeline value exceeds its current US run-rate (ex-Copaxone & ex-Tamiflu).
Domestic oncology opportunity yet to be fully tapped into: Natco is the market leader in
the domestic oncology segment with c.20% market share. The under-penetration in the
segment and the expected increase in the number of new cancer cases are expected to
provide Natco with a long runway for growth. We expect Natco to continue its industry-
leading growth trajectory with domestic oncology revenue expected to grow at a CAGR
of 15% over FY19-FY21.
Valuations more attractive than ever: At c.16x FY20E earnings, Natco is trading at c.40%
discount to its 5-year average trading range. Given Natco’s strong domestic business,
robust balance sheet, increasing focus in new markets and maturing R&D pipeline, risk-
reward is extremely favourable. Initiate with BUY with a Mar’20 TP of INR 640.
FY19 Revenue Mix by Business Segment Exhibit 7.
Source: Company, JM Financial
FY21E Revenue Mix by Business Segment Exhibit 8.
Source: Company, JM Financial
41%
35%
14%
5%
3% 2%
US Formulations Domestic Formulations API
Subsidiaries Other operating income ROW (incl. Europe)
29%
36%
14%
14%
3%
4%
US Formulations Domestic Formulations API
Subsidiaries Other operating income ROW (incl. Europe)

Natco Pharma 11 June 2019
JM Financial Institutional Securities Limited Page 6
The Story So Far
Natco’s share price performance & key triggers Exhibit 9.
Source: Company, JM Financial, Bloomberg
Natco’s share price performance has been shaped by few major drivers including gTamiflu &
gCopaxone over the last 3 years and its domestic oncology & Hepatitis C franchise during the
earlier part of the decade. The vagaries of the stock reflect the uncertainty surrounding Para
IV litigations and the vitality of FTF exclusivity in the US. While exclusivity in gTamiflu resulted
in windfall gains and the loss of exclusivity had an equally marked impact, delayed approval
or simultaneous approvals to multiple filers have often acted as impediments to gaining
meaningful market share in case of other opportunities (E.g.: gNuvigil & gEntocort). Natco
now seeks to address this uncertainty surrounding its US Para IV pipeline by increasing its
focus on domestic and key subsidiary markets.
Natco had announced its arrival on the big stage in Feb 2011 with its ANDA for Roche’s
blockbuster drug, Tamiflu, in partnership with Alvogen and by achieving First-to-File status.
Natco’s first major success in a domestic patent lawsuit came in Mar 2012 when it was
granted a compulsory license, first-of-its-kind, for Bayer’s Nexavar, the first-line treatment for
liver and kidney cancer. While Natco subsequently emerged as the largest player in domestic
oncology on the back of steady growth in the segment, Natco’s Hepatitis C franchise
witnessed non-linear growth post its licensing agreement with Gilead in Mar 2015 for
gSovaldi and gHarvoni in 91 developing countries. Natco registered 5x growth in revenue
from its Hepatitis C franchise in FY16.
With the launch of gTamiflu capsules in Dec 2016, Natco’s second breakout moment came
immediately after in FY17 with a 6x jump in US revenue. While the launch of gDoxil helped
partially offset the seasonality in gTamiflu sales, the earlier-than-expected at-risk launch of
gCopaxone in Oct 2017 provided the much needed boost in FY18. However, increased
competition post the loss of exclusivity in gTamiflu, sharp price cuts in gCopaxone by partner
Mylan and the increasing pricing pressure in the domestic Hepatitis C segment weighed on
the stock in FY19.
While growth in FY20 is expected to be muted, key near-term catalysts include the much-
awaited approval for gRevlimid, favourable outcomes in litigations involving domestic
launches of Valsac (c. INR 1200 mn) & gBrilinta (c. INR 1500 mn) and strong offtake of first
generic launches in key international markets (Brazil & Canada).
0
200
400
600
800
1000
1200
Dec
-10
Mar
-11
Jun-1
1
Sep
-11
Dec
-11
Mar
-12
Jun-1
2
Sep
-12
Dec
-12
Mar
-13
Jun-1
3
Sep
-13
Dec
-13
Mar
-14
Jun-1
4
Sep
-14
Dec
-14
Mar
-15
Jun-1
5
Sep
-15
Dec
-15
Mar
-16
Jun-1
6
Sep
-16
Dec
-16
Mar
-17
Jun-1
7
Sep
-17
Dec
-17
Mar
-18
Jun-1
8
Sep
-18
Dec
-18
Mar
-19
Files ANDA for gTamiflu; granted FTF Status
Granted compulsory license for gNexavar, indicated for liver & kidney cancer, in India
US Court awards a favourable ruling on gCopaxone 20 mg/ml patent suit, reversing a district court ruling
Files ANDA for gCopaxone 40 mg/ml
Announced licensing agreement with Gilead to sell generic Hep C drugs in 91 countries
Announced settlement with Celgene for the launch of gRevlimid in Mar'22
Receives Form 483 for Kothur & Chennai facilities; receives EIR subsequently
Launched gTamiflu capsules in US
Launched gDoxil in US
Launched gCopaxone (40 mg/ml & 20 mg/ml) in US
Decline in revenue post loss of exclusivity in gTamiflu
Files ANDA for gTamiflu; granted FTF Status
Granted compulsory license for gNexavar, indicated for liver & kidney cancer, in India
US Court awards a favourable ruling on gCopaxone 20 mg/ml patent suit, reversing a district court ruling
Files ANDA for gCopaxone 40 mg/ml
Announced licensing agreement with Gilead to sell generic Hep C drugs in 91 countries
Announced settlement with Celgene for the launch of gRevlimidin Mar'22
Receives Form 483 for Kothur & Chennai facilities; receives EIR subsequently
Launched gTamiflu capsules in US
Launched gDoxil in US
Launched gCopaxone (40 mg/ml & 20 mg/ml) in US
Decline in revenue post loss of exclusivity in gTamiflu
Share price performance has
largely been driven by few high-
value opportunities

Natco Pharma 11 June 2019
JM Financial Institutional Securities Limited Page 7
Domestic Formulations: The bedrock of stable growth
After having sold off a basket of specialty brands to Sun Pharma in 1998, Natco re-entered
the domestic market with the launch of its flagship oncology brand, Veenat (Imatinib
Mesylate). Since then, it has significantly scaled up its domestic business which contributed
INR 7.4bn (c. 35% of overall revenue) in FY19. Currently, Natco’s domestic business is mainly
driven by two segments – Oncology and Hepatology – with a specialist sales force of c.350
personnel and over 400 distributors. Third party sales currently account for c.11% of
domestic formulations revenue. Natco is a leader in the oncology space with c.20% share in
in its operated portfolio and a total of 29 products in the market. Natco’s domestic
formulations revenue grew at a CAGR of 64% over FY14-FY17, driven by the launch of
Hepatitis C drugs (licensed from Gilead) in India, generating revenue of c. INR 4.8bn in FY17,
although the Hepatitis C contribution has declined since then owing to increased competition
and pricing pressure in the domestic market.
Given the volatility surrounding its Para IV pipeline and the increasing competitive and pricing
pressures in US, Natco increased its focus and resource allocation to grow in India by
expanding capacity at its Guwahati & Dehradun facilities as well as by launching the
Cardiology and Diabetology (CnD) division in early 2017, where it intends to introduce niche
products in the market over the next 2 years and generate revenue of INR 1.5bn by FY22.
Natco’s Pharma Specialties division, which includes its Hepatology and its Orthopaedics
portfolio, is expected to stabilize going forward aided by new launches and an emerging
portfolio of Hepatitis B drugs. The management expects the Pharma Specialties division to
contribute INR 4bn by FY22.
We expect domestic formulations revenue to grow at a CAGR of 11% over FY19-FY21 aided
by strong double-digit growth in domestic oncology, increasing traction in Cardiology and
Diabetology and stabilization in the Specialties division.
Stable growth outlook for domestic formulations Exhibit 10.
Source: Company, JM Financial
1983
2516
6342
8810
7202 7347
8139
9108
0
1,000
2,000
3,000
4,000
5,000
6,000
7,000
8,000
9,000
10,000
FY14 FY15 FY16 FY17 FY18 FY19 FY20E FY21E
INR m
n
Domestic formulations to emerge as
the largest business segment by FY20

Natco Pharma 11 June 2019
JM Financial Institutional Securities Limited Page 8
Domestic Oncology: Surface barely scratched
Natco forayed into the Indian oncology market in 2003 with the launch of the first generic
alternative for Novartis’s Gleevec (Imanitib Mesylate) under the Veenat brand. Since then,
Natco has significantly ramped up sales from this segment through expansion of its portfolio
from 6 products in FY04 to 29 products in FY19 which includes 6 brands (Veenat, Lenalid,
Erlonat, Geftinat, Sorafenat and Bortenat) with over INR 100mn of annual sales.
Natco is currently the market leader (c.20% market share) in the domestic oncology market,
with sales supported by a specialised field force of over 75 sales representatives and a strong
distribution network. Oncology is one of the fastest growing and one of the most lucrative
therapeutic areas in the Indian pharma market due to limited competition, high
manufacturing complexity and very high margins (c.90% Gross Margin).
Natco’s oncology segment posted a CAGR of 20% over FY14-FY19 and is expected to post a
CAGR of 15% over FY19-FY21, driven by increasing market penetration and its strong
product portfolio.
Oncology a strong growth driver for Natco Exhibit 11.
Source: Company, JM Financial
Natco currently has a portfolio of 29 brands across two segments: hematology (13 brands)
and solid tumors (16 brands). Although the company primarily operates in hematology, it is
increasing its presence in the solid tumours segment, targeting the therapeutic areas of
breast and lung cancers. Natco intends to build a full-fledged Bone Marrow Transplant (BMT)
portfolio in India and has already launched Thiotepa, India’s first generic BMT product.
Natco’s top oncology brands (INR 100mn+ annual sales) Exhibit 12.
Natco Brand Innovator Brand Molecule Indication
Veenat Gleevec Imatinib Mesylate Chronic Myeloid Leukemia
Lenalid Revlimid Lenalidomide Multiple Myeloma
Bortenat Velcade Bortezomib Multiple Myeloma
Erlonat Tarceva Erlotinib Lung and Pancreatic Cancer
Geftinat Iressa Gefitinib Lung Cancer
Sorafenat Nexavar Sorafenib Liver and Kidney Cancer
Source: Company, JM Financial
1572
1947
2526
3224 3335
3968
4558
5205
0
1,000
2,000
3,000
4,000
5,000
6,000
FY14 FY15 FY16 FY17 FY18 FY19 FY20E FY21E
INR m
n
Domestic oncology segment
characterized by limited competition
and very high margins

Natco Pharma 11 June 2019
JM Financial Institutional Securities Limited Page 9
Globally, oncology is the largest therapeutic area by medicine spending. The global market
for oncology therapeutic medicines was valued at USD 104bn in 2017 and is expected to
grow at a CAGR of 12.2% to reach USD 233bn by 2024. The sales of oncology drugs in
2024 are expected to be more than the combined sales of the next four top therapeutic
areas. Emerging markets are growing at a much faster pace (c.17% YoY in 2017) with
increased adoption and usage of medicines aiding strong volume growth.
Top 10 Therapeutic areas by medicine spending Exhibit 13.
Therapy Area Global Sales (USD bn)
CAGR % Global Market Share (%)
2017 2024E 2017 2024E
Oncology 104 233 12.2 12.6 18.6
Anti-diabetics 46 59 3.7 5.6 4.8
Anti-rheumatics 56 57 0.2 6.8 4.5
Vaccines 28 45 7.1 3.4 3.6
Anti-virals 42 40 -0.9 5.1 3.2
Immunosuppressants 14 38 15.7 1.7 3
Bronchodilators 27 32 2.5 3.3 2.6
Dermatologicals 13 30 13 1.6 2.4
Sensory Organs 22 27 3.2 2.6 2.2
Anti-hypertensives 23 24 0.8 2.8 2
Source: Evaluate Pharma
The oncology market in India remains largely underpenetrated given the prohibitive
treatment costs, lack of access to diagnosis and treatment as well as low awareness. Access
to specialist care remains extremely limited with oncologists per capita in India being one of
the lowest in the world. Low awareness and low affordability have resulted in only 12.5% of
patients opting for treatment in early stages with c.70% of the patients seeking treatment at
the terminal stage.
Oncologists per capita in India one of the lowest in the world Exhibit 14.
Source: IQVIA
161
131
122115
88
74
6052
43 40
21 18 1711 8 7
1
0
20
40
60
80
100
120
140
160
180
Onco
logis
ts p
er
one m
illio
n o
f popula
tion
Rising cancer incidence and limited
access to treatment offer long runway
for growth

Natco Pharma 11 June 2019
JM Financial Institutional Securities Limited Page 10
Cancer is the second most common cause of death in India. The Indian Council of Medical
Research has estimated that by 2020, the total number of new cancer cases is likely to reach
nearly 1.73mn (up from 1.45mn in 2016) and over 0.88mn (up from 0.74mn in 2016) are
expected to succumb by 2020. Cervix and breast cancers in women and oral cavity and lung
cancers in men are the leading causes of fatalities and together account for c. 50% of
cancer-related deaths in India. However, due to deficiencies in data collection and screening,
the actual cancer incidence in India is expected to be much higher (c.150-200 per 1,00,000
people) as compared to the reported incidence (c.106 per 1,00,000 people in 2016).
Cancer incidence in India increasing Exhibit 15.
Source: Indian Council of Medical Research
The Indian oncology market was valued at c. INR 38bn in 2017 and is estimated to have
grown by c.11% in 2018. With increasing exposure to risk factors (tobacco use, pollution and
sedentary lifestyle), increasing affordability (owing to rising incomes and insurance
penetration), gradual improvements in access (diagnosis and treatment) and greater
awareness, the Indian cancer drug market is expected to continue to grow in double-digits
(c.13-15%) over the medium-term.
1.45
1.73
0.74
0.88
0.00
0.20
0.40
0.60
0.80
1.00
1.20
1.40
1.60
1.80
2.00
2016 2020 E
New cancer cases (mn) Cancer deaths (mn)

Natco Pharma 11 June 2019
JM Financial Institutional Securities Limited Page 11
Gastro Hepatology: Focus shifts to international markets
Natco established its presence in the Hepatitis C segment in 2015 by being the first company
in India to launch the generic version of Gilead’s Sovaldi (Sofosbuvir) under the Hepcinat
brand and currently occupies the top spot across the Hepatitis C class of drugs in India with
its sales and marketing efforts supported by a sales force of 120 representatives. Natco, along
with partner Laurus Labs, was one of the 11 players that entered into a non-exclusive
licensing agreement in 2015 to manufacture and market Gilead’s Hepatitis C portfolio in 91
developing countries (subsequently extended to 105 countries with a target population of c.
100mn people). Moreover, Natco entered into an agreement with Bristol Myers Squibb for
the sale of the generic version of Daklinza (Daclatasvir) in 112 developing countries. Natco
was also among the first few players to launch the generic version of Gilead’s Harvoni
(Ledipasvir+Sofosbuvir) in 2015 under the Hepcinat LP brand in India. Natco’s partnership
with Laurus offered it adequate access to API, while other players had to rely on external
sources or develop API in-house, giving Natco a significant competitive advantage. Natco
witnessed a 5x growth in Hepatitis C revenue in FY16 to INR 3.5bn with its 3 brands
capturing c.60% of the market.
Despite low prevalence of Hepatitis C (0.9%), India accounts for a significant share of global
Hepatitis C infections owing to its large population. c.12 million people in India are affected
by Hepatitis C. However, with increased competition (entry of c. 8-9 players including Cadila,
Cipla & Strides) and pricing pressure (over 50% decline in prices since launch) in the domestic
market, Natco’s Hepatitis C franchise has been under pressure over the past 2 years.
Moreover, unlike other therapies, Hepatitis C drugs do not offer opportunities for repeat
sales. We expect domestic Hepatology revenue to stabilize in FY20 and to be mainly driven by
the first-generic launch of Hepcinat Plus (Sofosbuvir+Daclatasvir) and by Natco’s emerging
Hepatitis B portfolio. Given the increased competitive intensity in the domestic market, Natco
is now aggressively focusing on leveraging its strong Hepatitis C portfolio in other developing
nations with significant growth potential. Besides the access to developing countries via
agreements with Gilead & Bristol Myers Squibb, Natco has received approvals for its Hepatitis
C drugs in 14 countries.
Domestic Hepatitis C segment facing increased competition Exhibit 16.
Source: Company, JM Financial
1003 990
800
700
780740
510
371
0
200
400
600
800
1,000
1,200
Q1FY18 Q2FY18 Q3FY18 Q4FY18 Q1FY19 Q2FY19 Q3FY19 Q4FY19
INR m
n
Leadership across Hepatitis C class of
drugs in India

Natco Pharma 11 June 2019
JM Financial Institutional Securities Limited Page 12
The global prevalence of Hepatitis C is estimated to be c.1.6%. Developing nations other
than India account for c.60% of global Hepatitis C infections. Moreover, Hepatitis C
prevalence in other developing nations is much higher than that in India.
Hepatitis C prevalence in other developing nations higher than that in India Exhibit 17.
Source: European Association for the Study of the Liver
Natco's Hepatitis C brands Exhibit 18.
Natco Brand Innovator Brand Molecule
Hepcinat Sovaldi Sofosbuvir
Hepcinat LP Harvoni Ledipasvir/Sofosbuvir
Natdac Daklinza Daclatasvir
Velpanat Epclusa Sofosbuvir + Velapatasvir
Hepcinat Plus Darvoni Sofosbuvir + Daclatasvir
Source: JM Financial, Company
Natco launched the first generic version of Sofosbuvir+Daclatasvir in India under its Hepcinat
Plus brand in July 2018. The fixed dose combination of Sofosbuvir+Daclatasvir was first
developed by Bangladesh-based Beacon Pharma under the Darvoni brand. Hepcinat Plus is
the cheapest available drug for the treatment of all 6 genotypes of Hepatitis C.
The cure rate of a drug indicated for Hepatitis C is measured in terms of SVR12, the sustained
virological response measured 12 weeks after the end of treatment. 100% SVR12 indicates
no detectable amount of Hepatitis C virus is present in the blood. Hepatitis C genotype 3 is
the most difficult genotype to treat. Gilead’s Epclusa, currently considered to be the most
effective treatment for genotype 3 (92% cure rate), was the first FDA approved drug to treat
all genotypes of Hepatitis C. Exhibit 19 indicates that Hepcinat Plus is as effective as Epclusa
in patients who have not been previously treated. In case of patients who failed previous
treatment, Hepcinat Plus is far superior. Mavyret, the first treatment of 8 weeks duration for
all Hepatitis C genotypes, was approved by FDA in 2017. Clinical trials conducted by Abbvie,
the manufacturer of Mavyret, indicated that the cure rate of Mavyret for genotype 3 was
lower than that of Hepcinat Plus even after 12 weeks. For genotypes 2, 5 and 6, the cure
rates with Sofosbuvir+Daclatasvir were 100% and for genotype 1, the cure rate with 12
weeks treatment of Sofosbuvir+Daclatasvir was 97% (comparable to Harvoni, the most
effective treatment for genotype 1). For genotype 4, the cure rate was 95%.Given that the
combination of Sofosbuvir+Daclatasvir is still under clinical trials in most countries, Natco
enjoys first-mover advantage in India and other developing countries.
14.7
11.3 11.210.8
6.7
4.33.2
2.7 2.31.7 1.7 1.6 1.6 1.4 1.3 1.3 0.9
0
2
4
6
8
10
12
14
16
Hep
C p
reva
len
ce (
%)
Increasing presence in other developing
nations with strong growth potential

Natco Pharma 11 June 2019
JM Financial Institutional Securities Limited Page 13
SVR12 for Genotype 3 with Epclusa & Hepcinat Plus (Sofosbuvir+Daclatasvir) Exhibit 19.
Source: European Association for the Study of the Liver
Natco launched the first-generic version of Tenofovir Alafenamide for the treatment of
Hepatitis B, under the brand Tafnat and under license from Gilead, in India in Dec 2017.This
was the third major launch in Natco’s emerging Hepatitis B portfolio which already comprises
Teravir (Tenofovir) and X-Vir (Entecavir). The Hepatitis B opportunity for Natco is expected to
be much larger as compared to Hepatitis C owing to the much greater global prevalence of
Hepatitis B (3.6% vs 1.6% for Hepatitis C). Moreover, most viral Hepatitis deaths result from
late complications of Hepatitis B.
Most viral Hepatitis deaths resulting from late complications of Hepatitis B Exhibit 20.
Source: WHO
9293
79
9192
87
70
75
80
85
90
95
Overall SVR Not previously treated Failed previous treatment
Epclusa Hepcinat Plus
0.8
66
30
3.2
0
10
20
30
40
50
60
70
HAV HBV HCV HEV
Perc
enta
ge o
f V
iral H
epatitis
death
s
First-mover advantage in Hepatitis B
and new treatment regimen for
Hepatitis C

Natco Pharma 11 June 2019
JM Financial Institutional Securities Limited Page 14
Cardiology and Diabetology: Poised to achieve scale
Natco had launched its Cardiology and Diabetology (CnD) division in early 2017 as part of its
strategy to expand its domestic footprint. The selection of Cardiology (2nd largest) and
Diabetology (4th largest) segments was driven by these segments being among the largest
and fastest growing therapeutic segments in India. Although Natco entered the market with
the launch of large commoditised products (Clinidipine, Bosentan, Teneligliptin and
Ivabradin), it is expected to launch niche products with high entry barriers over the next 2
years which could potentially contribute INR 1.5bn of annualised revenue by FY22. Natco had
launched the first Argatroban injection and Dabigatran in 2017 for the treatment of patients
with thrombosis syndrome. Natco’s strong CnD field force of c.125 sales representatives is
expected to help it achieve scale in these high-growth chronic segments.
Cardiology has the second largest share (c.12%) in the Indian pharma market and had
posted a growth of c.12% in CY18. Cardio vascular disease (CVD) is the leading cause of
death in India with the age-standardized deaths per 1,00,000 people resulting from CVD in
India (272) being higher than the global average (235). Diabetology has the fourth largest
share (c.9%) in the Indian pharma market and had posted a growth of c.13% in CY18. The
number of diabetics in India is estimated to be c.70mn. India has the second highest number
of patients with Type-2 diabetes in the world.
Natco’s approach to its domestic CnD division has been similar to its approach to the
developed markets with a clear focus on limited-competition high-value bets. Natco is willing
to face legal risks resulting from patent challenges given its strong track record of successfully
challenging innovators in the domestic market. Two major recent CnD launches which are
currently under litigation include Valsac (c. INR 1200 mn) and gBrilinta (c. INR 1500mn).
Natco had launched the generic version of Novartis’ Vymada (Valsartan-Sacubitril) in Jan
2019 under the brand Valsac. While Lupin and Cipla have launched the authorized generics
for Vymada at the innovator price, Natco had launched Valsac at a 40% discount to Vymada.
Valsac is now under litigation with Novartis being granted an injunction against Natco. The
earliest Vymada patent expiry is due in 2023. Natco’s gBrilinta (Ticagrelor) launch has faced
litigation challenge from innovator AstraZeneca with the court granting an injunction against
the sale of the generic version in May 2018. AstraZeneca has also filed similar lawsuits
against Dr Reddy’s and Micro Labs. Ticagrelor is a two-player market including the innovator
and Sun Pharma (authorized generic). Natco expects a favourable outcome in at least one of
the two litigations in CY19. With both Valsac and gBrilinta being high-margin products and
meaningful opportunities, a favourable outcome could offer significant value addition to
Natco’s CnD division.
Cardiology & Diabetology among the
largest and fastest growing therapies
in India

Natco Pharma 11 June 2019
JM Financial Institutional Securities Limited Page 15
Brazil & Canada: The new frontiers
Post its strategic reset and given its long-term goal of achieving c.80% of revenue outside
US, Natco expects its main international markets of Brazil and Canada to be the key earnings
drivers over the next 2 years. Natco operates through its subsidiaries in Brazil, Canada,
Singapore and Australia. Natco’s Kothur facility has been approved by the Brazilian Health
Regulatory Agency (ANVISA) and Health Canada. Natco’s subsidiaries in Singapore and
Australia currently account for less than 10% of its overall revenue from subsidiaries.
Natco had entered the Brazil market in 2011 and has made 9 oncology filings with ANVISA.
However, it achieved its first major breakthrough in Brazil in 2018 with an approval for its
first generic version of Letrozole. Natco subsequently received an approval for first-generic
version of Everolimus which is expected to generate annualized sales of c. USD 15mn. With
the major challenge of gaining product approval from ANVISA now addressed, visibility with
respect to approvals of major first-generic oncology filings is increasing. Natco’s Brazil
subsidiary achieved break even in FY19 and is expected to generate revenue of c. INR 1.3bn
in FY20.
Natco had entered Canada in 2012 and has a portfolio comprising a mix of in-house and in-
licensed products. Natco has an established front-end network in Canada with its strategy
revolving around leveraging its strong US portfolio in the Canadian market. The Canada
portfolio comprises 16 products including gTamiflu, gGleevec & gZofran. Natco expects two
first-generic approvals in Canada and revenue of c. INR 1bn in FY20.
Natco has made 2 product filings in China and is expected to file more products in FY20.
Natco has entered into partnerships with 2 companies in the Chinese market for product
filings and front-end distribution and expects to receive its first approval in FY22.
Besides its subsidiary markets, Natco has operations in Europe (mainly UK and Germany) as
well as emerging markets such as Vietnam, Mongolia, Myanmar, Venezuela and several other
Asian countries. In these RoW markets, Natco mainly operates through JVs or supply
agreements with local players and global distributors. Natco’s operations in RoW markets are
centred around its Hepatitis C and oncology portfolio. Natco is currently working on
establishing new channels to drive Hepatitis C sales in these markets. Natco has limited its
market penetration in Europe to only a few select products through its marketing partners.
Brazil & Canada operations set to witness rapid expansion Exhibit 21.
Source: Company, JM Financial
188 221
628
10571290
2320
3900
0
500
1000
1500
2000
2500
3000
3500
4000
4500
FY15 FY16 FY17 FY18 FY19 FY20E FY21E
INR m
n
Revenue from Brazil & Canada
Strong visibility on commercialization of
oncology pipeline in Brazil & Canada

Natco Pharma 11 June 2019
JM Financial Institutional Securities Limited Page 16
Agrochem Foray: Entry into niche molecules to bear fruit
Natco announced its foray into the niche agrichemical business in Jan 2019 with a green-field
manufacturing facility in Nellore. Natco has earmarked INR 1bn for the facility which will
manufacture agrichemical technical and formulation products. The facility is expected to be
commissioned by the end of CY19. Post the completion of field trials and the receipt of
regulatory approvals, the facility is expected to be commercialized by FY22. Natco expects the
agrichemical business to generate revenue of INR 2bn in FY22.
Natco’s agrochem foray is part of its strategy of diversifying its business by reducing the
reliance on its US portfolio, identifying opportunities in emerging markets and bringing in
new streams of revenue. Natco’s skillset in pharma, from a chemistry perspective, offers it a
significant competitive advantage in agrochem. Given Natco’s track record of identifying
niche opportunities in pharma, its niche agrochem venture complements its differentiated
R&D platform. In line with its core product strategy, Natco aims to focus on high-margin, difficult to source
agrichemical technical products with high manufacturing complexity. Recognising that the
agrochem business is a distribution game with distributors having significant bargaining
power, Natco is already working with partners to establish a front-end distribution network.
The partnership is expected to aid Natco in making inroads into the segment by reaching out
to farmers directly. India’s agrichemical industry, including exports, was valued at USD 4.1bn in FY16 and is
expected to double in size by FY25 to USD 8.1bn. Natco is expected to focus on products
losing patent protection over the next 5 years. Off-patent products account for c.82% of the
global agrichemical market. With multiple products coming off-patent over the next few
years, the share of off-patent products is expected to increase further.
Agrochem Active Ingredients Losing Patent Protection over 2019-2026 Exhibit 22.
Bixafen Flubendiamide Mandipropamid Pyroxsulam
Chlorantraniliprole Fluopicolide Penflufen Sedaxane
Cyantraniliprole Fluopyram Penthiopyrad Thiencarbazone-Methyl
Cyprosulfamide Fluxapyroxad Pinoxaden Valifenalate
Fenpyrazamine Isopyrazam Pyriofenone
Source: Enigma Marketing Research
Agrochem foray complements Natco’s
differentiated R&D platform and skillset
in chemistry

Natco Pharma 11 June 2019
JM Financial Institutional Securities Limited Page 17
Natco’s Para IV Opportunities: US pipeline underappreciated
Natco has been a late entrant in the US generics space with sales of under USD 20mn until
FY16. However, the launch of gTamiflu in Dec’16 (in partnership with Alvogen) and the
launch of gCopaxone (in partnership with Mylan) in Oct’17 catapulted Natco into the league
of companies with significant US presence. While gTamiflu was the major contributor in FY17
(c. USD 95mn) and FY18 (c. USD 60mn) with gDoxil and gFosrenol also aiding growth,
gCopaxone (c. USD 60mn) has been the key growth driver in FY19 and is expected to be the
major contributor in FY20-21. Natco has a strong pipeline of 38 approved ANDAs with 20
Para IVs yet to be launched. Natco’s Para IV pipeline, the value of which exceeds its current
US run-rate (ex-Tamiflu & ex-Copaxone), includes gRevlimid which is its largest opportunity to
date and is expected to contribute peak sales of USD 283mn and support its strong growth in
the US beyond FY22. An approval for gRevlimid is expected to be received in CY19. Natco is
expected to receive final approval for gNexavar (Para IV, Tentative Approval) in H2FY21.
gAfinitor and gTreanda are the other two Para IV launches expected in FY22.
Natco's major US launches Exhibit 23.
Innovator Brand Molecule Indication Para IV Para III
Copaxone Glatiramer Acetate Multiple Sclerosis ✔
Tamiflu Oseltamivir Phosphate Influenza ✔
Doxil Doxorubicin Hydrochloride Ovarian Cancer ✔
Vidaza Azacitidine Blood Cancer ✔
Fosrenol Lanthanum Carbonate Chronic Kidney Disease ✔
Nuvigil Armodafinil Narcolepsy ✔
Entocort Budesonide Crohn's disease ✔
Source: Company, JM Financial
Natco's Para IV pipeline Exhibit 24.
Innovator Brand Molecule Indication US market size
(USD mn)
Revlimid Lenalidomide Multiple Myeloma 6469
Imbruvica Ibrutinib Chronic Lymphocytic Leukemia 2968
Zytiga Abiraterone Acetate Prostate cancer 1771
Gilenya Fingolimod Multiple Sclerosis 1765
Pomalyst Pomalidomide Multiple Myeloma 1391
Aubagio Teriflunomide Multiple Sclerosis 1294
Eliquis Apixaban Anticoagulant 979
Afinitor Everolimus (higher strength) Kidney Cancer 929
Kyprolis Carfilzomib Multiple Myeloma 586
Tracleer Bosentan (lower strength) Pulmonary arterial hypertension 268
Tarceva Erlotinib Pancreatic Cancer 228
Nexavar Sorafenib Liver Cancer 216
Jevtana Cabazitaxel Prostate cancer 200
Zortress Everolimus Kidney Transplant 145
Treanda Bendamustine Hydrochloride Chronic Lymphocytic Leukemia 133
Sovaldi Sofosbuvir Anti-Viral / Hep C 130
Tykerb Lapatinib Ditosylate Breast Cancer 100
Source: Company, JM Financial
Value of Para IV pipeline exceeds current
US run-rate (ex-Tamiflu & ex-Copaxone)

Natco Pharma 11 June 2019
JM Financial Institutional Securities Limited Page 18
Natco has successfully implemented a partnership strategy to expand its US formulations
business. Besides product specific partnerships with global generic players at different stages
of a potential ANDA filing, Natco enters into de-risking arrangements with marketing
partners whereby the partner bears the responsibility of litigation and the regulatory process
to secure ANDA approval. In some cases, it enters into profit sharing arrangements with its
front-end partners to participate in the upside as witnessed in gTamiflu (Alvogen), gDoxil (Dr
Reddy’s) and gCopaxone (Mylan).
Natco has recently made significant investments (c. INR 2.5bn) towards building a
formulations plant in Visakhapatnam SEZ, with both cyto and non-cyto orals capability, in
order to de-risk its main formulations plant at Kothur. The plant is currently undergoing plant
validation and is expected to be a key contributor of incremental filings for US and other
regulated markets. The facility is expected to be commercialized in FY20. The management
has guided for 8 ANDA filings in FY20 including 3 niche filings.
Cumulative ANDA approvals & filings Exhibit 25.
Source: Company, JM Financial; Note: Approvals include Tentative Approvals
15 14
19
25
22 21
17 16
21
810 10 10
16
22
29
36
39
0
5
10
15
20
25
30
35
40
45
FY12 FY13 FY14 FY15 FY16 FY17 FY18 FY19 FY20E
Cumulative ANDA Filings Under Review Cumulative ANDA Approvals
Partnership strategy in US aids de-risking
litigations & the ANDA approval process
Natco Pharma 11 June 2019
JM Financial Institutional Securities Limited Page 19
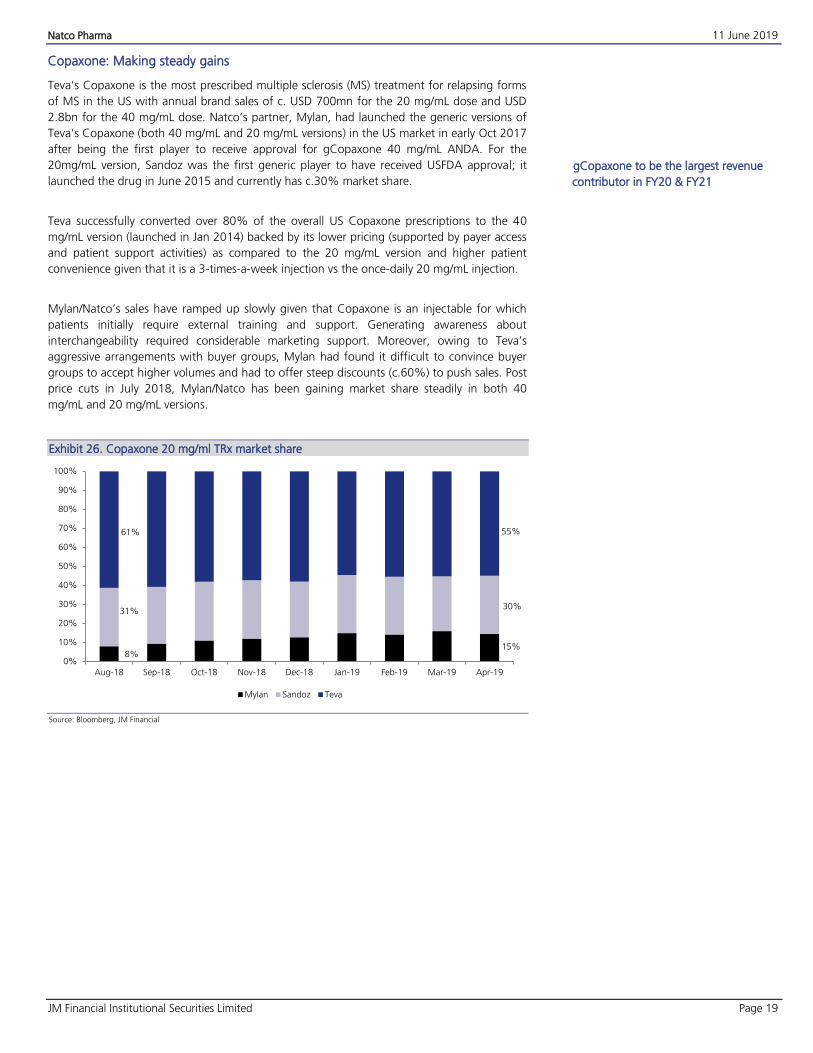
Copaxone: Making steady gains
Teva’s Copaxone is the most prescribed multiple sclerosis (MS) treatment for relapsing forms
of MS in the US with annual brand sales of c. USD 700mn for the 20 mg/mL dose and USD
2.8bn for the 40 mg/mL dose. Natco’s partner, Mylan, had launched the generic versions of
Teva’s Copaxone (both 40 mg/mL and 20 mg/mL versions) in the US market in early Oct 2017
after being the first player to receive approval for gCopaxone 40 mg/mL ANDA. For the
20mg/mL version, Sandoz was the first generic player to have received USFDA approval; it
launched the drug in June 2015 and currently has c.30% market share.
Teva successfully converted over 80% of the overall US Copaxone prescriptions to the 40
mg/mL version (launched in Jan 2014) backed by its lower pricing (supported by payer access
and patient support activities) as compared to the 20 mg/mL version and higher patient
convenience given that it is a 3-times-a-week injection vs the once-daily 20 mg/mL injection.
Mylan/Natco’s sales have ramped up slowly given that Copaxone is an injectable for which
patients initially require external training and support. Generating awareness about
interchangeability required considerable marketing support. Moreover, owing to Teva’s
aggressive arrangements with buyer groups, Mylan had found it difficult to convince buyer
groups to accept higher volumes and had to offer steep discounts (c.60%) to push sales. Post
price cuts in July 2018, Mylan/Natco has been gaining market share steadily in both 40
mg/mL and 20 mg/mL versions.
Copaxone 20 mg/ml TRx market share Exhibit 26.
Source: Bloomberg, JM Financial
8%15%
31%30%
61% 55%
0%
10%
20%
30%
40%
50%
60%
70%
80%
90%
100%
Aug-18 Sep-18 Oct-18 Nov-18 Dec-18 Jan-19 Feb-19 Mar-19 Apr-19
Mylan Sandoz Teva
gCopaxone to be the largest revenue
contributor in FY20 & FY21

Natco Pharma 11 June 2019
JM Financial Institutional Securities Limited Page 20
Copaxone 40 mg/ml TRx market share Exhibit 27.
Source: Bloomberg, JM Financial
Despite the prevalence of cheaper and convenient oral treatments for multiple sclerosis such
as Tecfidera (Biogen), Gilenya (Novartis) and Aubagio (Sanofi), Copaxone has been able to
maintain its leadership position due to its superior safety and efficacy profile. Dr Reddy's,
Amneal, Pfizer/Synthon and Biocon/Apotex are among the filers for both versions of
gCopaxone. While Synthon had received an approval for its generic 40 mg/mL version in
Europe in Oct 2017, Teva’s patents were upheld in Europe in April 2019. Dr Reddy’s has
received additional queries from the FDA and is not expected to receive an approval in FY20.
Biocon/Apotex’s response to the FDA’s CRL has been delayed and an approval in CY19 seems
unlikely. Amneal has not guided for a CY19 launch. Given that Sandoz, which had launched
the generic 40 mg/mL version in Feb 2018, has struggled to gain market share in 40 mg/mL
(currently c.2%), we expect Mylan/Natco to hold on to their market share in 40 mg/mL
(c.28%) in FY20 and expect a marginal decline (c.3%) in market share in FY21.
gCopaxone 40 mg/ml projections for Natco Exhibit 28.
FY20 FY21 FY22
Brand sales 2,777 2,777 2,777
Price erosion 70% 70% 70%
Mylan/Natco’s Market share 28% 25% 20%
Sales (USDmn) 233 208 167
Margin 70% 70% 70%
Profit (USDmn) 163 146 117
Natco’s share 30% 30% 30%
Natco’s Profit Share (USDmn) 49 44 35
Source: JM Financial
gCopaxone 20 mg/ml projections for Natco Exhibit 29.
FY20 FY21 FY22
Brand sales 700 700 700
Price erosion 70% 70% 70%
Mylan/Natco’s Market share 18% 15% 10%
Sales (USDmn) 38 32 21
Margin 70% 70% 70%
Profit (USDmn) 26 22 15
Natco’s share 30% 30% 30%
Natco’s Profit Share (USDmn) 8 7 4
Source: JM Financial
We expect Natco’s profit share from gCopaxone 40mg/mL and gCopaxone 20mg/mL to be
USD 49mn and USD 8mn respectively, in FY20. We arrive at a fair value of INR 46 for
gCopaxone 40mg/ml and INR 8 for the 20 mg/mL version.
20%
28%
2%
2%
78% 70%
0%
10%
20%
30%
40%
50%
60%
70%
80%
90%
100%
Aug-18 Sep-18 Oct-18 Nov-18 Dec-18 Jan-19 Feb-19 Mar-19 Apr-19
Mylan Sandoz Teva
Copaxone to continue to largely be a
3-player market in FY20

Natco Pharma 11 June 2019
JM Financial Institutional Securities Limited Page 21
Revlimid: Blockbuster waiting in the wings
Celgene’s Revlimid, an oral immunomodulatory drug, is the most widely used first- and
second-line multiple myeloma therapy and had recorded US sales of c. USD 6.5bn in 2018,
posting a CAGR of 21% over 2013-2018 and making it the biggest opportunity in Natco’s
US pipeline.
Revlimid's growth trajectory in US Exhibit 30.
Source: Company, JM Financial
Revlimid (Lenalidomide) is sold in the US through certified pharmacies under the Risk
Evaluation and Mitigation Strategy (REMS) program, to avoid embryo-fetal exposure to
Lenalidomide, making it difficult to source the samples to carry-out bioequivalence (BE)
studies required to develop and file an ANDA for the product and, thereby, limiting
competition. Moreover, Revlimid is a complex drug that is difficult to replicate.
In Dec 2015, Celgene settled ongoing litigations with Natco/Allergan and as part of the
settlement agreed to allow Natco/Allergan to start selling gRevlimid in Mar 2022, although
volumes would be restricted to a mid-single digit percentage of overall US volumes in the first
year which would gradually be relaxed every 12 months until Mar 2025, and will be restricted
to one-third of overall US volumes until Jan 2026, after which Natco/Allergan will be eligible
to sell unlimited volumes. Patents covering Revlimid in the US expire in Apr 2027. Natco’s
ability to market gRevlimid in the US is now contingent on USFDA approval for its ANDA.
Although Natco had partnered with Allergan to market the drug, following the sale of
Allergan’s generics business to Teva in 2015, Teva will be marketing the product in the US
while Allergan will be retaining 50% of Teva's future revenues from gRevlimid.
Dr Reddy’s, Mylan, Alvogen, Apotex and Sun Pharma are known to be the other players with
gRevlimid in their pipeline. Mylan had sued Celgene in Apr 2014 for refusing to sell sufficient
samples of Revlimid and Thalomid capsules needed for BE studies to develop the drug,
alleging anti-competitive behaviour. Following this, the Federal Trade Commission filed an
amicus brief in favour of Mylan. A separate class action suit has also been filed by insurers &
buyers against Celgene for denying samples to generic drug makers. Decisions in Mylan’s
anti-trust lawsuit and the class action suit are pending. In Feb 2019, the U.S. Patent and
Trademark Office dismissed Dr Reddy’s bid to invalidate 3 key Revlimid patents expiring in
2023. Celgene has also sued Apotex and Sun Pharma seeking to block their entry before the
expiry of the 3 patents. While the litigation is ongoing, chances of a generic launch by Dr
Reddy’s or other challengers before 2023 are slim. Moreover, any generic entry before 2026
could enable Natco to launch without restrictions on volumes depending on the terms of its
settlement. In March 2019, Celgene entered into a settlement, similar to that with Natco,
with Alvogen. However, under the terms of the settlement, Alvogen can only launch
sometime after the Mar 2022 date granted to Natco.
24892916
3535
4417
5426
6469
7245
7970
86079124
17%
21%
25%
23%
19%
12%
10%8%
6%
0%
5%
10%
15%
20%
25%
30%
0
1000
2000
3000
4000
5000
6000
7000
8000
9000
10000
CY13 CY14 CY15 CY16 CY17 CY18 CY19E CY20E CY21E CY22E
USD
mn
Revlimid US sales Growth YoY (%)
gRevlimid - Natco’s largest Para IV
opportunity - to be a strong growth driver
beyond FY22

Natco Pharma 11 June 2019
JM Financial Institutional Securities Limited Page 22
Natco is expected to receive approval in CY19. We expect Natco to achieve a peak profit
share of USD 283mn from gRevlimid. We value the gRevlimid opportunity at INR 143/share.
gRevlimid Projections for Natco Exhibit 31.
FY22 FY23 FY24 FY25 FY26 FY27 FY28
Revlimid US sales (US mn) 8,737 8,737 8,737 8,737 8,737 8,737 8,737
Price erosion 25% 30% 40% 50% 60% 70% 80%
Teva/Natco’s Market share 5% 15% 22% 27% 30% 25% 20%
Sales (USDmn) 27 917 1,153 1,179 1,048 655 349
Margin 80% 80% 80% 80% 75% 65% 60%
Profit (USDmn) 22 734 923 944 786 426 210
Natco’s share 30% 30% 30% 30% 30% 30% 30%
Natco’s Profit Share (USDmn) 7 220 277 283 236 128 63
Source: JM Financial

Natco Pharma 11 June 2019
JM Financial Institutional Securities Limited Page 23
Natco’s R&D capabilities: A Class Apart
Natco has adopted a differentiated approach towards R&D vis-à-vis its peers, focusing on
niche, limited competition products, which is reflected in the fact that c.50% of its ANDA
filings are Para IV filings. Natco’s R&D strengths are also validated by the fact that it was the
first player to launch generics for Tamiflu capsules and gCopaxone 40mg/mL injectables in
the US and by the willingness of major global pharma players to tie-up with Natco to market
its products in the US. Natco’s R&D infrastructure comprises over 40 laboratories across two
research facilities employing c.440 scientists with capabilities across synthetic chemistry,
biotech & fermentation, nano pharmaceuticals, new drug discovery and cell biology.
Natco’s R&D spend grew at a CAGR of 37% over FY14-FY19. Natco’s R&D spend increased
to 9.4% of sales in FY19 with its strong balance sheet offering adequate room to spend
aggressively on complex generic opportunities. While US filings were a major focus area
earlier (c.50% of R&D spend), Natco is now increasing its R&D focus on India (c.50%) and
other emerging markets (c.20%). Going forward, Natco’s R&D strategy for the US market will
be driven by identifying big-ticket opportunities along the lines of Copaxone and Revlimid. A
major recent big-ticket filing was gImbruvica (Ibrutinib; USD 3bn) which was filed in Jan 2019
in partnership with Alvogen and could potentially be granted FTF exclusivity.
A comparison of Natco’s R&D spend with that of other Indian pharma firms with strong R&D
focus indicates that Natco’s R&D engine is far more efficient with the ability to crack high-
value complex generic opportunities with lower R&D outlay. Two key components of Natco’s
superior technology and R&D platform are its effective R&D filters resulting in the
identification of high-value bets and its decision to play to its R&D strengths in the US with its
marketing partner bearing the responsibility of litigation and ANDA filing. The backward
integration for critical APIs (c.60% of ANDAs including all Para IVs) is a significant competitive
advantage for Natco.
Natco’s willingness to make risky bets and its ability to successfully challenge innovators in
the domestic market provide it with a head start in both domestic and international markets.
Natco’s Para IV filings for gRevlimid, gTarceva, gJevtana, gAfinitor, gNexavar, gTreanda,
gKyprolis, gPomalyst and gVidaza (Para III), which are all part of its domestic oncology
portfolio, and its Para IV filing for gSovaldi, part of its Hepatitis C portfolio, demonstrate its
strong ability to leverage its portfolio in international markets. Natco has filed 9 drugs from
its domestic oncology portfolio in Brazil and has received approvals for two drugs (Letrozole
& Everolimus).
Sharp growth in Natco's R&D Spend Exhibit 32.
Source: Company, JM Financial
R&D Spend: Natco vs Peers with strong R&D Focus Exhibit 33.
Source: Company, JM Financial
407517
703
1216
1665
1975
5.5%
6.3% 6.2%5.9%
7.6%
9.4%
0.0%
1.0%
2.0%
3.0%
4.0%
5.0%
6.0%
7.0%
8.0%
9.0%
10.0%
0
500
1000
1500
2000
2500
FY14 FY15 FY16 FY17 FY18 FY19
R&D Spend (INR mn) R&D Spend (% of sales)
5.5%6.3% 6.2% 5.9%
7.6%
9.4%9.4%
11.8%
11.5%
13.9%
12.9%
10.1%
8.4% 8.3%
11.7%
13.5%
11.9%
9.6%
5.4%
10.5%
12.6%
10.2%
9.2%
8.7%
4.0%
6.0%
8.0%
10.0%
12.0%
14.0%
16.0%
FY14 FY15 FY16 FY17 FY18 FY19
Natco Dr Reddy's Lupin Biocon

Natco Pharma 11 June 2019
JM Financial Institutional Securities Limited Page 24
Financial Analysis
While revenue growth in FY20 is expected to be muted with 8 new product launches in India,
4 in international markets (ex-US) and 3 new launches in US expected to offset the decline in
contribution from gTamiflu, we expect Natco to revert to a double-digit growth trajectory in
FY21 aided by strong double-digit growth in domestic oncology and strong offtake of first-
generic launches in Brazil & Canada. We expect the contribution from gCopaxone to be flat
in FY20 (USD 57mn) and to marginally decline in FY21 (USD 51mn).
Revenue expected to be back on double-digit growth trajectory in FY21 Exhibit 34.
Source: Company, JM Financial
EBITDA margin is expected to compress by 430 bps in FY20 owing to the decline in
contribution from high-margin (c.70%) gTamiflu. We expect margins to recover in FY21
aided by strong growth in Brazil & domestic oncology (margins much higher than corporate
average). We expect return ratios to remain above 15% levels in FY20 and to recover to
16%+ in FY21.
Margin recovery expected in FY21 Exhibit 35.
Source: Company, JM Financial
4831 5556 6605
73898253
11416
2065022020 20945
22259
25021
15%19%
12% 12%
38%
81%
7%
-5%
6%
12%
-10%
0%
10%
20%
30%
40%
50%
60%
70%
80%
90%
0
5000
10000
15000
20000
25000
30000
FY11 FY12 FY13 FY14 FY15 FY16 FY17 FY18 FY19 FY20E FY21E
INR m
n
Revenue Growth YoY (%)
33.1%
42.2%
37.9%
33.6%
35.2%
23.5%
31.6%30.8%
28.1%29.2%
20.0%
25.0%
30.0%
35.0%
40.0%
45.0%
FY17 FY18 FY19 FY20E FY21E
EBITDA Margin Net Profit Margin
Revenue growth, margins & return ratios
expected to recover in FY21

Natco Pharma 11 June 2019
JM Financial Institutional Securities Limited Page 25
Return ratios to remain healthy Exhibit 36.
Source: Company, JM Financial
Natco is debt-free with its Capex being funded with internal accruals. Despite significant
Capex (c. INR 3.5bn) expected to be incurred on the upcoming Visakhapatnam and
agrochem facilities in FY20 & FY21, we expect Natco’s balance sheet to remain strong.
Strong FCFE Yield & Balance Sheet Exhibit 37.
Source: Company, JM Financial
33.0%
29.5%
19.6%
16.7% 16.9%
30.5%
27.6%
18.4%
15.6%16.2%
10.0%
15.0%
20.0%
25.0%
30.0%
35.0%
FY17 FY18 FY19 FY20E FY21E
ROE ROCE
-0.4
-0.3
-0.2
-0.1
0.0
0.1
0.0%
2.0%
4.0%
6.0%
8.0%
10.0%
12.0%
FY17 FY18 FY19 FY20E FY21E
FCFE Yield Net Debt/Equity (RHS)

Natco Pharma 11 June 2019
JM Financial Institutional Securities Limited Page 26
Valuation
Natco is currently trading below its 10-year average trading range and at c.40% discount to
its 5-year trading range. We believe that the current valuations barely price in the base
earnings (Earnings excluding profit share from niche US launches) with the value of Natco’s
US portfolio and pipeline not factored in. Given Natco’s track record of identifying and
exploiting niche opportunities, we believe that the CMP does not capture any potential
upside to Natco’s base earnings and offers an attractive entry point.
Valuations more attractive than ever Exhibit 38.
Source: Bloomberg, JM Financial
We value Natco’s base business at 19x FY21E earnings; its 10-year average trading range. We
arrive at an NPV-based value of INR 143/share for the Revlimid opportunity and INR 54/share
for the Copaxone portfolio (40 mg/ml+20mg/ml). We estimate the value of Natco’s pipeline
with near-term launch visibility (Afinitor, Nexavar & Treanda) at INR 15/share. Initiate with
BUY with a Mar’20 TP of INR 640.
Natco Valuation Exhibit 39.
FY21E Base Earnings 22.5
Target Multiple on FY21E Base Earnings 19
Base business Value 428
Revlimid 143
Copaxone 40 mg/ml 46
Copaxone 20 mg/ml 8
Others (Afinitor, Nexavar & Treanda) 15
Fair Value (Mar’20) 640
Source: JM Financial
0
5
10
15
20
25
30
35
40
45
50
10-yr Average
5-yr Average
-1 SD
+1 SD
Risk-reward extremely favourable with base
earnings barely priced in and valuations at
10-year low

Natco Pharma 11 June 2019
JM Financial Institutional Securities Limited Page 27
Peer Comparison Exhibit 40.
Company Mkt Cap
(Rs bn) CMP (Rs)
PE (x) EV/EBITDA (x) ROE (%)
FY19 FY20E FY21E FY19 FY20E FY21E FY19 FY20E FY21E
Alkem Laboratories* 215 1797 34.0 22.0 17.8 21.0 15.4 12.8 13.5 16.6 17.9
Ajanta Pharma* 89 1020 23.2 20.8 17.4 15.5 13.9 11.7 18.1 17.6 18.3
Glenmark Pharma* 150 533 16.9 15.9 13.2 11.3 9.5 8.3 15.4 14.3 15.2
Torrent Pharma 257 1522 35.8 26.8 20.3 14.8 12.8 10.6 15.4 18.8 21.0
Alembic Pharma 94 501 16.1 15.1 14.3 11.6 10.4 9.2 23.8 21.1 18.9
Strides Pharma 38 429 11.8 13.9 10.1 13.6 8.8 6.5 12.7 10.0 12.4
Average 23.0 19.1 15.5 14.6 11.8 9.9 16.5 16.4 17.3
Natco Pharma 100 547 15.6 15.9 13.7 11.5 12.0 9.9 19.6 16.7 16.9
Source: JM Financial, Bloomberg; *Bloomberg Consensus Estimates; Note: Valuations as of 10/Jun/2019

Natco Pharma 11 June 2019
JM Financial Institutional Securities Limited Page 28
Company Background
Established in 1981 and headquartered in Hyderabad, Natco Pharma is a vertically integrated
R&D-driven pharma company engaged in the development, manufacture and marketing of
finished dosage formulations and active pharmaceutical ingredients. Natco also offers
contract manufacturing services to other leading pharma firms in India. Natco has two well-
equipped research centres and seven manufacturing facilities (five formulations and two API)
with a formulations facility in Visakhapatnam and an agrochem facility in Nellore currently
under development. In India, it is the market leader in oncology and gastro hepatology.
Natco entered the domestic cardiology and diabetology segments in 2017. In US, Natco is
focused on niche and difficult-to-make complex generics with recent launches such as
gTamiflu and gCopaxone highlighting its R&D capabilities. It partners with top generic
companies such as Mylan and Teva in the US which de-risks its business and allows it to focus
on its core R&D and manufacturing strengths while leaving litigation and marketing to its
partners. Natco markets its products in more than 40 countries and operates through its
subsidiaries in Brazil, Canada, Singapore and Australia.
Timeline of key events Exhibit 41.
Year Event
1981 Incorporated Natco Fine Pharmaceuticals Private Limited
1988 Inaugurated Parenterals manufacturing facility at Nagarajuna Sagar, Telangana
1993 Inaugurated Natco Laboratories Limited (Chemical division), Mekaguda, Telangana
1994 Incorporated Natco Organics Limited in Chennai
1995 Natco Parenterals Limited, Natco Laboratories Limited and Dr. Karanth Pharma Labs Private Limited merged
into Natco Pharma Limited
1997 Inaugurated Natco Research Centre, Hyderabad
2003 Launched Oncology division with introduction of flagship brand Veenat (generic Imatinib Mesylate) for the
treatment of chronic Myelogenous Leukemia
2007 Approval of first ANDA in the United States
2008 First Paragraph IV Certification application in the United States
Inaugurated facility at Dehradun, Uttarakhand
2011 Incorporated Natco Brazil
2012 Granted compulsory license from Bayer for patent-protected anti-cancer drug Nexavar (generic Sorafenib) in
India
2015 Launched generic Sofosbuvir in India and Nepal for Hepatitis C
Merged Natco Organics Limited with Natco Pharma
2016 Exited US-based pharmacy business
Launched gTamiflu capsules in the United States
2017
Launched Cardiology and Diabetology divisions for domestic market
Launched first generic version of Sofosbuvir/Velpatasvir in Nepal
Launched gCopaxone (20 mg/ml & 40 mg/ml) in the United States
Launched gDoxil, a complex drug delivery product, in the United States
Launched generic Tenofovir in India for Hepatitis B
2018 Launched first generic version of Teriflunomide in India for Multiple Sclerosis
Launched first generic version of Sofosbuvir/Daclatasvir in India
2019 Announced foray in Agrichemical business with a greenfield facility in Nellore, Andhra Pradesh
Source: Company, JM Financial

Natco Pharma 11 June 2019
JM Financial Institutional Securities Limited Page 29
Manufacturing facilities Exhibit 42.
Facility Capabilities Approvals
Kothur, Telangana Tablets, capsules, pellets and injectables USFDA, GMP (DCA), German Health Authority,
ANVISA (Brazil)
Nagarjunasagar,
Telangana
Ampoules, vials, lyophilized vials,
parenterals, sterile dry powders GMP (DCA)
Pharma City, Dehradun Tablets, capsules, injectables GMP (DCA)
UPSIDC Industrial Area,
Dehradun Tablets, capsules
GMP (DCA), Public Health Service of the Netherlands
(EU GMP)
Guwahati, Assam Tablets, capsules GMP (DCA)
Mekaguda, Telangana API USFDA, GMP (DCA), German Health Authority,
PMDA Japan, Cofepris (Mexico)
Chennai API GMP (Director of Drugs Control), USFDA
Source: Company, JM Financial
FDA inspection record of Natco's facilities Exhibit 43.
Facility Inspection Date USFDA Status
Kothur, Telangana
June 2019 9 Form 483 observations; observations procedural in nature
Jan 2017 6 Form 483 observations; EIR Received in July 2017
Mar 2016 Minor Form 483 observations; EIR Received in Aug 2016
May 2014 6 Form 483 observations; EIR Received in Sept 2014
Mekaguda,
Telangana Feb 2018 Zero observations; No Form 483 issued
Chennai Feb 2016 Minor Form 483 observations; EIR Received in Aug 2016
Source: Company, JM Financial
Key Management personnel Exhibit 44.
Management Bio
V. C. Nannapaneni, Chairman and
Managing Director
Mr. V.C. Nannapaneni has over 42 years of experience in the pharmaceutical Industry. He has more than a decade of experience in various pharmaceutical companies in the US. He holds
Bachelors and Master’s Degree in Pharmacy from Andhra University, India. He also holds a
Master’s degree in Pharmaceutical Administration from the Brooklyn College of Pharmacy, USA.
Along with general management, he oversees Natco's New Drug Discovery programme
Rajeev Nannapaneni,
Vice Chairman and
CEO
Mr. Rajeev Nannapaneni joined the company in 2000. He has previously worked at Merrill Lynch and Natco Systems LL.C in USA.. He has experience in General Management & New Business/New Product Development in India and in international markets. He holds a B.A. degree
in Quantitative Economics and a B.A. in History from Tufts University, Boston, USA.
Dr. Linga Rao,
President - Technical
Affairs
Dr.D.Linga Rao has over 39 years of experience in the pharmaceutical industry and has been working with Natco for over 21 years. He has vast experience in various departments including
R&D, Quality Control and Quality Assurance. He has previously worked with Indian Drug & Pharmaceuticals Limited (IDPL) & Novochem Laboratories. He holds an M.Sc. in Applied
Chemistry (Organic Chemistry) & a Ph.D in Chemistry from JNTU, Hyderabad. He has also
undergone training on Applications of High Performance Liquid Chromatography in Singapore.
S. V. V. N. Appa Rao, Chief Financial
Officer
S. V. V. N. Appa Rao has been Chief Financial Officer of Natco Pharma Limited since 11-Feb’16. Mr. Rao served as Interim Chief Financial Officer of Natco Pharma Limited from Nov’14-Feb’16
and served as its Vice President of Finance & Accounts until 11-Feb’16. He has over 27 years of
experience including 22 years within the Company
Source: Company, JM Financial

Natco Pharma 11 June 2019
JM Financial Institutional Securities Limited Page 30
Key Risks to our thesis
Delayed ramp up in Brazil & Canada: A delay in the ramp up of new first generic launches
in Brazil & Canada and in approvals for new products could have an impact on Natco’s
expansion plans for these two focus markets.
Faster erosion in contribution from gCopaxone: We expect Copaxone to continue to be a
3 player market and Mylan/Natco to maintain their market share in FY20. However,
approvals to Biocon/Apotex and Amneal in H2CY19 could result in faster erosion in
contribution from gCopaxone.
Earlier than expected generic entry in Revlimid: While Celgene’s litigation with Dr Reddy’s
is ongoing and the chances of a generic entry before 2023 seem remote, an adverse
outcome in the litigation for Celgene and an at-risk launch by Dr Reddy’s could embolden
other challengers (Apotex & Sun) to seek an entry in the lucrative market. Earlier than
expected genericisation of Revlimid will result in faster price erosion and have a material
impact on our estimates.
Adverse observations and regulatory escalation at Kothur: Natco has had a clean FDA
inspection record at its flagship Kothur formulations facility. While the upcoming
Visakhapatnam facility will help de-risk filings from Kothur for the US market, adverse
observations and regulatory escalation at Kothur could result in a delay in approval for
key ANDA filings.

Natco Pharma 11 June 2019
JM Financial Institutional Securities Limited Page 31
Financial Tables (Consolidated)
Income Statement (INR mn)
Y/E March FY17A FY18A FY19A FY20E FY21E
Net Sales 20,650 22,020 20,945 22,259 25,021
Sales Growth 80.9% 6.6% -4.9% 6.3% 12.4%
Other Operating Income 0 0 0 0 0
Total Revenue 20,650 22,020 20,945 22,259 25,021
Cost of Goods Sold/Op. Exp 5,991 4,111 3,542 3,784 4,203
Personnel Cost 2,432 3,256 3,559 4,130 4,623
Other Expenses 5,393 5,369 5,896 6,858 7,398
EBITDA 6,834 9,284 7,948 7,486 8,796
EBITDA Margin 33.1% 42.2% 37.9% 33.6% 35.2%
EBITDA Growth 153.4% 35.9% -14.4% -5.8% 17.5%
Depn. & Amort. 544 662 810 969 1,137
EBIT 6,290 8,622 7,138 6,517 7,659
Other Income 139 404 1,302 1,684 1,843
Finance Cost 185 154 193 181 143
PBT before Excep. & Forex 6,244 8,872 8,247 8,021 9,359
Excep. & Forex Inc./Loss(-) 0 0 0 0 0
PBT 6,244 8,872 8,247 8,021 9,359
Taxes 1,394 1,920 1,823 1,765 2,059
Extraordinary Inc./Loss(-) 0 0 0 0 0
Assoc. Profit/Min. Int.(-) 11 10 20 9 5
Reported Net Profit 4,861 6,962 6,444 6,265 7,305
Adjusted Net Profit 4,861 6,962 6,444 6,265 7,305
Net Margin 23.5% 31.6% 30.8% 28.1% 29.2%
Diluted Share Cap. (mn) 174.2 179.7 184.0 182.5 182.5
Diluted EPS (INR) 27.9 38.8 35.0 34.3 40.0
Diluted EPS Growth 206.4% 38.9% -9.6% -2.0% 16.6%
Total Dividend + Tax 1,416 1,817 1,501 1,095 1,095
Dividend Per Share (INR) 6.7 8.4 6.5 4.8 4.8
Source: Company, JM Financial
Cash Flow Statement (INR mn)
Y/E March FY17A FY18A FY19A FY20E FY21E
Profit before Tax 6,244 8,872 8,247 8,021 9,359
Depn. & Amort. 544 662 810 969 1,137
Net Interest Exp. / Inc. (-) 82 -97 -1,109 -1,504 -1,700
Inc (-) / Dec in WCap. -2,528 -2,946 0 -553 -1,162
Others 374 191 0 0 0
Taxes Paid -1,258 -2,045 -1,823 -1,765 -2,059
Operating Cash Flow 3,458 4,637 6,125 5,169 5,575
Capex -2,792 -4,225 -2,896 -3,520 -3,020
Free Cash Flow 666 412 3,229 1,649 2,555
Inc (-) / Dec in Investments -75 -285 -1,661 0 0
Others -127 -6,645 -3,295 1,684 1,843
Investing Cash Flow -2,994 -11,155 -7,852 -1,836 -1,177
Inc / Dec (-) in Capital 0 8,956 -775 0 0
Dividend + Tax thereon -1,409 -1,814 -1,501 -1,095 -1,095
Inc / Dec (-) in Loans 2,074 1,732 5,994 2,863 1,363
Others -158 -158 -193 -181 -143
Financing Cash Flow 507 8,716 3,525 1,587 125
Inc / Dec (-) in Cash -7 -18 66 1,058 1,160
Opening Cash Balance 242 235 217 283 1,341
Closing Cash Balance 235 217 283 1,341 2,500
Source: Company, JM Financial
Balance Sheet (INR mn)
Y/E March FY17A FY18A FY19A FY20E FY21E
Shareholders’ Fund 16,493 30,722 34,890 40,060 46,270
Share Capital 349 369 365 365 365
Reserves & Surplus 16,144 30,353 34,525 39,695 45,905
Preference Share Capital 0 0 0 0 0
Minority Interest 41 38 20 11 6
Total Loans 2,216 1,732 3,863 3,363 1,863
Def. Tax Liab. / Assets (-) 150 139 116 116 116
Total - Equity & Liab. 18,900 32,631 38,889 43,550 48,256
Net Fixed Assets 11,693 14,986 18,648 21,699 24,082
Gross Fixed Assets 11,456 13,955 16,804 20,304 23,304
Intangible Assets 131 149 196 216 236
Less: Depn. & Amort. 3,257 3,918 4,728 5,697 6,834
Capital WIP 3,363 4,800 6,376 6,876 7,376
Investments 322 6,907 8,633 8,633 8,633
Current Assets 11,161 15,258 15,750 17,571 20,336
Inventories 3,489 4,384 5,290 5,622 6,319
Sundry Debtors 4,752 6,375 5,062 5,379 6,047
Cash & Bank Balances 358 1,837 2,795 3,853 5,012
Loans & Advances 35 45 71 71 71
Other Current Assets 2,527 2,617 2,532 2,646 2,886
Current Liab. & Prov. 4,276 4,520 4,142 4,353 4,795
Current Liabilities 2,635 2,699 2,178 2,314 2,600
Provisions & Others 1,641 1,821 1,964 2,039 2,195
Net Current Assets 6,885 10,738 11,608 13,218 15,540
Total – Assets 18,900 32,631 38,889 43,550 48,256
Source: Company, JM Financial
Dupont Analysis
Y/E March FY17A FY18A FY19A FY20E FY21E
Net Margin 23.5% 31.6% 30.8% 28.1% 29.2%
Asset Turnover (x) 1.2 0.8 0.6 0.5 0.5
Leverage Factor (x) 1.1 1.1 1.1 1.1 1.1
RoE 33.0% 29.5% 19.6% 16.7% 16.9%
Key Ratios
Y/E March FY17A FY18A FY19A FY20E FY21E
BV/Share (INR) 94.7 171.0 189.6 219.5 253.5
ROIC 31.1% 32.3% 21.8% 17.4% 18.3%
ROE 33.0% 29.5% 19.6% 16.7% 16.9%
Net Debt/Equity (x) 0.1 -0.2 -0.2 -0.2 -0.3
P/E (x) 19.6 14.1 15.6 15.9 13.7
P/B (x) 5.8 3.2 2.9 2.5 2.2
EV/EBITDA (x) 14.6 9.9 11.5 12.0 9.9
EV/Sales (x) 4.8 4.2 4.4 4.0 3.5
Debtor days 84 106 88 88 88
Inventory days 62 73 92 92 92
Creditor days 69 77 61 57 58
Source: Company, JM Financial

Natco Pharma 11 June 2019
JM Financial Institutional Securities Limited Page 32
APPENDIX I
JM Financial Institutional Securit ies Limited ( fo rmer l y known as JM F inanc ia l Secur i t i e s L im i ted)
Corporate Identity Number: U67100MH2017PLC296081 Member of BSE Ltd., National Stock Exchange of India Ltd. and Metropolitan Stock Exchange of India Ltd.
SEBI Registration Nos.: Stock Broker - INZ000163434, Research Analyst – INH000000610
Registered Office: 7th Floor, Cnergy, Appasaheb Marathe Marg, Prabhadevi, Mumbai 400 025, India. Board: +9122 6630 3030 | Fax: +91 22 6630 3488 | Email: [email protected] | www.jmfl.com
Compliance Officer: Mr. Sunny Shah | Tel: +91 22 6630 3383 | Email: [email protected]
Definition of ratings
Rating Meaning
Buy Total expected returns of more than 15%. Total expected return includes dividend yields.
Hold Price expected to move in the range of 10% downside to 15% upside from the current market price.
Sell Price expected to move downwards by more than 10%
Research Analyst(s) Certification The Research Analyst(s), with respect to each issuer and its securities covered by them in this research report, certify that: All of the views expressed in this research report accurately reflect his or her or their personal views about all of the issuers and their securities; and No part of his or her or their compensation was, is, or will be directly or indirectly related to the specific recommendations or views expressed in this research report. Important Disclosures This research report has been prepared by JM Financial Institutional Securities Limited (JM Financial Institutional Securities) to provide information about the
company(ies) and sector(s), if any, covered in the report and may be distributed by it and/or its associates solely for the purpose of information of the select
recipient of this report. This report and/or any part thereof, may not be duplicated in any form and/or reproduced or redistributed without the prior written
consent of JM Financial Institutional Securities. This report has been prepared independent of the companies covered herein.
JM Financial Institutional Securities is registered with the Securities and Exchange Board of India (SEBI) as a Research Analyst and a Stock Broker having trading
memberships of the BSE Ltd. (BSE), National Stock Exchange of India Ltd. (NSE) and Metropolitan Stock Exchange of India Ltd. (MSEI). No material disciplinary
action has been taken by SEBI against JM Financial Institutional Securities in the past two financial years which may impact the investment decision making of the
investor.
JM Financial Institutional Securities renders stock broking services primarily to institutional investors and provides the research services to its institutional
clients/investors. JM Financial Institutional Securities and its associates are part of a multi-service, integrated investment banking, investment management,
brokerage and financing group. JM Financial Institutional Securities and/or its associates might have provided or may provide services in respect of managing
offerings of securities, corporate finance, investment banking, mergers & acquisitions, broking, financing or any other advisory services to the company(ies)
covered herein. JM Financial Institutional Securities and/or its associates might have received during the past twelve months or may receive compensation from
the company(ies) mentioned in this report for rendering any of the above services.
JM Financial Institutional Securities and/or its associates, their directors and employees may; (a) from time to time, have a long or short position in, and buy or sell
the securities of the company(ies) mentioned herein or (b) be engaged in any other transaction involving such securities and earn brokerage or other
compensation or act as a market maker in the financial instruments of the company(ies) covered under this report or (c) act as an advisor or lender/borrower to,
or may have any financial interest in, such company(ies) or (d) considering the nature of business/activities that JM Financial Institutional Securities is engaged in,
it may have potential conflict of interest at the time of publication of this report on the subject company(ies).
Neither JM Financial Institutional Securities nor its associates or the Research Analyst(s) named in this report or his/her relatives individually own one per cent or
more securities of the company(ies) covered under this report, at the relevant date as specified in the SEBI (Research Analysts) Regulations, 2014.
The Research Analyst(s) principally responsible for the preparation of this research report and members of their household are prohibited from buying or selling
debt or equity securities, including but not limited to any option, right, warrant, future, long or short position issued by company(ies) covered under this report.
The Research Analyst(s) principally responsible for the preparation of this research report or their relatives (as defined under SEBI (Research Analysts) Regulations,
2014); (a) do not have any financial interest in the company(ies) covered under this report or (b) did not receive any compensation from the company(ies) covered
under this report, or from any third party, in connection with this report or (c) do not have any other material conflict of interest at the time of publication of this
report. Research Analyst(s) are not serving as an officer, director or employee of the company(ies) covered under this report.
While reasonable care has been taken in the preparation of this report, it does not purport to be a complete description of the securities, markets or
developments referred to herein, and JM Financial Institutional Securities does not warrant its accuracy or completeness. JM Financial Institutional Securities may
not be in any way responsible for any loss or damage that may arise to any person from any inadvertent error in the information contained in this report. This
report is provided for information only and is not an investment advice and must not alone be taken as the basis for an investment decision.

Natco Pharma 11 June 2019
JM Financial Institutional Securities Limited Page 33
The investment discussed or views expressed or recommendations/opinions given herein may not be suitable for all investors. The user assumes the entire risk of
any use made of this information. The information contained herein may be changed without notice and JM Financial Institutional Securities reserves the right to
make modifications and alterations to this statement as they may deem fit from time to time.
This report is neither an offer nor solicitation of an offer to buy and/or sell any securities mentioned herein and/or not an official confirmation of any transaction.
This report is not directed or intended for distribution to, or use by any person or entity who is a citizen or resident of or located in any locality, state, country or
other jurisdiction, where such distribution, publication, availability or use would be contrary to law, regulation or which would subject JM Financial Institutional
Securities and/or its affiliated company(ies) to any registration or licensing requirement within such jurisdiction. The securities described herein may or may not be
eligible for sale in all jurisdictions or to a certain category of investors. Persons in whose possession this report may come, are required to inform themselves of
and to observe such restrictions.
Persons who receive this report from JM Financial Singapore Pte Ltd may contact Mr. Ruchir Jhunjhunwala ([email protected]) on +65 6422 1888 in
respect of any matters arising from, or in connection with, this report.
Additional disclosure only for U.S. persons: JM Financial Institutional Securities has entered into an agreement with JM Financial Securities, Inc. ("JM Financial
Securities"), a U.S. registered broker-dealer and member of the Financial Industry Regulatory Authority ("FINRA") in order to conduct certain business in the
United States in reliance on the exemption from U.S. broker-dealer registration provided by Rule 15a-6, promulgated under the U.S. Securities Exchange Act of
1934 (the "Exchange Act"), as amended, and as interpreted by the staff of the U.S. Securities and Exchange Commission ("SEC") (together "Rule 15a-6").
This research report is distributed in the United States by JM Financial Securities in compliance with Rule 15a-6, and as a "third party research report" for
purposes of FINRA Rule 2241. In compliance with Rule 15a-6(a)(3) this research report is distributed only to "major U.S. institutional investors" as defined in Rule
15a-6 and is not intended for use by any person or entity that is not a major U.S. institutional investor. If you have received a copy of this research report and are
not a major U.S. institutional investor, you are instructed not to read, rely on, or reproduce the contents hereof, and to destroy this research or return it to JM
Financial Institutional Securities or to JM Financial Securities.
This research report is a product of JM Financial Institutional Securities, which is the employer of the research analyst(s) solely responsible for its content. The
research analyst(s) preparing this research report is/are resident outside the United States and are not associated persons or employees of any U.S. registered
broker-dealer. Therefore, the analyst(s) are not subject to supervision by a U.S. broker-dealer, or otherwise required to satisfy the regulatory licensing
requirements of FINRA and may not be subject to the Rule 2241 restrictions on communications with a subject company, public appearances and trading
securities held by a research analyst account.
JM Financial Institutional Securities only accepts orders from major U.S. institutional investors. Pursuant to its agreement with JM Financial Institutional Securities,
JM Financial Securities effects the transactions for major U.S. institutional investors. Major U.S. institutional investors may place orders with JM Financial
Institutional Securities directly, or through JM Financial Securities, in the securities discussed in this research report.
Additional disclosure only for U.K. persons: Neither JM Financial Institutional Securities nor any of its affiliates is authorised in the United Kingdom (U.K.) by the
Financial Conduct Authority. As a result, this report is for distribution only to persons who (i) have professional experience in matters relating to investments
falling within Article 19(5) of the Financial Services and Markets Act 2000 (Financial Promotion) Order 2005 (as amended, the "Financial Promotion Order"), (ii)
are persons falling within Article 49(2)(a) to (d) ("high net worth companies, unincorporated associations etc.") of the Financial Promotion Order, (iii) are outside
the United Kingdom, or (iv) are persons to whom an invitation or inducement to engage in investment activity (within the meaning of section 21 of the Financial
Services and Markets Act 2000) in connection with the matters to which this report relates may otherwise lawfully be communicated or caused to be
communicated (all such persons together being referred to as "relevant persons"). This report is directed only at relevant persons and must not be acted on or
relied on by persons who are not relevant persons. Any investment or investment activity to which this report relates is available only to relevant persons and will
be engaged in only with relevant persons.
Additional disclosure only for Canadian persons: This report is not, and under no circumstances is to be construed as, an advertisement or a public offering of the
securities described herein in Canada or any province or territory thereof. Under no circumstances is this report to be construed as an offer to sell securities or as
a solicitation of an offer to buy securities in any jurisdiction of Canada. Any offer or sale of the securities described herein in Canada will be made only under an
exemption from the requirements to file a prospectus with the relevant Canadian securities regulators and only by a dealer properly registered under applicable
securities laws or, alternatively, pursuant to an exemption from the registration requirement in the relevant province or territory of Canada in which such offer or
sale is made. This report is not, and under no circumstances is it to be construed as, a prospectus or an offering memorandum. No securities commission or
similar regulatory authority in Canada has reviewed or in any way passed upon these materials, the information contained herein or the merits of the securities
described herein and any representation to the contrary is an offence. If you are located in Canada, this report has been made available to you based on your
representation that you are an “accredited investor” as such term is defined in National Instrument 45-106 Prospectus Exemptions and a “permitted client” as
such term is defined in National Instrument 31-103 Registration Requirements, Exemptions and Ongoing Registrant Obligations. Under no circumstances is the
information contained herein to be construed as investment advice in any province or territory of Canada nor should it be construed as being tailored to the
needs of the recipient. Canadian recipients are advised that JM Financial Securities, Inc., JM Financial Institutional Securities Limited, their affiliates and authorized
agents are not responsible for, nor do they accept, any liability whatsoever for any direct or consequential loss arising from any use of this research report or the
information contained herein.