india daily, september 3, 2018 - kotak securities...india strategy 4 kotak institutional equities...
TRANSCRIPT
For Private Circulation Only. FOR IMPORTANT INFORMATION ABOUT KOTAK SECURITIES’ RATING SYSTEM AND OTHER DISCLOSURES. REFER TO THE END OF THIS MATERIAL.
Contents
Special Reports
Strategy
Strategy: The curious case of the Indian aviation industry, Part 2
Theme Report
Banks: Smooth growth trajectory
Daily Alerts
Company alerts
Infosys: In conversation with the CEO
Coal India: The base catches up
Godrej Consumer Products: Divests 100% stake in the UK business
United Breweries: AR2018 analysis - a solid year on all counts
Balkrishna Industries: Investing in greenfield capacity in US
Sector alerts
Real Estate: Supreme Court bans all construction in three states
Telecom: Speed Tracker 3.0; interesting data points from Ookla’s latest report
Economy alerts
Economy: Economic recovery underway but risks abound
Economy: GST: Revenues well below target
INDIA DAILY September 3, 2018
India 31-Aug 1-day 1-mo 3-mo
Sensex 38,645 (0.1) 2.9 9.7
Nifty 11,681 0.0 2.8 9.2
Global/Regional indices
Dow Jones 25,965 (0.1) 2.0 5.4
Nasdaq Composite 8,110 0.3 3.8 7.3
FTSE 7,432 (1.1) (3.0) (3.5)
Nikkei 22,751 (0.5) 1.0 2.6
Hang Seng 27,889 (1.0) 0.8 (8.5)
KOSPI 2,311 (0.5) 1.0 (5.3)
Value traded – India
Cash (NSE+BSE) 461 368 338
Derivatives (NSE) 5,552 5,294 18,34
9
Deri. open interest 3,406 3,475 4,654
Forex/money market
Change, basis points
31-Aug 1-day 1-mo 3-mo
Rs/US$ 71.0 16 245 390
10yr govt bond, % 8.2 - 8 3
Net investment (US$ mn)
30-Aug MTD CYTD
FIIs 113 - (283)
MFs (21) - 11,700
Top movers
Change, %
Best performers 31-Aug 1-day 1-mo 3-mo
SUNP IN Equity 653 2.0 11.4 34.8
RIL IN Equity 1,242 (2.6) 5.5 33.4
ARBP IN Equity 713 3.7 14.4 33.1
DRRD IN Equity 2,492 4.7 9.2 28.4
CIPLA IN Equity 662 2.0 3.3 26.2
Worst performers
IDEA IN Equity 49 (1.0) (10.6) (20.1)
HPCL IN Equity 254 0.3 (13.3) (18.7)
JPA IN Equity 12 1.7 (20.3) (18.2)
TTMT/A IN Equity 142 2.8 (0.5) (18.2)
AL IN Equity 129 (1.4) 9.2 (14.5)

For Private Circulation Only. FOR IMPORTANT INFORMATION ABOUT KOTAK SECURITIES’ RATING SYSTEM AND OTHER DISCLOSURES, REFER TO THE END OF THIS MATERIAL.
Does the aircraft leasing model work against industry profitability?
We wonder if the easy availability of aircraft through leasing (direct or sale-and-leaseback) results
in poor industry structure through easy entry and exit of operators (limited upfront capital
commitment) and irrational pricing behavior (need to fill in the ASK (available seat kilometers) at
any price). Airlines seem happy to place huge orders for new aircraft with the aircraft
manufacturers in order to avail of large discounts from them, sell the acquired aircraft to aircraft
leasing companies at market prices and lease them back, which result in upfront cash and
staggered book profits for the airline companies.
Too much of a good thing
The easy availability of leased aircraft through direct leases or sale-and-leaseback deals may
force airline companies to adopt aggressive pricing to fill in seats (additional ASK) to meet the
future lease rental obligations. It seems to us that the industry is quite desperate to book any
revenue and is offering large discounts to fill the available capacity and have some confidence
about future revenues. However, an industry with all the major players operating at effectively
negative spreads (RASK-CASK) is clearly unsustainable for debt and equity holders both.
JETIN’s advance lease incentives and Air India’s equity infusion are unlikely to solve the problem
JETIN has received an additional US$300 mn of advance lease incentives and debt recently and
Air India will reportedly receive `9.8 bn of equity from the Indian government. We doubt this
will address the industry’s dire financial condition (see Exhibit 1 for the quarterly results of the
listed players from 1QFY19). In fact, JETIN’s `20-21 bn of additional inflows are equal to about
1.5 quarters of losses (based on 1QFY19 reported net loss of `13.2 bn). As for the reported
`9.8 bn of fresh equity infusion into Air India, we doubt it will achieve anything beyond AI
servicing its immediate loan repayments to avoid defaulting on all or part of its `514 bn debt
(as of March 31, 2017).
Still not sure why the industry cannot simply raise prices and solve its problems
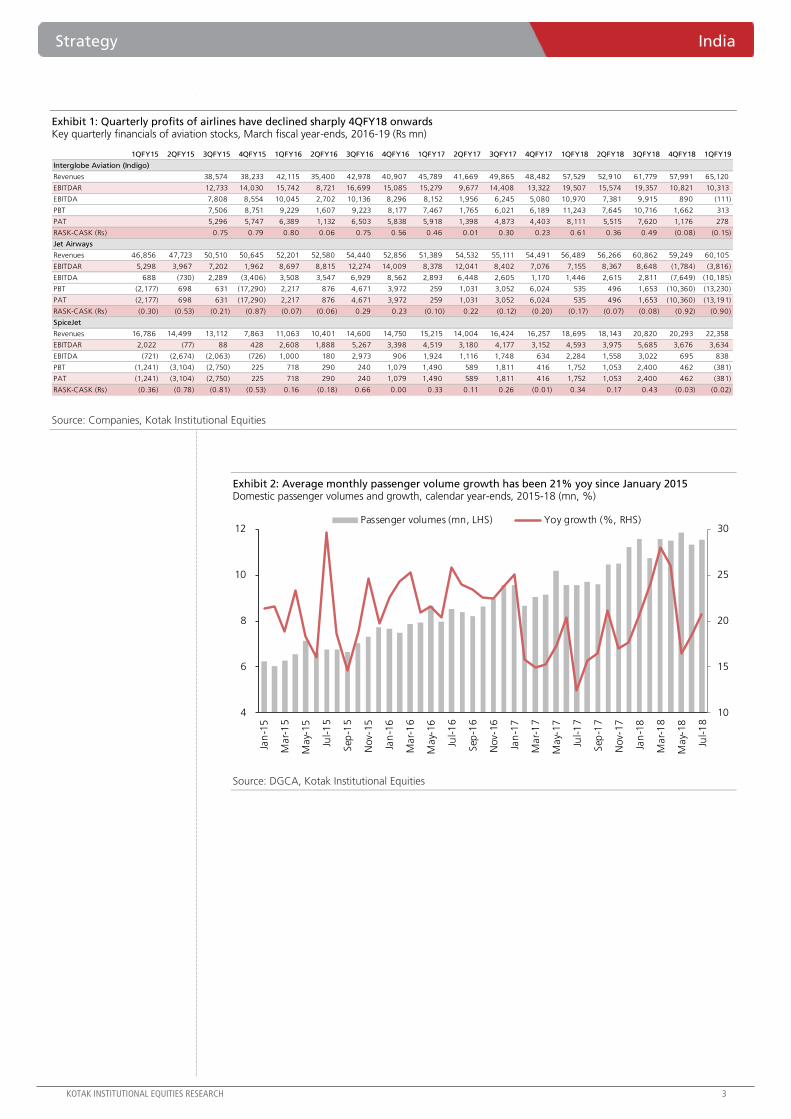
We have been quite puzzled by the industry’s inability to raise ticket prices (RASK) given (1) the
steep increase in input (fuel prices) and (2) continued strong growth in passenger volumes (see
Exhibit 2; 21% yoy monthly average growth rate for the past 43 months). Yields of the listed
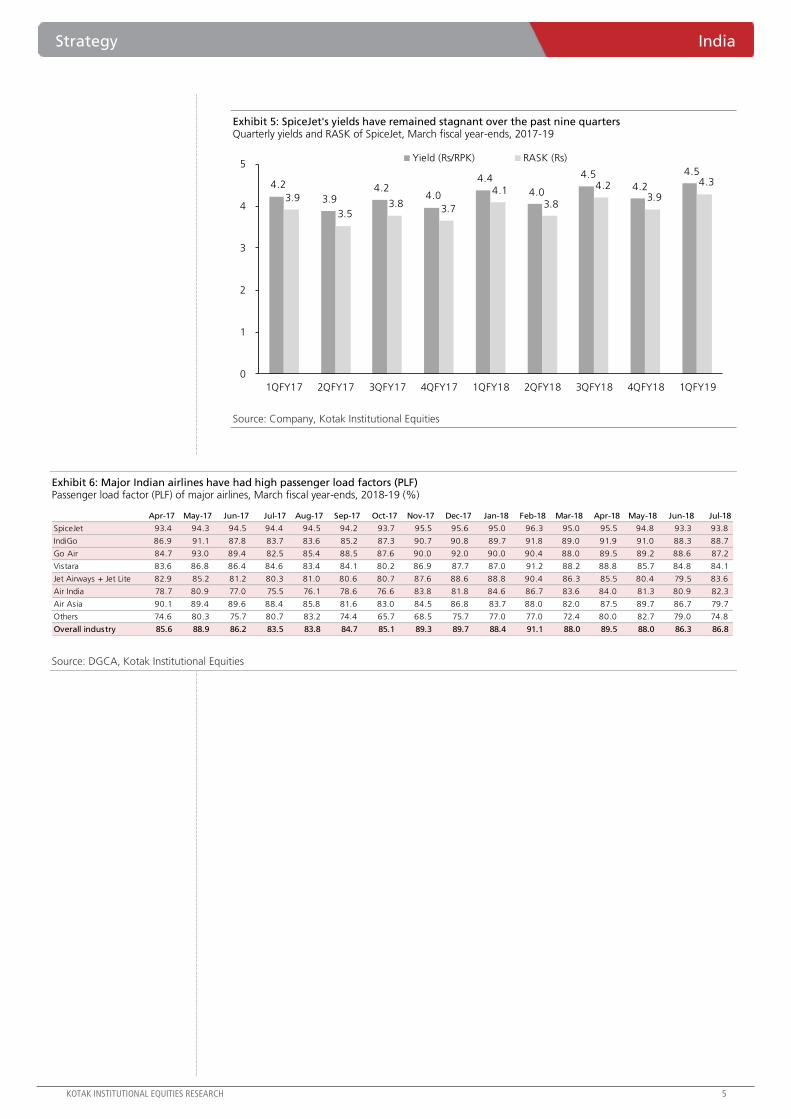
airline companies have come off over the past 12 months on a yoy basis (see Exhibits 3-5)
despite reasonably high PLF of the major airline companies (see Exhibit 6). The industry will likely
make even larger losses in 2QFY19 given a seasonally weak quarter and higher qoq input costs
(weaker INR). We can only hope that some sanity dawns on the industry, forced or incentivized
by the authorities, financiers, industry players and/or shareholders.
Strategy India
The curious case of the Indian aviation industry, Part 2. We wonder about the role
of financiers in exacerbating the current difficult financial condition of the Indian aviation
industry given the continued strange inability or reluctance of the companies to raise
prices despite large industry losses. The long history of airline bankruptcies should alert
them to similar risks in the Indian aviation sector and hopefully induce them to nudge
the industry participants towards a more rational pricing behavior.
INDIA
SEPTEMBER 03, 2018
UPDATE
BSE-30: 38,645
QUICK NUMBERS
Combined EBITDAR
of the three listed
aviation companies
declined 64%
between 4QFY17
and 1QFY19
INDIGO’s 1QFY19
spread (RASK –
CASK) at -`0.15;
JETIN at -`0.9
19% CAGR in
passenger volume
growth over
January 2015-July
2018
Sanjeev Prasad
Garima Mishra
Anindya Bhowmik
Strategy India
KOTAK INSTITUTIONAL EQUITIES RESEARCH 3
Exhibit 1: Quarterly profits of airlines have declined sharply 4QFY18 onwards Key quarterly financials of aviation stocks, March fiscal year-ends, 2016-19 (Rs mn)
Source: Companies, Kotak Institutional Equities
Exhibit 2: Average monthly passenger volume growth has been 21% yoy since January 2015 Domestic passenger volumes and growth, calendar year-ends, 2015-18 (mn, %)
Source: DGCA, Kotak Institutional Equities
1QFY15 2QFY15 3QFY15 4QFY15 1QFY16 2QFY16 3QFY16 4QFY16 1QFY17 2QFY17 3QFY17 4QFY17 1QFY18 2QFY18 3QFY18 4QFY18 1QFY19
Interglobe Aviation (Indigo)
Revenues 38,574 38,233 42,115 35,400 42,978 40,907 45,789 41,669 49,865 48,482 57,529 52,910 61,779 57,991 65,120
EBITDAR 12,733 14,030 15,742 8,721 16,699 15,085 15,279 9,677 14,408 13,322 19,507 15,574 19,357 10,821 10,313
EBITDA 7,808 8,554 10,045 2,702 10,136 8,296 8,152 1,956 6,245 5,080 10,970 7,381 9,915 890 (111)
PBT 7,506 8,751 9,229 1,607 9,223 8,177 7,467 1,765 6,021 6,189 11,243 7,645 10,716 1,662 313
PAT 5,296 5,747 6,389 1,132 6,503 5,838 5,918 1,398 4,873 4,403 8,111 5,515 7,620 1,176 278
RASK-CASK (Rs) 0.75 0.79 0.80 0.06 0.75 0.56 0.46 0.01 0.30 0.23 0.61 0.36 0.49 (0.08) (0.15)
Jet Airways
Revenues 46,856 47,723 50,510 50,645 52,201 52,580 54,440 52,856 51,389 54,532 55,111 54,491 56,489 56,266 60,862 59,249 60,105
EBITDAR 5,298 3,967 7,202 1,962 8,697 8,815 12,274 14,009 8,378 12,041 8,402 7,076 7,155 8,367 8,648 (1,784) (3,816)
EBITDA 688 (730) 2,289 (3,406) 3,508 3,547 6,929 8,562 2,893 6,448 2,605 1,170 1,446 2,615 2,811 (7,649) (10,185)
PBT (2,177) 698 631 (17,290) 2,217 876 4,671 3,972 259 1,031 3,052 6,024 535 496 1,653 (10,360) (13,230)
PAT (2,177) 698 631 (17,290) 2,217 876 4,671 3,972 259 1,031 3,052 6,024 535 496 1,653 (10,360) (13,191)
RASK-CASK (Rs) (0.30) (0.53) (0.21) (0.87) (0.07) (0.06) 0.29 0.23 (0.10) 0.22 (0.12) (0.20) (0.17) (0.07) (0.08) (0.92) (0.90)
SpiceJet
Revenues 16,786 14,499 13,112 7,863 11,063 10,401 14,600 14,750 15,215 14,004 16,424 16,257 18,695 18,143 20,820 20,293 22,358
EBITDAR 2,022 (77) 88 428 2,608 1,888 5,267 3,398 4,519 3,180 4,177 3,152 4,593 3,975 5,685 3,676 3,634
EBITDA (721) (2,674) (2,063) (726) 1,000 180 2,973 906 1,924 1,116 1,748 634 2,284 1,558 3,022 695 838
PBT (1,241) (3,104) (2,750) 225 718 290 240 1,079 1,490 589 1,811 416 1,752 1,053 2,400 462 (381)
PAT (1,241) (3,104) (2,750) 225 718 290 240 1,079 1,490 589 1,811 416 1,752 1,053 2,400 462 (381)
RASK-CASK (Rs) (0.36) (0.78) (0.81) (0.53) 0.16 (0.18) 0.66 0.00 0.33 0.11 0.26 (0.01) 0.34 0.17 0.43 (0.03) (0.02)
10
15
20
25
30
4
6
8
10
12
Jan
-15
Mar-
15
May-
15
Jul-1
5
Sep
-15
Nov-
15
Jan
-16
Mar-
16
May-
16
Jul-1
6
Sep
-16
Nov-
16
Jan
-17
Mar-
17
May-
17
Jul-1
7
Sep
-17
Nov-
17
Jan
-18
Mar-
18
May-
18
Jul-1
8
Passenger volumes (mn, LHS) Yoy growth (%, RHS)

India Strategy
4 KOTAK INSTITUTIONAL EQUITIES RESEARCH
Exhibit 3: INDIGO's yields have remained stagnant for the past nine quarters Quarterly yields and RASK of Interglobe Aviation, March fiscal year-ends, 2017-19
Source: Company, Kotak Institutional Equities
Exhibit 4: JETIN's yields have declined over the past nine quarters Quarterly yields and RASK of Jet Airways, March fiscal year-ends, 2017-19
Source: Company, Kotak Institutional Equities
4.3
3.8 4.0 4.0
4.3 4.2
4.3
3.8 4.1
3.6
3.1
3.5 3.4
3.8
3.5
3.8
3.4 3.7
0
1
2
3
4
5
1QFY17 2QFY17 3QFY17 4QFY17 1QFY18 2QFY18 3QFY18 4QFY18 1QFY19
Yield (Rs/RPK) RASK (Rs)
6.4 6.7
6.3
5.7 5.9 5.8 5.9 5.6 5.8
5.1 5.3 5.2 5.0 4.9 4.8 4.8 4.7 4.7
0
1
2
3
4
5
6
7
8
1QFY17 2QFY17 3QFY17 4QFY17 1QFY18 2QFY18 3QFY18 4QFY18 1QFY19
Yield (Rs/RPK) RASK (Rs)
Strategy India
KOTAK INSTITUTIONAL EQUITIES RESEARCH 5
Exhibit 5: SpiceJet's yields have remained stagnant over the past nine quarters Quarterly yields and RASK of SpiceJet, March fiscal year-ends, 2017-19
Source: Company, Kotak Institutional Equities
Exhibit 6: Major Indian airlines have had high passenger load factors (PLF) Passenger load factor (PLF) of major airlines, March fiscal year-ends, 2018-19 (%)
Source: DGCA, Kotak Institutional Equities
4.2
3.9 4.2
4.0
4.4
4.0
4.5 4.2
4.5
3.9
3.5 3.8
3.7
4.1
3.8
4.2 3.9
4.3
0
1
2
3
4
5
1QFY17 2QFY17 3QFY17 4QFY17 1QFY18 2QFY18 3QFY18 4QFY18 1QFY19
Yield (Rs/RPK) RASK (Rs)
Apr-17 May-17 Jun-17 Jul-17 Aug-17 Sep-17 Oct-17 Nov-17 Dec-17 Jan-18 Feb-18 Mar-18 Apr-18 May-18 Jun-18 Jul-18
SpiceJet 93.4 94.3 94.5 94.4 94.5 94.2 93.7 95.5 95.6 95.0 96.3 95.0 95.5 94.8 93.3 93.8
IndiGo 86.9 91.1 87.8 83.7 83.6 85.2 87.3 90.7 90.8 89.7 91.8 89.0 91.9 91.0 88.3 88.7
Go Air 84.7 93.0 89.4 82.5 85.4 88.5 87.6 90.0 92.0 90.0 90.4 88.0 89.5 89.2 88.6 87.2
Vistara 83.6 86.8 86.4 84.6 83.4 84.1 80.2 86.9 87.7 87.0 91.2 88.2 88.8 85.7 84.8 84.1
Jet Airways + Jet Lite 82.9 85.2 81.2 80.3 81.0 80.6 80.7 87.6 88.6 88.8 90.4 86.3 85.5 80.4 79.5 83.6
Air India 78.7 80.9 77.0 75.5 76.1 78.6 76.6 83.8 81.8 84.6 86.7 83.6 84.0 81.3 80.9 82.3
Air Asia 90.1 89.4 89.6 88.4 85.8 81.6 83.0 84.5 86.8 83.7 88.0 82.0 87.5 89.7 86.7 79.7
Others 74.6 80.3 75.7 80.7 83.2 74.4 65.7 68.5 75.7 77.0 77.0 72.4 80.0 82.7 79.0 74.8
Overall industry 85.6 88.9 86.2 83.5 83.8 84.7 85.1 89.3 89.7 88.4 91.1 88.0 89.5 88.0 86.3 86.8
For Private Circulation Only. FOR IMPORTANT INFORMATION ABOUT KOTAK SECURITIES’ RATING SYSTEM AND OTHER DISCLOSURES, REFER TO THE END OF THIS MATERIAL.
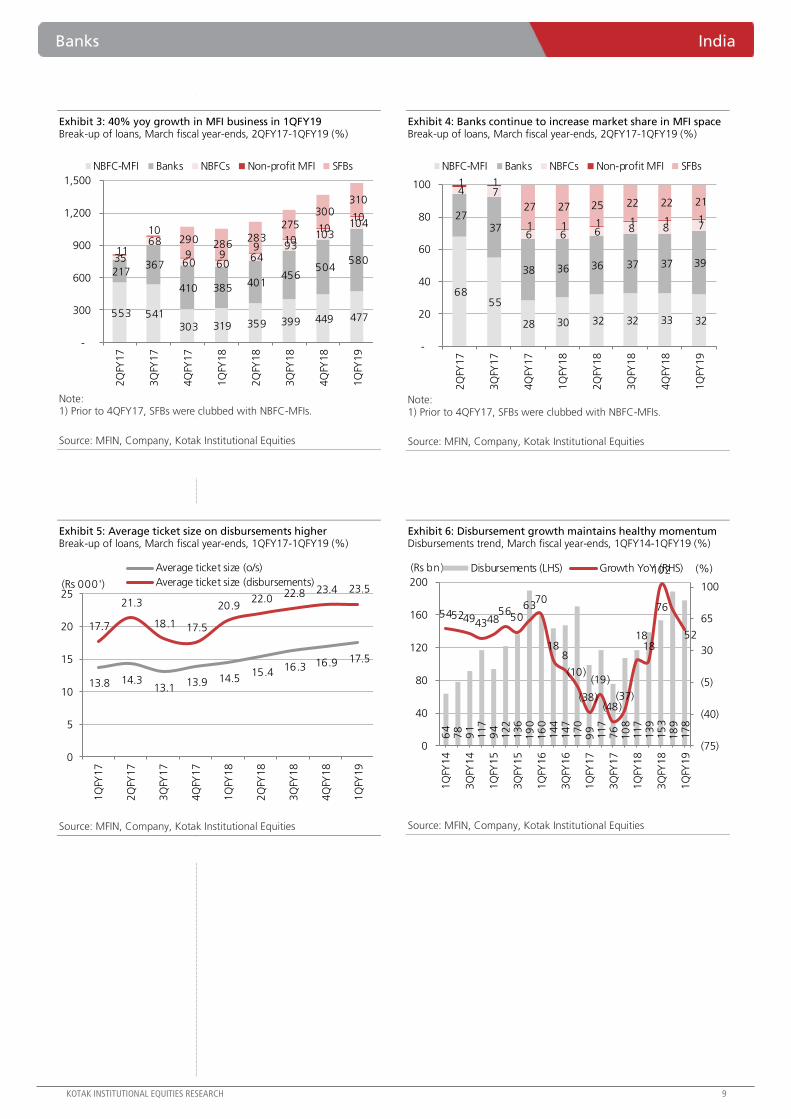
Steady performance across the board
MFI business maintained a steady pace of recovery recording improved trends across most
metrics. While the data that we have represented in this report is only for NBFC-MFI, our
channel checks suggest that there should be similar trends for other players as well. While a few
larger players have slowed moderately, smaller players have started to pick pace. The industry
saw an overall growth of 40% yoy in 1QFY19 with strong growth from banks; up 51% yoy (see
Exhibit 3). Banks dominate the business with a share of 39% (up 280 bps yoy); including SFBs
this would increase by another 21% points to ~60%. NBFCs aligned to MFIN have a share of
~32% who along with other NBFCs have grown the fastest at 53% yoy. Disbursements grew
~52% yoy (down 6% qoq) while AUMs grew 53% yoy and 8% qoq for NBFC-MFIs (see Exhibit
6). Net addition of clients has been positive at 31% yoy. SFBs witnessed modest growth at 8%
yoy. These entities have started to expand their footprint as well as increase employee
headcount which is a positive outcome.
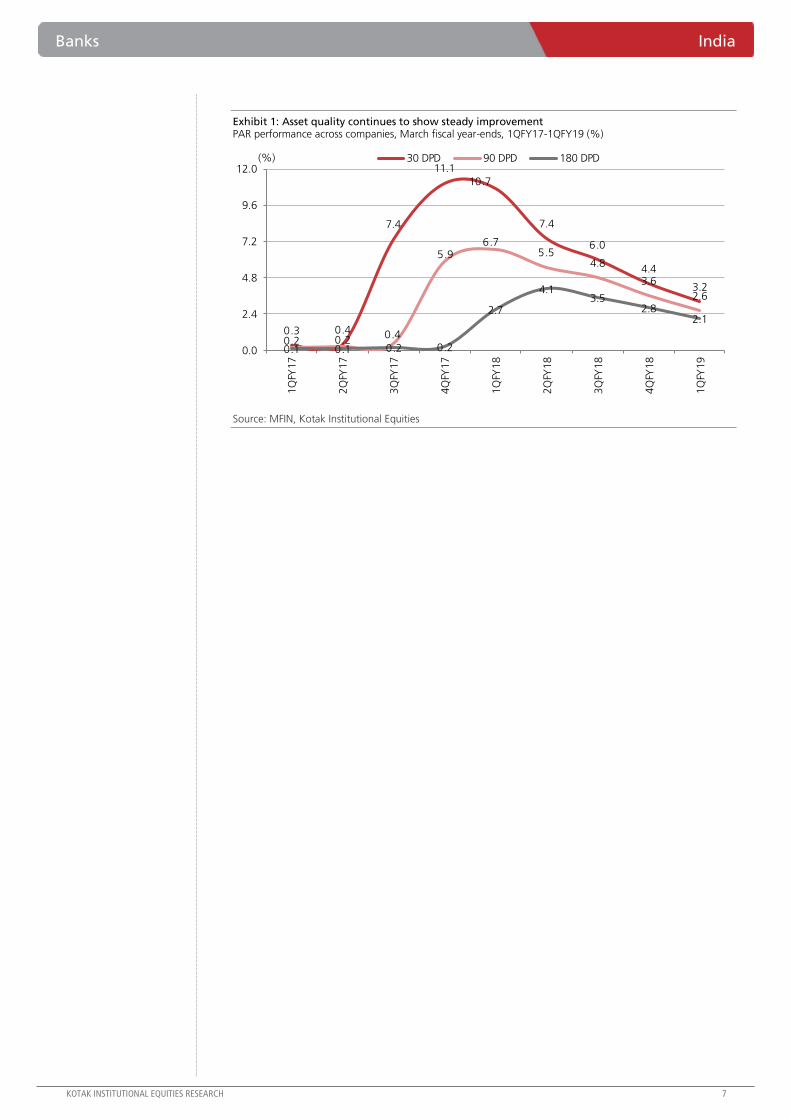
Asset quality shows steady signs of improvement
MFIN data shows that the PAR 30 loan portfolio has fallen by 750 bps yoy and 80 bps qoq to
3.2% of loans (see Exhibit 1). Asset quality has improved across all buckets. Incremental risk
from a stress recognition standpoint is low as the PAR 30 and PAR 90 has converged. Higher
write-offs, is probably one of the reasons which can explain a decline in PAR 180 portfolio
which is quite low at 2.1% of loans. The cool-off period from peak NPL levels during
demonetization is low at 4-5 quarters.
Average ticket size on the rise
The rise in the average ticket size over the last few quarters has been a sign of concern. The
average ticket size on disbursements is approximately `23,500 as compared to the average
ticket size on loans outstanding at approximately `17,500 (see Exhibit 5). Given the nature of
these unsecured loans and as these customers are getting greater access to other formal
channels of financing, especially asset-based financing, we do see a gradual increase in risk. The
rise in ticket size (absolute basis) on yoy basis in Eastern India has been higher than other
regions.
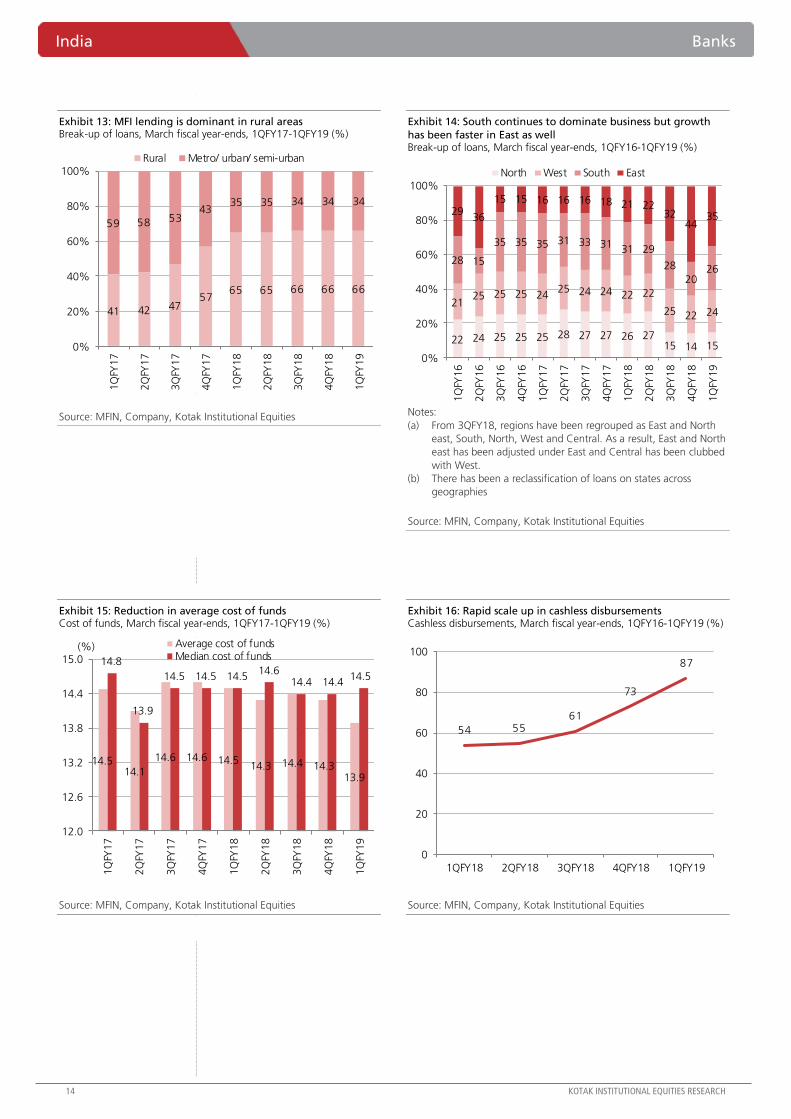
Share of Eastern India increased 440 bps yoy to 35%
MFI business continues to maintain robust pace in Eastern India. NBFC-MFIs saw a 75% yoy rise
in MFI loans in Eastern India (Assam+Jharkhand+Bihar+Odisha+WB) driven by a 53% yoy rise in
disbursements. The share of loans increased 440 bps yoy to 34.6%. The number of clients
increased 51% yoy to 9.5 mn. 51% of incremental client addition in 1QFY19 from 1QFY18 was
from these states. Incremental disbursements during the same period held a share of 46%. The
rise in the average ticket size (of disbursements) in these regions was higher than others on an
absolute basis. Average ticket size in Assam, Bihar, Jharkhand, Odisha and WB increased by
~`2,900, `3,000, `3,500, `3,000 and `3,000 respectively compared to `2,200 on pan-India
basis.
Banks India
Smooth growth trajectory. Recent data on MFI business shows that growth
maintained momentum (up 40% yoy for the industry) while asset quality continued to
improve. PAR 30 (Portfolio-at-Risk) has reduced to 3.2% from a peak of 11%. We have
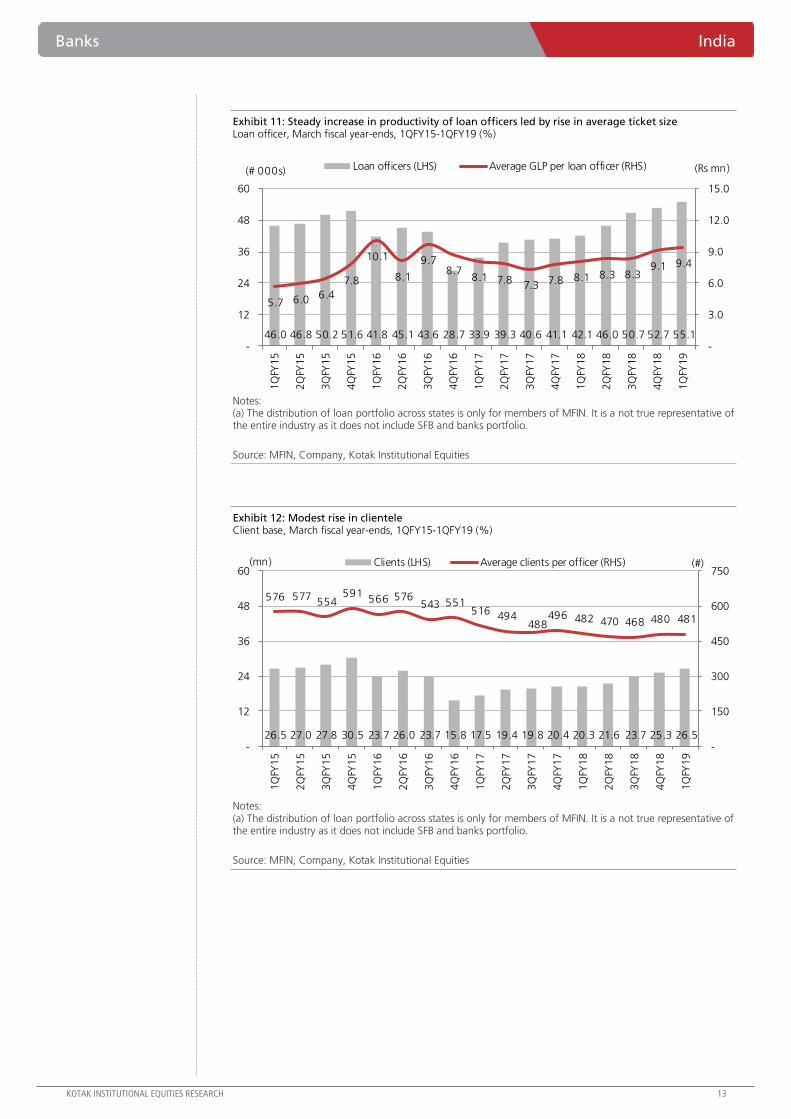
seen solid growth in disbursements (~52% yoy) reflecting in acceleration in loan growth
(53% yoy), additions to clients (31% yoy), employee (30% yoy) and branch (31% yoy)
for NBFC-MFIs. Around 34% difference between average loans/borrower and
disbursements/borrower remains a key concern.
ATTRACTIVE
SEPTEMBER 03, 2018
THEME
BSE-30: 38,645
QUICK NUMBERS
MFI loans up 40%
yoy in 1QFY19 for
the industry
PAR>30 dropped
750 bps yoy and 80
bps qoq to 3.2%
Average ticket size
of disbursements
increased 12% yoy
to ~`23,500
M B Mahesh CFA
Nischint Chawathe
Dipanjan Ghosh
Shrey Singh 5
Banks India
KOTAK INSTITUTIONAL EQUITIES RESEARCH 7
Exhibit 1: Asset quality continues to show steady improvement PAR performance across companies, March fiscal year-ends, 1QFY17-1QFY19 (%)
Source: MFIN, Kotak Institutional Equities
0.3 0.4
7.4
11.1
10.7
7.4
6.0
4.4
3.2
0.2 0.20.4
5.96.7
5.54.8
3.6
2.6
0.1 0.1 0.2 0.2
2.7
4.13.5
2.82.1
0.0
2.4
4.8
7.2
9.6
12.0
1Q
FY17
2Q
FY17
3Q
FY17
4Q
FY17
1Q
FY18
2Q
FY18
3Q
FY18
4Q
FY18
1Q
FY19
(%) 30 DPD 90 DPD 180 DPD

India Banks
8 KOTAK INSTITUTIONAL EQUITIES RESEARCH
Exhibit 2: PAR shows significant improvement in stressed states like Maharashtra, Uttar Pradesh and Madhya Pradesh PAR performance across states, March fiscal year-ends, 4QFY16-1QFY19 (%)
Notes: (a) The distribution of loan portfolio across states is only for members of MFIN. It is a not true representative of the entire industry as it does not include SFB and banks portfolio.
Source: MFIN, Kotak Institutional Equities
4QFY16 1QFY17 2QFY17 3QFY17 4QFY17 1QFY18 2QFY18 3QFY18 4QFY18 4QFY19
PAR>30
Karnataka 0.5 0.4 0.4 5.7 18.0 4.9 3.3 4.2 4.0 3.4
Tamilnadu 0.2 0.2 0.4 1.0 14.0 1.9 1.7 1.9 1.0 1.4
Maharashtra 0.3 0.3 0.4 9.1 28.0 15.5 11.7 14.1 10.0 8.4
UP 0.4 0.4 0.8 28.7 37.0 23.7 14.4 14.1 11.0 6.3
Bihar 0.2 0.2 0.2 0.7 3.0 0.5 0.6 1.2 1.0 0.6
MP 0.5 0.4 0.6 7.2 17.0 12.8 9.7 8.7 6.0 5.2
West Bengal 0.2 0.2 0.2 2.4 14.0 1.8 1.7 2.7 1.0 1.0
Odisha 0.1 0.1 0.1 0.4 1.0 0.3 0.3 0.7 1.0 0.5
Kerala 0.1 0.1 0.1 0.8 1.0 1.5 1.5 2.4 3.0 2.6
Gujarat 0.5 0.7 0.7 5.3 14.0 7.7 6.3 NA NA NA
Haryana 0.4 0.5 0.7 14.0 22.0 15.4 11.6 13.8 10.0 6.1
Punjab 0.2 0.2 0.2 8.1 16.0 18.8 7.7 7.2 6.0 3.0
Jharkhand NA 0.2 0.3 2.8 10.0 4.3 3.8 5.4 3.0 2.4
Rajasthan 0.6 0.6 0.6 8.2 1.0 5.1 3.1 5.7 4.0 1.9
Assam 0.1 NA 0.2 0.6 1.0 NA NA 1.4 1.0 0.7
Industry 0.3 0.3 0.4 7.4 11.1 10.7 7.4 6.0 4.4 3.2
PAR>90
Karnataka 0.3 0.3 0.3 0.3 12.0 3.9 2.6 3.6 4.0 3.0
Tamilnadu 0.1 0.1 0.3 0.2 2.0 1.2 1.0 1.3 1.0 0.9
Maharashtra 0.2 0.2 0.3 0.4 20.0 13.2 9.9 12.6 10.0 7.7
UP 0.2 0.2 0.4 0.9 14.0 11.2 10.3 10.1 11.0 4.9
Bihar 0.1 0.1 0.1 0.1 1.0 0.3 0.4 0.8 1.0 0.4
MP 0.3 0.3 0.3 0.6 9.0 8.3 6.8 6.6 6.0 4.2
West Bengal 0.1 0.1 0.1 0.3 4.0 1.3 1.3 2.2 1.0 0.8
Odisha 0.1 0.1 0.1 0.2 0.3 0.2 0.2 0.5 1.0 0.4
Kerala 0.1 0.0 0.1 0.1 1.0 0.7 0.9 1.6 3.0 1.7
Gujarat 0.3 0.4 0.4 0.7 9.0 4.7 4.4 NA NA NA
Haryana 0.2 0.3 0.4 0.6 11.0 8.0 8.3 10.5 10.0 5.0
Punjab 0.1 0.1 0.1 0.1 5.0 9.0 5.5 5.3 6.0 2.4
Jharkhand NA 0.1 0.2 0.4 5.0 2.7 2.8 4.5 3.0 2.1
Rajasthan 0.5 0.4 0.3 0.6 5.0 2.6 2.3 10.4 4.0 1.4
Assam 0.0 NA 0.1 0.1 0.3 NA NA 1.1 1.0 0.5
Industry 0.2 0.2 0.2 0.4 5.9 6.7 5.5 4.8 3.6 2.6
PAR>180
Karnataka 0.2 0.2 0.2 0.3 0.2 2.0 1.8 2.8 2.6 2.6
Tamilnadu 0.1 0.1 0.1 0.1 0.2 0.6 0.5 0.9 0.7 0.7
Maharashtra 0.1 0.1 0.1 0.2 0.2 7.9 8.7 10.3 8.6 7.0
UP 0.2 0.2 0.1 0.3 0.6 2.3 7.2 7.2 6.3 3.5
Bihar 0.1 0.1 0.1 0.0 0.1 0.1 0.2 0.5 0.3 0.3
MP 0.2 0.2 0.2 0.2 0.4 3.5 5.1 4.1 3.6 3.2
West Bengal 0.1 0.1 0.1 0.1 0.2 0.7 0.9 1.8 0.6 0.6
Odisha 0.0 0.0 0.0 0.1 0.1 0.1 0.1 0.3 0.3 0.3
Kerala 0.0 0.0 0.0 0.0 0.1 0.3 0.3 0.9 1.0 1.0
Gujarat 0.1 0.2 0.2 0.3 0.4 1.4 2.6 NA NA NA
Haryana 0.1 0.1 0.2 0.2 0.4 2.5 5.7 7.3 5.9 3.8
Punjab 0.1 0.1 0.1 0.1 0.0 0.5 3.9 4.0 3.3 1.8
Jharkhand NA 0.1 0.1 0.2 0.4 1.1 1.6 3.2 2.3 1.7
Rajasthan 0.2 0.2 0.1 0.2 0.3 0.5 1.7 8.0 2.1 1.0
Assam 0.0 NA 0.1 0.1 0.1 NA NA 0.7 0.5 0.4
Industry 0.1 0.1 0.1 0.2 0.2 2.7 4.1 3.5 2.8 2.1
Banks India
KOTAK INSTITUTIONAL EQUITIES RESEARCH 9
Exhibit 3: 40% yoy growth in MFI business in 1QFY19 Break-up of loans, March fiscal year-ends, 2QFY17-1QFY19 (%)
Note: 1) Prior to 4QFY17, SFBs were clubbed with NBFC-MFIs.
Source: MFIN, Company, Kotak Institutional Equities
Exhibit 4: Banks continue to increase market share in MFI space Break-up of loans, March fiscal year-ends, 2QFY17-1QFY19 (%)
Note: 1) Prior to 4QFY17, SFBs were clubbed with NBFC-MFIs.
Source: MFIN, Company, Kotak Institutional Equities
Exhibit 5: Average ticket size on disbursements higher Break-up of loans, March fiscal year-ends, 1QFY17-1QFY19 (%)
Source: MFIN, Company, Kotak Institutional Equities
Exhibit 6: Disbursement growth maintains healthy momentum Disbursements trend, March fiscal year-ends, 1QFY14-1QFY19 (%)
Source: MFIN, Company, Kotak Institutional Equities
553 541 303 319 359 399 449 477
217 367
410 385 401
456 504
580 35
68
60 60 64
93 103
104
11
10
9 9 9
10 10
10
-
290 286 283
275 300
310
-
300
600
900
1,200
1,500
2Q
FY17
3Q
FY17
4Q
FY17
1Q
FY18
2Q
FY18
3Q
FY18
4Q
FY18
1Q
FY19
NBFC-MFI Banks NBFCs Non-profit MFI SFBs
68 55
28 30 32 32 33 32
27 37
38 36 36 37 37 39
4 7
6 6 6 8 8 7
1 1
1 1 1 1 1 1 27 27 25 22 22 21
-
20
40
60
80
100
2Q
FY17
3Q
FY17
4Q
FY17
1Q
FY18
2Q
FY18
3Q
FY18
4Q
FY18
1Q
FY19
NBFC-MFI Banks NBFCs Non-profit MFI SFBs
13.8 14.3 13.1
13.9 14.5 15.4
16.3 16.9 17.5
17.7
21.3
18.1 17.5
20.9 22.0
22.8 23.4 23.5
0
5
10
15
20
25
1Q
FY17
2Q
FY17
3Q
FY17
4Q
FY17
1Q
FY18
2Q
FY18
3Q
FY18
4Q
FY18
1Q
FY19
(Rs 000')
Average ticket size (o/s)
Average ticket size (disbursements)
64
78
9
1
117
94
122
136
19
0
16
0
144
147
170
9
9
117
76
10
8
117
139
15
3
18
9
178
54 52 49 43 48 56
50 63
70
18 8
(10)
(38)
(19)
(48)(37)
18 18
102
76
52
(75)
(40)
(5)
30
65
100
0
40
80
120
160
200
1Q
FY14
3Q
FY14
1Q
FY15
3Q
FY15
1Q
FY16
3Q
FY16
1Q
FY17
3Q
FY17
1Q
FY18
3Q
FY18
1Q
FY19
(%)(Rs bn) Disbursements (LHS) Growth YoY (RHS)

India Banks
10 KOTAK INSTITUTIONAL EQUITIES RESEARCH
Exhibit 7: Smaller players begin to accelerate Group lending portfolio across various institutions, March fiscal year-ends, 2013-1QFY19 (` bn)
Notes:
(a) 4QFY18 data has been used for Arohan, Muthoot Microfin, Navchetana, Spandana and 2QFY18 data
has been used for CreditAccess for analysis as 1QFY19 data for them is not available.
(b) Data for small finance banks is not available where they are not listed. Janalakshmi, Ujjivan, Equitas,
Utkarsh, ESAF and Suryoday have been converted into SFBs.
Source: MFIN, Company, Kotak Institutional Equities
2013 2014 2015 2016 2017 2018 1QFY19 YoY (%)
Janalakshmi 10 21 37 110 126 - — NA
BHAFIN 20 28 42 77 92 126 138 44
Ujjivan 11 16 33 54 64 76 78 21
Satin credit 6 11 21 33 36 43 54 49
L&T Finance 2 4 9 22 36 75 91 133
Equitas 11 15 21 33 33 23 24 (18)
Muthoot 3 8 15 7 20 29 29 34
Asirvad 1 2 3 10 18 24 24 33
Spandana 12 9 12 12 13 32 32 80
Suryoday 2 3 6 10 8 - — NA
ESAF 4 6 10 19 — — — NA
Utkarsh 2 3 7 14 — — — NA
Annapurna NA NA 4 9 12 20 20 53
Arohan NA NA 4 7 10 22 22 93
Fusion NA NA 3 6 8 16 18 94
Sonata NA NA 6 10 10 14 13 28
Madura NA NA 4 5 8 12 14 66
Belstar NA NA 2 3 6 11 12 86
SVCL NA NA 4 10 8 9 8 (3)
Samasta NA NA 1 1 2 8 11 290
FINO NA NA 1 3 3 6 6 75

Banks India
KOTAK INSTITUTIONAL EQUITIES RESEARCH 11
Exhibit 8: Odisha, Bihar and West Bengal continue to gain share; Karnataka maintains tepid growth Share of loans across states, March fiscal year-ends, 2013-1QFY19 (%)
Notes: (a) The distribution of loan portfolio across states is only for members of MFIN. It is a not true representative of the entire industry as it does not include SFB and banks portfolio.
Source: MFIN, Company, Kotak Institutional Equities
2013 2014 2015 2016 2017 2018 1QFY19 YoY (%)
GLP (Rs bn)
Karnataka 20.5 26.2 43.7 74.1 43.0 60.7 62.6 27.8
Odisha 7.8 11.0 19.3 30.3 31.3 52.8 58.5 69.4
Uttar Pradesh 12.9 20.0 33.9 60.0 35.2 48.0 50.0 43.7
Bihar 9.9 15.6 27.2 31.6 31.0 46.8 54.6 68.6
Tamilnadu 27.6 37.9 57.0 88.9 32.0 45.7 49.2 45.7
Maharashtra 17.2 23.7 38.7 64.6 31.0 45.2 47.4 40.4
Madhya Pradesh 9.8 14.9 24.9 41.7 24.9 39.0 38.9 44.7
West Bengal 30.1 38.9 60.2 32.6 21.2 35.4 39.4 69.6
Kerala — 10.3 17.7 24.6 15.5 21.3 22.4 33.2
Rajasthan — — — — 7.3 14.5 17.7 128.6
Gujarat — — — 21.5 — — — NA
Jharkhand — — — — 9.0 — — NA
Assam 7.3 11.1 20.9 — — — — NA
Andhra Pradesh 39.9 — — — — — — NA
Total 182.9 209.5 343.5 469.9 281.4 409.4 440.6 45.9
% distribution of GLP within top 10 states
Karnataka 11.2 12.5 12.7 15.8 15.3 14.8 14.2 -201 bps
Odisha 4.3 5.2 5.6 6.5 11.1 12.9 13.3 184 bps
Uttar Pradesh 7.0 9.5 9.9 12.8 12.5 11.7 11.4 -17 bps
Bihar 5.4 7.4 7.9 6.7 11.0 11.4 12.4 167 bps
Tamilnadu 15.1 18.1 16.6 18.9 11.4 11.2 11.2 -1 bps
Maharashtra 9.4 11.3 11.3 13.7 11.0 11.0 10.8 -42 bps
Madhya Pradesh 5.3 7.1 7.3 8.9 8.9 9.5 8.8 -7 bps
West Bengal 16.4 18.5 17.5 6.9 7.5 8.6 8.9 125 bps
Kerala — 4.9 5.1 5.2 5.5 5.2 5.1 -48 bps
Rajasthan — — — — 2.6 3.5 4.0 145 bps
Gujarat — — — 4.6 — — — NA
Jharkhand — — — — 3.2 — — NA
Assam 4.0 5.3 6.1 — — — — NA
Andhra Pradesh 21.8 — — — — — — NA

India Banks
12 KOTAK INSTITUTIONAL EQUITIES RESEARCH
Exhibit 9: Ticket size in Eastern parts have been higher than others Average ticket size of loans disbursed across states, March fiscal year-ends, 1QFY17-1QFY19 (Rs)
Notes: (a) The distribution of loan portfolio across states is only for members of MFIN. It is a not true representative of the entire industry as it does not include SFB and banks portfolio.
Source: MFIN, Company, Kotak Institutional Equities
Exhibit 10: Productivity continues to improve Branch productivity, March fiscal year-ends, 1QFY14-1QFY19 (%)
Notes: (a) The distribution of loan portfolio across states is only for members of MFIN. It is a not true representative of the entire industry as it does not include SFB and banks portfolio.
Source: MFIN, Company, Kotak Institutional Equities
1QFY17 2QFY17 3QFY17 4QFY17 1QFY18 2QFY18 3QFY18 4QFY18 1QFY19
Average ticket size (Rs)
Assam 22,712 23,127 23,074 21,026 23,500 23,413 24,142 26,602 26,400
Bihar 19,462 64,395 19,135 21,619 201,167 22,040 22,209 14,178 23,080
Chandigarh 20,796 21,025 20,008 20,605 21,050 21,448 22,974 23,403 23,400
Delhi 28,834 30,159 27,074 34,436 37,000 26,026 30,796 44,389 23,000
Gujarat 26,129 25,895 28,205 24,132 22,714 25,088 26,006 26,517 26,750
Haryana 23,986 22,884 23,583 23,433 23,667 25,017 26,090 23,903 24,769
Jharkhand 19,679 19,751 20,528 20,719 20,267 20,329 21,616 24,517 23,720
Karnataka 16,224 18,613 17,027 16,024 21,326 19,626 19,825 20,675 21,133
Kerala 21,225 16,628 22,853 24,132 21,120 21,043 20,864 23,719 24,029
Madhya Pradesh 20,924 21,907 20,174 20,574 22,000 23,556 23,979 24,639 23,609
Maharashtra 20,238 21,425 19,956 19,306 21,080 22,088 22,651 21,355 23,364
Orissa 18,632 20,368 19,209 22,485 21,349 21,149 21,907 23,629 24,295
Punjab 23,262 23,964 22,544 22,554 21,875 25,902 25,723 24,268 26,235
Rajasthan 21,101 21,587 22,222 22,790 20,846 22,093 21,269 21,881 23,219
Tamil nadu 23,519 25,536 26,653 21,752 21,837 21,459 23,048 24,064 25,034
Tripura 22,335 21,508 22,784 NA NA 22,150 22,882 NA NA
Uttar Pradesh 22,191 22,969 21,511 23,074 23,658 26,282 26,478 23,842 24,614
Uttarakhand 22,673 23,768 21,980 20,838 23,000 28,394 32,776 26,464 24,000
West Bengal 19,447 20,254 20,964 20,752 19,271 20,069 20,123 21,960 22,288
Total 20,239 25,084 20,857 20,778 23,729 21,987 22,388 21,598 23,525
9.2 9.5 9.5 9.7 10.1 9.9 10.3 10.6 10.1 8.6 8.2 6.0 6.8 7.3 7.7 8.0 8.2 9.0 9.7 10.1 10.7
20 21 22 26 26
28 31
38 42 43
52
41 41 42 39 40 41 43 44
48 48
-
12
24
36
48
60
-
3
6
9
12
15
1Q
FY14
2Q
FY14
3Q
FY14
4Q
FY14
1Q
FY15
2Q
FY15
3Q
FY15
4Q
FY15
1Q
FY16
2Q
FY16
3Q
FY16
4Q
FY16
1Q
FY17
2Q
FY17
3Q
FY17
4Q
FY17
1Q
FY18
2Q
FY18
3Q
FY18
4Q
FY18
1Q
FY19
(Rs mn)(# 000s) Branches (LHS) Average GLP per branch (RHS)
Banks India
KOTAK INSTITUTIONAL EQUITIES RESEARCH 13
Exhibit 11: Steady increase in productivity of loan officers led by rise in average ticket size Loan officer, March fiscal year-ends, 1QFY15-1QFY19 (%)
Notes: (a) The distribution of loan portfolio across states is only for members of MFIN. It is a not true representative of the entire industry as it does not include SFB and banks portfolio.
Source: MFIN, Company, Kotak Institutional Equities
Exhibit 12: Modest rise in clientele Client base, March fiscal year-ends, 1QFY15-1QFY19 (%)
Notes: (a) The distribution of loan portfolio across states is only for members of MFIN. It is a not true representative of the entire industry as it does not include SFB and banks portfolio.
Source: MFIN, Company, Kotak Institutional Equities
46.0 46.8 50.2 51.6 41.8 45.1 43.6 28.7 33.9 39.3 40.6 41.1 42.1 46.0 50.7 52.7 55.1
5.7 6.0 6.4
7.8
10.1
8.1
9.7 8.7
8.1 7.8 7.3 7.8 8.1 8.3 8.3
9.1 9.4
-
3.0
6.0
9.0
12.0
15.0
-
12
24
36
48
60
1Q
FY15
2Q
FY15
3Q
FY15
4Q
FY15
1Q
FY16
2Q
FY16
3Q
FY16
4Q
FY16
1Q
FY17
2Q
FY17
3Q
FY17
4Q
FY17
1Q
FY18
2Q
FY18
3Q
FY18
4Q
FY18
1Q
FY19
(Rs mn)(# 000s) Loan officers (LHS) Average GLP per loan officer (RHS)
26.5 27.0 27.8 30.5 23.7 26.0 23.7 15.8 17.5 19.4 19.8 20.4 20.3 21.6 23.7 25.3 26.5
576 577 554
591 566 576
543 551 516 494
488 496 482 470 468 480 481
-
150
300
450
600
750
-
12
24
36
48
60
1Q
FY15
2Q
FY15
3Q
FY15
4Q
FY15
1Q
FY16
2Q
FY16
3Q
FY16
4Q
FY16
1Q
FY17
2Q
FY17
3Q
FY17
4Q
FY17
1Q
FY18
2Q
FY18
3Q
FY18
4Q
FY18
1Q
FY19
(#)(mn) Clients (LHS) Average clients per officer (RHS)
India Banks
14 KOTAK INSTITUTIONAL EQUITIES RESEARCH
Exhibit 13: MFI lending is dominant in rural areas Break-up of loans, March fiscal year-ends, 1QFY17-1QFY19 (%)
Source: MFIN, Company, Kotak Institutional Equities
Exhibit 14: South continues to dominate business but growth
has been faster in East as well Break-up of loans, March fiscal year-ends, 1QFY16-1QFY19 (%)
Notes:
(a) From 3QFY18, regions have been regrouped as East and North
east, South, North, West and Central. As a result, East and North
east has been adjusted under East and Central has been clubbed
with West.
(b) There has been a reclassification of loans on states across
geographies
Source: MFIN, Company, Kotak Institutional Equities
Exhibit 15: Reduction in average cost of funds Cost of funds, March fiscal year-ends, 1QFY17-1QFY19 (%)
Source: MFIN, Company, Kotak Institutional Equities
Exhibit 16: Rapid scale up in cashless disbursements Cashless disbursements, March fiscal year-ends, 1QFY16-1QFY19 (%)
Source: MFIN, Company, Kotak Institutional Equities
41 42 4757
65 65 66 66 66
59 58 5343
35 35 34 34 34
0%
20%
40%
60%
80%
100%
1Q
FY17
2Q
FY17
3Q
FY17
4Q
FY17
1Q
FY18
2Q
FY18
3Q
FY18
4Q
FY18
1Q
FY19
Rural Metro/ urban/ semi-urban
22 24 25 25 25 28 27 27 26 2715 14 15
2125 25 25 24
25 24 24 22 22
25 22 24
28 15
35 35 35 31 33 31 31 29
28
2026
2936
15 15 16 16 16 18 21 2232
4435
0%
20%
40%
60%
80%
100%
1Q
FY16
2Q
FY16
3Q
FY16
4Q
FY16
1Q
FY17
2Q
FY17
3Q
FY17
4Q
FY17
1Q
FY18
2Q
FY18
3Q
FY18
4Q
FY18
1Q
FY19
North West South East
14.514.1
14.6 14.6 14.514.3 14.4 14.3
13.9
14.8
13.9
14.5 14.5 14.514.6
14.4 14.414.5
12.0
12.6
13.2
13.8
14.4
15.0
1Q
FY17
2Q
FY17
3Q
FY17
4Q
FY17
1Q
FY18
2Q
FY18
3Q
FY18
4Q
FY18
1Q
FY19
(%) Average cost of fundsMedian cost of funds
54 5561
73
87
0
20
40
60
80
100
1QFY18 2QFY18 3QFY18 4QFY18 1QFY19

For Private Circulation Only. FOR IMPORTANT INFORMATION ABOUT KOTAK SECURITIES’ RATING SYSTEM AND OTHER DISCLOSURES, REFER TO THE END OF THIS MATERIAL.
Leadership strength is good, external recruits in go-to-market roles, says Mr Parekh
In a recent conversation to understand changes in management and measures taken to
strengthen the leadership team, Mr Parekh, made several points:
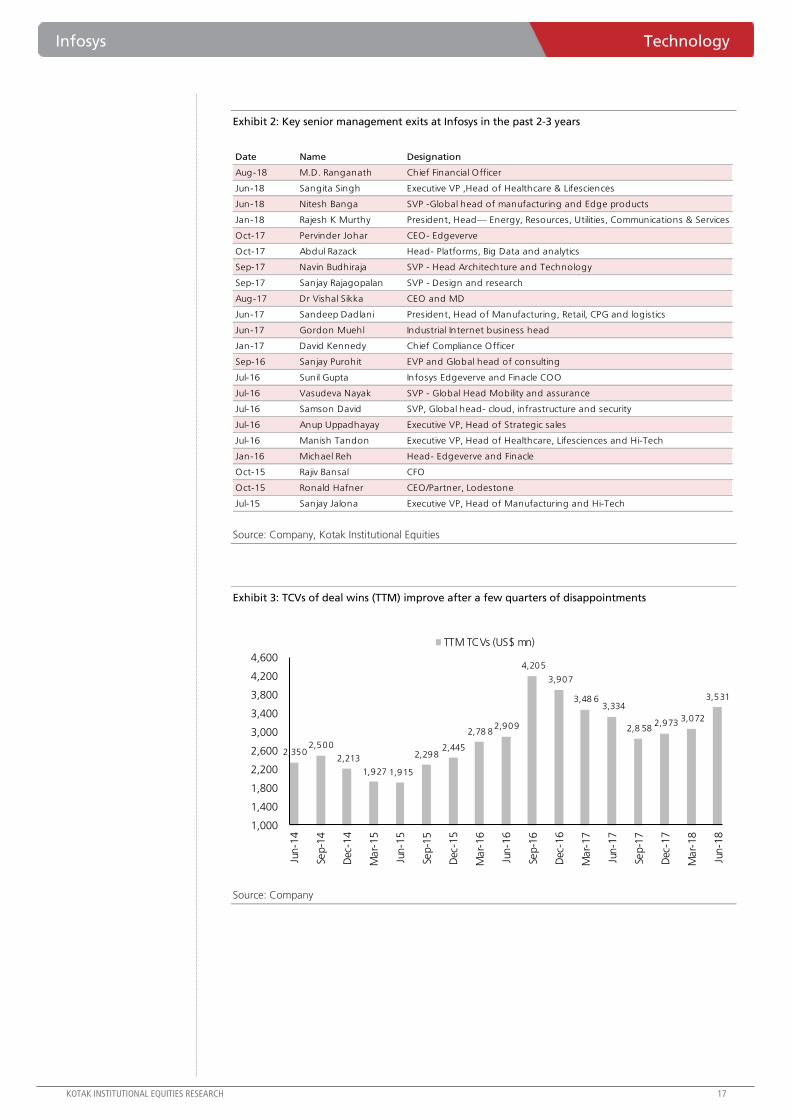
Strong bench strength in verticals. Infosys has seen some churn among segment heads
with the recent departure of heads of manufacturing, healthcare and energy & utilities. The
company has promoted vertical/ segment heads from within. Each of the leaders has been a
part of the vertical for long and is geared to assume the expanded role. Mr Parekh believes
there is enough leadership talent and depth within the organization.
Stable delivery leadership team. Infosys has a stable leadership team with key practice
heads running their respective service lines for long. The strong and stable delivery team has
been instrumental in high customer satisfaction scores and the scaling-up of large
relationships (number of US$100 mn clients have increased by 6 on yoy comparison).
External hires in digital, sales capacity and large deals team. Infosys has mapped the
areas which require talent induction, which is largely in to go-to-market roles. These are in
the areas of building sales capacity, select digital competencies and large deal teams. The
company has started augmenting capacity in some of these areas, especially in account
management. Do note that some of these areas are a part of the investment areas outlined
by the company and critical to a three-year growth plan. The company is six months into this
journey and has begun investing in some of these areas.
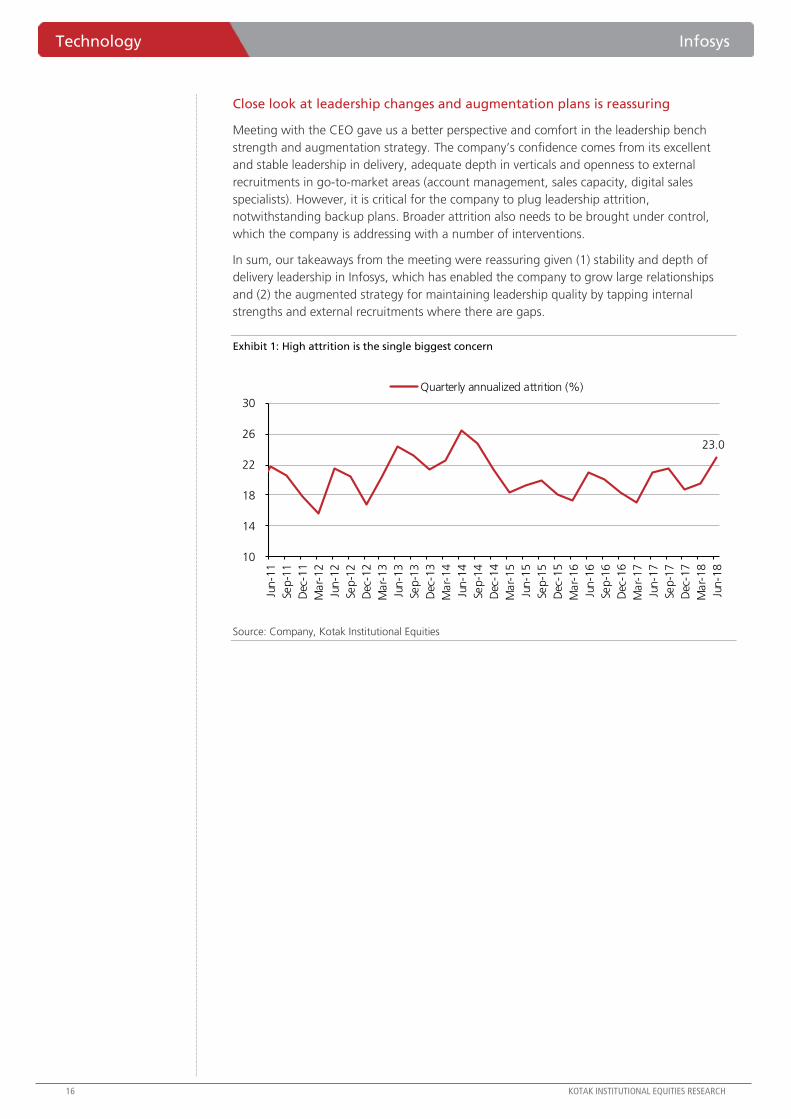
Attrition. Mr Parekh believes Infosys’ high attrition can be partly attributed to its strong
training engine which makes employees an attractive target. Mr. Parekh expects attrition to
decline in the coming quarters with multiple interventions kicking in, including: timely wage
revisions, more promotions and better employee engagement. The company is also making
differential-compensation-based interventions based on the outcome of initial training
programs. Notably, there is no common thread in the senior level exits, of which there have
four during Mr Parekh’s tenure (see Exhibit 1).
Infosys (INFO) Technology
In conversation with the CEO. We met Salil Parekh, CEO of Infosys, to understand
the reasons for high attrition in the company and its plans to augment the leadership
bench. Infosys has a strong leadership bench and has promoted people to head
verticals/ sub-verticals. Further, Mr Parekh is looking to augment leadership through
external hires in account management, large deals team and select digital competencies
while interventions are under way to contain attrition.
ADD
SEPTEMBER 03, 2018
UPDATE
Coverage view: Cautious
Price (`): 1,441
Target price (`): 1,400
BSE-30: 38,645
Kawaljeet Saluja
Jaykumar Doshi
Infosys
Stock data Forecasts/Valuations 2018 2019E 2020E
52-week range (Rs) (high,low) EPS (Rs) 64.6 70.9 78.3
Market Cap. (Rs bn) EPS growth (%) 3.0 9.7 10.4
Shareholding pattern (%) P/E (X) 22.3 20.3 18.4
Promoters 12.9 Sales (Rs bn) 705.2 804.8 885.2
FIIs 52.7 Net profits (Rs bn) 146.0 154.1 170.2
MFs 10.6 EBITDA (Rs bn) 190.1 209.9 230.5
Price performance (%) 1M 3M 12M EV/EBITDA (X) 15.5 14.0 12.5
Absolute 5.6 17.9 58.8 ROE (%) 21.8 23.0 23.5
Rel. to BSE-30 2.7 7.8 30.4 Div. Yield (%) 1.9 3.0 2.7
Co mpan y d a ta an d va lua t io n s ummary
1,454-867
3,147.6
Technology Infosys
16 KOTAK INSTITUTIONAL EQUITIES RESEARCH
Close look at leadership changes and augmentation plans is reassuring
Meeting with the CEO gave us a better perspective and comfort in the leadership bench
strength and augmentation strategy. The company’s confidence comes from its excellent
and stable leadership in delivery, adequate depth in verticals and openness to external
recruitments in go-to-market areas (account management, sales capacity, digital sales
specialists). However, it is critical for the company to plug leadership attrition,
notwithstanding backup plans. Broader attrition also needs to be brought under control,
which the company is addressing with a number of interventions.
In sum, our takeaways from the meeting were reassuring given (1) stability and depth of
delivery leadership in Infosys, which has enabled the company to grow large relationships
and (2) the augmented strategy for maintaining leadership quality by tapping internal
strengths and external recruitments where there are gaps.
Exhibit 1: High attrition is the single biggest concern
Source: Company, Kotak Institutional Equities
23.0
10
14
18
22
26
30
Jun-1
1
Sep-1
1
Dec
-11
Mar-
12
Jun-1
2
Sep-1
2
Dec
-12
Mar-
13
Jun-1
3
Sep-1
3
Dec
-13
Mar-
14
Jun-1
4
Sep-1
4
Dec
-14
Mar-
15
Jun-1
5
Sep-1
5
Dec
-15
Mar-
16
Jun-1
6
Sep-1
6
Dec
-16
Mar-
17
Jun-1
7
Sep-1
7
Dec
-17
Mar-
18
Jun-1
8
Quarterly annualized attrition (%)
Infosys Technology
KOTAK INSTITUTIONAL EQUITIES RESEARCH 17
Exhibit 2: Key senior management exits at Infosys in the past 2-3 years
Source: Company, Kotak Institutional Equities
Exhibit 3: TCVs of deal wins (TTM) improve after a few quarters of disappointments
Source: Company
Date Name Designation
Aug-18 M.D. Ranganath Chief Financial Officer
Jun-18 Sangita Singh Executive VP ,Head of Healthcare & Lifesciences
Jun-18 Nitesh Banga SVP -Global head of manufacturing and Edge products
Jan-18 Rajesh K Murthy President, Head— Energy, Resources, Utilities, Communications & Services
Oct-17 Pervinder Johar CEO- Edgeverve
Oct-17 Abdul Razack Head- Platforms, Big Data and analytics
Sep-17 Navin Budhiraja SVP - Head Architechture and Technology
Sep-17 Sanjay Rajagopalan SVP - Design and research
Aug-17 Dr Vishal Sikka CEO and MD
Jun-17 Sandeep Dadlani President, Head of Manufacturing, Retail, CPG and logistics
Jun-17 Gordon Muehl Industrial Internet business head
Jan-17 David Kennedy Chief Compliance Officer
Sep-16 Sanjay Purohit EVP and Global head of consulting
Jul-16 Sunil Gupta Infosys Edgeverve and Finacle COO
Jul-16 Vasudeva Nayak SVP - Global Head Mobility and assurance
Jul-16 Samson David SVP, Global head- cloud, infrastructure and security
Jul-16 Anup Uppadhayay Executive VP, Head of Strategic sales
Jul-16 Manish Tandon Executive VP, Head of Healthcare, Lifesciences and Hi-Tech
Jan-16 Michael Reh Head- Edgeverve and Finacle
Oct-15 Rajiv Bansal CFO
Oct-15 Ronald Hafner CEO/Partner, Lodestone
Jul-15 Sanjay Jalona Executive VP, Head of Manufacturing and Hi-Tech
2,350 2,500
2,213
1,927 1,915
2,298 2,445
2,78 8 2,909
4,205
3,907
3,48 6 3,334
2,8 58 2,973
3,072
3,531
1,000
1,400
1,800
2,200
2,600
3,000
3,400
3,800
4,200
4,600
Jun-1
4
Sep-1
4
Dec
-14
Mar-
15
Jun-1
5
Sep-1
5
Dec
-15
Mar-
16
Jun-1
6
Sep-1
6
Dec
-16
Mar-
17
Jun-1
7
Sep-1
7
Dec
-17
Mar-
18
Jun-1
8
TTM TCVs (US$ mn)

Technology Infosys
18 KOTAK INSTITUTIONAL EQUITIES RESEARCH
Exhibit 4: Infosys: Key client metrics are steady
Source: Company, Kotak Institutional Equities
Sep-15 Dec-15 Mar-16 Jun-16 Sep-16 Dec-16 Mar-17 Jun-17 Sep-17 Dec-17 Mar-18 Jun-18
Client metrics
Number of active clients 1,011 1,045 1,092 1,126 1,136 1,152 1,162 1,164 1,173 1,191 1,204 1,214
New clients added in the period 82 75 89 95 78 77 71 59 72 79 73 70
Repeat business % 97.6 96.8 95.8 98.8 97.5 96.7 96.2 99.4 98.7 98.3 97.6 99.5
Million $ clients 542 555 558 574 577 591 598 606 620 630 634 627
5 Million $ clients 258 261 268 268 277 275 282 279 286 290 295 NA
10 Million $ clients 190 186 198 198 200
50 Million $ clients 50 51 52 52 54 54 56 56 55 56 57 56
75 Million $ clients 31 28 31 31 30 32 31 31 31 34 35 NA
100 Million $ clients 14 13 14 17 18 18 19 18 19 20 20 24
200 Million $ clients 6 6 6 6 6 6 6 NA NA NA NA NA
300 Million $ clients 1 1 1 1 1 1 1 NA NA NA NA NA
Infosys Technology
KOTAK INSTITUTIONAL EQUITIES RESEARCH 19
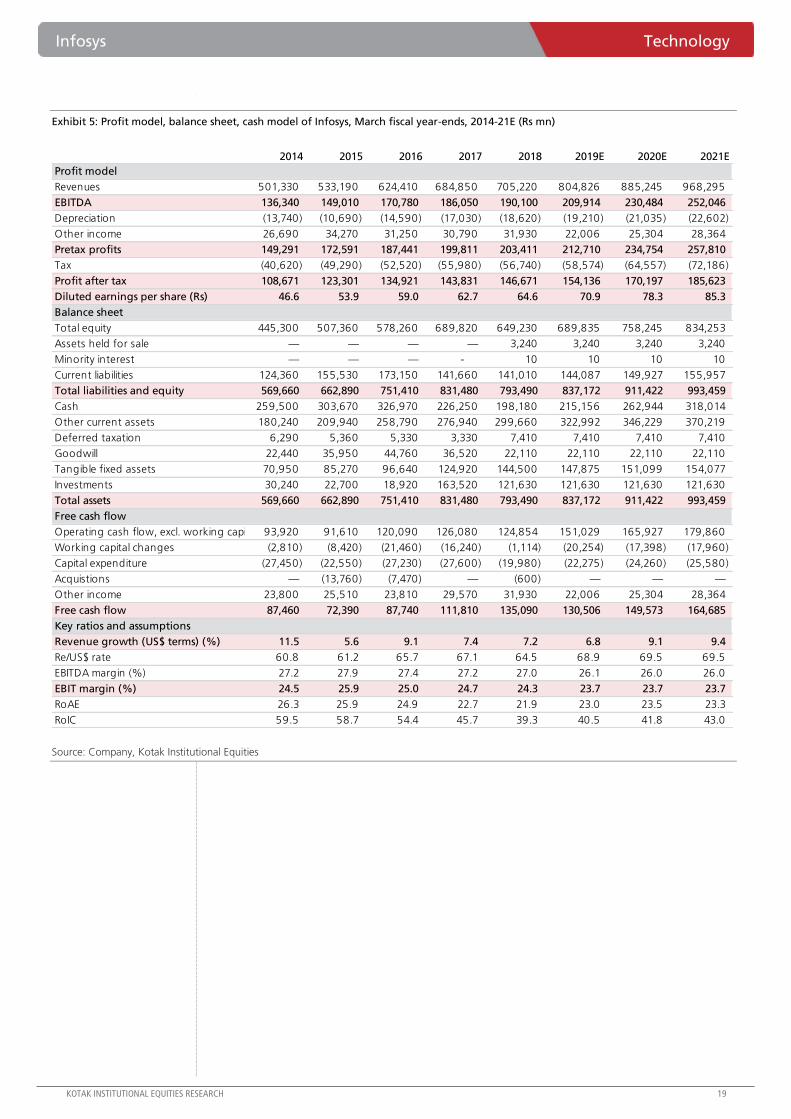
Exhibit 5: Profit model, balance sheet, cash model of Infosys, March fiscal year-ends, 2014-21E (Rs mn)
Source: Company, Kotak Institutional Equities
2014 2015 2016 2017 2018 2019E 2020E 2021E
Profit model
Revenues 501,330 533,190 624,410 684,850 705,220 804,826 885,245 968,295
EBITDA 136,340 149,010 170,780 186,050 190,100 209,914 230,484 252,046
Depreciation (13,740) (10,690) (14,590) (17,030) (18,620) (19,210) (21,035) (22,602)
Other income 26,690 34,270 31,250 30,790 31,930 22,006 25,304 28,364
Pretax profits 149,291 172,591 187,441 199,811 203,411 212,710 234,754 257,810
Tax (40,620) (49,290) (52,520) (55,980) (56,740) (58,574) (64,557) (72,186)
Profit after tax 108,671 123,301 134,921 143,831 146,671 154,136 170,197 185,623
Diluted earnings per share (Rs) 46.6 53.9 59.0 62.7 64.6 70.9 78.3 85.3
Balance sheet
Total equity 445,300 507,360 578,260 689,820 649,230 689,835 758,245 834,253
Assets held for sale — — — — 3,240 3,240 3,240 3,240
Minority interest — — — - 10 10 10 10
Current liabilities 124,360 155,530 173,150 141,660 141,010 144,087 149,927 155,957
Total liabilities and equity 569,660 662,890 751,410 831,480 793,490 837,172 911,422 993,459
Cash 259,500 303,670 326,970 226,250 198,180 215,156 262,944 318,014
Other current assets 180,240 209,940 258,790 276,940 299,660 322,992 346,229 370,219
Deferred taxation 6,290 5,360 5,330 3,330 7,410 7,410 7,410 7,410
Goodwill 22,440 35,950 44,760 36,520 22,110 22,110 22,110 22,110
Tangible fixed assets 70,950 85,270 96,640 124,920 144,500 147,875 151,099 154,077
Investments 30,240 22,700 18,920 163,520 121,630 121,630 121,630 121,630
Total assets 569,660 662,890 751,410 831,480 793,490 837,172 911,422 993,459
Free cash flow
Operating cash flow, excl. working capital 93,920 91,610 120,090 126,080 124,854 151,029 165,927 179,860
Working capital changes (2,810) (8,420) (21,460) (16,240) (1,114) (20,254) (17,398) (17,960)
Capital expenditure (27,450) (22,550) (27,230) (27,600) (19,980) (22,275) (24,260) (25,580)
Acquistions — (13,760) (7,470) — (600) — — —
Other income 23,800 25,510 23,810 29,570 31,930 22,006 25,304 28,364
Free cash flow 87,460 72,390 87,740 111,810 135,090 130,506 149,573 164,685
Key ratios and assumptions
Revenue growth (US$ terms) (%) 11.5 5.6 9.1 7.4 7.2 6.8 9.1 9.4
Re/US$ rate 60.8 61.2 65.7 67.1 64.5 68.9 69.5 69.5
EBITDA margin (%) 27.2 27.9 27.4 27.2 27.0 26.1 26.0 26.0
EBIT margin (%) 24.5 25.9 25.0 24.7 24.3 23.7 23.7 23.7
RoAE 26.3 25.9 24.9 22.7 21.9 23.0 23.5 23.3
RoIC 59.5 58.7 54.4 45.7 39.3 40.5 41.8 43.0

For Private Circulation Only. FOR IMPORTANT INFORMATION ABOUT KOTAK SECURITIES’ RATING SYSTEM AND OTHER DISCLOSURES, REFER TO THE END OF THIS MATERIAL.
Growth performance moderates in August, though YTD growth still at 9.5% yoy
Coal India reported 3.4% yoy growth in coal dispatches at 45.2 mn tons in August 2018 with
all subsidiaries but two reporting positive volume growth. Production volumes stood at 38.8 mn
tons registering a modest growth of 3.1% yoy in August 2018. Headline numbers should be
seen in the context of a strong base in August 2017 wherein CIL reported its highest dispatch
and production growth at 19% and 16% respectively.
ECL and WCL showed the highest dispatch growth of 13% yoy and 7.8% yoy respectively
followed by NCL (+6% yoy). On the production front, only three of the seven subsidiaries
reported positive volume growth with NCL reporting growth of 157% yoy with a dismal 3 mn
tons of production in August 2017 while ECL and SECL reported growth in the range of 13-
17% yoy in August 2018.
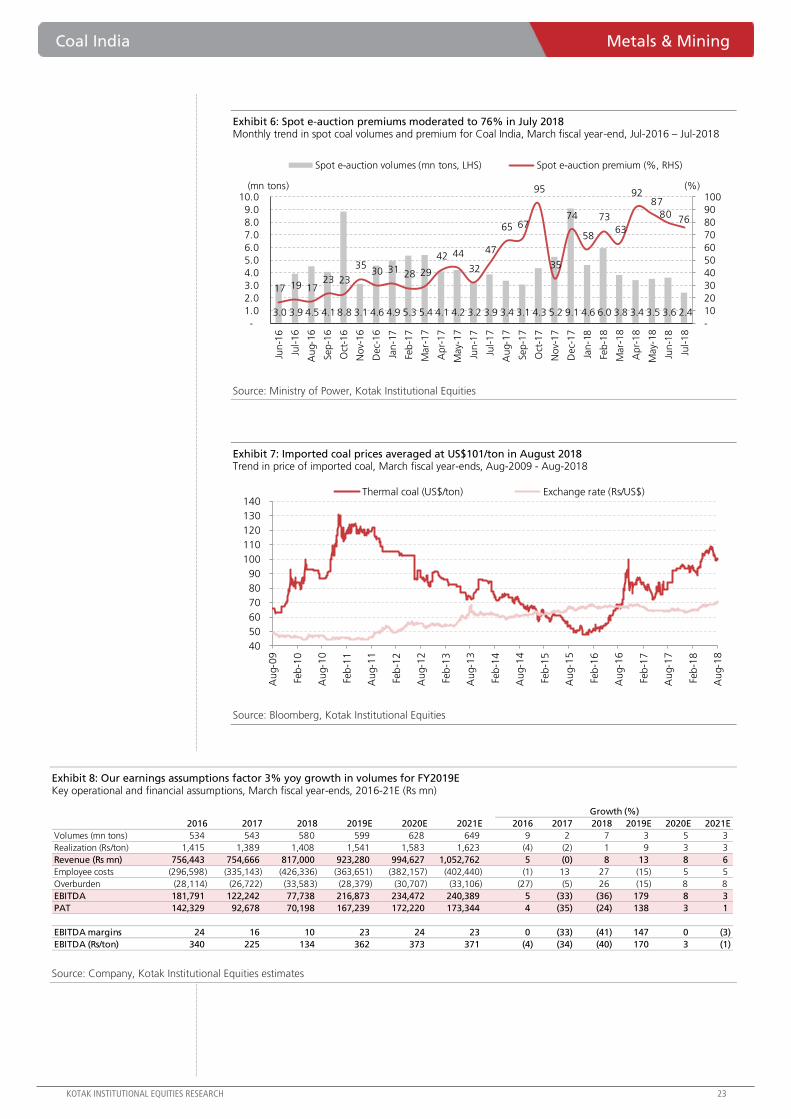
Auction premiums remain strong, inventory remains healthy across regions except West
E-auction premiums moderated to 76% in July 2018 from 80% seen in June 2018. Premiums
are still well above those seen in FY2018, and should also be seen in the context of the price
increase taken in January 2018. Coal inventory days have remained stable over the past five
months with 10 days of inventories in August 2018—East has no plants with critical inventory
while North and South have one plant each. Overall, plants with critical/supercritical levels of
inventory declined to 11 in August 2018 from a high of 25 in May 2018, largely concentrated
in the West region. YTD growth in coal generation stands at 5.1% (upto July 2018).
Improved pricing and volume profile augurs well for earnings
Coal India’s earnings, which have been plagued by (1) increase in wage revisions and (2) grade
slippages for coal, will likely see an improvement in realizations on the back of an increase in
notified coal prices as well as an evacuation charge of ₹50/ton (in December 2017). Strong e-
auction realizations coupled with improved power demand, will also aid topline performance.
We maintain our ADD rating with a target price of Rs326/share. Our positive stance is backed
by continued improvement in top-line performance, and limited cost-side shocks hereon.
Coal India (COAL) Metals & Mining
The base catches up. Coal India reported 3.4% yoy growth in dispatches in August
2018, though YTD growth still remains strong at 9.5%. The moderated growth for the
month should be seen in the context of 19% yoy growth seen in August 2017. E-
auction premiums moderated to 76% in July 2018 though still fairly healthy. After two
years of disappointing earnings performance, Coal India appears well on course to
mend the earnings trajectory. Maintain ADD rating with a target price of Rs326/share.
ADD
SEPTEMBER 03, 2018
UPDATE
Coverage view: Attractive
Price (`): 286
Target price (`): 326
BSE-30: 38,645
Murtuza Arsiwalla
Samrat Verma
Coal India
Stock data Forecasts/Valuations 2018 2019E 2020E
52-week range (Rs) (high,low) EPS (Rs) 11.3 26.9 27.7
Market Cap. (Rs bn) EPS growth (%) (24.2) 138.2 3.0
Shareholding pattern (%) P/E (X) 25.3 10.6 10.3
Promoters 78.5 Sales (Rs bn) 823.9 947.8 1,020.3
FIIs 5.5 Net profits (Rs bn) 70.2 167.2 172.2
MFs 1.6 EBITDA (Rs bn) 77.7 216.9 234.5
Price performance (%) 1M 3M 12M EV/EBITDA (X) 19.0 6.8 6.5
Absolute 9.5 (3.5) 20.5 ROE (%) 26.7 66.1 66.4
Rel. to BSE-30 6.6 (11.8) (1.1) Div. Yield (%) 5.8 7.0 8.7
Co mpan y d a ta an d va lua t io n s ummary
317-236
1,775.0

Coal India Metals & Mining
KOTAK INSTITUTIONAL EQUITIES RESEARCH 21
Exhibit 1: Coal India reported modest dispatch growth of 3.4% yoy in August 2018; production volume growth was 3.1% yoy Subsidiary-wise monthly dispatch volumes, March fiscal year-ends (mn tons)
Source: Company, Kotak Institutional Equities
Exhibit 2: Monthly dispatches to power sector increased by 27% yoy in July 2018 Monthly trend of coal dispatches to power sector, March fiscal year-ends, Jul-2016 - Jul-2018
Source: Ministry of Power, Kotak Institutional Equities
Growth (%) YTD Quarterly
Aug-18 Aug-17 Jul-18 yoy mom 2019 2018 (% chg.) 1QFY19 1QFY18 (% chg.)
Dispatches
ECL 3.3 2.9 3.6 13.1 (8.7) 19.1 15.4 24.5 12.3 9.6 28.4
BCCL 2.5 2.6 3.0 (4.9) (16.6) 14.6 12.9 12.9 9.1 7.8 16.4
CCL 4.6 5.3 4.9 (12.3) (4.5) 27.2 26.1 4.2 17.7 16.0 10.8
NCL 8.3 7.8 8.4 5.9 (1.7) 41.0 36.8 11.3 24.4 21.8 11.9
WCL 3.7 3.4 3.9 7.8 (5.4) 21.2 18.5 15.1 13.6 11.1 22.2
SECL 12.1 11.5 13.1 5.7 (7.0) 65.8 61.0 7.9 40.6 37.6 8.0
MCL 10.7 10.2 11.4 4.7 (6.4) 57.8 54.6 5.7 35.7 33.4 7.0
NEC 0.0 0.0 0.0 50.0 — 0.2 0.3 (11.5) 0.2 0.2 (19.0)
CIL 45.2 43.8 48.3 3.4 (6.3) 246.9 225.5 9.5 153.5 137.4 11.7
Production
ECL 3.0 2.6 3.1 17.2 (2.9) 17.1 13.8 23.7 11.0 8.9 24.0
BCCL 2.2 2.4 2.3 (9.1) (5.2) 12.2 11.2 8.7 7.7 6.8 12.3
CCL 3.7 3.7 3.5 (0.8) 6.0 18.7 17.0 9.5 11.4 10.2 12.4
NCL 7.7 3.0 8.1 157.7 (4.2) 40.4 31.1 29.9 24.6 21.2 16.0
WCL 2.2 2.3 1.7 (5.6) 31.7 13.5 12.5 8.1 9.6 8.1 18.7
SECL 10.7 9.5 11.7 13.3 (8.6) 62.4 51.1 22.1 40.0 31.7 26.0
MCL 9.2 9.6 10.2 (3.9) (9.5) 51.8 51.7 0.3 32.5 31.9 1.9
NEC 0.0 0.0 0.0 25.0 50.0 0.2 0.1 62.9 0.1 0.1 98.4
CIL 38.8 37.6 40.6 3.1 (4.4) 216.2 193.1 12.0 136.9 118.8 15.2
31
26 27
34 3436
34
3935 33 33 35
3134
32
40 41 42 4138
4340 42 40 40
(20) (15) (10) (5) - 5 10 15 20 25 30 35
-
5
10
15
20
25
30
35
40
45
50
Jul-
16
Au
g-1
6
Sep
-16
Oct
-16
No
v-1
6
Dec-
16
Jan
-17
Feb
-17
Mar-
17
Ap
r-1
7
May-
17
Jun
-17
Jul-
17
Au
g-1
7
Sep
-17
Oct
-17
No
v-1
7
Dec-
17
Jan
-18
Feb
-18
Mar-
18
Ap
r-1
8
May-
18
Jun
-18
Jul-
18
Dispatch to power (LHS, mn tons) YoY growth (RHS, %)
(mn tons) (%)

Metals & Mining Coal India
22 KOTAK INSTITUTIONAL EQUITIES RESEARCH
Exhibit 3: Inventory days have improved in recent months; number of plants with critical inventory continues to remain high in West Inventory position of coal across power plants in India, March fiscal year-ends, 2017-18
Source: CEA, Kotak Institutional Equities
Exhibit 4: Coal-based generation increased 5% yoy in July 2018 Key details of installed capacity, generation and PLF in India, March fiscal year-ends
Source: CEA, Kotak Institutional Equities
Exhibit 5: Railways freights not reflecting the seasonal drop this time around Volume and freight rates for coal movement by railway (mn tons, Rs/ton km)
Source: Indian Railways, Kotak Institutional Equities
Aug-2018 Jul-2018 Jun-2018
Days Critical (#) Super-Critical (#) Days Critical (#) Super-Critical (#) Days Critical (#) Super-Critical (#)
North 12 1 — 14 — 1 11 2 5
West 10 3 6 10 6 5 8 6 3
South 13 — 1 12 — 1 11 — —
East 4 — — 5 — — 9 — —
All India 10 4 7 11 6 7 10 8 8
Aug-2017 Jul-2017 Jun-2017
Days Critical (#) Super-Critical (#) Days Critical (#) Super-Critical (#) Days Critical (#) Super-Critical (#)
North 9 1 2 13 11 — 17 1 —
West 8 4 3 12 1 1 9 2 1
South 10 — — 16 — — 12 — —
East 6 — — 9 — — 10 — —
All India 8 5 5 12 — 1 11 3 1
Jul-18 Jul-17 yoy (%) Jul-18 Jul-17 yoy (%)
Overall
Installed capacity (MW) 345,494 330,154 4.6 345,494 330,154 4.6
Generation (MU) 101,439 97,041 4.5 416,721 404,034 3.1
PLF (%) 49.6 48.1 152 bps 51.8 51.0 80 bps
Coal
Installed capacity (MW) 196,957 194,433 1.3 196,957 194,433 1.3
Generation (MU) 75,598 71,811 5.3 328,269 312,215 5.1
PLF (%) 53.3 51.5 180 bps 58.8 57.1 175 bps
Monthly YTD
1.50
1.60
1.70
1.80
1.90
2.00
2.10
2.20
35.00
40.00
45.00
50.00
55.00
60.00
Jun
/16
Jul/1
6
Au
g/1
6
Sep
/16
Oct
/16
No
v/1
6
Dec/
16
Jan
/17
Feb
/17
Mar/
17
Ap
r/1
7
May/
17
Jun
/17
Jul/1
7
Au
g/1
7
Sep
/17
Oct
/17
No
v/1
7
Dec/
17
Jan
/18
Feb
/18
Mar/
18
Ap
r/1
8
May/
18
Jun
/18
Jul/1
8
Volumes (LHS, mn tons) Freight (RHS,Rs/ton km)
Coal India Metals & Mining
KOTAK INSTITUTIONAL EQUITIES RESEARCH 23
Exhibit 6: Spot e-auction premiums moderated to 76% in July 2018 Monthly trend in spot coal volumes and premium for Coal India, March fiscal year-end, Jul-2016 – Jul-2018
Source: Ministry of Power, Kotak Institutional Equities
Exhibit 7: Imported coal prices averaged at US$101/ton in August 2018 Trend in price of imported coal, March fiscal year-ends, Aug-2009 - Aug-2018
Source: Bloomberg, Kotak Institutional Equities
Exhibit 8: Our earnings assumptions factor 3% yoy growth in volumes for FY2019E Key operational and financial assumptions, March fiscal year-ends, 2016-21E (Rs mn)
Source: Company, Kotak Institutional Equities estimates
3.0 3.9 4.5 4.1 8.8 3.1 4.6 4.9 5.3 5.4 4.1 4.2 3.2 3.9 3.4 3.1 4.3 5.2 9.1 4.6 6.0 3.8 3.4 3.5 3.6 2.4
17 19 17 23 23
35 30 31 28 29
42 44
32
47
65 67
95
35
74
58
73
63
92 87
80 76
-
10
20
30
40
50
60
70
80
90
100
-
1.0
2.0
3.0
4.0
5.0
6.0
7.0
8.0
9.0
10.0
Jun
-16
Jul-
16
Au
g-1
6
Sep
-16
Oct
-16
No
v-1
6
Dec-
16
Jan
-17
Feb
-17
Mar-
17
Ap
r-1
7
May-
17
Jun
-17
Jul-
17
Au
g-1
7
Sep
-17
Oct
-17
No
v-1
7
Dec-
17
Jan
-18
Feb
-18
Mar-
18
Ap
r-1
8
May-
18
Jun
-18
Jul-
18
Spot e-auction volumes (mn tons, LHS) Spot e-auction premium (%, RHS)
(mn tons) (%)
40
50
60
70
80
90
100
110
120
130
140
Au
g-0
9
Feb
-10
Au
g-1
0
Feb
-11
Au
g-1
1
Feb
-12
Au
g-1
2
Feb
-13
Au
g-1
3
Feb
-14
Au
g-1
4
Feb
-15
Au
g-1
5
Feb
-16
Au
g-1
6
Feb
-17
Au
g-1
7
Feb
-18
Au
g-1
8
Thermal coal (US$/ton) Exchange rate (Rs/US$)
Growth (%)
2016 2017 2018 2019E 2020E 2021E 2016 2017 2018 2019E 2020E 2021E
Volumes (mn tons) 534 543 580 599 628 649 9 2 7 3 5 3
Realization (Rs/ton) 1,415 1,389 1,408 1,541 1,583 1,623 (4) (2) 1 9 3 3
Revenue (Rs mn) 756,443 754,666 817,000 923,280 994,627 1,052,762 5 (0) 8 13 8 6
Employee costs (296,598) (335,143) (426,336) (363,651) (382,157) (402,440) (1) 13 27 (15) 5 5
Overburden (28,114) (26,722) (33,583) (28,379) (30,707) (33,106) (27) (5) 26 (15) 8 8
EBITDA 181,791 122,242 77,738 216,873 234,472 240,389 5 (33) (36) 179 8 3
PAT 142,329 92,678 70,198 167,239 172,220 173,344 4 (35) (24) 138 3 1
EBITDA margins 24 16 10 23 24 23 0 (33) (41) 147 0 (3)
EBITDA (Rs/ton) 340 225 134 362 373 371 (4) (34) (40) 170 3 (1)

Metals & Mining Coal India
24 KOTAK INSTITUTIONAL EQUITIES RESEARCH
Exhibit 9: Profit model, balance sheet, cash model of Coal India, March fiscal year-ends, 2016-21E (Rs mn)
Source: Company, Kotak Institutional Equities estimates
2016 2017 2018 2019E 2020E 2021E
Profit model
Net sales 756,443 754,666 817,000 923,280 994,627 1,052,762
Transport and loading recovery 22,386 27,382 23,700 24,520 25,759 26,599
Total income 793,271 794,430 823,905 947,767 1,020,332 1,079,306
EBITDA 181,791 122,242 77,738 216,873 234,472 240,389
Interest income 48,042 37,306 31,633 18,278 14,245 14,870
Other Income (ex transport, interest) 10,515 18,008 32,875 43,407 43,407 43,407
Interest expense (207) (4,117) (4,318) (5,297) (5,297) (5,297)
Depreciation (24,664) (29,101) (30,664) (32,567) (36,619) (39,545)
Pretax profits 215,476 144,337 107,264 240,695 250,207 253,824
Tax (73,148) (51,660) (37,067) (73,456) (77,987) (80,480)
Net income 142,329 92,678 70,198 167,239 172,220 173,344
Extraordinary items 415 (18) — — — —
Reported profit 142,743 92,660 70,198 167,239 172,220 173,344
Earnings per share (Rs) 23 15 11 27 28 28
Balance sheet
Paid-up common stock 63,164 62,074 62,074 62,074 62,074 62,074
Total shareholders' equity 338,976 245,268 198,466 220,464 211,133 202,926
Minority interest 1,048 3,459 3,625 3,625 3,625 3,625
Total borrowings 11,988 30,078 15,309 15,309 15,309 15,309
Shifting and rehab fund 31,777 38,197 43,666 43,666 43,666 43,666
Total liabilities and equity 383,788 317,002 261,065 283,064 273,733 265,525
Net fixed assets 183,608 220,900 275,774 292,861 325,640 316,939
Capital work-in progress 58,942 103,078 102,864 139,849 158,724 167,114
Investments 29,019 14,829 15,086 15,086 15,086 15,086
Cash 383,128 312,298 314,751 310,121 278,617 307,434
Current assets (excl. cash) 427,055 482,357 512,892 544,841 564,843 576,208
Current liabilities and provisions 718,408 843,787 1,013,852 1,075,170 1,126,483 1,177,245
Deferred tax asset 20,445 27,328 53,551 55,476 57,304 59,989
Misc. expenditure — — — — — —
Total assets 383,788 317,002 261,065 283,064 273,733 265,525
Free cash flow
Operating cash flow, excl. working capital 165,021 121,761 100,862 197,880 207,011 210,204
Working capital changes (62,730) 70,077 139,530 29,369 31,310 39,397
Capital expenditure (43,450) 162,491 (85,324) (86,638) (88,274) (39,233)
Investments (885) 14,191 (258) — — —
Free cash flow 57,957 368,519 154,810 140,612 150,047 210,368
Ratios
Net debt/equity (%) (109) (115) (151) (134) (125) (144)
Return on equity (%) 38 32 32 80 80 84
Book value per share (Rs) 54 40 32 36 34 33
ROCE (%) 39 34 39 89 89 93

For Private Circulation Only. FOR IMPORTANT INFORMATION ABOUT KOTAK SECURITIES’ RATING SYSTEM AND OTHER DISCLOSURES, REFER TO THE END OF THIS MATERIAL.
The event – GCPL exits the UK market; sells 100% stake in the UK business for GBP34 mn
GCPL has announced the divestment of its 100% stake in its UK operating entity Godrej
Consumer Products (UK) Limited to JZ international, a pan-European investment bank based in
London. Deal EV of GBP34 mn implies a trailing (FY2018) EV/EBITDA multiple of 5.1X and a
forward (FY2020, based on KIE estimates) EV/EBITDA of 4X. On a PE basis, deal consideration
implies a valuation of 8.4X trailing (FY2018) and around 6.5X forward (FY2020E) PE. GCP (UK)
had revenues, EBITDA, and PAT of GBP53.9 mn (Rs4.61 bn), GBP7.1 mn (Rs607 mn) and
GBP4.6 mn (Rs390 mn) in FY2018, respectively. Revenues and EBITDA had grown at a 15% and
23% CAGR in the past seven years (FY2011-18) in INR terms, we note.
The impact – EPS dilution of around 1.6-1.9% for FY2020E
Even as the UK business was not a material contributor to GCPL’s consolidated financials (4.7%
of revenues, 2.9% of EBITDA, and 2.7% of PAT in FY2018), low valuations do make the deal
marginally earnings dilutive, per our math. The math – a 6% post-tax yield on the deal
consideration value of Rs3.1 bn (at current GBPINR rate) would generate Rs187 mn at the PAT
level; PAT loss on account of the UK business divestment, per our model, would be close to
Rs500-550 mn. PAT dilution of Rs310-360 mn, in other words, or 1.6-1.9% of our FY2020E
PAT expectation. Impact on FY2019E earnings would be part-year and hence, lower.
The nub – sharpens strategic focus but also highlights an important valuation aspect
From a strategic standpoint, the divestment marks GCPL’s exit from the only developed market
(other than the US, where the target consumer group is strategic) it has been present in. This is
in sync with the company’s stated geographical focus – Asia, Africa, and Latin America.
More important, however, is the valuation aspect the transaction highlights. GCPL’s earnings
have the lowest ‘India’ component in the sector. UK business divestment has happened at
multiples way lower than GCPL’s consolidated multiples. Sector multiples in GCPL’s
international markets (Indonesia, Africa, LatAm) are generally lower than in India, we note. For
argument’s sake, if we ascribe a 30X FY2020E PE to GCPL’s non-India earnings (35% of total),
the implied valuation of the India business would work out to 62X, 15% premium to HUVR.
Godrej Consumer Products (GCPL) Consumer Products
Divests 100% stake in the UK business. GCPL has sold a 100% stake in its UK
operating subsidiary Godrej Consumer Products (UK) Limited for a consideration of
GBP34 mn. We are surprised at the low implied transaction multiples – 5.1X trailing,
FY2018, EV/EBITDA and 8.4X FY2018 P/E. Even as the UK business was an immaterial
contributor to the overall business, deal multiples do raise a question mark on applying
‘India’ multiples to ‘non-India’ earnings; nearly 40% of GCPL’s EBITDA is non-India. The
transaction, per se, does not swing the needle much on numbers. Our SELL stays.
SELL
SEPTEMBER 03, 2018
UPDATE
Coverage view: Cautious
Price (`): 1,452
Target price (`): 1,100
BSE-30: 38,645
Rohit Chordia
Jaykumar Doshi
Aniket Sethi
Godrej Consumer Products
Stock data Forecasts/Valuations 2018 2019E 2020E
52-week range (Rs) (high,low) EPS (Rs) 21.4 25.4 28.8
Market Cap. (Rs bn) EPS growth (%) 11.5 18.8 13.7
Shareholding pattern (%) P/E (X) 68.0 57.3 50.4
Promoters 63.3 Sales (Rs bn) 98.4 110.3 123.0
FIIs 28.0 Net profits (Rs bn) 14.5 17.3 19.6
MFs 0.7 EBITDA (Rs bn) 20.7 24.2 27.5
Price performance (%) 1M 3M 12M EV/EBITDA (X) 48.2 40.7 35.3
Absolute 10.3 27.5 56.3 ROE (%) 25.2 25.4 24.8
Rel. to BSE-30 7.3 16.5 28.3 Div. Yield (%) 0.5 0.6 0.7
Co mpan y d a ta an d va lua t io n s ummary
1,468-888
989.6

Consumer Products Godrej Consumer Products
26 KOTAK INSTITUTIONAL EQUITIES RESEARCH
Note that we have not made any changes to our model to reflect the transaction
yet.
Exhibit 1: GCP (UK) limited financials, March fiscal year-ends
Source: Company, Kotak Institutional Equities
GBP mn Rs mn
Revenues 53.9 4,610
COGS (31.4) (2,685)
Gross profit 22.5 1,925
Gross margin (%) 41.8 42
Staff costs (5.2) (448)
Other expenses (10.2) (871)
EBITDA 7.1 607
EBITDA margin (%) 13.2 13.2
D&A (1.2) (102)
EBIT 5.9 505
Net finance cost (0.0) (0)
PBT 5.9 505
Taxes (1.3) (114)
PAT 4.6 390
ETR (%) 22.6 22.6
% of consolidated
Revenues 4.7
EBITDA 2.9
PBT 2.7
PAT 2.7
FY2018 financials

Godrej Consumer Products Consumer Products
KOTAK INSTITUTIONAL EQUITIES RESEARCH 27
Exhibit 2: GCPL: Consolidated Profit model, balance sheet, cash flow model 2015-2020E, March fiscal year-ends (Rs mn)
Source: Company, Kotak Institutional Equities estimates
2015 2016 2017 2018E 2019E 2020E 2021E
Profit model (Rs mn)
Net revenues 82,422 84,132 92,428 97,680 109,428 122,045 135,765
EBITDA 13,684 16,358 18,977 20,671 24,216 27,533 31,018
Other income 839 946 1,004 1,828 2,126 2,594 3,103
Interest expense (1,032) (1,190) (1,452) (1,607) (1,517) (1,433) (1,350)
Depreciation (908) (1,006) (1,416) (1,557) (1,729) (1,933) (2,152)
Extraordinary items 260 (3,335) 1 1,796 1,075 — —
Pretax profits 12,843 11,772 17,114 21,131 24,171 26,761 30,619
Tax (2,737) (3,361) (3,792) (4,047) (4,969) (6,154) (7,386)
Minority Interest (693) (29) (31) 11 11 11 11
Net Income 9,413 8,383 13,292 17,094 19,212 20,618 23,244
PAT after MI but before EO/Norm tax 8,811 11,611 13,040 14,546 17,280 19,647 22,147
Earnings per share (Rs) 12.9 17.1 19.1 21.4 25.4 28.8 32.5
Balance sheet (Rs mn)
Total shareholder's equity 43,107 42,670 53,020 62,583 73,440 84,770 97,369
Total borrowings 27,172 28,911 40,009 25,208 23,508 21,808 20,108
Other financial liabilities — 672— 9,112 7,540 7,540 7,540 7,540
Deferred tax liability (312) 1,362 1,898 2,047 2,047 2,047 2,047
Minority Interest 1,620 100 — — — — —
Total liabilities and equity 71,587 73,715 104,040 97,378 106,535 116,164 127,064
Net fixed assets incl CWIP 57,756 59,751 81,864 83,989 83,563 83,030 82,324
Investments 1,857 1,895 9,335 9,973 9,973 9,973 9,973
Cash 8,942 7,538 9,127 9,602 18,753 28,510 39,638
Net current assets 3,032 4,531 3,714 (6,186) (5,754) (5,348) (4,872)
Total assets 71,587 73,715 104,040 97,378 106,535 116,164 127,064
Free cash flow (Rs mn)
Operating cash flow (excl working capital) 11,246 13,328 14,688 16,996 19,670 21,860 24,163
Working capital (721) (4,645) 3,563 76 (432) (406) (476)
Capital expenditure (8,424) (8,555) (16,116) (3,144) (1,831) (1,928) (1,974)
Free cash flow 2,101 128 2,135 13,929 17,407 19,527 21,712
Key ratios (%)
Sales growth 8.7 2.1 9.9 5.7 12.0 11.5 11.2
EPS growth 16.9 31.8 12.3 11.6 18.8 13.7 12.7
EBITDA margin 16.5 19.4 20.5 21.0 22.0 22.4 22.7
Gross margin 53.6 54.1 55.4 56.6 56.9 56.9 57.0
Ad spends (% of sales) 11.0 7.9 7.7 8.2 8.2 8.1 8.1
ROE (%) 21.8 27.1 27.3 25.2 25.4 24.8 24.3
ROCE (%) 18.8 21.0 19.7 18.9 21.9 22.9 23.6
Note:
(1) FY2016 P&L and forecasts based on IND-AS and hence not strictly comparable to pre-FY2016 P&L which were based on IGAAP.

For Private Circulation Only. FOR IMPORTANT INFORMATION ABOUT KOTAK SECURITIES’ RATING SYSTEM AND OTHER DISCLOSURES, REFER TO THE END OF THIS MATERIAL.
FY2018 – a 180-degree swing from year-beginning to year-end
UBBL ended the year on a completely different note than it started the year with. The highway
ban was in effect at the beginning of the year and GST-related concerns on stranded taxes were
looming large. The highway ban ended by end-1QFY18 and the industry negotiated the GST
headwind well; very well in fact, as a potential negative turned into a net positive as the
‘stranded taxes’ argument was presented strongly enough to get material price hikes from a
large number of states. Subsumption of local body taxes in important states like Maharashtra
aided the net positive equation that GST implementation turned out to be, for the industry.
To be sure, UBBL continued to execute well to make the most of the positive turn of events.
P&L – strong volume growth and adspend cuts drove 41% EBITDA growth
UBBL had a strong year, even adjusted for the soft FY2017 base. Volume growth of 10.3%
(to 161 mn cases) was the first double-digit volume growth print since FY2011 (FY2011-17
volume CAGR: 2.7%). Net realization per case went up 7.7% yoy (highest yoy swing in six
years) despite higher stranded taxes under GST; gross realization per case increased (a good
indicator of price increases received from states) and was broadly in line with excise/case
increase; the gap between the two (210 bps) was the lowest since FY2009. Strong
premiumization also aided. EBITDA margins expanded 250 bps yoy, primarily on the back of (a)
207 bps decline in adspends as % of sales, and (b) 66 bps decline in rates and taxes. Adspends
went down 13% in absolute terms after declining by a similar level in FY2017 as well. EPS grew
a strong 72% yoy. Performance was healthy even adjusted for the soft FY2017 base; 2-year
(FY16-18) CAGR on revenues, EBITDA and PAT stood at 8%, 14%, and 15%, respectively.
Return ratios improved but cash flow generation remains subdued
UBBL’s RoE and pre-tax RoCE were at multi-year highs of 15.7% and 22.6%, respectively, for
FY2018. Consistent margin improvement has been the primary driver of improvement in return
ratios for many years now; asset turns have stayed in the 1.1-1.2X range. FCF growth at 17%
yoy was materially lower than the 41% EBITDA growth print on account of the adverse working
capital swing. FCF/EBITDA stood at 18%.
United Breweries (UBBL) Consumer Products
AR2018 analysis – a solid year on all counts. Despite a subdued start to the fiscal on
account of the highway ban, UBBL ended the year on a strong note with multi-year
highs on volume growth, EBITDA margin, and return ratios. Cash flow generation ratios
remained subdued on account of an adverse working capital swing, however. In-market
execution was healthy resulting in 150 bps market share gains and strong
premiumization. We like the long-term growth potential in beer as well as UBBL’s
execution prowess to leverage the same. Stock is too expensive, however. SELL.
SELL
SEPTEMBER 3, 2018
UPDATE
Coverage view: Cautious
Price (`): 1,404
Target price (`): 1,100
BSE-30: 38,645
Rohit Chordia
Jaykumar Doshi
Aniket Sethi
United Breweries
Stock data Forecasts/Valuations 2018 2019E 2020E
52-week range (Rs) (high,low) EPS (Rs) 14.9 20.8 25.7
Market Cap. (Rs bn) EPS growth (%) 71.6 39.2 23.6
Shareholding pattern (%) P/E (X) 94.1 67.6 54.6
Promoters 73.3 Sales (Rs bn) 56.2 63.2 70.9
FIIs 16.8 Net profits (Rs bn) 3.9 5.5 6.8
MFs 3.7 EBITDA (Rs bn) 9.0 11.1 12.7
Price performance (%) 1M 3M 12M EV/EBITDA (X) 41.4 33.4 28.7
Absolute 28.7 20.0 78.2 ROE (%) 15.7 18.7 19.6
Rel. to BSE-30 25.3 9.6 46.3 Div. Yield (%) 0.1 0.2 0.3
Company data and va luation summary
1,462-775
371.3
United Breweries Consumer Products
KOTAK INSTITUTIONAL EQUITIES RESEARCH 29
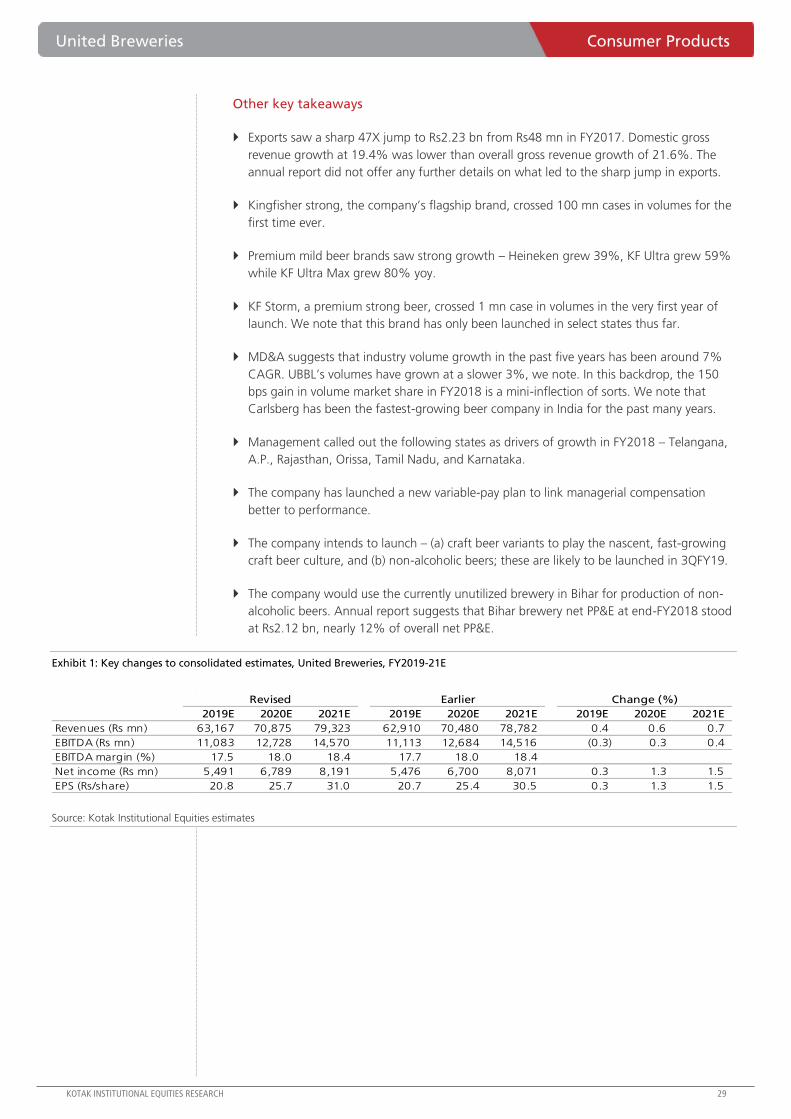
Other key takeaways
Exports saw a sharp 47X jump to Rs2.23 bn from Rs48 mn in FY2017. Domestic gross
revenue growth at 19.4% was lower than overall gross revenue growth of 21.6%. The
annual report did not offer any further details on what led to the sharp jump in exports.
Kingfisher strong, the company’s flagship brand, crossed 100 mn cases in volumes for the
first time ever.
Premium mild beer brands saw strong growth – Heineken grew 39%, KF Ultra grew 59%
while KF Ultra Max grew 80% yoy.
KF Storm, a premium strong beer, crossed 1 mn case in volumes in the very first year of
launch. We note that this brand has only been launched in select states thus far.
MD&A suggests that industry volume growth in the past five years has been around 7%
CAGR. UBBL’s volumes have grown at a slower 3%, we note. In this backdrop, the 150
bps gain in volume market share in FY2018 is a mini-inflection of sorts. We note that
Carlsberg has been the fastest-growing beer company in India for the past many years.
Management called out the following states as drivers of growth in FY2018 – Telangana,
A.P., Rajasthan, Orissa, Tamil Nadu, and Karnataka.
The company has launched a new variable-pay plan to link managerial compensation
better to performance.
The company intends to launch – (a) craft beer variants to play the nascent, fast-growing
craft beer culture, and (b) non-alcoholic beers; these are likely to be launched in 3QFY19.
The company would use the currently unutilized brewery in Bihar for production of non-
alcoholic beers. Annual report suggests that Bihar brewery net PP&E at end-FY2018 stood
at Rs2.12 bn, nearly 12% of overall net PP&E.
Exhibit 1: Key changes to consolidated estimates, United Breweries, FY2019-21E
Source: Kotak Institutional Equities estimates
2019E 2020E 2021E 2019E 2020E 2021E 2019E 2020E 2021E
Revenues (Rs mn) 63,167 70,875 79,323 62,910 70,480 78,782 0.4 0.6 0.7
EBITDA (Rs mn) 11,083 12,728 14,570 11,113 12,684 14,516 (0.3) 0.3 0.4
EBITDA margin (%) 17.5 18.0 18.4 17.7 18.0 18.4
Net income (Rs mn) 5,491 6,789 8,191 5,476 6,700 8,071 0.3 1.3 1.5
EPS (Rs/share) 20.8 25.7 31.0 20.7 25.4 30.5 0.3 1.3 1.5
Revised Earlier Change (%)

Consumer Products United Breweries
30 KOTAK INSTITUTIONAL EQUITIES RESEARCH
Exhibit 2: Strong bounce back off FY2017 lows United Breweries, condensed P&L, March fiscal year-ends, 2009-18, Rs mn
Source: Company, Kotak Institutional Equities
Exhibit 3: Per case economics improved substantially in FY2018
Source: Company, Kotak Institutional Equities
2009 2010 2011 2012 2013 2014 2015 2016 2017 2018
Gross revenues 26,790 32,390 44,302 56,836 62,079 68,160 77,204 93,894 100,055 121,634
Excise duty (8,559) (10,727) (15,447) (22,406) (26,326) (30,335) (35,519) (48,083) (55,006) (68,116)
Net sales 18,231 21,663 28,856 34,430 35,752 37,826 41,685 45,811 45,049 53,518
Other operating income 1,063 1,092 1,743 1,821 3,235 4,471 5,196 2,520 2,243 2,672
Net operating revenues 19,295 22,755 30,598 36,252 38,987 42,297 46,881 48,331 47,292 56,190
Gross profit 9,924 11,622 16,638 20,089 22,546 24,976 27,944 27,122 25,513 29,876
EBITDA 2,271 2,342 3,903 4,125 4,769 5,973 6,217 6,930 6,421 9,020
EBIT 1,374 1,302 2,595 2,636 3,065 3,995 4,142 4,493 3,551 6,423
PBT 856 1,468 2,266 2,377 2,660 3,351 3,790 4,547 3,481 6,078
Recurring PAT 456 896 1,475 1,464 1,721 2,260 2,598 2,983 2,296 3,942
Growth, yoy (%)
Gross revenues 24.1 20.9 36.8 28.3 9.2 9.8 13.3 21.6 6.6 21.6
Excise duty 24.1 25.3 44.0 45.0 17.5 15.2 17.1 35.4 14.4 23.8
Net sales 24.2 18.8 33.2 19.3 3.8 5.8 10.2 9.9 (1.7) 18.8
Other operating income 14.9 2.7 59.6 4.5 77.6 38.2 16.2 (51.5) (11.0) 19.1
Net operating revenues 23.6 17.9 34.5 18.5 7.5 8.5 10.8 3.1 (2.2) 18.8
Gross profit 20.1 17.1 43.2 20.7 12.2 10.8 11.9 (2.9) (5.9) 17.1
EBITDA 22.3 3.2 66.6 5.7 15.6 25.2 4.1 11.5 (7.3) 40.5
EBIT 22.1 (5.3) 99.3 1.6 16.3 30.3 3.7 8.5 (21.0) 80.9
PBT 0.8 71.6 54.3 4.9 11.9 26.0 13.1 20.0 (23.4) 74.6
Recurring PAT (15.9) 96.7 64.5 (0.8) 17.6 31.3 15.0 14.8 (23.0) 71.7
Margin (%)
Gross margin 51.4 51.1 54.4 55.4 57.8 59.0 59.6 56.1 53.9 53.2
EBITDA margin 11.8 10.3 12.8 11.4 12.2 14.1 13.3 14.3 13.6 16.1
EBIT margin 7.1 5.7 8.5 7.3 7.9 9.4 8.8 9.3 7.5 11.4
PAT margin 2.4 3.9 4.8 4.0 4.4 5.3 5.5 6.2 4.9 7.0
Excise as % of Gross revenues 31.9 33.1 34.9 39.4 42.4 44.5 46.0 51.2 55.0 56.0
2009 2010 2011 2012 2013 2014 2015 2016 2017 2018
Volumes (mn cases) 82 101 124 133 139 139 145 150 146 161
Gross realization/case (Rs) 325 321 357 427 447 491 531 627 687 757
Excise/case (Rs) 104 106 124 168 189 219 244 321 378 424
Net realization/case (Rs) 221 214 232 259 257 273 287 306 309 333
COGS/case (Rs) 114 110 112 122 118 125 130 142 150 164
Gross profit/case (Rs) 108 104 120 137 139 148 156 164 160 169
Other costs/case (Rs) 93 92 103 120 128 137 149 135 131 130
Of which, adspend/case (Rs) 27 25 19
Ex-adspends, other costs/case (Rs) 107 106 111
Other revenues/case (Rs) 13 11 14 14 23 32 36 17 15 17
EBITDA/case (Rs) 28 23 31 31 34 43 43 46 44 56
Growth, yoy (%)
Volumes (mn cases) 9.3 22.6 23.0 7.1 4.5 (0.2) 4.8 3.0 (2.8) 10.3
Gross realization/case (Rs) 13.6 (1.4) 11.2 19.8 4.5 10.0 8.0 18.1 9.6 10.2
Excise/case (Rs) 13.6 2.3 17.1 35.5 12.4 15.5 11.7 31.4 17.7 12.3
Net realization/case (Rs) 13.6 (3.1) 8.3 11.5 (0.6) 6.0 5.1 6.7 1.2 7.7
COGS/case (Rs) 16.8 (3.1) 1.9 8.1 (2.7) 5.6 4.3 8.7 5.6 9.5
Gross profit/case (Rs) 10.5 (3.0) 15.0 14.6 1.1 6.4 5.8 5.0 (2.7) 6.0
Other costs/case (Rs) 9.3 (1.1) 11.6 17.1 6.6 7.1 9.1 (9.8) (2.7) (1.0)
Other revenues/case (Rs) 5.1 (16.2) 29.7 (2.4) 70.0 38.5 10.9 (52.9) (8.4) 8.0
EBITDA/case (Rs) 11.9 (15.8) 35.5 (1.3) 10.6 25.5 (0.7) 8.2 (4.7) 27.3

United Breweries Consumer Products
KOTAK INSTITUTIONAL EQUITIES RESEARCH 31
Exhibit 4: Return ratios back on a consistent improvement path
Source: Company, Kotak Institutional Equities
Exhibit 5: Cash flow metrics remain subdued
Source: Company, Kotak Institutional Equities
2009 2010 2011 2012 2013 2014 2015 2016 2017 2018
Fixed Assets
GFA 9,825 11,680 16,322 19,328 24,660 26,684 30,530 32,731 34,794 36,956
Goodwill/Intangibles 2,890 2,890 1,793 1,597 1,644 1,711 1,966 1,993 2,017 2,017
Total GFA incl goodwill/intangibles 12,715 14,571 18,115 20,925 26,304 28,395 32,496 34,724 36,810 38,972
CWIP 972 604 720 2,074 1,140 823 902 608 1,372 723
Capex 1,671 1,513 4,389 3,806 3,782 2,120 4,069 2,430 2,355 2,015
Asset Turn (Gross rev/ GFA) 2.7 2.8 2.7 2.9 2.5 2.6 2.5 2.9 2.9 3.3
Return ratios (%)
RoE 5.0 7.6 11.7 11.0 12.0 14.1 14.6 14.9 10.3 15.7
RoCE 8.4 6.6 13.2 12.8 12.2 14.4 15.7 17.4 13.3 22.6
RoIC 4.7 4.4 9.2 8.5 8.6 10.5 11.1 11.5 8.8 14.8
DuPont Analysis
Net Margin (%) 2.4 3.9 4.8 4.0 4.4 5.4 5.6 6.2 4.9 7.0
Asset turnover (X) 1.0 0.9 1.1 1.2 1.1 1.1 1.2 1.2 1.1 1.2
Equity Multiplier 2.2 2.0 2.1 2.3 2.4 2.4 2.2 2.1 2.0 1.8
RoE (%) 5.0 7.6 11.7 11.0 12.0 14.1 14.6 14.9 10.3 15.7
Dividend Payout (%) 18.5 11.2 12.5 17.0 12.6 12.3 12.2 12.3 15.9 16.1
Divided per share (Rs) 0.3 0.3 0.6 0.7 0.7 0.9 1.0 1.2 1.2 2.0
2009 2010 2011 2012 2013 2014 2015 2016 2017 2018
Cash flow from operations 2,269 2,264 3,498 3,840 4,214 5,054 5,028 6,169 5,419 6,898
Change in net working capital (3,233) (531) 2,213 (311) (2,692) (2,159) 3,381 (777) 22 (1,265)
Capex (including acquisitions) (1,671) (1,513) (4,389) (3,806) (3,782) (2,120) (4,069) (2,430) (2,355) (2,015)
Free cash flow (2,634) 220 1,323 (277) (2,260) 776 4,339 2,962 3,085 3,618
Cash from from investing (840) 647 503 356 (535) 544 774 (22) 19 45
Cash from from financing 3,873 (451) (1,461) 405 3,352 (2,225) (6,408) (2,931) (3,002) (3,663)
Net change in cash and equivalents 399 415 364 483 557 (905) (1,294) 9 103 (1)
Cash Balance 511 927 1,291 1,774 2,331 1,425 131 140 243 242
Marketable investments — — — — — — — — — —
Cash & Equivalents 511 927 1,291 1,774 2,331 1,425 131 140 243 242
Growth in FCF (%) (359) 108 502 121 716 134 459 (32) 4 17
FCF as % of EBITDA (127) 5 20 (3) (23) 7 32 18 16 18
FCF as % of Core PAT (152) 6 27 (5) (33) 10 49 26 24 25

Consumer Products United Breweries
32 KOTAK INSTITUTIONAL EQUITIES RESEARCH
Exhibit 6: Adverse working capital swings the key FCF drag in FY2018
Source: Company, Kotak Institutional Equities
Exhibit 7: Excise movement less adverse than usual despite GST-led stranded taxes; aided EBITDA per
case math
Source: Company, Kotak Institutional Equities
2009 2010 2011 2012 2013 2014 2015 2016 2017 2018
Working Capital
Inventory 1,788 2,204 2,898 4,007 5,136 5,441 5,591 6,881 7,508 8,080
Receivables 5,006 6,695 5,200 7,000 8,134 9,586 9,643 11,189 12,954 14,986
Loans and advances 2,740 2,772 4,117 4,371 4,346 5,310 4,171 1,628 988 635
Other current assets 1,002 1,261 2,480 1,276 122 68 49 4,990 4,217 5,269
Creditors 3,166 4,808 3,899 5,739 2,500 2,097 3,427 4,176 4,596 5,217
Other current liabilities - - 4,284 4,123 5,207 7,856 7,983 11,769 11,525 11,418
Provisions 185 257 195 269 577 671 907 507 868 907
Net Working Capital (ex-cash) 7,184 7,867 6,317 6,522 9,454 9,782 7,138 8,236 8,680 11,427
Working Capital (Days)
Inventory 9 10 9 11 13 13 12 14 16 14
Receivables 26 29 17 19 21 23 21 23 27 27
Loans and advances 14 12 13 12 11 13 9 3 2 1
Other current assets 5 6 8 4 0 0 0 10 9 9
Creditors 16 21 13 16 6 5 7 9 10 9
Other current liabilities - - 14 11 13 19 17 24 24 20
Provisions 1 1 1 1 1 2 2 1 2 2
Cash conversion cycle 19 18 14 15 28 31 25 29 34 32
Cash conversion cycle (% of sales) 18.8 18.0 13.7 14.5 27.6 30.6 25.2 28.7 33.6 31.8
Net Working Capital (ex-cash) 37 35 21 18 24 23 15 17 18 20
Net Working Capital (% of sales) 37.2 34.6 20.6 18.0 24.2 23.1 15.2 17.0 18.4 20.3
32 33 35
39 42
45 46
51
55 56
-
10
20
30
40
50
60
2009 2010 2011 2012 2013 2014 2015 2016 2017 2018
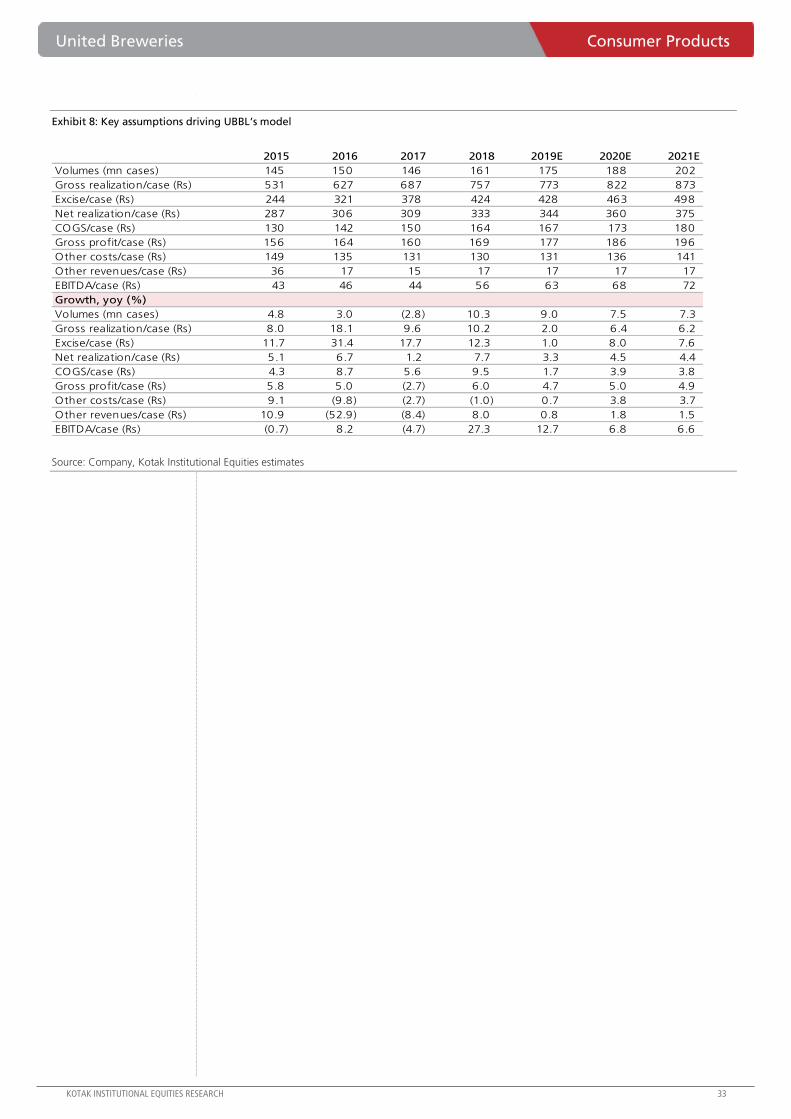
United Breweries Consumer Products
KOTAK INSTITUTIONAL EQUITIES RESEARCH 33
Exhibit 8: Key assumptions driving UBBL’s model
Source: Company, Kotak Institutional Equities estimates
2015 2016 2017 2018 2019E 2020E 2021E
Volumes (mn cases) 145 150 146 161 175 188 202
Gross realization/case (Rs) 531 627 687 757 773 822 873
Excise/case (Rs) 244 321 378 424 428 463 498
Net realization/case (Rs) 287 306 309 333 344 360 375
COGS/case (Rs) 130 142 150 164 167 173 180
Gross profit/case (Rs) 156 164 160 169 177 186 196
Other costs/case (Rs) 149 135 131 130 131 136 141
Other revenues/case (Rs) 36 17 15 17 17 17 17
EBITDA/case (Rs) 43 46 44 56 63 68 72
Growth, yoy (%)
Volumes (mn cases) 4.8 3.0 (2.8) 10.3 9.0 7.5 7.3
Gross realization/case (Rs) 8.0 18.1 9.6 10.2 2.0 6.4 6.2
Excise/case (Rs) 11.7 31.4 17.7 12.3 1.0 8.0 7.6
Net realization/case (Rs) 5.1 6.7 1.2 7.7 3.3 4.5 4.4
COGS/case (Rs) 4.3 8.7 5.6 9.5 1.7 3.9 3.8
Gross profit/case (Rs) 5.8 5.0 (2.7) 6.0 4.7 5.0 4.9
Other costs/case (Rs) 9.1 (9.8) (2.7) (1.0) 0.7 3.8 3.7
Other revenues/case (Rs) 10.9 (52.9) (8.4) 8.0 0.8 1.8 1.5
EBITDA/case (Rs) (0.7) 8.2 (4.7) 27.3 12.7 6.8 6.6

Consumer Products United Breweries
34 KOTAK INSTITUTIONAL EQUITIES RESEARCH
Exhibit 9: Summary of forecasts, March fiscal year-ends
Source: Company, Kotak Institutional Equities estimates
2015 2016 2017 2018 2019E 2020E 2021E
Profit model (Rs mn)
Net revenues 46,881 48,331 47,292 56,190 63,167 70,875 79,323
EBITDA 6,217 6,930 6,421 9,020 11,083 12,728 14,570
Other income 377 864 517 131 326 775 1,166
Interest (728) (811) (587) (477) (357) (339) (322)
Depreciation (2,075) (2,436) (2,871) (2,597) (2,533) (2,631) (2,708)
Profit before tax 3,790 4,547 3,481 6,078 8,520 10,533 12,705
Tax expense (1,184) 264 264 264 264 264 264
Exceptional items/minority int. 4 4 4 4 4 4 4
Reported PAT 2,610 4,815 3,749 6,347 8,788 10,802 12,974
Adjusted PAT 2,598 2,983 2,296 3,942 5,491 6,789 8,191
EPS (Rs/share) 9.8 11.3 8.7 14.9 20.8 25.7 31.0
Balance sheet (Rs mn)
Equity 18,506 21,471 23,342 26,903 31,757 37,528 44,350
Total borrowings 6,992 4,708 3,959 2,578 2,578 2,578 2,578
Deferred tax liability/minority interest 685 659 497 212 216 220 225
Current liabilities and provisions 12,663 16,820 16,988 17,542 19,769 22,239 24,955
Total liabilites 38,846 43,659 44,787 47,234 54,320 62,564 72,107
Net fixed assets 18,612 18,235 18,338 17,526 17,702 17,404 16,913
Investments and goodwill 648 596 537 495 628 776 939
Cash 131 140 243 242 3,970 9,032 15,289
Other current assets 19,455 24,688 25,669 28,971 32,019 35,352 38,966
Total assets 38,846 43,659 44,787 47,234 54,320 62,564 72,107
Free cash flow (Rs mn)
Operating cash 5,028 6,169 5,419 6,898 8,059 8,989 10,059
Working capital changes 3,381 (777) 22 (1,265) (821) (864) (898)
Capital expenditure (13,777) (12,401) (10,974) (10,870) (9,643) (9,693) (9,718)
Free cash flow (5,369) (7,009) (5,534) (5,237) (2,405) (1,569) (557)
Ratios
Revenue growth (%) 10.8 3.1 (2.2) 18.8 12.4 12.2 11.9
EBITDA growth (%) 4.1 11.5 (7.3) 40.5 22.9 14.8 14.5
PAT growth (%) 14.9 14.8 (23.0) 71.6 39.2 23.6 20.6
Gross margin (%) 59.6 56.1 53.9 53.2 53.8 54.0 54.2
EBITDA margin (%) 13.3 14.3 13.6 16.1 17.5 18.0 18.4
RoE (%) 14.6 14.9 10.3 15.7 18.7 19.6 20.0
RoCE (%) 15.7 17.4 13.3 22.6 26.8 27.1 27.2

For Private Circulation Only. FOR IMPORTANT INFORMATION ABOUT KOTAK SECURITIES’ RATING SYSTEM AND OTHER DISCLOSURES, REFER TO THE END OF THIS MATERIAL.
Board approves additional capex of `17 bn over FY2018-21E to expand/refurbish capacities
Balkrishna Industries has announced a capex plan of `17 bn, which will be incurred by
FY2021E. This is in addition to already envisaged capex of (1) `4 bn on a carbon black project
and (2) `2 bn of annual maintenance capex. Three key areas where the capex would be
incurred are:
Greenfield plant in US: BKT will spend `7 bn (USD100 mn) on setting up a greenfield plant
in the US with annual capacity of 20,000 tons. As per the management, this is to improve
the company’s growth prospects in the region particularly with OEMs as currently lead time
from India is high, which is impacting volume growth. We find this move a little surprising as
lower labor cost in India is the main source of competitive advantage for BKT versus global
peers leading to the company’s higher profitability and return ratios (a key driver of higher
valuation multiples). As per our calculations, post-tax RoCE of its US plant will be low due to
higher capex intensity and lower profitability (refer to Exhibit 1). We note that the US
capacity would account for only around 6% of BKT’s overall capacity and we believe that the
decision could also possibly be driven by recent developments around tariff wars globally.
Replace capacity of Waluj plant: The company plans to incur capex of `5 bn to replace its
existing production facilities in Waluj (around 30,000 tons). BKT will set up a greenfield
facility near the existing plant and transfer PPE from the older plant (almost 30 years old) and
will also set-up a co-generation power plant and warehousing facilities in the new plant.
Capacity expansion in Bhuj plant: BKT will incur capex of `5 bn to set up annual capacity
of 5,000 tons for higher-sized all steed radial OTR tires (51 and 57 inches diameter). Capex
appears to be on the higher side; as per the management, asset turnover is lower in higher-
sized tires, which is compensated by higher profitability.
Fine-tune our EPS estimates; maintain REDUCE with unchanged TP of `1,300
We have marginally cut our EPS estimates as we build in higher capex assumptions. Valuations
are expensive at 22X FY2020E EPS, which drive our REDUCE rating on the stock.
Balkrishna Industries (BIL) Automobiles
Investing in greenfield capacity in US. BKT has announced capex plans of `17 bn
over FY2018-21E to (1) set-up a greenfield plant in the US (`7 bn) and (2)
expand/refurbish capacities in India (`10 bn). We find the decision to set-up capacity in
the US a little surprising as India’s low labor cost lends BKT its main competitive edge
over global peers leading to the company’s higher profitability and return ratios. While
the currently announced capacity in the US is relatively small, if BKT adopts the strategy
of setting up more capacity overseas to gain market share, then its return ratios could
come down significantly leading to a de-rating of the stock. REDUCE stays.
REDUCE
SEPTEMBER 03, 2018
UPDATE
Coverage view: Neutral
Price (`): 1,360
Target price (`): 1,300
BSE-30: 38,645
Nishit Jalan
Hitesh Goel
Balkrishna Industries
Stock data Forecasts/Valuations 2018 2019E 2020E
52-week range (Rs) (high,low) EPS (Rs) 37.4 50.3 62.5
Market Cap. (Rs bn) EPS growth (%) 4.8 34.5 24.1
Shareholding pattern (%) P/E (X) 36.4 27.0 21.8
Promoters 58.3 Sales (Rs bn) 46.6 57.3 67.0
FIIs 17.6 Net profits (Rs bn) 7.2 9.7 12.1
MFs 10.9 EBITDA (Rs bn) 13.5 17.1 20.9
Price performance (%) 1M 3M 12M EV/EBITDA (X) 19.3 14.8 12.2
Absolute 12.6 19.9 73.5 ROE (%) 19.0 21.6 22.1
Rel. to BSE-30 9.6 9.6 42.4 Div. Yield (%) 0.4 0.4 0.5
Company data and valuation summary
1,454-776
262.9

Automobiles Balkrishna Industries
36 KOTAK INSTITUTIONAL EQUITIES RESEARCH
Exhibit 1: RoCE in US plant will be much lower compared to investments in India Comparison of incremental RoCE on new plants in US and China, (` mn)
Source: Company, Kotak Institutional Equities estimates
Exhibit 2: We have fine-tuned our FY2019-21E consolidated EPS estimates Earnings revision table, consolidated numbers, March fiscal year-ends, 2019-21E (` mn, %)
Source: Kotak Institutional Equities estimates
India
@ 15% EBITDA margin @ 20% EBITDA margin
Achievable annual capacity (MT) 20,000 20,000 20,000
Capex per ton per day (Rs mn) 122.5 122.5 85.0
Capex (Rs mn) 7,000 7,000 4,857
Working capital days 30 30 50
Working capital requirement (Rs mn) 440 440 685
Total capital employed (Rs mn) 7,440 7,440 5,542
ASP (Rs/ton) 267,500 267,500 250,000
Revenues at full utilization (Rs mn) 5,350 5,350 5,000
EBITDA margin (%) 15.0 20.0 30.0
EBITDA (Rs mn) 803 1,070 1,500
Depreciation (5% of gross block) 350 350 243
EBIT (Rs mn) 453 720 1,257
Tax rate (%) 30.0 30.0 30.0
Post-tax EBIT (Rs mn) 317 504 880
Post-tax RoCE (%) 4.3 6.8 15.9
USA
2019E 2020E 2021E 2019E 2020E 2021E 2019E 2020E 2021E
Revenues (Rs mn) 57,252 66,997 75,290 57,252 66,563 74,802 - 0.7 0.7
EBITDA (Rs mn) 17,128 20,850 23,457 17,128 20,473 22,802 - 1.8 2.9
EBITDA margin (%) 29.9 31.1 31.2 29.9 30.8 30.5
PAT (Rs mn) 9,725 12,073 13,621 9,725 12,131 13,779 - (0.5) (1.1)
EPS (Rs) 50.3 62.5 70.5 50.3 62.8 71.3 - (0.5) (1.1)
New estimates Old estimates Change (%)
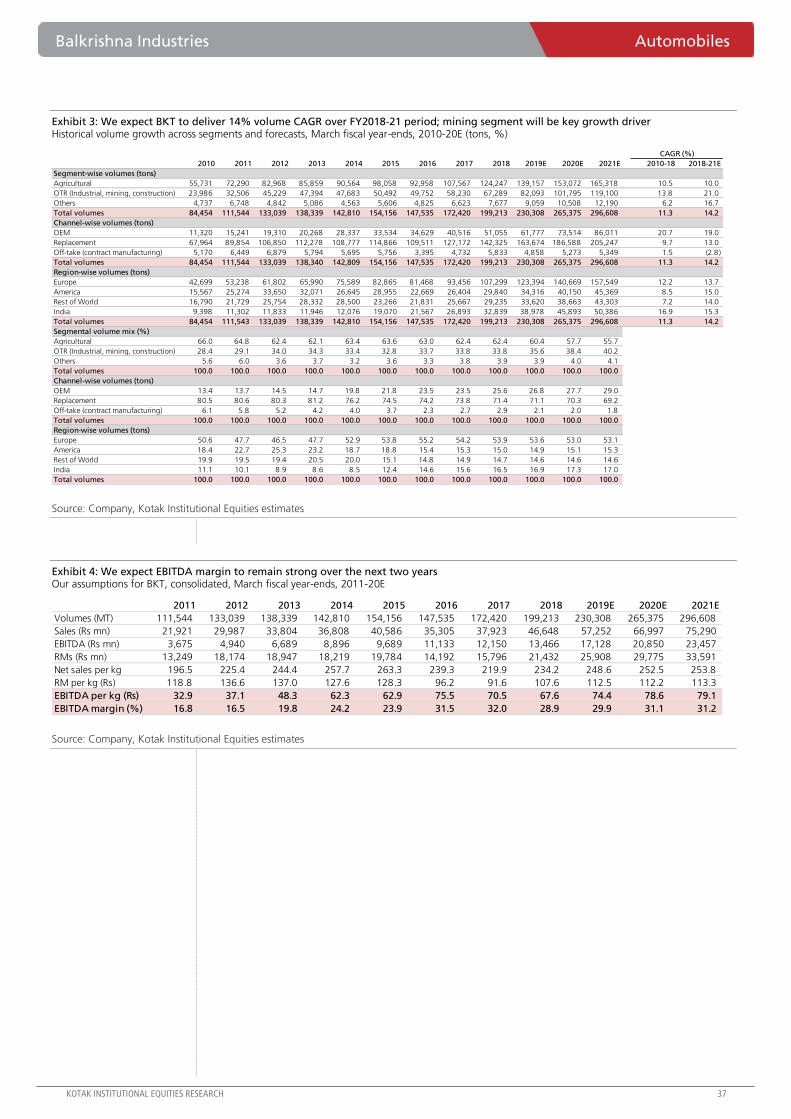
Balkrishna Industries Automobiles
KOTAK INSTITUTIONAL EQUITIES RESEARCH 37
Exhibit 3: We expect BKT to deliver 14% volume CAGR over FY2018-21 period; mining segment will be key growth driver Historical volume growth across segments and forecasts, March fiscal year-ends, 2010-20E (tons, %)
Source: Company, Kotak Institutional Equities estimates
Exhibit 4: We expect EBITDA margin to remain strong over the next two years Our assumptions for BKT, consolidated, March fiscal year-ends, 2011-20E
Source: Company, Kotak Institutional Equities estimates
2010 2011 2012 2013 2014 2015 2016 2017 2018 2019E 2020E 2021E 2010-18 2018-21E
Segment-wise volumes (tons)
Agricultural 55,731 72,290 82,968 85,859 90,564 98,058 92,958 107,567 124,247 139,157 153,072 165,318 10.5 10.0
OTR (Industrial, mining, construction) 23,986 32,506 45,229 47,394 47,683 50,492 49,752 58,230 67,289 82,093 101,795 119,100 13.8 21.0
Others 4,737 6,748 4,842 5,086 4,563 5,606 4,825 6,623 7,677 9,059 10,508 12,190 6.2 16.7
Total volumes 84,454 111,544 133,039 138,339 142,810 154,156 147,535 172,420 199,213 230,308 265,375 296,608 11.3 14.2
Channel-wise volumes (tons)
OEM 11,320 15,241 19,310 20,268 28,337 33,534 34,629 40,516 51,055 61,777 73,514 86,011 20.7 19.0
Replacement 67,964 89,854 106,850 112,278 108,777 114,866 109,511 127,172 142,325 163,674 186,588 205,247 9.7 13.0
Off-take (contract manufacturing) 5,170 6,449 6,879 5,794 5,695 5,756 3,395 4,732 5,833 4,858 5,273 5,349 1.5 (2.8)
Total volumes 84,454 111,544 133,039 138,340 142,809 154,156 147,535 172,420 199,213 230,308 265,375 296,608 11.3 14.2
Region-wise volumes (tons)
Europe 42,699 53,238 61,802 65,990 75,589 82,865 81,468 93,456 107,299 123,394 140,669 157,549 12.2 13.7
America 15,567 25,274 33,650 32,071 26,645 28,955 22,669 26,404 29,840 34,316 40,150 45,369 8.5 15.0
Rest of World 16,790 21,729 25,754 28,332 28,500 23,266 21,831 25,667 29,235 33,620 38,663 43,303 7.2 14.0
India 9,398 11,302 11,833 11,946 12,076 19,070 21,567 26,893 32,839 38,978 45,893 50,386 16.9 15.3
Total volumes 84,454 111,543 133,039 138,339 142,810 154,156 147,535 172,420 199,213 230,308 265,375 296,608 11.3 14.2
Segmental volume mix (%)
Agricultural 66.0 64.8 62.4 62.1 63.4 63.6 63.0 62.4 62.4 60.4 57.7 55.7
OTR (Industrial, mining, construction) 28.4 29.1 34.0 34.3 33.4 32.8 33.7 33.8 33.8 35.6 38.4 40.2
Others 5.6 6.0 3.6 3.7 3.2 3.6 3.3 3.8 3.9 3.9 4.0 4.1
Total volumes 100.0 100.0 100.0 100.0 100.0 100.0 100.0 100.0 100.0 100.0 100.0 100.0
Channel-wise volumes (tons)
OEM 13.4 13.7 14.5 14.7 19.8 21.8 23.5 23.5 25.6 26.8 27.7 29.0
Replacement 80.5 80.6 80.3 81.2 76.2 74.5 74.2 73.8 71.4 71.1 70.3 69.2
Off-take (contract manufacturing) 6.1 5.8 5.2 4.2 4.0 3.7 2.3 2.7 2.9 2.1 2.0 1.8
Total volumes 100.0 100.0 100.0 100.0 100.0 100.0 100.0 100.0 100.0 100.0 100.0 100.0
Region-wise volumes (tons)
Europe 50.6 47.7 46.5 47.7 52.9 53.8 55.2 54.2 53.9 53.6 53.0 53.1
America 18.4 22.7 25.3 23.2 18.7 18.8 15.4 15.3 15.0 14.9 15.1 15.3
Rest of World 19.9 19.5 19.4 20.5 20.0 15.1 14.8 14.9 14.7 14.6 14.6 14.6
India 11.1 10.1 8.9 8.6 8.5 12.4 14.6 15.6 16.5 16.9 17.3 17.0
Total volumes 100.0 100.0 100.0 100.0 100.0 100.0 100.0 100.0 100.0 100.0 100.0 100.0
CAGR (%)
2011 2012 2013 2014 2015 2016 2017 2018 2019E 2020E 2021E
Volumes (MT) 111,544 133,039 138,339 142,810 154,156 147,535 172,420 199,213 230,308 265,375 296,608
Sales (Rs mn) 21,921 29,987 33,804 36,808 40,586 35,305 37,923 46,648 57,252 66,997 75,290
EBITDA (Rs mn) 3,675 4,940 6,689 8,896 9,689 11,133 12,150 13,466 17,128 20,850 23,457
RMs (Rs mn) 13,249 18,174 18,947 18,219 19,784 14,192 15,796 21,432 25,908 29,775 33,591
Net sales per kg 196.5 225.4 244.4 257.7 263.3 239.3 219.9 234.2 248.6 252.5 253.8
RM per kg (Rs) 118.8 136.6 137.0 127.6 128.3 96.2 91.6 107.6 112.5 112.2 113.3
EBITDA per kg (Rs) 32.9 37.1 48.3 62.3 62.9 75.5 70.5 67.6 74.4 78.6 79.1
EBITDA margin (%) 16.8 16.5 19.8 24.2 23.9 31.5 32.0 28.9 29.9 31.1 31.2
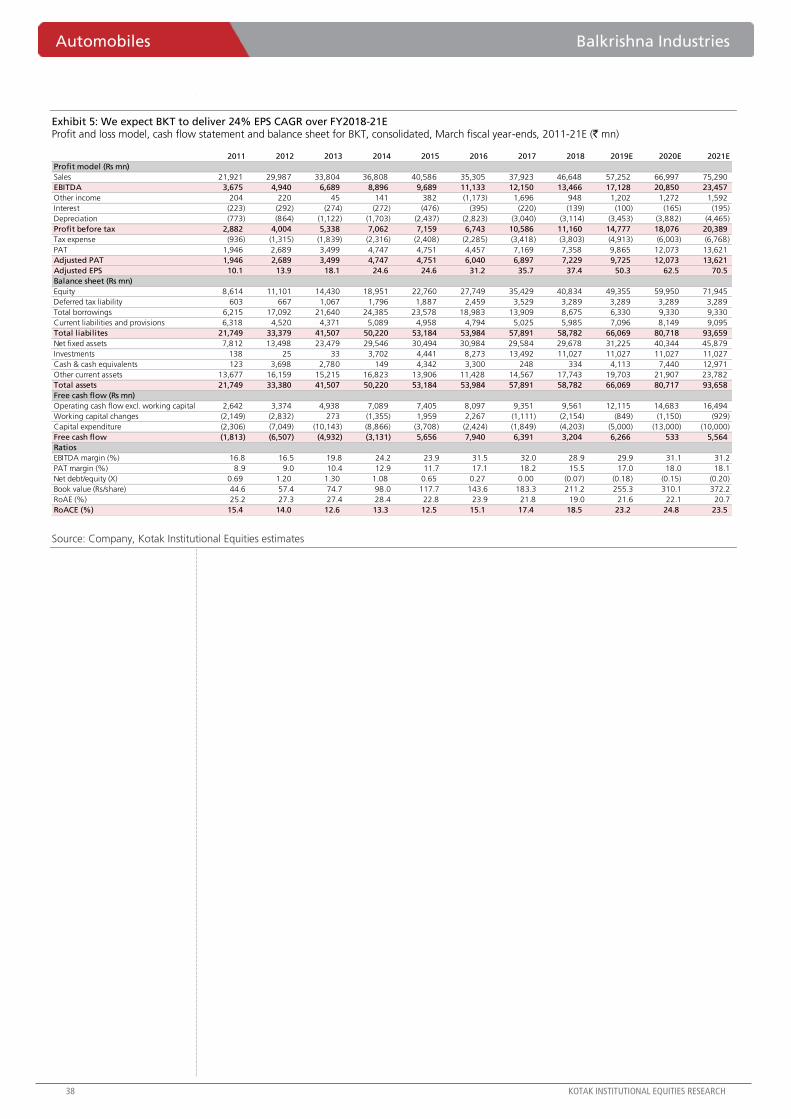
Automobiles Balkrishna Industries
38 KOTAK INSTITUTIONAL EQUITIES RESEARCH
Exhibit 5: We expect BKT to deliver 24% EPS CAGR over FY2018-21E Profit and loss model, cash flow statement and balance sheet for BKT, consolidated, March fiscal year-ends, 2011-21E (` mn)
Source: Company, Kotak Institutional Equities estimates
2011 2012 2013 2014 2015 2016 2017 2018 2019E 2020E 2021E
Profit model (Rs mn)
Sales 21,921 29,987 33,804 36,808 40,586 35,305 37,923 46,648 57,252 66,997 75,290
EBITDA 3,675 4,940 6,689 8,896 9,689 11,133 12,150 13,466 17,128 20,850 23,457
Other income 204 220 45 141 382 (1,173) 1,696 948 1,202 1,272 1,592
Interest (223) (292) (274) (272) (476) (395) (220) (139) (100) (165) (195)
Depreciation (773) (864) (1,122) (1,703) (2,437) (2,823) (3,040) (3,114) (3,453) (3,882) (4,465)
Profit before tax 2,882 4,004 5,338 7,062 7,159 6,743 10,586 11,160 14,777 18,076 20,389
Tax expense (936) (1,315) (1,839) (2,316) (2,408) (2,285) (3,418) (3,803) (4,913) (6,003) (6,768)
PAT 1,946 2,689 3,499 4,747 4,751 4,457 7,169 7,358 9,865 12,073 13,621
Adjusted PAT 1,946 2,689 3,499 4,747 4,751 6,040 6,897 7,229 9,725 12,073 13,621
Adjusted EPS 10.1 13.9 18.1 24.6 24.6 31.2 35.7 37.4 50.3 62.5 70.5
Balance sheet (Rs mn)
Equity 8,614 11,101 14,430 18,951 22,760 27,749 35,429 40,834 49,355 59,950 71,945
Deferred tax liability 603 667 1,067 1,796 1,887 2,459 3,529 3,289 3,289 3,289 3,289
Total borrowings 6,215 17,092 21,640 24,385 23,578 18,983 13,909 8,675 6,330 9,330 9,330
Current liabilities and provisions 6,318 4,520 4,371 5,089 4,958 4,794 5,025 5,985 7,096 8,149 9,095
Total liabilites 21,749 33,379 41,507 50,220 53,184 53,984 57,891 58,782 66,069 80,718 93,659
Net fixed assets 7,812 13,498 23,479 29,546 30,494 30,984 29,584 29,678 31,225 40,344 45,879
Investments 138 25 33 3,702 4,441 8,273 13,492 11,027 11,027 11,027 11,027
Cash & cash equivalents 123 3,698 2,780 149 4,342 3,300 248 334 4,113 7,440 12,971
Other current assets 13,677 16,159 15,215 16,823 13,906 11,428 14,567 17,743 19,703 21,907 23,782
Total assets 21,749 33,380 41,507 50,220 53,184 53,984 57,891 58,782 66,069 80,717 93,658
Free cash flow (Rs mn)
Operating cash flow excl. working capital 2,642 3,374 4,938 7,089 7,405 8,097 9,351 9,561 12,115 14,683 16,494
Working capital changes (2,149) (2,832) 273 (1,355) 1,959 2,267 (1,111) (2,154) (849) (1,150) (929)
Capital expenditure (2,306) (7,049) (10,143) (8,866) (3,708) (2,424) (1,849) (4,203) (5,000) (13,000) (10,000)
Free cash flow (1,813) (6,507) (4,932) (3,131) 5,656 7,940 6,391 3,204 6,266 533 5,564
Ratios
EBITDA margin (%) 16.8 16.5 19.8 24.2 23.9 31.5 32.0 28.9 29.9 31.1 31.2
PAT margin (%) 8.9 9.0 10.4 12.9 11.7 17.1 18.2 15.5 17.0 18.0 18.1
Net debt/equity (X) 0.69 1.20 1.30 1.08 0.65 0.27 0.00 (0.07) (0.18) (0.15) (0.20)
Book value (Rs/share) 44.6 57.4 74.7 98.0 117.7 143.6 183.3 211.2 255.3 310.1 372.2
RoAE (%) 25.2 27.3 27.4 28.4 22.8 23.9 21.8 19.0 21.6 22.1 20.7
RoACE (%) 15.4 14.0 12.6 13.3 12.5 15.1 17.4 18.5 23.2 24.8 23.5

For Private Circulation Only. FOR IMPORTANT INFORMATION ABOUT KOTAK SECURITIES’ RATING SYSTEM AND OTHER DISCLOSURES, REFER TO THE END OF THIS MATERIAL.
Supreme Court ban a result of non-compliance with rules framed for solid waste management
The Supreme Court has put a blanket ban on all construction activities in the state of
Maharashtra, Madhya Pradesh, Uttarakhand and the union territory of Chandigarh due to non-
compliance with the Solid Waste Management Rules put into effect by the Ministry of
Environment and Forest in April 2016.
The rules required that each state frame a policy for disposal of solid waste, and the absence of
such a policy led to the court putting a ban on any construction activity for non-compliance of
the rules. We note that issuance of commencement certificate had already been impacted due
to the lack of facilities for solid waste management. However, construction in case of sites
where CC had been issued were not impacted so far. The ban on new projects to be sanctioned
was lifted as late as March 2018. The current ban though covers all construction activity,
whether construction activity has been commenced or otherwise.
Maharashtra likely to file solid waste management policy, vacate the ban at the earliest
Media reports suggest that Maharashtra government is already working in overdrive to put
before the Supreme Court the solid waste management policy of the state that was already in
preparation but had not been submitted to the concerned authorities. The Supreme Court is
likely to next hear the case on October 9, 2018, and the state government of Maharashtra is
likely to file its plan for solid waste management while apologizing for the delay to the apex
court.
Ban on construction will likely impact real estate sector, besides ongoing infrastructure projects
Cash collections for real estate projects are linked to construction activity, and accordingly a
prolonged blanket ban on construction activity will impact players such as Oberoi, Sunteck, and
Godrej Properties among our coverage, even as the latter has a more pan-India portfolio. We
note that our coverage universe already has commencement certificates for most projects, so if
the ban were to be restricted to new projects only, the companies will likely be less impacted.
We do highlight though, that our interaction with various players in the industry as well as the
response from the government suggests that the policy for solid waste management is already
in place in Maharashtra, even though the same had not been submitted to the concerned
authorities. In our view, the government, that has large infrastructure projects at stake will likely
formalize the solid waste management policy and be able to vacate the ban on the construction
activity at the earliest. An unwanted outcome would be a prolonged ban, the likelihood of
which we see as low.
Real Estate India
Supreme Court bans all construction in three states. The absence of a state policy
on disposal of solid waste management, has led the Supreme Court of India to put a
ban on construction activity in the states of Maharashtra, Madhya Pradesh, Uttarakhand
as well as the union territory of Chandigarh. Media reports indicate that Maharashtra,
that is more pertinent from our coverage stand point, already has a policy in place, and
will work towards vacating the ban at the earliest.
NEUTRAL
SEPTEMBER 03, 2018
UPDATE
BSE-30: 38,645
Murtuza Arsiwalla
Samrat Verma

For Private Circulation Only. FOR IMPORTANT INFORMATION ABOUT KOTAK SECURITIES’ RATING SYSTEM AND OTHER DISCLOSURES, REFER TO THE END OF THIS MATERIAL.
We add Ookla’s Speedtest results to our Speed Tracker database
Our Speed Tracker 1.0 and 2.0 notes had analyzed results from three sources – (a) OpenSignal
reports, (b) TRAI’s mySpeed app results, and (c) TRAI’s city-wise independent drive tests. With
Ookla now having released the fourth edition of its India Speedtest award report, we are
adding this source to our database. We hope Ookla’s reports on India will continue to be
released at a six-monthly (or shorter) frequency.
Ookla 1QCY18 Speedtest award report; Bharti on top again, Jio’s share of tests falls
Exhibit 1 depicts the summarized results of the last three editions (1QCY17, 2QCY17, and
1QCY18) of Ookla’s Speedtest awards for India. Key takeaways -
Bharti comes out on top again with overall speed score of 10.15 Mbps in the 1QCY18
report. Vodafone is a distant second with a score of 8.31 Mbps while Jio and Idea stood 3rd
and 4th
with scores of 6.95 Mbps and 6.66 Mbps, respectively.
Ookla’s methodology is interesting and tries to capture the real-world consumer experience
aspect. Speed score is computed as a weighted average of download (90% weight) and
upload (10% weight) tri-mean speeds. Tri-mean speeds (both download and upload) are
computed as a weighted average of the respective 90th
percentile (25% weight), 50th
percentile (50%) and 10th
percentile (25%) speeds. We quite like the methodology as it (a)
places higher weight on download speeds but also captures upload experience, (b) places
higher weight on average experience and (c) gives a good sense of what the worst
experience on different networks looks like.
Bharti and Vodafone have shown consistent improvement in speed scores (overall as well as
download) through the three editions; Jio’s saw improvement from 1QCY17 to 2QCY17 but
dipped in 1QCY18 while Idea’s has seen a decline in both iterations (sharper in the latest
one). Idea’s scores are pulled up by its highest upload speeds, perhaps a function of its LTE
network still being primarily on FDD (1800) spectrum band. Note that FD-LTE has equal
bandwidth allocated for DL and UL while TDD allocates higher bandwidth to DL.
Bharti’s best (90th
percentile), average (50th
) as well as worst (10th
) speeds – (1) are all better
than the respective speeds of peers, and (2) have all seen consistent improvement. Jio’s
average and worst speeds have improved but the best speeds have seen a dip in the latest
report. Vodafone has been fairly consistent while Idea’s best/average speeds have dropped.
The most important takeaway for us from Ookla’s report was the sharp decline in Jio’s share
of total tests on the app (these tests are what are used to arrive at aggregate results). Jio’s
share for 1QCY18 stood at 45% (9.6 mn tests in absolute terms), down from as high as
71% (15.2 mn tests) in 1QCY17 and 51% (10.9 mn tests) in 2QCY17. Bharti’s share for
1QCY18 stood at 33%, materially higher than the combined 22% share for Voda-Idea.
Telecom India
Speed Tracker 3.0; interesting data points from Ookla’s latest report. Bharti has
emerged the top-ranked Indian telco on overall network speeds for the fourth
consecutive half (2QCY16-1QCY18) per Ookla’s Speedtest report. More importantly,
Jio’s share of total tests on Ookla’s app declined substantially in 1QCY18 (to 45% from
71% in 1QCY17). TRAI’s mySpeed app continues to suggest substantially higher
average speeds on Jio’s network. Results per Ookla, OpenSignal as well as TRAI’s own
city-wise independent drive tests do not concur with the mySpeed app results.
CAUTIOUS
SEPTEMBER 03, 2018
UPDATE
BSE-30: 38,645
Rohit Chordia
Aniket Sethi
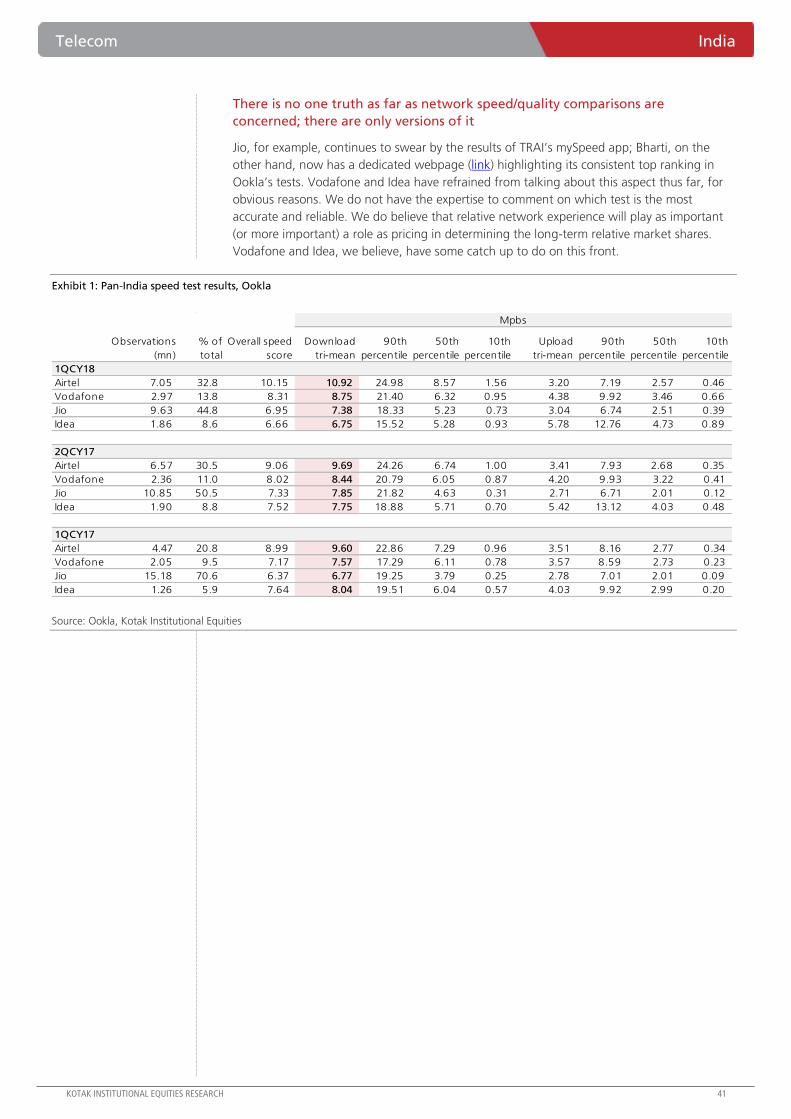
Telecom India
KOTAK INSTITUTIONAL EQUITIES RESEARCH 41
There is no one truth as far as network speed/quality comparisons are
concerned; there are only versions of it
Jio, for example, continues to swear by the results of TRAI’s mySpeed app; Bharti, on the
other hand, now has a dedicated webpage (link) highlighting its consistent top ranking in
Ookla’s tests. Vodafone and Idea have refrained from talking about this aspect thus far, for
obvious reasons. We do not have the expertise to comment on which test is the most
accurate and reliable. We do believe that relative network experience will play as important
(or more important) a role as pricing in determining the long-term relative market shares.
Vodafone and Idea, we believe, have some catch up to do on this front.
Exhibit 1: Pan-India speed test results, Ookla
Source: Ookla, Kotak Institutional Equities
Observations
(mn)
% of
total
Overall speed
score
Download
tri-mean
90th
percentile
50th
percentile
10th
percentile
Upload
tri-mean
90th
percentile
50th
percentile
10th
percentile
1QCY18
Airtel 7.05 32.8 10.15 10.92 24.98 8.57 1.56 3.20 7.19 2.57 0.46
Vodafone 2.97 13.8 8.31 8.75 21.40 6.32 0.95 4.38 9.92 3.46 0.66
Jio 9.63 44.8 6.95 7.38 18.33 5.23 0.73 3.04 6.74 2.51 0.39
Idea 1.86 8.6 6.66 6.75 15.52 5.28 0.93 5.78 12.76 4.73 0.89
2QCY17
Airtel 6.57 30.5 9.06 9.69 24.26 6.74 1.00 3.41 7.93 2.68 0.35
Vodafone 2.36 11.0 8.02 8.44 20.79 6.05 0.87 4.20 9.93 3.22 0.41
Jio 10.85 50.5 7.33 7.85 21.82 4.63 0.31 2.71 6.71 2.01 0.12
Idea 1.90 8.8 7.52 7.75 18.88 5.71 0.70 5.42 13.12 4.03 0.48
1QCY17
Airtel 4.47 20.8 8.99 9.60 22.86 7.29 0.96 3.51 8.16 2.77 0.34
Vodafone 2.05 9.5 7.17 7.57 17.29 6.11 0.78 3.57 8.59 2.73 0.23
Jio 15.18 70.6 6.37 6.77 19.25 3.79 0.25 2.78 7.01 2.01 0.09
Idea 1.26 5.9 7.64 8.04 19.51 6.04 0.57 4.03 9.92 2.99 0.20
Mpbs

India Telecom
42 KOTAK INSTITUTIONAL EQUITIES RESEARCH
Exhibit 2: TRAI's mySpeed app results
Source: TRAI, Kotak Institutional Equities
Download speeds (Mbps) Bharti Idea Jio Vodafone
Andhra Pradesh 11.8 3.6 20.7
Assam 12.2 17.6 10.5 6.7
Bihar 6.3 6.9 33.1
Chennai 9.3 8.7 8.6 12.0
Delhi 11.5 9.9 7.3
Gujarat 6.5 10.0 21.0 8.8
Haryana 13.2 6.9 24.5 6.8
Himachal Pradesh 10.6 4.4 25.4
Jammu & Kashmir 11.8 6.9 8.8
Karnataka 8.2 4.7 18.0 5.0
Kerala 11.3 6.1 12.4 7.5
Kolkata 9.5 16.3 8.8
Madhya Pradesh 12.5 7.1 26.0
Maharashtra 10.4 6.1 17.4 9.1
Mumbai 10.2 5.2 9.5 7.0
North East 6.8 4.0 5.0 4.7
Orissa 12.5 7.0 15.6 12.2
Punjab 11.6 6.9 21.6 5.2
Rajasthan 10.5 5.3 23.6 5.2
Tamil Nadu 9.1 8.9 11.0 9.3
UP East 4.9 4.0 16.9 3.9
UP West 5.0 6.3 21.2 3.5
West Bengal 6.6 10.4 19.3 7.2
Pan-India (past six months) 9.2 6.7 18.8 7.0
Pan-India - current month 9.7 6.2 19.9 6.4

Telecom India
KOTAK INSTITUTIONAL EQUITIES RESEARCH 43
Exhibit 3: Pan-India results, OpenSignal
Source: OpenSignal, Kotak Institutional Equities
Apr-18
8.4 bn measurements,
736,571 devices, Dec
2017-Feb 2018 Availability (%)
Average download
speed (Mbps) Latency (ms)
Bharti 66.81 9.31 70.31
Vodafone 68.83 6.98 66.44
Idea 68.15 7.27 72.58
Reliance Jio 96.41 5.13 79.31
Oct-17
7.4 bn measurements,
708,504 devices, Jun
2017-Aug 2017 Availability (%)
Average download
speed (Mbps) Latency (ms)
Bharti 57.16 9.15 62.98
Vodafone 61.72 7.45 60.71
Idea 63.60 7.40 73.30
Reliance Jio 95.59 5.81 75.40
Apr-17
1.3 bn measurements,
93,464 devices, Dec
2016-Feb 2017 Availability (%)
Average download
speed (Mbps) Latency (ms)
Bharti 54.72 11.53 63.86
Vodafone 59.05 8.59 54.27
Idea 59.49 8.34 61.34
Reliance Jio 91.57 3.92 86.61
Notes:
(1) Availability: higher the better, speed: higher the better, latency: lower the better.
(2) NA: respective network not available.
4G
4G
4G
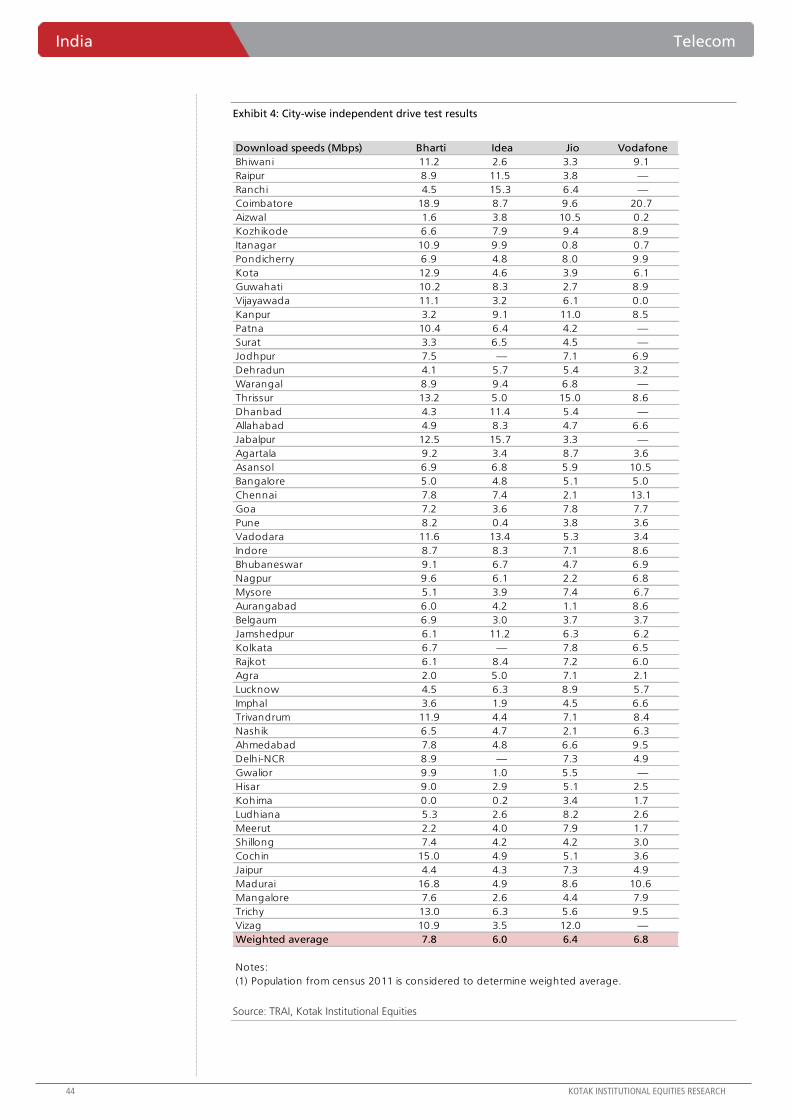
India Telecom
44 KOTAK INSTITUTIONAL EQUITIES RESEARCH
Exhibit 4: City-wise independent drive test results
Source: TRAI, Kotak Institutional Equities
Download speeds (Mbps) Bharti Idea Jio Vodafone
Bhiwani 11.2 2.6 3.3 9.1
Raipur 8.9 11.5 3.8 —
Ranchi 4.5 15.3 6.4 —
Coimbatore 18.9 8.7 9.6 20.7
Aizwal 1.6 3.8 10.5 0.2
Kozhikode 6.6 7.9 9.4 8.9
Itanagar 10.9 9.9 0.8 0.7
Pondicherry 6.9 4.8 8.0 9.9
Kota 12.9 4.6 3.9 6.1
Guwahati 10.2 8.3 2.7 8.9
Vijayawada 11.1 3.2 6.1 0.0
Kanpur 3.2 9.1 11.0 8.5
Patna 10.4 6.4 4.2 —
Surat 3.3 6.5 4.5 —
Jodhpur 7.5 — 7.1 6.9
Dehradun 4.1 5.7 5.4 3.2
Warangal 8.9 9.4 6.8 —
Thrissur 13.2 5.0 15.0 8.6
Dhanbad 4.3 11.4 5.4 —
Allahabad 4.9 8.3 4.7 6.6
Jabalpur 12.5 15.7 3.3 —
Agartala 9.2 3.4 8.7 3.6
Asansol 6.9 6.8 5.9 10.5
Bangalore 5.0 4.8 5.1 5.0
Chennai 7.8 7.4 2.1 13.1
Goa 7.2 3.6 7.8 7.7
Pune 8.2 0.4 3.8 3.6
Vadodara 11.6 13.4 5.3 3.4
Indore 8.7 8.3 7.1 8.6
Bhubaneswar 9.1 6.7 4.7 6.9
Nagpur 9.6 6.1 2.2 6.8
Mysore 5.1 3.9 7.4 6.7
Aurangabad 6.0 4.2 1.1 8.6
Belgaum 6.9 3.0 3.7 3.7
Jamshedpur 6.1 11.2 6.3 6.2
Kolkata 6.7 — 7.8 6.5
Rajkot 6.1 8.4 7.2 6.0
Agra 2.0 5.0 7.1 2.1
Lucknow 4.5 6.3 8.9 5.7
Imphal 3.6 1.9 4.5 6.6
Trivandrum 11.9 4.4 7.1 8.4
Nashik 6.5 4.7 2.1 6.3
Ahmedabad 7.8 4.8 6.6 9.5
Delhi-NCR 8.9 — 7.3 4.9
Gwalior 9.9 1.0 5.5 —
Hisar 9.0 2.9 5.1 2.5
Kohima 0.0 0.2 3.4 1.7
Ludhiana 5.3 2.6 8.2 2.6
Meerut 2.2 4.0 7.9 1.7
Shillong 7.4 4.2 4.2 3.0
Cochin 15.0 4.9 5.1 3.6
Jaipur 4.4 4.3 7.3 4.9
Madurai 16.8 4.9 8.6 10.6
Mangalore 7.6 2.6 4.4 7.9
Trichy 13.0 6.3 5.6 9.5
Vizag 10.9 3.5 12.0 —
Weighted average 7.8 6.0 6.4 6.8
Notes:
(1) Population from census 2011 is considered to determine weighted average.

For Private Circulation Only.
Base effect and pickup in momentum push up GDP growth from the trough
Real GDP growth accelerated to 8.2% (Kotak: 7.6%) in 1QFY19 compared to 7.7% in 4QFY18
led by a strong favorable base effect and also pickup in a sequential momentum. Nominal GDP
growth improved sharply to 13.8% from 10.9% in 4QFY18. Real GVA growth picked up to 8%
from 7.6% in 4QFY18 largely led by pickup in agriculture (5.3% from 4.5% in 4QFY18) and
industrial growth (10.2% from 8.8% in 4QFY18). Within industry, manufacturing (13.5% from
9.1% in 4QFY18) and construction (8.7% from 11.5% in 4QFY18) were the key contributors.
The sharp pickup in agriculture sector output was largely led by 8.1% growth in livestock
products, forestry and fisheries (accounts for 44.9% of agriculture sector GVA). Meanwhile, the
service sector growth moderated to 7.3% from 7.7% in 4QFY19 (Exhibit 1).
Private consumption, investments and exports drive up 1QFY19 GDP growth
On the demand side, private consumption surged to the highest growth in six quarters at 8.6%,
mirroring the trends in the high frequency data like production of consumer durables, personal
loans and robust consumer sector corporate earnings even as rural wages remained subdued.
Tracking the strong growth in IIP capital goods (production growth of cement, CVs, etc.), the
gross fixed capital formation (GFCF) continued to grow in double digit at 10% (Exhibit 2).
Exports growth surged 12.7% (highest growth in four years) while imports growth remained
firm at 12.5%. Meanwhile, government consumption growth moderated to 7.6% (Exhibit 3).
Gradual recovery underway; 2HFY19 growth may moderate
Robust 1QFY19 GDP affirms that the cyclical recovery of the economy is underway. While the
momentum is likely to continue (although at a slower pace) in 2QFY19, the 2HFY19 GDP
growth is expected to moderate amid (1) fading favorable base effect, (2) tighter financial
conditions, (3) limited space for government spending growth, (4) deleveraging by corporates
and banks, (5) adverse oil-related terms of trade and (6) worsening global growth prospects. On
the positive side, the ongoing gradual improvement in private investment, capacity utilization
along with firm rural demand amid assurance of adequate procurement and support prices are
expected to provide support to growth. We expect 2HFY19 GDP growth to moderate to around
7% after 7.8% in 1HFY19 (7.1% GVA growth and 7.3% GDP growth in FY2019). While the
growth-inflation dynamics may have given the comfort to the MPC to be on hold through rest
of FY2019, the recent EM currency meltdown and a sustained INR depreciation have increased
the probability of a rate hike. If the current pace of depreciation in INR continues through the
next couple of weeks, we do not rule out a 25 bps rate hike by October.
Economy National Accounts
Economic recovery underway but risks abound. Acceleration in 1QFY19 growth
was led not only by favorable base effect arising from a weak 1QFY18 ahead of the
GST implementation but also sequential momentum suggesting some narrowing of
supply-side constraints. We maintain our FY2019 GDP growth estimate at 7.3%, up
from 6.7% in FY2018, on the back of robust government spending, rural demand and
cyclical recovery in the industrial sector. However, we expect growth to moderate in
2HFY19 amid elevated crude oil prices, sharp INR weakness and tighter financial market
conditions amid adverse global conditions. If the recent weakness in INR was to
continue, we do not rule out an October rate hike even as the next few inflation
readings will remain comfortably around 4%.
INDIA
SEPTEMBER 3, 2018
UPDATE
BSE-30: 38,645
QUICK NUMBERS
1QFY19 GDP growth
at 8.2%; GVA
growth at 8%
Industry grows
10.2%; services
grows 7.3%
GFCF growth at
10%; private
consumption
growth at 8.6%
We expect FY2019
GVA at 7.1%; GDP
at 7.3%
Upasna Bhardwaj
Suvodeep Rakshit
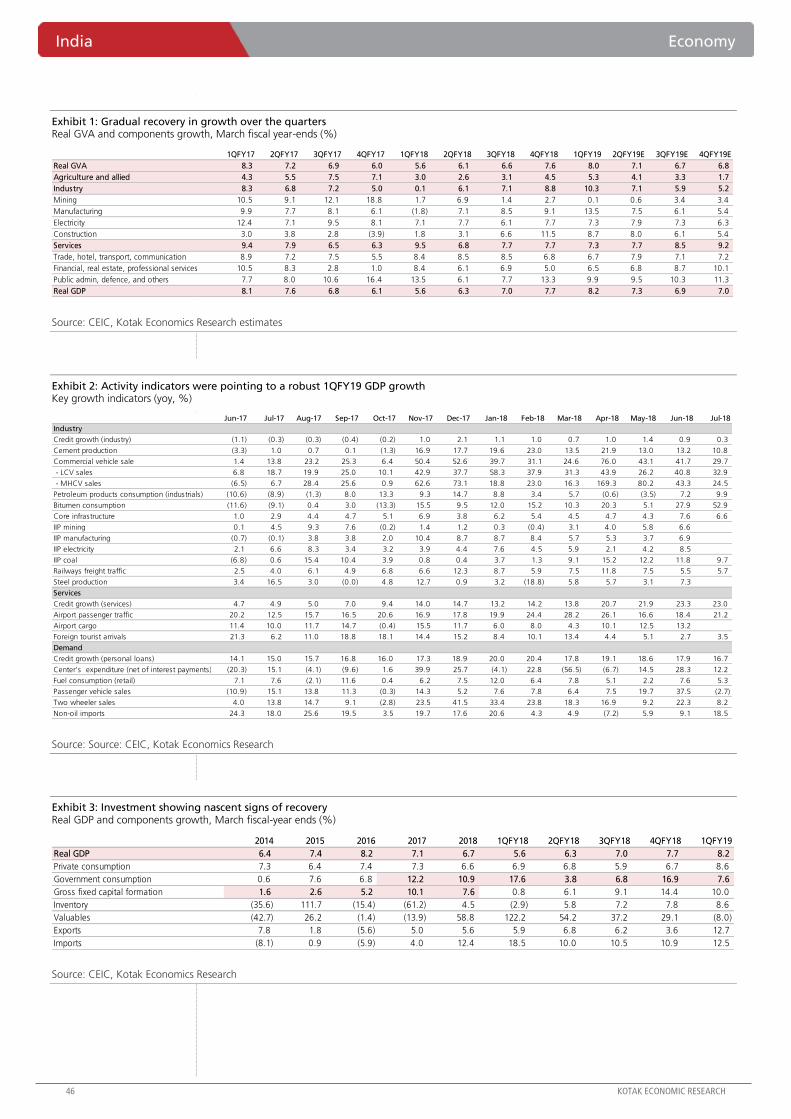
India Economy
46 KOTAK ECONOMIC RESEARCH
Exhibit 1: Gradual recovery in growth over the quarters Real GVA and components growth, March fiscal year-ends (%)
Source: CEIC, Kotak Economics Research estimates
Exhibit 2: Activity indicators were pointing to a robust 1QFY19 GDP growth Key growth indicators (yoy, %)
Source: Source: CEIC, Kotak Economics Research
Exhibit 3: Investment showing nascent signs of recovery Real GDP and components growth, March fiscal-year ends (%)
Source: CEIC, Kotak Economics Research
1QFY17 2QFY17 3QFY17 4QFY17 1QFY18 2QFY18 3QFY18 4QFY18 1QFY19 2QFY19E 3QFY19E 4QFY19E
Real GVA 8.3 7.2 6.9 6.0 5.6 6.1 6.6 7.6 8.0 7.1 6.7 6.8
Agriculture and allied 4.3 5.5 7.5 7.1 3.0 2.6 3.1 4.5 5.3 4.1 3.3 1.7
Industry 8.3 6.8 7.2 5.0 0.1 6.1 7.1 8.8 10.3 7.1 5.9 5.2
Mining 10.5 9.1 12.1 18.8 1.7 6.9 1.4 2.7 0.1 0.6 3.4 3.4
Manufacturing 9.9 7.7 8.1 6.1 (1.8) 7.1 8.5 9.1 13.5 7.5 6.1 5.4
Electricity 12.4 7.1 9.5 8.1 7.1 7.7 6.1 7.7 7.3 7.9 7.3 6.3
Construction 3.0 3.8 2.8 (3.9) 1.8 3.1 6.6 11.5 8.7 8.0 6.1 5.4
Services 9.4 7.9 6.5 6.3 9.5 6.8 7.7 7.7 7.3 7.7 8.5 9.2
Trade, hotel, transport, communication 8.9 7.2 7.5 5.5 8.4 8.5 8.5 6.8 6.7 7.9 7.1 7.2
Financial, real estate, professional services 10.5 8.3 2.8 1.0 8.4 6.1 6.9 5.0 6.5 6.8 8.7 10.1
Public admin, defence, and others 7.7 8.0 10.6 16.4 13.5 6.1 7.7 13.3 9.9 9.5 10.3 11.3
Real GDP 8.1 7.6 6.8 6.1 5.6 6.3 7.0 7.7 8.2 7.3 6.9 7.0
Jun-17 Jul-17 Aug-17 Sep-17 Oct-17 Nov-17 Dec-17 Jan-18 Feb-18 Mar-18 Apr-18 May-18 Jun-18 Jul-18
Industry
Credit growth (industry) (1.1) (0.3) (0.3) (0.4) (0.2) 1.0 2.1 1.1 1.0 0.7 1.0 1.4 0.9 0.3
Cement production (3.3) 1.0 0.7 0.1 (1.3) 16.9 17.7 19.6 23.0 13.5 21.9 13.0 13.2 10.8
Commercial vehicle sale 1.4 13.8 23.2 25.3 6.4 50.4 52.6 39.7 31.1 24.6 76.0 43.1 41.7 29.7
- LCV sales 6.8 18.7 19.9 25.0 10.1 42.9 37.7 58.3 37.9 31.3 43.9 26.2 40.8 32.9
- MHCV sales (6.5) 6.7 28.4 25.6 0.9 62.6 73.1 18.8 23.0 16.3 169.3 80.2 43.3 24.5
Petroleum products consumption (industrials) (10.6) (8.9) (1.3) 8.0 13.3 9.3 14.7 8.8 3.4 5.7 (0.6) (3.5) 7.2 9.9
Bitumen consumption (11.6) (9.1) 0.4 3.0 (13.3) 15.5 9.5 12.0 15.2 10.3 20.3 5.1 27.9 52.9
Core infrastructure 1.0 2.9 4.4 4.7 5.1 6.9 3.8 6.2 5.4 4.5 4.7 4.3 7.6 6.6
IIP mining 0.1 4.5 9.3 7.6 (0.2) 1.4 1.2 0.3 (0.4) 3.1 4.0 5.8 6.6
IIP manufacturing (0.7) (0.1) 3.8 3.8 2.0 10.4 8.7 8.7 8.4 5.7 5.3 3.7 6.9
IIP electricity 2.1 6.6 8.3 3.4 3.2 3.9 4.4 7.6 4.5 5.9 2.1 4.2 8.5
IIP coal (6.8) 0.6 15.4 10.4 3.9 0.8 0.4 3.7 1.3 9.1 15.2 12.2 11.8 9.7
Railways freight traffic 2.5 4.0 6.1 4.9 6.8 6.6 12.3 8.7 5.9 7.5 11.8 7.5 5.5 5.7
Steel production 3.4 16.5 3.0 (0.0) 4.8 12.7 0.9 3.2 (18.8) 5.8 5.7 3.1 7.3
Services
Credit growth (services) 4.7 4.9 5.0 7.0 9.4 14.0 14.7 13.2 14.2 13.8 20.7 21.9 23.3 23.0
Airport passenger traffic 20.2 12.5 15.7 16.5 20.6 16.9 17.8 19.9 24.4 28.2 26.1 16.6 18.4 21.2
Airport cargo 11.4 10.0 11.7 14.7 (0.4) 15.5 11.7 6.0 8.0 4.3 10.1 12.5 13.2
Foreign tourist arrivals 21.3 6.2 11.0 18.8 18.1 14.4 15.2 8.4 10.1 13.4 4.4 5.1 2.7 3.5
Demand
Credit growth (personal loans) 14.1 15.0 15.7 16.8 16.0 17.3 18.9 20.0 20.4 17.8 19.1 18.6 17.9 16.7
Center's expenditure (net of interest payments) (20.3) 15.1 (4.1) (9.6) 1.6 39.9 25.7 (4.1) 22.8 (56.5) (6.7) 14.5 28.3 12.2
Fuel consumption (retail) 7.1 7.6 (2.1) 11.6 0.4 6.2 7.5 12.0 6.4 7.8 5.1 2.2 7.6 5.3
Passenger vehicle sales (10.9) 15.1 13.8 11.3 (0.3) 14.3 5.2 7.6 7.8 6.4 7.5 19.7 37.5 (2.7)
Two wheeler sales 4.0 13.8 14.7 9.1 (2.8) 23.5 41.5 33.4 23.8 18.3 16.9 9.2 22.3 8.2
Non-oil imports 24.3 18.0 25.6 19.5 3.5 19.7 17.6 20.6 4.3 4.9 (7.2) 5.9 9.1 18.5
2014 2015 2016 2017 2018 1QFY18 2QFY18 3QFY18 4QFY18 1QFY19
Real GDP 6.4 7.4 8.2 7.1 6.7 5.6 6.3 7.0 7.7 8.2
Private consumption 7.3 6.4 7.4 7.3 6.6 6.9 6.8 5.9 6.7 8.6
Government consumption 0.6 7.6 6.8 12.2 10.9 17.6 3.8 6.8 16.9 7.6
Gross fixed capital formation 1.6 2.6 5.2 10.1 7.6 0.8 6.1 9.1 14.4 10.0
Inventory (35.6) 111.7 (15.4) (61.2) 4.5 (2.9) 5.8 7.2 7.8 8.6
Valuables (42.7) 26.2 (1.4) (13.9) 58.8 122.2 54.2 37.2 29.1 (8.0)
Exports 7.8 1.8 (5.6) 5.0 5.6 5.9 6.8 6.2 3.6 12.7
Imports (8.1) 0.9 (5.9) 4.0 12.4 18.5 10.0 10.5 10.9 12.5

Economy India
KOTAK ECONOMIC RESEARCH 47
Exhibit 4: We expect a cyclical recovery in FY2019 Real GVA and components growth, March fiscal-year ends, 2014-19E (%)
Source: CEIC, Kotak Economics Research estimates
2014 2015 2016 2017 2018 2019E
Real GVA 6.1 7.2 8.1 7.1 6.5 7.1
Agriculture and allied 5.6 (0.2) 0.6 6.3 3.4 3.5
Industry 3.8 7.0 9.8 6.8 5.5 7.1
Mining 0.2 9.7 13.8 13.0 2.9 2.0
Manufacturing 5.0 7.9 12.8 7.9 5.7 8.0
Electricity 4.2 7.2 4.7 9.2 7.2 7.2
Construction 2.7 4.3 3.7 1.3 5.7 7.0
Services 7.7 9.8 9.6 7.5 7.9 8.2
Trade, hotel, transport, communication 6.5 9.4 10.3 7.2 8.0 7.2
Financial, real estate, professional services 11.2 11.0 10.9 6.0 6.6 7.8
Public admin, defence, and others 3.8 8.3 6.1 10.7 10.0 10.3
Non-agriculture GVA 6.2 8.7 9.6 7.2 7.0 7.8
Real GDP 6.4 7.4 8.2 7.1 6.7 7.3
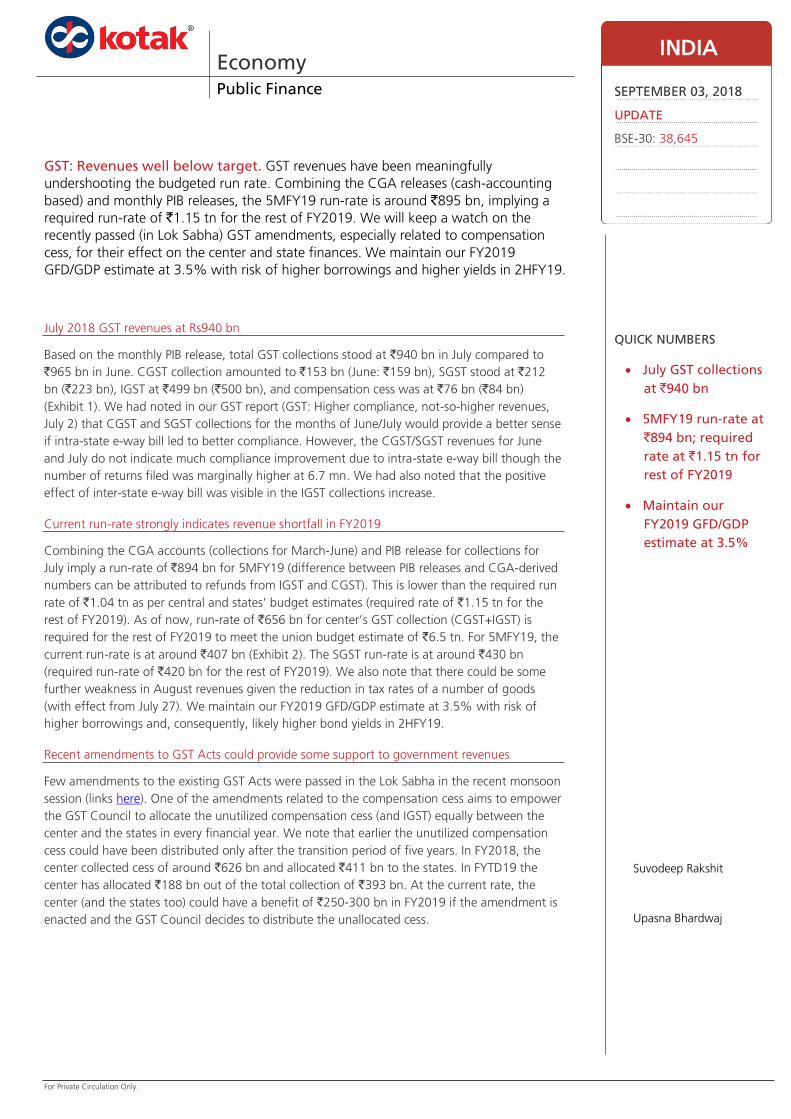
For Private Circulation Only.
July 2018 GST revenues at Rs940 bn
Based on the monthly PIB release, total GST collections stood at `940 bn in July compared to
`965 bn in June. CGST collection amounted to `153 bn (June: `159 bn), SGST stood at `212
bn (`223 bn), IGST at `499 bn (`500 bn), and compensation cess was at `76 bn (`84 bn)
(Exhibit 1). We had noted in our GST report (GST: Higher compliance, not-so-higher revenues,
July 2) that CGST and SGST collections for the months of June/July would provide a better sense
if intra-state e-way bill led to better compliance. However, the CGST/SGST revenues for June
and July do not indicate much compliance improvement due to intra-state e-way bill though the
number of returns filed was marginally higher at 6.7 mn. We had also noted that the positive
effect of inter-state e-way bill was visible in the IGST collections increase.
Current run-rate strongly indicates revenue shortfall in FY2019
Combining the CGA accounts (collections for March-June) and PIB release for collections for
July imply a run-rate of `894 bn for 5MFY19 (difference between PIB releases and CGA-derived
numbers can be attributed to refunds from IGST and CGST). This is lower than the required run
rate of `1.04 tn as per central and states’ budget estimates (required rate of `1.15 tn for the
rest of FY2019). As of now, run-rate of `656 bn for center’s GST collection (CGST+IGST) is
required for the rest of FY2019 to meet the union budget estimate of `6.5 tn. For 5MFY19, the
current run-rate is at around `407 bn (Exhibit 2). The SGST run-rate is at around `430 bn
(required run-rate of `420 bn for the rest of FY2019). We also note that there could be some
further weakness in August revenues given the reduction in tax rates of a number of goods
(with effect from July 27). We maintain our FY2019 GFD/GDP estimate at 3.5% with risk of
higher borrowings and, consequently, likely higher bond yields in 2HFY19.
Recent amendments to GST Acts could provide some support to government revenues
Few amendments to the existing GST Acts were passed in the Lok Sabha in the recent monsoon
session (links here). One of the amendments related to the compensation cess aims to empower
the GST Council to allocate the unutilized compensation cess (and IGST) equally between the
center and the states in every financial year. We note that earlier the unutilized compensation
cess could have been distributed only after the transition period of five years. In FY2018, the
center collected cess of around `626 bn and allocated `411 bn to the states. In FYTD19 the
center has allocated `188 bn out of the total collection of `393 bn. At the current rate, the
center (and the states too) could have a benefit of `250-300 bn in FY2019 if the amendment is
enacted and the GST Council decides to distribute the unallocated cess.
Economy Public Finance
GST: Revenues well below target. GST revenues have been meaningfully
undershooting the budgeted run rate. Combining the CGA releases (cash-accounting
based) and monthly PIB releases, the 5MFY19 run-rate is around `895 bn, implying a
required run-rate of `1.15 tn for the rest of FY2019. We will keep a watch on the
recently passed (in Lok Sabha) GST amendments, especially related to compensation
cess, for their effect on the center and state finances. We maintain our FY2019
GFD/GDP estimate at 3.5% with risk of higher borrowings and higher yields in 2HFY19.
INDIA
SEPTEMBER 03, 2018
UPDATE
BSE-30: 38,645
QUICK NUMBERS
July GST collections
at `940 bn
5MFY19 run-rate at
`894 bn; required
rate at `1.15 tn for
rest of FY2019
Maintain our
FY2019 GFD/GDP
estimate at 3.5%
Suvodeep Rakshit
Upasna Bhardwaj
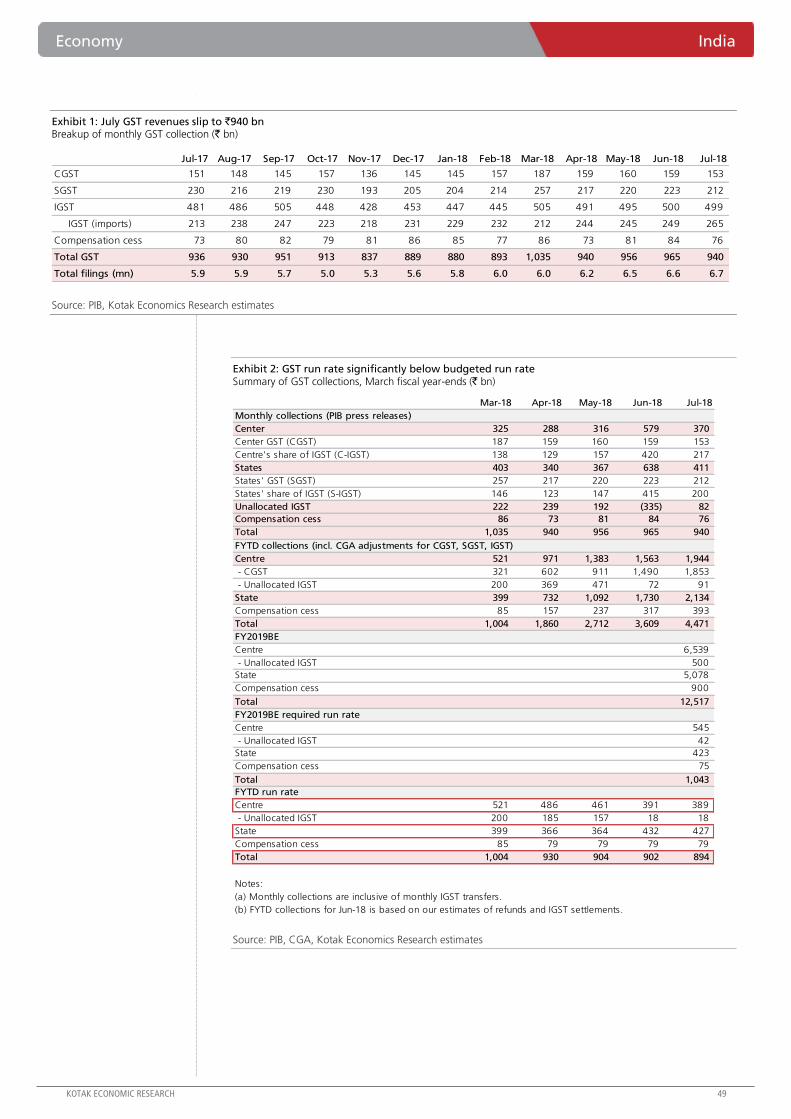
Economy India
KOTAK ECONOMIC RESEARCH 49
Exhibit 1: July GST revenues slip to `940 bn Breakup of monthly GST collection (` bn)
Source: PIB, Kotak Economics Research estimates
Exhibit 2: GST run rate significantly below budgeted run rate Summary of GST collections, March fiscal year-ends (` bn)
Source: PIB, CGA, Kotak Economics Research estimates
Jul-17 Aug-17 Sep-17 Oct-17 Nov-17 Dec-17 Jan-18 Feb-18 Mar-18 Apr-18 May-18 Jun-18 Jul-18
CGST 151 148 145 157 136 145 145 157 187 159 160 159 153
SGST 230 216 219 230 193 205 204 214 257 217 220 223 212
IGST 481 486 505 448 428 453 447 445 505 491 495 500 499
IGST (imports) 213 238 247 223 218 231 229 232 212 244 245 249 265
Compensation cess 73 80 82 79 81 86 85 77 86 73 81 84 76
Total GST 936 930 951 913 837 889 880 893 1,035 940 956 965 940
Total filings (mn) 5.9 5.9 5.7 5.0 5.3 5.6 5.8 6.0 6.0 6.2 6.5 6.6 6.7
Mar-18 Apr-18 May-18 Jun-18 Jul-18
Monthly collections (PIB press releases)
Center 325 288 316 579 370
Center GST (CGST) 187 159 160 159 153
Centre's share of IGST (C-IGST) 138 129 157 420 217
States 403 340 367 638 411
States' GST (SGST) 257 217 220 223 212
States' share of IGST (S-IGST) 146 123 147 415 200
Unallocated IGST 222 239 192 (335) 82
Compensation cess 86 73 81 84 76
Total 1,035 940 956 965 940
FYTD collections (incl. CGA adjustments for CGST, SGST, IGST)
Centre 521 971 1,383 1,563 1,944
- CGST 321 602 911 1,490 1,853
- Unallocated IGST 200 369 471 72 91
State 399 732 1,092 1,730 2,134
Compensation cess 85 157 237 317 393
Total 1,004 1,860 2,712 3,609 4,471
FY2019BE
Centre 6,539
- Unallocated IGST 500
State 5,078
Compensation cess 900
Total 12,517
FY2019BE required run rate
Centre 545
- Unallocated IGST 42
State 423
Compensation cess 75
Total 1,043
FYTD run rate
Centre 521 486 461 391 389
- Unallocated IGST 200 185 157 18 18
State 399 366 364 432 427
Compensation cess 85 79 79 79 79
Total 1,004 930 904 902 894
Notes:
(a) Monthly collections are inclusive of monthly IGST transfers.
(b) FYTD collections for Jun-18 is based on our estimates of refunds and IGST settlements.

50 KOTAK ECONOMIC RESEARCH
KO
TA
K IN
STIT
UTIO
NA
L EQ
UIT
IES R
ESEA
RC
H
50
Ind
ia D
aily
Su
mm
ary
- Se
pte
mb
er 3
, 201
8
Kotak Institutional Equities: Valuation summary of KIE Universe stocks
.
Source: Company, Bloomberg, Kotak Institutional Equities estimates
Target O/S ADVT
Price (Rs) price Upside Mkt cap. shares EPS (Rs) EPS growth (%) P/E (X) EV/EBITDA (X) 3mo
Company Rating 31-Aug-18 (Rs) (%) (Rs bn) (US$ bn) (mn) 2019E 2020E 2021E 2019E 2020E 2021E 2019E 2020E 2021E 2019E 2020E 2021E 2019E 2020E 2021E 2019E 2020E 2021E 2019E 2020E 2021E (US$ mn)
Automobiles
Amara Raja Batteries REDUCE 846 780 (7.8) 144 2.0 171 32 37 43 17.1 15.9 14.5 26.2 22.6 19.7 13.9 11.9 10.3 4.3 3.7 3.2 17.4 17.5 17.4 0.6 0.7 0.8 5.6
Apollo Tyres BUY 251 340 35.2 144 2.0 541 20 25 29 46.9 25.7 17.0 12.8 10.2 8.7 7.8 6.6 5.4 1.3 1.2 1.1 11.0 12.5 13.1 1.2 1.2 1.2 11.7
Ashok Leyland BUY 129 160 24.0 379 5.3 2,926 6.2 8.9 9.4 15.3 43.2 6.1 20.8 14.5 13.7 10.7 7.7 7.3 4.5 3.8 3.2 23.4 28.4 25.4 1.4 2.1 2.2 45.4
Bajaj Auto SELL 2,745 2,500 (8.9) 794 11.2 289 148 161 176 5.4 9.0 9.3 18.6 17.0 15.6 12.8 11.4 10.1 3.7 3.3 3.0 21.2 20.7 20.3 2.2 2.3 2.6 31.8
Balkrishna Industries REDUCE 1,360 1,300 (4.4) 263 3.7 193 50 62 70 34.5 24.1 12.8 27.0 21.8 19.3 14.8 12.2 10.6 5.3 4.4 3.7 21.6 22.1 20.7 0.4 0.5 0.5 11.1
Bharat Forge SELL 679 600 (11.6) 316 4.5 466 23 27 29 44.4 14.6 7.1 29.0 25.3 23.7 16.4 14.3 13.3 5.8 4.9 4.3 21.5 21.0 19.4 0.7 0.8 0.9 11.2
CEAT ADD 1,386 1,500 8.2 56 0.8 40 99 108 116 53.7 8.3 7.9 13.9 12.9 11.9 8.9 7.6 6.9 1.9 1.7 1.5 14.4 13.8 13.2 0.7 0.7 0.8 13.2
Eicher Motors SELL 28,022 24,000 (14.4) 764 10.8 27 997 1,180 1,306 25.8 18.4 10.7 28.1 23.7 21.4 20.3 17.1 14.8 10.3 7.7 6.0 42.4 37.1 31.4 0.1 0.1 — 20.2
Escorts BUY 869 1,200 38.1 74 1.5 89 59 71 78 52.2 19.9 10.6 14.7 12.3 11.1 9.1 7.5 6.3 2.6 2.2 1.9 17.6 18.0 17.1 1.0 1.2 1.4 14.6
Exide Industries SELL 285 235 (17.6) 242 3.4 850 10 11 13 25.3 11.0 11.6 27.7 25.0 22.4 15.8 14.1 12.6 4.1 3.7 3.3 15.4 15.5 15.7 1.1 1.2 1.4 8.4
Hero Motocorp SELL 3,254 3,000 (7.8) 650 9.2 200 183 204 225 (0.9) 11.4 10.2 17.7 15.9 14.4 10.6 9.3 8.2 4.9 4.4 3.9 29.3 29.1 28.6 2.8 3.1 3.5 21.2
Mahindra CIE Automotive ADD 265 290 9.6 100 1.4 378 14 16 17 45.0 12.7 10.4 19.0 16.9 15.3 9.5 8.4 7.5 2.4 2.1 1.8 13.2 13.1 12.7 — — — 3.1
Mahindra & Mahindra BUY 965 1,085 12.4 1,200 16.9 1,138 45 51 53 18.5 14.4 3.1 21.5 18.8 18.2 14.0 12.1 11.5 3.2 2.8 2.5 15.8 16.0 14.7 0.9 1.1 1.1 33.1
Maruti Suzuki ADD 9,096 10,000 9.9 2,748 38.7 302 323 393 461 26.4 21.8 17.2 28.1 23.1 19.7 16.2 12.8 10.5 5.7 4.8 4.1 21.6 22.5 22.6 0.9 1.1 1.3 65.1
Motherson Sumi Systems SELL 305 280 (8.1) 642 9.0 2,105 11 14 16 40.2 21.5 13.8 26.6 21.9 19.2 10.6 8.7 7.6 5.5 4.7 4.0 22.5 23.2 22.3 0.9 1.1 1.2 14.3
MRF REDUCE 73,747 69,000 (6.4) 313 4.4 4 3,425 3,932 4,411 28.3 14.8 12.2 21.5 18.8 16.7 10.2 8.8 7.6 2.8 2.4 2.1 13.9 13.9 13.7 0.1 0.1 0.1 7.0
Schaeffler India BUY 5,447 6,000 10.1 91 1.3 17 156 199 233 9.0 27.3 17.6 34.9 27.4 23.3 21.3 16.2 13.5 4.8 4.2 3.7 14.5 16.4 17.0 0.6 0.7 0.9 0.5
SKF ADD 1,793 1,800 0.4 92 1.3 51 69 82 97 19.7 18.5 18.2 26.0 21.9 18.5 16.7 13.8 11.3 4.3 3.8 3.2 16.7 17.1 17.4 0.7 0.8 0.9 0.4
Tata Motors BUY 268 425 58.9 908 11.9 3,396 22 36 39 10.7 62.7 8.0 12.1 7.4 6.9 3.6 3.0 2.8 0.9 0.8 0.7 7.6 11.2 10.8 — — — 53.9
Timken SELL 693 660 (4.7) 47 0.7 68 19 25 30 42.3 27.5 21.8 36.0 28.2 23.2 19.9 15.8 13.1 5.7 4.8 4.0 17.1 18.5 18.8 0.1 0.1 0.2 0.3
TVS Motor SELL 569 405 (28.9) 270 3.8 475 16 20 25 13.9 23.0 26.0 35.8 29.1 23.1 19.7 16.3 13.3 8.0 6.8 5.7 24.2 25.4 27.0 0.8 1.0 1.3 13.9
WABCO India SELL 7,140 6,350 (11.1) 135 1.9 19 169 222 225 17.8 31.3 1.0 42.1 32.1 31.8 27.6 20.9 20.6 7.4 6.1 5.2 19.2 20.9 17.7 0.1 0.2 0.2 0.5
Automobiles Neutral 10,373 146 19.3 25.5 11.0 22.3 17.7 16.0 9.9 8.2 7.3 3.4 2.9 2.6 15.1 16.5 16.1 0.9 1.1 1.2 386.4
Banks
Axis Bank REDUCE 649 600 (7.6) 1,667 23.5 2,567 18 40 45 1,577.6 122.3 12.3 36.0 16.2 14.4 — — — 2.8 2.3 2.0 7.1 14.1 14.1 0.4 0.9 1.0 69.2
Bank of Baroda NR 153 — — 405 5.7 2,652 21 26 29 323.7 26.4 12.1 7.5 5.9 5.3 — — — 1.3 1.0 0.8 12.7 14.0 13.7 — — — 34.0
Canara Bank ADD 284 300 5.7 208 2.9 733 (5) 51 68 91.6 1,147.0 33.3 (58.6) 5.6 4.2 — — — 1.7 1.0 0.7 (1.0) 10.1 12.0 — — — 26.5
City Union Bank ADD 203 190 (6.2) 148 2.1 665 9 11 12 5.8 13.3 16.7 21.5 19.0 16.2 — — — 3.3 2.9 2.5 15.5 15.6 16.0 0.8 0.9 1.1 1.7
DCB Bank ADD 179 205 14.7 55 0.8 308 10 12 16 28.2 21.0 33.1 17.5 14.5 10.9 — — — 2.1 1.8 1.6 11.7 12.7 14.9 0.5 0.7 0.9 4.1
Equitas Holdings BUY 159 190 19.9 54 0.8 340 4.4 8.4 11.4 378.4 89.9 35.6 35.7 18.8 13.9 — — — 2.3 2.1 1.8 6.4 11.2 13.4 — — — 4.8
Federal Bank BUY 81 130 60.3 161 2.3 1,972 5.7 7.9 9.7 29.5 39.5 22.9 14.3 10.3 8.4 — — — 1.3 1.2 1.1 8.8 11.4 12.8 1.6 2.2 2.7 17.8
HDFC Bank REDUCE 2,062 2,000 (3.0) 5,599 78.9 2,595 78 94 112 15.7 20.0 19.1 26.4 22.0 18.5 — — — 3.9 3.4 3.0 16.7 16.2 17.0 0.7 0.9 1.0 92.1
ICICI Bank BUY 343 400 16.8 2,204 31.1 6,429 8 26 31 (19.6) 209.1 19.2 40.4 13.1 11.0 — — — 2.3 1.9 1.7 5.1 14.5 15.5 0.5 1.5 1.8 98.5
IDFC Bank NR 48 — — 162 2.3 3,404 1.2 2.9 4.3 (52.7) 146.7 44.8 39.9 16.2 11.2 — — — 1.0 1.0 0.9 2.6 6.3 8.6 0.5 1.2 1.8 9.7
IndusInd Bank REDUCE 1,907 1,900 (0.3) 1,146 16.2 600 71 87 102 17.5 23.6 16.9 27.0 21.8 18.7 — — — 4.0 3.5 3.0 17.6 16.8 17.0 — 0.5 0.6 29.8
J&K Bank BUY 55 100 80.8 31 0.4 557 7 11 15 82.4 63.8 33.5 8.3 5.1 3.8 — — — 0.7 0.6 0.5 5.9 9.1 11.2 2.4 3.9 5.2 0.4
Karur Vysya Bank ADD 94 110 17.5 75 1.1 727 3 13 14 (32.3) 306.7 9.1 29.1 7.1 6.6 — — — 1.3 1.1 1.0 3.7 14.1 13.9 0.9 3.5 4.0 1.7
Punjab National Bank ADD 88 90 2.1 243 3.4 2,761 (27) 12 18 40.4 145.3 46.9 (3.3) 7.3 5.0 — — — 4.4 1.4 0.9 (23.4) 10.7 13.8 — — — 38.5
RBL Bank SELL 627 475 (24.3) 266 3.7 420 22 29 36 48.1 31.5 21.0 28.0 21.3 17.6 — — — 3.7 3.3 2.9 13.3 15.5 16.5 0.5 0.7 0.9 15.4
State Bank of India BUY 310 370 19.5 2,763 39.0 8,925 8 37 53 204.8 380.5 42.7 40.3 8.4 5.9 — — — 2.0 1.5 1.1 3.1 13.6 16.7 — 0.1 0.2 93.2
Ujjivan Financial Services ADD 349 420 20.3 42 0.6 121 19 28 32 3,033.9 47.3 15.1 18.7 12.7 11.0 — — — 2.2 1.9 1.6 12.1 15.8 15.8 0.5 0.8 1.0 5.5
Union Bank ADD 90 120 33.7 105 1.5 1,169 8 33 40 117.1 330.8 22.5 11.7 2.7 2.2 — — — 1.3 0.8 0.5 3.9 15.2 16.3 1.3 5.5 6.8 9.6
YES Bank SELL 344 335 (2.5) 793 11.2 2,303 20 22 27 8.1 9.5 23.4 17.3 15.8 12.8 — — — 2.8 2.4 2.1 16.6 15.9 17.2 1.0 1.0 1.3 64.5
Banks Attractive 16,127 227 822.5 144.3 26.3 32.3 13.2 10.5 2.0 1.7 1.5 6.1 13.2 14.5 0.5 0.8 1.0 616.8
P/B (X) RoE (%) Dividend yield (%)

KOTAK ECONOMIC RESEARCH 51
In
dia
Da
ily S
um
ma
ry - S
ep
tem
be
r 3, 2
01
8
51
K
OTA
K IN
STIT
UTIO
NA
L EQ
UIT
IES R
ESEA
RC
H
Kotak Institutional Equities: Valuation summary of KIE Universe stocks
Source: Company, Bloomberg, Kotak Institutional Equities estimates
Target O/S ADVT
Price (Rs) price Upside Mkt cap. shares EPS (Rs) EPS growth (%) P/E (X) EV/EBITDA (X) 3mo
Company Rating 31-Aug-18 (Rs) (%) (Rs bn) (US$ bn) (mn) 2019E 2020E 2021E 2019E 2020E 2021E 2019E 2020E 2021E 2019E 2020E 2021E 2019E 2020E 2021E 2019E 2020E 2021E 2019E 2020E 2021E (US$ mn)
NBFCs
Bajaj Finance SELL 2,857 2,000 (30.0) 1,651 23.3 575 68 90 114 56.6 31.9 27.3 42.0 31.9 25.0 — — — 8.6 6.9 5.6 22.4 24.0 24.6 0.2 0.3 0.4 55.1
Bajaj Finserv REDUCE 6,748 6,100 (9.6) 1,074 15.1 159 245 307 376 39.7 25.2 22.5 27.5 22.0 17.9 — — — 4.4 3.7 3.1 17.5 18.1 18.6 0.2 0.2 0.2 18.4
Bharat Financial Inclusion NA 1,163 — — 163 2.3 139 43 54 69 31.1 27.2 25.8 27.1 21.3 17.0 — — — 4.4 3.6 2.9 17.9 18.5 19.0 — — — 10.0
Cholamandalam REDUCE 1,476 1,500 1.6 231 3.3 156 90 110 136 44.8 22.1 23.4 16.4 13.4 10.9 — — — 3.8 3.1 2.5 24.5 24.3 24.3 0.7 0.9 1.1 7.1
HDFC ADD 1,936 2,075 7.2 3,274 46.2 1,676 56 67 81 (25.8) 19.0 21.2 34.6 29.1 24.0 — — — 4.4 4.0 3.6 13.8 14.5 16.0 1.1 1.3 1.6 69.1
HDFC Standard Life Insurance SELL 462 405 (12.3) 930 13.1 2,007 6 7 8 14.8 10.9 14.7 72.7 65.6 57.2 — — — 19.3 17.2 15.3 28.0 27.7 28.4 0.3 0.4 0.4 9.3
ICICI Lombard SELL 795 620 (22.0) 361 5.1 454 26 32 37 37.1 21.5 18.5 30.5 25.1 21.2 — — — 6.7 5.6 4.7 23.8 24.2 24.0 0.8 0.9 1.1 2.3
ICICI Prudential Life BUY 375 500 33.2 539 7.6 1,436 12 13 15 10.1 7.0 10.0 30.2 28.3 25.7 — — — 6.7 5.7 4.8 24.5 21.8 20.2 0.6 0.6 0.7 8.9
IIFL Holdings SELL 725 625 (13.7) 231 3.3 319 38 45 52 31.5 18.6 16.0 19.3 16.3 14.0 — — — 3.4 3.0 #DIV/0! 20.5 20.0 20.0 1.1 1.3 1.5 1.6
L&T Finance Holdings ADD 181 190 4.7 362 5.1 1,996 13 14 16 70.9 12.3 12.8 14.5 12.9 11.4 — — — 2.6 2.3 1.9 18.9 18.8 18.3 1.1 1.4 1.3 13.5
LIC Housing Finance ADD 521 610 17.1 263 3.7 505 50 58 66 14.1 16.2 14.6 10.5 9.0 7.9 — — — 1.7 1.5 1.3 17.4 16.9 16.8 1.5 1.7 2.0 15.1
Magma Fincorp BUY 153 190 24.1 41 0.6 237 13 17 21 34.0 31.8 23.0 11.7 8.9 7.2 — — — 1.5 1.3 1.1 13.9 15.8 17.0 1.3 1.7 2.1 1.0
Mahindra & Mahindra Financial REDUCE 489 500 2.2 302 4.3 614 23 28 34 58.4 23.2 18.6 21.3 17.3 14.6 — — — 3.1 2.8 2.5 14.3 15.8 16.7 1.3 1.6 1.9 10.3
Max Financial Services ADD 448 650 45.1 120 1.7 268 6 6 6 36.9 1.8 1.8 71.4 70.1 68.9 — — — — — — 8.3 8.0 7.8 — 0.5 0.5 4.5
Muthoot Finance ADD 409 480 17.2 164 2.3 400 38 40 46 (10.8) 4.0 15.7 10.7 10.3 8.9 — — — 1.8 1.6 1.4 18.4 16.9 17.2 2.2 2.2 2.6 3.8
PNB Housing Finance REDUCE 1,360 1,325 (2.5) 228 3.2 167 62 75 92 25.3 20.9 22.4 21.8 18.0 14.7 — — — 3.2 2.8 2.4 15.2 15.9 17.0 0.3 0.3 0.3 5.1
SBI Life Insurance ADD 672 785 16.7 672 9.5 1,000 15 18 21 26.0 22.9 17.0 46.3 37.6 32.2 — — — 8.8 7.3 6.2 20.6 21.3 20.9 0.3 0.4 0.5 3.1
Shriram City Union Finance ADD 1,961 2,250 14.7 129 1.8 66 141 174 209 40.4 22.7 20.5 13.9 11.3 9.4 — — — 2.2 1.9 1.7 15.8 16.9 17.6 0.9 1.1 1.3 1.5
Shriram Transport ADD 1,336 1,550 16.0 303 4.3 227 114 130 146 64.4 14.3 12.8 11.8 10.3 9.1 — — — 2.1 1.8 1.6 18.3 17.5 17.1 1.2 1.4 1.6 31.3
NBFCs Neutral 11,038 156 14.9 19.4 19.4 28.1 23.5 19.7 4.5 3.9 3.4 16.1 16.7 17.2 0.7 0.8 1.0 616.8
Cement
ACC SELL 1,639 1,270 (22.5) 308 4.3 188 62 70 81 27.0 13.8 15.2 26.5 23.3 20.2 14.8 12.7 10.8 3.0 2.8 2.5 11.9 12.5 13.1 1.0 1.0 1.0 16.6
Ambuja Cements REDUCE 241 210 (13.0) 479 6.8 1,986 9 11 12 14.5 23.2 15.8 28.0 22.8 19.7 9.6 7.9 6.6 2.2 2.1 2.0 8.1 9.5 10.4 1.5 1.5 1.5 11.8
Dalmia Bharat ADD 2,631 2,830 7.6 235 3.3 89 94 122 139 55.8 29.3 14.8 28.0 21.7 18.9 10.6 8.7 7.5 3.4 2.9 2.6 12.9 14.6 14.5 0.1 0.1 0.1 4.8
Grasim Industries BUY 1,068 1,170 9.6 702 9.9 657 46 55 70 (2.5) 18.8 28.0 23.1 19.4 15.2 7.6 7.2 6.7 1.2 1.1 1.0 5.2 5.9 7.1 0.5 0.5 0.5 15.7
India Cements REDUCE 126 118 (6.6) 39 0.6 308 4 8 12 28.0 102.6 41.3 30.2 14.9 10.6 9.2 7.2 6.1 0.7 0.7 0.7 2.5 4.8 6.5 0.8 0.8 0.8 8.9
J K Cement ADD 795 890 11.9 56 0.8 70 45 79 78 3.7 75.4 (0.8) 17.7 10.1 10.2 10.4 8.5 7.0 2.5 2.1 1.7 15.0 22.3 18.5 1.0 1.0 1.0 0.5
JK Lakshmi Cement ADD 330 370 12.1 39 0.5 118 11 28 37 153.5 147.9 30.5 29.1 11.8 9.0 10.1 6.6 5.4 2.5 2.1 1.7 8.9 19.5 21.0 0.6 0.6 0.6 0.3
Orient Cement ADD 116 145 25.4 24 0.3 205 7 11 15 212.9 58.7 41.3 17.1 10.8 7.6 8.0 6.1 4.6 2.1 1.8 1.5 12.9 18.2 21.8 1.3 1.7 1.7 0.2
Shree Cement SELL 18,926 12,500 (34.0) 659 9.3 35 421 630 760 6.0 49.7 20.6 45.0 30.0 24.9 21.0 15.8 12.9 6.5 5.4 4.5 15.4 19.7 19.8 0.3 0.3 0.3 5.3
UltraTech Cement SELL 4,470 2,950 (34.0) 1,228 17.3 275 126 162 201 42.7 28.9 24.0 35.5 27.6 22.2 18.4 15.3 12.8 4.2 3.7 3.2 12.6 14.3 15.4 0.2 0.2 0.2 18.7
Cement Cautious 3,768 53 19.5 30.3 21.8 30.4 23.4 19.2 11.5 9.9 8.6 2.5 2.3 2.1 8.4 10.0 11.0 0.5 0.5 0.5 82.8
P/B (X) RoE (%) Dividend yield (%)

52 KOTAK ECONOMIC RESEARCH
K
OTA
K IN
STIT
UTIO
NA
L EQ
UIT
IES R
ESEA
RC
H
52
Ind
ia D
aily
Su
mm
ary
- Se
pte
mb
er 3
, 201
8
Kotak Institutional Equities: Valuation summary of KIE Universe stocks
Source: Company, Bloomberg, Kotak Institutional Equities estimates
Target O/S ADVT
Price (Rs) price Upside Mkt cap. shares EPS (Rs) EPS growth (%) P/E (X) EV/EBITDA (X) 3mo
Company Rating 31-Aug-18 (Rs) (%) (Rs bn) (US$ bn) (mn) 2019E 2020E 2021E 2019E 2020E 2021E 2019E 2020E 2021E 2019E 2020E 2021E 2019E 2020E 2021E 2019E 2020E 2021E 2019E 2020E 2021E (US$ mn)
Consumer products
Asian Paints REDUCE 1,371 1,325 (3.4) 1,315 18.5 959 27 33 39 32.1 20.3 18.3 50.6 42.0 35.5 31.7 26.2 22.1 13.6 11.9 10.4 28.8 30.3 31.3 0.9 1.1 1.3 21.1
Bajaj Corp. ADD 431 470 9.0 64 0.9 148 15 17 19 7.8 10.3 9.5 28.0 25.3 23.2 22.4 19.1 16.6 13.0 12.9 12.7 46.3 51.2 55.4 3.0 3.2 3.5 0.6
Britannia Industries ADD 6,737 6,700 (0.5) 809 11.4 120 104 127 152 24.5 22.2 19.2 64.7 52.9 44.4 42.5 34.8 29.1 18.8 15.2 12.5 32.5 31.8 30.9 0.5 0.7 0.8 12.4
Coffee Day Enterprises REDUCE 278 290 4.3 59 0.8 211 8 10 12 129.9 30.0 21.2 36.2 27.8 23.0 12.1 10.6 9.8 2.3 2.1 2.0 6.6 8.0 8.9 — — — 0.9
Colgate-Palmolive (India) ADD 1,169 1,250 6.9 318 4.5 272 27 32 36 14.7 15.6 15.5 42.9 37.1 32.1 24.5 21.3 18.5 18.7 16.2 14.3 46.0 46.9 47.3 1.4 1.6 2.0 6.7
Dabur India REDUCE 479 390 (18.5) 846 11.9 1,762 9 10 12 17.3 12.9 13.6 52.5 46.5 40.9 43.9 38.0 32.9 14.8 12.9 11.3 28.1 29.6 29.4 0.8 0.9 1.1 17.2
GlaxoSmithKline Consumer ADD 7,705 7,300 (5.3) 324 4.6 42 199 223 246 19.5 12.1 10.1 38.7 34.5 31.4 27.4 23.6 20.8 8.4 7.6 6.9 22.8 23.0 23.1 1.2 1.4 1.6 2.1
Godrej Consumer Products SELL 1,452 1,100 (24.3) 990 14.0 681 25 29 33 18.8 13.7 12.7 57.3 50.4 44.7 40.7 35.3 31.0 13.5 11.7 10.2 25.4 24.8 24.3 0.6 0.7 0.8 10.9
Hindustan Unilever REDUCE 1,780 1,570 (11.8) 3,853 54.3 2,160 29 33 37 19.5 13.2 12.6 60.7 53.6 47.6 42.1 37.0 32.8 47.5 40.4 34.7 83.5 81.4 78.3 1.2 1.3 1.5 33.7
ITC ADD 320 330 3.2 3,912 55.2 12,275 10 11 12 8.2 12.3 11.7 33.2 29.5 26.4 21.5 19.0 16.9 7.2 6.8 6.4 20.4 22.2 24.2 1.8 2.1 2.4 53.4
Jubilant Foodworks BUY 1,549 1,650 6.5 204 2.9 132 25 35 46 73.6 37.5 32.3 61.3 44.6 33.7 30.8 23.3 17.8 15.2 11.6 8.8 28.9 29.5 29.7 0.1 0.2 0.3 33.8
Jyothy Laboratories ADD 217 240 10.9 79 1.1 364 6 7 8 27.6 16.7 15.4 38.5 33.0 28.6 25.7 21.8 18.6 5.9 5.2 4.5 16.6 16.8 16.9 0.5 0.7 0.9 1.1
Marico ADD 369 375 1.5 477 6.7 1,291 7 8 9 8.9 20.0 14.5 54.1 45.1 39.4 37.6 31.1 26.8 17.7 16.5 15.2 33.7 37.9 40.2 1.3 1.5 1.7 9.5
Nestle India ADD 11,582 11,000 (5.0) 1,117 15.7 96 171 197 223 34.2 15.7 13.2 67.9 58.7 51.8 39.0 33.7 29.6 30.0 27.5 25.2 46.1 49.0 50.8 1.0 1.2 1.3 9.0
Page Industries SELL 34,424 25,000 (27.4) 384 5.4 11 418 508 607 34.3 21.6 19.5 82.4 67.7 56.7 53.3 44.0 36.7 34.8 27.6 22.2 47.8 45.5 43.4 0.5 0.6 0.8 12.1
Pidilite Industries REDUCE 1,169 1,080 (7.6) 593 8.4 508 21 26 31 16.8 21.8 20.2 55.5 45.5 37.9 36.9 30.5 25.4 14.1 11.8 9.9 27.4 28.2 28.4 0.6 0.7 0.8 12.3
S H Kelkar and Company BUY 232 290 25.1 34 0.5 145 7 10 12 (6.2) 41.9 23.2 33.4 23.5 19.1 21.5 15.4 13.3 3.6 3.2 2.9 11.3 14.5 16.0 0.8 0.9 1.2 0.4
Tata Global Beverages REDUCE 234 250 6.7 148 2.1 631 8 9 10 7.7 17.0 12.9 29.6 25.3 22.4 16.2 14.2 12.6 2.0 1.9 1.9 7.0 7.9 8.5 1.3 1.5 1.7 11.0
Titan Company SELL 892 840 (5.8) 792 11.2 888 16 20 23 25.6 21.8 19.3 55.6 45.6 38.2 36.9 29.4 24.1 13.1 11.0 9.3 25.6 26.3 26.4 0.5 0.6 0.8 36.3
United Breweries SELL 1,404 1,100 (21.7) 371 5.2 264 21 26 31 39.2 23.6 20.6 67.6 54.6 45.3 33.4 28.7 24.6 11.7 9.9 8.4 18.7 19.6 20.0 0.2 0.3 0.4 13.4
United Spirits REDUCE 630 590 (6.4) 458 6.5 727 10 13 17 34.7 30.9 24.5 61.5 47.0 37.7 35.7 28.9 24.5 12.6 9.3 7.1 24.2 22.7 21.3 — — 0.4 14.5
Varun Beverages ADD 819 800 (2.4) 150 2.1 183 15 20 26 29.8 34.5 30.7 54.8 40.7 31.2 18.0 15.3 12.9 7.6 6.5 5.5 14.6 17.1 19.0 — — 0.2 1.6
Consumer products Cautious 17,295 244 17.7 16.0 14.7 48.7 42.0 36.6 31.6 27.1 23.6 12.7 11.4 10.2 26.1 27.1 27.8 1.1 1.3 1.5 313.8
Energy
BPCL REDUCE 362 375 3.6 785 11.1 1,967 38 39 39 (6.7) 3.1 1.1 9.6 9.3 9.2 7.0 6.6 6.5 1.9 1.7 1.6 20.5 19.1 17.5 4.1 4.3 4.3 27.6
Castrol India SELL 159 155 (2.4) 157 2.2 989 7 8 9 2.9 10.1 9.7 22.5 20.4 18.6 14.0 12.7 11.5 14.8 14.4 13.9 67.1 71.5 76.0 3.5 3.9 4.3 4.1
GAIL (India) BUY 372 440 18.2 839 11.8 2,255 26 29 31 27.8 10.0 9.5 14.3 13.0 11.8 8.9 8.2 7.4 1.9 1.8 1.6 14.0 14.1 14.2 2.3 2.6 2.8 24.3
GSPL SELL 193 175 (9.1) 109 1.5 564 11 11 12 (6.5) (0.5) 11.9 17.4 17.5 15.6 6.5 6.6 5.8 1.9 1.8 1.6 11.7 10.7 10.9 0.9 0.9 1.0 1.3
HPCL REDUCE 254 285 12.2 387 5.5 1,524 32 32 32 (22.3) (2.2) 0.5 7.8 8.0 8.0 7.0 7.4 7.7 1.5 1.3 1.2 19.6 17.4 16.1 5.2 5.1 5.1 24.3
Indraprastha Gas SELL 290 240 (17.4) 203 2.9 700 12 13 15 16.4 12.3 10.7 24.2 21.6 19.5 15.4 13.5 12.0 5.0 4.3 3.8 22.1 21.5 20.9 0.9 1.1 1.4 10.5
IOCL REDUCE 156 150 (3.6) 1,511 21.3 9,479 18 17 18 (11.2) (4.1) 2.8 8.5 8.9 8.7 4.9 4.9 4.7 1.2 1.2 1.1 15.1 13.4 12.9 4.7 4.5 4.6 20.5
Mahanagar Gas ADD 866 965 11.5 86 1.2 99 56 60 64 16.0 7.6 5.4 15.4 14.3 13.6 8.9 8.1 7.5 3.6 3.2 2.8 24.8 23.5 22.0 2.6 2.8 2.9 11.6
ONGC ADD 180 200 11.1 2,309 32.6 12,833 20 20 19 16.8 0.3 (5.9) 8.8 8.8 9.4 4.2 4.0 3.9 1.0 0.9 0.9 11.2 10.6 9.5 3.8 3.9 3.9 16.9
Oil India SELL 214 200 (6.4) 242 3.4 1,135 23 24 23 (6.7) 3.4 (2.5) 9.3 9.0 9.2 6.1 5.8 5.8 0.8 0.8 0.8 9.2 9.0 8.4 4.3 4.5 4.3 2.4
Petronet LNG BUY 248 280 12.9 372 5.2 1,500 16 18 20 16.7 13.1 9.4 15.3 13.5 12.4 10.2 8.7 7.7 3.3 3.0 2.7 23.3 23.2 22.7 2.3 3.0 3.6 10.4
Reliance Industries SELL 1,241 985 (20.6) 7,344 103.5 5,922 69 78 87 17.6 12.4 11.9 17.9 15.9 14.2 12.0 10.2 8.7 2.2 2.0 1.8 12.2 12.1 12.1 0.5 0.5 0.6 130.3
Energy Attractive 14,345 202 7.2 5.2 4.8 13.0 12.3 11.8 7.8 7.2 6.7 1.7 1.5 1.4 13.0 12.5 12.0 2.0 2.1 2.2 284.1
P/B (X) RoE (%) Dividend yield (%)
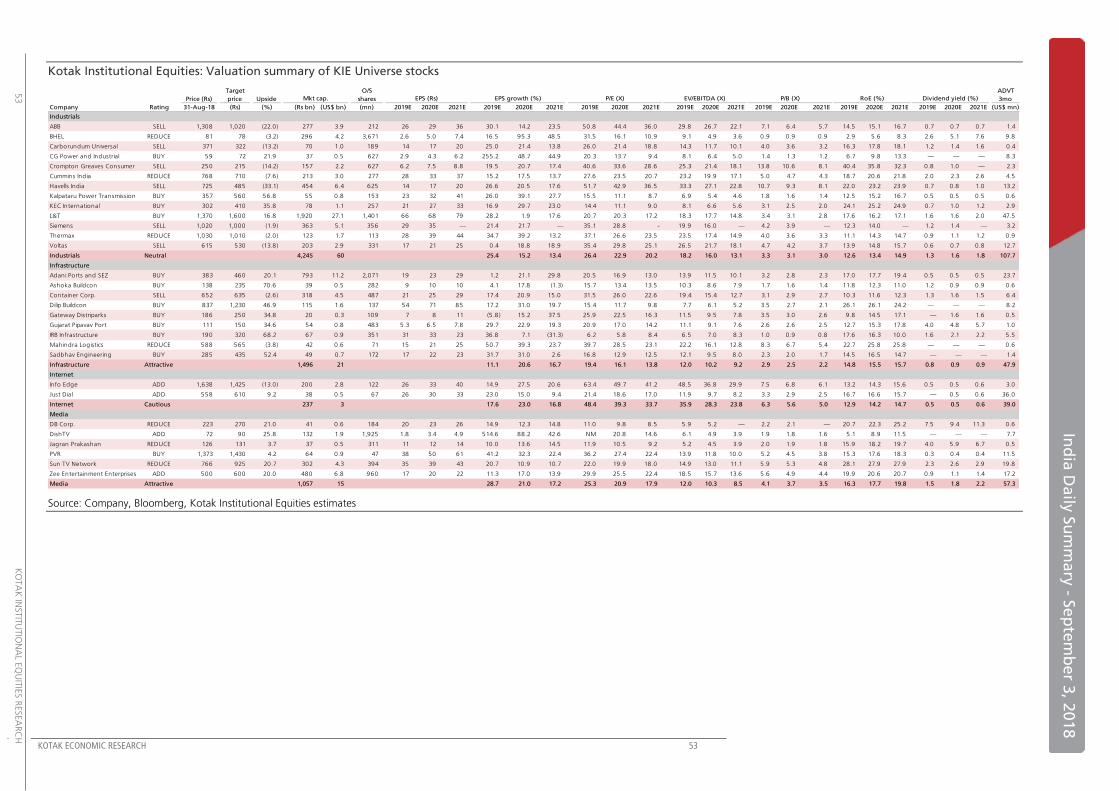
KOTAK ECONOMIC RESEARCH 53
In
dia
Da
ily S
um
ma
ry - S
ep
tem
be
r 3, 2
01
8
53
K
OTA
K IN
STIT
UTIO
NA
L EQ
UIT
IES R
ESEA
RC
H
Kotak Institutional Equities: Valuation summary of KIE Universe stocks
Source: Company, Bloomberg, Kotak Institutional Equities estimates
Target O/S ADVT
Price (Rs) price Upside shares 3mo
Company Rating 31-Aug-18 (Rs) (%) (Rs bn) (US$ bn) (mn) 2019E 2020E 2021E 2019E 2020E 2021E 2019E 2020E 2021E 2019E 2020E 2021E 2019E 2020E 2021E 2019E 2020E 2021E 2019E 2020E 2021E (US$ mn)
Industrials
ABB SELL 1,308 1,020 (22.0) 277 3.9 212 26 29 36 30.1 14.2 23.5 50.8 44.4 36.0 29.8 26.7 22.1 7.1 6.4 5.7 14.5 15.1 16.7 0.7 0.7 0.7 1.4
BHEL REDUCE 81 78 (3.2) 296 4.2 3,671 2.6 5.0 7.4 16.5 95.3 48.5 31.5 16.1 10.9 9.1 4.9 3.6 0.9 0.9 0.9 2.9 5.6 8.3 2.6 5.1 7.6 9.8
Carborundum Universal SELL 371 322 (13.2) 70 1.0 189 14 17 20 25.0 21.4 13.8 26.0 21.4 18.8 14.3 11.7 10.1 4.0 3.6 3.2 16.3 17.8 18.1 1.2 1.4 1.6 0.4
CG Power and Industrial BUY 59 72 21.9 37 0.5 627 2.9 4.3 6.2 255.2 48.7 44.9 20.3 13.7 9.4 8.1 6.4 5.0 1.4 1.3 1.2 6.7 9.8 13.3 — — — 8.3
Crompton Greaves Consumer SELL 250 215 (14.2) 157 2.2 627 6.2 7.5 8.8 19.5 20.7 17.4 40.6 33.6 28.6 25.3 21.4 18.1 13.8 10.6 8.1 40.4 35.8 32.3 0.8 1.0 — 2.3
Cummins India REDUCE 768 710 (7.6) 213 3.0 277 28 33 37 15.2 17.5 13.7 27.6 23.5 20.7 23.2 19.9 17.1 5.0 4.7 4.3 18.7 20.6 21.8 2.0 2.3 2.6 4.5
Havells India SELL 725 485 (33.1) 454 6.4 625 14 17 20 26.6 20.5 17.6 51.7 42.9 36.5 33.3 27.1 22.8 10.7 9.3 8.1 22.0 23.2 23.9 0.7 0.8 1.0 13.2
Kalpataru Power Transmission BUY 357 560 56.8 55 0.8 153 23 32 41 26.0 39.1 27.7 15.5 11.1 8.7 6.9 5.4 4.6 1.8 1.6 1.4 12.5 15.2 16.7 0.5 0.5 0.5 0.6
KEC International BUY 302 410 35.8 78 1.1 257 21 27 33 16.9 29.7 23.0 14.4 11.1 9.0 8.1 6.6 5.6 3.1 2.5 2.0 24.1 25.2 24.9 0.7 1.0 1.2 2.9
L&T BUY 1,370 1,600 16.8 1,920 27.1 1,401 66 68 79 28.2 1.9 17.6 20.7 20.3 17.2 18.3 17.7 14.8 3.4 3.1 2.8 17.6 16.2 17.1 1.6 1.6 2.0 47.5
Siemens SELL 1,020 1,000 (1.9) 363 5.1 356 29 35 — 21.4 21.7 — 35.1 28.8 - 19.9 16.0 — 4.2 3.9 — 12.3 14.0 — 1.2 1.4 — 3.2
Thermax REDUCE 1,030 1,010 (2.0) 123 1.7 113 28 39 44 34.7 39.2 13.2 37.1 26.6 23.5 23.5 17.4 14.9 4.0 3.6 3.3 11.1 14.3 14.7 0.9 1.1 1.2 0.9
Voltas SELL 615 530 (13.8) 203 2.9 331 17 21 25 0.4 18.8 18.9 35.4 29.8 25.1 26.5 21.7 18.1 4.7 4.2 3.7 13.9 14.8 15.7 0.6 0.7 0.8 12.7
Industrials Neutral 4,245 60 25.4 15.2 13.4 26.4 22.9 20.2 18.2 16.0 13.1 3.3 3.1 3.0 12.6 13.4 14.9 1.3 1.6 1.8 107.7
Infrastructure
Adani Ports and SEZ BUY 383 460 20.1 793 11.2 2,071 19 23 29 1.2 21.1 29.8 20.5 16.9 13.0 13.9 11.5 10.1 3.2 2.8 2.3 17.0 17.7 19.4 0.5 0.5 0.5 23.7
Ashoka Buildcon BUY 138 235 70.6 39 0.5 282 9 10 10 4.1 17.8 (1.3) 15.7 13.4 13.5 10.3 8.6 7.9 1.7 1.6 1.4 11.8 12.3 11.0 1.2 0.9 0.9 0.6
Container Corp. SELL 652 635 (2.6) 318 4.5 487 21 25 29 17.4 20.9 15.0 31.5 26.0 22.6 19.4 15.4 12.7 3.1 2.9 2.7 10.3 11.6 12.3 1.3 1.6 1.5 6.4
Dilip Buildcon BUY 837 1,230 46.9 115 1.6 137 54 71 85 17.2 31.0 19.7 15.4 11.7 9.8 7.7 6.1 5.2 3.5 2.7 2.1 26.1 26.1 24.2 — — — 8.2
Gateway Distriparks BUY 186 250 34.8 20 0.3 109 7 8 11 (5.8) 15.2 37.5 25.9 22.5 16.3 11.5 9.5 7.8 3.5 3.0 2.6 9.8 14.5 17.1 — 1.6 1.6 0.5
Gujarat Pipavav Port BUY 111 150 34.6 54 0.8 483 5.3 6.5 7.8 29.7 22.9 19.3 20.9 17.0 14.2 11.1 9.1 7.6 2.6 2.6 2.5 12.7 15.3 17.8 4.0 4.8 5.7 1.0
IRB Infrastructure BUY 190 320 68.2 67 0.9 351 31 33 23 36.8 7.1 (31.3) 6.2 5.8 8.4 6.5 7.0 8.3 1.0 0.9 0.8 17.6 16.3 10.0 1.6 2.1 2.2 5.5
Mahindra Logistics REDUCE 588 565 (3.8) 42 0.6 71 15 21 25 50.7 39.3 23.7 39.7 28.5 23.1 22.2 16.1 12.8 8.3 6.7 5.4 22.7 25.8 25.8 — — — 0.6
Sadbhav Engineering BUY 285 435 52.4 49 0.7 172 17 22 23 31.7 31.0 2.6 16.8 12.9 12.5 12.1 9.5 8.0 2.3 2.0 1.7 14.5 16.5 14.7 — — — 1.4
Infrastructure Attractive 1,496 21 11.1 20.6 16.7 19.4 16.1 13.8 12.0 10.2 9.2 2.9 2.5 2.2 14.8 15.5 15.7 0.8 0.9 0.9 47.9
Internet
Info Edge ADD 1,638 1,425 (13.0) 200 2.8 122 26 33 40 14.9 27.5 20.6 63.4 49.7 41.2 48.5 36.8 29.9 7.5 6.8 6.1 13.2 14.3 15.6 0.5 0.5 0.6 3.0
Just Dial ADD 558 610 9.2 38 0.5 67 26 30 33 23.0 15.0 9.4 21.4 18.6 17.0 11.9 9.7 8.2 3.3 2.9 2.5 16.7 16.6 15.7 — 0.5 0.6 36.0
Internet Cautious 237 3 17.6 23.0 16.8 48.4 39.3 33.7 35.9 28.3 23.8 6.3 5.6 5.0 12.9 14.2 14.7 0.5 0.5 0.6 39.0
Media
DB Corp. REDUCE 223 270 21.0 41 0.6 184 20 23 26 14.9 12.3 14.8 11.0 9.8 8.5 5.9 5.2 — 2.2 2.1 — 20.7 22.3 25.2 7.5 9.4 11.3 0.6
DishTV ADD 72 90 25.8 132 1.9 1,925 1.8 3.4 4.9 514.6 88.2 42.6 NM 20.8 14.6 6.1 4.9 3.9 1.9 1.8 1.6 5.1 8.9 11.5 — — — 7.7
Jagran Prakashan REDUCE 126 131 3.7 37 0.5 311 11 12 14 10.0 13.6 14.5 11.9 10.5 9.2 5.2 4.5 3.9 2.0 1.9 1.8 15.9 18.2 19.7 4.0 5.9 6.7 0.5
PVR BUY 1,373 1,430 4.2 64 0.9 47 38 50 61 41.2 32.3 22.4 36.2 27.4 22.4 13.9 11.8 10.0 5.2 4.5 3.8 15.3 17.6 18.3 0.3 0.4 0.4 11.5
Sun TV Network REDUCE 766 925 20.7 302 4.3 394 35 39 43 20.7 10.9 10.7 22.0 19.9 18.0 14.9 13.0 11.1 5.9 5.3 4.8 28.1 27.9 27.9 2.3 2.6 2.9 19.8
Zee Entertainment Enterprises ADD 500 600 20.0 480 6.8 960 17 20 22 11.3 17.0 13.9 29.9 25.5 22.4 18.5 15.7 13.6 5.6 4.9 4.4 19.9 20.6 20.7 0.9 1.1 1.4 17.2
Media Attractive 1,057 15 28.7 21.0 17.2 25.3 20.9 17.9 12.0 10.3 8.5 4.1 3.7 3.5 16.3 17.7 19.8 1.5 1.8 2.2 57.3
Mkt cap. EPS (Rs) EPS growth (%) P/E (X) EV/EBITDA (X) P/B (X) RoE (%) Dividend yield (%)

54 KOTAK ECONOMIC RESEARCH
K
OTA
K IN
STIT
UTIO
NA
L EQ
UIT
IES R
ESEA
RC
H
54
Ind
ia D
aily
Su
mm
ary
- Se
pte
mb
er 3
, 201
8
Kotak Institutional Equities: Valuation summary of KIE Universe stocks
Source: Company, Bloomberg, Kotak Institutional Equities estimates
Target O/S ADVT
Price (Rs) price Upside shares 3mo
Company Rating 31-Aug-18 (Rs) (%) (Rs bn) (US$ bn) (mn) 2019E 2020E 2021E 2019E 2020E 2021E 2019E 2020E 2021E 2019E 2020E 2021E 2019E 2020E 2021E 2019E 2020E 2021E 2019E 2020E 2021E (US$ mn)
Metals & Mining
Coal India ADD 286 326 14.0 1,775 25.0 6,207 27 28 28 138.2 3.0 0.7 10.6 10.3 10.2 6.8 6.5 6.2 6.7 7.0 7.2 66.1 66.4 69.1 7.0 8.7 8.7 15.4
Hindalco Industries BUY 238 305 28.2 534 7.5 2,229 27 31 34 25.1 13.6 10.2 8.7 7.7 7.0 5.6 4.9 4.3 0.9 0.8 0.7 10.6 10.8 10.8 0.5 0.5 0.5 34.3
Hindustan Zinc ADD 299 290 (3.1) 1,264 17.8 4,225 22 26 27 3.7 14.7 5.4 13.4 11.7 11.1 7.9 6.5 5.7 3.1 2.6 2.3 24.4 24.2 22.1 2.7 2.7 2.7 7.5
Jindal Steel and Power REDUCE 221 215 (2.6) 214 3.0 968 8 14 22 195.9 68.5 60.8 27.1 16.1 10.0 7.0 6.4 5.5 0.7 0.7 0.6 2.7 4.3 6.5 — — — 29.0
JSW Steel ADD 397 350 (11.7) 958 13.5 2,417 30 27 30 10.2 (8.7) 11.7 13.4 14.7 13.2 7.9 8.6 7.3 2.7 2.4 2.0 22.4 17.3 16.7 0.8 0.8 0.8 26.4
National Aluminium Co. ADD 75 80 6.9 145 2.0 1,933 9 7 8 125.8 (21.1) 2.4 8.0 10.2 9.9 3.7 4.8 4.7 1.3 1.3 1.3 16.8 13.0 13.3 8.0 8.0 8.0 11.0
NMDC REDUCE 112 120 7.6 353 5.0 3,164 12 10 11 4.2 (14.3) 5.9 9.1 10.7 10.1 5.6 6.5 6.0 1.4 1.3 1.2 15.3 12.4 12.5 4.9 4.9 4.9 4.8
Tata Steel ADD 601 660 9.9 689 9.7 1,205 76 85 94 12.8 12.1 10.9 7.9 7 6.4 6.0 6.3 5.9 1.0 1.0 0.9 14.3 14.3 14.4 1.7 1.7 1.7 71.1
Vedanta BUY 228 370 62.5 846 11.9 3,717 32 39 38 49.1 19.7 (0.7) 7.1 5.9 6.0 4.7 3.8 3.5 1.2 1.1 1.0 18.0 19.4 17.2 4.2 5.1 5.0 48.6
Metals & Mining Attractive 6,778 96 41.7 7.7 5.9 10.1 9.4 8.9 6.2 5.8 5.3 1.8 1.7 1.5 18.0 17.8 17.1 3.6 4.2 4.2 248.1
Pharmaceutical
Apollo Hospitals ADD 1,183 1,090 (7.8) 165 2.3 139 20 27 33 133.5 36.7 21.6 60.0 43.9 36.1 20.7 17.5 15.4 4.8 4.4 4.1 8.2 10.5 11.8 0.4 0.6 0.7 14.2
Aster DM Healthcare BUY 176 240 36.2 89 1.3 505 5 8 12 74.4 62.0 51.4 36.7 22.6 14.9 13.0 10.3 8.0 2.9 2.6 2.3 8.3 12.2 16.3 — — — 0.3
Aurobindo Pharma ADD 713 640 (10.2) 418 5.9 584 40 48 54 (4.5) 20.1 13.1 17.9 14.9 13.1 11.9 9.9 8.5 3.0 2.6 2.2 18.4 17.3 16.8 0.7 0.9 1.0 24.4
Biocon SELL 624 330 (47.1) 374 5.3 601 8 15 18 35.9 75.7 21.7 74.1 42.2 34.7 32.2 21.6 18.3 6.2 5.6 5.0 8.7 13.9 14.3 0.5 0.8 1.0 22.1
Cipla BUY 662 680 2.7 533 7.5 805 24 31 40 34.5 31.0 29.4 28.1 21.5 16.6 15.8 12.6 9.8 3.3 3.0 2.6 12.4 14.6 15.7 0.7 1.0 1.3 26.8
Dr Lal Pathlabs REDUCE 1,046 900 (14.0) 87 1.2 83 24 29 34 19.0 17.9 18.4 43.0 36.5 30.8 26.5 22.3 18.2 9.2 7.7 6.5 23.4 23.1 22.9 0.5 0.5 0.6 1.5
Dr Reddy's Laboratories REDUCE 2,492 2,150 (13.7) 414 5.8 166 89 118 141 50.2 32.8 19.3 28.1 21.2 17.7 14.1 10.1 8.4 3.0 2.7 2.4 11.1 12.6 13.3 0.5 0.7 0.9 37.5
HCG REDUCE 254 290 14.3 22 0.3 85 2 4 7 39.8 80.3 80.8 116.1 64.4 35.6 18.6 15.5 11.9 4.0 3.8 3.4 3.5 6.1 10.1 — — — 0.2
Laurus Labs ADD 438 500 14.0 46 0.7 106 16 29 34 2.4 79.9 17.5 27.0 15.0 12.8 12.5 8.7 7.6 2.8 2.4 2.0 10.9 17.1 15.6 — — — 0.6
Lupin REDUCE 931 800 (14.1) 421 5.9 450 27 39 50 (28.9) 44.0 27.4 34.4 23.9 18.7 16.0 11.6 9.4 2.9 2.6 2.3 8.6 11.4 12.4 0.4 0.6 0.8 44.0
Narayana Hrudayalaya ADD 250 265 6.0 51 0.7 204 3 6 9 23.0 103.2 40.7 80.9 39.8 28.3 22.9 16.0 12.9 4.7 4.2 3.6 5.9 11.0 13.7 — — — 0.2
Sun Pharmaceuticals REDUCE 653 520 (20.3) 1,566 22.1 2,406 17 24 29 11.1 42.5 20.5 38.7 27.2 22.6 21.3 15.6 13.1 3.8 3.4 3.0 10.2 13.1 13.3 0.5 0.7 0.9 60.5
Torrent Pharmaceuticals NR 1,813 — — 307 4.3 169 47 61 81 18.0 29.6 32.1 38.3 29.6 22.4 16.7 14.3 11.8 5.9 5.1 4.3 15.3 17.2 19.3 0.6 0.8 1.0 7.8
Pharmaceuticals Neutral 4,494 63 11.3 37.2 22.7 33.9 24.7 20.1 17.5 13.4 11.1 3.7 3.3 2.9 10.9 13.2 14.3 0.5 0.7 0.9 240.1
Real Estate
Brigade Enterprises BUY 210 290 38.0 29 0.4 136 9 15 17 (17.0) 59.2 15.8 22.9 14.4 12.4 13.6 10.6 8.5 1.2 1.1 1.1 5.4 8.1 8.8 1.2 1.2 1.2 0.3
DLF RS 221 — — 394 5.6 1,784 5.3 23.9 14.1 (87.2) 354.6 (41.0) 42.0 9.2 15.7 57.2 10.0 18.8 1.1 1.0 0.9 2.6 11.3 6.2 0.9 0.9 0.9 17.0
Godrej Properties SELL 688 400 (41.8) 158 2.2 216 13.3 15.8 18.2 (38.9) 19.1 15.2 51.9 43.5 37.8 306.1 159.6 131.5 4.4 4.0 3.6 10.5 9.7 10.1 — — — 1.7
Oberoi Realty BUY 441 560 27.0 160 2.3 340 62 44 66 385.4 (28.0) 49.3 7.1 9.9 6.6 9.9 12.4 5.4 1.6 1.4 1.2 27.4 15.2 19.2 0.5 0.5 0.5 2.1
Prestige Estates Projects ADD 237 315 32.9 89 1.3 375 19 21 11 (24.2) 8.4 — 12.5 11.5 22.2 10.4 10.5 14.1 0.9 0.8 — 14.6 14.9 7.3 1.3 1.3 0.6 1.0
Sobha REDUCE 460 510 11.0 44 0.6 95 23 36 24 (48.8) 51.7 (32.6) 19.6 12.9 19.1 11.8 9.2 11.5 2.0 1.8 1.7 9.0 14.8 9.1 1.5 1.5 1.5 1.5
Sunteck Realty REDUCE 509 360 (29.2) 74 1.0 140 19 19 39 22.4 1.6 106.6 27.2 26.8 13.0 22.5 21.7 9.6 2.5 2.3 2.0 9.5 8.9 16.2 0.2 0.2 0.2 2.0
Real Estate Neutral 948 13 (53.1) 65.1 (14.4) 20.3 12.3 14.3 20.8 12.3 13.7 1.4 1.3 1.3 7.1 10.6 9.0 0.7 0.7 0.6 25.7
Dividend yield (%)Mkt cap. EPS (Rs) EPS growth (%) P/E (X) EV/EBITDA (X) P/B (X) RoE (%)

KOTAK ECONOMIC RESEARCH 55
In
dia
Da
ily S
um
ma
ry - S
ep
tem
be
r 3, 2
01
8
55
K
OTA
K IN
STIT
UTIO
NA
L EQ
UIT
IES R
ESEA
RC
H
Kotak Institutional Equities: Valuation summary of KIE Universe stocks
Source: Company, Bloomberg, Kotak Institutional Equities estimates
Target O/S ADVT
Price (Rs) price Upside shares 3mo
Company Rating 31-Aug-18 (Rs) (%) (Rs bn) (US$ bn) (mn) 2019E 2020E 2021E 2019E 2020E 2021E 2019E 2020E 2021E 2019E 2020E 2021E 2019E 2020E 2021E 2019E 2020E 2021E 2019E 2020E 2021E (US$ mn)
Technology
HCL Technologies REDUCE 1,046 1,025 (2.0) 1,457 20.5 1,409 70 74 77 12.8 5.0 5.0 14.9 14.2 13.5 9.8 8.9 8.3 3.3 2.9 2.6 24.2 21.8 20.5 0.8 3.0 3.1 32.2
Hexaware Technologies SELL 438 435 (0.7) 130 1.8 302 20 23 25 18.4 18.0 10.0 22.4 19.0 17.2 16.6 13.2 11.6 5.7 4.9 4.2 27.4 27.8 26.3 1.8 1.8 2.3 21.2
Infosys ADD 1,441 1,400 (2.9) 3,148 44.4 2,175 71 78 85 9.7 10.4 9.1 20.3 18.4 16.9 14.0 12.5 11.2 4.5 4.1 3.8 23.0 23.5 23.3 3.0 2.7 2.9 83.8
L&T Infotech ADD 1,798 2,000 11.3 311 4.4 175 83 94 109 30.5 13.0 16.5 21.7 19.2 16.5 16.6 14.0 11.8 6.6 5.3 4.4 33.5 30.7 29.2 1.3 1.4 1.7 4.7
Mindtree ADD 1,113 1,115 0.2 183 2.6 165 43 53 62 24.9 23.6 15.9 25.8 20.9 18.0 16.3 13.1 11.2 5.7 4.9 4.2 23.9 25.2 24.9 1.2 1.4 1.7 22.9
Mphasis SELL 1,260 825 (34.5) 244 3.4 193 53 57 59 20.5 7.1 4.6 23.8 22.3 21.3 17.7 15.7 14.6 4.7 4.2 3.9 18.7 19.9 19.2 1.6 2.0 2.4 6.5
TCS REDUCE 2,078 1,790 (13.9) 7,957 112.2 3,829 82 89 96 21.2 8.8 7.4 25.4 23.3 21.7 18.7 17.2 15.9 8.0 7.8 7.7 33.4 33.8 35.9 2.0 3.4 3.7 92.7
Tech Mahindra ADD 766 785 2.5 676 9.5 891 46 55 61 8.3 18.2 11.1 16.6 14.0 12.6 10.1 8.2 7.0 3.1 2.7 2.3 20.2 20.5 19.5 1.2 1.3 1.5 38.9
Wipro REDUCE 302 295 (2.2) 1,365 19.2 4,507 19 22 23 11.8 14.6 7.7 15.9 13.9 12.9 10.1 8.9 8.1 2.4 2.3 2.1 16.4 16.8 16.8 0.5 3.3 3.6 12.9
Technology Cautious 15,469 218 13.1 9.7 8.0 21.4 19.5 18.0 14.8 13.3 12.2 5.1 4.7 4.4 23.8 24.2 24.2 1.9 3.0 3.2 315.7
Telecom
Bharti Airtel ADD 384 445 15.9 1,534 21.6 3,997 (6) (4) 5 (221.5) 28.8 215.1 (66.7) (93.8) 81.5 9.9 8.3 6.6 2.3 2.4 2.4 (3.4) (2.5) 2.9 0.3 (0.2) 0.3 25.2
Bharti Infratel REDUCE 287 285 (0.7) 531 7.5 1,850 13 12 13 (4.8) (8.5) 7.7 21.9 24.0 22.2 8.1 8.6 8.1 3.3 3.3 3.2 14.6 13.7 14.6 3.7 3.4 3.6 11.6
IDEA REDUCE 49 45 (8.8) 215 3.0 4,359 (17) (17) (15) (75.6) (2.4) 11.4 (2.9) (2.9) (3.2) 34.1 28.9 18.0 1.0 1.5 2.7 (29.7) (41.1) (59.4) — — — 15.3
Tata Communications ADD 540 660 22.2 154 2.2 285 0 3 7 (77.5) 694.2 123.5 1,457 183.5 82.1 10.8 9.5 8.5 (67.1) (91.1) (1,764.5) 7.8 (42.1) (211.0) 1.2 1.4 1.4 3.7
Telecom Cautious 2,434 34 (2,384.5) 5.0 68.0 (33.9) (35.7) (111.5) 11.0 9.7 8.0 2.3 2.6 2.7 (6.9) (7.2) (2.4) 1.0 0.6 1.0 55.8
Utilities
CESC BUY 996 1,180 18.5 132 1.9 133 115 128 141 31.7 11.6 10.1 8.7 7.8 7.1 6.0 5.3 4.7 0.8 0.8 0.7 10.0 10.4 10.5 1.3 1.3 1.3 6.6
JSW Energy REDUCE 73 70 (4.0) 120 1.7 1,640 5.1 6.5 6.6 65.9 26.8 2.9 14.3 11.3 11.0 6.0 5.0 4.5 1.0 0.9 0.8 7.2 8.5 8.0 — — — 1.6
NHPC ADD 25 30 18.3 260 3.7 10,260 3.1 3.2 3.4 26.9 1.8 8.0 8.2 8.0 7.4 7.4 7.2 7.7 0.8 0.8 0.8 10.4 10.2 10.6 6.9 6.9 5.8 1.8
NTPC BUY 172 190 10.8 1,414 19.9 8,245 15 16 18 30.9 4.4 16.5 11.5 11.0 9.5 9.1 8.4 7.0 1.3 1.2 1.1 11.6 11.3 12.2 2.6 2.7 3.2 12.5
Power Grid BUY 202 250 24.1 1,054 14.9 5,232 19 21 23 19.3 13.6 7.6 10.7 9.4 8.8 7.4 6.8 6.5 1.7 1.6 1.4 17.1 17.5 17.0 3.1 3.5 3.8 23.9
Tata Power BUY 77 90 17.3 207 2.9 2,705 6.0 7.0 10.9 12.7 15.6 57.0 12.7 11.0 7.0 10.8 10.4 9.1 1.2 1.1 1.0 10.1 10.6 14.6 — — — 4.1
Utilities Attractive 3,187 45 26.0 8.8 14.1 10.9 10.0 8.8 8.1 7.5 6.8 1.3 1.2 1.1 11.9 12.0 12.5 2.8 3.0 3.2 50.5
Dividend yield (%)Mkt cap. EPS (Rs) EPS growth (%) P/E (X) EV/EBITDA (X) P/B (X) RoE (%)
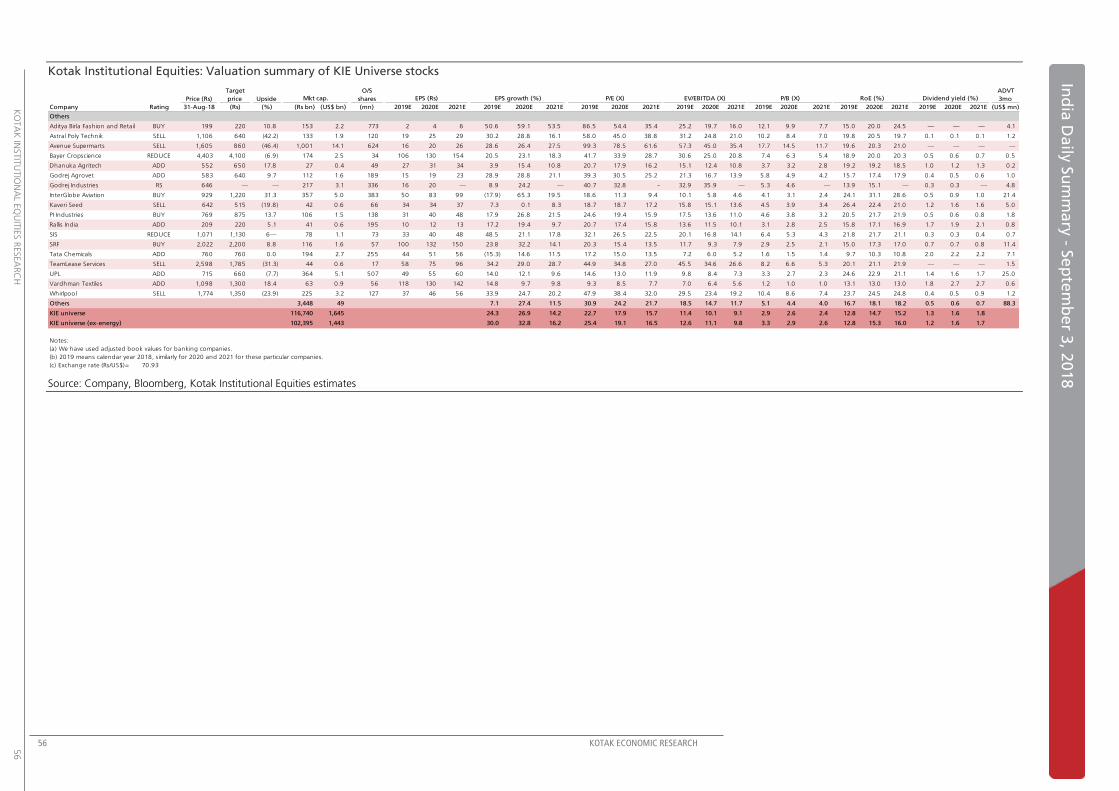
56 KOTAK ECONOMIC RESEARCH
K
OTA
K IN
STIT
UTIO
NA
L EQ
UIT
IES R
ESEA
RC
H
56
Ind
ia D
aily
Su
mm
ary
- Se
pte
mb
er 3
, 201
8
Kotak Institutional Equities: Valuation summary of KIE Universe stocks
Source: Company, Bloomberg, Kotak Institutional Equities estimates
Target O/S ADVT
Price (Rs) price Upside shares 3mo
Company Rating 31-Aug-18 (Rs) (%) (Rs bn) (US$ bn) (mn) 2019E 2020E 2021E 2019E 2020E 2021E 2019E 2020E 2021E 2019E 2020E 2021E 2019E 2020E 2021E 2019E 2020E 2021E 2019E 2020E 2021E (US$ mn)
Others
Aditya Birla Fashion and Retail BUY 199 220 10.8 153 2.2 773 2 4 6 50.6 59.1 53.5 86.5 54.4 35.4 25.2 19.7 16.0 12.1 9.9 7.7 15.0 20.0 24.5 — — — 4.1
Astral Poly Technik SELL 1,106 640 (42.2) 133 1.9 120 19 25 29 30.2 28.8 16.1 58.0 45.0 38.8 31.2 24.8 21.0 10.2 8.4 7.0 19.8 20.5 19.7 0.1 0.1 0.1 1.2
Avenue Supermarts SELL 1,605 860 (46.4) 1,001 14.1 624 16 20 26 28.6 26.4 27.5 99.3 78.5 61.6 57.3 45.0 35.4 17.7 14.5 11.7 19.6 20.3 21.0 — — — —
Bayer Cropscience REDUCE 4,403 4,100 (6.9) 174 2.5 34 106 130 154 20.5 23.1 18.3 41.7 33.9 28.7 30.6 25.0 20.8 7.4 6.3 5.4 18.9 20.0 20.3 0.5 0.6 0.7 0.5
Dhanuka Agritech ADD 552 650 17.8 27 0.4 49 27 31 34 3.9 15.4 10.8 20.7 17.9 16.2 15.1 12.4 10.8 3.7 3.2 2.8 19.2 19.2 18.5 1.0 1.2 1.3 0.2
Godrej Agrovet ADD 583 640 9.7 112 1.6 189 15 19 23 28.9 28.8 21.1 39.3 30.5 25.2 21.3 16.7 13.9 5.8 4.9 4.2 15.7 17.4 17.9 0.4 0.5 0.6 1.0
Godrej Industries RS 646 — — 217 3.1 336 16 20 — 8.9 24.2 — 40.7 32.8 - 32.9 35.9 — 5.3 4.6 — 13.9 15.1 — 0.3 0.3 — 4.8
InterGlobe Aviation BUY 929 1,220 31.3 357 5.0 383 50 83 99 (17.9) 65.3 19.5 18.6 11.3 9.4 10.1 5.8 4.6 4.1 3.1 2.4 24.1 31.1 28.6 0.5 0.9 1.0 21.4
Kaveri Seed SELL 642 515 (19.8) 42 0.6 66 34 34 37 7.3 0.1 8.3 18.7 18.7 17.2 15.8 15.1 13.6 4.5 3.9 3.4 26.4 22.4 21.0 1.2 1.6 1.6 5.0
PI Industries BUY 769 875 13.7 106 1.5 138 31 40 48 17.9 26.8 21.5 24.6 19.4 15.9 17.5 13.6 11.0 4.6 3.8 3.2 20.5 21.7 21.9 0.5 0.6 0.8 1.8
Rallis India ADD 209 220 5.1 41 0.6 195 10 12 13 17.2 19.4 9.7 20.7 17.4 15.8 13.6 11.5 10.1 3.1 2.8 2.5 15.8 17.1 16.9 1.7 1.9 2.1 0.8
SIS REDUCE 1,071 1,130 6— 78 1.1 73 33 40 48 48.5 21.1 17.8 32.1 26.5 22.5 20.1 16.8 14.1 6.4 5.3 4.3 21.8 21.7 21.1 0.3 0.3 0.4 0.7
SRF BUY 2,022 2,200 8.8 116 1.6 57 100 132 150 23.8 32.2 14.1 20.3 15.4 13.5 11.7 9.3 7.9 2.9 2.5 2.1 15.0 17.3 17.0 0.7 0.7 0.8 11.4
Tata Chemicals ADD 760 760 0.0 194 2.7 255 44 51 56 (15.3) 14.6 11.5 17.2 15.0 13.5 7.2 6.0 5.2 1.6 1.5 1.4 9.7 10.3 10.8 2.0 2.2 2.2 7.1
TeamLease Services SELL 2,598 1,785 (31.3) 44 0.6 17 58 75 96 34.2 29.0 28.7 44.9 34.8 27.0 45.5 34.6 26.6 8.2 6.6 5.3 20.1 21.1 21.9 — — — 1.5
UPL ADD 715 660 (7.7) 364 5.1 507 49 55 60 14.0 12.1 9.6 14.6 13.0 11.9 9.8 8.4 7.3 3.3 2.7 2.3 24.6 22.9 21.1 1.4 1.6 1.7 25.0
Vardhman Textiles ADD 1,098 1,300 18.4 63 0.9 56 118 130 142 14.8 9.7 9.8 9.3 8.5 7.7 7.0 6.4 5.6 1.2 1.0 1.0 13.1 13.0 13.0 1.8 2.7 2.7 0.6
Whirlpool SELL 1,774 1,350 (23.9) 225 3.2 127 37 46 56 33.9 24.7 20.2 47.9 38.4 32.0 29.5 23.4 19.2 10.4 8.6 7.4 23.7 24.5 24.8 0.4 0.5 0.9 1.2
Others 3,448 49 7.1 27.4 11.5 30.9 24.2 21.7 18.5 14.7 11.7 5.1 4.4 4.0 16.7 18.1 18.2 0.5 0.6 0.7 88.3
KIE universe 116,740 1,645 24.3 26.9 14.2 22.7 17.9 15.7 11.4 10.1 9.1 2.9 2.6 2.4 12.8 14.7 15.2 1.3 1.6 1.8
KIE universe (ex-energy) 102,395 1,443 30.0 32.8 16.2 25.4 19.1 16.5 12.6 11.1 9.8 3.3 2.9 2.6 12.8 15.3 16.0 1.2 1.6 1.7
Notes:
(a) We have used adjusted book values for banking companies.
(b) 2019 means calendar year 2018, similarly for 2020 and 2021 for these particular companies.
(c) Exchange rate (Rs/US$)= 70.93
Mkt cap. EPS (Rs) EPS growth (%) P/E (X) EV/EBITDA (X) P/B (X) RoE (%) Dividend yield (%)
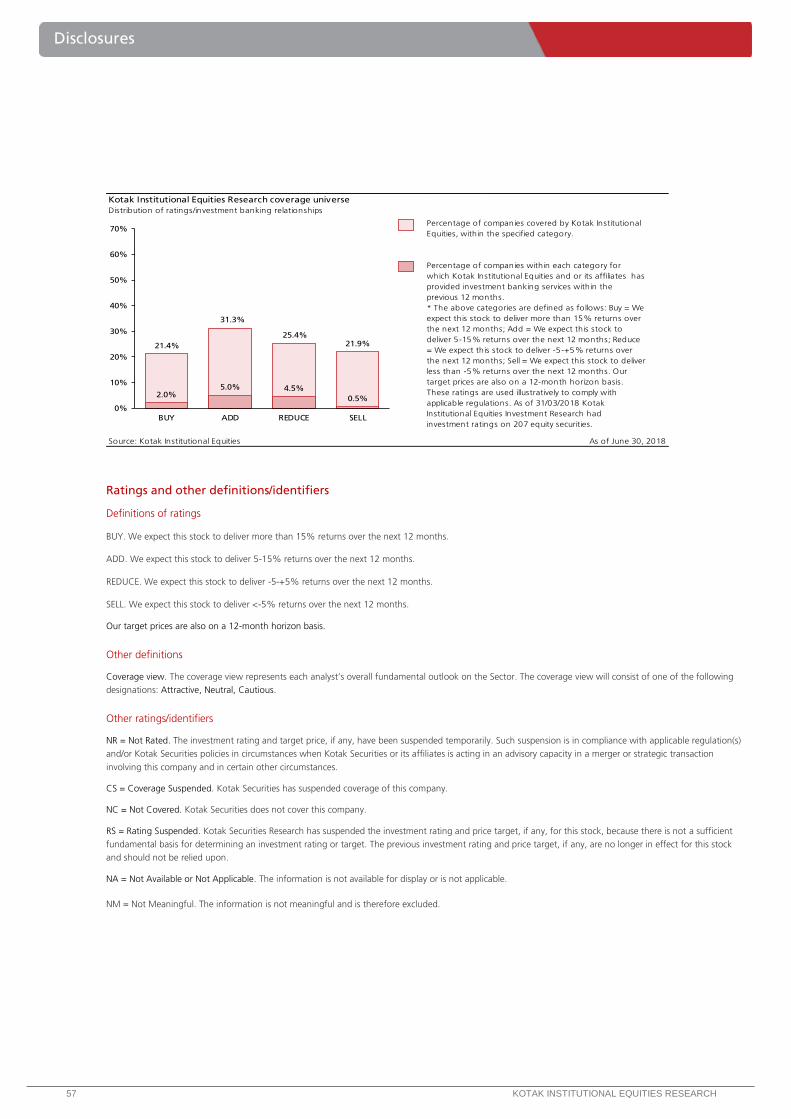
Disclo
sure
s
57 KOTAK INSTITUTIONAL EQUITIES RESEARCH
Disclosures
Ratings and other definitions/identifiers
Definitions of ratings
BUY. We expect this stock to deliver more than 15% returns over the next 12 months.
ADD. We expect this stock to deliver 5-15% returns over the next 12 months.
REDUCE. We expect this stock to deliver -5-+5% returns over the next 12 months.
SELL. We expect this stock to deliver <-5% returns over the next 12 months.
Our target prices are also on a 12-month horizon basis.
Other definitions
Coverage view. The coverage view represents each analyst’s overall fundamental outlook on the Sector. The coverage view will consist of one of the following
designations: Attractive, Neutral, Cautious.
Other ratings/identifiers
NR = Not Rated. The investment rating and target price, if any, have been suspended temporarily. Such suspension is in compliance with applicable regulation(s)
and/or Kotak Securities policies in circumstances when Kotak Securities or its affiliates is acting in an advisory capacity in a merger or strategic transaction
involving this company and in certain other circumstances.
CS = Coverage Suspended. Kotak Securities has suspended coverage of this company.
NC = Not Covered. Kotak Securities does not cover this company.
RS = Rating Suspended. Kotak Securities Research has suspended the investment rating and price target, if any, for this stock, because there is not a sufficient
fundamental basis for determining an investment rating or target. The previous investment rating and price target, if any, are no longer in effect for this stock
and should not be relied upon.
NA = Not Available or Not Applicable. The information is not available for display or is not applicable.
NM = Not Meaningful. The information is not meaningful and is therefore excluded.
Kotak Institutional Equities Research coverage universe
Distribution of ratings/investment banking relationships
Source: Kotak Institutional Equities As of June 30, 2018
Percentage of companies covered by Kotak Institutional
Equities, within the specified category.
* The above categories are defined as follows: Buy = We
expect this stock to deliver more than 15% returns over
the next 12 months; Add = We expect this stock to
deliver 5-15% returns over the next 12 months; Reduce
= We expect this stock to deliver -5-+5% returns over
the next 12 months; Sell = We expect this stock to deliver
less than -5% returns over the next 12 months. Our
target prices are also on a 12-month horizon basis.
These ratings are used illustratively to comply with
applicable regulations. As of 31/03/2018 Kotak
Institutional Equities Investment Research had
investment ratings on 207 equity securities.
Percentage of companies within each category for
which Kotak Institutional Equities and or its affiliates has
provided investment banking services within the
previous 12 months.
21.4%
31.3%
25.4%21.9%
2.0%5.0% 4.5%
0.5%
0%
10%
20%
30%
40%
50%
60%
70%
BUY ADD REDUCE SELL
Corporate Office Overseas Affiliates
Kotak Securities Ltd.
27 BKC, Plot No. C-27, “G Block”
Bandra Kurla Complex, Bandra (E)
Mumbai 400 051, India
Tel: +91-22-43360000
Kotak Mahindra (UK) Ltd
8th Floor, Portsoken House
155-157 Minories
London EC3N 1LS
Tel: +44-20-7977-6900
Kotak Mahindra Inc
369 Lexington Avenue
28th Floor, New York
NY 10017, USA
Tel:+1 212 600 8856
Copyright 2018 Kotak Institutional Equities (Kotak Securities Limited). All rights reserved.
1. Note that the research analysts contributing to this report may not be registered/qualified as research analysts with FINRA; and
2. Such research analysts may not be associated persons of Kotak Mahindra Inc and therefore, may not be subject to NASD Rule 2711 restrictions on communications with a subject company, public appearances and trading securities held by a research analyst account.
3. Any U.S. recipients of the research who wish to effect transactions in any security covered by the report should do so with or through Kotak Mahindra Inc and (ii) any transactions in the securities covered by the research by U.S. recipients must be effected only through Kotak Mahindra Inc at [email protected].
This report is distributed in Singapore by Kotak Mahindra (UK) Limited (Singapore Branch) to institutional investors, accredited investors or expert investors only as defined under the Securities and Futures Act. Recipients of this analysis / report are to contact Kotak Mahindra (UK) Limited (Singapore Branch) (16 Raffles Quay, #35-02/03, Hong Leong Building, Singapore 048581) in respect of any matters arising from, or in connection with, this analysis / report. Kotak Mahindra (UK) Limited (Singapore Branch) is regulated by the Monetary Authority of Singapore. Kotak Securities Limited and its affiliates are a full-service, integrated investment banking, investment management, brokerage and financing group. We along with our affiliates are leading underwriter of securities and participants in virtually all securities trading markets in India. We and our affiliates have investment banking and other business relationships with a significant percentage of the companies covered by our Investment Research Department. Our research professionals provide important input into our investment banking and other business selection processes. Investors should assume that Kotak Securities Limited and/or its affiliates are seeking or will seek investment banking or other business from the company or companies that are the subject of this material and that the research professionals who were involved in preparing this material may participate in the solicitation of such business. Our research professionals are paid in part based on the profitability of Kotak Securities Limited, which include earnings from investment banking and other business. Kotak Securities Limited generally prohibits its analysts, persons reporting to analysts, and members of their households from maintaining a financial interest in the securities or derivatives of any companies that the analysts cover. Additionally, Kotak Securities Limited generally prohibits its analysts and persons reporting to analysts from serving as an officer, director, or advisory board member of any companies that the analysts cover. Our salespeople, traders, and other professionals may provide oral or written market commentary or trading strategies to our clients that reflect opinions that are contrary to the opinions expressed herein, and our proprietary trading and investing businesses may make investment decisions that are inconsistent with the recommendations expressed herein. Kotak Securities Limited has two independent equity research groups: Institutional Equities and Private Client Group. This report has been prepared by the Institutional Equities Research Group of Kotak Securities Limited. The views and opinions expressed in this document may or may not match or may be contrary with the views, estimates, rating, target price of the Private Client Group. In reviewing these materials, you should be aware that any or all of the foregoing, among other things, may give rise to real or potential conflicts of interest. Additionally, other important information regarding our relationships with the company or companies that are the subject of this material is provided herein. This material should not be construed as an offer to sell or the solicitation of an offer to buy any security in any jurisdiction where such an offer or solicitation would be illegal. We are not soliciting any action based on this material. It is for the general information of clients of Kotak Securities Limited. It does not constitute a personal recommendation or take into account the particular investment objectives, financial situations, or needs of individual clients. Before acting on any advice or recommendation in this material, clients should consider whether it is suitable for their particular circumstances and, if necessary, seek professional advice. The price and value of the investments referred to in this material and the income from them may go down as well as up, and investors may realize losses on any investments. Past performance is not a guide for future performance, future returns are not guaranteed and a loss of original capital may occur. Kotak Securities Limited does not provide tax advise to its clients, and all investors are strongly advised to consult with their tax advisers regarding any potential investment. Certain transactions -including those involving futures, options, and other derivatives as well as non-investment-grade securities - give rise to substantial risk and are not suitable for all investors. The material is based on information that we consider reliable, but we do not represent that it is accurate or complete, and it should not be relied on as such. Opinions expressed are our current opinions as of the date appearing on this material only. We endeavor to update on a reasonable basis the information discussed in this material, but regulatory, compliance, or other reasons may prevent us from doing so. We and our affiliates, officers, directors, and employees, including persons involved in the preparation or issuance of this material, may from time to time have "long" or "short" positions in, act as principal in, and buy or sell the securities or derivatives thereof of companies mentioned herein. Kotak Securities Limited and its non US affiliates may, to the extent permissible under applicable laws, have acted on or used this research to the extent that it relates to non US issuers, prior to or immediately following its publication. Foreign currency denominated securities are subject to fluctuations in exchange rates that could have an adverse effect on the value or price of or income derived from the investment. In addition, investors in securities such as ADRs, the value of which are influenced by foreign currencies affectively assume currency risk. In addition options involve risks and are not suitable for all investors. Please ensure that you have read and understood the current derivatives risk disclosure document before entering into any derivative transactions. Kotak Securities Limited established in 1994, is a subsidiary of Kotak Mahindra Bank Limited. Kotak Securities is one of India's largest brokerage and distribution house. Kotak Securities Limited is a corporate trading and clearing member of BSE Limited (BSE), National Stock Exchange of India Limited (NSE), MSEI a. Our businesses include stock broking, services rendered in connection with distribution of primary market issues and financial products like mutual funds and fixed deposits, depository services and Portfolio Management. Kotak Securities Limited is also a depository participant with National Securities Depository Limited (NSDL) and Central Depository Services (India) Limited (CDSL). Kotak Securities Limited is also registered with Insurance Regulatory and Development Authority as Corporate Agent for Kotak Mahindra Old Mutual Life Insurance Limited and is also a Mutual Fund Advisor registered with Association of Mutual Funds in India (AMFI). Kotak Securities Limited is registered as a Research Analyst under SEBI (Research Analyst) Regulations, 2014. We hereby declare that our activities were neither suspended nor we have defaulted with any stock exchange authority with whom we are registered in last five years. However SEBI, Exchanges and Depositories have conducted the routine inspection and based on their observations have issued advise letters or levied minor penalty on KSL for certain operational deviations. We have not been debarred from doing business by any Stock Exchange / SEBI or any other authorities; nor has our certificate of registration been cancelled by SEBI at any point of time. We offer our research services to primarily institutional investors and their employees, directors, fund managers, advisors who are registered with us Details of Associates are available on our website i.e. www.kotak.com Research Analyst has served as an officer, director or employee of subject company(ies): No We or our associates may have received compensation from the subject company(ies) in the past 12 months. We or our associates have managed or co-managed public offering of securities for the subject company(ies) in the past 12 months. YES We or our associates may have received compensation for investment banking or merchant banking or brokerage services from the subject company(ies) in the past 12 months. We or our associates may have received any compensation for products or services other than investment banking or merchant banking or brokerage services from the subject company(ies) in the past 12 months. We or our associates may have received compensation or other benefits from the subject company(ies) or third party in connection with the research report. Our associates may have financial interest in the subject company(ies). Research Analyst or his/her relative's financial interest in the subject company(ies): No Kotak Securities Limited has financial interest in the subject company(ies) at the end of the month immediately preceding the date of publication of Research Report: YES Our associates may have actual/beneficial ownership of 1% or more securities of the subject company(ies) at the end of the month immediately preceding the date of publication of Research Report. Research Analyst or his/her relatives has actual/beneficial ownership of 1% or more securities of the subject company(ies) at the end of the month immediately preceding the date of publication of Research Report: No Kotak Securities Limited has actual/beneficial ownership of 1% or more securities of the subject company(ies) at the end of the month immediately preceding the date of publication of Research Report: No Subject company(ies) may have been client during twelve months preceding the date of distribution of the research report. A graph of daily closing prices of securities is available at www.nseindia.com and http://economictimes.indiatimes.com/markets/stocks/stock-quotes. (Choose a company from the list on the browser and select the"three years" icon in the price chart). Kotak Securities Limited. Registered Office: 27 BKC, C 27, G Block, Bandra Kurla Complex, Bandra (E), Mumbai 400051. CIN: U99999MH1994PLC134051, Telephone No.: +22 43360000, Fax No.: +22 67132430. Website: www.kotak.com / www.kotaksecurities.com. Correspondence Address: Infinity IT Park, Bldg. No 21, Opp. Film City Road, A K Vaidya Marg, Malad (East), Mumbai 400097. Telephone No: 42856825. SEBI Registration No: NSE INB/INF/INE 230808130, BSE INB 010808153/INF 011133230, MSE INE 260808130/INB 260808135/INF 260808135, AMFI ARN 0164, PMS INP000000258 and Research Analyst INH000000586. NSDL/CDSL: IN-DP-NSDL-23-97. Compliance Officer Details: Mr. Manoj Agarwal. Call: 022 - 4285 8484, or Email: [email protected]. Investments in securities market are subject to market risks, read all the related documents carefully before investing. In case you require any clarification or have any concern, kindly write to us at below email ids: Level 1: For Trading related queries, contact our customer service at ‘[email protected]’ and for demat account related queries contact us at [email protected] or call us on:
Toll free numbers 18002099191 / 1800222299 and 18002099292 Level 2: If you do not receive a satisfactory response at Level 1 within 3 working days, you may write to us at [email protected] or call us on 022-42858445 and if you feel you are
still unheard, write to our customer service HOD at [email protected] or call us on 022-42858208. Level 3: If you still have not received a satisfactory response at Level 2 within 3 working days, you may contact our Compliance Officer (Name: Mr. Manoj Agarwal) at
[email protected] or call on 91- (022) 4285 8484.
Level 4: If you have not received a satisfactory response at Level 3 within 7 working days, you may also approach CEO (Mr. Kamlesh Rao) at [email protected] or call on 91-(022) 4285 8301.
First Cut notes published on this site are for information purposes only. They represent early notations and responses by analysts to recent events. Data in the notes may not have been verified by us and investors should not act upon any data or views in these notes. Most First Cut notes, but not necessarily all, will be followed by final research reports on the subject. There could be variance between the First cut note and the final research note on any subject, in which case the contents of the final research note would prevail. We accept no liability for the contents of the First Cut Notes.
For further disclosure please view https://kie.kotak.com/kinsite/index.php