india and the wto - world bank
TRANSCRIPT

India and the WTO


Aaditya Mattoo and Robert M. Stern,
Editors
A copublication of the World Bankand Oxford University Press
India and the WTO
© 2003 The International Bank for Reconstruction and Development / The World Bank
1818 H Street, NW
Washington, DC 20433
Telephone 202-473-1000
Internet www.worldbank.org
E-mail [email protected]
All rights reserved.
1 2 3 4 06 05 04 03
A copublication of the World Bank and Oxford University Press.
The findings, interpretations, and conclusions expressed here are those of the author(s) and do not
necessarily reflect the views of the Board of Executive Directors of the World Bank or the governments
they represent.
The World Bank cannot guarantee the accuracy of the data included in this work. The boundaries,
colors, denominations, and other information shown on any map in this work do not imply on the
part of the World Bank any judgment of the legal status of any territory or the endorsement or accept-
ance of such boundaries.
Rights and Permissions
The material in this work is copyrighted. No part of this work may be reproduced or transmitted in
any form or by any means, electronic or mechanical, including photocopying, recording, or inclusion
in any information storage and retrieval system, without the prior written permission of the World
Bank. The World Bank encourages dissemination of its work and will normally grant permission
promptly.
For permission to photocopy or reprint, please send a request with complete information to the
Copyright Clearance Center, Inc., 222 Rosewood Drive, Danvers, MA 01923, USA, telephone 978-750-
8400, fax 978-750-4470, www.copyright.com.
All other queries on rights and licenses, including subsidiary rights, should be addressed to the
Office of the Publisher, World Bank, 1818 H Street NW, Washington, DC 20433, fax 202-522-2422,
e-mail [email protected].
ISBN 0-8213-5410-8
ISSN 1727-3455
Library of Congress Cataloging-in-Publication data has been applied for.
Cover photo credit: AFP/CORBIS.
A textile worker puts a thread through an embroidery machine on display at Garmentech Interna-
tional 2000, a garment technology trade fair in New Delhi billed as Asia’s largest-ever such fair.

Preface xi
1 Introduction and Overview 1Aaditya Mattoo and Robert M. Stern
2 Computational Analysis of the Impact on India of the Uruguay Round and the Doha Development Agenda Negotiations 13Rajesh Chadha, Drusilla K. Brown,
Alan V. Deardorff, and Robert M. Stern
3 Implications of Multifibre Arrangement Abolition for India and South Asia 47Sanjay Kathuria, Will J. Martin,
and Anjali Bhardwaj
4 Services Issues and Liberalization in the Doha Development Agenda Negotiations: A Case Study of India 67Rajesh Chadha
5 Telecommunications Policy Reform in India 81Rajat Kathuria, Harsha Vardhana Singh,
and Anita Soni
6 Economic Impact of Foreign Direct Investment in South Asia 117Pradeep Agrawal
7 An Indian Perspective on WTO Rules on Foreign Direct Investment 141Satya P. Das
v
Contents

8 India as User and Creator of Intellectual Property: The Challenges Post-Doha 169Arvind Subramanian
9 Trade, Investment, and Competition Policy: An Indian Perspective 197Aditya Bhattacharjea
10 India’s Accession to the Government Procurement Agreement: Identifying Costs and Benefits 235Vivek Srivastava
11 Technical Barriers to Trade and the Role of Indian Standard-Setting Institutions 269Mohammed Saqib
12 Trade and Environment: Doha and Beyond 299Veena Jha
13 India and the Multilateral Trading System Post-Doha: Defensive or Proactive? 327Aaditya Mattoo and Arvind Subramanian
Contributors 367
Index 369
Figures3.1 Market Equilibrium in the Absence of Quotas 49
3.2 Market Equilibrium in the Presence of Quotas 49
6.1 Inflows of FDI as Percent of GDP 121
8.1 Data on Patenting in the United States for Selected
Developing Countries, 1985–98 189
9.1 Distribution of Merger Activity, 1973–74 to 2000–01 208
11.1 BIS Organizational Hierarchy 282
11.2 BIS Notification Procedure 283
13.1 India’s Share in World Imports and Exports 328
13.2 Cross-Country Comparison of Average Tariff Rates 336
13.3 Exports of India and Mexico to the North American
Market, 1990–2001 339
13.4 Comparison of International Long-Distance Tariffs
(Telecom) for Selected Asian Countries, 2002 347
13.5 Estimated Transport Cost Margins for Exports
of Textiles to the United States, Using Singapore
as a Benchmark, 2000 348
vi Contents

Tables2.1 India: Tariff Structure, 1990–91 to 1997–98 16
2.2 India: Tariffs by Products, Average Import-Weighted
Rates, 1990–98 17
2.3 India: Bound Tariff Rates and Applied Rates of Duty 18
2.4 Economies and Regions of the Model 21
2.5 Sectors of Production 22
2.6 Summary Results of the Uruguay Round: Change
in Imports, Exports, Terms of Trade, Welfare,
and the Real Return to Labor and Capital 24
2.7 Summary Results of the Doha Development Agenda
Negotiations: Change in Imports, Exports,
Terms of Trade, Welfare, and the Real Return
to Capital and Labor 31
2.8 Sectoral Results of the Uruguay Round
Negotiations (UR-3): Change in Exports, Imports,
Output, Scale, and Employment in India 39
2.9 Sectoral Results of the Doha Development Agenda
Negotiations (DR-4): Change in Exports, Imports,
Output, Scale, and Employment in India 40
2.10 Impact of Multilateral and Unilateral Trade
Liberalization for India 42
3.1 Export-Tax Equivalents for Indian Garment
Exports to the United States and the
European Union 53
3.2 India: Welfare Effects of Reforms That Raise Labor
Productivity in Clothing Sectors, 1992 55
4.1 Trade in Services by Mode of Supply 70
4.2 Protection in India, 1997–98 72
4.3 Sectoral Effects for India of Doha Development
Agenda Services Liberalization 75
5.1 Subscriber Base, Basic Services 83
5.2 List of Basic Service Providers and Their Areas
of Operation 84
5.3 Subscriber Base, Cellular Services 85
5.4 List of Cellular Service Providers and Their Areas
of Operation 87
5.5 Telecommunications Market Structure 88
5.6 Revenue Contribution by Different Subscriber Groups 95
6.1 Foreign Direct Investment Approvals, 1991–2000:
Share of Major Investing Economies 122
6.2 Foreign Direct Investment Approvals, August 1991
to March 2000: Share by Industry 124
Contents vii
6.3 Impact of FDI Inflows on Investment Rate (Net of FDI)
for South Asia, 1965–96, Ordinary Least Squares
Panel Estimation (Fixed-Effects Model) 129
6.4 Impact of FDI Inflows on Investment Rate (Net of FDI)
for South Asia, Four Different Time Periods, Ordinary
Least Squares Panel Estimation (Fixed-Effects Model) 130
6.5 Impact of FDI Inflows on GDP Growth in South Asia,
1965–96, Ordinary Least Squares Panel Estimation
(Fixed-Effects Model) 133
6.6 Impact of FDI Inflows on GDP Growth in South Asia:
Comparison of FDI Inflows and Foreign Borrowing,
1965–96, Ordinary Least Squares Panel Estimation
(Fixed-Effects Model) 134
6.7 Granger Causality Test between GDP Growth and FDI
Inflows as a Share of GDP in South Asia, 1990–96 135
7.1 FDI Policies over Time 143
7.2 Total FDI in Selected Countries, 1997–2001 149
7.3 Flow of FDI into India and Other Countries, 1997–2001 150
7.4 Inward and Outward FDI Flows as a Percentage
of Gross Fixed Capital Formation, 1997–2000 151
7.5 Inflow of FDI into India 152
7.6 Sectorwise Breakdown of FDI in India, 1991–98 153
7.7 FDI and the Growth Rate of Industrial
Production in India from December 1994
to March 1999: Regression Results 159
8.1 Data on Patenting in the United States by Selected
Countries, 1985–98 190
10.1 Central Government Expenditures, Excluding
Railways and Telecommunications 246
10.2 Estimates of Purchases by Railways 247
10.3 Estimates of Purchases by Department
of Telecommunications 248
10.4 State Government Expenditures 249
10.5 Purchases by Public Sector Enterprises 249
10.6 Consolidated Government Procurement Estimates 252
10.7 Potential Gains, Central Government Only 253
10.8 Estimates of Social Gain 254
10.A.1 Shares of Total Expenditure for Items Involving
Government Purchases 260
10.A.2 Objects of Expenditure 262
12.1 India’s Environmental Legislation 316
13.1 Summary Indicators of WTO Disputes, 1995–2001 332
13.2 Bound Tariff Rates and Effective Rates of Duty 337
viii Contents

13.3 Predictability, Responses, and Availability
of Rules and Regulations 338
13.4 Indicators of Indian Agricultural Trade 341
13.5 Antidumping Initiations by Economy Taking Action 344
13.6 Antidumping Initiations by Exporting Economy 345
13.7 Cross-Country Comparisons of Costs of
Software Services 350
13.8 GATS Commitments on Modes 1 and 2 in Selected
Service Sectors 353
13.9 Current and Recommended Negotiating
and Domestic Policy Positions for India 360
Contents ix

India’s increasing engagement in the international economy has created a growing
awareness that multilateral trade negotiations can and must be used to serve dev-
elopment goals. At the same time, India is a developing economy of key importance
in the World Trade Organization, and it played a pivotal role in the negotiation
and design of the Doha Development Agenda. The chapters in this volume are
intended to provide new information and analysis to policymakers and other
stakeholders in India, and to assist them in articulating their interests and in
developing negotiating strategies. Because the issues raised in the context of the
Doha Development Agenda are critical to both industrial and developing coun-
tries, we hope that this volume will be of much wider interest.
We would like to thank the United Kingdom government’s Department for Inter-
national Development, India’s National Council of Applied Economic Research
(NCAER), the University of Michigan, and the World Bank for their financial and
administrative support. We are also grateful to Philip English, Bernard Hoekman,
and Rakesh Mohan for their guidance on different aspects of the project; Tercan
Baysan, Ezra Benethan, Garry Pursell, Maurice Schiff, and particularly Jayanta Roy
for their valuable comments on the manuscript; Rajesh Chadha and his colleagues
at the NCAER and Malina Savova for their help in organizing the New Delhi con-
ference at which earlier versions of the articles were presented; Robb Sims for edito-
rial assistance; Judith Jackson, Santiago Pombo-Bejarano, Melissa Edeburn, and
Ilma Kramer for their assistance in producing the final manuscript, managing pro-
duction of the book, and coordinating printing of the book.
Aaditya Mattoo Robert M. Stern
The World Bank University of Michigan
June 18, 2003
preface
xi


The chapters in this volume focus on the issues of central importance in the
negotiation and design of the Doha Development Agenda, which was
approved at the WTO Ministerial Meeting held in Doha, Qatar, in November
2001, and which launched a new round of multilateral trade negotiations.1 India
played a pivotal role in the Doha meeting on its own behalf and on behalf of other
developing countries. This volume is intended especially to clarify India’s interests
in the Doha Development Agenda, which coincide in many respects with the
interests of other developing countries, and to assist in the development of nego-
tiating strategies.
The topics covered in this volume span the Doha Development Agenda and
include calculations of the economic effects on India and the other major devel-
oping and the industrial countries of the Uruguay Round negotiations and the
prospective Doha Agenda negotiations; the implications for India and other
South Asian exporting countries of abolition of the Multifibre Arrangement
(MFA); services trade liberalization; telecommunications policy reform; foreign
direct investment; intellectual property rights; competition policy; government
procurement; technical barriers to trade; trade and the environment; and an
analysis of the issues coupled with concrete proposals to inform the participation
of India in the Doha Development Agenda negotiations.
In this introduction we first provide brief summaries of the individual chapters
and then highlight the menu of negotiating and domestic policy positions and the
benefits of India’s active involvement in the Doha Agenda negotiations.
1
1
Introduction andOverview
Aaditya Mattoo and Robert M. Stern

Chapter Summaries
The chapter summaries that follow are designed to give the reader an indication of
the coverage and main conclusions of the chapters, and they may help the reader
decide which chapters to read in depth.
In Chapter 2, “Computational Analysis of the Impact on India of the Uruguay
Round and the Doha Development Agenda Negotiations,” Rajesh Chadha,
Drusilla Brown, Alan Deardorff, and Robert Stern note that the Indian economy
experienced a major transformation during the decade of the 1990s. Apart from
the impact of various unilateral economic reforms undertaken since 1991, the
economy had to reorient itself to the changing multilateral trade disciplines
within the newly written framework of the General Agreement on Tariffs and
Trade (GATT)/World Trade Organization (WTO). The unilateral policy measures
encompassed the exchange rate regime, foreign investment, external borrowing,
import licensing, import tariffs, and export subsidies. The multilateral aspect of
India’s trade policy included India’s WTO commitments regarding trade in goods
and services, trade-related investment measures, and intellectual property rights.
This chapter analyzes the economic effects of the Uruguay Round trade liberaliza-
tion and the liberalization that might be undertaken in the Doha Development
Agenda negotiations on the major industrial and developing economies and
regions, including India. India’s welfare gain is expected to be 0.68 percent of its
2005 gross domestic product (GDP) (an additional US$2.8 billion) when the
Uruguay Round scenarios are fully implemented. When the assumed liberaliza-
tion under the Doha Development Agenda is implemented, the additional welfare
gain for India is an estimated 1.7 percent ($7.0 billion). Resources there would be
allocated to such labor-intensive sectors as textiles; apparel; leather and leather
products; and food, beverages, and tobacco. These sectors would also experience
growth in output and exports. Real returns to both labor and capital would
increase in the economy, insofar as the scale effect (percent change in output per
firm) is positive for all manufacturing sectors, indicating that Indian firms have
become more efficient than they were before. Finally, even if India undertakes
unilateral trade liberalization of the order indicated in the Doha Agenda multilat-
eral scenarios, it would benefit, although less so than with multilateral liberaliza-
tion. The computational results for the other economies and regions are presented
in the chapter’s detailed tables.
In Chapter 3, “Implications of Multifibre Arrangement Abolition for India and
South Asia,” Sanjay Kathuria, Will J. Martin, and Anjali Bhardwaj provide an intro-
duction to the economics of the MFA and use available empirical evidence to exam-
ine the impact of the MFA on exports of textiles and clothing, focusing particularly
on India. A review of the basic economics of the MFA shows the discriminatory
2 India and the WTO

character of the arrangement. Although exporting countries can gain from quota
rents, much of the gain is likely to be offset by losses in exports to unrestricted
markets and by efficiency losses resulting from inability to put resources to their
best uses, or to be shared with industrial country importers. The chapter draws on
empirical work by Kathuria and Bhardwaj (1998), which uses the concept of an
export tax equivalent (ETE), to provide comprehensive estimates of the extent to
which Indian textiles and clothing exports are restricted by the MFA. It provides
new results on the magnitude of the ETEs, which suggest that they increased in
1999/00, after staying at lower levels for a couple of years.
Although the abolition of MFA quotas in 2005 will create opportunities for
India and other developing economies, it will also expose them to additional com-
petition from formerly restrained exporters. Countries that use the opportunity
to streamline their policies and improve their competitiveness are likely to
increase their gains from quota abolition, and the Indian context is used in partic-
ular to illustrate the need for a sound policy response. It is further shown that
South Asia as a whole would gain from quota abolition, although experiences may
differ depending on the nature of domestic reforms in individual countries.
In Chapter 4, “Services Issues and Liberalization in the Doha Development
Agenda Negotiations: A Case Study of India,” Rajesh Chadha notes that the Gen-
eral Agreement on Trade in Services (GATS) negotiated in the Uruguay Round is
the first multilateral agreement to provide legally enforceable rights to trade in a
wide range of services. Although very little liberalization was actually achieved in
the Uruguay Round, GATS established the institutional structure for negotiating
liberalization in the future. Chadha argues that GATS provides India and other
developing countries with an opportunity to integrate into the global economy
through adoption of more liberal policies with regard to trade in services. Both
the developing and the industrial countries would gain through liberalization of
various service sectors. Inefficiencies in the service sectors have a negative effect
on the export competitiveness of agriculture and manufacturing sectors through
forward linkages. Chadha examines salient features of India’s commitments under
GATS and a study of India’s success in software services. Unilateral moves by the
Indian Government toward liberalizing imports of computer software and hard-
ware along with facilitating the inflow of foreign direct investment into these sec-
tors during the 1990s have been the major contributors to this success.
In Chapter 5, “Telecommunications Policy Reform in India,” Rajat Kathuria,
Harsha Vardhana Singh, and Anita Soni note that telecommunications reform
policies everywhere have recognized that exposing the incumbent firm to com-
petition from new firms will positively influence the efficiency of service provi-
sion and enhance the process of telecommunications network expansion and
Introduction and Overview 3
service development. The question is no longer whether to have competition, but
how quickly competition should be ushered in and under what conditions.
Following the announcement of the National Telecom Policy, which sought
private-sector participation in the Indian telecommunications market, liberaliza-
tion was initially riddled with uncertainty. This resulted especially from jurisdic-
tional disputes between the Department of Telecom Service and the Telecom Reg-
ulatory Authority of India. This situation has now changed and more open
competition has been allowed. Clear open access and interconnection guidelines
among operators have created an enabling environment for an increase in tele-
density and a quantum expansion in reach.
Telecom technologies and services and the market structure for India’s
telecommunications sector are changing rapidly. The authors stress that telecom
policies should ensure that services provided are affordable and efficient, and
should cater to both the demand for telephony by the general public and the
demand for value-added and high-bandwidth services made possible by modern
technologies. Furthermore, policies should ensure that the transition from the
present regulatory regime be managed so that there is no conflict between the
mandates of different regulatory bodies, such as the bodies for telecom and com-
petition policy. It also must be recognized that the nature of policy planning has
changed because of the introduction of increased competition in the market.
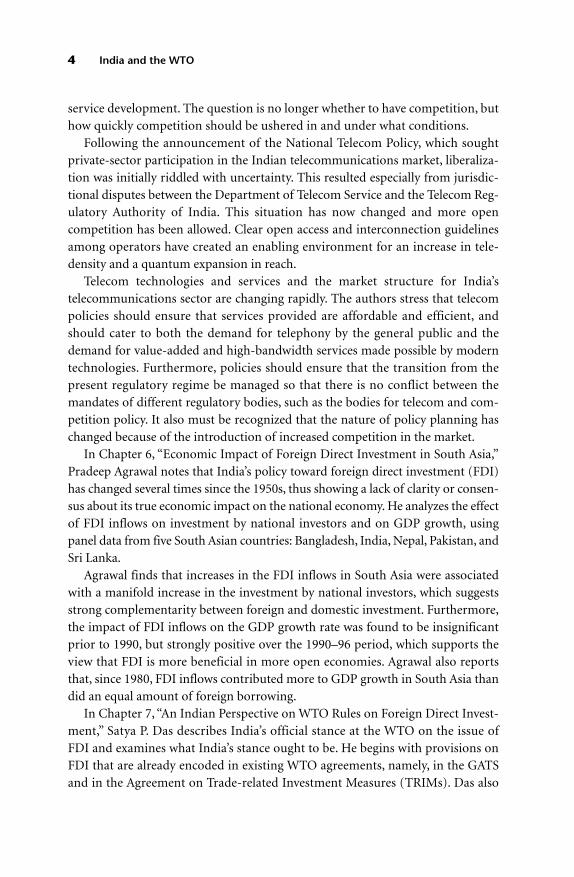
In Chapter 6, “Economic Impact of Foreign Direct Investment in South Asia,”
Pradeep Agrawal notes that India’s policy toward foreign direct investment (FDI)
has changed several times since the 1950s, thus showing a lack of clarity or consen-
sus about its true economic impact on the national economy. He analyzes the effect
of FDI inflows on investment by national investors and on GDP growth, using
panel data from five South Asian countries: Bangladesh, India, Nepal, Pakistan, and
Sri Lanka.
Agrawal finds that increases in the FDI inflows in South Asia were associated
with a manifold increase in the investment by national investors, which suggests
strong complementarity between foreign and domestic investment. Furthermore,
the impact of FDI inflows on the GDP growth rate was found to be insignificant
prior to 1990, but strongly positive over the 1990–96 period, which supports the
view that FDI is more beneficial in more open economies. Agrawal also reports
that, since 1980, FDI inflows contributed more to GDP growth in South Asia than
did an equal amount of foreign borrowing.
In Chapter 7, “An Indian Perspective on WTO Rules on Foreign Direct Invest-
ment,” Satya P. Das describes India’s official stance at the WTO on the issue of
FDI and examines what India’s stance ought to be. He begins with provisions on
FDI that are already encoded in existing WTO agreements, namely, in the GATS
and in the Agreement on Trade-related Investment Measures (TRIMs). Das also
4 India and the WTO
summarizes the views of various member countries, including India, toward FDI
provisions in the WTO, as expressed in documents submitted to the WTO Decem-
ber 1999 (Seattle) and November 2001 (Doha) meetings.
Das reviews India’s FDI policies since its independence from British rule in
1947, with an emphasis on recent policy changes. He documents data on FDI
flows into India relative to other Southeast Asian countries, noting that FDI into
India entered a phase of absolute decline from 1997 to 2000. The only other coun-
try that witnessed a decline in FDI in his sample countries is Malaysia. Malaysia,
however, was hit by currency crises whereas India was not. Thus this phase of
India’s inward FDI should worry policymakers. India’s FDI reforms are obviously
not sufficient to attract foreign firms in increasing numbers. Das outlines the wel-
fare gains from FDI inflows as well as the gains from technology transfer gains
from FDI and the possible losses in terms of adverse effects on domestic entrepre-
neurship, the environment, and so forth. He briefly reviews the empirical evidence
on the effects of FDI on a host country and on India in particular. After weighing
the benefits and costs of FDI and the history of policy discretion by Indian policy-
makers, Das concludes that India should be forthcoming toward multilateral rules
on FDI. This is very different from—indeed opposite of—the official position of
India toward the WTO and FDI.
In Chapter 8, “India as User and Creator of Intellectual Property: The Chal-
lenges Post-Doha,” Arvind Subramanian notes that although external pressure to
change intellectual property (IP) regimes has abated, India faces other challenges
not only as a net user and importer but as a potential net creator of IP. He outlines
the responses to five future challenges. First, India should consider revising its draft
IP legislation so that Trade-Related Aspects of Intellectual Property Rights (TRIPS)
obligations can serve as a mechanism for enforcing its market access rights in the
WTO. Second, compulsory licensing and competition policy regimes need to be
implemented expeditiously to mitigate some of the most egregious effects of
TRIPS. Third, India should seek changes in the TRIPS agreement to enable it to
contribute to significant public health crises, such as the AIDS crisis in Africa.
Fourth, India needs to identify where its interests lie in relation to the new tech-
nologies (i.e., plants, biotechnology), and appropriately to adapt IP rights legisla-
tion as well as complementary institutions that would allow the benefits of these
technologies to be harnessed while minimizing attendant risks. Finally, establishing
workable domestic systems for protecting intellectual property and resources cre-
ated in India would serve as a basis for seeking their replication internationally.
In Chapter 9, “Trade, Investment, and Competition Policy: An Indian Perspec-
tive,” Aditya Bhattacharjea notes that the interaction among trade, investment,
and competition policies is a relative newcomer on the WTO agenda. Two work-
ing groups were set up by the 1996 Singapore Ministerial Conference to study
Introduction and Overview 5

the issues, and the issues studied by the working groups may well be on the nego-
tiating agenda after the next ministerial conference in September 2003. In a par-
allel development, the Indian Parliament recently passed a new competition law
to replace the 1969 Monopolies and Restrictive Trade Practices (MRTP) Act.
Bhattacharjea undertakes an integrated review of the international debate and
India’s new and old legislation, in light of the theoretical literature on trade policy
under imperfect competition and recent empirical research in India. He surveys
merger trends and the regulation of anticompetitive conduct and points out the
ineffectiveness of many MRTP provisions, the long delays in rendering judg-
ments, the existence of other government policies that encourage price-fixing, and
the apparent absence of exclusionary vertical arrangements that would impede
market access to imports. He also notes that some Indian industries have found
MRTP injunctions against alleged predatory pricing by foreign producers easier
to obtain and more effective than antidumping remedies.
Contesting the conventional wisdom that more competition is always better,
Bhattacharjea reviews some theoretical results on welfare-decreasing domestic
and foreign entry under oligopoly, and points to indirect Indian evidence that lib-
eralization of entry barriers in conjunction with tardy trade liberalization might
have caused fragmentation of industrial capacities and inefficient investment
decisions. He shows that the Indian approach to predatory pricing has ignored
some basic conceptual issues, allowing it to be used for protectionist purposes.
Finally, he examines the provisions of the new Indian Competition Act and sug-
gests a course of action for India both domestically and at the WTO. This course
of action involves implementing the act in phases; building technical expertise;
carefully scrutinizing cartels, entry, and mergers involving foreign firms; and tak-
ing a more relaxed attitude to domestic mergers. Consequently he makes a case for
resisting the national treatment clause in possible multilateral agreements on
investment and competition.
In Chapter 10, “India’s Accession to the Government Procurement Agreement:
Identifying Costs and Benefits,” Vivek Srivastava notes that the Government Pro-
curement Agreement (GPA) is a plurilateral agreement with 27 signatories, and
that 18 WTO members have observer status. There are two potential sources of
benefits for the signatories to the GPA. One is through better market access and
gains from trade, and the second is through the cost savings and quality gains
likely to result from the procurement disciplines imposed by the agreement. It
appears that India is willing to negotiate an agreement on transparency in govern-
ment procurement, but it is opposed to the extension of this to a market access
agreement. Even with respect to this limited agenda, a major problem is the inclu-
sion of state governments and public sector undertakings within the ambit of the
agreement. Although this has not been documented (most likely, not calculated),
6 India and the WTO

implicit in this decision is the assumption that the costs of entering into an agree-
ment like the existing GPA, and of including state governments and public enter-
prises in a transparency agreement, outweigh the possible benefits.
Srivastava describes the important features of the GPA, compares them with
Indian procurement practices, and discusses the possible costs of switching to the
GPA disciplines. He provides some estimates of benefit to India on the assump-
tion that gains from market access are likely to be small and that the only signifi-
cant source of gain is from the potential saving of government resources resulting
from better procurement practices. Thus he focuses on the direct gains that could
accrue exclusively as a result of reduced domestic procurement costs resulting
from the disciplines imposed by the GPA. His estimates reveal that benefits could
range from approximately Rs. 80 billion (US$1.7 billion) if only the central gov-
ernment is included, to approximately Rs. 105 billion (US$2.3 billion) if state gov-
ernments are also included—a significant 0.4 percent to 0.5 percent of GDP.
Although there may be some costs resulting from the possible misuse or overuse
of the domestic review provision, the costs of switching over to the GPA disci-
plines are likely to be small. Srivastava concludes, therefore, that at the very least
India should have no hesitation in negotiating a transparency agreement and
would benefit from it.
In Chapter 11, “Technical Barriers to Trade and the Role of Indian Standard-
Setting Institutions,” Mohammed Saqib notes that the Sanitary and Phytosanitary
(SPS) Agreement and the Technical Barriers to Trade (TBT) Agreement (which
relate to the development or application of standards-related measures that affect
trade) define the international rights and obligations of WTO member countries.
These agreements are based on the principle that countries have a right to adopt
and apply standards-related measures as long as they do not restrict international
trade more than is necessary or unavoidable.
Despite growing concerns that certain technical or phytosanitary measures
may be inconsistent with WTO provisions and may unfairly impede exports, the
Indian Government is not well positioned to address these issues. Trade associa-
tions and key government officials face difficulty in defining the nature and scope
of the problem that these measures could create for India’s exports, partly because
of the complex nature of the issues themselves. The preliminary evidence indi-
cates that exports of a broad range of commodities could be affected, which could
result in a variety of negative trade effects.
Although the Indian Government’s approach to addressing the SPS and TBT
measures has been improving, it still has many weaknesses. Even though a num-
ber of government, quasi-government, trade, regulatory, and research entities
have some responsibility for addressing SPS and TBT measures, no single entity
exists for providing direction and coordination to their overall efforts. As a result
Introduction and Overview 7

these entities find it difficult to coordinate their activities because their roles are
not clearly defined. There is no composite evaluation process so the government
entities lack comprehensive data on the measures being addressed and on the
progress that has been made.
India’s participation and coordination with international standard-setting sys-
tems (e.g., ISO/CODEX) apparently has been poor. Domestically there are multi-
ple standards, laboratories are ill equipped, implementation authorities are
understaffed, and the regulatory system is complex. There is a dire need to
upgrade the whole system, and that will require financial and technical support at
the international level.
In Chapter 12, “Trade and Environment: Doha and Beyond,” Veena Jha notes
that enhancing understanding and strengthening policy coordination in the areas
of trade, environment, and development are of key interest to India and other
developing countries. Doing so has become particularly relevant since the begin-
ning of the 1990s for several domestic and external reasons, including the eco-
nomic liberalization policy that India has followed since 1991, the increasing
importance of the environment as a factor influencing market access and export
competitiveness, and the inclusion of environment on the international trade
agenda of the WTO. The Doha Declaration has brought trade and environment
within the realm of negotiations in the WTO, so it is even more urgent to develop
expertise on this issue to safeguard India’s national interest.
India has followed a defensive agenda on trade and environment, strongly
resisting calls for mainstreaming environment in WTO negotiations and for
changes in WTO rules to make allowances for environmental standards. On the
other hand, India has advocated changes in TRIPS to accommodate the environ-
ment and has advocated that safeguards in existing agreements be tightened fur-
ther to ensure that measures taken for environmental reasons are not used against
its trade interests. Although the Doha Declaration takes account of some of its
interests, there are several issues (such as ecolabeling) on which India did not wish
to see any negotiations.
Although the new negotiating agenda may not be entirely in India’s interest,
India has to build capacity and identify specific issues on which it can derive some
benefit. In this process of give and take, capacity building and expertise building
are of key importance. Jha concludes by providing some details of the specific
issues on which India needs to build capacity.
In Chapter 13,“India and the Multilateral Trading System Post-Doha: Defensive
or Proactive?”Aaditya Mattoo and Arvind Subramanian argue that India and other
developing countries should engage more actively in the multilateral trading sys-
tem. The argument is based on four reasons. First, engagement can facilitate
domestic reform and enhance access for India’s exports. India is now at a critical
8 India and the WTO

juncture. It is an increasingly willing reformer, but is confronted by domestic
opposition to reform. At the same time, market access remains impeded in areas of
major export interest. Multilateral engagement pits these two elements against each
other constructively. On the one hand, domestic reform would be helped if the
government could demonstrate that there were payoffs in terms of increased access
abroad. The gainers from the increased access—whether exporters of textiles, soft-
ware, professional services, or other products—could represent a countervailing
voice to groups that resist reform. On the other hand, the need to demonstrate
external payoffs to secure greater openness at home makes India a credible bar-
gainer and could help induce trading partners to open their own markets.
Second, engagement can serve as a commitment to good policies. The experi-
ence of unconstrained choices in Indian trade policy has not been salutary. Exter-
nal commitments can foster good policies in two respects: providing guarantees
against reversal of current policies and credibly promising future reform. For
instance, in recent years India has reversed some of its tariff liberalization, which
could have been prevented by more meaningful tariff bindings. India also failed in
services sectors to take advantage of multilateral commitments to lend credibility
to future reform programs. Such precommitment can help strike a balance
between reluctance to unleash competition immediately and desire not to be con-
strained by the weakness of domestic industry or the influence of vested interests.
Third, engagement can serve as a means of securing market access rights that
have been established. In a situation of asymmetric power, a rules-based system
protects the weaker party, albeit imperfectly. The WTO dispute-settlement system
thus far has enabled developing countries to enforce their rights. Although this
experience affords some comfort, there is increasing concern that the required
elimination of quotas on textiles and clothing may not happen on time and may
be difficult to enforce. Mattoo and Subramanian argue that in such an eventuality
India can enforce its rights by threatening to wield an effective retaliatory weapon:
withdrawing its TRIPS obligations.
Fourth, multilateral engagement can serve as a bulwark against regionalism.
The proliferation of regional agreements is having a serious if unrecognized
impact on India’s trade. A particularly stark example relates to the potential trade
diversion consequences of the North American Free Trade Agreement. India has a
strong interest in multilateral tariff reduction to neutralize this policy-induced
disadvantage.
Overall, the value of multilateral engagement might be limited if prospects for
securing increased market access are dim. But with the conclusion of the WTO
Ministerial Meeting in Doha and the launching of a new round of multilateral
trade negotiations in 2002, Mattoo and Subramanian conclude that the challenge
for India is to open its markets in return for improved access. Success in this
Introduction and Overview 9

regard is not ensured, but its chances can be improved if India aligns itself with
countries that press for sound open policies.
The Negotiating and Domestic Policy Positions of India
In Chapter 13 Mattoo and Subramanian review the major challenges that India
faces in designing and implementing their domestic and external policies in the
context of their engagement in the Doha Development Agenda negotiations. In
their table 13.9, they recommend the following strategies:2
• Industrial tariffs—Reduce own bound and actual tariffs and seek to reduce tar-
iffs in other countries, especially in textiles, clothing, and footwear.
• Agriculture—End domestic policies that discriminate against agriculture. Push
for liberalization on a global basis and consider joining the Cairns group.
• Services—Further domestic liberalization, emphasizing competition more
than a change of ownership, and greater use of the GATS to precommit to
future liberalization. Create intermodal negotiating linkages to enhance the
scope for export of services through greater mobility of labor and capital.
Strengthen domestic regulations and push for stronger multilateral disciplines
on regulatory barriers to trade.
• Electronic commerce—The current WTO decision on duty-free treatment has
little meaning because quotas and discriminatory internal taxation are still
permitted in many cases. Therefore, widen and deepen the scope of cross-
border supply commitments under the GATS on market access (prohibiting
quotas) and national treatment (prohibiting discriminatory taxation) to
ensure that current openness continues in areas of export interest, such as
software and business services.
• TRIPS—Change IP legislation to ensure that TRIPS benefits can be withdrawn
in the event of noncompliance by partners with commitments that affect
India’s exports adversely. Institute workable systems for protecting traditional
knowledge domestically to seek the replication of such systems internationally.
Use new competition policy and judicious compulsory licensing to mitigate
the egregious effects of the TRIPS agreement.
• Preferential agreements—Argue for the inclusion of a compensation provision
for third countries adversely affected by trade diversion.
• Competition policy—Strengthen the implementation of new competition law
and be open to the development of meaningful multilateral disciplines, which
ideally also would cover antidumping and international cartels.
10 India and the WTO

• Standards—Strengthen disciplines on mutual recognition agreements to
ensure that they are nondiscriminatory. Push for multilateral disciplines on
domestic regulations in goods and services based on the necessity test. Improve
domestic standards. On labor standards, be proactive in the International
Labour Organisation while resisting attempts to bring the issue into the WTO.
• Government procurement—Be open to creation of multilateral disciplines, but
link them to the elimination of barriers to trade in goods and services so that
foreign procurement contracts can be contested in areas of comparative advan-
tage, such as labor services.
• Investment—Be willing to discuss multilateral disciplines, but examine the case
for preserving discretion beyond that provided by a strengthened competition
policy.
• Antidumping—Curtail domestic use of antidumping. Argue for drastic reform
of multilateral antidumping rules to eliminate current protectionist use, ideally
by subjecting the rules to competition policy.
In the final analysis, India’s engagement in the Doha Development Agenda
negotiations and the associated changes in domestic and external policies needed
to achieve its objectives will require the strong and consistent backing of govern-
ment and political parties and leaders. Many of the issues and requisite policies
are fairly clear, whereas others require greater analysis and engagement by stake-
holders and researchers. The main question, however, is whether the variegated
domestic interests are able to coalesce and support a proactive rather than a
defensive posture under the Doha Agenda.
Endnotes
1. The text of the Ministerial Declaration of the Doha Ministerial Conference is available at
www.wto.org.
2. In this connection see also Srinivasan (2001) and Panagariya (2002).
References
Kathuria, Sanjay, and A. Bhardwaj. 1998. “Export Quotas and Policy Constraints in the Indian Tex-
tile and Garment Industries.” Policy Research Working Paper 2012. World Bank, Policy Research
Department, Washington, D.C.
Panagariya, Arvind. 2002. “India at Doha: Retrospect and Prospect.” Economic and Political Weekly
37(January 26): 279–84.
Srinivasan, T. N. 2001. “India’s Reform of External Sector Policies and Future Multilateral Trade
Negotiations.” Discussion Paper 830 (June). Yale University, Economic Growth Center, New Haven,
Connecticut.
Introduction and Overview 11


The Indian economy experienced a major transformation during the decade
of the 1990s. Apart from the effects of various unilateral economic reforms
undertaken since 1991, the economy has had to reorient itself to the chang-
ing multilateral trade discipline within the newly written framework of the General
Agreement on Tariffs and Trade (GATT) and the World Trade Organization
(WTO). The unilateral policy measures have encompassed exchange-rate policy,
foreign investment, external borrowing, import licensing, import tariffs, and
export subsidies. The multilateral aspect of India’s trade policy pertains to India’s
WTO commitments with regard to trade in goods and services, trade-related
investment measures, and intellectual property rights.
13
2
ComputationalAnalysis of the Impact
on India of theUruguay Round
and the DohaDevelopment Agenda
Negotiations
Rajesh Chadha, Drusilla K. Brown,Alan V. Deardorff, and Robert M. Stern
This chapter is an outgrowth of a collaborative program of computable general equilibrium modeling
research that began in 1994 between the National Council of Applied Economic Research (NCAER),
New Delhi, and the University of Michigan (UM), Ann Arbor. We would like to express our gratitude to
S. L. Rao and Rakesh Mohan for active and sustained support of the NCAER-UM collaborative research
effort. Special thanks are due to K. L. Krishna, Arvind Panagariya, V. N. Pandit, and T. N. Srinivasan for
having provided valuable comments on our earlier work. Thanks are also due to Sanjib Pohit who par-
ticipated in the earlier work. Devender Pratap, Bikram Prakas Ghosh, and Praveen Sachdeva of the
NCAER and Alan Fox and Soraphol Tulayasathien of UM provided excellent research assistance.

Multilateral trade liberalization under the auspices of the Uruguay Round
Agreement and the Doha Development Agenda is aimed at reducing tariff and
nontariff barriers on international trade. The purpose of this chapter is to provide
a computational analysis of the effect of such changes in trade barriers on the eco-
nomic welfare, on trade, and on the intersectoral allocation of resources in India
and its major trading partners.
A liberal international trade policy is now widely accepted as an important part
of growth and development policy. Growth, in turn, is the key to permanently alle-
viating poverty (Winters 2001). It is expected that trade liberalization will stimulate
production in labor-intensive sectors in India. Productive resources would then be
allocated more efficiently than during the preliberalization period because India
would specialize in the sectors where it has comparative advantage. Of course, there
may be transitional costs resulting from the intersectoral movement of factors of
production. Beyond such welfare gains, trade liberalization is also expected to have a
procompetitive effect on domestic firms, which results in additional gains from the
economies of large-scale production. When firms are protected from foreign com-
petition through tariff and nontariff barriers, they may take advantage of their mar-
ket power by raising their prices and reducing their domestic sales. The result is that
the protected firms may produce below their minimum cost, efficient plant size.
Trade liberalization then should bring about competitive pressures on the formerly
protected firms and induce them to raise production and productivity and to
achieve more efficient plant size and lower per-unit costs. Thus gains in economic
welfare are expected to come from the improved allocation of resources and from
the lower prices and greater variety available to consumers and firms. Realizing
economies of scale in manufacturing also reinforces the welfare-enhancing effect.
This chapter is organized as follows. The next section deals with the experience
of India during the 1990s with regard to its unilateral liberalization moves and to
changes induced through multilateral trade negotiations. In the third section we
present a computational analysis of the impact on India of the Uruguay Round
negotiations and the current Doha Development Agenda negotiations. We used a
specially designed version of the National Council of Applied Economic Research
(NCAER)-University of Michigan (UM) computable general equilibrium (CGE)
model of world production and trade for this purpose. Conclusions and policy
implications are discussed in the final section.
India in the Changing Global Trade Scenario
Even though India’s trade regime began to be liberalized in the late 1970s, 93 percent
of its local production of internationally tradable goods were still protected by some
type of quantitative restrictions (QRs) on imports as of 1990/91 (Pursell 1996).
14 India and the WTO

The QR coverage was 94 percent for agricultural and 90 percent for manufactured
intermediate and capital goods. Import licenses were granted subject to indige-
nous clearance—that is, a proof that there was no source of indigenous supply.
India had one of the most restrictive import tariff structures among developing
countries. The import-weighted tariff rate was 87 percent in 1989/90, accompa-
nied by a collection rate of 51 percent. There was a rapid increase in import tariffs
in the latter half of the 1980s. Such a protective regime led India into a sustained
phase of allocating its resources inefficiently. Its share in world trade declined
from 2 percent in 1950/51, to 1 percent in 1965/66, and to 0.5 percent by 1973/74.
Its share continued to hover around that figure until 1990/91.
India’s trade policy regime was quite complex until the beginning of the 1990s.
There were various categories of importers, import licenses, and methods of
importing. The regime’s details were contained in 19 Appendixes and spanned
more than 200 pages. The Import and Export Policy, introduced in 1990, was
replaced by the Export and Import (EXIM) Policy, which took effect on April 1,
1992.1 The content was reduced to 20 pages in the latter policy, thus making matters
simpler for exporters and importers. The new EXIM Policy contained negative-list
imports subject to licensing.2 Almost all consumer goods remained subject to
import licensing.
The first stage of India’s reforms after 1991 continued to focus on manufactur-
ing while largely ignoring agriculture. The share of value added in the manufac-
turing sector protected by QRs declined from 90 percent to 47 percent by May
1992 and to 36 percent by May 1995 (Pursell 1996, p. 5). The corresponding
decline was much less in agriculture—from 94 percent to 93 percent by May 1992
and to 84 percent by May 1995.
It has been estimated that about one-third of the value of India’s imports in
1998/99 were still subject to some type of nontariff barrier (Mehta 1998, pp. 35–36).
In April 1998, about 30 percent of the 10-digit tariff lines (3,068 of 10,281) under
the Harmonized System (HS) of India’s trade classification were subject to nontariff
barriers.3 The 3,068 restricted tariff lines include 1,379 lines for consumer goods.
The import value of these consumer goods is only 0.2 percent of India’s total
imports, which reflects the relatively high degree of restrictions. The import of
40 percent of agricultural products was still restricted because these were classified
as consumer goods.
Prior to 1991 India’s import tariff rates were among the highest in the world.
The Tax Reforms Committee, chaired by Raja J. Chelliah, proposed that the
import-weighted average duty rate should go down from 87 percent in 1989/90 to
45 percent in 1995/96 and further to 25 percent by 1998/99 (Government of India
1993). India has lowered its average (unweighted) applied tariff rate for the over-
all economy from 125 percent in 1990/91 to 71 percent in 1993/94, to 41 percent
Computational Analysis of the Impact on India of the Uruguay Round 15

in 1995/96, and to 35 percent in 1997/98 (table 2.1). The corresponding reduction
in the import-weighted average has been from 87 percent in 1990/91 to 47 percent
in 1993/94, to 25 percent in 1995/96, and to 20 percent in 1997/98, thus exceeding
the recommendations of the Chelliah Committee.4 The maximum tariff rate has
declined from 355 percent in 1990/91 to 45 percent in 1997/98 and was scheduled
to fall to 40 percent in 1999/00.
The World Bank estimates of changes in tariffs on consumer, intermediate, and
capital goods are given in table 2.2. Although the average import-weighted tariff
rate on consumer goods was reduced from 153 percent in 1990/91 to 25 percent in
1997/98, a large portion of this category still remained protected by QRs.
The import of some restricted items was liberalized through freely transferable
special import licenses (SILs). Apart from being used as a step toward liberalization,
the SIL regime also provided incentives to large established exporters; exporters of
16 India and the WTO
TABLE 2.1 India: Tariff Structure, 1990–91 to 1997–98 (Percent)
1990/91a 1993/94b 1995/96 1996/97c 1997/98d
Appliede Appliede Appliede Appliede Appliede
Average unweightedAgriculture 113 43 27 26 26Mining 100 70 30 26 25Manufacturing 126 73 42 40 36Whole economy 125 71 41 39 35Index of dispersionf 32 42 47 49 42Maximum tariff rateg 355 85 50 52 45Average weightedh 87 47 25 22 20
a. Prior to the reform package of July 1991. Includes auxiliary duty, mostly at 45 percent.
b. The auxiliary duty was merged with the basic customs duty in the 1993/94 budget.
c. Includes special rate of 2 percent.
d. Includes special rate of 5 percent.
e. Effective most-favored nation rate—that is, actual rates applied where basic rates have been reduced byexempt rates. However, many exempt rates cannot be incorporated, such as where the exempt rateapplies to only a part of the HS six-digit tariff line. The effective rate also excludes specific exemptions.
f. Index of dispersion for the whole economy as measured by the coefficient of variation, percentage points.
g. Higher than the so-called maximum rate is applied to a few items; in 1997/98, to 0.4 percent of tariff lines.
h. Weighted by 1992/93 import values.
Notes: Tariff averages consider only those tariff lines with ad valorem rates. Year beginning April 1. Classi-fication used is based on the International Standard Industrial Classifications (ISIC): agriculture = ISIC 1;mining = ISIC 2; manufacturing, including food processing = ISIC 3.
Source: WTO 1998, p. 46.

Computational Analysis of the Impact on India of the Uruguay Round 17
electronic and telecommunications equipment, diamonds, gems, and jewelry; and
manufacturers who have acquired the prescribed quality certification.
The coverage of tariff lines has gradually expanded since their introduction in
1992/93. Typically tariff lines have moved from the restricted list to the SIL list,
and thereafter to the free list. SILs were concentrated in industrial products with
nearly 56 percent of the HS eight-digit tariff lines under SIL as of April 1, 1997.
The corresponding coverage was 30 percent for textile and clothing products and
15 percent for agricultural products, including fisheries (WTO 1998, p. 66). The
SIL coverage has been extended systematically since April 1997, moving various
items from the restricted list to the SIL list and from there to the open general
license (OGL) list.
Various items also have been liberalized from two of the most restricted
groups—namely, agricultural products and consumer goods. The recently freed
agricultural products include dairy items, fish, and a variety of processed foods,
and the consumer goods include toiletries, electronic items, and cooking ranges.
In the WTO balance-of-payments committee India’s unrestrained use of QRs was
strongly challenged by the European Union, the United States, and other indus-
trial countries in December 1995.5
India is a founding member of the 1947 General Agreement on Tariffs and
Trade (GATT) and of the WTO, which came into effect January 1, 1995. By virtue
of its WTO membership, India automatically receives most-favored-nation
(MFN) treatment and national treatment from all WTO members for its exports,
and vice versa. Its participation in this increasingly rule-based system is aimed
toward ensuring more stability and predictability in its international trade.
The Uruguay Round resulted in increased tariff-binding commitments by
developing countries. India bound 67 percent of its tariff lines compared with
TABLE 2.2 India: Tariffs by Products, Average Import-WeightedRates, 1990–98 (Percent)
1990/91 1992/93 1993/94 1994/95 1995/96 1996/97 1997/98
Consumer 153 131 86 48 36 33 25goodsIntermediate 77 55 42 31 22 19 18goodsCapital 97 74 50 37 29 29 24goods
Note: Year beginning April 1.
Source: WTO 1998, p. 49.

6 percent of its lines prior to this round. All agricultural tariff lines and nearly
62 percent of the tariff lines for industrial goods are now bound. The unbound
lines include some consumer goods and industrial items. Ceiling bindings for
industrial goods are generally at 40 percent ad valorem for finished goods and 25
percent on intermediate goods, machinery, and equipment. The phased reduction
to these bound levels is to be achieved during the 10-year period that began in
1995. Tariff rates on equipment covered under the Information Technology
Agreement and on software are to be brought down to zero by 2005. The only
exception is in textiles, for which India has kept the option of reverting to the 1990
tariff levels in case the Agreement on Textiles and Clothing does not fully materi-
alize by 2005. It may be seen in table 2.3 that applied tariff rates in India are below
the Uruguay Round bound levels. The differential is greatest in the cases of agri-
culture and unprocessed primary goods.
On balance-of-payment grounds, quantitative restrictions on imports were
being maintained for 1,429 tariff lines at the eight-digit level. These include items
relating to textiles, agriculture, consumer goods, and a variety of manufactured
goods. With the improvement in India’s balance of payments since 1991, India was
asked to phase out its QRs. Based on presentations before the balance-of-payments
18 India and the WTO
TABLE 2.3 India: Bound Tariff Rates and Applied Rates of Duty(Percent)
a. Includes only items bound during the Uruguay Round. The bound rates do not include the commitmentsunder the Information Technology Agreement.
b. Effective most-favored nation rate—that is, actual rates applied where basic rates have been reduced byexempt rates. Many exempt rates cannot be incorporated, however, such as where the exempt rateapplies to only a part of the HS six-digit tariff line. The effective rate also excludes specific exemptions.
Note: Tariff averages consider only those tariff lines with ad valorem rates, year beginning April 1.
Source: WTO 1998, p. 54.
Bound Rate of Dutya Applied Rate of Dutyb
by Year 2005 1997/98
Average unweighted tariff (percent)Agriculture (ISIC 1) 94 26Mining (ISIC 2) 36 25Manufacturing (ISIC 3, includes
food processing) 52 36Whole economy 54 35Average unweighted tariff by stage of processing (percent)Unprocessed 74 25Semiprocessed 44 35Processed 56 37
committee and subsequent consultations with India’s main trading partners, an
agreement was reached to phase out QRs by 2001.
In line with the Agreement on Trade-related Investment Measures (TRIMs),
India has reported to the WTO the TRIMs that it has maintained. These measures
were to be eliminated by January 1, 2000. Under the Information Technology
Agreement tariffs were to be brought down to zero on 95 HS six-digit tariff lines
by the year 2000, on 4 more tariff lines by 2003, on another 2 tariff lines by 2004,
and on the balance of 116 tariff lines in the year 2005. Under the Agreement on
Technical Barriers to Trade and the Agreement on Sanitary and Phytosanitary
Measures, India was also committed to establishing and administering national
standards and technical regulations, keeping in view the basic precepts of MFN
status, national treatment, and transparency.
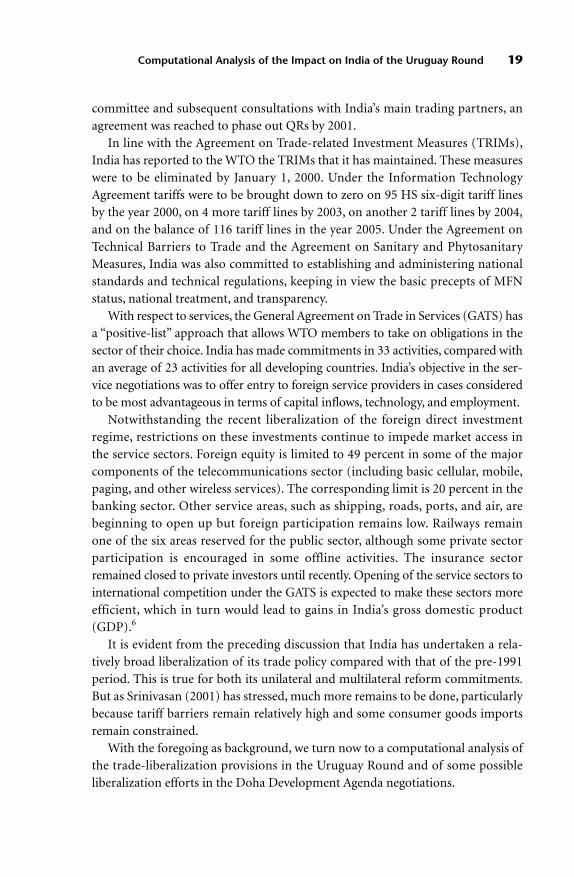
With respect to services, the General Agreement on Trade in Services (GATS) has
a “positive-list” approach that allows WTO members to take on obligations in the
sector of their choice. India has made commitments in 33 activities, compared with
an average of 23 activities for all developing countries. India’s objective in the ser-
vice negotiations was to offer entry to foreign service providers in cases considered
to be most advantageous in terms of capital inflows, technology, and employment.
Notwithstanding the recent liberalization of the foreign direct investment
regime, restrictions on these investments continue to impede market access in
the service sectors. Foreign equity is limited to 49 percent in some of the major
components of the telecommunications sector (including basic cellular, mobile,
paging, and other wireless services). The corresponding limit is 20 percent in the
banking sector. Other service areas, such as shipping, roads, ports, and air, are
beginning to open up but foreign participation remains low. Railways remain
one of the six areas reserved for the public sector, although some private sector
participation is encouraged in some offline activities. The insurance sector
remained closed to private investors until recently. Opening of the service sectors to
international competition under the GATS is expected to make these sectors more
efficient, which in turn would lead to gains in India’s gross domestic product
(GDP).6
It is evident from the preceding discussion that India has undertaken a rela-
tively broad liberalization of its trade policy compared with that of the pre-1991
period. This is true for both its unilateral and multilateral reform commitments.
But as Srinivasan (2001) has stressed, much more remains to be done, particularly
because tariff barriers remain relatively high and some consumer goods imports
remain constrained.
With the foregoing as background, we turn now to a computational analysis of
the trade-liberalization provisions in the Uruguay Round and of some possible
liberalization efforts in the Doha Development Agenda negotiations.
Computational Analysis of the Impact on India of the Uruguay Round 19

Computational Analysis of India’s Trade Reformsin a Global Setting
The empirical evidence from a number of studies points to a strong and signifi-
cant effect of openness to trade on growth performance (Srinivasan 1998). Thus,
it is expected that the multilateral liberalization of trade should benefit countries
of the world in general. In this section we will analyze the impact of trade liberal-
ization provisions in the Uruguay Round and some possible liberalization efforts
in the Doha Development Agenda negotiations. For comparative purposes, we
shall also analyze hypothetical scenarios when only India undertakes unilateral
liberalization. For this purpose we use simulation analysis to assess the potential
economic effects of implementing various liberalization provisions. The simula-
tions are based on a special version of the NCAER-UM computable general equi-
librium patterned after the Michigan Model of World Production and Trade. The
main features of the model are described by Brown and others (1993, 1996),
Chadha and Pohit (1998), and Chadha and others (1998a,b, 1999), and the equa-
tions and other details are available on the University of Michigan Web site:
www.umich.spp.edu/rsie/. The economy/region and sectoral coverage of the
model are noted in tables 2.4 and 2.5.
Computational Scenarios
The main data source for the model is the Purdue University Center for Global
Trade Analysis Project, “GTAP4 Data Base” (McDougall, Elbehri, and Truong
1998), which refers to 1995. For purposes of analysis we have projected this
database from 1995 to 2005 to get an approximate picture of what the world
will look like in 2005, assuming that the 1995 Uruguay Round (UR) Agreement
had not existed. We analyzed the impact of the UR-induced changes that may
occur during the 10-year implementation period after 1995 with respect to
reduction/removal of tariff and nontariff barriers on trade.7 Then we readjusted
the scaled-up database of 2005 to mimic the world as it might look when the UR
Agreement has been fully implemented. After that we devised some liberalization
scenarios for Doha Round Development Agenda negotiations, which we refer to
as the Doha Round (DR) and which involve possible reductions in tariffs on agri-
culture and manufacturing and reductions of barriers to services trade and to for-
eign direct investment.
The following are the computational scenarios:8
• UR-1—Agreement on Textiles and Clothing (ATC) is analyzed by simulating
the effects of the Multifibre Arrangement (MFA) phase-out under the UR
20 India and the WTO
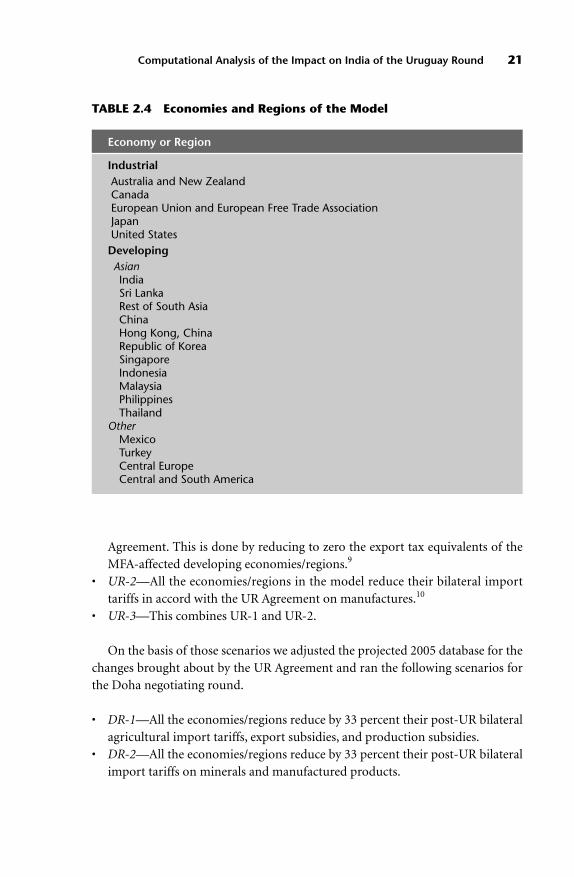
Agreement. This is done by reducing to zero the export tax equivalents of the
MFA-affected developing economies/regions.9
• UR-2—All the economies/regions in the model reduce their bilateral import
tariffs in accord with the UR Agreement on manufactures.10
• UR-3—This combines UR-1 and UR-2.
On the basis of those scenarios we adjusted the projected 2005 database for the
changes brought about by the UR Agreement and ran the following scenarios for
the Doha negotiating round.
• DR-1—All the economies/regions reduce by 33 percent their post-UR bilateral
agricultural import tariffs, export subsidies, and production subsidies.
• DR-2—All the economies/regions reduce by 33 percent their post-UR bilateral
import tariffs on minerals and manufactured products.
Computational Analysis of the Impact on India of the Uruguay Round 21
TABLE 2.4 Economies and Regions of the Model
Economy or Region
IndustrialAustralia and New ZealandCanadaEuropean Union and European Free Trade Association JapanUnited StatesDevelopingAsianIndiaSri LankaRest of South AsiaChinaHong Kong, ChinaRepublic of KoreaSingaporeIndonesiaMalaysiaPhilippinesThailand
OtherMexicoTurkeyCentral EuropeCentral and South America

• DR-3—All economies/regions reduce by 33 percent the import tariff equiva-
lents of estimated post-UR services barriers.
• DR-4—This combines DR-1, DR-2, and DR-3.
Finally, for purposes of comparison with the multilateral DR scenarios, we have
run the following unilateral liberalization scenarios for India alone (UNIDR):
• UNIDR-1—India reduces by 33 percent its post-UR agricultural import tariffs,
export subsidies, and production subsidies.
• UNIDR-2—India reduces by 33 percent its post-UR tariffs on minerals and
manufactured products.
• UNIDR-3—India reduces by 33 percent its tariff equivalents on services.
• UNIDR-4—All three scenarios (UNIDR1, UNIDR2, and UNIDR3) combined.
22 India and the WTO
TABLE 2.5 Sectors of Production
Sector
Agriculture
Mining and quarrying
Food, beverages, and tobacco
Textiles
Wearing apparel
Leather products and footwear
Wood and wood products
Chemicals, rubber, plastic, and petroleum products
Nonmetallic mineral products
Metal and metal products
Transport equipment
Machinery and equipment
Other manufactures, including electronic equipment
Electricity, gas, and water
Construction
Trade and transport
Finance, business, and recreational services
Public administration, defense, education and health, and dwellings

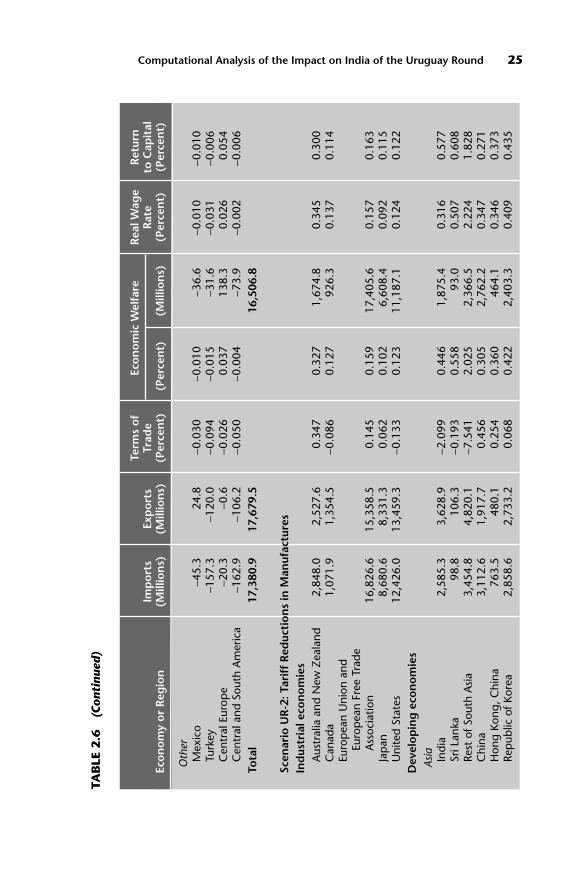
Uruguay Round Results
Table 2.6 provides aggregate, or economywide, results from the UR scenarios
described above for the 20 economies and regions that have been modeled. The
results reported include absolute changes in imports, exports, and equivalent vari-
ation (a measure of economic welfare); and percentage changes in the terms of
trade, equivalent variation, real wage rate, and the real return to capital. (Disag-
gregated sectoral results for India for the UR-3 and DR-4 scenarios will be pre-
sented in tables 2.8 and 2.9 below.)
For help in interpreting the results, you may find it useful to review the features
of the model that identify the various economic effects being captured in the dif-
ferent scenarios. Although the model includes the imperfect-competition features
of the New Trade Theory,11 it remains true that markets respond to trade liberal-
ization in much the same way that they would with perfect competition. That is,
when tariffs or other trade barriers are reduced in a sector, domestic buyers (both
final and intermediate) switch toward imports, and the domestic competing
industry contracts production while foreign exporters expand. With multilateral
liberalization reducing tariffs and other trade barriers simultaneously in most sec-
tors and countries, each country’s industries share in both of these effects,
expanding or contracting depending primarily on whether their protection is
reduced more or less than in other sectors and countries. At the same time, coun-
tries with larger average tariff reductions than their trading partners tend to expe-
rience a real depreciation of their currencies in order to maintain a constant trade
balance, so that all countries therefore experience mixtures of expanding and con-
tracting sectors.
Worldwide these changes cause increased international demand for all sectors,
with world prices rising most for those sectors where trade barriers fall the most.
This in turn causes positive or negative changes in countries’ terms of trade. Those
countries that are net exporters of goods with the greatest degree of liberalization
will experience increases in their terms of trade as the world prices of their exports
rise relative to their imports. The reverse occurs for net exporters in industries
where liberalization is slight (perhaps because it already happened in previous
trade rounds).
The effects on the welfare of countries arise from a mixture of these terms-of-
trade effects with the standard efficiency gains from trade and with additional
benefits resulting from elements of the New Trade Theory. Thus we expect, on
average, that the world will gain from multilateral liberalization as resources are
reallocated to those sectors in each country where there is a comparative advan-
tage. In the absence of terms-of-trade effects, these efficiency gains should raise
national welfare (our “equivalent variation”) for every country, although some
Computational Analysis of the Impact on India of the Uruguay Round 23

24 India and the WTOTA
BLE
2.6
Sum
mar
y R
esu
lts
of
the
Uru
gu
ay R
ou
nd
: C
han
ge
in I
mp
ort
s, E
xp
ort
s, T
erm
s o
f Tr
ade,
Wel
fare
,an
d t
he
Rea
l R
etu
rn t
o L
abo
r an
d C
apit
al Te
rms
of
Eco
no
mic
Wel
fare
R
eal W
age
Ret
urn
Imp
ort
s Ex
po
rts
Trad
eR
ate
to C
apit
alEc
on
om
y o
r R
egio
n(M
illio
ns)
(Mill
ion
s)(P
erce
nt)
(Per
cen
t)(M
illio
ns)
(Per
cen
t)(P
erce
nt)
Scen
ario
UR
-1:
Rem
ova
l of
the
Mul
ti-f
iber
Ag
reem
ent
Ind
ustr
ial e
con
om
ies
Aus
tral
ia a
nd N
ew Z
eala
nd14
4.7
114.
00.
030
0.01
894
.50.
012
0.02
8C
anad
a78
2.3
719.
40.
065
0.09
468
3.8
0.06
60.
133
Euro
pea
n U
nion
and
Eu
rop
ean
Free
Tra
de
Ass
ocia
tion
2,51
7.7
2,27
5.1
0.05
50.
058
6,32
0.8
0.05
10.
071
Jap
an−1
21.4
191.
0−0
.050
0.00
425
7.1
−0.0
020.
012
Uni
ted
Stat
es6,
497.
44,
482.
00.
148
0.09
58,
608.
20.
084
0.11
4D
evel
op
ing
eco
no
mie
s As
ia Indi
a1,
517.
91,
992.
1−0
.954
0.23
197
2.2
0.22
40.
238
Sri L
anka
98.7
159.
1−1
.101
0.14
323
.80.
032
0.25
1Re
st o
f Sou
th A
sia
449.
165
2.8
−1.0
880.
263
307.
40.
207
0.31
9C
hina
1,84
9.7
2,76
0.4
−0.3
66−0
.161
−1,4
58.5
−0.1
20−0
.194
Hon
g Ko
ng, C
hina
1,54
4.3
1,36
4.5
0.18
7−0
.473
−609
.20.
121
−0.9
88Re
pub
lic o
f Kor
ea40
5.0
428.
0−0
.015
0.02
514
2.7
0.04
50.
006
Sing
apor
e−5
10.4
−591
.40.
054
−0.0
01−0
.8−0
.025
0.02
0In
done
sia
147.
520
7.8
−0.0
89−0
.005
−13.
80.
030
−0.0
32M
alay
sia
223.
035
4.0
−0.1
210.
275
328.
70.
735
0.02
5Ph
ilip
pin
es2,
080.
92,
513.
8−1
.316
0.90
079
4.3
2.05
70.
045
Thai
land
140.
325
9.0
−0.1
430.
029
59.4
0.16
1−0
.019
Computational Analysis of the Impact on India of the Uruguay Round 25
Term
s o
fEc
on
om
ic W
elfa
reR
eal W
age
Ret
urn
Imp
ort
s Ex
po
rts
Trad
eR
ate
to C
apit
alEc
on
om
y o
r R
egio
n(M
illio
ns)
(Mill
ion
s)(P
erce
nt)
(Per
cen
t)(M
illio
ns)
(Per
cen
t)(P
erce
nt)
Oth
erM
exic
o−4
5.3
24.8
−0.0
30−0
.010
−36.
6−0
.010
−0.0
10Tu
rkey
−157
.3−1
20.0
−0.0
94−0
.015
−31.
6−0
.031
−0.0
06C
entr
al E
urop
e−2
0.3
−0.6
−0.0
260.
037
138.
30.
026
0.05
4C
entr
al a
nd S
outh
Am
eric
a−1
62.9
−106
.2−0
.050
−0.0
04−7
3.9
−0.0
02−0
.006
Tota
l17
,380
.917
,679
.516
,506
.8
Scen
ario
UR
-2: T
arif
f R
educ
tio
ns
in M
anuf
actu
res
Ind
ustr
ial e
con
om
ies
Aus
tral
ia a
nd N
ew Z
eala
nd2,
848.
02,
527.
60.
347
0.32
71,
674.
80.
345
0.30
0C
anad
a1,
071.
91,
354.
5−0
.086
0.12
792
6.3
0.13
70.
114
Euro
pea
n U
nion
and
Eu
rop
ean
Free
Tra
de
Ass
ocia
tion
16,8
26.6
15,3
58.5
0.14
50.
159
17,4
05.6
0.15
70.
163
Jap
an8,
680.
68,
331.
30.
062
0.10
26,
608.
40.
092
0.11
5U
nite
d St
ates
12,4
26.0
13,4
59.3
−0.1
330.
123
11,1
87.1
0.12
40.
122
Dev
elo
pin
g e
con
om
ies
Asia Indi
a2,
585.
33,
628.
9−2
.099
0.44
61,
875.
40.
316
0.57
7Sr
i Lan
ka98
.810
6.3
−0.1
930.
558
93.0
0.50
70.
608
Rest
of S
outh
Asi
a3,
454.
84,
820.
1−7
.541
2.02
52,
366.
52.
224
1.82
8C
hina
3,11
2.6
1,91
7.7
0.45
60.
305
2,76
2.2
0.34
70.
271
Hon
g Ko
ng, C
hina
763.
548
0.1
0.25
40.
360
464.
10.
346
0.37
3Re
pub
lic o
f Kor
ea2,
858.
62,
733.
20.
068
0.42
22,
403.
30.
409
0.43
5
TAB
LE 2
.6(C
onti
nued
)

26 India and the WTOTA
BLE
2.6
(Con
tinu
ed)
Term
s o
fEc
on
om
ic W
elfa
reR
eal W
age
Ret
urn
Imp
ort
s Ex
po
rts
Trad
eR
ate
to C
apit
alEc
on
om
y o
r R
egio
n(M
illio
ns)
(Mill
ion
s)(P
erce
nt)
(Per
cen
t)(M
illio
ns)
(Per
cen
t)(P
erce
nt)
Sing
apor
e3,
539.
83,
647.
5−0
.078
2.11
11,
570.
31.
943
2.25
8In
done
sia
936.
589
4.5
0.06
80.
247
626.
00.
291
0.21
5M
alay
sia
2,79
0.9
3,41
1.4
−0.5
631.
919
2,29
3.9
1.81
61.
974
Phili
pp
ines
2,45
2.6
3,10
2.1
−1.9
891.
917
1,69
1.7
1.85
31.
964
Thai
land
1,26
4.7
1,00
2.3
0.29
10.
366
753.
90.
597
0.28
3O
ther
Mex
ico
−64.
91.
4−0
.026
0.01
966
.30.
038
0.01
0Tu
rkey
319.
325
3.9
0.14
30.
123
259.
10.
122
0.12
4C
entr
al E
urop
e1,
871.
71,
846.
10.
020
0.29
41,
091.
20.
311
0.27
0C
entr
al a
nd S
outh
Am
eric
a3,
778.
82,
999.
50.
423
0.02
237
7.1
0.04
30.
004
Tota
l71
,616
.271
,876
.456
,496
.0
Scen
ario
UR
-3: U
rug
uay
Ro
und
Co
mb
ined
Lib
eral
izat
ion
Ind
ustr
ial e
con
om
ies
Aus
tral
ia a
nd N
ew Z
eala
nd2,
992.
82,
641.
60.
377
0.34
51,
769.
30.
357
0.32
8C
anad
a1,
854.
22,
073.
9−0
.021
0.22
11,
610.
10.
202
0.24
7Eu
rop
ean
Uni
on a
nd
Euro
pea
n Fr
ee T
rade
A
ssoc
iatio
n19
,344
.217
,633
.60.
200
0.21
623
,726
.40.
208
0.23
4Ja
pan
8,55
9.2
8,52
2.3
0.01
10.
106
6,86
5.5
0.09
00.
127
Uni
ted
Stat
es18
,923
.417
,941
.30.
014
0.21
819
,795
.30.
208
0.23
6D
evel
op
ing
eco
no
mie
sAs
ia Indi
a4,
103.
25,
620.
9−3
.053
0.67
72,
847.
50.
540
0.81
5
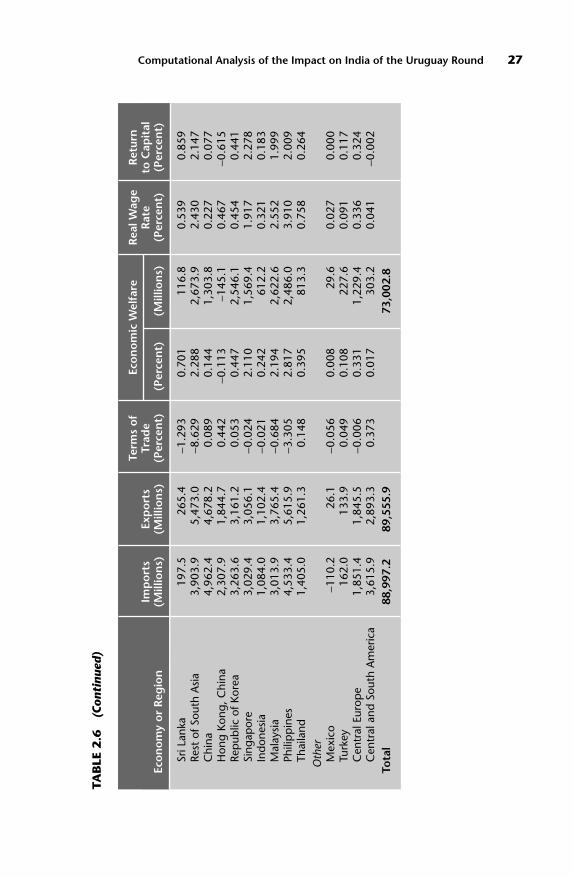
Computational Analysis of the Impact on India of the Uruguay Round 27
TAB
LE 2
.6(C
onti
nued
)
Term
s o
fEc
on
om
ic W
elfa
reR
eal W
age
Ret
urn
Imp
ort
s Ex
po
rts
Trad
eR
ate
to C
apit
alEc
on
om
y o
r R
egio
n(M
illio
ns)
(Mill
ion
s)(P
erce
nt)
(Per
cen
t)(M
illio
ns)
(Per
cen
t)(P
erce
nt)
Sri L
anka
197.
526
5.4
−1.2
930.
701
116.
80.
539
0.85
9Re
st o
f Sou
th A
sia
3,90
3.9
5,47
3.0
−8.6
292.
288
2,67
3.9
2.43
02.
147
Chi
na4,
962.
44,
678.
20.
089
0.14
41,
303.
80.
227
0.07
7H
ong
Kong
, Chi
na2,
307.
91,
844.
70.
442
−0.1
13−1
45.1
0.46
7−0
.615
Rep
ublic
of K
orea
3,26
3.6
3,16
1.2
0.05
30.
447
2,54
6.1
0.45
40.
441
Sing
apor
e3,
029.
43,
056.
1−0
.024
2.11
01,
569.
41.
917
2.27
8In
done
sia
1,08
4.0
1,10
2.4
−0.0
210.
242
612.
20.
321
0.18
3M
alay
sia
3,01
3.9
3,76
5.4
−0.6
842.
194
2,62
2.6
2.55
21.
999
Phili
pp
ines
4,53
3.4
5,61
5.9
−3.3
052.
817
2,48
6.0
3.91
02.
009
Thai
land
1,40
5.0
1,26
1.3
0.14
80.
395
813.
30.
758
0.26
4O
ther
Mex
ico
−110
.226
.1−0
.056
0.00
829
.60.
027
0.00
0Tu
rkey
162.
013
3.9
0.04
90.
108
227.
60.
091
0.11
7C
entr
al E
urop
e1,
851.
41,
845.
5−0
.006
0.33
11,
229.
40.
336
0.32
4C
entr
al a
nd S
outh
Am
eric
a3,
615.
92,
893.
30.
373
0.01
730
3.2
0.04
1−0
.002
Tota
l88
,997
.289
,555
.973
,002
.8
factor owners within a country may lose. It is possible, however, for a particular
country whose net imports are concentrated in sectors with the greatest liberaliza-
tion to lose overall if the worsening of its terms of trade swamps these efficiency
gains.
On the other hand, although the New Trade Theory is perhaps best known for
introducing new reasons why countries may lose from trade, its greatest contribu-
tion is to expand the list of reasons for gains from trade. These gains are the dom-
inant contribution of the New Trade Theory in our model. That is, trade liberal-
ization permits all countries to expand their export sectors at the same time that
all sectors compete more closely with a larger number of competing varieties from
abroad. As a result, countries as a whole gain from lower costs due to increasing
returns to scale, lower monopoly distortions as a result of greater competition,
and reduced costs and increased utility prompted by greater product variety. All of
these effects make it more likely that countries will gain from liberalization in
ways that are shared across the entire population.
In perfectly competitive trade models such as the Heckscher-Ohlin model, one
expects countries as a whole to gain from trade, but the owners of one factor—the
“scarce factor”—to lose through the mechanism known as the Stolper-Samuelson
theorem. The additional sources of gain from trade as a result of increasing
returns to scale, competition, and product variety, however, are shared across fac-
tors, and we routinely find in our CGE modeling that both labor and capital gain
from liberalization (for details, see Brown and others [1993]). That is often the
case here.
A final point concerns the modeling and role of nontariff barriers, such as
are included here, especially in textiles and apparel. These are quantitative
restrictions captured in the model by endogenous tariff equivalents that rise
and fall with changing supplies and demands for trade. The tariff equivalents
generate quota rents that accrue to whatever group is granted the rights to
trade under the restriction. In the case of the MFA these are the textiles and
apparel–exporting countries. Liberalizing these nontariff barriers reduces or
eliminates the quota rents—an action that can be costly to those who pos-
sessed them disproportionately beforehand. Therefore, it is not the case that
exporting countries necessarily benefit from relaxing these trade barriers
because their loss of quota rents can more than outweigh their gains from
increased exports. Indeed, their exports can actually decline, along with their
national welfare, if increased exports from other countries displace them in
world markets.
In the real world, all of these effects occur over time, some of them more
quickly than others. Our model is static, however, based on a single set of equi-
librium conditions rather than on relationships that vary over time. Our results
28 India and the WTO
refer to a time horizon that is somewhat uncertain, depending on the assump-
tions that have been made about which variables do and which do not adjust to
changing market conditions, and on the short- or long-run nature of these
adjustments. Because our elasticities of supply and demand reflect relatively
long-run adjustments and because we assume that the demand and supply in
markets for both labor and capital equilibrate within countries, our results are
appropriate for a relatively long time horizon of several years—perhaps two or
three at a minimum.
On the other hand, our model does not allow for the very long-run adjust-
ments that could occur through capital accumulation, population growth, and
technological change. Our results should therefore be thought of as superimposed
on longer-run growth paths of the economies involved. To the extent that these
growth paths themselves may be influenced by trade liberalization, therefore, our
model does not capture that.
Let us turn now to the Uruguay Round results. As mentioned, table 2.6 reports
various economywide changes for each of the economies/regions of the model.
These include changes in exports and imports in millions of dollars; the changes
in terms of trade, real wage rate, and real return to capital in percentages; and
changes in economic welfare measured by equivalent variation, both in millions
of dollars and as a percentage of country GDP. The terms of trade is the world
price of a country’s exports relative to its imports. The equivalent variation is the
amount of money that, if given to the country’s consumers at initial prices, would
be equivalent in terms of their level of welfare to the effects of the assumed liber-
alization. In general, as discussed above, a worsening (fall) in a country’s terms of
trade has an adverse effect on its consumers’ welfare. But this can be outweighed
by the other gains from trade resulting from economic efficiency and the other
benefits modeled by the New Trade theory.
UR-1: Elimination of the MFA Quota Constraints. The results for the Uruguay
Round elimination of the MFA quota and of other bilateral constraints on devel-
oping country exports of textiles and apparel, shown in scenario UR-1 of table
2.6, indicate an increase in global welfare of US$16.5 billion. When interpreting
the results note that, with increased exports of these goods to world markets, their
prices will fall and both the terms of trade of the MFA exporting countries and
their economic welfare may deteriorate. The decline in terms of trade is experi-
enced as a loss of quota rents from the MFA and can be seen in the terms-of-trade
column in table 2.6 for most of the developing economies. Although several of
those economies also experience reductions in welfare, India’s welfare increases by
$972 million. The industrial countries all gain from MFA elimination. Changes in
returns to labor and capital are mostly small.
Computational Analysis of the Impact on India of the Uruguay Round 29

UR-2: Liberalization of Manufactures. Scenario UR-2 in table 2.6 covers the
reductions in import tariffs on manufactures that were negotiated in the
Uruguay Round. Global economic welfare increases by US$56.5 billion and the
gains are positive for all economies and regions. The largest welfare increases
noted are for European Union/European Free Trade Association (EU/EFTA,
$17.4 billion), the United States ($11.2 billion), and Japan ($6.6 billion). India’s
welfare increases by $1.9 billion. The effects on returns to labor and capital are
uniformly positive.
UR-3: Combined Liberalization Effects (UR-1 + UR-2). The combined effects
of the Uruguay Round liberalization are indicated in Scenario UR-3 of table 2.6.
As noted, this table is the linear combination of UR-1 and UR-2. Global wel-
fare is increased by US$73.0 billion. It is noteworthy that the industrial coun-
tries all gain, with an increase in welfare of $23.7 billion for the EU/EFTA,
$19.8 billion for the United States, and $6.9 billion for Japan. All of the devel-
oping economies, except Hong Kong (China), show an increase in welfare from
the combined UR liberalization. India’s welfare increases by $2.8 billion.
Changes in the real wage and the return to capital are positive but relatively
small for the industrial countries, and relatively sizable in several of the Asian
developing economies.
As mentioned earlier, we used scenario UR-3 as the basis for updating our
database to the year 2005, which is the base for our subsequent scenarios for the
Doha Round of liberalization. We first scaled up the GTAP data for 1995 by con-
stant growth rates for labor and output to get estimates of output, employment,
and trade for the year 2005 in the absence of the Uruguay Round liberalization.
We then used the detailed results of scenario UR-3 to adjust these data further to
include the changes that the Uruguay Round can be expected to bring about.
Thus, for example, the trade data for each economy in the model were expanded
by the percentages implicit in the terms-of-trade and economic welfare (percent)
columns of table 2.6. Of course this was actually done using the disaggregated
results for percentage changes in output, trade, and employment that are applied
to the scaled levels from the GTAP data.
We turn now to the Doha Round scenarios.
Doha Round Results
DR-1: Agricultural Liberalization. The results for assumed 33 percent reduc-
tions in post-UR agricultural import tariffs, export subsidies, and production
subsidies (taken here as a proxy for the aggregate measure of support) are shown in
table 2.7. (More detailed results are available from the authors on request.) In the
30 India and the WTO

Computational Analysis of the Impact on India of the Uruguay Round 31
TAB
LE 2
.7Su
mm
ary
Res
ult
s o
f th
e D
oh
a D
evel
op
men
t A
gen
da
Neg
oti
atio
ns:
Ch
ang
e in
Im
po
rts,
Exp
ort
s,Te
rms
of
Trad
e, W
elfa
re, an
d t
he
Rea
l R
etu
rn t
o C
apit
al a
nd
Lab
or
Term
s o
fEc
on
om
ic W
elfa
reR
eal W
age
Ret
urn
Imp
ort
s Ex
po
rts
Trad
eR
ate
to C
apit
alEc
on
om
y o
r R
egio
n(M
illio
ns)
(Mill
ion
s)(P
erce
nt)
(Per
cen
t)(M
illio
ns)
(Per
cen
t)(P
erce
nt)
Scen
ario
DR
-1:
33 P
erce
nt
Red
ucti
on
in A
gri
cult
ural
Pro
tect
ion
Ind
ustr
ial e
con
om
ies
Aus
tral
ia a
nd N
ew Z
eala
nd56
6.2
−168
.10.
798
−0.0
63−3
20.7
−0.1
82−0
.224
Can
ada
−248
.6−7
68.3
0.16
8−0
.051
−368
.4−0
.218
−0.2
09Eu
rop
ean
Uni
on a
nd
Euro
pea
n Fr
ee T
rade
A
ssoc
iatio
n15
7.1
416.
2−0
.041
0.25
828
,328
.0−0
.045
0.02
3Ja
pan
564.
33,
199.
9−0
.470
−0.0
44−2
,826
.4−0
.039
−0.0
03U
nite
d St
ates
2,69
0.9
928.
30.
219
−0.1
22−1
1,08
1.1
−0.1
90−0
.193
Dev
elo
pin
g e
con
om
ies
Asia Indi
a32
4.2
285.
30.
066
0.38
41,
617.
4−0
.109
−0.0
30Sr
i Lan
ka−9
3.9
−67.
5−0
.240
−2.7
34−4
55.7
−0.3
07−0
.480
Rest
of S
outh
Asi
a10
6.6
157.
2−0
.118
0.31
036
2.1
−0.0
78−0
.119
Chi
na−5
22.8
−652
.7−0
.013
−0.4
34−3
,932
.0−0
.163
−0.3
20H
ong
Kong
, Chi
na−3
80.7
−256
.9−0
.026
−0.2
94−3
79.0
−0.1
86−0
.180
Rep
ublic
of K
orea
285.
491
2.9
−0.3
33−0
.230
−1,3
11.4
0.13
20.
134
Sing
apor
e−1
53.9
−39.
5−0
.067
−0.2
44−1
81.4
−0.0
38−0
.068
Indo
nesi
a−4
36.5
−466
.7−0
.006
−1.2
59−3
,185
.5−0
.113
−0.4
62M
alay
sia
−10.
849
.0−0
.076
−0.2
64−3
15.8
0.18
90.
104
Phili
pp
ines
−344
.8−2
41.8
−0.1
99−1
.336
−1,1
79.1
−0.0
62−0
.076
Thai
land
−621
.2−1
,119
.30.
613
0.04
592
.4−0
.703
0.05
4O
ther
Mex
ico
−200
.7−1
93.6
−0.0
89−0
.121
−425
.6−0
.354
−0.1
85

32 India and the WTOTA
BLE
2.7
(Con
tinu
ed)
Term
s o
fEc
on
om
ic W
elfa
reR
eal W
age
Ret
urn
Imp
ort
s Ex
po
rts
Trad
eR
ate
to C
apit
alEc
on
om
y o
r R
egio
n(M
illio
ns)
(Mill
ion
s)(P
erce
nt)
(Per
cen
t)(M
illio
ns)
(Per
cen
t)(P
erce
nt)
Turk
ey−1
89.1
−119
.0−0
.087
−0.4
14−8
71.4
−0.3
27−0
.347
Cen
tral
Eur
ope
−432
.7−4
28.6
0.02
5−0
.457
−1,6
95.6
−0.3
63−0
.391
Cen
tral
and
Sou
th A
mer
ica
1,50
0.6
870.
30.
377
−0.2
85−4
,988
.0−0
.252
−0.3
58To
tal
2,55
9.5
2,29
7.3
−3,1
17.2
Scen
ario
DR
-2: 3
3 Pe
rcen
t R
educ
tio
n in
Man
ufac
ture
s Ta
riff
sIn
dus
tria
l eco
no
mie
sA
ustr
alia
and
New
Zea
land
3,72
0.7
3,45
7.2
0.26
70.
545
2,79
0.6
0.50
80.
515
Can
ada
1,99
6.0
2,09
7.3
−0.0
130.
347
2,52
6.2
0.21
60.
251
Euro
pea
n U
nion
and
Eu
rop
ean
Free
Tra
de
Ass
ocia
tion
23,1
84.8
22,8
40.3
0.05
00.
358
39,2
73.0
0.19
00.
199
Jap
an19
,071
.415
,817
.00.
548
0.69
645
,190
.90.
234
0.30
4U
nite
d St
ates
20,4
54.2
18,3
37.3
0.16
70.
260
23,6
34.2
0.19
80.
224
Dev
elo
pin
g e
con
om
ies
Asia Indi
a3,
280.
44,
054.
2−1
.384
0.73
33,
084.
40.
439
0.59
2Sr
i Lan
ka53
6.8
592.
1−1
.025
3.20
753
4.5
1.56
52.
010
Rest
of S
outh
Asi
a1,
892.
02,
018.
4−0
.604
1.89
52,
214.
70.
889
1.02
5C
hina
16,0
80.3
19,4
16.3
−1.2
211.
199
10,8
59.3
1.47
01.
323
Hon
g Ko
ng, C
hina
3,18
2.8
1,84
0.3
1.24
61.
444
1,85
9.1
0.94
70.
647
Rep
ublic
of K
orea
8,02
3.4
8,44
0.7
−0.2
331.
515
8,62
2.9
1.15
81.
003
Sing
apor
e4,
382.
94,
161.
80.
131
2.27
61,
692.
52.
481
2.61
1In
done
sia
2,36
2.7
2,33
6.0
0.05
30.
835
2,11
3.3
0.64
50.
447

Computational Analysis of the Impact on India of the Uruguay Round 33
TAB
LE 2
.7(C
onti
nued
)
Term
s o
fEc
on
om
ic W
elfa
reR
eal W
age
Ret
urn
Imp
ort
s Ex
po
rts
Trad
eR
ate
to C
apit
alEc
on
om
y o
r R
egio
n(M
illio
ns)
(Mill
ion
s)(P
erce
nt)
(Per
cen
t)(M
illio
ns)
(Per
cen
t)(P
erce
nt)
Mal
aysi
a4,
242.
84,
805.
2−0
.488
2.55
53,
055.
12.
896
2.81
2Ph
ilip
pin
es3,
984.
04,
535.
1−1
.192
5.47
84,
834.
43.
310
2.46
1Th
aila
nd3,
406.
13,
970.
1−0
.675
0.87
31,
798.
61.
664
0.97
2O
ther
Mex
ico
916.
31,
132.
6−0
.166
0.36
41,
283.
10.
195
0.20
4Tu
rkey
1,42
1.0
1,55
8.6
−0.3
350.
827
1,74
0.3
0.34
90.
272
Cen
tral
Eur
ope
3,86
6.3
4,36
6.4
−0.4
280.
734
2,72
4.2
0.81
60.
722
Cen
tral
and
Sou
th A
mer
ica
5,03
8.9
6,10
3.2
−0.6
120.
206
3,61
0.0
0.15
90.
108
Tota
l13
1,04
3.7
131,
880.
016
3,44
1.4
Scen
ario
DR
-3: 3
3 Pe
rcen
t R
educ
tio
n in
Ser
vice
s B
arri
ers
Ind
ustr
ial e
con
om
ies
Aus
tral
ia a
nd N
ew Z
eala
nd2,
354.
41,
962.
30.
385
1.05
05,
379.
60.
694
0.65
7C
anad
a2,
244.
02,
136.
30.
083
0.81
15,
910.
40.
317
0.31
6Eu
rop
ean
Uni
on a
nd
Euro
pea
n Fr
ee T
rade
A
ssoc
iatio
n35
,478
.135
,336
.80.
032
1.29
514
2,00
3.2
0.55
30.
546
Jap
an14
,797
.715
,501
.6−0
.067
0.89
157
,875
.10.
247
0.27
7U
nite
d St
ates
32,4
67.7
32,2
31.5
−0.0
331.
448
131,
426.
80.
524
0.53
4D
evel
op
ing
eco
no
mie
sAs
ia Indi
a91
9.2
803.
90.
212
0.55
22,
321.
60.
170
0.20
4Sr
i Lan
ka12
1.7
99.1
0.33
51.
202
200.
40.
881
0.50
7Re
st o
f Sou
th A
sia
374.
328
6.7
0.28
60.
689
804.
90.
293
0.45
3

34 India and the WTOTA
BLE
2.7
(Con
tinu
ed)
Term
s o
fEc
on
om
ic W
elfa
reR
eal W
age
Ret
urn
Imp
ort
s Ex
po
rts
Trad
eR
ate
to C
apit
alEc
on
om
y o
r R
egio
n(M
illio
ns)
(Mill
ion
s)(P
erce
nt)
(Per
cen
t)(M
illio
ns)
(Per
cen
t)(P
erce
nt)
Chi
na5,
660.
36,
210.
9−0
.128
1.32
011
,959
.10.
840
0.60
3H
ong
Kong
, Chi
na7,
587.
28,
058.
4−0
.611
4.38
25,
643.
15.
638
5.92
7Re
pub
lic o
f Kor
ea4,
842.
25,
002.
5−0
.102
1.33
97,
619.
50.
913
0.95
6Si
ngap
ore
3,32
5.1
3,77
6.2
−0.2
973.
322
2,47
0.8
4.82
13.
972
Indo
nesi
a1,
401.
31,
469.
4−0
.072
1.25
63,
177.
00.
327
0.30
7M
alay
sia
1,48
7.6
1,46
6.8
0.04
91.
267
1,51
4.5
1.02
60.
928
Phili
pp
ines
1,98
6.7
2,19
5.0
−0.4
622.
342
2,06
7.1
1.73
91.
622
Thai
land
3,32
4.2
3,62
5.3
−0.4
131.
401
2,88
6.4
1.08
80.
904
Oth
erM
exic
o86
3.1
809.
10.
110
0.87
83,
099.
30.
204
0.19
5Tu
rkey
1,73
3.3
1,46
2.9
0.58
91.
781
3,74
5.9
0.69
50.
884
Cen
tral
Eur
ope
3,84
1.7
3,74
4.5
0.06
11.
409
5,22
7.2
1.06
70.
996
Cen
tral
and
Sou
th A
mer
ica
4,19
9.9
4,44
2.8
−0.1
791.
050
18,3
63.5
0.25
60.
272
Tota
l12
9,00
9.6
130,
621.
841
3,69
5.4
Scen
ario
DR
-4: 3
3 Pe
rcen
t R
educ
tio
n in
All
Trad
e B
arri
ers
Ind
ustr
ial e
con
om
ies
Aus
tral
ia a
nd N
ew Z
eala
nd6,
641.
25,
251.
41.
449
1.53
27,
849.
31.
020
0.94
7C
anad
a3,
991.
33,
465.
30.
238
1.10
78,
068.
20.
315
0.35
9Eu
rop
ean
Uni
on a
nd
Euro
pea
n Fr
ee T
rade
A
ssoc
iatio
n58
,819
.358
,592
.50.
041
1.91
120
9,60
9.8
0.69
70.
768
Jap
an34
,433
.434
,518
.50.
012
1.54
410
0,23
9.5
0.44
20.
579
Uni
ted
Stat
es55
,612
.451
,496
.80.
353
1.58
614
3,98
0.5
0.53
30.
565
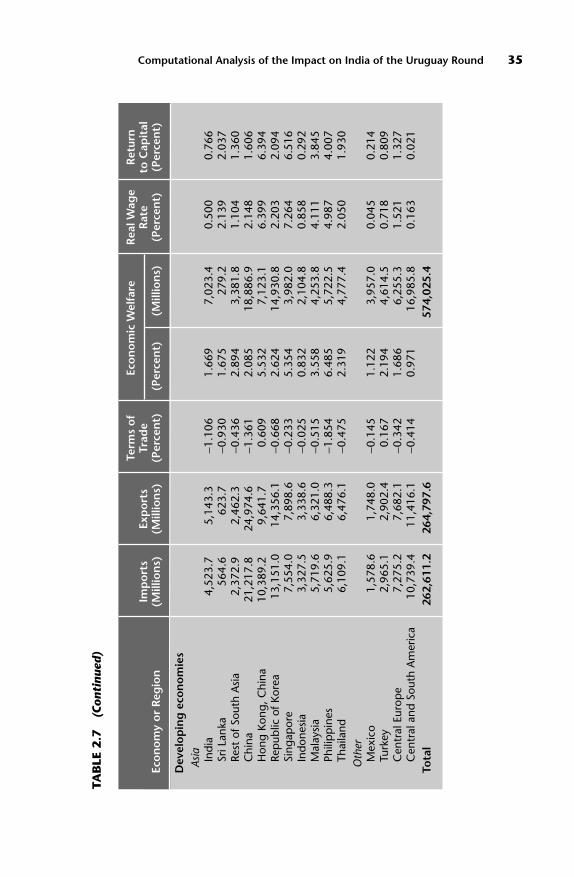
Computational Analysis of the Impact on India of the Uruguay Round 35
TAB
LE 2
.7(C
onti
nued
)
Term
s o
fEc
on
om
ic W
elfa
reR
eal W
age
Ret
urn
Imp
ort
s Ex
po
rts
Trad
eR
ate
to C
apit
alEc
on
om
y o
r R
egio
n(M
illio
ns)
(Mill
ion
s)(P
erce
nt)
(Per
cen
t)(M
illio
ns)
(Per
cen
t)(P
erce
nt)
Dev
elo
pin
g e
con
om
ies
Asia Indi
a4,
523.
75,
143.
3−1
.106
1.66
97,
023.
40.
500
0.76
6Sr
i Lan
ka56
4.6
623.
7−0
.930
1.67
527
9.2
2.13
92.
037
Rest
of S
outh
Asi
a2,
372.
92,
462.
3−0
.436
2.89
43,
381.
81.
104
1.36
0C
hina
21,2
17.8
24,9
74.6
−1.3
612.
085
18,8
86.9
2.14
81.
606
Hon
g Ko
ng, C
hina
10,3
89.2
9,64
1.7
0.60
95.
532
7,12
3.1
6.39
96.
394
Rep
ublic
of K
orea
13,1
51.0
14,3
56.1
−0.6
682.
624
14,9
30.8
2.20
32.
094
Sing
apor
e7,
554.
07,
898.
6−0
.233
5.35
43,
982.
07.
264
6.51
6In
done
sia
3,32
7.5
3,33
8.6
−0.0
250.
832
2,10
4.8
0.85
80.
292
Mal
aysi
a5,
719.
66,
321.
0−0
.515
3.55
84,
253.
84.
111
3.84
5Ph
ilip
pin
es5,
625.
96,
488.
3−1
.854
6.48
55,
722.
54.
987
4.00
7Th
aila
nd6,
109.
16,
476.
1−0
.475
2.31
94,
777.
42.
050
1.93
0O
ther
Mex
ico
1,57
8.6
1,74
8.0
−0.1
451.
122
3,95
7.0
0.04
50.
214
Turk
ey2,
965.
12,
902.
40.
167
2.19
44,
614.
50.
718
0.80
9C
entr
al E
urop
e7,
275.
27,
682.
1−0
.342
1.68
66,
255.
31.
521
1.32
7C
entr
al a
nd S
outh
Am
eric
a10
,739
.411
,416
.1−0
.414
0.97
116
,985
.80.
163
0.02
1To
tal
262,
611.
226
4,79
7.6
574,
025.
4

36 India and the WTO
model, the reductions in agricultural import tariffs will have the effects of tariff
reductions already described. In the case of export subsidies, their effects will be to
reduce world prices and raise domestic prices. When export subsidies are reduced,
world prices rise and domestic prices in the subsidizing countries fall, with the
possible consequences that economic welfare may rise in the countries reducing
their export subsidies and fall in net-importing countries now facing higher world
prices. Similarly, production subsidies will have the effect of reducing prices both
domestically and abroad. When production subsidies are reduced, the cost of
agricultural products will rise with consequent terms-of-trade effects similar to
those just discussed. In addition, depending on the input–output structure, a rise
in the cost of agricultural inputs will push up marginal cost relative to average
total cost in some sectors. To return to the optimal markup of price relative to
marginal cost, firm output in these sectors has to fall, and economic welfare may
then decline as a result of reduced economies of scale.
In the underlying results, the reductions in agricultural import tariffs alone
increase global economic welfare by US$9.5 billion. Welfare increases in the
Asian developing countries, the EU/EFTA, Japan, Mexico, and Turkey as
resources are shifted away from agriculture. Correspondingly, welfare declines
in Australia/New Zealand, Canada, and the United States as resources are shifted
to agriculture and away from nonagricultural increasing-returns industries. As
noted above, when export subsidies are reduced, world prices rise and domestic
prices fall. This is borne out in the underlying results of welfare increases in the
EU/EFTA and welfare declines in all of the economies in the model, except
Thailand. Global welfare falls by an estimated $23.2 billion. When production
subsidies are reduced, domestic and foreign prices rise and, depending on input–
output structures, the increased cost of agricultural inputs may cause firm out-
put in some sectors to decline for the reasons discussed above. In the underlying
results, it turns out that the EU/EFTA region benefits the most when its agri-
cultural production subsidies are reduced, whereas welfare declines for most
developing economies. Global welfare rises by $10.6 billion.12 Agricultural lib-
eralization thus involves a complex of differential changes because both tariffs
and subsidies are being reduced. The net effect indicated in table 2.7 is a reduc-
tion in global welfare of $3.1 billion. The net effect on India is a welfare increase
of $1.6 billion.
DR-2: Liberalization of Manufactures. The assumed 33 percent reduction of
post-UR manufactures tariffs results in an increase in global welfare of US$163.4
billion, which is considerably greater than the $56.5 billion welfare gain from the
Uruguay Round manufactures liberalization. As was the case in the Uruguay
Round results, the assumed liberalization of manufactures in the Doha Round

would increase welfare in all of the economies and regions listed and would have
positive effects as well on real wages and the return to capital. The largest welfare
gains are for Japan ($45.2 billion), the EU/EFTA ($39.3 billion), and the United
States ($23.6 billion). Although the welfare gains for the developing economies
and regions are much smaller in absolute terms, the percentage gains are mostly
larger, ranging from 0.2 percent for Central and South America to 5.5 percent for
the Philippines.13 India’s welfare increases by $3.1 billion, which is 0.7 percent of
its GDP. There are also sizable percentage increases in the real factor returns in the
Asian developing economies.
DR-3: Services Liberalization. As noted above, the Uruguay Round negotia-
tions on services resulted in the creation of the GATS, but there was no signifi-
cant liberalization of barriers to services. Following the Uruguay Round there
have been successful multilateral negotiations to liberalize telecommunications
and financial services. Although it would be desirable to assess the economic
effects of these sectoral agreements, lack of data prevents us from doing so.
What we have done then is to use the estimates of services barriers based on the
calculations of gross operating margins for services firms in the economies and
regions in our model. These estimates of services barriers are intended to be
indirect approximations of the actual barriers. Assuming that the ad valorem
equivalents of these barriers are reduced by 33 percent, it can be seen in table 2.7
that global economic welfare rises by US$413.7 billion, which exceeds the
$163.4 billion in welfare increase for manufactures liberalization. All of the
economies listed experience positive welfare gains and increases in real wages
and returns to capital. The EU/EFTA region has the largest welfare gain ($142.0
billion) in the group of industrial countries, compared with $131.4 billion for
the United States and $57.9 billion for Japan. For the smaller industrial and
developing countries, the percentage increases in welfare and factor returns are
especially noteworthy. India’s welfare increases by $2.3 billion, which is 0.6 of its
GDP. It should be borne in mind that the foregoing results of services liberaliza-
tion depend on the size of the services barriers that have been calculated indi-
rectly from financial data and they may be overstated. Nonetheless, it seems fair
to say that services barriers tend to be considerably greater than the tariffs on
manufactures.
DR-4: Combined Liberalization Effects (DR-1 + DR-2 + DR-3). The results for
DR-4 are a linear combination of the other three scenarios. As can be seen in table
2.7, global welfare overall rises by US$574.0 billion. Among the industrial coun-
tries, the EU/EFTA region has a welfare gain of $209.6 billion, the United States a
gain of $144.0 billion, and Japan a gain of $100.2 billion. The percentage welfare
Computational Analysis of the Impact on India of the Uruguay Round 37
gains and increases in returns to factors are sizable in most of the smaller indus-
trial countries and in the developing economies. India’s welfare increase is $7.0
billion, which is 1.7 percent of GDP.
Sectoral Impact of Trade Liberalization on India
A major contribution that this sort of CGE modeling can make is to identify those
sectors that will expand and those that will contract as a result of various patterns of
trade liberalization and the sizes of these changes. Given our assumption that
expenditure adjusts within each country to maintain a constant level of total
employment, each country must experience a mixture of expansions and contrac-
tions at the industry level. This must be true of employment, and it is likely to be
true for industry output. (Detailed sectoral results are available for all the economies
and regions included in the model from the authors on request.) We will concen-
trate here on the sectoral results for India that are given in tables 2.8 and 2.9.
We expect that trade liberalization will stimulate production of labor-intensive
sectors in India. Productive resources would then be allocated more efficiently
than they would in the preliberalization situation because India would specialize
in the sectors where it has comparative advantage. There may, of course, be transi-
tional costs resulting from intersectoral movement of production factors. In addi-
tion to such welfare gains, trade liberalization is expected to have a procompetitive
effect on domestic firms, resulting in additional gains from the realization of
economies of large-scale production. When firms are protected from foreign
competition through tariff and nontariff barriers, they may take advantage of
their market power by raising their prices and reducing their domestic sales. The
result is that the protected firms may produce below their minimum-cost, effi-
cient plant size. Trade liberalization should then bring about competitive pres-
sures on the formerly protected firms and induce them to raise production and
productivity and to achieve more efficient plant size and lower per-unit costs.
Thus gains in economic welfare are expected to come from improved allocation of
resources, lower prices to consumers and business firms, and availability of more
varieties to consumers and firms. Realizing economies of scale in manufacturing
also reinforces the welfare-enhancing effect.
The sectoral results for UR-3 for India presented in table 2.8 indicate that the
largest employment increases are in textiles (388,154), wearing apparel (231,338),
trade and transport (124,360), mining (46,546), and leather products and
footwear (42,892). India’s largest employment declines are in wood and wood
products (–226,363), agriculture (–143,922), and the combined categories of
industrial products and machinery. The sectoral results for DR-4 in India pre-
sented in table 2.9 show employment increases in government services (340,109);
38 India and the WTO

Computational Analysis of the Impact on India of the Uruguay Round 39
Emp
loym
ent
Exp
ort
sIm
po
rts
Out
put
Scal
eSe
cto
r(P
erce
nt)
(Per
cen
t)(P
erce
nt)
(Per
cen
t)(P
erce
nt)
(000
s)
Agr
icul
ture
0.70
−2.0
4−0
.09
0.00
−0.0
5−1
43,9
22.3
Min
ing
3.73
−2.0
71.
790.
671.
4146
,546
.0Fo
od, b
ever
ages
, and
tob
acco
5.18
10.6
60.
060.
35−0
.07
−7,8
41.8
Text
iles
18.8
67.
434.
341.
253.
3438
8,15
3.9
Wea
ring
app
arel
54.3
4−9
.57
29.2
31.
3328
.26
231,
337.
8Le
athe
r p
rodu
cts
and
foot
wea
r7.
9734
.60
4.61
1.21
3.70
42,8
92.0
Woo
d an
d w
ood
pro
duct
s4.
8131
.29
–2.6
80.
60−3
.09
−226
,363
.1C
hem
ical
s4.
4412
.54
−1.0
20.
70−1
.46
−21,
998.
1N
onm
etal
lic m
iner
al p
rodu
cts
6.55
22.2
6–0
.45
0.66
−0.9
4−3
2,50
2.0
Met
al p
rodu
cts
4.37
7.23
–2.3
40.
65−2
.76
−96,
777.
2Tr
ansp
orta
tion
equi
pm
ent
7.09
25.2
4–1
.62
0.79
−2.2
3−3
0,91
2.3
Mac
hine
ry a
nd e
qui
pm
ent
2.65
16.3
6–5
.65
1.10
−6.5
6−1
56,5
88.3
Oth
er m
anuf
actu
res
2.60
19.3
1−1
.55
0.76
−1.9
8−1
06,8
83.9
Elec
tric
ity, g
as, a
nd w
ater
4.37
−2.2
71.
211.
110.
366,
171.
9C
onst
ruct
ion
2.86
−2.6
8−0
.27
−0.0
3−0
.08
−11,
520.
2Tr
ade
and
tran
spor
t2.
49−2
.99
0.33
0.28
0.26
124,
360.
2O
ther
priv
ate
serv
ices
2.05
−2.3
9−0
.24
−0.0
6–0
.03
−962
.6G
over
nmen
t se
rvic
es1.
57−2
.12
−0.1
8−0
.03
−0.0
1−3
,189
.9
Ave
rag
e11
.31
8.22
0.43
0.00
0.0
TAB
LE 2
.8Se
cto
ral
Res
ult
s o
f th
e U
rug
uay
Ro
un
d N
ego
tiat
ion
s (U
R-3
): C
han
ge
in E
xp
ort
s, I
mp
ort
s,O
utp
ut,
Sca
le, an
d E
mp
loym
ent
in I
nd
ia

40 India and the WTO
Emp
loym
ent
Exp
ort
sIm
po
rts
Out
put
Scal
eSe
cto
r(P
erce
nt)
(Per
cen
t)(P
erce
nt)
(Per
cen
t)(P
erce
nt)
(000
s)
Agr
icul
ture
11.5
00.
71−0
.19
0.00
−0.1
5−4
49,8
27.9
Min
ing
5.43
−1.8
42.
681.
032.
0769
,399
.1Fo
od, b
ever
ages
, and
tob
acco
7.75
17.8
30.
400.
060.
5260
,679
.6Te
xtile
s8.
6921
.56
1.82
0.78
1.23
148,
188.
9W
earin
g ap
par
el14
.06
24.7
79.
300.
868.
7595
,004
.0Le
athe
r p
rodu
cts
and
foot
wea
r9.
309.
136.
631.
105.
8269
,966
.9W
ood
and
woo
d p
rodu
cts
5.40
5.53
0.03
0.46
–0.2
7−1
8,85
9.3
Che
mic
als
5.75
10.5
3–0
.65
0.92
–1.2
9−1
9,16
7.5
Non
met
allic
min
eral
pro
duct
s7.
6115
.32
0.55
0.92
–0.2
0−6
,811
.1M
etal
pro
duct
s5.
2311
.70
–2.1
51.
13–3
.01
−102
,891
.1Tr
ansp
orta
tion
equi
pm
ent
7.33
12.9
3–0
.03
1.23
–1.0
5−1
4,19
8.4
Mac
hine
ry a
nd e
qui
pm
ent
4.53
10.8
3–3
.04
1.58
–4.4
4−9
9,19
9.1
Oth
er m
anuf
actu
res
4.93
15.5
2–0
.51
1.21
–1.3
2−7
0,10
9.0
Elec
tric
ity, g
as, a
nd w
ater
6.33
–4.5
30.
710.
750.
172,
982.
9C
onst
ruct
ion
15.9
02.
990.
630.
720.
1420
,273
.2Tr
ade
and
tran
spor
t15
.06
14.6
60.
260.
64–0
.07
−35,
549.
3O
ther
priv
ate
serv
ices
16.8
610
.16
0.58
0.58
0.35
10,0
09.5
Gov
ernm
ent
serv
ices
15.4
5–2
.91
1.22
0.86
0.81
340,
108.
6
Ave
rag
e9.
228.
300.
500.
000.
0
TAB
LE 2
.9Se
cto
ral
Res
ult
s o
f th
e D
oh
a D
evel
op
men
t A
gen
da
Neg
oti
atio
ns
(DR
-4):
Ch
ang
e in
Exp
ort
s,Im
po
rts,
Ou
tpu
t, S
cale
, an
d E
mp
loym
ent
in I
nd
ia
textiles (148,189); wearing apparel (95,004); leather products and footwear
(69,967); mining (69,399); food, beverages, and tobacco (60,680); and construc-
tion (20,273). There are employment declines in agriculture (−449,828), the com-
bined categories of industrial products and durable manufactures; and trade and
transport (−35,549).
Although the employment changes for several sectors appear fairly large in
percentage terms in tables 2.8 and 2.9, it should be noted that the Uruguay Round
liberalization was to be phased in over a period of 10 years and presumably the
Doha Round will be phased in over several years. As a consequence, being spread
over time would mitigate possible sectoral employment dislocations.
Unilateral Liberalization by India
In earlier work by Chadha and others (1998a,b), the effects of India’s unilateral,
post-1991 economic reforms were analyzed using a standalone model of the Indian
economy in which the rest of the world was assumed not to undertake any liberal-
ization. It is interesting in this light to consider how India would be affected by
multilateral liberalization in the Doha Round negotiations compared with what it
might undertake unilaterally. For this purpose, we repeated the DR-1 to DR-4 sce-
narios for India on a unilateral basis. The results are reported in table 2.10. It is
interesting that India would appear to gain more from unilateral liberalization in
agriculture, whereas multilateral liberalization of manufactures and services pro-
duces greater welfare effects. In any case there is reason to believe that India stands
to gain by pursuing trade liberalization.
We should also note that India may gain even more if it were to undertake
measures to improve trade facilitation, which is an important but often neglected
area in discussions of international trade. According to one estimate, the global
costs to business of unnecessary red tape and procedures could be as high as
US$70 billion a year and such costs often fall disproportionately on small and
medium enterprises, which ultimately pass it on to consumers in developing
countries (Mehta 2002). Trade facilitation covers a wide range of noneconomic
measures aimed at promoting the expansion of international trade by smoothing
its flow. Such facilitation is expected to benefit trades and consumers by lowering
transaction costs and to benefit governments by enabling them to realize higher
revenue collection as a result of simplified procedures.14 The central budget
(2003/04) presented by the Finance Minister of India on February 28, 2003, has
proposed new measures toward trade facilitation (Government of India 2003,
paras. 184–86).
Computational Analysis of the Impact on India of the Uruguay Round 41

42 India and the WTO
DR-1 DR-2 DR-3 DR-4
MultilateralEquivalent Variation
Percent 0.4 0.7 0.6 1.7Million US dollars 1,617 3,084 2,322 7,023
Returns to Factors, % changeWage Rate −0.1 0.4 0.2 0.5Returns to Capital −0.3 0.6 0.2 0.8
TradeImports (million US dollars) 324 3,280 919 4,524Exports (million US dollars) 285 4,054 804 5,143
Unilateral Equivalent Variation
Percent 0.9 0.3 0.3 1.4Million US dollars 3,658 1,370 1,074 6,103
Returns to Factors, % changeWage Rate −0.1 0.2 0.0 0.2Returns to Capital 0.2 0.5 0.1 0.8
TradeImports (million US dollars) 215 2,182 296 2,694Exports (million US dollars) 279 3,364 437 4,080
MultilateralDR-1: 33 percent bilateral reduction in post-Uruguay Round agricultural importtariffs, export subsidies, and production subsidies DR-2: 33 percent bilateral reduction in post-Uruguay Round tariffs on mineralsand manufacturesDR-3: 33 percent bilateral reduction in tariff equivalents of barriers to trade inservices DR-4: 33 percent bilateral tariffs reduction in all sectors combined (DR1, DR2,and DR3)
UnilateralIndia’s unilateral:UNIDR-1: 33 percent reduction in post-Uruguay Round agricultural import tariffs, export subsidies, and production subsidies UNIDR-2: 33 percent reduction in post-Uruguay Round tariffs on minerals andmanufactures UNIDR-3: 33 percent reduction in tariff equivalent of barriers to trade in servicesUNIDR-4: 33 percent tariff reduction in all sectors combined (UNIDR-1, UNIDR-2,and UNIDR-3)
TABLE 2.10 Impact of Multilateral and Unilateral Trade Liberalization for India

Conclusions and Implications for Policy
The failure of the Third WTO Ministerial Conference in Seattle led to a temporary
setback to the launch of a new round of multilateral trade negotiations. Despite
the consequent uncertainties, the built-in agenda from the Uruguay Round was
mandated for negotiations on agricultural and services liberalization to begin in
the year 2000. In November 2001 the agenda for a new negotiating round was
approved at Doha, Qatar. In this chapter, we have provided computational esti-
mates of the economic effects that might be realized from UR and DR trade liber-
alization for India and other major trading economies.
An important message that emerges is that multilateral liberalization enhances
the economic welfare of all of the major trading economies. India’s welfare gain
is 0.68 percent (US$2.8 billion over its 2005 GDP) when the UR scenarios are
fully implemented. The country’s additional welfare gain amounts to 1.67 percent
($7.0 billion) when the assumed DR multilateral trade liberalization is completed.
Resources in India are allocated toward labor-intensive sectors, such as textiles;
wearing apparel; leather and leather products; and food, beverages, and tobacco.
Real returns to both labor and capital increase. Finally, India benefits even if it
were to undertake unilateral trade liberalization of the order indicated in the mul-
tilateral scenarios.
The gains from the liberalization scenarios that have been noted, of course,
should be interpreted in the light of the assumptions of our modeling structure.
In particular, our computational model abstracts from the effects of macroeconomic
changes and policies. Also, we do not capture the effects of dynamic changes in effi-
ciency and economic growth. Furthermore, we have not analyzed the effects of pos-
sible changes in inflows of foreign direct investment. Finally, the analysis of intersec-
toral employment shifts makes no allowance for the constraining effects of India’s
sectoral exit barriers and its domestic labor laws.
Endnotes
1. Before the announcement of India’s EXIM policy, all imports unless specifically exempted
required a license or a customs-clearance permit. All imports were classified under one of four main
licensing types: restricted items, banned items, limited permissible items, and open general licenses
(OGL). The items falling under OGL were only nominally unrestricted. In practice many OGL imports
required government approval and most remained subject to actual user conditions. The system was
complicated further by applying different import and approval procedures among license types and
frequently shifting products across licensing categories.
2. The goods under licensing included precious, semiprecious, and other stones; safety, security,
and related items; seeds, plants, and animals; insecticides and pesticides; drugs and pharmaceuticals;
chemicals and allied items; items relating to small-scale sector; and miscellaneous and special cate-
gories.
Computational Analysis of the Impact on India of the Uruguay Round 43
3. India implemented the Harmonized Commodity Description and Coding System (HS) for clas-
sifying imports and exports in February 1986. Although the Indian Customs Tariff Schedule is subdi-
vided into 5,134 standard HS 6-digit codes (as of April 1, 1997), India uses a 10-digit HS classification
for import licensing purposes.
4. The Chelliah Committee recommended seven different rates of customs tariff, namely, 5, 10, 15,
20, 25, 30, and 50 percent, to be achieved by 1997/98 (Government of India 1993). It was further sug-
gested that additional or special protection might be given for a limited period to new industries, new
products, or new technologies. The 5 percent rate was to apply to inputs for fertilizer and newsprint, 10
and 15 percent to other basic inputs, 20 percent to capital goods, and 25 percent to chemicals and
intermediates. Other final products (excluding nonessential consumer goods) would be charged 30
percent duty. Nonessential consumer goods, if permitted for import, would have a duty rate of 50 percent.
Although the multiple suggested tariff rates can be used to achieve the Committee’s philosophy of sys-
tematic escalation according to the degree of processing, the result may be effective rates of protection
that are much higher than the nominal tariffs on finished goods. Thus, for example, when QRs on con-
sumer goods are removed, a 50 percent duty on imports of consumer goods combined with a duty of
25 percent or less on tradable inputs would lead to an effective rate of protection close to 100 percent
(Joshi and Little 1994, p. 76). This tariff escalation was prevalent in India’s economy throughout the
1990s. Whereas the simple average tariff on processed goods was 37 percent in 1997/98, unprocessed
goods (primary products) had an average tariff of 25 percent. Significant tariff escalation is further
evident in paper and paper products; printing and publishing; wood and wood products; and food,
beverages, and tobacco (WTO 1998, p. 19).
5. India obtained the right to use QRs from the General Agreement on Tariffs and Trade in 1949
for balance of payments reasons and retained it thereafter. This right was reasserted in its Uruguay
Round submissions. As noted below, however, QRs were to be phased out by 2001.
6. See Chadha (2001 and Chapter 4 of this volume) for a more detailed analysis of India’s services
commitments and policies.
7. It should be noted that we are not considering the effects of the Agreement on Trade-related
Aspects of Intellectual Property Rights and the other agreements on rules and procedures that the
Uruguay Round negotiations encompassed.
8. Agricultural liberalization in the Uruguay Round negotiations presumably was to be as follows:
agricultural import tariffs were to be reduced by 20 percent for the industrial countries and by 13 percent
for the developing economies; agricultural export subsidies were to be reduced by 36 percent for the
industrial countries and by 24 percent for the developing economies; and agricultural production sub-
sidies were to be reduced by 20 percent for the industrial countries and by 14 percent for the developing
economies. However, as noted in Francois (2001),“Basically, in agriculture, we are in a world that allows
scope for great policy discretion and uncertainty as a result of the loose commitments made.” This
means that many countries introduced quantitative restrictions on imports in the form of tariff rate
quotas. There is also evidence of considerable leeway in the choice of the reference period from which to
measure reductions in export subsidies. Furthermore, the disciplines on domestic subsidies were weak-
ened by changes in the definition of the aggregate measure of support. As a consequence, relatively little
agricultural liberalization was accomplished in the Uruguay Round negotiations. In the absence of
detailed information on the various agricultural policy changes that have been made, we have chosen
not to include agricultural liberalization in the Uruguay Round computational scenarios.
9. Under the ATC agreement, quota growth rates will increase in stages over the decade from 1995
to 2005. We assumed in our computations that the MFA quota constraints are eliminated all at once.
10. The post-UR tariff data were adapted from Francois and Strutt (1999).
11. The agricultural sector in the model is assumed to be perfectly competitive, and the manufac-
turing and services sectors are assumed to be monopolistically competitive with free entry.
12. All we can capture with our model is this aggregate change. Were we able to distinguish the
incomes of the rural and urban populations, we would presumably find a rise in the incomes of the
mostly poor rural population.
44 India and the WTO

13. Our results differ from those obtained by Hertel, Hoekman, and Martin (2002, p. 121), who
concluded that “. . . the bulk of the gains go to developing countries, which are estimated to receive three
quarters of the total gains from liberalizing manufacturing trade.” The differences in our results com-
pared with those of Hertel and colleagues most likely stem from the assumptions made in projecting
the database for the model to 2005. That is, Hertel, Hoekman, and Martin projected significantly
greater expansions of the output and trade of the developing economies than in our simpler extrapo-
lations noted above.
14. See Wilson and others (2002) for an analysis of the potential benefits in the Asia Pacific region
of improvements in port facilities, regulatory systems, technical and health standards, and electronic
commerce.
References
The word “processed” describes informally produced works that may not be available commonly
through libraries.
Brown, Drusilla K., Alan V. Deardorff, Alan Fox, and Robert M. Stern. 1996. “The Liberalization of
Services Trade: Potential Impacts of the Aftermath of the Uruguay Round.” In Will Martin and L. Alan
Winters, eds., The Uruguay Round and the Developing Countries. Cambridge, U.K.: Cambridge University
Press.
Brown, Drusilla, Alan V. Deardorff, and Robert M. Stern. 1993. “Protection and Real Wages: Old
and New Trade Theories and Their Empirical Counterparts.” Discussion Paper 331. Research Seminar
in International Economics, University of Michigan, Ann Arbor.
Chadha, Rajesh, 2001. “GATS and Developing Countries: A Case Study of India.” In Robert M.
Stern, ed., Services in the International Economy. Ann Arbor: University of Michigan Press.
Chadha, Rajesh, and Sanjib Pohit. 1998.“Rationalising Tariff and Non-Tariff Barriers on Trade: Sec-
toral Impact on Indian Economy.” Paper prepared for the Tariff Commission, Government of India.
Chadha, Rajesh, Sanjib Pohit, Alan V. Deardorff, and Robert M. Stern. 1998a. “Analysis of India’s
Policy Reforms.” World Economy 21: 235–59.
———. 1998b. The Impact of Trade and Domestic Policy Reforms in India: A CGE Modeling
Approach. Ann Arbor: University of Michigan Press.
———. 1999. “Phasing Out the Multi-Fibre Arrangement: Implications for India.” Paper pre-
sented at the Second Annual Conference on Global Economic Analysis, June, Copenhagen.
Francois, Joseph. 2001. “The Next WTO Round: North-South Stakes in New Market Access Nego-
tiations.” Centre for International Economic Studies, Adelaide, and Tinbergen Institute, Amsterdam
and Rotterdam.
Francois, Joseph, and Anna Strutt. 1999. “Post-Uruguay Round Tariff Vectors for GTAP Version 4.”
Faculty of Economics, Erasmus University, Rotterdam, Netherlands. Processed.
Government of India. 1993. Tax Reforms Committee: Final Report Part II. Ministry of Finance.
———. 2003. Budget 2003–2004. Ministry of Finance.
Hertel, Thomas W., Bernard M. Hoekman, and Will Martin. 2002. “Developing Countries and a
New Round of WTO Negotiations.” World Bank Research Observer 17: 113–40.
Joshi, Vijay, and I. M. D. Little. 1994. India: Macroeconomics and Political Economy 1964–1991.
Washington, D.C.: World Bank.
McDougall, Robert A., Aziz Elbehri, and Truong P. Truong. 1998. Global Trade, Assistance and Pro-
tection: The GTAP4 Data Base. Center for Global Trade Analysis, Purdue University, West Lafayette,
Ind.
Mehta, Pradeep. 2002. “WTO and India: An Agenda for Actions in Post-Doha Scenario.” Jaipur,
India: Consumer Unity and Trust Society.
Mehta, Rajesh. 1998. “Tariff and Non-Tariff Barriers of the Indian Economy: A Profile.” Study
report submitted to the Tariff Commission, Government of India.
Computational Analysis of the Impact on India of the Uruguay Round 45
Pursell, Gary. 1996. “Indian Trade Policies Since the 1991/92 Reforms.” World Bank, Washington,
D.C. Processed.
Srinivasan, T. N. 1998. Developing Countries and the Multilateral Trading System. Boulder, Colo.:
Westview Press.
———. 2001. “India’s Reform of External Sector Policies and Future Multilateral Trade Negotia-
tions.” Discussion Paper 830. Economic Growth Center, Yale University, New Haven, Conn.
Wilson, John S., Catherine Mann, Yuen Pau Woo, Nizar Assanie, and Inbom Choi. 2002. “Trade
Facilitation: A Development Perspective in the Asia Pacific Region.” Singapore: Asia Pacific Economic
Cooperation.
Winters, L. A. 2001. “Harnessing Trade for Development.” Issue Paper prepared for the Conference
on Making Globalisation Work for the Poor—The European Contribution, June 20–21, Kramsfors,
Sweden.
WTO (World Trade Organization). 1998. Trade Policy Review: India. Lanham, Md.: Bernan Associates.
46 India and the WTO

An important feature of the Uruguay Round negotiations was the agree-
ment by members of the World Trade Organization (WTO) to abolish the
Multifibre Arrangement (MFA) quotas1 that (with their predecessors)
have restricted exports of textile and clothing products from developing countries
for close to 40 years. This iniquitous system of quotas has violated all of the fun-
damental principles of the multilateral trading system and has discriminated
against the poorest countries and those seeking to move up from reliance on com-
modity trade toward an emphasis on manufactures.
Developing countries had to invest a large amount of their negotiating capital
into securing the developed countries’ agreement to abolish these quotas. As Mattoo
and Subramanian argue in Chapter 13 of this volume, those countries may need to
press hard to ensure that the abolition of the quotas goes according to plan.
Although enormously welcome, the prospective abolition of these quotas will
not necessarily generate automatic benefits to all developing countries. Quota
abolition will create opportunities for developing countries, but also will expose
them to additional competition from other, formerly restrained exporters. The
outcome for any individual country will depend heavily on its policy response.
47
3
Implications ofMultifibre Arrangement
Abolition for India and South Asia
Sanjay Kathuria, Will J. Martin, and Anjali Bhardwaj
The views expressed in this chapter are entirely those of the authors and should not be attributed in
any manner to the World Bank (Kathuria and Martin are at The World Bank, and Bhardwaj works as a
freelance consultant). We are grateful to D. K. Nair, Secretary General of the Indian Cotton Mills Fed-
eration, for numerous discussions on the subject of this chapter that have contributed greatly to our
understanding of the Indian textiles industry. We also thank Garry Pursell for useful comments and
suggestions.

Countries that take the opportunity to streamline their policies and improve their
competitiveness are likely to increase their gains from quota abolition.
In the following section we introduce the economics of the MFA, using a simple
diagrammatic treatment of the effects of MFA-type quotas. In the second section we
examine some of the empirical evidence, focusing particularly on India. Kathuria
and Bhardwaj (1998) recently have provided some new results on the magnitude of
the effective taxes imposed by the MFA on India’s exports of textiles and clothing.
This chapter further updates those results, and in the third section we discuss the
likely effect of quota abolition on South Asia, with a focus on India. In the fourth
section we examine the domestic distortions that affect this industry and then dis-
cuss policy options in the fifth section. The final section summarizes the chapter.
The Basic Economics of the MFA
A key feature of the MFA quotas is that they are imposed only by a subset of coun-
tries and only on exports from a subset of exporters (Hamilton 1990). For an indi-
vidual exporter, these quotas restrict access to the MFA importer markets and
encourage the exporter to divert its exports from those restricted markets to
other, unrestricted markets. An important feature of this policy regime is that the
importers allow exporters to allocate the quotas and hence to benefit from the
higher prices in the restricted markets. This complication may thus be considered
a kind of payoff, given that the system of quotas was of such doubtful legality
under the General Agreement on Tariffs and Trade (GATT).
The basic economic implications of the MFA for an individual exporter can be
summarized in the simple diagram drawn from Martin and Suphachalasai (1990)
and presented as figure 3.1. To keep the diagram simple we base it on the widely
used Armington assumption that the products produced by the exporter of interest
are differentiated from those produced by other countries. This assumption allows
us to draw well-defined import demand curves for the country’s products in the
restricted markets (DR) and in the unrestricted markets (DU). The horizontal sum-
mation of these two demand curves gives the global demand (DT) for the exports
from the exporter under consideration. In the absence of any quota restrictions, as
in figure 3.1, the intersection of this total demand curve and the export supply curve
from the country in question will yield the uniform price at which exports are sold.
In the undistorted equilibrium represented in figure 3.1 the same price applies
in both the “restricted” (the restriction, of course, comes about in figure 3.2) and
unrestricted markets, and the allocation of exports between the two markets
depends only on the magnitude of demand in those markets. When quotas are
introduced in the restricted market as shown in figure 3.2, the quantity exported
to that market declines. Because of the restrictions, the price received for exports
48 India and the WTO
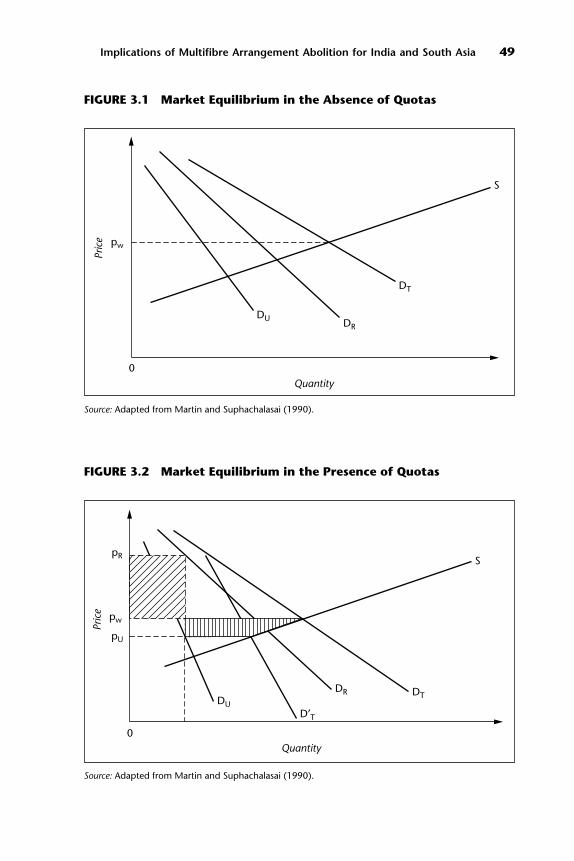
Implications of Multifibre Arrangement Abolition for India and South Asia 49
Pric
e
DRDU
DT
pw
0Quantity
S
FIGURE 3.1 Market Equilibrium in the Absence of Quotas
DRDU
DT
pw
0
D′T
S
pR
pU
Pric
e
Quantity
FIGURE 3.2 Market Equilibrium in the Presence of Quotas
Source: Adapted from Martin and Suphachalasai (1990).
Source: Adapted from Martin and Suphachalasai (1990).

to the restricted market increases from pw to pR. The price received for exports to
the unrestricted market, however, declines from pw to pU (which is the new world
price/marginal price). Note also that the overall demand curve facing the country
(D′T) becomes steeper, and hence less elastic, because of the zero elasticity of
demand in the restricted market. Because the marginal price of output falls, the
volume of output in the industry unambiguously declines. Whether static welfare
increases or decreases depends on whether the net gain from quota rents in the
restricted export market compared with the situation in figure 3.1 (represented by
the crosshatched area in figure 3.2) outweighs the losses in the unrestricted mar-
kets (represented by the vertically shaded area in figure 3.2).2
The overall effect of the MFA on a country’s welfare cannot, of course, be
determined simply by the static welfare effects depicted in figure 3.2. A major
problem with gains that accrue in the form of rents is that they create incentives
for what Bhagwati (1988) has termed Directly Unproductive (DUP) activities in
which enterprises and individuals use real resources in pursuit of the quota rents.
Krishna and Tan (1998) pointed out that the systems of quota allocation used in
the South Asian countries encourage such activities. Quota allocations frequently
are based on historic export performance, which creates an incentive for firms to
increase their exports to unrestricted third markets even when those markets are
not directly profitable, thus increasing the losses accruing in unrestricted markets.
A further source of loss with quota rents is loss to exporters through rent sharing.
According to Krishna and Tan (1998), when export quotas are sufficiently nar-
rowly defined, some major importers appear to acquire sufficient market power to
appropriate some of the quota rents.
Although figure 3.2 provides a basis for evaluating the partial effect of quotas
on a single country’s exports, it is inadequate as a basis for evaluating the overall
impact of the MFA on a country because it does not take into account the effect of
restrictions on other countries’ exports. Restrictions on those exports tend to
increase the demand for exports from the country of interest. It is clearly possible
that some exporters might benefit in the short term from these arrangements if
they are less restricted than other countries. Traditionally, small suppliers have
had an advantage in being less likely to trigger quotas than were such major sup-
pliers as India or China. It should be mentioned, however, that in recent years the
key gainers in terms of restricted market access have been relatively large suppli-
ers, such as Mexico, Turkey, and the Central European countries that have bene-
fited from regional preferences granted by the major importers.
One very crude indicator of the restrictiveness of quotas for a particular coun-
try is the share of its exports directed to quota markets. If all countries were
broadly similar, one might expect the share of exports directed to quota and non-
quota markets to be roughly the same.3 Because each country’s MFA quota levels
50 India and the WTO

are based on more or less arbitrary historical factors there are good reasons to
anticipate that they will result in barriers whose export-tax equivalents vary con-
siderably between exporter-importer pairs. Under such circumstances the shares
of export revenues from restricted and unrestricted markets will vary. The more
competitive a country is relative to its quota allocation, the greater is likely to be
the share of its export revenues received from sales outside the restricted markets.
A better indicator, where this is available, is the export-tax equivalent of the MFA
quotas that restrict exports from one supplier to a particular market.
All of the analysis to this point has been based on comparatively static method-
ology. When we take a dynamic perspective on the problem, the costs of the MFA
are potentially more serious. A key feature of an outward-oriented development
process seems to be identifying industries where relatively high levels of produc-
tivity can be achieved. Bernard and Jensen (1999) found that the expansion of
such industries, rather than learning by doing within industries, appears to
account for the bulk of the potentially formidable gains associated with export
growth. Where superior technology in one sector can be introduced into an eco-
nomy with low productivity in other sectors, and hence low factor prices, such a
sector is extremely profitable at first. When the policy environment is sufficiently
accommodating and the infrastructure is adequate, such a leading sector can grow
extremely rapidly. The extraordinary growth rates achieved by the clothing-export
industry in Bangladesh, where exports are said to have grown at close to 30 percent
a year since 1985, manifest this phenomenon.
The presence or continuing threat of export quotas reduces the opportunity
for developing countries to use the relative ease of adopting new technology in the
clothing sector as a first step on the ladder of economic development. At the other
end of the product life cycle, it encourages economies like Hong Kong (China),
whose natural comparative advantage in this labor-intensive industry has largely
dissipated, to continue producing because of the quota rents that are available to
incumbent exporters.
Export Tax Equivalents4
One of the major problems associated with nontariff barriers (NTBs) such as
quotas is their lack of transparency. The presence of a quota of a certain size does
not indicate clearly whether exports are being restricted by a large or a small
amount. Because MFA quotas are administered by exporting governments, these
valuable quotas could be used to generate government revenues. More commonly,
they are allocated to individual firms, which usually choose to use them or to sell
them to another exporter. To export apparel or textile goods subject to quotas,
exporters must either buy quotas for these goods or pass up the opportunity to
Implications of Multifibre Arrangement Abolition for India and South Asia 51
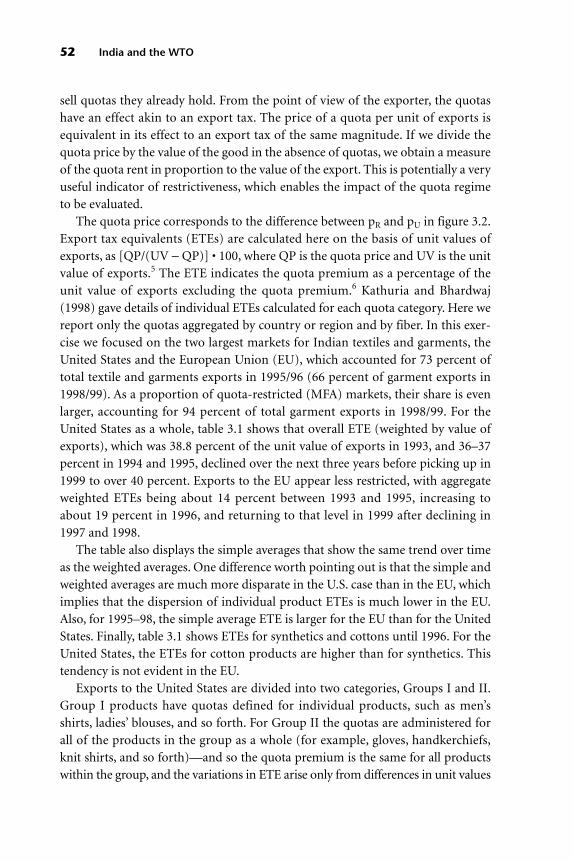
sell quotas they already hold. From the point of view of the exporter, the quotas
have an effect akin to an export tax. The price of a quota per unit of exports is
equivalent in its effect to an export tax of the same magnitude. If we divide the
quota price by the value of the good in the absence of quotas, we obtain a measure
of the quota rent in proportion to the value of the export. This is potentially a very
useful indicator of restrictiveness, which enables the impact of the quota regime
to be evaluated.
The quota price corresponds to the difference between pR and pU in figure 3.2.
Export tax equivalents (ETEs) are calculated here on the basis of unit values of
exports, as [QP/(UV − QP)] • 100, where QP is the quota price and UV is the unit
value of exports.5 The ETE indicates the quota premium as a percentage of the
unit value of exports excluding the quota premium.6 Kathuria and Bhardwaj
(1998) gave details of individual ETEs calculated for each quota category. Here we
report only the quotas aggregated by country or region and by fiber. In this exer-
cise we focused on the two largest markets for Indian textiles and garments, the
United States and the European Union (EU), which accounted for 73 percent of
total textile and garments exports in 1995/96 (66 percent of garment exports in
1998/99). As a proportion of quota-restricted (MFA) markets, their share is even
larger, accounting for 94 percent of total garment exports in 1998/99. For the
United States as a whole, table 3.1 shows that overall ETE (weighted by value of
exports), which was 38.8 percent of the unit value of exports in 1993, and 36–37
percent in 1994 and 1995, declined over the next three years before picking up in
1999 to over 40 percent. Exports to the EU appear less restricted, with aggregate
weighted ETEs being about 14 percent between 1993 and 1995, increasing to
about 19 percent in 1996, and returning to that level in 1999 after declining in
1997 and 1998.
The table also displays the simple averages that show the same trend over time
as the weighted averages. One difference worth pointing out is that the simple and
weighted averages are much more disparate in the U.S. case than in the EU, which
implies that the dispersion of individual product ETEs is much lower in the EU.
Also, for 1995–98, the simple average ETE is larger for the EU than for the United
States. Finally, table 3.1 shows ETEs for synthetics and cottons until 1996. For the
United States, the ETEs for cotton products are higher than for synthetics. This
tendency is not evident in the EU.
Exports to the United States are divided into two categories, Groups I and II.
Group I products have quotas defined for individual products, such as men’s
shirts, ladies’ blouses, and so forth. For Group II the quotas are administered for
all of the products in the group as a whole (for example, gloves, handkerchiefs,
knit shirts, and so forth)—and so the quota premium is the same for all products
within the group, and the variations in ETE arise only from differences in unit values
52 India and the WTO

Category 1993 1994 1995 1996 1997 1998 1999
United States:Group I
Weighted average 44.1 37.8 41.2 31.3 26.5 29.1 41.7Simple average 32.8 24.7 25.9 23.4 23.1 24.0 32.2
Group IIWeighted average 5.8 9.7 0.8 0.6 5.1 5.2 31.4Simple average 13.8 14.6 1.5 1.3 5.2 4.8 35.6
TotalWeighted average 38.8 35.7 36.9 28.0 23.9 25.9 40.2Simple average 18.5 17.1 7.2 6.4 9.7 9.2 34.8
CottonWeighted average 48.2 50.9 51.0 38.9 n.a. n.a. n.a.Simple average 28.1 23.7 15.8 14.2 n.a. n.a. n.a.
SyntheticsWeighted average 4.7 13.0 16.4 16.4 n.a. n.a. n.a.Simple average 11.8 19.0 13.1 10.4 n.a. n.a. n.a.
European Union:Total
Weighted average 14.0 13.9 14.4 18.6 15.5 14.8 18.8Simple average 12.5 12.9 11.9 14.8 13.4 12.1 17.1
CottonWeighted average 13.7 14.1 13.3 17.4 n.a. n.a. n.a.Simple average 14.3 14.3 12.7 16.2 n.a. n.a. n.a.
SyntheticsWeighted average 14.5 9.0 16.8 22.9 n.a. n.a. n.a.Simple average 10.8 11.4 10.6 12.6 n.a. n.a. n.a.
Implications of Multifibre Arrangement Abolition for India and South Asia 53
(see Kathuria and Bhardwaj [1998] for product-wise ETEs). In 1995 Group II gar-
ment ETEs in the United States declined sharply, but because of the low weight of
Group II in the total, the weighted average did not decline. It was only in 1996,
when the ETE of some of the important Group I garments (338—knit shirts and
blouses) fell sharply, that the weighted ETE fell for Group I and for the United
States as a whole. The recovery in 1999, on the other hand, related to increases in
ETEs for both Group I as well as Group II products.
It also should be noted that ETEs in the range of 28–40 percent for the United
States are higher than the actual tariffs levied by the United States on imports of
TABLE 3.1 Export-Tax Equivalents for Indian Garment Exportsto the United States and the European Union(Percentage)
n.a. Not applicable.
Source: Field work, updating analysis in Kathuria and Bhardwaj (1998).
textiles and apparel, and (partially) indicate the hidden cost of the MFA, for both
the exporting and the importing countries.
The presence of substantial ETEs in the Indian garment and textiles industry is
indicative of excess demand, given quota allocations. After what appears to have
been a temporary decline in 1997 and 1998, the ETEs for Indian garments recov-
ered strongly in 1999. These high ETEs mean that there may be static welfare gains
(see figure 3.2) for India from the quota rents—but those gains need to be set off
against possible declines in prices in unrestricted markets. A more fundamental
loss, however, would seem to be the loss of potential output and all its associated
welfare effects in terms of employment growth, productivity growth, and poten-
tially high profits.
There is little doubt that the ETEs could have been even higher had there been
lesser domestic policy constraints on the operation and productivity of Indian
firms. To put it another way, India has the potential to benefit substantially from
the abolition of quotas in terms of increased market access, employment and out-
put growth, and productivity gains. Policy constraints must be eased for another
reason—the increased import competition resulting from the removal of India’s
own import restrictions since April 2001.7 Such constraints, which are well known
in India, are discussed in the fourth section below.
Implications of MFA Abolition
Recent studies using general equilibrium modeling techniques have examined the
implications of MFA abolition for South Asia. Another relevant series of studies
has assessed the implications of domestic reforms in India before and after such
abolition. In these various studies a key input is the availability of export-tax
equivalents such as those just discussed for India.
Evaluating the implications of MFA abolition requires a model comprehensive
enough to take into account the interactions between suppliers and their markets,
as well as the interactions between the textile and clothing sectors and other sec-
tors of each economy. This requirement favors the use of computable general
equilibrium models, which can incorporate these different features. Several such
studies were conducted as part of the evaluation of the Uruguay Round, including
those of Hertel and others (1996) and Harrison, Rutherford, and Tarr (1996).
Both studies concluded that South Asia in total would benefit significantly
from abolition of the MFA. Hertel and others concluded that the gains to the
region would be about US$2 billion per year. These results point to substantial
overall gains that are likely to be even greater today than they were estimated to be
in 1996 because of the increases in export-tax equivalents reported above and
because of the completion of regional arrangements (that is, the North American
54 India and the WTO

Free Trade Agreement [NAFTA] and agreements between Europe, Central
Europe, Turkey, and other Mediterranean countries) that have diverted export
opportunities away from South Asia.
Quota abolition will greatly increase the return from reforms in the domestic
industry, and increase the defensive need for South Asian countries to improve
productivity in these sectors because countries that do not reform to increase
their efficiency will face greatly increased competitive pressure as other exporters
currently repressed by the quotas will also be liberalized.
Elbehri, Hertel, and Martin (1997) examined the implications of a number of
policy reforms that could increase productivity in the textile and clothing indus-
tries in India. One experiment considered a series of reforms that would raise
labor productivity in the clothing sector by 67 percent—to roughly the level
enjoyed by China. This increase in productivity would seem a realistic goal for
such policy reforms as reductions in disincentives for operating in factory mode
(see Kathuria and Bhardwaj [1998]) and allowing foreign direct investment (FDI)
in the industry. The experiment was conducted both before and after abolition of
the quotas to assess the importance of prior abolition of the MFA. The welfare
results were then decomposed to allocate them to their sources. The results of the
experiment are shown in table 3.2.
The total welfare gains in table 3.2 are divided into direct effects of productiv-
ity growth, increases in allocative efficiency, and terms-of-trade gains. The welfare
gains resulting from productivity increases depend on the size of the sector in
which the gain occurs. The gains in allocative efficiency depend on the induced
changes in the quantities of exports and imports passing over trade barriers—the
higher the barriers over which additional imports pass, the larger the difference
between the value of imports in the country and their external cost, and the larger
the gains from additional imports.8 The terms-of-trade changes depend on the
effects of the reform on the average prices for India’s exports.
Implications of Multifibre Arrangement Abolition for India and South Asia 55
TABLE 3.2 India: Welfare Effects of Reforms That Raise LaborProductivity in Clothing Sectors, 1992 (US$ millions)
AllocativeTotal Welfare Terms of Trade Efficiency Productivity
Before MFA 577 62 74 442abolitionAfter MFA 1,700 476 255 970abolition
Source: Adapted from Elbehri, Hertel, and Martin (1997).

Somewhat surprisingly, the terms-of-trade effects reported in table 3.2 were
positive in both of the experiments considered. Two main factors contributed to
this result.9 The first is that the boost to productivity in the clothing industry
caused it to draw resources from other sectors. As a consequence, exports of all
goods other than clothing fell and that led to an increase in the export prices
received for those goods. A second important factor was that the elasticity of sub-
stitution10 for clothing in the Global Trade Analysis Project (GTAP) database is
twice as high as for most other products (Huff and others 1997, p. 125), thereby
making the elasticity of export demand for clothing higher than for other prod-
ucts. This difference in elasticities means that the terms-of-trade losses resulting
from falls in the export price for clothing are less than the gains for other goods. In
the first case in table 3.2, that is, before abolition of quotas, an additional factor
comes into play. In this situation the rent-inclusive price received for exports to
quota markets does not decline even after an increase in clothing exports—rather,
the quota rents received by India increase in these markets. Clearly there is some
uncertainty about whether the terms-of-trade effects will be positive in all cases.
What is important for our purposes is whether the gains from reform rise or fall as
a result of quota abolition.
From table 3.2 it is very apparent that the gains from reforms are much higher
after the quotas are abolished. Part of this increase merely reflects the greater size
of the industry when quotas have been removed. For that larger industry a given
increase in productivity has a greater positive effect on income. Another substan-
tial source of welfare gains is the improved terms-of-trade effect resulting from
abolition of the quotas. Prior to abolition an outward shift in the supply curve
must confront a relatively inelastic demand curve. After abolition the overall
demand curve facing the country becomes more elastic and hence the favorable
terms-of-trade effect becomes much larger, which more than makes up for the
loss of the quota-induced positive price effects mentioned in the previous para-
graph. The allocative efficiency effect is also larger because the increase in produc-
tivity after the reform permits a much greater increase in imports over India’s high
tariff barriers. The overall effect is roughly to triple the gains from domestic
reform.
This experiment considered only the effect of improving productivity in the
Indian textile and clothing sectors. The abolition of the MFA quotas agreed to in
the Uruguay Round will not be confined to India, of course, but will cover all
members of the WTO.11 Although model-based research has suggested that South
Asia will gain from this process (Yang, Martin, and Yanagishima 1997), South Asia
will face greatly increased competition in the industrial country markets. Unless
the pace of reforms is maintained, South Asia is likely to suffer severely from this
increase in competition.
56 India and the WTO

Domestic Policy Constraints in India
Having considered the implications of the abolition of the MFA, we now consider
the domestic policy constraints that have long affected the textile and clothing
industries in India and elsewhere in South Asia. These constraints are particularly
severe in India, which has perhaps a stronger tradition of intervention in industry
policies than do other South Asian countries. Many of the distortions that reduce
the efficiency of the sector are quite complex and assessments of their impact
require detailed studies.
Disincentives to Operating in the Factory Mode
The garment industry is based on a system of decentralized production. This
decentralization results at least partly from the existence of labor legislation and
the lack of an effective exit policy, as well as the reservation of garment (until
recently) and hosiery production for the small-scale sector.12 Decentralized produc-
tion, however, also has natural advantages, such as cheap labor in the subcontracted
firms and production flexibility. The tax regime that grants exemptions and conces-
sions in tax payments to small-scale producers also favors the decentralized mode.
The question that now needs to be addressed is whether the decentralized system of
production is becoming a constraint to investment and therefore to increased
productivity and growth in the apparel industry.
Indian garment exports have been niche-based, focusing on low volume and
high variety of outputs, within the broad area of fashion clothing and especially
ladies’ outerwear. The flexibility in the Indian production system is eminently
suited to meeting this demand. In fact, the nature of demand and the characteris-
tics of the production system are mutually reinforcing. The downside of relying
on fabricators is that variations are likely among different lots of output. This
effectively prevents India from becoming a major player in the mass market for cloth-
ing, which demands good and consistent quality across huge volumes of a single
item of clothing.13 Moreover, the average quality of output, although much
improved, still has not allowed the price to go beyond the middle range.
All of the countries with very successful garment exports have a much lower
level of subcontracting than does India. As Khanna (1993, p. 285) pointed out, in
the early 1990s apparel firms in India subcontracted 74 percent of their output,
compared with only 11 percent for Hong Kong (China), 18 percent for China, 20
percent for Thailand, 28 percent for South Korea, and 36 percent for Taiwan
(China). All of these countries have a broader base of exports and have done very
well in the market for large volumes of uniform products. Khanna also presented
evidence that apparel firms are more productive in East Asian countries than in
Implications of Multifibre Arrangement Abolition for India and South Asia 57

India because of far larger investments in machinery, even in low-wage China.
Indian firms tend to invest more in sewing machines and less in processing and
special machinery.14 For Indian exports to grow substantially beyond present lev-
els the current overwhelming reliance on fabricators will have to change.
Much of the garment industry is aware that factory investment is needed but
the industry has been unwilling to commit itself to larger investments. This hesi-
tancy is to some extent a response to the failures of some high-profile garment
factories, caused at least partly by labor problems. It is not as though there are no
large organized-sector firms in India—quite the contrary. So what makes the gar-
ment industry so different or unable to handle the labor issue? Perhaps it is the
high export orientation of the industry and its focus on fashion goods, wherein
even a short strike can cripple the firm.15 A second reason for the lack of invest-
ment in factories is that the domestic fabric base is not fully compatible with the
demands of factory production. The large lengths of uniform lots of fabric that
are needed for factories are not being produced in the domestic sector because
fabrics are sourced largely from (small) powerlooms and because there are few
high-quality fabric dyeing and printing facilities.
Our own judgment on this is that subcontracting is a low-risk, low-capital
strategy. In subcontracting, the bulk of the labor force is “outsourced,” which
results in a major decline in fixed costs. Investments in equipment and factory
space are also minimized. Exporters are unwilling to trade this off against an
unproven and high-risk strategy, unless they are pushed to the wall because
demand for the present kind of products starts to decline—and that has not hap-
pened so far. Risks are high for the following reasons. First, labor is a fixed cost in
India because of the grave difficulty of shedding labor in an industry where
demand can be cyclical. Second, while investing in a large factory for garments,
exporters had to make a commitment to export 50 percent of their output in per-
petuity (until de-reservation of garments in 2000). Although actual exports may
exceed the commitments, the obligation and the attendant monitoring of the obli-
gation (the “Inspector Raj syndrome”) by the authorities enhance the investor’s
perception of inherent risk. Third (and this is more speculative), the factory mode
may make the final product more expensive (albeit of higher quality), whereas the
additional return from the domestic market is uncertain because it is still highly
sensitive to price. This may make the exporter more export-oriented than he
would like to be or than the government requires him to be.
Fiber Bias, Product Reservation, and the Hank Yarn Obligation
Perhaps the most critical aspect is the policy bias against synthetic fibers. This bias
arose from the view that “. . . cotton is for the masses and synthetics for the
58 India and the WTO
classes!”16 as well as from a concern for cotton producers. Manmade fibers (MMF)
have always been subject to higher rates of indirect taxation vis-à-vis similar cotton-
based products. Moreover, domestic costs of manufacturing synthetic fibers and
polyester-filament yarn are high because of uneconomic plant size in an industry
where economies of scale are very important. This situation arose from the indus-
trial-licensing policy that licensed relatively small plants for production of speci-
fied outputs with little interfiber flexibility. The latter policy changed with the
coming of the Textile Policy of 1985, which adopted a distinct multifiber
approach. The gap has narrowed, although tax policies still discriminate against
MMF vis-à-vis cottons, and this discrimination at the fiber stage continues into
the yarn and fabric stages. For example, whereas the excise duty on cotton yarn in
1997/98 was 5.75 percent, it was 20.7 percent on blended yarn and 34.5 percent on
PFY (polyester filament yarn).17 Moreover, imported inputs for production of
PSF (polyester staple fiber) and PFY are still subject to high duties. In 1998, for
example, the duty was 25 percent on dimethylene terephthalate (DMT), purified
terephthalic acid (PTA), and monoethylene glycol (MEG), and 30 percent on
caprolactum.18
Although the policy bias has narrowed since 1997/98, the differential still pre-
vails in the following ways: (a) controls on the export of cotton and cotton yarn
mean that prices of raw cotton are typically below international prices, which pro-
vides an implicit subsidy to consumers of cotton; (b) the still high import duties
raise the cost of synthetic yarn and intermediates; and (c) the domestic duties
such as excise are lower for cotton fabrics. This combines with a trade regime that,
despite improvements, remains cumbersome and imposes high transaction costs,
for example, when exporters claim duty drawback on exports or want duty-free
imports for exports. The combination of the cotton bias and the high transaction
costs imposed by the trade regime has meant that India’s production, consumption,
and export of textiles and garments are still heavily weighted in favor of cotton-based
products. For example, cotton exports were 83 percent by volume and 75 percent by
value of all apparel exports from India in 1993, and this fell only slowly to 81 percent
and 71 percent, respectively, in 1998. By comparison, world exports and con-
sumption are predominantly in the synthetic blends.
The potential gains from promoting a true multifiber policy cannot be pre-
cisely estimated but the possibilities are very promising. One could think of an
increase in India’s overall exports based on the world-demand pattern of noncot-
ton to cotton consumption, using as a base the current value of cotton-based
exports. In 1998/99, 71 percent of US$5.3 billion in garment exports and 70 per-
cent of $8.4 billion in all textiles exports (including garments) were cotton based.
If cotton-based exports had been only 50 and 40 percent of total exports, respec-
tively, and assuming no decrease in cotton exports, total exports of textiles in
Implications of Multifibre Arrangement Abolition for India and South Asia 59

1998/99 would have been $11.7 billion and $14.7 billion, respectively, and gar-
ments would have been $7.5 billion and $9.4 billion, respectively. Thus, had India’s
policies not been cotton biased, its textile and garments exports could have been as
much as 75 percent higher than they are on this count alone. Of course the domestic
bias could have been substantially mitigated had the import-duty drawback and
the duty-free import-for-export system worked more efficiently.
Promotion of the handloom sector has been a central feature of the textile pol-
icy in India. According to the Ministry of Textiles Annual Report of 1998/99,
handlooms provided direct and indirect employment to over 12.4 million
weavers. This and a desire to preserve culture and heritage have meant that the
government has used several instruments to prop up the handloom sector. One of
these instruments is the reservation of 11 textile articles (such as cotton and silk
sarees, dhotis, towels, lungis, bedsheets, shawls, blankets, and so forth) for exclu-
sive production in the handloom sector, under the 1996 policy on this issue. The
implementation of this policy got a boost when in 1994 the Indian Supreme
Court dismissed the petitions challenging the Handlooms (Reservations of Arti-
cles for Production) Act of 1985.
The futility of this policy can be gauged from the fact that there were, accord-
ing to government estimates, as many as 1.4 million powerlooms in India at the
end of 1995. As Misra (1993) pointed out, the policy ignores the dismal past
record of enforcement measures and the huge administrative machinery required
to enforce this policy. Besides requiring this totally unproductive administration,
the policy is also a breeding ground for corruption. It is no surprise that Misra
concluded that the Handlooms Act has made little material difference to the state
of the handloom sector. On the other hand, it has penalized the domestic industry
as a whole. As in the case of small-scale industry (SSI), foreign-made products in
the form of imports can compete on these items even while domestic industry is
kept out.
The Hank Yarn Obligation stipulates that spinning mills should supply not less
than 50 percent of the yarn marketed by them in the form of hanks for use by the
handloom sector (reduced to 40 percent under an order of the Textile Commis-
sioner dated January 2003). Hank yarn is exempted from excise and sales tax and
opens up possibilities for corruption, misdeclaration, and the like. There have
been direct costs to this policy and longer-term effects on investment decisions.
Misra (1993) advocated doing away with the obligation and, if necessary, having
handloom-development agencies set up independent hank-reeling centers close
to areas where handlooms are concentrated.19
All these policy restrictions impair the efficiency of the industry and result in
an upward shift in its supply curve. This in turn results in lower measured ETEs
than would have prevailed in a less constraining policy environment (a downward
60 India and the WTO

shift in the supply curve results in an increase in the quota price—intuitively, it
can be thought of as an increase in competition for the same quota). Removing
these restrictions will be vital in the post-quota world where competitiveness will
be the key.
Key Policy Imperatives
To summarize the policy discussion, India’s textile industry will benefit from pol-
icy action along the following lines:
• Reduction of disincentives for factory-mode production. The recent repeal of the
reservation of garments production for small-scale units has removed a major
disincentive for factory-mode production.20 Such policies have allowed China,
with factor endowments very similar to those of India, to march well ahead of
India in the export business. Second, and accompanying SSI de-reservation, is
the introduction of a labor policy wherein labor can be retrenched if necessary,
with appropriate safeguards.21 Part of the pressure for these changes is already
appearing from international buyers who are demanding to see factory-type
production in conditions where they can be confident about production sys-
tems, quality control, and working conditions.
• Removal of the policy bias (high taxation) against synthetic fibers (which is
admittedly lower than in the past), thereby increasing the domestic base of syn-
thetic fibers and providing the factories with an additional source of demand
and an avenue to increase exports in a major way. Cheaper domestic sourcing
may also reduce the need for exporters to import synthetic fibers and would
thereby reduce their transaction costs.
• Eliminations of the reservation for exclusive handlooms production will enable
large and small Indian firms to compete equally with large foreign firms
(which cannot be barred from exporting these products to India), and elimi-
nate the large administrative apparatus that polices compliance, thereby reduc-
ing the bureaucratic (Inspector Raj) cost imposed on firms. In a similar vein,
elimination of the hank-yarn obligation will help. Neither policy has been suc-
cessful at propping up the noncompetitive segments within handlooms. The
2000 National Textile Policy promises to review these policies, “keeping in
mind the needs of the handloom industry.”
• Other policies of a more generic nature will also help—for example, making
imported fabrics available for export production in an effective manner. Cur-
rently, there are long delays in shipments and clearance, and there are many
problems in the operation of the duty-free input-for-exports schemes (see Nair
and Kaul 1996). In general, the transaction costs of trading remain very high
Implications of Multifibre Arrangement Abolition for India and South Asia 61

and contribute in a substantial way to the antiexport bias that still persists in
the Indian economy. Finally, continued easing of trade constraints including a
reduction in the high rates of customs tariffs will also promote exports.22
Conclusion
This chapter has set out the basic economics of the MFA applicable to the South
Asian countries and examined the implications for domestic reform. The key to
assessing the implications of this discriminatory regime is to recognize the price
discrimination among markets. This discrimination means that the benefits of
any quota gains in the restricted industrial markets must be weighed against losses
in the unrestricted markets where prices are depressed by the regime.
A key set of parameters for any evaluation of the MFA is the magnitude of the
implicit export taxes that are imposed on a country’s exports of textiles and cloth-
ing. These taxes were found to be substantial in an earlier study by Kathuria and
Bhardwaj (1998). Updates of these estimates suggest that the ETEs of these quotas
may well have declined in 1996, but they appear to have increased in 1999 to an
average of 40 percent in the United States and 20 percent in the EU—thereby
imposing substantial barriers to Indian exports and highlighting the strong com-
petitiveness of India’s producers of textiles and apparel even despite the regulatory
and cost burdens they face.
The limited available evidence about effects on India and other countries in
South Asia suggests that the gains from domestic reform to raise productivity in
these industries will greatly increase following abolition of the quotas. Part of the
increase in the gains comes from increases in the scale of the industry experienc-
ing the productivity gain, but another important source of gains is a reduction in
the terms-of-trade losses associated with increased textile and clothing exports.
Following removal of the quotas, important parts of the world textile and clothing
markets will be much more price responsive. Overall, there are substantial terms-
of-trade gains when productivity rises after the abolition of the quotas because
resources are attracted into clothing and out of sectors where export-demand
curves are relatively inelastic. Overall gains of about US$2 billion a year were
found for India alone by increasing productivity by 67 percent in the clothing sec-
tor to bring it roughly into line with China.
The substantially improved gains after quota abolition provide an analytical
foundation to the demands of India and its South Asian neighbors for “. . . an
immediate need for a more meaningful integration of the textile and clothing sec-
tor. . .Measures in this regard should include, inter alia, accelerated removal of
quota restrictions. . . and implementation of increased growth rates for the
remaining years of the Agreement on Textiles and Clothing . . . .”23
62 India and the WTO

Within India, policymakers may have been prepared to accept a slow pace of
reform in the textile and clothing sectors in the past, when opportunities were
restricted and threats in the domestic market were limited. But to do so in the
future will mean missing out on potentially far greater direct gains from produc-
tivity improvements. In addition, it will expose these industries to much greater
risk of losing ground in a fiercely competitive world market. Finally, as trade bar-
riers start coming down following World Trade Organization negotiations in
India and elsewhere, the industries also will face substantially increased competi-
tion in their home markets—a fact that lends an urgency to domestic policy
reform. Urgent action is therefore required to address the disincentives for factory-
based operations, including labor laws, removing the policy bias against synthetic
fibers, and reducing the still high transaction costs of trading.
Endnotes
1. Formally, the MFA was replaced by the Agreement on Textiles and Clothing but the basic archi-
tecture of these quotas is the same as those under the MFA and so we use the same terminology.
2. Producer welfare in figure 3.1 is represented by the area between pW and the supply curve S. The
gain in welfare in figure 3.2 is the area above pW (the cross-hatched area), and the area below pW is the
loss in welfare (the vertically hatched area).
3. Of course countries are not the same, and there may be reasons, such as proximity or historical
performance, for some countries to have much higher shares of exports to quota markets. However,
the export share still provides a useful benchmark.
4. This section is based on an update of Kathuria and Bhardwaj (1998).
5. We define the export-tax equivalent as the value of the quota divided by the price received by a
producer who does not own quota for this product.
6. In figure 3.2, the ETE is [(PR − PU)/PU] • 100.
7. A surge of imports is unlikely, however, given that Indian garments and textiles are largely quite
cost competitive.
8. Fukase and Martin (2000) showed that this source of welfare gains can be substantial. Vietnam’s
gaining most-favored-nation access to the U.S. market accounted for 40 percent of its welfare gain.
9. Another factor contributing to this outcome is the Armington specification used in the GTAP
model. Because exports and products sold on the domestic market are the same, the increased demand
for imports by India can be met without large increases in import prices.
10. This is the key parameter in determining the export-demand elasticities facing India’s exports.
11. The timing of the abolition of restrictions on countries such as China that were not WTO
members when the Agreement on Textiles and Clothing came into effect depends on the provisions of
their accession to the WTO, or on bilateral agreements that they reach with the importing countries.
12. Alam (1991), in a study of small industrial firms, found that firms deliberately minimize the
size of the labor force to reduce the bargaining power of employees and to avoid legal obligations
toward them. The most common way to do this is to separate the most labor-intensive production
process (for example, fabrication in the case of garments) and have that work done by outside con-
tractors. As part of the National Textile Policy 2000, garments production was de-reserved and the pro-
duction of garments by large firms in India was no longer barred.
13. In Khanna’s (1993) study of 149 apparel manufacturers in five countries of Southeast Asia,
manufacturers in Hong Kong (China) and Thailand observed that Indian garments lacked consistency
and uniformity in quality.
Implications of Multifibre Arrangement Abolition for India and South Asia 63
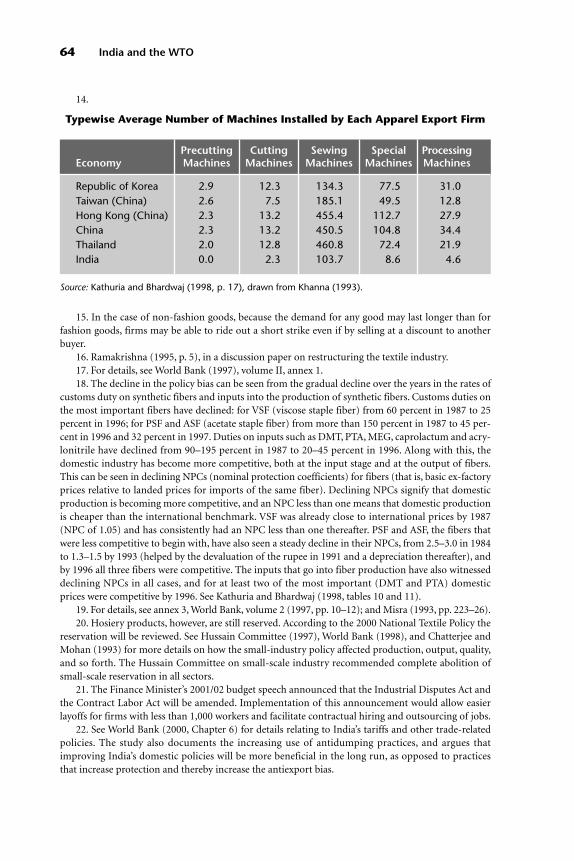
15. In the case of non-fashion goods, because the demand for any good may last longer than for
fashion goods, firms may be able to ride out a short strike even if by selling at a discount to another
buyer.
16. Ramakrishna (1995, p. 5), in a discussion paper on restructuring the textile industry.
17. For details, see World Bank (1997), volume II, annex 1.
18. The decline in the policy bias can be seen from the gradual decline over the years in the rates of
customs duty on synthetic fibers and inputs into the production of synthetic fibers. Customs duties on
the most important fibers have declined: for VSF (viscose staple fiber) from 60 percent in 1987 to 25
percent in 1996; for PSF and ASF (acetate staple fiber) from more than 150 percent in 1987 to 45 per-
cent in 1996 and 32 percent in 1997. Duties on inputs such as DMT, PTA, MEG, caprolactum and acry-
lonitrile have declined from 90–195 percent in 1987 to 20–45 percent in 1996. Along with this, the
domestic industry has become more competitive, both at the input stage and at the output of fibers.
This can be seen in declining NPCs (nominal protection coefficients) for fibers (that is, basic ex-factory
prices relative to landed prices for imports of the same fiber). Declining NPCs signify that domestic
production is becoming more competitive, and an NPC less than one means that domestic production
is cheaper than the international benchmark. VSF was already close to international prices by 1987
(NPC of 1.05) and has consistently had an NPC less than one thereafter. PSF and ASF, the fibers that
were less competitive to begin with, have also seen a steady decline in their NPCs, from 2.5–3.0 in 1984
to 1.3–1.5 by 1993 (helped by the devaluation of the rupee in 1991 and a depreciation thereafter), and
by 1996 all three fibers were competitive. The inputs that go into fiber production have also witnessed
declining NPCs in all cases, and for at least two of the most important (DMT and PTA) domestic
prices were competitive by 1996. See Kathuria and Bhardwaj (1998, tables 10 and 11).
19. For details, see annex 3, World Bank, volume 2 (1997, pp. 10–12); and Misra (1993, pp. 223–26).
20. Hosiery products, however, are still reserved. According to the 2000 National Textile Policy the
reservation will be reviewed. See Hussain Committee (1997), World Bank (1998), and Chatterjee and
Mohan (1993) for more details on how the small-industry policy affected production, output, quality,
and so forth. The Hussain Committee on small-scale industry recommended complete abolition of
small-scale reservation in all sectors.
21. The Finance Minister’s 2001/02 budget speech announced that the Industrial Disputes Act and
the Contract Labor Act will be amended. Implementation of this announcement would allow easier
layoffs for firms with less than 1,000 workers and facilitate contractual hiring and outsourcing of jobs.
22. See World Bank (2000, Chapter 6) for details relating to India’s tariffs and other trade-related
policies. The study also documents the increasing use of antidumping practices, and argues that
improving India’s domestic policies will be more beneficial in the long run, as opposed to practices
that increase protection and thereby increase the antiexport bias.
14.
Source: Kathuria and Bhardwaj (1998, p. 17), drawn from Khanna (1993).
64 India and the WTO
Typewise Average Number of Machines Installed by Each Apparel Export Firm
Precutting Cutting Sewing Special ProcessingEconomy Machines Machines Machines Machines Machines
Republic of Korea 2.9 12.3 134.3 77.5 31.0Taiwan (China) 2.6 7.5 185.1 49.5 12.8Hong Kong (China) 2.3 13.2 455.4 112.7 27.9China 2.3 13.2 450.5 104.8 34.4Thailand 2.0 12.8 460.8 72.4 21.9India 0.0 2.3 103.7 8.6 4.6

23. Joint Statement by the SAARC (South Asian Association for Regional Cooperation) Commerce
Ministers on the forthcoming Fourth WTO Ministerial Conference at Doha. New Delhi, August 23,
2001.
References
The word “processed” describes informally produced works that may not be available commonly
through libraries.
Alam, Ghayur. 1991. “Impact of Non-Economic Factors on Choice of Technology and Organiza-
tion of Production: A Study of Small Industrial Firms in India” New Delhi: International Labor Orga-
nization. Processed.
Bernard, Andrew, and J. B. Jensen. 1999. “Exporting and Productivity.” Working Paper 7135.
National Bureau of Economic Research, Cambridge, Mass.
Bhagwati, J. 1988. Protectionism. Cambridge, Mass.: MIT Press.
Chatterjee, S., and R. Mohan. 1993. “India’s Garment Exports.” Economic and Political Weekly,
August 28, pp. M-95–119.
Elbehri, A., T. Hertel, and W. Martin. 1997. “Estimating the Impact of Trade Reforms on the Indian
Cotton and Textile Sectors: A General Equilibrium Approach” Washington, D.C.: World Bank.
Processed.
Fukase, E., and W. Martin. 2000. “The Effects of the United States Granting MFN Status to Viet-
nam.” Weltwirtschaftliches Archiv 136: 539–59.
Hamilton, Carl B., ed. 1990. Textiles Trade and the Developing Countries: Eliminating the Multi-
Fiber Arrangement in the 1990s. Washington, D.C.: World Bank.
Harrison, Glenn, T. Rutherford, and D. Tarr. 1996. “Quantifying the Uruguay Round.” In W. Mar-
tin and L. A. Winters, eds., The Uruguay Round and the Developing Countries. Cambridge, U.K.: Cam-
bridge University Press.
Hertel, Thomas, W. Martin, K. Yanagishima, and B. Dimaranan. 1996. “Liberalizing Manufactures
Trade in a Changing World Economy.” In W. Martin and L. A. Winters, eds., The Uruguay Round and
the Developing Countries. Cambridge, U.K.: Cambridge University Press.
Huff, K., K. Hanslow, T. Hertel, and M. Tsigas. 1997. “GTAP Behavioral Parameters.” In T. Hertel,
ed., Global Trade Analysis: Modeling and Applications. New York: Cambridge University Press.
Hussain Committee. 1997. “Report of the Expert Committee on Small Enterprises.” Abid Hussain,
chairman. New Delhi.
Kathuria, Sanjay, and A. Bhardwaj. 1998. “Export Quotas and Policy Constraints in the Indian Tex-
tile and Garment Industries.” Policy Research Working Paper 2012. World Bank, Policy Research
Department, Washington, D.C.
Khanna, S. R. 1993. “The Challenge of Global Competition in the 1990s: An Agenda for Enhancing
the Competitive Position of the Indian Textiles and Clothing Industry.” New Delhi: Indian Council for
Research on International Economic Relations. Processed.
Krishna, Kala, and L. Tan. 1998. Rags and Riches: Implementing Apparel Quotas under the Multi-
Fiber Arrangement. Ann Arbor: University of Michigan Press.
Martin, Will, and S. Suphachalasai. 1990. “Effects of the Multi-Fiber Arrangements on Developing
Country Exporters: A Simple Theoretical Framework.” In Carl B. Hamilton, ed., Textiles Trade and the
Developing Countries: Eliminating the Multi-Fiber Arrangement in the 1990s. Washington, D.C.: World
Bank.
Misra, Sanjeev. 1993. India’s Textile Sector: A Policy Analysis. New Delhi: Saga Publications.
Nair, R. M., and P. Kaul. 1996. “Exporting Garments from India.” Policy Paper 4. New Delhi: Project
LARGE.
Ramakrishna, R. 1995. “Workshop on Restructuring of Textile Industry” Background paper. New
Delhi: Federation of Indian Chambers of Commerce and Industry.
Implications of Multifibre Arrangement Abolition for India and South Asia 65
World Bank. 1997. India: Cotton and Textile Industries—Maximizing the Potential for Growth in a
More Competitive Environment, Volumes I and II. Washington, D.C.
———. 1998. India Macroeconomic Update: Reforming for Growth and Poverty Reduction. Wash-
ington, D.C.
———. 2000. India: Reducing Poverty, Accelerating Development. Delhi: Oxford University Press.
Yang, Y., W. Martin, and K. Yanagishima. 1997. “Evaluating the Benefits of Abolishing the MFA in
the Uruguay Round Package.” In T. Hertel, ed., Global Trade Analysis: Modeling and Applications. Cam-
bridge, U.K.: Cambridge University Press.
66 India and the WTO

67
4
Services Issues andLiberalization in the
Doha Development Agenda Negotiations: A Case Study of India
Rajesh Chadha
I am sincerely grateful to Alan V. Deardorff and Robert M. Stern for continued guidance and support
on issues relating to trade and computable general equilibrium (CGE) modeling. Special thanks to
Rakesh Mohan for providing enduring encouragement and useful comments during the course of this
study. Thanks also are due to Sanjib Pohit, who worked with me on the National Council of Applied
Economic Research initiative on CGE trade models. Devender Pratap, Bikram Prakas Ghosh, and
Praveen Sachdeva provided excellent research support.
The preamble to the General Agreement on Trade in Services (GATS) states
that the general goal of participants is to establish a multilateral framework
of principles and rules for trade in services with a view to expanding such
trade under conditions of transparency and progressive liberalization. This would
promote the economic growth and development of all trading partners. The agree-
ment expresses the desire “to facilitate the increasing participation of developing
countries in trade in services and the expansion of their service exports including,
inter alia, through the strengthening of their domestic services capacity and its effi-
ciency and competitiveness.” The preamble clearly recognizes the right of all parties
to regulate the supply of services within their territories. It takes “particular
account of the serious difficulty of the least-developed countries in view of their
special economic situation and their development, trade and financial needs.”
The objective of this chapter is to analyze the importance of the service sectors
in India. In the first section, I present a discussion of what constitutes trade in ser-
vices. In the second section, I highlight India’s commitments in the GATS. In the
third section, I present a discussion of how protected and inefficient service sectors
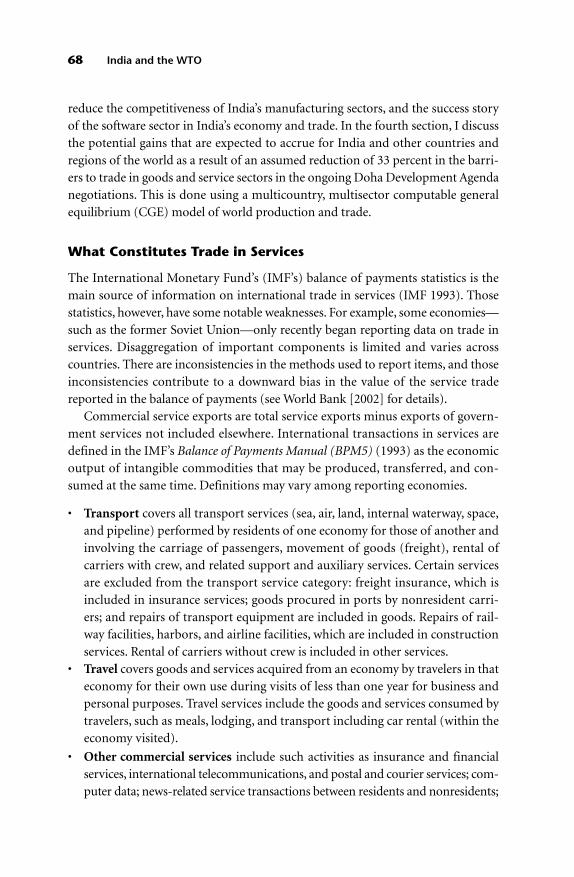
reduce the competitiveness of India’s manufacturing sectors, and the success story
of the software sector in India’s economy and trade. In the fourth section, I discuss
the potential gains that are expected to accrue for India and other countries and
regions of the world as a result of an assumed reduction of 33 percent in the barri-
ers to trade in goods and service sectors in the ongoing Doha Development Agenda
negotiations. This is done using a multicountry, multisector computable general
equilibrium (CGE) model of world production and trade.
What Constitutes Trade in Services
The International Monetary Fund’s (IMF’s) balance of payments statistics is the
main source of information on international trade in services (IMF 1993). Those
statistics, however, have some notable weaknesses. For example, some economies—
such as the former Soviet Union—only recently began reporting data on trade in
services. Disaggregation of important components is limited and varies across
countries. There are inconsistencies in the methods used to report items, and those
inconsistencies contribute to a downward bias in the value of the service trade
reported in the balance of payments (see World Bank [2002] for details).
Commercial service exports are total service exports minus exports of govern-
ment services not included elsewhere. International transactions in services are
defined in the IMF’s Balance of Payments Manual (BPM5) (1993) as the economic
output of intangible commodities that may be produced, transferred, and con-
sumed at the same time. Definitions may vary among reporting economies.
• Transport covers all transport services (sea, air, land, internal waterway, space,
and pipeline) performed by residents of one economy for those of another and
involving the carriage of passengers, movement of goods (freight), rental of
carriers with crew, and related support and auxiliary services. Certain services
are excluded from the transport service category: freight insurance, which is
included in insurance services; goods procured in ports by nonresident carri-
ers; and repairs of transport equipment are included in goods. Repairs of rail-
way facilities, harbors, and airline facilities, which are included in construction
services. Rental of carriers without crew is included in other services.
• Travel covers goods and services acquired from an economy by travelers in that
economy for their own use during visits of less than one year for business and
personal purposes. Travel services include the goods and services consumed by
travelers, such as meals, lodging, and transport including car rental (within the
economy visited).
• Other commercial services include such activities as insurance and financial
services, international telecommunications, and postal and courier services; com-
puter data; news-related service transactions between residents and nonresidents;
68 India and the WTO
construction services; royalties and license fees; miscellaneous business, profes-
sional, and technical services; and personal, cultural, and recreational services.
The GATS encompasses all that is traded under the four modes of service
transactions carried out among different countries of the world: cross-border
trade (mode 1); consumption abroad (mode 2); commercial presence (mode 3);
and movement of natural persons (mode 4). The traditional IMF definition of
trade in commercial services is stated in the BPM5. The balance of payments sta-
tistics there are based on the concept of residency, and all transactions are
recorded between residents and nonresident transactors.1 The scope of service
transactions is widened under the GATS through the introduction of additional
concepts like nationality, territorial location, and ownership or control. The data
on trade in commercial services as provided in the BPM5 relate only to the first
two modes of service transactions. In fact there is no mention of supply of services
through commercial presence, and the trade in services based on the movement of
natural persons is, at best, estimated as a proxy.
The Manual of Statistics of International Trade in Services (MSITS; UN 2002)2
has been a major effort to resolve the divergence between the GATS legal frame-
work and the traditional statistical framework of the BPM5. The MSITS sets out
an internationally agreed, GATS-coherent framework for compiling and reporting
statistics of international trade in services, but the MSITS conforms with and
explicitly relates to the BPM5.
International transactions under mode 3 are based on the commercial presence
of foreign affiliates and are referred to as foreign affiliate trade in services (FATS).
The statistical concept of FATS is similar to the commercial presence notion under
the GATS (Karsenty 2000), with two major differences. First, whereas the GATS
refers to majority ownership and control, FATS data are based on majority owner-
ship alone. Second, whereas the GATS covers services whether produced by a service
company or a company classified under the manufacturing sector, FATS aims at
measuring the output of companies classified according to their primary activity.
For our purposes, trade in commercial services refers to the first two modes of
trade in services, and trade in all services (in line with the GATS definition)
includes international service transactions under modes 3 and 4 and commercial
services. The values of the four modes for 1997 and 2000 are indicated in table 4.1.
India’s GATS Commitments
In the Uruguay Round, India’s schedule under the GATS provided for specific com-
mitments covering business services, communications, construction work for civil
engineering, financial services, health-related and social services, and tourism ser-
vices (WTO 1998, p. 152; see also Chadha 2002). The extent of commitments varied
Services Issues and Liberalization in the Doha Development Agenda 69
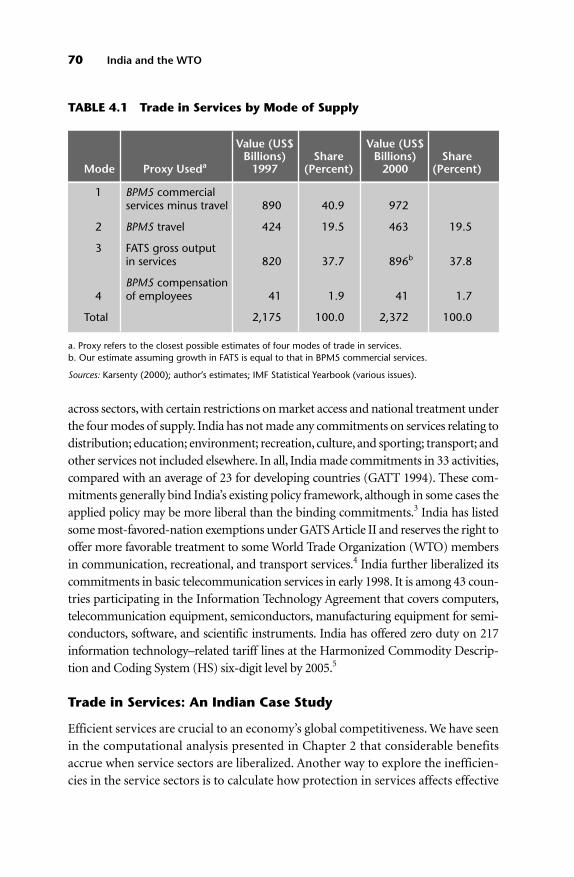
across sectors, with certain restrictions on market access and national treatment under
the four modes of supply. India has not made any commitments on services relating to
distribution; education; environment; recreation, culture, and sporting; transport; and
other services not included elsewhere. In all, India made commitments in 33 activities,
compared with an average of 23 for developing countries (GATT 1994). These com-
mitments generally bind India’s existing policy framework, although in some cases the
applied policy may be more liberal than the binding commitments.3 India has listed
some most-favored-nation exemptions under GATS Article II and reserves the right to
offer more favorable treatment to some World Trade Organization (WTO) members
in communication, recreational, and transport services.4 India further liberalized its
commitments in basic telecommunication services in early 1998. It is among 43 coun-
tries participating in the Information Technology Agreement that covers computers,
telecommunication equipment, semiconductors, manufacturing equipment for semi-
conductors, software, and scientific instruments. India has offered zero duty on 217
information technology–related tariff lines at the Harmonized Commodity Descrip-
tion and Coding System (HS) six-digit level by 2005.5
Trade in Services: An Indian Case Study
Efficient services are crucial to an economy’s global competitiveness. We have seen
in the computational analysis presented in Chapter 2 that considerable benefits
accrue when service sectors are liberalized. Another way to explore the inefficien-
cies in the service sectors is to calculate how protection in services affects effective
70 India and the WTO
TABLE 4.1 Trade in Services by Mode of Supply
Value (US$ Value (US$Billions) Share Billions) Share
Mode Proxy Useda 1997 (Percent) 2000 (Percent)
1 BPM5 commercialservices minus travel 890 40.9 972
2 BPM5 travel 424 19.5 463 19.5
3 FATS gross outputin services 820 37.7 896b 37.8
BPM5 compensation4 of employees 41 1.9 41 1.7
Total 2,175 100.0 2,372 100.0
a. Proxy refers to the closest possible estimates of four modes of trade in services.b. Our estimate assuming growth in FATS is equal to that in BPM5 commercial services.
Sources: Karsenty (2000); author’s estimates; IMF Statistical Yearbook (various issues).

rates of protection (ERPs).6 It has been pointed out that the actual effective pro-
tection to manufacturing sectors may turn out to be lower if adjustment for high
protection to service sectors, arising from regulatory policies, is also taken into
account (Hoekman and Djankov 1997).7 I have computed such ERPs for the man-
ufacturing sectors of India for the year 1997/98, using Hoekman’s (1995, 1996)
“guesstimates” of tariff equivalents of implicit protection on India’s service sec-
tors. The results for the 30 input–output sectors, which account for more than 20
percent share of services in total intermediate inputs, are reported in table 4.2.
Note that in 25 of 30 sectors, the inefficient services–adjusted ERP is less than the
normal ERP, with the difference becoming large in some sectors. In the case of
electrical machinery, the adjusted ERP is negative at −6.6 percent compared with
an original value of 26.2 percent. The difference is substantial also for coal tar
products, steel and ferrous alloys, fertilizers, and woolen textiles. The upshot is
that the inefficient service sectors may act as a tax on manufacturing and thereby
reduce effective protection.
The Indian Government is aware of the need to improve the provision of ser-
vices, and it understands that the investment required is beyond the means avail-
able to it. Hence, the Government has been urged to seek private support (Mohan
1996). India liberalized its foreign direct investment (FDI) regime during the
1990s.8 Foreign equity up to 51 percent is now automatically allowed in restau-
rants and hotels; support services for land and water transport; parts of renting
and leasing; business services, including software; and health and medical ser-
vices. The automatic approval provision for foreign equity is 74 percent in the case
of mining services, nonconventional energy generation and distribution, land and
water transport, and storage and warehousing. The limit is 100 percent in the case
of electricity generation, transmission, and distribution. Foreign equity, however,
is limited to 49 percent in telecommunications, 40 percent in domestic airlines,
and 20 percent in banking services. Railway transport remains among the four
industries reserved for the public sector. Only recently has the insurance sector
been opened to the private sector.
India’s Success Story: Software
The GATS Services Sectoral Classification List (GNS) includes “computer and
related services” as a component of “business services” (GNS code 1B). Computer
and related services include (a) consultancy services related to the installation of
computer hardware; (b) software implementation services; (c) data processing ser-
vices; (d) database services; and (e) others.9 But it is not clear where to draw the line
between computer “software” and “services.”10 In the case of India’s commitments
under “computer and related services,”cross-border supply (mode 1) and consumption
Services Issues and Liberalization in the Doha Development Agenda 71

abroad (mode 2) are unbound under both market access and national treatment.
Commercial presence (mode 3) gets national treatment, but market access is possi-
ble only through incorporation with foreign equity. The presence of natural persons
(mode 4) is unbound except as indicated in the horizontal section.
72 India and the WTO
TABLE 4.2 Protection in India, 1997–98 (Percent)
Nominal Share of Effective AdjustedRate of Services in Rate of Effective Rate
Sector Protection Total Inputs Protection of Protectiona
1 Cement 43.7 35.1 57.9 36.02 Coal tar products 30.6 31.5 43.4 7.13 Inorganic heavy chemicals 34.3 29.3 36.0 16.44 Other nonmetallic
mineral products 42.1 28.5 48.3 37.95 Nonferrous basic metals 31.6 28.3 34.4 17.66 Electrical industrial machinery 29.1 27.8 26.2 −6.67 Organic heavy chemicals 33.8 26.6 34.8 17.78 Other transport equipment 45.0 26.4 49.5 51.99 Iron, steel, and ferroalloys 28.4 25.8 28.4 6.0
10 Paper, paper products, and newsprint 33.4 25.6 35.3 22.2
11 Structural clay products 39.4 24.8 47.9 39.512 Iron and steel casting
and forging 35.0 24.3 43.1 29.813 Cotton textiles and khadi 41.1 23.9 59.0 59.114 Watches and clocks 39.2 23.7 39.6 39.815 Ships and boats 32.9 23.3 32.7 28.616 Communication equipment 36.3 23.3 36.7 31.117 Jute, hemp, mesta, textiles 45.0 22.9 52.9 49.318 Industrial machinery (others) 26.6 22.7 23.1 13.819 Paints, varnishes, and lacquers 35.0 22.6 35.1 26.720 Fertilizers 25.7 22.5 19.9 2.621 Iron and steel foundries 35.0 22.2 41.0 27.622 Electronic equipment
(including TV) 29.7 22.1 27.3 18.223 Leather footwear 45.0 21.8 52.3 53.624 Leather and leather products 32.1 21.7 32.2 27.125 Art silk, synthetic fiber textiles 43.3 21.3 50.0 47.926 Industrial machinery 31.7 20.9 24.3 16.227 Readymade garments 45.0 20.6 48.1 49.228 Motor cycles and scooters 45.0 20.5 51.1 51.029 Synthetic fibers, resins 40.0 20.4 44.7 39.330 Woolen textiles 23.2 20.3 12.8 3.9
a. Adjustment made for tariff equivalents for services.
Sources: Hoekman 1995; Chadha and Pohit 1998; and NCAER 1998.
India has the world’s second largest pool of English-speaking, scientific man-
power. Moreover, Indian software is of high quality and relatively low cost. The
software industry emerged as one of the fastest growing and most vibrant seg-
ments of India’s economy during the 1990s. The domestic software market
increased from US$160 million in 1992/93 to $944 million in 1997/98, thus regis-
tering an average annual growth rate of 43 percent (NASSCOM 1999). The
exports of software increased from $225 million in 1992/93 to $1.75 billion in
1997/98, which is an average annual growth rate of 51 percent.11 In May 1998 the
National Task Force on Information Technology and Software Development was
set up, consisting of ministers, bureaucrats, scientists, academicians, and industry
representatives.12
India has already acquired a substantial market share in the global cross-country,
customized software–development market. Recognized as an important base for
software development, its share in the global market has increased from 11.9 per-
cent in 1991 to 18.5 percent in 1998. In 1997/98, more than 158 of the Fortune 500
companies outsourced their software requirements to India. Quality has become
the hallmark of the industry with more than 109 Indian software companies hav-
ing acquired international quality certification. Two out of six companies in the
world that have acquired SEI CMM (Level 5) (the highest maturity level for a soft-
ware process) are located in India, namely, Motorola and Wipro. After a major suc-
cess in addressing the Y2K (year 2000) issue in the international market, India has
set its sights on servicing Euro currency solutions, with 82 Indian software com-
panies already participating in that effort. The strategic 12-hour time difference
with the United States enables India to facilitate a 24-hour workday for many of
the U.S. companies who prefer to “follow the sun.”
The cost competitiveness of India will remain for at least another decade. The
expansion of U.S. H1-B visa numbers that occurred between 1998 and 2000
(65,000 in 1998; 115,000 in 1999 and 2000) may be reversed, but U.S. companies
are increasingly likely to outsource their work to India because of the continued
shortage of software-skilled workers in the United States. I do not see the contin-
ued H1-B visa restrictions as a major disadvantage to the software-trained Indian
workforce, however, because work will come to India as a result of its outsourcing
reputation. The often-quoted lower wages paid to Indian software development
and support personnel compared with the wages of their U.S. counterparts should
not discourage the Indian workforce because the real difference may not be as
large as it appears. To understand this, assume that Indian wages are about 10 percent
of the corresponding U.S. wages (Mattoo 1999). For an Indian, this figure should
be read as 40 percent instead of 10 percent under the “purchasing power parity’”
paradigm (World Bank 1998). That figure grows to about 60 percent if one
accounts for an “implicit” 30 percent wage discrimination against the “alien”
Services Issues and Liberalization in the Doha Development Agenda 73

H1-B visaholders.13 This wedge may further increase over the next 10 years as the
United States and some other developed countries outsource their software-
related work to India.
Liberalization of the Service Sector
Brown and others (1996) have analyzed the potential effects of the liberalization
of trade in services. Because there was no such liberalization during the Uruguay
Round negotiations, those authors examined what might happen when liberaliza-
tion finally occurs. Using Hoekman’s (1995) “guesstimates” of the size of trade
barriers in services, they calculated the effects of an assumed 25 percent reduction
in those barriers, which they assumed to be plausible.14 To provide a benchmark
for comparison, Brown and others also calculated the effects of the negotiated lib-
eralization of tariffs on industrial products that were actually negotiated. They
concluded that the world’s major trading countries/regions, including India,
could expect to gain from liberalization of trade in services, with gains increasing
further when tariffs on industrial goods are reduced simultaneously.
In Chapter 2 of this volume, Chadha and others have estimated some potential
results of the liberalization of trade in services as well as in agricultural and indus-
trial products for the major industrial and developing countries, including India.
For that purpose they used a specially constructed version of the University of
Michigan Brown-Deardorff-Stern computable general equilibrium (CGE) model
of world production and trade. The estimated results of 33 percent reductions in
barriers to trade in agricultural products, manufactures, services, and all sectors
combined are presented in table 2.7 of Chapter 2. Comparison of the scenario
results shows substantial gains under both services liberalization and goods liber-
alization. Thus India’s liberalization of services results in an estimated welfare
increase of 0.55 percent of gross domestic product (GDP) and goods liberaliza-
tion produces an estimated welfare increase of 0.73 percent of GDP.
The Indian sectoral employment effects of the assumed Doha Development
Agenda liberalization of services barriers are shown in table 4.3. It is interesting
that this liberalization results in employment increases in Indian agriculture and
especially government services, and declines in most manufacturing sectors and
in trade and transport services related to manufactures. It should be noted, how-
ever, that these sectoral employment changes would be altered when account is
taken of the combined effects of the Doha Development Agenda liberalization of
agriculture, manufactures, and services (shown in table 2.9). By themselves, how-
ever, the employment effects of the services liberalization presented in table 4.3
are all relatively small.
74 India and the WTO
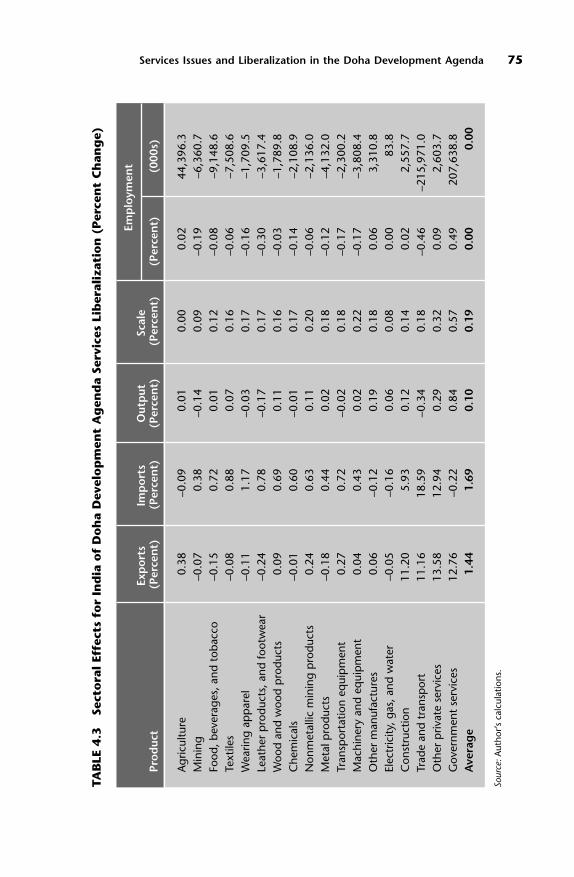
Services Issues and Liberalization in the Doha Development Agenda 75
Emp
loym
ent
Exp
ort
sIm
po
rts
Out
put
Scal
ePr
od
uct
(Per
cen
t)(P
erce
nt)
(Per
cen
t)(P
erce
nt)
(Per
cen
t)(0
00s)
Agr
icul
ture
0.38
–0.0
90.
010.
000.
0244
,396
.3M
inin
g–0
.07
0.38
–0.1
40.
09–0
.19
–6,3
60.7
Food
, bev
erag
es, a
nd t
obac
co–0
.15
0.72
0.01
0.12
–0.0
8–9
,148
.6Te
xtile
s–0
.08
0.88
0.07
0.16
–0.0
6–7
,508
.6W
earin
g ap
par
el–0
.11
1.17
–0.0
30.
17–0
.16
–1,7
09.5
Leat
her
pro
duct
s, a
nd fo
otw
ear
–0.2
40.
78–0
.17
0.17
–0.3
0–3
,617
.4W
ood
and
woo
d p
rodu
cts
0.09
0.69
0.11
0.16
–0.0
3–1
,789
.8C
hem
ical
s–0
.01
0.60
–0.0
10.
17–0
.14
–2,1
08.9
Non
met
allic
min
ing
pro
duct
s0.
240.
630.
110.
20–0
.06
–2,1
36.0
Met
al p
rodu
cts
–0.1
80.
440.
020.
18–0
.12
–4,1
32.0
Tran
spor
tatio
n eq
uip
men
t0.
270.
72–0
.02
0.18
–0.1
7–2
,300
.2M
achi
nery
and
eq
uip
men
t0.
040.
430.
020.
22–0
.17
–3,8
08.4
Oth
er m
anuf
actu
res
0.06
–0.1
20.
190.
180.
063,
310.
8El
ectr
icity
, gas
, and
wat
er–0
.05
–0.1
60.
060.
080.
0083
.8C
onst
ruct
ion
11.2
05.
930.
120.
140.
022,
557.
7Tr
ade
and
tran
spor
t11
.16
18.5
9–0
.34
0.18
–0.4
6–2
15,9
71.0
Oth
er p
rivat
e se
rvic
es13
.58
12.9
40.
290.
320.
092,
603.
7G
over
nmen
t se
rvic
es12
.76
–0.2
20.
840.
570.
4920
7,63
8.8
Ave
rag
e1.
441.
690.
100.
190.
000.
00
TAB
LE 4
.3Se
cto
ral
Effe
cts
for
Ind
ia o
f D
oh
a D
evel
op
men
t A
gen
da
Serv
ices
Lib
eral
izat
ion
(P
erce
nt
Ch
ang
e)
Sour
ce:A
utho
r’s c
alcu
latio
ns.

Conclusion
The main objectives of the GATS are the expansion of trade in services, progres-
sive liberalization of such trade through negotiations, transparency of rules and
regulations, and increasing participation of developing countries. Efficient ser-
vices are crucial to an economy’s global competitiveness. High levels of protection
granted to the service sectors by an economy through its regulatory policies create
inefficient service sectors and thereby reduce the effective protection to various
sectors of production in the economy.
India’s schedule under the GATS provides for specific commitments covering
business services, communications, construction work for civil engineering,
financial services, health-related and social services, and tourism services. The
extent of commitments varies across sectors with certain restrictions on market
access and national treatment under the four modes of supply of services. India
has not made any commitments on services relating to distribution; education;
environment; recreation, culture, and sporting; transport; and other services not
included elsewhere. India has made commitments in 33 activities, compared with
an average of 23 for developing countries. It has demonstrated success in the
export of software services. The CGE model results noted here clearly demon-
strate the additional benefits that services liberalization can bring about for India
as well as for other major developing and industrial countries/regions, depending
on their respective degrees of comparative advantage in different service sectors in
a liberalized world economy.
In the ongoing Doha Development Agenda negotiations, services liberalization
requires a change in negotiating strategies (Mattoo 2000). India especially needs to
push for liberalization of domestic service markets, laying more emphasis on com-
petition than on change of ownership. It is imperative to undertake domestic dereg-
ulation to encourage economic efficiency in remedying market failures and pushing
social goals. Furthermore, external service markets need to be liberalized effectively
by the elimination of both explicit restrictions and implicit regulatory barriers.
Those efforts would lead GATS negotiations into a “virtuous cycle of mutually ben-
eficial liberalization.” India’s dynamic and growing software sector would transform
the country into a global software powerhouse even if the industrial countries con-
tinue to impose restrictions on the movement of foreign workers.
India should look forward to more active participation in the Doha Develop-
ment Agenda negotiations and particularly to furthering the cause of the GATS.
There is a compelling need to take great initiative in the process of GATS negotia-
tions to put forward developing country points of view lest these countries have to
accept sectoral agreements in which they did not fully participate. The industrial
countries must listen to the needs and aspirations of the developing countries and
76 India and the WTO

adhere to the basic lessons of comparative advantage. The gains are going to be
shared by the industrial as well as the developing economies, and both groups
should participate actively to ensure more equitable distribution of the resulting
gains. Keeping in view specific provisions for freer movement of capital under
GATS commitments, similar provisions must also address the freer movement of
labor. In the Doha Development Agenda, GATS negotiations must focus on a
comprehensive approach rather than a case-by-case approach to discussions.
Negotiations since the conclusion of the Uruguay Round Agreements have
focused on financial services, insurance, and maritime transport. Simultaneous
negotiations on all services must proceed so as to keep the interests of India and
other developing countries fully involved.
An important single factor that can help India improve the efficiency of its
service sectors and compete with international service providers lies in the cer-
tainty with which the country commits itself to future liberalization while binding
the status quo. Serious analysis of strengths, weaknesses, and opportunities for
services liberalization should be undertaken with a liberal view toward future
commitments. Strengths and opportunities should be fully exploited in the future
negotiations, and perceived weaknesses should not hinder the process of further
liberalization The optimum solution lies in dealing with existing weaknesses and
avoiding the closing of the economy to forces of international competition.15
Endnotes
1. People residing abroad for more than one year.
2. The MSITS is a United Nations publication in collaboration with the European Union, the
International Monetary Fund, the United Nations Conference on Trade and Development, and the
World Trade Organization.
3. India’s commitments under GATS can be downloaded from the World Trade Organization Web
site (http://www.wto.org). These commitments are summarized in tables AIV.3 and AIV.4 in WTO
(1998).
4. India originally had declared some most-favored-nation exemptions in financial services
(banking and insurance), which were later withdrawn during negotiations on financial services. India
also increased the annual limit on foreign bank branches from 8 to 12.
5. A detailed and very informative discussion of India’s existing regulatory policies and commit-
ments under the GATS in financial, transportation, telecommunication, tourism, and software services
is provided in WTO (1998).
6. The ERP is a measure of the extent to which trade barriers protect domestic value added in pro-
duction. The effective protection coefficient (EPC) is computed by dividing the value added at domes-
tic prices by value added at world prices. The ERP = EPC − 1.
7. Analogous to tariffs on traded inputs, the higher the tariff equivalent of regulatory policies for
services, the lower the effective protection for industries that use the service inputs involved (Hoekman
and Braga 1997).
8. See the Handbook of Industrial Policy and Statistics published by the Government of India
(1999). For the latest version, see www.eaindustry.nic.in.
Services Issues and Liberalization in the Doha Development Agenda 77
9. Telecommunication services under the GATS constitute a sector that is very closely related to
computer services. Telecommunication services constitute a component of “communication services”
(GNS code 2C). With regard to telecommunications, there appears to be considerable overlap, partic-
ularly for the activities such as database and data processing services to be performed and/or supplied
online. Given the interplay between the two sectors’ listed activities, it may not be clear when telecom-
munication services, computer services, or both are supplied. Whereas GATS directly addresses the
progressive liberalization of computer and telecommunication services, the WTO agreements to elim-
inate tariffs and nontariff barriers on information and communication technology products are of
great importance to both of those services (GNS 1B and 2C).
10. “Software” appears not to be covered under the existing GATS classification (GNS 1B). The
provisional United Nations Central Product Classification (UNCPC) code 842 refers only to “consul-
tancy” services related to “development and implementation” of software. The packaged or standard-
ized software may be treated as a good, but consultants or other professionals hired by a firm produc-
ing packaged software may be covered by GATS mode 4 commitments. It is not clear whether the
online supply of packaged or even customized software should be classified as a good or a service.
11. According to the National Association of Software and Service Companies (NASSCOM 1999),
the share of on-site development, which was about 90 percent in 1998/99, was 59 percent in 1997/98.
Offshore project development has been increasing since 1995 as a result of the proliferation of software
technology parks, service of high-speed data transfer provided by the telecommunications company
VSNL, liberalized economic policy, and visa restrictions by the United States and some Western European
countries. Although the share of products and packages in the domestic market was 52 percent in
1997/98, it was only 8.8 percent in the export market. Major components of software export activity
include professional services (48.4 percent) and projects (31.5 percent). The United States accounted
for 58 percent of India’s software exports and Europe accounted for 21 percent.
12. The Government of India (1998) supported the development of the software and hardware
sectors during the 1990s. Since 1992 Electronic hardware technology parks (EHTPs) and software
technology parks (STPs) have been attracting foreign investment. Compulsory industrial licensing
for electronics-related industries was abolished in 1996. Investment in the electronics industry is
unrestricted in terms of foreign shareholdings or repatriation of profits. For export industries there
have been additional incentives, such as a five-year tax holiday, tax exemption for income from
exports, duty-free imports of inputs, and access to some imports through special import licenses
(SILs). There is no ceiling on the amount of foreign equity participation in EHTPs, STPs, and export-
processing zones (EPZs), or in 100 percent export-oriented units. There is almost a computer revolu-
tion in the country, and both government and industry are growing more determined to strengthen
the brand equity of the Indian software industry and make the country an information technology
superpower.
13. According to Batuk Vora in 1999 (in an article previously available at <www.indiatimes.com>,
an Indian H1-B visaholder may receive only $70 instead of the $100 paid to a native for similar work.
14. It is more difficult to provide quantitative measures of commitments to the liberalization of
trade in services than for liberalization of trade in goods because there are no comprehensive interna-
tional data for trade in services by the four modes of supply. Furthermore, there is no equivalent of
customs duties in services. The barriers to trade in services are camouflaged under quantitative restric-
tions, prohibitions, and the framework of government regulation with regard to the supply of services.
Analyzing the economic impact of such measures or the effect of their removal does not lend itself
readily to quantitative measurement. Hoekman (1996) provided “guesstimates” of the size of trade
barriers in services, and more recently, Dee and Hanslow (2001) estimated services barriers based on
sectoral studies of the banking and telecommunications industries. Brown and Stern (2001) have used
estimates of services barriers derived from measures of price-cost margins, and these have been used in
the Doha Development Agenda computational scenarios in Chapter 2 of this volume.
15. See Chanda (2002) for an assessment of India’s opportunities and constraints. Stiglitz (2000)
has asked the WTO members to have well-balanced trade negotiations to reflect the interests and con-
cerns of the developing world. The two key principles should be “fairness,” especially to the developing
78 India and the WTO

countries, and “comprehensiveness” such that sectors of interest to the developing economies (e.g.,
construction and maritime services) receive greater attention.
References
The word “processed” describes informally produced works that may not be available commonly
through libraries.
Brown, Drusilla K., Alan V. Deardorff, Alan Fox, and Robert M. Stern. 1996. “The Liberalization of
Services Trade: Potential Impacts in the Aftermath of the Uruguay Round.” In Will Martin and L. Alan
Winters, eds., The Uruguay Round and the Developing Countries. Cambridge, U.K.: Cambridge Univer-
sity Press.
Brown, Drusilla K., and Robert M. Stern. 2001. “Measurement and Modeling of the Economic
Effects of Trade and Investment Barriers in Services.” Review of International Economics 9: 262–86.
Chadha, Rajesh. 2002. “Competitiveness of Service Sectors in South Asia: Role and Implications of
GATS.” Draft Report. NCAER (National Council of Applied Economic Research), New Delhi, and
CUTS (Consumer Unity & Trust Society), Jaipur.
Chadha, Rajesh, and Sanjib Pohit. 1998. “Rationalising Tariff and Non-Tariff Barriers on Trade:
Sectoral Impact on Indian Economy.” Paper prepared for the Tariff Commission, Government of
India.
Chanda, Rupa. 2002. Globalization of Services: India’s Opportunities and Constraints. New Delhi:
Oxford University Press.
Dee, Philippa, and Kevin Hanslow. 2001. “Multilateral Liberalization of Services Trade.” In Robert
M. Stern, ed., Services in the International Economy. Ann Arbor: University of Michigan Press.
GATT. 1994. Schedule of Specific Commitments Submitted by Member Countries under GATS.
Geneva.
Government of India. 1998. National Task Force on Information Technology and Software Develop-
ment. New Delhi.
Government of India, Ministry of Commerce and Industry. 1999. Handbook of Industrial Policy
and Statistics. New Delhi.
Hoekman, Bernard. 1995. “Tentative First Steps: An Assessment of the Uruguay Round Agreement
on Services.” Working Paper. Centre for Economic Policy Research, London.
–––––. 1996. “Assessing the General Agreement on Trade in Services.” in Will Martin and L. Alan
Winters, eds., The Uruguay Round and the Developing Countries. Cambridge, U.K.: Cambridge Univer-
sity Press.
Hoekman, Bernard, and Carlos A. Primo Braga. 1997.“Protection and Trade in Services: A Survey.”
Open Economies Review 8: 285–308.
Hoekman, Bernard, and Simeon Djankov. 1997.“Towards a Free Trade Agreement with the European
Union: Issues and Policy Options for Egypt.” In A. Galal and Bernard Hoekman, eds., Regional Partners
in Global Markets. London: Centre for Economic Policy Research.
IMF (International Monetary Fund). 1993. Balance of Payments Manual, 5th ed. Washington, D.C.
–––––. 1998. Balance of Payments Statistics Yearbook. Washington, D.C.
Karsenty, G. 2000. “Assessing Trade in Services by Mode of Supply.” In Pierre Sauvé and Robert M.
Stern, eds., GATS 2000: New Directions in Services Trade Liberalization. Washington, D.C.: Brookings
Institution Press.
Mattoo, Aaditya. 1999. “Developing Countries in the New Round of GATS Negotiations: From a
Defensive to a Pro-Active Role.” Paper presented at the WTO/World Bank Conference on Developing
Countries and the Millennium Round, September, Geneva.
–––––. 2000.“Developing Countries in the New Round of GATS Negotiations: From a Defensive to
a Pro-Active Role.” World Economy 23: 471–89.
Mohan, Rakesh. 1996. India Infrastructure Report. New Delhi: National Council of Applied Economic
Research.
Services Issues and Liberalization in the Doha Development Agenda 79

NASSCOM (National Association of Software and Service Companies). 1999. The Software Indus-
try in India: A Strategic Review. New Delhi. <www.nasscom.org>
NCAER (National Council of Applied Economic Research). 1998. Protection in Indian Industry.
New Delhi. Processed.
Stiglitz, E. Joseph. 2000. “Two Principles for the Next Round: How to Bring Developing Countries
in from the Cold.” World Economy 23: 437–54.
World Bank. 1998. World Development Report, 1998/99. Washington, D.C.
–––––. 2002. World Development Indicators. Washington, D.C.
WTO (World Trade Organization). 1998. Trade Policy Review: India. Lanham, Md.: Bernan
Associates.
80 India and the WTO

81
5
Telecommunicationspolicy reform
in India
Rajat Kathuria, Harsha Vardhana Singh,and Anita Soni
The Indian economy is currently undergoing a structural shift. Agricultural
and manufactured products are contributing a smaller share of economic
output, whereas the service sector contribution is growing. The service sec-
tor in India today accounts for more than 48 percent of economic activity and is
likely to grow at the rate of 8 percent per year (Reserve Bank of India 1998). A
majority of service workers are engaged in creating, processing, and distributing
information. The telecommunications sector therefore has assumed major impor-
tance as an enabling infrastructure. Accordingly, it is vital for the country that there
be a comprehensive and forward-looking telecommunications policy that creates
a suitable framework for development of this service industry. The availability of
infrastructure for electronically transferring and accessing information is per-
ceived as critical for hastening the realization of economic, social, and cultural
benefits as well as for conferring competitive advantage.
In the last five years there have been rapid changes in India’s telecom sector:
far-reaching developments in information technology (IT), consumer electronics,
and media industries around the globe. Convergence of both markets and tech-
nologies is a reality that is forcing an industry realignment. At one level, telephone
and broadcasting industries are entering each other’s markets, and at another
level, technology is blurring the difference between such conduit systems as wire-
line and wireless. As in most countries, separate licenses have been issued in India
for basic, cellular, and Internet service providers, and for satellite and cable televi-
sion operators, each with a distinct industry structure, terms of entry, and varying
requirement to create infrastructure. This convergence, however, which now

enables operators to use their facilities to deliver some services reserved for other
operators, requires a reexamination of the existing policy framework.
The Government of India has recognized that providing world-class telecom-
munications infrastructure and information is the key to the country’s rapid eco-
nomic and social development. This will not only help in developing the IT indus-
try; it will also provide for widespread spillover benefits to other sectors of the
economy.
The first step in this direction was the National Telecom Policy announced in
1994 (NTP 94). This policy opened up the telecommunications sector to compe-
tition in basic services as well as value-added offerings like cellular-mobile ser-
vices, radio paging, very small aperture terminals (V-SAT) services, and so forth. It
also set targets for providing telephone on demand and for opening long-distance
telephony. These liberalizations were followed by a New Telecom Policy declara-
tion in March 1999 (NTP 99) that removed some of the bottlenecks and moved
the liberalization process forward.
This chapter is organized as follows. The next section details the existing struc-
ture of the Indian telecommunications sector. That discussion is followed by a
comparison of the policy documents of 1994 and 1999. The third section analyzes
crucial policy issues and addresses questions likely to arise in their implementa-
tion. The final section offers concluding observations.
Existing Structure of the Telecommunications Sector
Telecommunications was not perceived as one of the key infrastructure sectors for
rapid economic development during the formative years of the Indian economy.
The relatively low levels of investment in this sector affected the quality, quantity,
and range of services available. In 1998 Indian telephone density per 100 people
was 2.2, whereas the world average was 14.26 (ITU 1999b). The evolution of the
subscriber base for basic services in India since 1997 is shown in table 5.1.
For the provision of basic services the entire country is divided into 21 telecom
circles, excluding Delhi and Mumbai. Bharat Sanchar Nigam Limited (BSNL)
(formerly the service provision arm of the Department of Telecommunications
[DoT]) provides basic services in those 21 telecom circles, and Mahanagar Tele-
phone Nigam Limited (MTNL) serves Delhi and Mumbai, two metropolitan
license areas. Table 5.1 presents the subscriber numbers for basic services since
1996. BSNL’s market share increased from 79 percent to 86 percent between
March 1997 and June 2001, whereas the share for MTNL dropped from 21 percent
to less than 13 percent of the total connections. In the early years after liberaliza-
tion, India restricted the number of licenses awarded for basic services. The mar-
ket was divided into separate circles and the policy admitted one private operator
82 India and the WTO
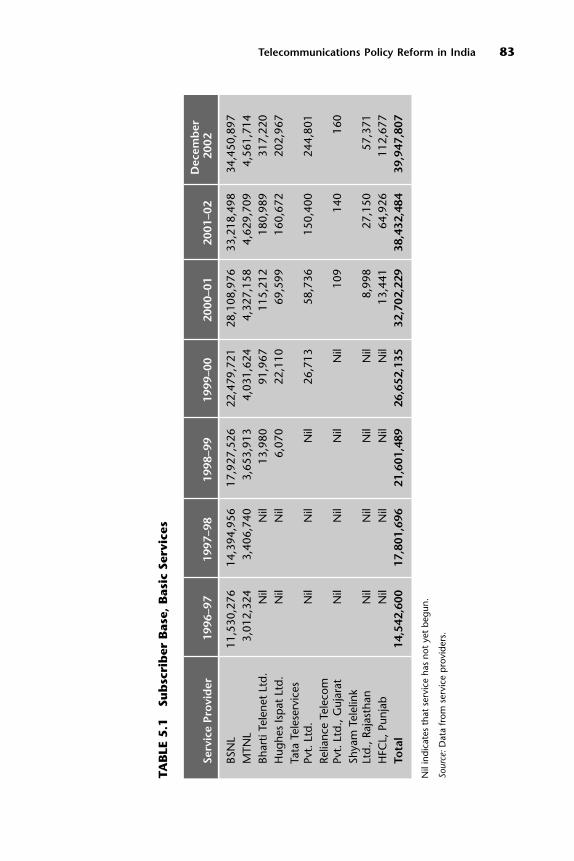
Telecommunications Policy Reform in India 83
TAB
LE 5
.1Su
bsc
rib
er B
ase,
Bas
ic S
ervi
ces
Nil
indi
cate
s th
at s
ervi
ce h
as n
ot y
et b
egun
.
Sour
ce:D
ata
from
ser
vice
pro
vide
rs.
Dec
emb
erSe
rvic
e Pr
ovi
der
1996
–97
1997
–98
1998
–99
1999
–00
2000
–01
2001
–02
2002
BSN
L11
,530
,276
14,3
94,9
5617
,927
,526
22,4
79,7
2128
,108
,976
33,2
18,4
9834
,450
,897
MTN
L3,
012,
324
3,40
6,74
03,
653,
913
4,03
1,62
44,
327,
158
4,62
9,70
94,
561,
714
Bhar
ti Te
lene
t Lt
d.N
ilN
il13
,980
91,9
6711
5,21
218
0,98
931
7,22
0H
ughe
s Is
pat
Ltd
.N
ilN
il6,
070
22,1
1069
,599
160,
672
202,
967
Tata
Tel
eser
vice
sPv
t. L
td.
Nil
Nil
Nil
26,7
1358
,736
150,
400
244,
801
Relia
nce
Tele
com
Pvt.
Ltd
., G
ujar
atN
ilN
ilN
ilN
il10
914
016
0Sh
yam
Tel
elin
k Lt
d., R
ajas
than
Nil
Nil
Nil
Nil
8,99
827
,150
57,3
71H
FCL,
Pun
jab
Nil
Nil
Nil
Nil
13,4
4164
,926
112,
677
Tota
l14
,542
,600
17,8
01,6
9621
,601
,489
26,6
52,1
3532
,702
,229
38,4
32,4
8439
,947
,807

in each circle to compete with the incumbent DoT (now with BSNL) and MTNL.
New entrants were allowed to offer intracircle long-distance services, but DoT
maintained its monopoly on intercircle long-distance telephony. The bidding
process led to six new entrants in basic services. In 2001 the policy was changed to
allow unlimited entry into each circle for basic services and subsequently 22
license agreements have been signed. As opposed to the fixed-license-fee regime
based on which licenses were awarded earlier, fresh licenses have been issued on
the bases of a one-time entry fee and a percentage of revenue share that is linked
to the area of operation.1 Six privately owned service providers have begun ser-
vices and newly licensed service providers are expected to start operations soon
(see table 5.2).
Private participation in the cellular-mobile market, on the other hand, has
been comparatively more successful. Eight cellular licenses, two in each of the four
metropolitan areas, were awarded in October 1994. Subsequently, bidding
resulted in the award of licenses in 18 Circles.2 No bids were received for two
circles—Jammu and Kashmir, and Andaman and Nicobar Island—and only one
bid each was made for West Bengal and Assam. In the past year, cellular services
have grown at an annual rate of more than 89 percent. The subscriber base
exceeded 3.5 million by the final quarter of 2001 and at the end of December
2002 it was approximately 10.53 million (see table 5.3). As a percentage of basic
84 India and the WTO
Area of Operation Name of Service Provider
All over India BSNL (formerly Department of Telecommunications)
Delhi and Mumbai MTNLDelhi, Haryana, Karnataka, Madhya Pradesh, Tamilnadu Bharti Telenet Ltd.Maharashtra Hughes Ispat Ltd.Andhra Pradesh, Delhi, Gujarat,Karnataka, Tamilnadu Tata Teleservices Pvt. Ltd.Gujarat Reliance Telecom Pvt. Ltd.Punjab HFCLRajasthan Shyam Telelink Ltd.
TABLE 5.2 List of Basic Service Providers and Their Areas of Operation
Note: Apart from the areas listed above, Reliance has yet to launch its services in 17 more circles (Andamanand Nicobar Island, Andhra Pradesh, Bihar, Delhi, Haryana, Himachal Pradesh, Karnataka, Kerala, MadhyaPradesh, Maharashtra, Orissa, Punjab, Rajasthan, Tamilnadu, Uttar Pradesh-West, Uttar Pradesh-East, andWest Bengal)
Source: Data available at www.dotindia.com and from reports by service providers.

Telecommunications Policy Reform in India 85
TAB
LE 5
.3Su
bsc
rib
er B
ase,
Cel
lula
r Se
rvic
es
Mar
ch
Mar
chM
arch
Mar
chM
arch
Mar
chD
ecem
ber
Cat
ego
ry19
9719
9819
9920
0020
0120
0220
02
All
met
ros
325,
967
551,
757
519,
543
795,
931
1,36
2,59
22,
567,
757
4,05
4,43
4A
Circ
le9,
698
176,
954
354,
799
585,
653
1,16
5,77
82,
134,
333
3,51
5,33
3B
Circ
le3,
000
138,
309
284,
189
460,
094
932,
685
1,50
1,15
12,
550,
223
C C
ircle
366
15,2
9636
,915
42,6
3311
6,04
022
7,57
336
0,44
0A
ll In
dia
339,
031
882,
316
1,19
5,44
61,
884,
311
3,57
7,09
56,
430,
814
10,4
80,4
30
Sour
ce: C
ellu
lar
Op
erat
ors
Ass
ocia
tion
of In
dia
(ww
w.c
oai.c
om).
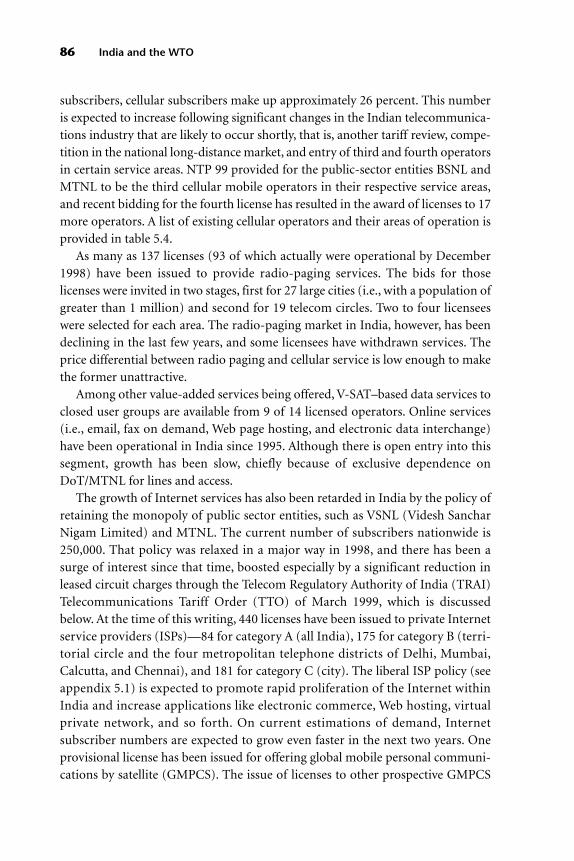
86 India and the WTO
subscribers, cellular subscribers make up approximately 26 percent. This number
is expected to increase following significant changes in the Indian telecommunica-
tions industry that are likely to occur shortly, that is, another tariff review, compe-
tition in the national long-distance market, and entry of third and fourth operators
in certain service areas. NTP 99 provided for the public-sector entities BSNL and
MTNL to be the third cellular mobile operators in their respective service areas,
and recent bidding for the fourth license has resulted in the award of licenses to 17
more operators. A list of existing cellular operators and their areas of operation is
provided in table 5.4.
As many as 137 licenses (93 of which actually were operational by December
1998) have been issued to provide radio-paging services. The bids for those
licenses were invited in two stages, first for 27 large cities (i.e., with a population of
greater than 1 million) and second for 19 telecom circles. Two to four licensees
were selected for each area. The radio-paging market in India, however, has been
declining in the last few years, and some licensees have withdrawn services. The
price differential between radio paging and cellular service is low enough to make
the former unattractive.
Among other value-added services being offered, V-SAT–based data services to
closed user groups are available from 9 of 14 licensed operators. Online services
(i.e., email, fax on demand, Web page hosting, and electronic data interchange)
have been operational in India since 1995. Although there is open entry into this
segment, growth has been slow, chiefly because of exclusive dependence on
DoT/MTNL for lines and access.
The growth of Internet services has also been retarded in India by the policy of
retaining the monopoly of public sector entities, such as VSNL (Videsh Sanchar
Nigam Limited) and MTNL. The current number of subscribers nationwide is
250,000. That policy was relaxed in a major way in 1998, and there has been a
surge of interest since that time, boosted especially by a significant reduction in
leased circuit charges through the Telecom Regulatory Authority of India (TRAI)
Telecommunications Tariff Order (TTO) of March 1999, which is discussed
below. At the time of this writing, 440 licenses have been issued to private Internet
service providers (ISPs)—84 for category A (all India), 175 for category B (terri-
torial circle and the four metropolitan telephone districts of Delhi, Mumbai,
Calcutta, and Chennai), and 181 for category C (city). The liberal ISP policy (see
appendix 5.1) is expected to promote rapid proliferation of the Internet within
India and increase applications like electronic commerce, Web hosting, virtual
private network, and so forth. On current estimations of demand, Internet
subscriber numbers are expected to grow even faster in the next two years. One
provisional license has been issued for offering global mobile personal communi-
cations by satellite (GMPCS). The issue of licenses to other prospective GMPCS
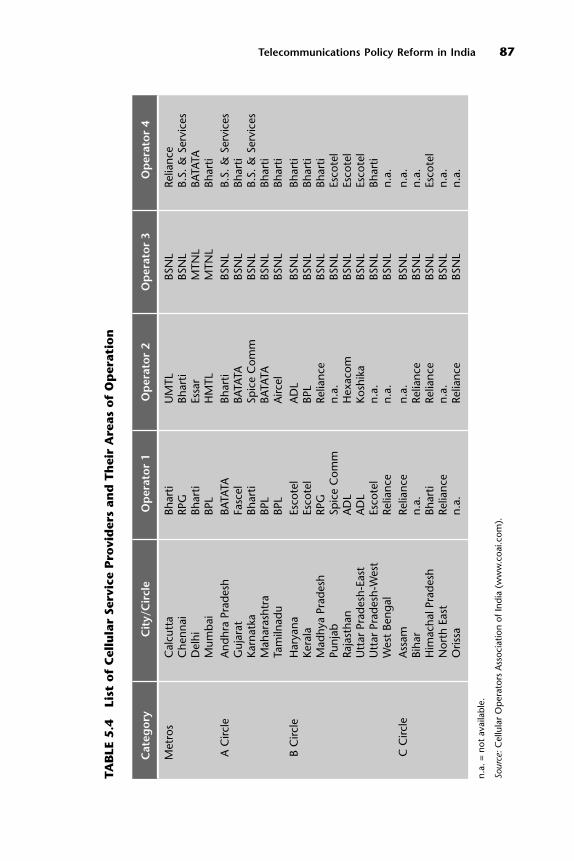
Telecommunications Policy Reform in India 87
TAB
LE 5
.4Li
st o
f C
ellu
lar
Serv
ice
Pro
vid
ers
and
Th
eir
Are
as o
f O
per
atio
n
Cat
ego
ryC
ity/
Cir
cle
Op
erat
or
1O
per
ato
r 2
Op
erat
or
3O
per
ato
r 4
Met
ros
Cal
cutt
aBh
arti
UM
TLBS
NL
Relia
nce
Che
nnai
RPG
Bhar
tiBS
NL
B.S.
& S
ervi
ces
Del
hiBh
arti
Essa
rM
TNL
BATA
TAM
umba
iBP
LH
MTL
MTN
LBh
arti
A C
ircle
And
hra
Prad
esh
BATA
TABh
arti
BSN
LB.
S. &
Ser
vice
sG
ujar
atFa
scel
BATA
TABS
NL
Bhar
tiKa
rnat
kaBh
arti
Spic
e C
omm
BSN
LB.
S. &
Ser
vice
sM
ahar
asht
raBP
LBA
TATA
BSN
LBh
arti
Tam
ilnad
uBP
LA
ircel
BSN
LBh
arti
B C
ircle
Har
yana
Esco
tel
AD
LBS
NL
Bhar
tiKe
rala
Esco
tel
BPL
BSN
LBh
arti
Mad
hya
Prad
esh
RPG
Relia
nce
BSN
LBh
arti
Punj
abSp
ice
Com
mn.
a.BS
NL
Esco
tel
Raja
stha
nA
DL
Hex
acom
BSN
LEs
cote
lU
ttar
Pra
desh
-Eas
tA
DL
Kosh
ika
BSN
LEs
cote
lU
ttar
Pra
desh
-Wes
tEs
cote
ln.
a.BS
NL
Bhar
tiW
est
Beng
alRe
lianc
en.
a.BS
NL
n.a.
C C
ircle
Ass
amRe
lianc
en.
a.BS
NL
n.a.
Biha
rn.
a.Re
lianc
eBS
NL
n.a.
Him
acha
l Pra
desh
Bhar
tiRe
lianc
eBS
NL
Esco
tel
Nor
th E
ast
Relia
nce
n.a.
BSN
Ln.
a.O
rissa
n.a.
Relia
nce
BSN
Ln.
a.
n.a.
= n
ot a
vaila
ble.
Sour
ce:C
ellu
lar
Op
erat
ors
Ass
ocia
tion
of In
dia
(ww
w.c
oai.c
om).

operators is reportedly under consideration. A summary of the telecom market
structure emerging from the policy outlined above is presented in table 5.5.
The Policy Documents of 1994 and 1999
NTP 94 spelled out five basic objectives and two of them (availability of telephone
on demand and universal service that connects all villages)—were to be realized
by 1997. Both of those objectives remain unrealized. With regard to quality of
service, matching the “world standard” and providing the “widest possible range
of services at reasonable prices” were stated aims. Two other objectives were to
make India a major manufacturing base and an exporter of telecom equipment
and to ensure the country’s defense and security needs. (The powers of licensing
and spectrum management were retained by the government on the ground that
both need to be strictly monitored to protect the strategic interests and security of
the country.)
There were serious gaps in the policy document relative to provision of a suit-
able environment for the entry of private-service providers and the issue of regu-
lation. Under the 1994 policy, a need for private sector contribution to the effort
was clearly recognized, but various implementation problems, including incom-
plete reforms, mitigated the efforts to achieve the targets. Meanwhile, the nature
of convergence had changed as a result of changes in technology and in the over-
all market structure for service provision, and there was a need to provide fresh
directions through another policy.
88 India and the WTO
TABLE 5.5 Telecommunications Market Structure
Period ofMarket Number of Service License
Segment Structure Operators Areas (Years)
Fixed telephone Openservices competition Unlimited Circles 20Domestic long Opendistance competition Unlimited All India 20 International Open
competition Unlimited All India 20 Cellular Limited Metros and
competition 4 circles 20Radio paging Limited Cities and
competition 4 circles 10
Source: Authors’ compilation of data from www.dotindia.com.
The opening up of the Internet sector set the background to NTP 99, which
was a major attempt to plug the loopholes in the 1994 policy. Its enunciation of
policy objectives was a marked improvement. Provision of universal service
(including service to unconnected and rural areas, retargeted for 2002) was
sought to be balanced by provision of sophisticated telecom services capable of
meeting the needs of India’s economy. The latter objective was further amplified
to include Internet access to all district headquarters by 2000 and high-speed data
and multimedia capabilities in all towns with populations of 200,000 and more by
2002. Apart from a target-average penetration of 7 percent by the year 2005 (and
15 percent by 2010), targets for rural teledensity have been set to increase from the
current level of 0.4 percent to 4.0 percent during the same period.
Recognizing the role of private investment, NTP 99 envisaged multiple opera-
tors in the market for various services. Another major change has been a shift
from the existing license-fee-bid system to one based on a one-time entry fee com-
bined with revenue-share payments. To meet the teledensity targets of NTP 99, it
was earlier estimated that a capital expenditure of Rs. 4 trillion for installing about
130 million lines would be required. With a decline in equipment price and
changes in technology, the current estimate is almost 25 percent lower and is
expected to decline further.
Whereas NTP 94 only acknowledged the need to induce significant private par-
ticipation into value-added as well as basic services and to “ensure fair competition,”
NTP 99 went further in targeting an enhanced competitive environment and a level
playing field. Over time, the government has made attempts to remove restrictions
that adversely affect performance of the licensee. For instance, there was a condition
that the last mile of linkage should be made only with copper wire, but this condi-
tion has been relaxed. NTP 99 allowed DoT/MTNL to enter as the third cellular-
mobile operators in their service areas if they wished to provide those services. To
ensure a level playing field, DoT and MTNL would have to pay a license fee, but
DoT’s license fee would be refunded because it had to meet the universal service
obligations (USO). It is worth noting that to the extent that the fee would be
refunded specifically to counter the cost of USO, this aspect should be accounted for
when the USO levy is calculated and the revenues from that levy are apportioned.
Some of the other notable advances marked by the NTP 99 are the following:
• Speeding up of competition in long distance, including usage of the existing
backbone network of public and private entities in the rail transport, power,
and energy sectors for data (immediately) and for domestic, long-distance
voice communication when the latter opened to competition in January 2000.
This increases the scope for entry of a new category of infrastructure providers
or “carrier’s carrier.”
Telecommunications Policy Reform in India 89

• Permission for fixed service providers (FSPs) to freely establish “last-mile”
linkages to provide fixed services and carry long-distance traffic within their
service areas without seeking an additional license. Direct interconnectivity
between FSPs and any other type of service provider (including another FSP)
in their areas of operation and the sharing of infrastructure with any other
type of service provider was also permitted.
• Conversion of public call offices, wherever justified, into public teleinfo centers
with such multimedia capability as integrated services digital network services,
remote database access, government and community information systems, and
the like.
• Transformation, in a time-bound manner, of the telecommunications sector
into a greater competitive environment in both urban and rural areas, thereby
providing equal opportunities and a level playing field for all participants.
• Strengthened research and development efforts in India and provision of an
impetus to build world-class manufacturing capabilities.
• Efficiency and transparency in spectrum management.
• Commitment to restructuring DoT.
• Interconnection between private-service providers in the same circle and
between a service provider and VSNL, along with introduction of competition
in domestic long distance.
• Undertaking to review interconnectivity between private-service providers of
different service areas, in consultation with TRAI.
• Permission for resale of domestic telephony.
• Clarity regarding the number of licenses that each operator may be granted.
(This could lead to consolidation of industry operators over the long term.)
• Emphasis on certain other issues, including standardization, human resource
development and training, disaster management, and legislative change.
According to NTP 99, the number of basic service providers in each circle and
their mode of selection would be decided on the basis of recommendations from
TRAI. As opposed to the bidding-based license fee regime in place earlier, licenses
would be issued on the basis of a one-time entry fee and a percentage of revenue
share to be determined by DoT on the basis of recommendations made by TRAI.
In 2001 the license policy was changed to allow open entry into each circle for
basic services, and 22 license agreements have been signed. As was noted above,
the new licenses have been issued for a one-time entry fee and a percentage of rev-
enue share that is linked to the area of operation.
In total, India’s basic service comprised only 9.5 million users in 1991. The
number of users had increased by almost 3.5 times as of June 2001 (to 33 million)
and presently there are about 40 million users. By all measures, the growth of basic
90 India and the WTO
telecommunications services in India has been phenomenal over the last five
years. Policymakers have provided further opportunities, including, for example,
open competition and permission for cable operators to provide last-mile link-
ages and switched services within their service areas of operation. Subject to
obtaining a basic service license, those operators also are permitted to provide
two-way communication, including voice, data, and information services.
NTP 99 proposed that the long-term policy have uniform 20-year licenses for
both basic and cellular-mobile services. Extending license periods initially by 5
years and subsequently by 10 years was also envisaged. Internet telephony has now
been permitted, and this will bring major changes in the telecom industry in India
as the entry costs for such telephony decline and quality of service improves. NTP
99 is a welcome effort to address key issues relating to telecom reforms and to lay
down policies that could transform the sector into a competitive and efficient
infrastructure within a reasonable time frame. The policy aims at providing a
modern and efficient telecom infrastructure and takes account of the convergence
of IT, media, telecommunications, and consumer electronics. The emphasis is on
making India an IT superpower. As mentioned above, the regulatory scenario for
telecommunications is changing rapidly, and many issues require further analysis
and perhaps a change in policy framework in the next few years.
Key Policy Issues
As stated above, the new policy provided the framework within which India’s tele-
com sector would function and focused on creating an environment to enable
continued attraction of investment in the sector and to allow creation of a world-
class telecommunications infrastructure. This section analyzes and provides
details of the issues relevant in the implementation of the new policy; for exam-
ple, the nature of the interconnection regime that will most likely result in attain-
ing the objectives of the new policy, the achievement of USO, the license condi-
tions to encourage more investment in the sector, and regulatory principles that
are important for achieving the ambitious objectives of NTP 99. The significant
issues are detailed below.
Interconnection
In a multi-operator environment, interconnection is a crucial regulatory issue for
telecommunications policy. No new entrant into the market will be able to compete
effectively unless it is able to interconnect its network with the facilities of the
incumbent operator either directly or indirectly via the network of another compet-
itive entrant. In the course of transition to competition, a pivotal issue is how best to
Telecommunications Policy Reform in India 91

meet the requirements of interconnection of each of the service providers. For most
telephone users, the services offered by the new entrant will be almost useless unless
the entrant can enable its subscribers to communicate with the large number of
subscribers of the incumbent operator. Consequently, competition in the market
can flourish only if entrants are able to interconnect their facilities with those of the
incumbent and to do so at terms that allow the entrant to provide the service at
competitive levels of price and quality. A “fair and reasonable” interconnection pol-
icy is a critical factor in fostering competition in telecommunications markets.
Prior to NTP 99, direct interconnection between service providers was not a
policy; instead, two networks had to be connected via the incumbent operator,
that is, DoT. This arrangement was combined with certain charges for intercon-
nection that were, in several instances, above cost-based interconnection charges.
For interconnection the following principles have been emphasized by TRAI:
• Principles of pricing, timeliness, point of interconnection, and quality of inter-
connection should be based on a “no less favorable standard” in comparison
with another operator (including the conditions implicitly or explicitly pro-
vided to one’s own operations).
• Interconnection charges should be cost based.
• Those costs should be those caused by constructing the link with, and through
the use of, the network of the interconnecting service provider (these costs
are directly attributable “incremental” or “additional” costs resulting from
interconnection).
• The interconnecting service provider must be allowed access to unbundled ele-
ments of the network that it requires, and must not be charged for facilities
that it does not require.
• For any particular interconnection service, the same interconnection charge
should apply to any service provider.
• All interconnection service providers should be allowed to charge an intercon-
nection price.
NTP 99 stated that direct interconnection between service providers in the
same service area would be permitted. This implies, for instance, that a cellular-
service provider can directly link its network to that of the other service provider
in the same service area without having to interconnect via BSNL. Not only is this
likely to reduce the price to the end user, but it may result in more efficient use of
the networks. Although direct interconnection between private networks has been
slow to take off following removal of policy restrictions, increased traffic and pen-
etration are likely to provide private operators the necessary impetus to take
advantage of direct interconnection.
92 India and the WTO
The necessity of providing a level playing field for public and private operators
is another key policy issue. In this context, for instance, an incumbent operator
who deters entry to a new operator can keep efficiency from being maximized. To
achieve the possible economies of scale and scope and network externalities, the
role of regulation should be to reduce or eliminate market power and mimic the
outcomes of the competitive process (ITU 1999a). In a press statement, the gov-
ernment has reiterated its commitment that, in terms of NTP 99,“there is going to
be the same licensing regime for all operators, i.e., interconnect revenue-sharing
arrangements for cellular services for payment of access charges between DoT and
MTNL for STD and ISD traffic will be the same as applicable to the other private
operators.” With the opening up of the domestic long-distance (DLD) market to
private competition to compete with BSNL, new opportunities and challenges are
likely to emerge with regard to interconnection. A private operator granted a
license to offer DLD services has proposed interconnection rates that are approxi-
mately 50 percent lower than the rates offered by the incumbent BSNL. BSNL has
responded in an aggressive manner to these proposals. Although these offers are
subject to regulatory approval based on the principles cited above, it is clear that
increasing competition for DLD traffic is bound to put pressure on the cross-subsidy
prevalent in the tariff regime, as will be noted below in more detail.
On December 14, 2001, TRAI issued a consultation paper on “Issues Relating
to Interconnection between Access Providers and National Long Distance Opera-
tors.” This process has led to TRAI’s specifying a model reference interconnect
offer (RIO) that covers various regulatory aspects relating to interconnection. The
TRAI has also recently published in the official gazette notice of a regime of inter-
connect usage charges to facilitate commercial interconnection in a multi-operator
environment.
Tariffs
Linked to interconnection and competitive efficiency are the issues of tariffs and
tariff policy. It is now widely recognized that enhancing efficiency and investment
in telecommunications requires the introduction of competition, which in turn
needs a regulatory mechanism to facilitate competition. An essential ingredient of
transition from a protected market to competition is the alignment of prices with
costs (i.e., cost-oriented or cost-based prices), so that prices better reflect their
likely levels in a competitive environment. In basic telecommunications, for
example, a major departure from cost-based pricing—such as that under the
prevailing price structure in several countries, including India—involves cross-
subsidization. This introduces inefficient decisionmaking by both consumers and
service providers. Cost-based prices also provide a basis for making subsidies
Telecommunications Policy Reform in India 93

more transparent and for more accurately targeting them on specific social objec-
tives, for example, achieving the USO. For consumers, cost-based prices reflect
economic costs and provide efficiency-oriented incentives for consumption. For
service providers, cost-based prices better prepare the conditions for competition
among different operators.
Cost-based prices restrict the possibility of cream skimming by operators,
facilitate the smooth interflow of traffic, and reduce the dependency of operators
on narrow market segments for maintaining their financial viability. This in turn
promotes greater concern among operators for a wider set of their subscriber base
and prompts them to focus on quality of service, improved technology, and ser-
vice options. If tariffs for services that incorporate a high level of cross-subsidies
(e.g., basic service) are not made cost oriented, major adjustments would be
required in the pricing structure when competition takes place in the telecom
market.
Traditionally, BSNL tariffs cross-subsidized the cost of access (as reflected by
rentals) by domestic and international long-distance usage charges. To promote
desired efficiencies, rebalancing tariffs is a necessity and therefore an important
policy issue. Rebalancing tariffs involves reducing tariffs that are above costs and
increasing those below costs. Thus rebalancing implies a reduction in the extent of
cross-subsidization in the fixed-services sector. Such a rationalization is a required
precondition for converting a single operator system to a multi-operator one.
Regarding tariff determination, as in other policy considerations, TRAI is
obliged to ensure transparency in exercising its powers (for which TRAI has
adopted a systematic procedure of consultation with all interest groups). After
going through a comprehensive consultation procedure covering service providers,
consumers, policymakers, and parliamentarians, TRAI issued its Telecommuni-
cations Tariff Order on March 9, 1999. The order represents a landmark for
infrastructure regulatory agencies in India in terms of attempting to rebalance
tariffs to reflect costs more closely and to usher in an era of competitive service
provision. The chief features of the tariff order were substantial reductions in
long-distance and international call charges, an increase in rentals and local
charges, and steep reductions (an average of about 70 percent) in the charge for
leased circuits.
For basic services, TRAI demonstrated that tariff rebalancing was necessary to
prepare the market for competition. A small proportion of the subscribers
account for a major share of call revenue, and these subscribers would be exposed
to competition when private-sector operators enter the market (see table 5.6).
Loss of such customers will have a significant effect on the revenue situation of the
incumbent, making it difficult to meet the objectives of USO and network expan-
sion. Thus, although tariffs have to be reduced for the services that are priced
94 India and the WTO

much above cost (e.g., long-distance and international calls), tariffs for below-cost
items need to be increased. Such a rebalancing exercise is common when prepar-
ing the situation for competition. Otherwise, competition will result in a decline
in above-cost prices without any compensating change in the below-cost prices.
The methodology of specifying tariffs included the following feature to impart
flexibility. For certain services, TRAI specified particular tariff levels whereas for
several others it showed forbearance. Even for those services for which tariff levels
are specified, the framework includes the possibility of providing alternative tar-
iffs. The tariffs specified by TRAI form a package that is termed the “standard tar-
iff package.” This package must always be provided to the customer. In addition,
the service provider is left free to provide any “alternative tariff package.” Because
the standard tariff package is always available, any alternative tariff package must
be better in order to attract any customer. Therefore, the standard tariff package
provides a minimum guarantee to the customer. In one sense, it specifies the peak
expenditure level for the customer, with the alternative tariff packages being
attractive only if the expenditure involved in them is lower than that for the stan-
dard tariff package. This method of flexibility was adopted because of the growing
tendency in telecom markets to provide different tariff combinations for various
baskets of services.
In the case of basic telecom tariffs, changes in certain tariffs (e.g., rental,
domestic long-distance, and international call tariffs) were to be phased in over a
period of three years. Traditionally, rental charges in India have been linked to the
Telecommunications Policy Reform in India 95
TABLE 5.6 Revenue Contribution by Different SubscriberGroups
Contribution of TheseShare of Total Subscribers (%) Subscribers to Call Revenue (%)
2.7 (those making more than 10,000 calls bimonthly) 46.1
2.5 (those making between 5001 and 10,000 calls bimonthly) 9.8
7.9 (those making between 2,001 and 5,000 calls bimonthly) 13.4
14.0 (those making between 1,001 and 2,000 calls bimonthly) 11.6
21.3 (those making between 501 and 1,000 calls bimonthly) 10.0
51.7 (those making 0 to 500 calls bimonthly) 8.1
Source: TRAI 1999b.

size of the exchange providing the connection. The revised tariffs involved an
increase in the price of local calls for low-calling subscribers and a decline in such
call charges for high-calling subscribers. Domestic long-distance calls on average
witnessed a reduction of up to 35 percent with further reductions of 15 percent
anticipated over the period to 2002. Likewise, charges for international calls to
areas outside of the South Asian Association for Regional Co-operation and
neighboring countries decreased by over 30 percent, with further reduction of
about 10 percent. With the entry of competition in the long-distance market, fur-
ther reduction in the corresponding tariffs has taken place. Certain tariffs have
declined by 60 percent. The TRAI has further addressed the basic tariff situation,
taking into account the structural change in the telecom market occasioned by the
introduction of competition in the domestic long-distance market. A revised tar-
iff order has been issued, extending the process of tariff rebalancing, and a linked
interconnect usage charge regime has been specified with origination, carriage,
and termination charges in a multi-operator, multiservice environment.
For cellular-mobile service, tariffs were restructured because the prevailing
rentals were low and call charges were high. This resulted in a tariff structure that
dissuaded usage and loaded the subscriber base. Thus, call charges were reduced
and rentals increased. The methodology clearly included license fee as a cost and
showed that a high license fee translates into higher tariffs.
The standard monthly rental for cellular-mobile service was increased from
Rs. 156 to Rs. 600, but the maximum call charge was reduced from a peak of
Rs. 16.80 per minute to Rs. 6 per minute. The service providers were allowed to give
alternative tariff packages that resulted in lower tariffs. Leased circuit tariffs were
decreased in order to encourage the use of telecom by business and bulk users, and
to provide a competitive stimulus to such users through the use of leased circuits.
Because there was a major systemic change encompassed in the tariff changes, it
was not possible to be definite about any eventuality. Thus the framework included
an annual review of the situation.
TTO 1999 evoked considerable protest from a number of quarters. The tariff
package was an attempt to balance several objectives. The explanatory memoran-
dum to the order provided a detailed reasoning on this matter, including the
affordability of tariffs. The possibility of giving alternative tariffs provided a
means of addressing several concerns. Over time, with greater competition in the
market, tariffs for long-distance calls and for cellular-mobile service have seen
dramatic declines within such a framework. The reduction in tariffs has also been
spurred by the introduction of wireless in local loop with limited mobility, and a
major cost reduction due to technological change. With the new service providers
relying on more recent, cost-efficient technologies, the Indian telecom market is
emerging with very strong competitive pressure.
96 India and the WTO

Convergence
Private sector participation in the Indian telecommunications sector will provide
a fillip to technology upgrading and help bridge the gap in adoption of new tech-
nology. There have been far-reaching developments in the recent past in telecom-
munications, IT, consumer electronics, and media industries. According to NTP
99, convergence of both markets and technology is a reality that is forcing realign-
ment of the telecom industry. Telephone and broadcasting industries are entering
each other’s markets, and technology is blurring the difference between conduit
systems, such as wireless and wireline. These rapid changes in technology have
largely diluted the monopoly characteristic of telecom-service provision, thereby
opening up avenues for improved efficiency. Competition is now viable in a range
of services, including long-distance transmission of voice and data. Facilitating
effective competition among the various players is therefore a key policy issue.
This fact was also acknowledged in NTP 99.
Convergence of technologies implies a need not only to consider the appropri-
ate method of charging a license fee, but also to consider whether to regulate and
the nature and extent of regulation. The goal of all the policy initiatives is to pro-
mote flexibility of technology choice and service provision. Thus neutrality of
policies toward the technology platform is seen as desirable because it enhances
opportunities, and because the policymaker is not in a position to anticipate the
likely developments and to finetune policy.
The basic driving force of growing competition in what was once thought to be
a natural monopoly is the increasing versatility with which services can be pro-
vided, based on the digitization of all signal-transfer technology. As the manner in
which signals are transferred from one location to another becomes standardized,
it is possible for a service provider in one segment of telecommunications (say, net-
work television services) to perform the functions of another (perhaps the local
phone company). Efforts to maintain barriers across such segments will eventu-
ally be overwhelmed by technology. Regulation will follow convergence rather
than the other way around.
The nature of telecommunications and broadcasting transactions, the tech-
nology used, and the methods of funding the infrastructure are becoming more
and more similar. Some of these diversification activities are on account of tech-
nical convergence of the medium (the fiberoptic cable) used to distribute ser-
vices. The high and versatile data-carrying capacity of optic–optic networks
means that those networks will also be ideal resources to be resold to multiple
service providers, such as cable operators, broadcasters, telephone operators,
ISPs, or any other company that needs to send digital signals into the connected
units.
Telecommunications Policy Reform in India 97
In several developed systems, broadcasting is increasingly exploiting the tradi-
tional telecommunications medium of cables rather than radio waves. Conversely,
entertainment and advertising are among the areas turning to the ordinary
telephone network. The use of telecommunications infrastructure to supply
entertainment will make it possible to deliver a potentially unlimited number of
television channels, and the need to limit the number of channels to preserve
radio frequencies will disappear.
As is true elsewhere, the telecom sector in India has witnessed rapid changes in
the last six years; and convergence that now allows operators to use their facilities
to deliver some services reserved for other operators demands a reconsideration
of the existing policy framework.
A proper regulatory framework is the first step toward effective regulation in a
converged environment. A draft Communications Convergence Bill (available at
http://communicationbill.dot.nic.in), introduced in India, aims to provide a regu-
latory framework for telecommunications companies confronted with the con-
vergence of telecom, Internet, and broadcasting services. This draft legislation has
been prepared along the lines of an amendment to the U.S. Telecommunications
Act of 1996 and the Malaysian Communications and Multimedia Commission
Act of 1998 (the latter available at http://www.cmc.gov.my/legisframe.htm). If the
bill is passed, India will become one of the few countries in the world to adopt leg-
islation covering the convergence of high-technology media. Under the proposed
legislation, a commission will be established as the regulatory authority in conver-
gence of IT, communications, and broadcasting, and will be responsible for man-
aging spectrum, granting of licenses, enforcing license conditions, determining
tariff rates, and ensuring a competitive marketplace. The proposal comes at a time
when several countries have introduced or are in the process of introducing
changes in their regulatory environments. Some countries with established regu-
lators have chosen to build on current structures rather than set up new entities.
The proposed bill provides the framework within which convergence in the
communications sector can start and be sustained. A major proposed change
from the current legislation is that licensing powers would be transferred to the
Communications Commission of India (CCI). The proposed commission is also
intended to be independent and autonomous. Its independence is necessary for
several reasons, not least the need to gain domestic and international credibility.
Because one of the main objectives of the commission will be promoting the prin-
ciples of a level playing field for all operators, even the slightest reservation about
its independence and autonomy could adversely affect the competitive climate
and constrain its regulatory efforts.
As stated above, convergence will eliminate the existing barriers between dif-
ferent types of services—for example, between basic and cellular services—and
98 India and the WTO

will enable service providers and thus consumers to benefit from scale and scope
economies. Naturally, competition policy issues will need to be addressed more
frequently in the converged environment, and the growing consolidation of the
telecom industry will engage the regulatory resources more than in the current
environment. Thus convergence often may result in issues falling within the com-
petence of more than one regulator. Issues relating to competition and competi-
tion policy could fall under the jurisdiction of either the proposed Competition
Commission of India or the Communications Commission of India.
It would be appropriate if the CCI is given adequate power to resolve all issues
in the telecom sector, including issues relating to competition and observance of a
level playing field. This aggregated power, in fact, should be applicable to all
industry-specific regulators because in practice it would be extremely difficult to
segregate competition issues from issues specific to a given industry. In case there
is overlapping jurisdiction on competition policy and related issues between the
CCI and the industry-specific regulatory body, the time required to resolve issues
would increase, thereby decreasing the effectiveness of the process. Furthermore, a
hybrid structure will allow the possibility of “forum shopping,” which could
increase the resources and time expended toward resolving issues. To achieve con-
sistent and clear handling of sector-specific problems, including those relating to
anticompetitive action, it is better that such problems be handled by the sector-
specific regulator.
Regulatory uncertainty is an important factor that could stifle convergence
before its benefits could be felt by the economy and society at large. Consistency in
regulation is truly a challenge. For instance, delivery of different services over a
single network does not make all services the same. And regulating different ser-
vices similarly may result in discriminatory treatment, which may hold back com-
petition, investment, and innovation. The nature of restrictions on market entry
and licensing ultimately would affect the consumer and one of the most crucial
decisions in this regard would relate to the licensing of existing and new players in
the converged environment.
Technology
To become globally competitive, India has to keep pace with developments in
telecommunication services and technology worldwide. Accessing related tech-
nologies and promoting needed investments in a competitive environment raise
important policy concerns. With the huge reserve of highly qualified manpower,
research and development is one area that should be given high priority. NTP 99
holds out the objective of India’s emergence as an IT superpower and of Indian tele-
com companies becoming truly global players. It envisages government measures to
Telecommunications Policy Reform in India 99

ensure that industry invests adequately in research and development for service
provision as well as manufacturing. Increased integration with global markets will
provide the thrust (as evidenced by the software industry); this needs to be sup-
plemented by targeted investment to realize the aims spelled out in NTP 99.
Quality of Service
A major objective and one around which important policies are designed is world-
class quality of service. In India, as in many other developing countries, low tele-
density has put great emphasis on rapid expansion. With the effort focused on
expansion, issues relating to quality of service (QOS) have sometimes not received
full attention, even though QOS has steadily improved over the years. One of the
benefits expected from private sector entry is an improvement of QOS to interna-
tional standards. QOS standards have been built into license conditions and have
been identified as one of the major areas of concern on the regulatory agenda. In
fact the regulator, TRAI, has developed QOS norms to apply across the board to all
operators who offer basic and cellular mobile service. Not only are the QOS norms
declared; they are also being monitored. This is a major consumer welfare strategy.
Consumer Welfare
Consumer welfare is the prime objective of the telecommunications revolution in
India. Telecom as infrastructure is a necessity not only for businesses but for all
consumers. The policy objective here is to extend the service to more new con-
sumers by making access easier and to improve the service available to existing
consumers. Providing greater choice through competition also is expected to ben-
efit the consumer through better services and lower tariffs. Therefore, although
liberalization policy is geared to improve consumer welfare, there is a need for
specific policies to achieve this objective. The regulatory framework is an impor-
tant means of ensuring consumer welfare. Customer satisfaction and the moni-
toring of operator performance are high on the regulatory agenda. Interconnec-
tion policy is also focused on achieving a nearly seamless architecture so that
consumer access is unrestricted. Another policy initiative intended to improve
consumer welfare is adopting a tariff structure suitable to social requirements to
ensure that the tariff is affordable for all users.
Competition
Almost four years after the implementation of TTO 1999, BSNL and MTNL have
approximately 98 percent of the total market in basic services. Thus private entry
100 India and the WTO
in basic services has had negligible impact on the market in the intervening years.
There are several reasons for the slow growth of private provision of basic ser-
vices. One reason involves the slow and delayed entry of basic service providers in
the Indian market consequent to troubles with the licensing process. Another rea-
son for the slow growth could be that most private operators have focused on the
lucrative business segment of the market, without much concern for increasing
market share. At the same time, the market for cellular services has shown high
growth rates and comparatively more frequent tariff changes.
Two of the main tasks of a regulator are to control prices and the quality of
service and to ensure that any service provider with monopoly power does not
overcharge users for the service they offer—that is, regulation should result in
outcomes that mimic those of a competitive environment. Furthermore, as the
market for a service becomes increasingly competitive, the level or scope of regu-
lation in that market should be reduced proportionately. The level of price regula-
tion should be inversely related to the level of price competition. Thus the basic
prescription is that weaker price regulation should prevail when competition is
incipient but be withdrawn altogether when competition is stronger or effective.
In the telecom sector, one of the major barriers to entry is the capital needs of
the entrant. If unbundling of the incumbent’s network enables the new entrants
to combine their own resources with those of the incumbent through fair inter-
connection terms, however, successful entry may occur. Thus market share indica-
tors must be treated with caution. The industry’s structural conditions, such as
unbundling, must be factored in when one determines whether competition is
effective. The goals of reforms are to open the sector to competition and to dereg-
ulate prices when competition is effective.
With the emergence of competition for the provision of basic services in cer-
tain circles and the continued increase in numbers of cellular services subscribers,
signs of competition are emerging in the provision of local services. Although the
circles where private basic services have been launched (Andhra Pradesh, Gujarat,
Madhya Pradesh, Maharashtra including Mumbai, Punjab, and Rajasthan)
account for a very small share of the total direct exchange lines (DELs) provided
by BSNL, cellular services have shown considerable growth in the last year. As
stated elsewhere in this chapter, the market for basic and cellular services has been
opened to more players. More competition, therefore, will exist in the future, and
developments in the cellular market will affect basic sources, and vice versa.
The market for domestic long-distance services also has been opened to new
competition, and there has been a substantial decline in domestic long-distance
tariffs. Where domestic long-distance tariffs have provided a cushion for the
service providers, the decline in long-distance tariffs must be addressed in a way
that ensures investment opportunities in basic services. The recent notification
Telecommunications Policy Reform in India 101

in the official gazette of the reference interconnection offer and the interconnec-
tion usage charge (IUC) regime are the relevant policy initiatives to address this
situation.
Furthermore, international long distance was opened to competition in April
2002, and international tariffs have been reduced substantially as a result of com-
petition. A decline in international tariffs will imply a decline in revenues, miti-
gated to some extent by the volume response. Making up for the revenue loss
requires an increase in certain other tariffs (that is, those tariffs that are either
below costs or not high enough to attract competition) or development of addi-
tional supplementary services. The problem is mitigated to some extent by the fact
that costs in the telecom sector are consistently decreasing. The regulatory
response to this is the specification of the IUC regime.
Regulatory Issues
One characteristic of India’s telecom reforms—and the cause of many of the
problems involved—is that major reform measures like private entry into services
were attempted without the establishment of a regulatory body. The Telecom Reg-
ulatory Authority of India was constituted in March 1997. To achieve the objec-
tives of the TRAI Act, TRAI was given power to issue directions to service
providers, make regulations, notify tariffs by order in the official gazette, and
adjudicate disputes between service providers. Among all its powers and duties,
TRAI’s authority and jurisdiction to settle disputes among the service providers
have been important. Overall, TRAI was designed to provide an effective regula-
tory framework and adequate safeguards to ensure fair competition and con-
sumer protection. There was a ruling, however, by the Delhi High Court against
the TRAI in July 1998. The High Court ruled that it was not mandatory for the
Indian government to seek the TRAI’s recommendations before issuing licenses
for telecommunications services in the country. The judgment affirmed the pow-
ers of the DoT—that is, the government—to issue licenses without recommenda-
tions from TRAI. It also clarified that TRAI did not have the power to over-ride
the license conditions. This was reiterated by another High Court judgment in
January 2000 which found that the calling-party-pays regime for cellular mobile
as specified by TRAI could not be implemented. In January 2000 the TRAI Act
was amended. More details are provided below.
World Trade Organization Issues
The World Trade Organization (WTO) rules and disciplines for telecoms com-
prise the General Agreement on Trade in Services (GATS), the schedules of
102 India and the WTO
commitments made under the GATS, and the Annex on Telecommunications.
To get an indication of the basic thrust of major regulatory disciplines that are
emphasized in the context of telecommunications, it is necessary to consider
the Telecommunications Reference Paper. In the WTO India has made certain
commitments for liberalizing the telecom sector. Comparing those commit-
ments with the actual policy steps that India has taken shows that the extent of
telecom liberalization there is significantly more than the commitments made.
Moreover, the process of telecom liberalization is continuing, and this will fur-
ther augment the telecom market that is available to investors in India and
abroad, as can be seen in table 5.5 and appendixes 5.2 and 5.3. Likewise, the
extent of foreign investment in Indian companies that provide telecom services
is much more than the maximum of 25 percent that has been committed in the
WTO. For instance, with the approval of the Foreign Investment Promotion
Board, the maximum foreign equity permitted in the telecom services sector is
as follows:
49 percent Basic, cellular mobile, paging, V-SAT, mobile radio trunking, Inter-
net; investment companies set up for investments in telecom services
companies (investment by these companies in a telecom services
company is treated as part of domestic equity and is not set off against
the foreign equity cap)
51 percent Email, voice mail, online information and data retrieval, online infor-
mation and/or data processing; enhanced/value-added facsimile ser-
vice, including store and forward, store and retrieve
Also, dividend income and capital invested are fully repatriable although tele-
com services companies are not permitted to make royalty payments.
Other incentives for the telecom sector include the following:
• License fee paid by telecom service providers is eligible for amortization for tax
purposes.
• Licenses to provide telecom services can be assigned.
• Limit of external commercial borrowings (foreign currency debt) by telecom
services companies has been raised to 50 percent of the project cost (including
license fee).
• Investments in equity shares and debentures of telecom services companies
qualify for tax rebate.
• Telecom services companies enjoy a 100 percent tax holiday for a period of 5
years and a 30 percent tax holiday for an additional 5 years during their first 15
years in business.
Telecommunications Policy Reform in India 103

• Import of specified telecom equipment is permitted at concessional customs
duty rates.
• Import of all capital goods for manufacturing telecom equipment does not
require any license.
For the Internet sector, which is likely to provide a basis for much of the
dynamic telecom-based activity in the future, India has a very permissive
regime. The main features of the policy, announced in 1998, are provided in
appendix 5.1.
Similarly, certain regulatory disciplines committed to by India (in terms of the
Telecommunications Reference Paper) are less onerous than the disciplines actu-
ally applied in practice. For example, under the WTO India has not agreed to
apply a nondiscriminatory interconnection regime, but nondiscrimination is one
of the principles of the interconnection regime that has been specified by TRAI.
Likewise, TRAI has specified that interconnection should be provided at any tech-
nically feasible point in the network. Furthermore, India is embarking on liberal-
ization in a number of telecom sectors, and the actual extent of liberalization is
likely to increase in the future. Such changes have already occurred with respect to
Internet telephony and the long-distance call market.
Regulatory Overview
The policymaker for India’s telecommunications sector is the Ministry of Com-
munications and Information Technology, which operates through two govern-
ment bodies—the Telecom Commission and the Department of Telecommunica-
tions. The Telecom Regulatory Authority of India is an independent regulator that
reports to parliament through the minister of communications and IT. The Tele-
com Commission performs the executive and policymaking function. The DoT is
the executive and policy-implementing body and the TRAI performs the function
of an independent regulator. The secretary of the DoT is the ex-officio chair of the
Telecom Commission.
Department of Telecommunications, Ministry of Communications andInformation Technology The DoT, Ministry of Communications, is the
authority that looks after the licensing and overall policymaking in India. Until
recently the DoT combined the roles of policymaker and main service provider.
The service provider section has been separated from DoT and is now functioning
as a corporate body, BSNL. One other government corporation is an important
service provider—MTNL—which operates in Mumbai and Delhi as a service
104 India and the WTO

provider with license to provide basic, cellular-mobile, and Internet service,
among other things. At an earlier point VSNL, which had a monopoly in the
international call segment, was also a public sector enterprise. The government is
a major shareholder in MTNL and is now a less-than-majority shareholder in
VSNL. These firms now compete with each other for the same market—a situa-
tion that began happening earlier in such cases as MTNL and VSNL vying for the
Internet market. The competitive situation would require greater autonomy for
MTNL and VSNL.
Telecom Regulatory Authority of India On January 24, 2000, an ordinance
amended the 1997 TRAI Act and altered a number of its aspects. For example, the
adjudicatory role of the TRAI was separated and assigned to a Telecom Dispute
Settlement and Appellate Tribunal (TDSAT).4 That tribunal has been given the
powers to adjudicate any dispute, such as:
a. That between a licensor and a licensee
b. That between two or more service providers
c. That between a service provider and a group of consumers.
TDSAT has been granted additional powers compared with those previously
exercised by TRAI. For example, it can settle disputes between licensor and
licensee, and its decisions may be challenged only in the Supreme Court of
India.
TRAI’s remaining functions have been better defined and have increased, for
instance, with respect to powers relating specifically to interconnection conditions.
TRAI now has the power to “fix the terms and conditions of inter-connectivity
between the service providers” (TRAI [Amendment] Act 2000, p. 5), instead of
“regulating arrangements between service providers of sharing revenue from
interconnection” (TRAI Act 1997). The new legalization signaled an attempt to
reestablish a credible regulator. The government would be required to seek a
recommendation from TRAI when issuing new licenses. The adjudication of
licensor–licensee disputes would be undertaken by an independent tribunal spe-
cializing in telecommunications. In terms of interconnection arrangements, TRAI
was given the powers to override the provisions of license agreements signed with
the DoT. However, although there has been an increase in TRAI’s powers (other
than in the area of dispute settlement), the act has led to a weakening of the guar-
antee that was provided in the previous act with respect to the five-year working
period for the TRAI chair and members. This statutory guarantee was done away
with, and the revised act provides for less stringent conditions for removal of any
authority member or chair.
Telecommunications Policy Reform in India 105
Assessment of Regulatory Reform
Regulatory reform in the Indian telecommunications sector can be seen as a
two-step process: (1) establishment of an independent regulator, and (2) the
regulatory authority implementing reform on the basis of its policy initiatives.
A crucial concomitant element of this process is the separation of the incum-
bent service provider from the policymaker. Since its establishment, the tele-
com regulator in India has taken a number of initiatives pertaining to tariffs,
interconnection charges, and revenue sharing, and has provided its recom-
mendations on license conditions/license fees for certain service segments.
The regulator also has addressed a number of disputes under Section 14 of
the act.
An important feature of the 1997 TRAI Act 1997 (amended in 2000) is that
the authority has to ensure transparency while exercising its powers and dis-
charging its functions. Hence, TRAI has adopted a procedure of consultations
under which it prepares consultation papers on the issues under consideration;
seeks comments from the general public and experts in the area; and provides an
explanatory memorandum with its tariff orders, interconnection charges, or rev-
enue-sharing regulation and its recommendations. TRAI was a pioneer in adopt-
ing such a process, which is being performed for the first time by policymakers in
India.
TRAI has also been vested with powers to frame regulations necessary for its
functioning, including the levy of fees and charges for services. The TRAI Act pro-
vides for a separate TRAI General Fund, which will be credited with all grants,
fees, and charges received by TRAI and with funds from other approved sources.
Provision has also been made for central government grants to help meet the
expenses of the regulatory authority.
In several countries that have significantly liberalized the telecommunications
sector, the focus now is on convergence of policies as well as on regulation that
addresses “unfair competition.” Furthermore, rapid developments in the area of
the Internet are posing particular problems for the regulator. It is now evident
that ISPs will be increasingly able to use their technologies to provide services
that are competitive with those provided by the main telecom service providers.
The changes are also raising new regulatory issues, which may even lead to a
recasting of the established principles in certain cases. There is now a tendency
for service providers to bundle different services, thus creating difficulties in reg-
ulating them as separate entities. In a number of instances, convergence of ser-
vices and technologies is prompting a convergence of regulatory authorities or
greater cooperation among the separate regulatory authorities handling the pol-
icy issues.
106 India and the WTO

In this regard it is useful to consider the view expressed by the International
Telecommunication Union:
Licensing frameworks around the world are facing pressures for dramatic change,
however. The future is uncertain by the voice-telephony paradigm that defines
the telecommunication industry being overtaken and will inevitably disappear. It
will be replaced with an IT paradigm that accommodates the multimedia charac-
teristics, global seamlessness and virtuality that will characterize a pervasively IT-
based global economy operating over converged technologies and services in
cyberspace.
Regulatory regimes of the future will have to reflect different public-interest con-
cerns. Countries that embrace rather than resist the IT paradigm will shift their
focus away from a concern for the assured availability of reasonably priced, basic
voice services provided over traditional public networks. Instead, they will focus
more on promoting multiple outlets for voice telephony and ensuring that a reliable
and universal virtual-public network is maintained across a crazy quilt of intercon-
nected technologies and applications.
Overall, this will likely mean decreased reliance on individual licensing of particular
services and facilities and increased reliance on general rules. It will also involve
greater coordination among authorities in different industry sectors. Telecommuni-
cations regulation will be less concerned with licensing and pricing and more con-
cerned with continuous efforts to adapt standards of reliability and interoperability
to unrelenting technology changes, as well as with frequency allocation and assign-
ment, dispute resolution and consumer protection. Much more of the telecommu-
nication industry will probably end up being regulated by the market. (ITU 1999a,
p. 129)
Recommendatory Role In line with standard practice with regard to such legis-
lation, the Government of India has reserved the right to give policy directions to
TRAI and to seek its recommendations on matters connected with technology,
service provision, and so forth. Both of these provisions have figured in the recent
past in reported disagreements between TRAI and the government. NTP 99 has
recognized the role of TRAI recommendations in a number of areas. To help
implement NTP 99, the government has sought TRAI’s recommendations on sev-
eral important issues (mentioned in appendix 5.3).
Government Retention of Licensing Powers Apart from the policymaking
function, the government has retained the licensing function. Among countries of
the world there is no common pattern for whether licensing powers reside with
the regulator or with the government. According to ITU sources, countries in
which the regulator has the licensing power include the following:
Telecommunications Policy Reform in India 107

• In Africa: Botswana, Ghana, Mauritius, Namibia, Nigeria, South Africa, Tanzania,
and Zambia.
• In the Americas: Paraguay, the United States, and República Bolivariana de
Venezuela.
• In the Asia Pacific region: Australia, Hong Kong (China), Pakistan, the Philippines,
and Sri Lanka (licensing spectrum).
In India the main issue with respect to licensing has not been whether the
power should be with the regulator but that, under the 1997 TRAI Act, the terms
and conditions of the license should involve a consideration of recommendations
from TRAI. In the Communications Commission of India proposed under the
Communications Convergence Bill it is expected that licensing powers will be
transferred to the regulator.
Some Concluding Observations
Telecommunications reform policies everywhere have recognized the need to have
many more participants than the incumbent operator in the process of telecom-
munications network expansion and service development. It is generally accepted
that these new participants will stimulate sector development and provide a
degree of competition to the incumbent public telephone operator, thus positively
influencing the efficiency of service provision. The question is no longer whether
to have competition—the traditional arguments for exclusivity no longer hold.
Instead, the question is how fast competition should be ushered in and under
what conditions.
Nine years since the announcement of NTP 94, which sought private sector
participation in the Indian telecommunications market, there is much to show by
way of competition in the sector. The liberalization of the Indian telecom sector
initially was riddled with uncertainty. The first bidding process for basic services
resulted in only 6 out of 22 licenses being awarded, of which only 3 licensees com-
menced operations in 2000. In the early phase of regulation by an independent
regulator, there were numerous disputes between the incumbent DoT and TRAI
over the jurisdiction of the latter. This was one of the troubling issues. In recent
years, this situation has changed, and the policy has allowed open competition in
basic services, national long distance, and international long distance sectors. For
cellular-mobile, only four service providers are allowed because of the limited
availability of frequency spectrum. Nonetheless, this number is significant enough
to generate effective competition. One indicator of competition is the sharp
reduction in prices that has occurred in recent years. There were quite a few circles
for basic services that private-service providers did not find attractive enough to
108 India and the WTO
enter. This situation has now changed, however, so that an effective communica-
tion infrastructure could contribute to the economic growth of these areas. There
are still some 275,000 villages that remain to be connected by phone. Setting up a
funding mechanism through the proposed universal service access levy has now
been done.
In addition, clearer policy enunciation by the TRAI through its reference inter-
connect offer and interconnect usage charge regimes to establish open access and
interconnection guidelines among operators will also create an environment in
which teledensity can increase. The presence of many operators and a technologi-
cal and regulatory environment that permits the interconnection of one network
with another also would lead to a quantum expansion of reach.
In India’s case, license fees were earlier identified as a source for government
revenue. Given India’s fiscal situation and the revenue-raising possibilities of tele-
com licenses, it is difficult to abjure the revenue-maximizing option. Focusing
only on revenue maximization, however, does not lead to satisfactory results even
from the viewpoint of this limited objective. Furthermore, if revenue has to be
earned from any sector, it is more efficient to glean it from the actual earnings
rather than to seek it from projected earnings in an uncertain environment. There
is considerable evidence to suggest that the initial bids for high license fees were
largely responsible for rendering telecom projects nonbankable and for the slow
takeoff of sector liberalization. This situation has been addressed by moving to a
regime of revenue-share-license fees, part of which would contribute to funding
the universal service obligation.
In India there is a major emphasis on expanding teledensity in the next
seven years, and the government has explicitly recognized the role of the pri-
vate sector in meeting such targets. Delay in implementing the operations will
create problems in meeting the stated objectives. The needs of the hour are to
begin operations in as many places as possible, and to infuse competition so
that another objective of the government policy can be met with success
through the market itself—namely, to provide the services at affordable prices.
To that extent, any license fees charged should be low, covering, for example,
contributions to the proposed universal service access levy, the cost of regula-
tion, and some additional amount to meet such other objectives as the creation
of a telecom fund.
Telecommunications technologies and services and the market structure for
India’s telecom sector are changing rapidly. New converged services are emerging
and the policymaker has allowed open entry in several segments of the market.
Basic telecom is facing competition not only from new entrants but also from
cellular-mobile service, which is growing rapidly. The consistent decline in costs
will also put further downward pressure on prices and provide a basis for achieving
Telecommunications Policy Reform in India 109
the teledensity targets with lower investment levels than those indicated by pres-
ent cost estimates.
With this background, the policymaker has to ensure that the telecom ser-
vices provided in India are affordable and efficient, and cater both to the
demand for telephony by the general public and to the demand for value-
added and high bandwidth services provided by modern technologies
(including the provision of adequate frequency spectrum). In time, with an
increase of teledensity to more than 20 to 30 percent for the urban areas, the
growth of telecom there will become self-sustaining. This demand base will be
enhanced also with the growth of IT services, as well as the specific efforts by
the Government to spread the use of data services through teleservices and e-
governance. The market will then provide a minimum critical mass required
for sustaining broadband and value-added services on a general scale. This
would require a stable and consistent regulatory regime that encourages com-
petition through a level playing field, the government’s easing financial con-
straints on provision of interconnection, and through the achievement of
social objectives. This would prepare the ground for the likely rapid growth of
cellular-mobile, which may become the preferred technology for rural
telecommunications. It would facilitate investment by creating time-bound,
single-window procedures, promoting specific efforts to develop content for
teleservices that will meet social objectives, and developing the software com-
ponent of the telecom equipment sector. Frameworks should be developed for
industry self-regulation and for interaction of the regulator with the con-
sumer bodies. Furthermore, the policymaker will have to ensure that the tran-
sition from the present regulatory regime to a new one is managed smoothly,
and that there is no conflict between the mandates of different regulatory
bodies, such as those for telecommunications and for competition policy. And
all this has to be managed in an environment in which the nature of policy
planning has been changed by the introduction of competition in the market.
The policy initiatives mentioned in this chapter are aimed at managing
affordable, large-scale provision of telecom services and providing adequate
opportunities for developing the market for modern services so that India is
in a good position to provide its citizens telecom opportunities similar to
those in the industrial world.
One final comment: it is in the fitness of things that policy statements for
the telecom sector have been periodically reviewed with the changing telecom
scenario. The reform process under way for more than eight years has intro-
duced major competition in the sector, and there is awareness of the additional
crucial issues that need to be addressed. Given the acknowledged importance
of telecommunications to overall national interests, governments tend to get
110 India and the WTO
Telecommunications Policy Reform in India 111
involved in the management of the sector’s progress. It is unfortunate in terms
of development that the interests of the government and the private sector are
not always easily reconciled. This fact has resulted in telecom stagnation in
many countries, including India. Evidence shows that governments that most
“competently” foster private sector advancement of their telecommunications
industries are best placed to gain world-class telecommunications services and
the attendant benefits. Arguably, early liberalization could give any country a
first-mover advantage in attaining high telecommunications performance, but
hasty adoption by developing economies of liberal frameworks adopted by
industrial economies could easily fail and in the process discredit the idea of
liberalization.
Enthusiasm for liberalization and its possibilities must be juxtaposed with a
realistic transformation program that takes into account the country’s economic
and political dynamics. The efforts of the regulator to build an appropriate frame-
work for fostering fair competition are crucial in this regard. The steps being
taken in India indicate that such an effort is under way, and the frameworks to
address issues relating to interconnection, tariffs, and quality of service are either
already established or will be established soon. Combined with open competition
in general, this suggests low prices and dynamic evolution of the telecom sector in
India.
Appendix 5.1: Salient Features of ISP Policy, 1999
Following are the main features of the policy for Internet service providers:
• There is no restriction on the number of service providers.
• Operation can be on a national, regional, or district basis.
• Service provider has the option of building or leasing capacity from infrastruc-
ture owners (railways, energy utilities).
• Foreign equity participation is capped at 49 percent.
• No prior experience in IT and telecommunications is required.
• Licenses will be issued for a period of 15 years, extendable by 5 years.
• There is no license fee for the first 5 years; token fee of Re 1 per annum
thereafter.
• Service providers are allowed to set up international gateways after obtaining
security clearance.
• Telephony on the Internet is not permitted.
• TRAI has the freedom to fix tariffs; that is, tariffs for Internet services have
been forborne by TRAI, but TRAI may review and fix tariff at any time during
the validity of the license.

112 India and the WTO
Year Event
1992 Bids are invited for radio-paging services in 27 cities.Bids are invited for cellular-mobile services in 4 metro cities.
1994 National Telecom Policy is announced.Radio paging, V-SAT data services, email services, voicemail, and video-text services are opened to private providers.DoT issues guidelines for private sector entry into basic telecom ser-vices in the country.Eight cellular licensees for four metros are finalized after more than twoyears of litigation.
1995 DoT calls for proposal to operate basic services, cellular telecom services,and public mobile radio trunked (PMRT) services.DoT receives bids for basic, cellular, and PMRT services.Most cellular operators in the circles sign license agreements.DoT announces a cap on the number of circles in which basic opera-tors can roll out services. Licensees are selected for 5 circles.
1996 After setting reserve prices for circles, DoT invites fresh bids for basicservices in 13 circles.Five successful bidders are short-listed as providers of basic services.There is poor response to the third round of basic telecom bidding.Only one company bids (for Madhya Pradesh).The selected bidder from the first round refuses to extend bank guar-antees for its 4 circles. In court the bidder challenges DoT’s move toencash guarantees.Three more companies challenge DoT’s move to encash guarantees incourt.
1997 The Telecom Regulatory Authority of India is formed.The first basic telecom service company signs its license and intercon-nect agreements with DoT (for Madhya Pradesh).The second basic service provider signs its basic telecom license pact(for Gujarat).TRAI quashes DoT’s move to increase tariffs for calls from fixed-linetelephones to cellular phones.VSNL calls for global tenders to find a partner for its South Asianregional hub project.The Internet policy is cleared; license agreement for basic services inMaharashtra becomes operational.Basic service licensees for Andhra Pradesh and Punjab sign basic tele-com agreements with DoT.
1999 TRAI issues its first tariff order.New Telecom Policy is announced.
Appendix 5.2: Chronology of Indian TelecommunicationsDeregulation
AU: what
does that
mean here?
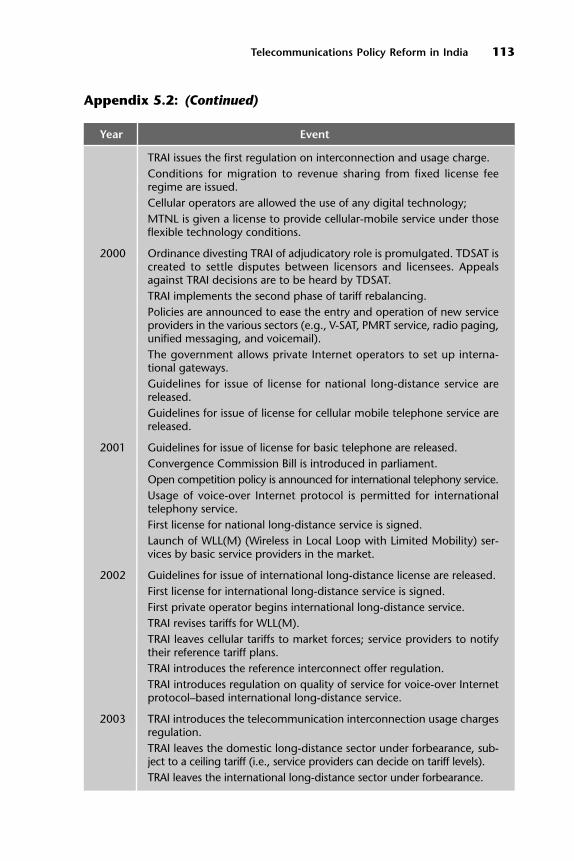
Telecommunications Policy Reform in India 113
Year Event
TRAI issues the first regulation on interconnection and usage charge.Conditions for migration to revenue sharing from fixed license feeregime are issued.Cellular operators are allowed the use of any digital technology;MTNL is given a license to provide cellular-mobile service under thoseflexible technology conditions.
2000 Ordinance divesting TRAI of adjudicatory role is promulgated. TDSAT iscreated to settle disputes between licensors and licensees. Appealsagainst TRAI decisions are to be heard by TDSAT. TRAI implements the second phase of tariff rebalancing.Policies are announced to ease the entry and operation of new serviceproviders in the various sectors (e.g., V-SAT, PMRT service, radio paging,unified messaging, and voicemail).The government allows private Internet operators to set up interna-tional gateways. Guidelines for issue of license for national long-distance service arereleased.Guidelines for issue of license for cellular mobile telephone service arereleased.
2001 Guidelines for issue of license for basic telephone are released.Convergence Commission Bill is introduced in parliament.Open competition policy is announced for international telephony service.Usage of voice-over Internet protocol is permitted for internationaltelephony service.First license for national long-distance service is signed.Launch of WLL(M) (Wireless in Local Loop with Limited Mobility) ser-vices by basic service providers in the market.
2002 Guidelines for issue of international long-distance license are released.First license for international long-distance service is signed.First private operator begins international long-distance service.TRAI revises tariffs for WLL(M).TRAI leaves cellular tariffs to market forces; service providers to notifytheir reference tariff plans.TRAI introduces the reference interconnect offer regulation.TRAI introduces regulation on quality of service for voice-over Internetprotocol–based international long-distance service.
2003 TRAI introduces the telecommunication interconnection usage chargesregulation.TRAI leaves the domestic long-distance sector under forbearance, sub-ject to a ceiling tariff (i.e., service providers can decide on tariff levels).TRAI leaves the international long-distance sector under forbearance.
Appendix 5.2: (Continued)
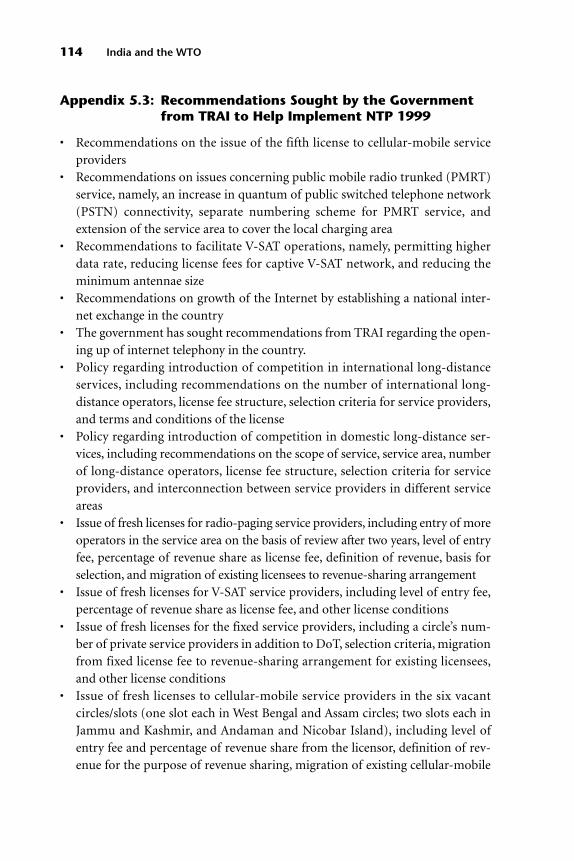
Appendix 5.3: Recommendations Sought by the Governmentfrom TRAI to Help Implement NTP 1999
• Recommendations on the issue of the fifth license to cellular-mobile service
providers
• Recommendations on issues concerning public mobile radio trunked (PMRT)
service, namely, an increase in quantum of public switched telephone network
(PSTN) connectivity, separate numbering scheme for PMRT service, and
extension of the service area to cover the local charging area
• Recommendations to facilitate V-SAT operations, namely, permitting higher
data rate, reducing license fees for captive V-SAT network, and reducing the
minimum antennae size
• Recommendations on growth of the Internet by establishing a national inter-
net exchange in the country
• The government has sought recommendations from TRAI regarding the open-
ing up of internet telephony in the country.
• Policy regarding introduction of competition in international long-distance
services, including recommendations on the number of international long-
distance operators, license fee structure, selection criteria for service providers,
and terms and conditions of the license
• Policy regarding introduction of competition in domestic long-distance ser-
vices, including recommendations on the scope of service, service area, number
of long-distance operators, license fee structure, selection criteria for service
providers, and interconnection between service providers in different service
areas
• Issue of fresh licenses for radio-paging service providers, including entry of more
operators in the service area on the basis of review after two years, level of entry
fee, percentage of revenue share as license fee, definition of revenue, basis for
selection, and migration of existing licensees to revenue-sharing arrangement
• Issue of fresh licenses for V-SAT service providers, including level of entry fee,
percentage of revenue share as license fee, and other license conditions
• Issue of fresh licenses for the fixed service providers, including a circle’s num-
ber of private service providers in addition to DoT, selection criteria, migration
from fixed license fee to revenue-sharing arrangement for existing licensees,
and other license conditions
• Issue of fresh licenses to cellular-mobile service providers in the six vacant
circles/slots (one slot each in West Bengal and Assam circles; two slots each in
Jammu and Kashmir, and Andaman and Nicobar Island), including level of
entry fee and percentage of revenue share from the licensor, definition of rev-
enue for the purpose of revenue sharing, migration of existing cellular-mobile
114 India and the WTO

Telecommunications Policy Reform in India 115
service providers to revenue-sharing arrangement, and any other issue consid-
ered relevant
• Issue of fresh license for PMRT services, including issue of fresh licenses
throughout the country, level of entry fee, percentage of revenue share as
license fee, and definition of revenue for the purpose of revenue sharing
• Recommendations on terms and conditions of license agreement for global
mobile personal communications by satellite, including an examination of the
provisional license, terms and conditions of the license, and quantum and
structure of the license fee
• Terms and conditions of usage of backbone network of utility service
providers, including the class of operators to fund universal access levy, various
cost models or approaches to determine the percentage contribution from the
revenue for the operators, and the mechanisms for computing it; per-unit sub-
sidy for village public telephones (VPTs) and rural DELs separately to cover
capital and recurring expenditure, and whether per-unit subsidy will be the
same or different in different geographical area/tribal and nontribal areas of
the country.
Endnotes
1. License fees are fixed at 12, 10, and 8 percent of adjusted gross revenues for circles A, B, and C,
respectively. Metros have a license fee equal to that of circle A.
2. Circles have been classified as category A, B, and C based on market characteristics and teleph-
ony potential in diminishing order of attractiveness.
3. At the end of February 2003, the cellular subscriber base stood at 11.7 million connections.
4. In its present form the CCI Bill also envisages the dispute-settlement function to be performed
by the Communications Dispute Settlement Appellate Tribunal (CAT).
Bibliography
Athreya, M. B. 1991. Report of the High Level Committee on Reorganisation of Telecom Department
(Athreya Committee). March. New Delhi.
DoT (Department of Telecommunications). 1994. National Telecom Policy. New Delhi: Government
of India.
———. 1999. New Telecom Policy. New Delhi: Government of India.
———. 2000a. Guidelines for Issue of Licence for Cellular Mobile Telephone Service. New Delhi:
Government of India.
———. 2000b. Guidelines for Issue of Licence for National Long Distance Service. New Delhi:
Government of India.
———. 2001a. Annual Report 2000-01. New Delhi: Government of India.
———. 2001b. Guidelines for Issue of Licence for Basic Telephone Service. January. New Delhi:
Government of India.
———. Various years. Annual Telecom Statistics. New Delhi: Government of India.
ICICI. 1992. International Experiences in Telecommunications Reforms and Its Relevance to India.
Background Papers to Seminar, November.

India Infrastructure Report Expert Group. 1996. Policy Imperatives for Growth and Welfare. New Delhi:
National Council of Applied Economic Research.
ITU (International Telecommunication Union). 1999a, “Trends in Telecommunication Reform
1999.” Geneva.
———. 1999b. World Telecommunication Development Report. Geneva.
Melody, William H., ed. 2001. Telecom Reform—Principles, Policies and Regulatory Practices.
Lyngby: Technical University of Denmark.
Planning Commission, India. 1999. Ninth Five-Year Plan. New Delhi: Government of India.
Reserve Bank of India. 1998. Handbook of Statistics on the Indian Economy. Mumbai, India.
TRAI (Telecom Regulatory Authority of India). 1998.“Consultation Paper on Framework and Pro-
posals for Telecom Pricing.” New Delhi.
———. 1999a. “Consultation Paper on Introduction of Competition in Domestic Long Distance
Communications.” New Delhi.
———. 1999b. “Telecommunication Tariff Order.” New Delhi.
———. 2001. “Issues Relating to Interconnection between Access Providers and National Long
Distance Operators.” New Delhi.
Utton, M. A. 1986. The Economics of Regulating Industry. Oxford, U.K.: Basil Blackwell.
World Bank. 1997. Telecommunications and Economic Development. Baltimore: Johns Hopkins
University Press.
116 India and the WTO

One of the important and contentious issues in the forthcoming World
Trade Organization (WTO) multilateral trade negotiations is whether to
establish a multilateral framework for investment. The industrial coun-
tries are seeking an agreement that would grant foreign investors virtually unfet-
tered rights to invest in all sectors of the host country’s economy and to obtain for
those investors the same treatment as is received by investors from the host
nation. Many developing countries, including India, however, are wary of such
demands. They are concerned that the multinational firms might adversely affect
the development of domestic firms and otherwise exploit them economically.
To negotiate effectively, it is important to understand the economic role of for-
eign direct investment (FDI) in developing countries in general, and particularly
in India. Two of the important issues of contention are the following:
• Does FDI crowd out domestic private investment or does it increase it by fos-
tering various backward and forward linkages with domestic firms?
• Does FDI increase the growth of gross domestic product (GDP) by creating
jobs, increasing exports, and bringing new management and production tech-
niques, or does it lower GDP growth in the long run by taking excessive profits
out of the developing country?
These issues can be analyzed econometrically. A few earlier cross-country studies
have suggested that, generally, FDI is economically beneficial to developing coun-
tries (see, for example, Balasubramanyam, Salisu, and Sapsford 1996; and Fry 1993).
117
6
Economic Impact of Foreign Direct
Investment in South Asia
Pradeep Agrawal

Additional work is needed, however, to carry out more careful and country/
region-specific studies to eliminate doubts that the cross-country results may be
driven by a few extreme cases and may not apply to the specific country or region
in question.
In this chapter, I analyze the above-mentioned issues econometrically. Because
FDI inflows to India have been very small, averaging less than 0.1 percent of the
GDP until 1991 and about 0.5 percent of GDP over the period 1992–96, for
enhanced reliability I undertake time-series/cross-section (panel) analysis of data
for five South Asian countries: Bangladesh, India, Pakistan, Nepal, and Sri Lanka.
This is reasonable because the South Asian countries generally have similar eco-
nomic structures and have followed similar policies toward FDI. The analysis here
uses 25–32 years of data over the period 1965–96 from each of the five countries.
My hope is to provide a better understanding of the economic impact of FDI in
South Asia.
The chapter proceeds as follows. The first section provides a brief overview of
India’s policies toward foreign direct investment and presents data on FDI inflows
to India. The second section analyzes the effect of FDI on investment by the citi-
zens of the country. The third section analyzes the effect of FDI on GDP growth in
South Asia. Some concluding remarks are provided in the final section.
Foreign Direct Investment in India: Policiesand Inflows
This brief overview of India’s policies toward FDI covers the period since inde-
pendence and presents data on the amount of foreign direct investment flowing
into India and other selected countries. It also provides a breakdown of the FDI
into India by country of origin and by industry.
A Brief History of India’s Policies Regarding FDI
India’s policy regarding FDI can be classified into four phases: phase I (1957–67)
was a cautiously welcoming approach; phase II (1967–79) can be characterized as
a restrictive regime; phase III (1980–90) was marked by the progressive attenua-
tion of regulations brought about in the 1970s; and phase IV (1991–2001) was a
liberal and welcoming approach to FDI (Gopinath 1997). These phases are briefly
discussed below.
Following independence in 1947, India initially had an ambivalent attitude
toward FDI, alternating between the nationalist distrust of colonial firms and the
hope that new foreign investment could provide the technology and capital essen-
tial for rapid industrialization. The positive view had the upper hand during the
118 India and the WTO

Economic Impact of Foreign Direct Investment in South Asia 119
second and the third five-year plans, spanning the period 1957–67. Thus, the cau-
tiously welcoming approach adopted during this period included features such as
nondiscriminatory treatment of foreign investment, easy repatriability of profits
by foreign firms, and emphasis on exports by foreign-controlled firms.
When an acute foreign exchange crisis began to develop in the late 1960s, it was
felt that foreign firms were contributing to the problem through the import of
inputs and repatriation of profits. The government nationalized some major oil-
producing and retailing multinational companies in the early 1970s. The Foreign
Exchange Regulation Act (FERA), passed in 1973, marked the tightening of the
regulatory regime regarding the management of foreign capital. A process of indi-
genization and dilution of foreign equity was carried out whereby foreign compa-
nies were required within two years to dilute nonresident shareholding to the level
prescribed by the Reserve Bank of India—generally to 40 percent. A restrictive
approach was adopted for noncash inflows and use of foreign brand names for
sales within India. Domestic firms requiring foreign technology were encouraged
to acquire it through licensing rather than through joint ventures. Companies in
high-technology and skills areas, however, were allowed foreign shareholdings up
to 74 percent (see Kumar 1994).
In the 1980s, growing concern about stagnation and technological obsoles-
cence in Indian industry drew attention to the restrictive licensing procedures.
Poor quality and the high cost of Indian manufactured products contributed to
the poor export performance, and created balance-of-payments problems in the
wake of the second oil shock. The need was felt for foreign collaborations to
increase exports and improve the quality of Indian manufacturing, so there was
an easing of restrictions on FDI that was further strengthened after Rajiv Gandhi
became prime minister in 1985. FERA restrictions were relaxed for FDI in areas of
high technology and for 100 percent export–oriented units. Foreign investment
equity up to 74 percent and 100 percent was allowed in the priority sectors and
export-oriented units, respectively, with full repatriation of profits. Four export-
processing zones were set up. During 1984 and 1985, many capital goods were
moved to the open general license list, thus making them easier to import. In 1986
the tax rate on royalty payments was brought down from 40 percent to 30 percent.
Bureaucratic bottlenecks remained, however, and foreign firms probably contin-
ued to distrust the Indian government. As a result, foreign equity inflows
remained meager, and Indian industry continued to rely largely on foreign debt
capital to meet its foreign exchange needs over this period.
A major change in regime came in 1991 when India introduced trade and
investment liberalization policies. Tariffs were sharply reduced on most products,
bringing down the average weighted tariff rate on imports from 87 percent in
1990/91 to 25 percent by 1994/95 and to 20 percent by 1997/98. The foreign

technology requirement for allowing inward FDI was discontinued, and a large
number of additional sectors, including many consumer goods sectors, were
opened to foreign investment. The repatriation of profits by foreign-controlled
firms was eased, and the earlier requirement that the export earnings balance the
dividend payment over the first seven years from the date of commercial produc-
tion by the foreign venture was dropped, except for 24 consumer goods industries.
In 1994 India became a member of the Multilateral Investment Guarantee Agency.
As a result all investments approved by the Government of India are now insured
against expropriation or nationalization. Up to 100 percent equity was allowed in a
number of industries (especially those in export-oriented and high-technology
industries). The Reserve Bank of India was authorized to give automatic approvals
(usually within two weeks) to proposals in the high-priority areas where foreign
equity did not exceed 51 percent and in the mining sector where the foreign equity
did not exceed 50 percent. A Foreign Investment Promotion Board (FIPB) was set
up to act as a single-window clearance entity. It deals with large investment propos-
als and such other proposals as those in which foreign equity exceeds 51 percent, or
the industry is not on the list of high-priority sectors, or foreign equity does not
cover the import of capital goods. Proposals are usually cleared in four to six weeks.
Unlike the Reserve Bank of India, the FIPB can initiate and carry on detailed nego-
tiations with foreign firms. Overall it appears that during the 1990s the government
adopted a much more welcoming attitude toward foreign investors—a stance exem-
plified by the common minimum program of the present government, which is
aimed at nearly tripling the FDI inflows to US$10 billion a year.
This brief overview of the history of India’s policies regarding FDI makes it
quite clear that there has existed considerable confusion about the true economic
impact of such investment on the national economy. My hope is that the analysis
to be undertaken here will help resolve some of that confusion.
FDI Flows into India
Figure 6.1 shows FDI inflows into India and other South Asian countries as a per-
cent of GDP over the period 1965–1996. Inflows in India have increased sharply
since 1992, following the policy changes. Figure 6.1 also presents a comparison of
the inflows into China and an average for the East Asian countries (simple average
of Indonesia, Malaysia, Singapore, South Korea, and Thailand) over the same
period. Evidently despite the sharp increase since 1992, India has had a much
lower level of FDI inflows than have China, the East Asian countries, and even
such South Asian countries as Sri Lanka and Pakistan.
Next let us consider the country and industry breakdown of FDI in India ap-
proved from 1991 to 2000, the period during which the bulk of FDI came into India.
120 India and the WTO
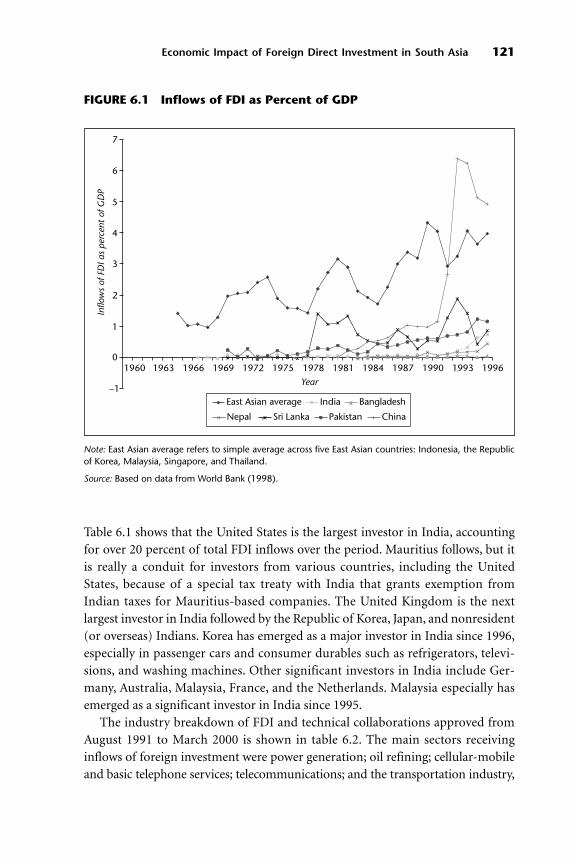
Table 6.1 shows that the United States is the largest investor in India, accounting
for over 20 percent of total FDI inflows over the period. Mauritius follows, but it
is really a conduit for investors from various countries, including the United
States, because of a special tax treaty with India that grants exemption from
Indian taxes for Mauritius-based companies. The United Kingdom is the next
largest investor in India followed by the Republic of Korea, Japan, and nonresident
(or overseas) Indians. Korea has emerged as a major investor in India since 1996,
especially in passenger cars and consumer durables such as refrigerators, televi-
sions, and washing machines. Other significant investors in India include Ger-
many, Australia, Malaysia, France, and the Netherlands. Malaysia especially has
emerged as a significant investor in India since 1995.
The industry breakdown of FDI and technical collaborations approved from
August 1991 to March 2000 is shown in table 6.2. The main sectors receiving
inflows of foreign investment were power generation; oil refining; cellular-mobile
and basic telephone services; telecommunications; and the transportation industry,
Economic Impact of Foreign Direct Investment in South Asia 121
−1
0
1
2
3
4
5
6
7
1960 1963 1966 1969 1972 1975 1978 1981 1984 1987 1990 1993 1996
Year
Inflo
ws
of F
DI a
s pe
rcen
t of
GD
P
East Asian average India Bangladesh
Nepal Sri Lanka Pakistan China
FIGURE 6.1 Inflows of FDI as Percent of GDP
Note: East Asian average refers to simple average across five East Asian countries: Indonesia, the Republicof Korea, Malaysia, Singapore, and Thailand.
Source: Based on data from World Bank (1998).

122 India and the WTO
Tota
l/A
vera
ge
Eco
no
mya
1991
1992
1993
1994
1995
1996
1997
1998
1999
2000
b(1
991–
2000
∗ )
Uni
ted
Stat
es34
.80
31.6
839
.08
24.5
922
.00
27.8
224
.72
11.5
612
.60
14.6
321
.26
Mau
ritiu
s0.
000.
001.
403.
775.
646.
4619
.00
10.2
713
.41
20.1
911
.57
Uni
ted
King
dom
6.01
3.03
7.03
9.16
5.38
4.22
8.18
10.3
910
.45
1.35
6.98
Kore
a, R
ep. o
f1.
151.
010.
330.
750.
988.
913.
561.
2012
.86
0.17
4.16
Jap
an9.
8715
.70
2.91
2.83
4.72
4.12
3.47
4.16
5.62
3.19
4.22
Non
resi
dent
In
dian
s3.
6911
.30
11.7
83.
462.
216.
063.
312.
441.
603.
033.
70G
erm
any
7.83
2.22
1.99
4.01
4.18
4.25
3.93
2.77
4.03
1.48
3.53
Aus
tral
ia0.
492.
000.
332.
744.
692.
310.
798.
562.
290.
182.
82M
alay
sia
0.03
1.91
0.10
0.18
4.32
0.12
3.83
5.85
0.41
0.03
2.38
Fran
ce3.
620.
761.
460.
631.
314.
621.
301.
675.
110.
312.
19N
ethe
rland
s10
.47
2.49
3.63
1.46
3.01
2.90
1.59
1.61
2.23
0.91
2.10
Isra
el0.
000.
030.
020.
0612
.90
0.04
0.09
0.04
0.03
0.00
1.81
Ital
y3.
332.
301.
322.
761.
440.
382.
180.
906.
200.
411.
95Si
ngap
ore
0.26
1.55
0.75
1.87
3.09
0.88
1.57
2.49
2.91
0.61
1.84
Belg
ium
0.30
0.61
0.07
0.05
0.52
0.54
0.39
10.6
70.
050.
101.
69C
aym
an Is
land
s0.
000.
000.
040.
020.
000.
026.
570.
000.
040.
341.
59Sw
itzer
land
6.65
17.7
44.
820.
340.
960.
440.
900.
931.
030.
271.
20Th
aila
nd0.
000.
064.
160.
076.
140.
210.
050.
000.
020.
001.
05C
anad
a0.
910.
020.
310.
304.
280.
540.
701.
020.
130.
371.
06H
ong
Kong
, C
hina
3.96
1.47
0.99
1.16
1.27
1.41
0.47
0.77
0.16
1.56
0.92
Swed
en1.
311.
250.
010.
081.
571.
470.
200.
700.
970.
400.
77So
uth
Afr
ica
0.00
0.00
0.00
0.00
0.05
0.16
0.17
5.54
0.09
0.02
0.81
Russ
ia1.
610.
300.
020.
740.
360.
000.
000.
050.
030.
000.
11
TAB
LE 6
.1Fo
reig
n D
irec
t In
vest
men
t A
pp
rova
ls, 1991–2
000: Sh
are
of
Maj
or
Inve
stin
g E
con
om
ies

Economic Impact of Foreign Direct Investment in South Asia 123
Tota
l/A
vera
ge
Eco
no
mya
1991
1992
1993
1994
1995
1996
1997
1998
1999
2000
b(1
991–
2000
∗ )
Taiw
an, C
hina
0.08
0.46
0.11
0.07
0.01
0.22
0.00
0.01
0.03
0.02
0.06
Tota
l of
all
coun
trie
s(i
n U
S$ m
illio
ns)
20
6.78
1,48
3.79
2,82
3.24
4,52
1.09
9,11
6.46
10,0
60.3
413
,974
.38
7,25
3.65
6,52
2.54
5,43
1.50
53,1
03.7
9G
DR/
FCC
Bc0.
000.
000.
0036
.87
3.71
14.5
68.
2010
.46
11.3
747
.96
14.5
9
TAB
LE 6
.1(C
onti
nued
)
GD
R =
glob
al d
epos
itory
rec
eip
t; F
CC
B =
fore
ign
curr
ency
con
vert
ible
bon
d.
a. R
anki
ng o
f all
coun
trie
s is
acc
ordi
ng t
o cu
mul
ativ
e to
tal o
f ap
pro
vals
for
the
per
iod
1991
to
2000
.b.
Rep
rese
nts
pro
ject
ed fi
gure
s fo
r 20
00 b
ased
on
data
up
to
Aug
ust
31, 2
000.
c. R
epre
sent
s p
rop
osal
s fo
r G
DRs
and
FC
CBs
.
Sour
ce:D
ata
from
Sec
reta
riat
for
Indu
stria
l Ass
ista
nce,
Min
istr
y of
Com
mer
ce a
nd In
dust
ry, G
over
nmen
t of
Indi
a, a
vaila
ble
atht
tp:/
/sia
dip
p.n
ic.in
/pub
licat
/new
sltt
r/se
p20
00/n
ews4
.htm
.

especially the production of passenger cars. There were also significant inflows in
financial services (e.g., banking and insurance), metallurgy, chemical production,
and food processing industries.
Impact of FDI on Investment by National Investors
To study the effect of FDI on domestic investment, we need to estimate an invest-
ment function and then analyze the impact of FDI. In this section I will briefly
124 India and the WTO
TABLE 6.2 Foreign Direct Investment Approvals, August 1991to March 2000: Share by Industry
Serial Number Name of Industry Share of Industry
1 Fuels 29.72Power generation 14.83Oil refinery 8.91
2 Telecommunications 17.32Cellular mobile and basic telephone
services 11.61Telecommunications 4.24
3 Transportation industry 8.27Passenger cars 3.36Automobile industry 1.88Air/sea transport 1.12
4 Service sector 6.91Financial 4.7Nonfinancial services 1.44Electronics 1.27
5 Metallurgical 5.87Ferrous 3.44Mining service 1.13
6 Chemicals 5.637 Food processing industry 4.04
Food products 3.998 Hotel and tourism 2.01
Hotel and restaurants 1.659 Textiles (including dyed, printed) 1.51
10 Paper and pulp (including paper products) 1.45
11 Industrial machinery 1.05
Total of all industries Rs. 2,142 billion(US$53.1 billion)
Source: Data from the Secretariat for Industrial Assistance, Ministry of Commerce and Industry, Governmentof India, available at http://siadipp.nic.in/publicat/newslttr/apr2000/news5.htm.

discuss the variables that affect investment and specify a functional form for its
determinants. Then we will consider the econometric procedures used and there-
after the results of the econometric estimations.
The Investment Function
Blejer and Khan (1984) described some of the difficulties of estimating neoclassical
investment functions for developing countries, such as the lack of readily available
measures of the capital stock or its rate of return. Thus the investment function
estimated here is based on the flexible accelerator model developed by Fry (1998).
The accelerator model has the desired real capital stock k∗ proportional to real
output, y:
k∗ = αy.
This can be expressed in terms of a desired investment rate (INV/Y)∗:
(INV/Y)∗ = αG
where INV denotes gross domestic fixed investment in current prices, Y denotes
GDP in current prices, and G is the rate of growth of real GDP, y. A partial adjust-
ment mechanism allows the actual investment rate to adjust to the difference
between the desired investment rate and the investment rate in the previous
period:
∆(INV/Y)t = λ [(INV/Y)∗ − (INV/Y)t−1]
or
(1) (INV/Y)t = λ(INV/Y)∗ + (1 − λ)(INV/Y)t−1
where λ is the coefficient of adjustment. The flexible accelerator model allows
economic conditions to influence the adjustment coefficient, λ. That is:
(2) λ = β0 + (β1X1 + β2X2 + β3X3 +…)/[(INV/Y)∗ − (INV/Y)t−1]
where Xi are the variables (including an intercept term for a constant depreciation
rate) that affect λ, and βi are their respective coefficients.
The explanatory variables used are GDP growth rate (G) over the previous year,
domestic credit availability as share of GDP (CRDT/Y), net FDI inflows as share of
GDP (FDI/Y), terms of trade (TOT)—an index with base-year (1990) value set to 100,
Economic Impact of Foreign Direct Investment in South Asia 125

real exchange rate (RER), net total foreign borrowing as share of GDP (∆TEDtot/Y),
and the real lending rate (RL). These variables are explained below.
FDI inflows constitute a source of investment funds. The use of this source of
funds depends on the various policies regarding FDI, such as the maximum share
of foreign equity allowed in joint ventures, regulations relating to repatriation of
profits, various other policies and regulations pertaining to industry and labor,
and the overall attractiveness of the country. FDI also can promote domestic
investment through backward and forward linkages with domestic industries.
Similarly, foreign borrowing can be used as a source of funds for investment,
although public foreign borrowing does have a tendency to go (partially) into
meeting urgent government budgetary requirements as well. Thus we also include
as an explanatory variable the net total foreign borrowings as a share of GDP. This
variable will enable us to compare the relative effectiveness of foreign borrowing
and FDI inflows in promoting investment.
An improvement in the terms of trade (the unit price of exports divided by the
unit price of imports) can increase investment by increasing real income, making
capital goods (mostly importables in developing countries) less expensive than
domestic goods. In some situations it could also decrease investment by decreas-
ing the demand for domestic goods compared with importables (see, for example,
Cardoso 1993).
Now consider the impact of an increase in the RER. It is defined as:
RER = E • P f/P
where E is the exchange rate (number of domestic currency units per U.S. dollar),
P is the domestic price level (the GDP deflator), and P f is the foreign price level
(proxied here by the U.S. GDP deflator, given that the United States is the most
important trading partner of the countries being studied). An increase in RER
would increase the price of imported capital and intermediate goods and would
result in a contraction of investment (Servén and Solimano 1992; Fry 1995). Van
Wijnbergen (1982) developed a two-sector model showing that the net effect of a
real depreciation is ambiguous: investment in tradable goods increases but invest-
ment in domestic goods declines.
True domestic costs of capital are very difficult to measure in the South Asian
developing countries examined here because of selective credit policies, disequi-
librium institutional interest rates, and the lack of data on tax rates. Therefore I
use the real lending rate of banks as a proxy for the cost of capital. The real lend-
ing rate is obtained by subtracting the average of the current and next year’s infla-
tion rates from the nominal prime lending rate of the banks.
The availability of institutional credit is one of the most important deter-
minants of the investment rate in developing countries (see Blinder and
126 India and the WTO

Stiglitz 1983; Fry 1995). The quantity of credit is likely to be significant in a
credit market where the interest rates are controlled at below market-clearing
levels and/or directed credit programs exist for selected industrial sectors. The
latter have continued in most of the countries under consideration even after
they liberalized their financial systems during the 1980s. Furthermore, banks
specialize in acquiring information on default risk. This information is highly
specific to each client. Hence, the market for bank loans is a customer market
in which borrowers and lenders are imperfect substitutes. A credit squeeze
culls some bank borrowers who may be unable to find loans elsewhere and so
will be unable to finance their investment projects (Blinder and Stiglitz 1983).
Here, therefore, the investment rate INV/Y is influenced by the ratio of
domestic credit to GDP, CRDT/Y.
Finally, note that the gross fixed domestic investment includes FDI. However,
my interest is in studying the effect of FDI inflows on the investment made by
host-country investors. Thus I consider the nationally owned gross fixed invest-
ment defined as gross fixed domestic investment minus the net FDI inflows,
denoted as INVnf). Then I define the dependent variable as the ratio of nationally
owned gross fixed investment to GDP (INVnf/Y). Given the above explanatory
variables, equations (1) and (2) suggest estimating a long-run relation of the type:
INVnf/Yt = b0 + b1 G + b2CRDT/Yt + b3 FDI/Yt + b4 TOTt
+ b5 RER + b6 ∆TEDtot/Y + RL.
For our purposes, the crucial variable here is FDI/Y. The coefficient, b3, of
FDI/Y should be zero if FDI has no impact on investment by local or national
sources. If FDI is associated with a decline in investment from host-country
investors, b3 should be negative; and if FDI inflows are associated with an increase
in investment by local investors, b3 should be positive.
Econometric Procedure Used
The above relation is estimated using pooled time-series/cross-section data for 25
to 32 annual observations of the five South Asian countries under consideration
between 1965 and 1996. A dynamic version of the linear model was estimated by
including the lagged dependent variable because the explanatory variables can be
expected to determine the change in the investment rate rather than its absolute
level. I used a fixed-effects model, which is usually appropriate when one has a rel-
atively small number of countries and a large number of observations for each
country. In this model, dummy variables were included for all but one country,
although for brevity their coefficients are not reported.
Economic Impact of Foreign Direct Investment in South Asia 127
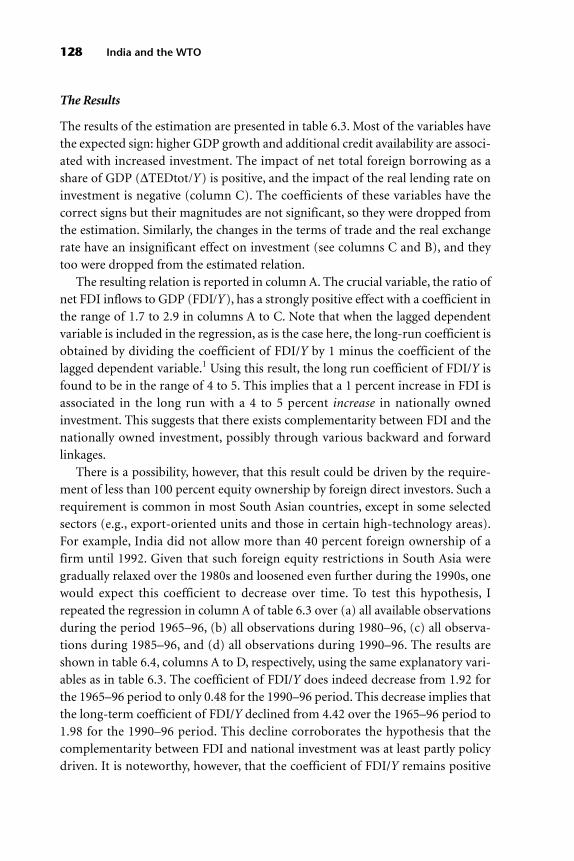
The Results
The results of the estimation are presented in table 6.3. Most of the variables have
the expected sign: higher GDP growth and additional credit availability are associ-
ated with increased investment. The impact of net total foreign borrowing as a
share of GDP (∆TEDtot/Y) is positive, and the impact of the real lending rate on
investment is negative (column C). The coefficients of these variables have the
correct signs but their magnitudes are not significant, so they were dropped from
the estimation. Similarly, the changes in the terms of trade and the real exchange
rate have an insignificant effect on investment (see columns C and B), and they
too were dropped from the estimated relation.
The resulting relation is reported in column A. The crucial variable, the ratio of
net FDI inflows to GDP (FDI/Y), has a strongly positive effect with a coefficient in
the range of 1.7 to 2.9 in columns A to C. Note that when the lagged dependent
variable is included in the regression, as is the case here, the long-run coefficient is
obtained by dividing the coefficient of FDI/Y by 1 minus the coefficient of the
lagged dependent variable.1 Using this result, the long run coefficient of FDI/Y is
found to be in the range of 4 to 5. This implies that a 1 percent increase in FDI is
associated in the long run with a 4 to 5 percent increase in nationally owned
investment. This suggests that there exists complementarity between FDI and the
nationally owned investment, possibly through various backward and forward
linkages.
There is a possibility, however, that this result could be driven by the require-
ment of less than 100 percent equity ownership by foreign direct investors. Such a
requirement is common in most South Asian countries, except in some selected
sectors (e.g., export-oriented units and those in certain high-technology areas).
For example, India did not allow more than 40 percent foreign ownership of a
firm until 1992. Given that such foreign equity restrictions in South Asia were
gradually relaxed over the 1980s and loosened even further during the 1990s, one
would expect this coefficient to decrease over time. To test this hypothesis, I
repeated the regression in column A of table 6.3 over (a) all available observations
during the period 1965–96, (b) all observations during 1980–96, (c) all observa-
tions during 1985–96, and (d) all observations during 1990–96. The results are
shown in table 6.4, columns A to D, respectively, using the same explanatory vari-
ables as in table 6.3. The coefficient of FDI/Y does indeed decrease from 1.92 for
the 1965–96 period to only 0.48 for the 1990–96 period. This decrease implies that
the long-term coefficient of FDI/Y declined from 4.42 over the 1965–96 period to
1.98 for the 1990–96 period. This decline corroborates the hypothesis that the
complementarity between FDI and national investment was at least partly policy
driven. It is noteworthy, however, that the coefficient of FDI/Y remains positive
128 India and the WTO
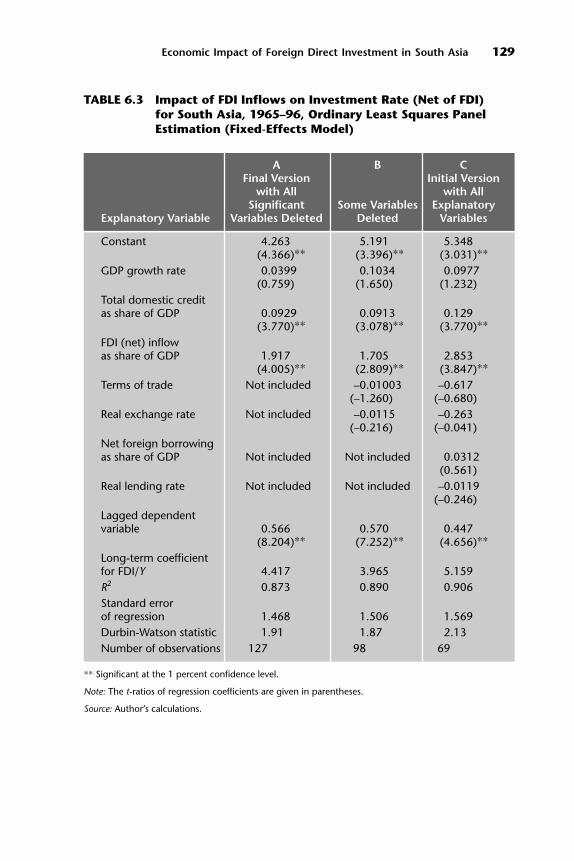
Economic Impact of Foreign Direct Investment in South Asia 129
TABLE 6.3 Impact of FDI Inflows on Investment Rate (Net of FDI)for South Asia, 1965–96, Ordinary Least Squares PanelEstimation (Fixed-Effects Model)
A B CFinal Version Initial Version
with All with AllSignificant Some Variables Explanatory
Explanatory Variable Variables Deleted Deleted Variables
Constant 4.263 5.191 5.348(4.366)∗∗ (3.396)∗∗ (3.031)∗∗
GDP growth rate 0.0399 0.1034 0.0977(0.759) (1.650) (1.232)
Total domestic credit as share of GDP 0.0929 0.0913 0.129
(3.770)∗∗ (3.078)∗∗ (3.770)∗∗
FDI (net) inflow as share of GDP 1.917 1.705 2.853
(4.005)∗∗ (2.809)∗∗ (3.847)∗∗
Terms of trade Not included –0.01003 –0.617(–1.260) (–0.680)
Real exchange rate Not included –0.0115 –0.263(–0.216) (–0.041)
Net foreign borrowing as share of GDP Not included Not included 0.0312
(0.561)Real lending rate Not included Not included –0.0119
(–0.246)Lagged dependent variable 0.566 0.570 0.447
(8.204)∗∗ (7.252)∗∗ (4.656)∗∗
Long-term coefficient for FDI/Y 4.417 3.965 5.159R2 0.873 0.890 0.906Standard error of regression 1.468 1.506 1.569Durbin-Watson statistic 1.91 1.87 2.13Number of observations 127 98 69
∗∗ Significant at the 1 percent confidence level.
Note: The t-ratios of regression coefficients are given in parentheses.
Source: Author’s calculations.

even over the 1990–96 period, so that FDI inflows have a positive effect on the
nationally owned investment during all periods of our analysis.
Furthermore, the long-run coefficient for gross fixed investment net of FDI
when foreign equity is 40 percent, as in pre-1992 India, would be 1.5, which would
decline to 0.33 when foreign equity increases to about 75 percent. This is a reason-
able estimate for India for the 1992–96 period because foreign equity limits varied
from 51 to 100 percent, depending on the sector of operation. Because the esti-
mated long-run coefficients for the South Asian countries during the two periods
are 4.42 and 1.98, respectively, they suggest that the FDI inflows had a positive
effect on nationally owned investment beyond that necessitated by the policy
restrictions on foreign equity share. Thus the complementarity between FDI and
130 India and the WTO
TABLE 6.4 Impact of FDI Inflows on Investment Rate (Net of FDI)for South Asia, Four Different Time Periods, OrdinaryLeast Squares Panel Estimation (Fixed-Effects Model)
A B C D
Explanatory Variable All Observations 1980–96 1985–96 1990–96
Constant 4.263 4.535 4.956 2.623(4.366)∗∗ (1.940)∗ (1.440) (0.565)
GDP growth rate 0.0399 0.054 0.0897 0.154(0.759) (0.722) (1.050) (1.181)
Total domestic credit as share of GDP 0.0929 0.107 0.0413 0.0415
(3.770)∗∗ (2.521)∗∗ (0.767) (0.518)FDI (net) inflow as share of GDP 1.917 1.461 0.934 0.476
(4.005)∗∗ (2.402)∗∗ (1.605) (0.630)Lagged dependent variable 0.566 0.519 0.660 0.759
(8.204)∗∗ (5.498)∗∗ (5.977)∗∗ (5.095)∗∗
Long-term coefficient for FDI/Y 4.417 3.037 2.747 1.975R2 0.873 0.893 0.929 0.930Standard error of regression 1.468 1.453 1.090 1.175Durbin-Watson statistic 1.91 2.263 2.099 2.007Number of observations 127 84 60 35
∗ Significant at the 5 percent confidence level. ∗∗ Significant at the 1 percent confidence level.
Note: The t-ratios of regression coefficients are given in parentheses.
Source: Author’s calculations.

nationally owned investment can be expected to continue even if the restrictions
on foreign equity share are further liberalized or removed. Doing so, however,
would dilute the complementarity. That is, increases in domestic investment
accompanying a given amount of FDI would be lower. Further liberalizing equity
restrictions on foreign firms is especially desirable when doing so attracts consid-
erably larger inflows of FDI (as was the case in India following the 1992 liberaliza-
tion of restrictions on foreign equity share) and when the impact of FDI inflows
on economic growth is positive. That last aspect is considered in the next section.
Impact of FDI on GDP Growth
In the previous section, FDI was shown to have had a strong complementary
effect on investment, leading to additional investment by host-country investors
that was several times the FDI inflow. But the more important question is how
FDI inflows may affect GDP growth. The inflows could promote growth by pro-
viding additional employment in a labor-surplus economy and by improving
technological know-how and human capital. On the other hand, as the analysis of
Brecher and Diaz-Alejandro (1977) suggested, foreign capital inflows could lead
to immiserizing growth when such inflows can earn excessive profits in the host
country, which may be particularly likely in economies subject to various trade
and financial distortions. India and most other South Asian economies suffered
from severe trade distortions while they were following protectionist policies in
the 1960s and 1970s. Those policies have eased slowly as liberalization gradually
occurred during the 1980s and 1990s. Thus the issue assumes added significance
in the context of South Asia.
To test the impact of FDI on growth, I use the conventional neoclassical pro-
duction function, but add foreign capital as a variable.2 Following a large number
of empirical studies that have supported the export-led growth hypothesis (Ram
1985, Salvatore and Hatcher 1991, Greenaway and Sapsford 1994, and Edwards
1996), I also introduce exports as a variable in the production function. This is
done because exports, like FDI, can result in a higher rate of technological inno-
vation and dynamic learning from abroad. Exports also impose a certain market
discipline, thus reducing the rent-seeking ability of special-interest groups and so
minimizing distortions in the economy (Agrawal and others 2000). The produc-
tion function can be written as follows:
y = F(L, kd, kf, x, t)
where y = gross domestic product in real terms, L = labor input, kd = stock of
domestic capital in real terms, kf = stock of foreign capital in real terms, x = exports
Economic Impact of Foreign Direct Investment in South Asia 131
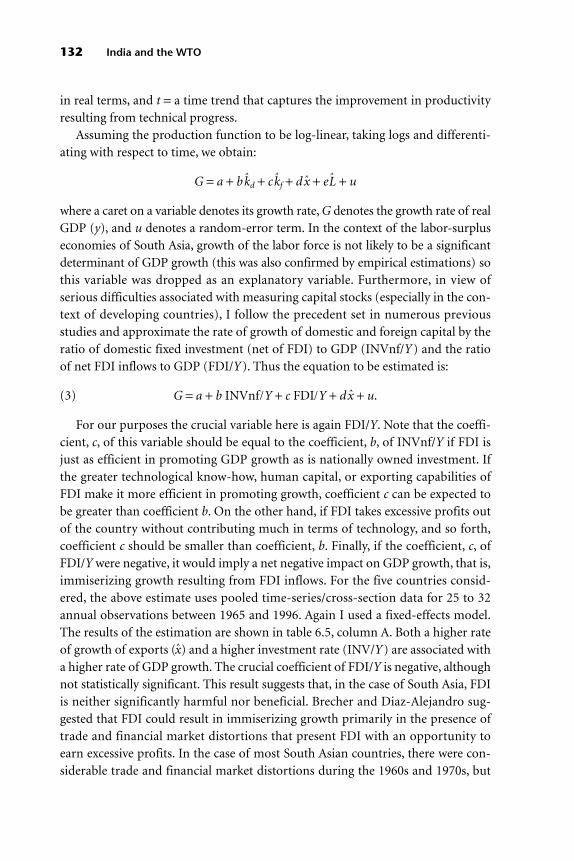
in real terms, and t = a time trend that captures the improvement in productivity
resulting from technical progress.
Assuming the production function to be log-linear, taking logs and differenti-
ating with respect to time, we obtain:
G = a + bkd + c kf + dx + eL + u
where a caret on a variable denotes its growth rate, G denotes the growth rate of real
GDP (y), and u denotes a random-error term. In the context of the labor-surplus
economies of South Asia, growth of the labor force is not likely to be a significant
determinant of GDP growth (this was also confirmed by empirical estimations) so
this variable was dropped as an explanatory variable. Furthermore, in view of
serious difficulties associated with measuring capital stocks (especially in the con-
text of developing countries), I follow the precedent set in numerous previous
studies and approximate the rate of growth of domestic and foreign capital by the
ratio of domestic fixed investment (net of FDI) to GDP (INVnf/Y) and the ratio
of net FDI inflows to GDP (FDI/Y). Thus the equation to be estimated is:
(3) G = a + b INVnf/Y + c FDI/Y + dx + u.
For our purposes the crucial variable here is again FDI/Y. Note that the coeffi-
cient, c, of this variable should be equal to the coefficient, b, of INVnf/Y if FDI is
just as efficient in promoting GDP growth as is nationally owned investment. If
the greater technological know-how, human capital, or exporting capabilities of
FDI make it more efficient in promoting growth, coefficient c can be expected to
be greater than coefficient b. On the other hand, if FDI takes excessive profits out
of the country without contributing much in terms of technology, and so forth,
coefficient c should be smaller than coefficient, b. Finally, if the coefficient, c, of
FDI/Y were negative, it would imply a net negative impact on GDP growth, that is,
immiserizing growth resulting from FDI inflows. For the five countries consid-
ered, the above estimate uses pooled time-series/cross-section data for 25 to 32
annual observations between 1965 and 1996. Again I used a fixed-effects model.
The results of the estimation are shown in table 6.5, column A. Both a higher rate
of growth of exports (x) and a higher investment rate (INV/Y) are associated with
a higher rate of GDP growth. The crucial coefficient of FDI/Y is negative, although
not statistically significant. This result suggests that, in the case of South Asia, FDI
is neither significantly harmful nor beneficial. Brecher and Diaz-Alejandro sug-
gested that FDI could result in immiserizing growth primarily in the presence of
trade and financial market distortions that present FDI with an opportunity to
earn excessive profits. In the case of most South Asian countries, there were con-
siderable trade and financial market distortions during the 1960s and 1970s, but
132 India and the WTO
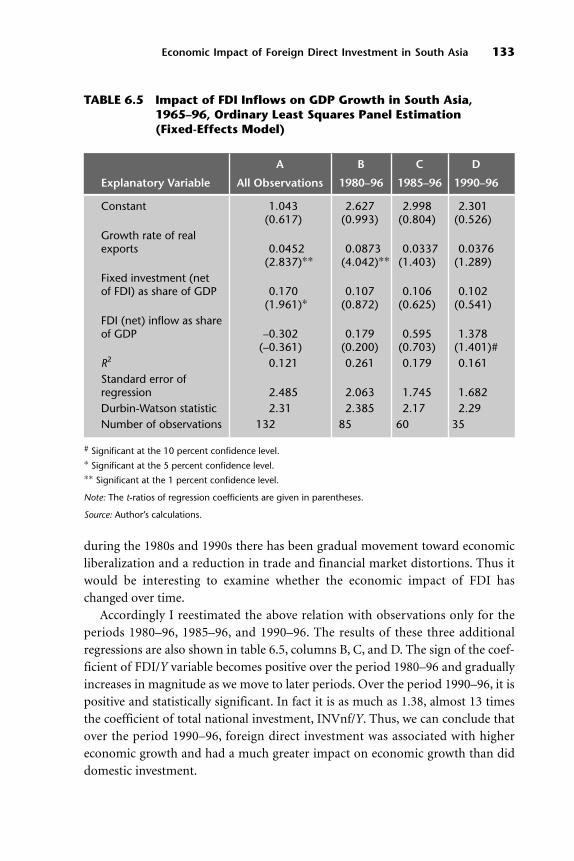
during the 1980s and 1990s there has been gradual movement toward economic
liberalization and a reduction in trade and financial market distortions. Thus it
would be interesting to examine whether the economic impact of FDI has
changed over time.
Accordingly I reestimated the above relation with observations only for the
periods 1980–96, 1985–96, and 1990–96. The results of these three additional
regressions are also shown in table 6.5, columns B, C, and D. The sign of the coef-
ficient of FDI/Y variable becomes positive over the period 1980–96 and gradually
increases in magnitude as we move to later periods. Over the period 1990–96, it is
positive and statistically significant. In fact it is as much as 1.38, almost 13 times
the coefficient of total national investment, INVnf/Y. Thus, we can conclude that
over the period 1990–96, foreign direct investment was associated with higher
economic growth and had a much greater impact on economic growth than did
domestic investment.
Economic Impact of Foreign Direct Investment in South Asia 133
TABLE 6.5 Impact of FDI Inflows on GDP Growth in South Asia,1965–96, Ordinary Least Squares Panel Estimation(Fixed-Effects Model)
A B C D
Explanatory Variable All Observations 1980–96 1985–96 1990–96
Constant 1.043 2.627 2.998 2.301(0.617) (0.993) (0.804) (0.526)
Growth rate of real exports 0.0452 0.0873 0.0337 0.0376
(2.837)∗∗ (4.042)∗∗ (1.403) (1.289)Fixed investment (net of FDI) as share of GDP 0.170 0.107 0.106 0.102
(1.961)∗ (0.872) (0.625) (0.541)FDI (net) inflow as share of GDP –0.302 0.179 0.595 1.378
(–0.361) (0.200) (0.703) (1.401)#R2 0.121 0.261 0.179 0.161Standard error of regression 2.485 2.063 1.745 1.682Durbin-Watson statistic 2.31 2.385 2.17 2.29Number of observations 132 85 60 35
# Significant at the 10 percent confidence level. ∗ Significant at the 5 percent confidence level.∗∗ Significant at the 1 percent confidence level.
Note: The t-ratios of regression coefficients are given in parentheses.
Source: Author’s calculations.

In this context it is also worth comparing the relative merits of FDI inflows and
foreign borrowing (an alternative form of foreign capital). For this purpose I rees-
timated relation (3) after adding another variable, namely, net total (private and
public) additional foreign borrowing as a share of GDP, ∆TEDtot/Y. This variable
was obtained by calculating the change in total external debt in U.S. dollars, con-
verting it to current local units, and dividing by nominal GDP. That is, I estimated
the following relation:
This relation was estimated over the same four periods as shown in table 6.5.
The estimation results are presented in table 6.6. Throughout the periods since
G a b Y c Y d Y ex u= + + + + +INVnf FDI TEDtot/ / / ˆ .∆
134 India and the WTO
TABLE 6.6 Impact of FDI Inflows on GDP Growth in South Asia:Comparison of FDI Inflows and Foreign Borrowing,1965–96, Ordinary Least Squares Panel Estimation(Fixed-Effects Model)
A B C D
Explanatory Variable All Observations 1980–96 1985–96 1990–96
Constant 1.0033 2.498 1.676 –0.473(0.596) (0.939) (0.430) (–0.109)
Growth rate of real exports 0.0471 0.08520 0.0352 0.0348
(2.956)∗∗ (4.080)∗∗ (1.468)# (1.271)Fixed investment (net of FDI) as share of GDP 0.1647 0.1075 0.153 0.212
(1.897)# (0.872) (0.892) (1.146)FDI (net) inflow as share of GDP –0.288 0.225 0.7668 1.840
(–0.345) (0.252) (0.895) (1.940)#
Net foreign debt inflow as share of GDP 0.077 0.0547 0.0906 0.2066
(1.418) (0.663) (1.146) (2.148)∗∗
R2 0.135 0.261 0.199 0.287Standard error of regression 2.476 2.063 1.740 1.580Durbin-Watson statistic 2.28 2.385 2.12 2.16Number of observations 132 85 60 35
# Significant at the 10 percent confidence level. ∗∗ Significant at the 1 percent confidence level.
Note: The t-ratios of regression coefficients are given in parentheses.
Source: Author’s calculations.

1980, the coefficient of ∆TEDtot/Y is positive and statistically significant. How-
ever, it is small (d = 0.21 over 1990–96) compared with the coefficient of FDI/Y
(c = 1.84 over 1990–96). This suggests that FDI inflows are more beneficial than is
foreign borrowing.
There still remains the question about the direction of causation in the positive
association between FDI/Y and GDP growth. Thus if higher GDP growth attracted
larger FDI inflows, this positive association might not be meaningful for FDI-
related policies. But if higher FDI/Y caused higher GDP growth, South Asian
countries would be well advised to attract more FDI. Therefore, I next consider
the direction of causality between FDI/Y and GDP growth using the Granger
causality analysis. The vector autoregression (VAR) framework used for testing
the Granger causality is explained briefly in the appendix. The lag length for the
VAR was chosen by minimizing the Schwartz Bayesian criterion, which selected a
lag length of one. The results of the test are shown in table 6.7. The causality test
was undertaken for 1990–96 given the above finding that the impact of FDI inflows
on GDP growth was significant only over this period. The null hypothesis that
GDP growth did not cause FDI/Y is not rejected whereas the null hypothesis that
FDI/Y did not cause GDP growth is rejected, albeit mildly at about 18 percent sig-
nificance level. This evidence suggests that the larger inflows of FDI as a share of
GDP did help cause higher GDP growth in South Asia during the period 1990–96.
The above results suggest therefore that FDI inflows helped achieve faster eco-
nomic growth in South Asia in the liberalized environment, beginning in the 1980s
and especially during the 1990s. This finding may be the result of a reduction in
excessive profits brought about by reduced distortions and a greater contribution
to technological know-how in the more competitive environment during the 1980s
and 1990s. Additional FDI inflows appear to be desirable in the liberalized eco-
nomic policy framework that now prevails and should be encouraged.
Economic Impact of Foreign Direct Investment in South Asia 135
TABLE 6.7 Granger Causality Test between GDP Growth and FDIInflows as a Share of GDP in South Asia, 1990–96
Test Results for Rejection of Null,b
Null Hypothesis Number of Lagsa F Statistic (p-Value)
GDP growth does not cause FDI/Y 1 0.0318 (0.860)
FDI/Y does not cause GDP growth 1 1.892 (0.180)
a. Number of lags was chosen to minimize the Schwartz Bayesian criterion.b. See the appendix for a brief explanation of the Granger causality test procedure used.
It may be worth noting that during the 1990s FDI inflows averaged about
5 percent of GDP in China and about 3 percent of GDP in the rapidly growing
East Asian economies, although they averaged only 0.5 percent in South Asia (see
figure 6.1). Thus there is considerable scope for increasing FDI inflows in South
Asia and doing so could increase the South Asian GDP growth rates by a few per-
centage points.
Conclusion
In this study I have tried to assess the economic impact of FDI in India and South
Asia by using panel data from five South Asian countries (Bangladesh, India,
Nepal, Pakistan, and Sri Lanka) to estimate the impact of FDI inflows on nation-
ally owned investment and on GDP growth. I found that an increase in FDI in
South Asia was associated with a manifold increase in the investment by domestic
investors. The analysis suggests that this association may in part result from for-
eign direct investors having to hold less than 100 percent equity ownership, a
requirement in most South Asian countries. Because the long-run positive impact
of FDI on national investors was considerably more than the equity-ownership
effect alone would imply, however, my analysis suggests that there exist comple-
mentarity and linkage effects between foreign and nationally owned investment
beyond the effects of the restrictions on foreign equity ownership.
The impact of FDI inflows on the GDP growth rate was found to be insignifi-
cant over the 1970s and 1980s, but positive and statistically significant over
1990–96, which is when the bulk of FDI came into India and South Asia. It is
noteworthy that most South Asian countries followed import-substitution poli-
cies and had high import tariffs in the 1960s and 1970s. These policies gradually
changed during the 1980s, and by the early 1990s most countries had largely
abandoned that strategy in favor of more open international trade and generally
market-oriented policies. These results can be understood in terms of the analysis
of Brecher and Diaz-Alejandro (1977), who showed that foreign capital would be
less beneficial (or even harmful) in the presence of trade and financial market dis-
tortions than otherwise. Thus my analysis suggests that FDI inflows have a posi-
tive impact on economic growth under the economic conditions now prevailing
in South Asia.3
I also found that FDI inflows since 1980 have contributed more to investment
and to GDP growth in South Asia than has an equal amount of foreign borrow-
ing. This finding suggests that to the extent that some foreign capital is needed in
the economy, FDI is preferable to foreign borrowing. Finally, Granger causality
tests showed that the larger FDI inflows as a share of GDP during the 1990–96
136 India and the WTO
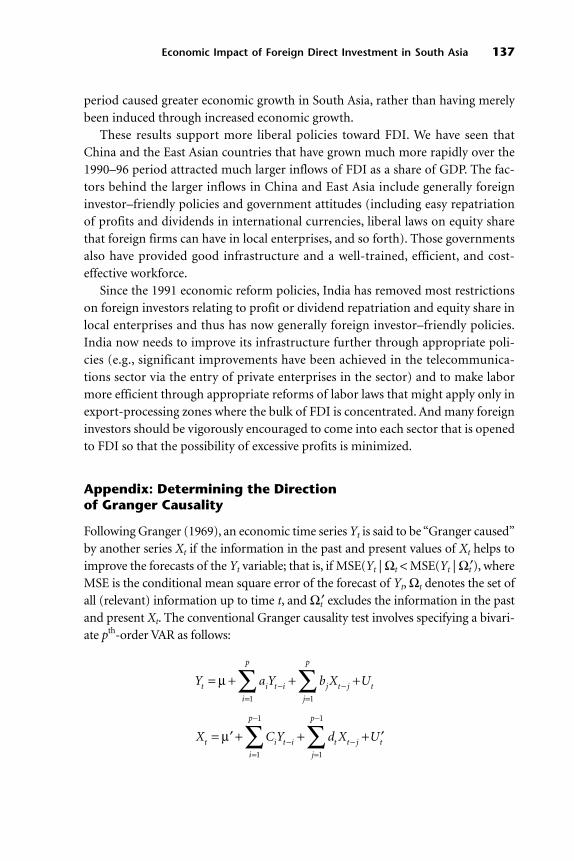
period caused greater economic growth in South Asia, rather than having merely
been induced through increased economic growth.
These results support more liberal policies toward FDI. We have seen that
China and the East Asian countries that have grown much more rapidly over the
1990–96 period attracted much larger inflows of FDI as a share of GDP. The fac-
tors behind the larger inflows in China and East Asia include generally foreign
investor–friendly policies and government attitudes (including easy repatriation
of profits and dividends in international currencies, liberal laws on equity share
that foreign firms can have in local enterprises, and so forth). Those governments
also have provided good infrastructure and a well-trained, efficient, and cost-
effective workforce.
Since the 1991 economic reform policies, India has removed most restrictions
on foreign investors relating to profit or dividend repatriation and equity share in
local enterprises and thus has now generally foreign investor–friendly policies.
India now needs to improve its infrastructure further through appropriate poli-
cies (e.g., significant improvements have been achieved in the telecommunica-
tions sector via the entry of private enterprises in the sector) and to make labor
more efficient through appropriate reforms of labor laws that might apply only in
export-processing zones where the bulk of FDI is concentrated. And many foreign
investors should be vigorously encouraged to come into each sector that is opened
to FDI so that the possibility of excessive profits is minimized.
Appendix: Determining the Direction of Granger Causality
Following Granger (1969), an economic time series Yt is said to be “Granger caused”
by another series Xt if the information in the past and present values of Xt helps to
improve the forecasts of the Yt variable; that is, if MSE(Yt | Ωt < MSE(Yt | Ωt′), where
MSE is the conditional mean square error of the forecast of Yt, Ωt denotes the set of
all (relevant) information up to time t, and Ωt′ excludes the information in the past
and present Xt. The conventional Granger causality test involves specifying a bivari-
ate pth-order VAR as follows:
Y a Y b X U
X C Y d X U
t
i
p
i t i
j
p
j t j t
t
i
p
i t i
j
p
t t j t
= + + +
= ′ + + + ′
=−
=−
=
−
−=
−
−
∑ ∑
∑ ∑
µ
µ
1 1
1
1
1
1
Economic Impact of Foreign Direct Investment in South Asia 137

where µ and µ′ are constant drifts; Ut and Ut′ are error terms; and, more generally,
the equation may include any number of additional relevant variables. Then the
null hypothesis that Xt does not cause Yt amounts to testing
b1 = b2 = … = bn = 0.
This can be tested by standard methods, such as an F test. Similarly, the null
hypothesis that Yt does not cause Xt amounts to testing
c1 = c2 = … = cn = 0.
Endnotes
1. To see the logic behind this, note that if Yt = aXt + bYt−1, then in the long-run equilibrium, where
Yt = Yt−1 = Y and Xt = X, we have Y = aX + bY, so that Y = [a/(1 − b)]X.
2. This approach has been used by Balasubramanyam, Salisu, and Sapsford (1996).
3. Das reviews the empirical literature on the effects of FDI in Chapter 7 of this volume. He con-
cludes that FDI on the whole has positive economic effects in host countries.
References
Agrawal, Pradeep, Subir Gokarn, Veena Mishra, Kirit S. Parikh, and Kunal Sen. 2000. Policy Regimes
and Industrial Competitiveness: A Comparative Study of East Asia and India. London: Macmillan.
Balasubramanyam, V. N., M. Salisu, and D. Sapsford. 1996.“Foreign Direct Investment and Growth
in EP and IS Countries.” Economic Journal 106: 92–105.
Blejer, Mario I., and M. Khan. 1984. “Government Policy and Private Investment in Developing
Countries.” IMF Staff Papers 31: 379–403.
Blinder, Alan S., and J. E. Stiglitz. 1983. “Money, Credit Constraints and Economic Activity.”
American Economic Review 73: 297–302.
Brecher, Richard A., and C. F. Diaz-Alejandro. 1977. “Tariffs, Foreign Capital and Immiserizing
Growth.” Journal of International Economics 7: 317–22.
Cardoso, Eliana. 1993. “Private Investment in Latin America.” Economic Development and Cultural
Change 41: 833–48.
Edwards, Sebastian. 1996. “Why Are Latin America’s Saving Rates So Low? An International Com-
parative Analysis.” Journal of Development Economics 51: 5–44.
Fry, Maxwell J. 1993. “Foreign Direct Investment in Southeast Asia: Differential Impacts.” ISEAS
Current Economic Affairs Series. Singapore: Institute of Southeast Asian Studies, ASEAN Economic
Research Unit.
———. 1995. Money Interest and Banking in Economic Development, 2nd ed. Baltimore: Johns
Hopkins University Press.
———. 1998. “Saving, Investment, Growth and Financial Distortions in Pacific Asia and Other
Developing Areas.” International Economic Journal 12: 1–25.
Gopinath, T. 1997.“Foreign Investment in India: Policy Issues, Trends and Prospects.” Reserve Bank
of India Occasional Papers 18(2 and 3; special issue): 453–70.
Granger, C. W. J. 1969. “Investigating Causal Relations by Econometric Models and Cross-Spectral
Methods.” Econometrica 55: 251–76.
Greenaway, David, and D. Sapsford. 1994.“What Does Liberalisation Do for Exports and Growth?”
Weltwirtschaftliches Archiv 130: 152–73.
138 India and the WTO

Kumar, Nagesh. 1994. Multinational Enterprises and Industrial Organisations—The Case of India.
New Delhi: Sage Publications.
Ram, Rati. 1985. “Exports and Economic Growth. Some Additional Evidence” Economic Develop-
ment and Cultural Change 33: 415–25.
Salvatore, Dominick, and T. Hatcher. 1991. “Inward Oriented and Outward Oriented Trade Strate-
gies.” Journal of Development Studies 27: 7–25.
Servén, Luis, and Andres Solimano. 1992. “Private Investment and Macroeconomic Adjustment: A
Survey.” World Bank Research Observer 7: 95–114.
Van Wijnbergen, Sveder. 1982. “Stagflationary Effect of Monetary Stabilization Policies: A Quanti-
tative Analysis of South Korea.” Journal of Development Economics 37: 133–69.
World Bank. 1998. World Development Indicators. Washington, D.C.
Economic Impact of Foreign Direct Investment in South Asia 139

The World Trade Organization (WTO) is a living and growing organism. It
was born with at least 16 “wings” (agreements) at various stages of com-
pleteness. The functioning of the WTO affects the economic life of all
countries around the globe. It is not concerned only with international trade—
meaning exports and imports of goods and services in the traditional sense—but
with “international business” in general, and that includes foreign direct invest-
ment (FDI). Indeed, in recent decades FDI in the global economy has grown
much faster than has trade in goods. Between 1973 and 1995, the annual outflow
of funds as FDI has grown more than 12-fold compared with a 9-fold increase in
the value of merchandise exports (Drabek 1998).1
The provisions on FDI in the WTO framework are contained in two agree-
ments: the General Agreement on Trade in Services (GATS) and the Agreement on
Trade-Related Investment Measures (TRIMs) in relation to trade in goods.
Undoubtedly at some time in the future these are going to be integrated and, more
important, they will evolve into simply investment measures (IMs). In other
words, the FDI wing of the WTO is likely to spread over time. Whether some form
of FDI is trade related would be an irrelevant issue. All forms of FDI would come
under the jurisdiction of the WTO.
In that context, the objective of this chapter is to assess the gains to India from
existing and potentially new WTO rules on FDI. I hope it will provide some basis
for articulating negotiating objectives and strategies from the Indian perspective
and, to some extent, from the perspective of developing countries.
141
7
An Indian Perspectiveon WTO Rules on
Foreign DirectInvestment
Satya P. Das

The next section of the chapter offers a review of different policies that parent
and host countries have adopted over time, the existing WTO provisions on FDI,
and a summary of the official views of different countries, including India, on
TRIMs and FDI in general. Because a truly forward-looking strategy should take
into account the dynamics of FDI in India as well as the history of India’s FDI pol-
icy, the second section of this chapter presents a facts-and-figures review of the
dynamics and history. The third section discusses the potential benefits and costs
of FDI. Findings from various empirical studies are presented in the fourth sec-
tion. Of particular interest will be those findings pertaining to India. All of these
materials are background for the main query—what should be the optimal strat-
egy for India? The fifth section presents a view that the arguments against freer
FDI and against multilateral rules on such investment are weak. The final section
proposes that, contrary to the current policy stand, India should support a regime
with more multilateral rules.
FDI Policies, and the WTO on FDI Thus Far
Over time FDI has been subject to various types of policies by both host and
parent countries—from extremely negative policies like nationalization or
appropriation to positive incentives like tax holidays. Some of these policies are
summarized in table 7.1. Nationalization is a rare occurrence, but the threat of it
has real effects (Eaton and Gersovitz 1984). Relatively common negative incen-
tives include restrictions on foreign equity share, domestic content requirements,
production or export requirements, restrictions on remittances of profits, and
so forth.
As one would expect, there are more restrictions on FDI in developing coun-
tries than in industrial countries. Member countries in the Association of
Southeast Asian Nations (ASEAN) in which FDI has played a major role in growth
use a screening, negative list (sectors into which FDI is not permitted or permit-
ted only with substantial restrictions); foreign equity caps; and land-ownership
limitations. India uses these restrictions plus balancing requirements (details are
given below). Most of the restrictions on FDI by less developed host countries
stem from their perception that multinational firms, the principal conduits of
FDI activity, engage in restrictive and predatory business practices, whereas the
countries do not have the institutional setup to enforce competition policies
effectively. Industrial countries use screening and the negative list much less
commonly than do developing countries. In some Organisation for Economic
Co-operation and Development (OECD) countries these have been practically
abolished.
142 India and the WTO

Against this background, among the four categories of agreements reached
under the GATT (which evolved into the WTO)—that is, agreements on goods,
services, intellectual property rights, and dispute settlement—by the end of 1994
two categories contained some disciplines on FDI: the agreements on goods and on
services. In the goods category, the agreement on FDI, called TRIMs, seeks to abol-
ish FDI policies that supposedly hamper trade. There is, however, a lack of consen-
sus on the definition of TRIMs. At least eight types of TRIMs can be classified:
1. Local content requirements
2. Trade balancing requirements
3. Foreign exchange restrictions
4. Export performance requirements
5. Local production requirements
6. Production mandates
7. Mandatory technology transfers
8. Limits on foreign equity and remittances.
An Indian Perspective on WTO Rules on Foreign Direct Investment 143
TABLE 7.1 FDI Policies over Time
Positive Incentives Negative Incentives
• Guarantee against nationalization• Tax holidays• Tax treaties to avoid double
taxation• Exemptions on import duties on
capital goods and intermediategoods
• Other exemptions or relaxation ofrules in priority sectors
• Subsidized loans, reduced rent forland use, accelerated depreciation
• Special promotion of exports, forexample, through exportprocessing zones
• Nationalization or appropriation• Double taxation• Domestic content requirement in
terms of intermediates• Domestic employment restrictions• Export requirements and foreign
currency earning targets• Screening• General foreign equity limits• Sectoral foreign equity limits• Land ownership restrictions• Division of management within a
joint venture• Restrictions on remittance of
profits• Transfer of shares• Restrictions on liquidation of the
company
Source: Author’s compilation from various sources.

Of these, the TRIMs agreement specifically mentions the first, the second, and
a part of the third entry (Yu and Chao 1998).
The TRIMs agreement set up a committee to monitor the implementation of
commitments. Industrial countries had two years (until the end of 1996) to elim-
inate these restrictions. Developing countries had five years (until the end of
1999) and the least developed countries had seven (until the end of 2001). It is
important to note that the incidence of TRIMs is believed to be high in India, as
well as in Brazil and Indonesia. It is interesting also that under the dispute settle-
ment scheme of the WTO, there is an instance of TRIMs violation: namely, the
European Union (EU), Japan, and the United States against Indonesia on its
National Car Program initiated in 1996. Under this program, the Indonesian
firms or firms located outside Indonesia but owned by Indonesian nationals
obtained exemption from the luxury tax on cars and from some import duties as
long as they met local content requirements. The WTO passed judgment in favor
of the plaintiff countries.2
The GATS defines four modes of international services transactions:
1. Cross-border supply (e.g., provision of a technical report faxed by a foreign
national)
2. Commercial presence (e.g., foreign banks operating in a host country)
3. Movement of business persons (e.g., computer software engineers moving to
another country temporarily to complete a project)
4. Consumption abroad (e.g., tourism).
Among these modes, commercial presence involves FDI naturally. Unlike the
broad range of sectors negotiated with respect to trade in goods, however, under
GATS each country negotiated a list of GATS-exempted sectors. In principal in
these sectors, FDI can be subject to substantial restrictions. In others, there is a de
facto commitment (rule) on FDI policy. This contrasts with TRIMs in that in the
goods sector there is no direct commitment on FDI policy. Local content, trade
balancing, and so forth can violate WTO norms only insofar as they adversely
affect trade in goods.3 Hence there are inconsistencies between FDI policies
embodied in the two agreements. In any event, this was the state of FDI liberaliza-
tion under WTO at its inception in 1995.
The next set of policy initiatives with respect to FDI came during the second
WTO Ministerial Meeting held in Singapore in 1996. It was decided to establish
three working groups mandated to undertake “educative work” in three areas, one
of which is the relationship between trade and investment.4 The report of the
working group was submitted in December 1998; it recommended further studies
on several aspects of FDI.
144 India and the WTO

Discussions about multilateral rules on FDI were scheduled for the WTO Min-
isterial Meeting in Seattle in 1999, and more than 150 documents by various
countries were submitted in preparation. The following is a brief summary of var-
ious viewpoints expressed there:
• It was generally agreed that FDI is a major means of enhancing global produc-
tion and efficiency. Countries other than Brazil, Colombia, and India stated
that transparency and fairness are critical in attempting to encourage FDI, and
that those can be achieved by formulating rules.
• At the same time, the countries held that the growth and development of
developing countries should be a major consideration in formulating disci-
plines on FDI. The EU even proposed that some characteristics of the develop-
ment process itself should be built into the WTO framework.5
• No country document was specific about where the line between international
rules and individual national goals may be drawn or, in other words, how com-
prehensive the rules ought to be.
• Also, they were silent on the time frame. Should FDI be included in the fast-
track agenda? Or should it be allowed to take a building-block approach?
• India was among the minority in opposing any kind of multilateral rules. It
wanted TRIMs to be permitted insofar as they could be justified from the view-
point of growth and development. Its document stated that “domestic content
is an extremely useful and necessary tool from the point of view of developing
countries.” Similar views were expressed by Brazil and Colombia.
As is well known, the Seattle Ministerial Meeting remained inconclusive for
various reasons. The next ministerial meeting was held in Doha in 2001. Before
that, in May 2001, member countries met to discuss how the FDI issue should be
taken up during the Doha gathering. Members such as Chile, Costa Rica, the EU,
Japan, and the Republic of Korea supported a multilateral investment agreement.
It is interesting that the United States heard out the arguments and counterargu-
ments and remained passive. The Arab Republic of Egypt, India, and Malaysia
(constituting what has been termed the “Like-Minded Group”), on the other
hand, were opposed to it, citing loss of sovereignty and lack of flexibility that
would be associated with a rules-based regime. A quid pro quo middle ground
was advanced by Argentina, Australia, and Brazil: negotiations on FDI rules would
be conditional on concessions to be granted to concerned countries in agriculture
and on commitments made in the area of market access to industrial countries.
Not much progress was made in the Doha Meeting but countries agreed that
negotiations will take place after the Mexico Ministerial Meeting in September
2003. WTO will cooperate with other organizations, such as the United Nations
An Indian Perspective on WTO Rules on Foreign Direct Investment 145

Conference on Trade and Development (UNCTAD), to provide technical assis-
tance and capacity building to developing and least developed countries in evaluat-
ing their objectives and development policies. The organization has also called for
further study of the various ramifications of FDI rules, including dispute settlement.
India remains opposed to further liberalization of FDI and to any set of multi-
lateral rules at the WTO level. The question is whether this policy stance is the
right one for the country’s self-interest. To answer that question it is necessary to
review (a) India’s policy toward FDI and the status of FDI flows into India, (b) the
various sources of benefits and costs associated with FDI, and (c) the empirical
findings that bear on these benefits and costs.
FDI and FDI Policies in India: Facts
There are many published studies on the history of Indian FDI policy from the
time of independence until the beginning of (or a couple of years into) the liber-
alization era (1991–94), for example, Athreye and Kapur (1999b), Bhattacharya
and Palaha (1996), and Kumar (1994). Thus our review of this period will be
short. More emphasis will be placed on postliberalization years.
The Years 1947 to 1991
As Kidron (1965) has put it, in the initial period after independence, between 1947
and 1957, an uneasy triangle prevailed among individual businesses, industry
associations, and the government. To assess technology, industrialists preferred
foreign collaboration. The actions of industrial associations were colored, how-
ever, by the proclaimed virtues of the Swadeshi (Nationalist) Revolution. The offi-
cial position of the government was a relatively open-door policy toward FDI, but
in intent it was nationalist. Ambivalence toward foreign capital prevailed very
starkly at the industry and government levels. This was understandable in view of
the memory of the East India Company’s rule evolving into the British Empire
and on the heels of independence from the empire.
The following decade, from 1957 to 1967, can be termed (following Kumar
1994) an era of gradual liberalization.6 An ambitious program of industrialization
was envisaged in the Second Five-Year Plan. It required massive doses of invest-
ment, much beyond what domestic sources could garner. And it was recognized
that, unlike domestic projects, investment from foreign sources would not “use
up” much foreign exchange. Consistent with the objective of the Second Five-Year
Plan and the concept of planning itself, the government followed a policy of selec-
tivity in terms of sectors. Manufacturing received most of the foreign capital.
The situation changed drastically by the late 1960s. The foreign exchange
shortage became acute. The rupee was devalued, but the balance-of-payments
146 India and the WTO
deficit continued. (This was similar to the experience of many other countries in
the Bretton Woods system.) Economic thinking turned to a more socialistic phi-
losophy. Major banks were nationalized. There was a wholesale policy shift toward
exchange rate management and FDI. The (in-)famous Foreign Exchange Regula-
tion Act (FERA) came into existence in 1973.7 Foreign equity was restricted to 40
percent, in the sense that:
(a) If the joint venture was to be treated without discrimination vis-à-vis domes-
tic firms, the foreign equity share must not exceed this limit.
(b) The conditions under which the foreign equity share could exceed 40 per-
cent were quite stringent and the decision as to whether such a venture
would be allowed (even if it met all conditions) was left to the discretion of
the government.
Different sectors were identified in which foreign collaboration was deemed
unnecessary, where only technological collaboration was considered desirable and
FDI was permissible. The period from 1967 to 1980 may therefore be called an era
of severe (draconian!) restriction.
Policies were eased in the 1980s. In the wake of the oil price shocks it was prob-
ably realized that the country needed to increase its exports considerably and, for
various reasons, domestic firms alone would not be up to the task. FERA restric-
tions were relaxed for 100 percent export-oriented units. Four export processing
zones were set up. In 1984 and 1985 many capital goods were moved to the Open
General License (OGL) list. In 1986, the tax rate on royalty payments was brought
down from 40 percent to 30 percent. FDI regulations continued to fall at a gradual
rate throughout the 1980s.
1991 Onward: The Liberalization Era
A structural break from the past policy regime came in 1991. As with other aspects
of India’s economic policy, 1991 and onward can be called the postliberalization era
or simply the liberalization era. Similar to other major policy shifts in the past, the
change was initiated partly because of outside shocks. The Gulf war in 1991 led to a
massive exodus of Indians working in the region and it severely curtailed the flow of
foreign exchange to India. In the international loan market, India’s credit rating
plummeted. There was an exodus of nearly US$1 billion dollars from nonresident
Indian (NRI) deposits. For the first time the country faced a serious prospect of
defaulting on foreign loans. Assistance from the International Monetary Fund and
the World Bank was sought and those institutions insisted on reforms.
In 1991 the rupee was devalued by 20 percent. Import liberalization took place
over a large spectrum of goods. For example, automatic clearance of capital goods
An Indian Perspective on WTO Rules on Foreign Direct Investment 147

up to 25 percent of total value of plant and equipment or Rs. 2 crores—whichever
is less—was granted. Foreign equity proposals would no longer have to be tied up
with a technology agreement. A Foreign Investment Promotion Board (FIPB) was
set up to consider large investment proposals. It could also negotiate and would
give single-window clearance.
The Monopolies and Restrictive Trade Practices Act requirement that expan-
sion of foreign ventures needed prior approval was lifted. Foreign brand names
could be used by domestic industry having connections with foreign firms. Over
time, the size of the negative list of exports and imports shrank. Previously there
was a dividend-balancing requirement for foreign ventures, which meant that div-
idend payments to a foreign party over the first seven years from the date of com-
mercial production had to be balanced by export earnings. That requirement was
lifted except for 24 consumer goods industries. Many restrictions on acquisition
of immovable property were removed.
In January 1994 India became a full-fledged member of the Multilateral Invest-
ment Guarantee Agency (MIGA). As a result, all investments approved by the gov-
ernment are insured by MIGA against expropriation or nationalization.
A minerals policy was introduced in 1993. The minerals sector was no longer
restricted to the public sector; private domestic firms or firms with foreign equity
not exceeding 50 percent could participate. Many “core” or priority sectors have
been defined in which FDI is “encouraged.” As of the end of the financial year 1999–
2000, there is automatic approval of up to 100 percent of equity in three special
categories of industries—power, transport, and totally export-oriented units—
unless the magnitude of foreign equity exceeds Rs. 1,500 crores. (The maximum
allowable limit is 100 percent whether or not FDI qualifies for automatic approval.)
In mining, there can be 100 percent foreign equity, but automatic approval is given
in case of 50 to 74 percent of equity, depending on particular subsectors. In core
industries, automatic approval is given as long as the foreign equity share does not
exceed 51 percent. In the petroleum sector, the maximum foreign equity allowed is
100 percent but a license is required; there is no automatic approval. Even in small-
scale industries, FDI is allowed (subject to licensing) with foreign equity not
exceeding 24 percent. There are a few sectors in which FDI is not permitted: arms
and ammunitions; railways; atomic energy; coal and lignite; and mining of chrome,
copper, diamond, gold, gypsum, iron, manganese, sulphur, and zinc.
India’s FDI Approval System
An FDI proposal requires approval. There are two approval bodies: the Reserve
Bank of India (RBI) and the SIA/FIPB (Secretariat for Industrial Assistance and
FIPB for Foreign Investment Promotion Board). The RBI gives automatic
148 India and the WTO

An Indian Perspective on WTO Rules on Foreign Direct Investment 149
approval to proposals in high-priority sectors where foreign equity does not
exceed 51 percent and in the mining sector as long as it does not exceed 50 per-
cent. Automatic approval is given in two weeks. This is subject to the following
conditions, however:
• Capital goods and machinery imported from abroad have to be new, not
secondhand.
• The (import) cost of such goods must be borne from foreign equity.
• Fees and royalties need to conform to some norms.
SIA/FIPB deals with other proposals, such as where foreign equity exceeds 51
percent the industry is not on the list of high-priority sectors, or foreign equity
does not cover the import of capital goods. Proposals are cleared in four to six
weeks. Unlike the RBI, SIA/FIPB can initiate and carry on detailed negotiations
with foreign firms. The secretary of the Department of Industry is the chairman.
FDI Flows into India
We now present data on FDI flows into India. Table 7.2 shows total FDI flows
from 1997 to 2001 into various countries. As we see, the United States is the
largest importer and exporter of foreign capital, followed by the United Kingdom
and China. It is interesting that Japan and Korea have received almost equal
amounts of foreign capital. India lags behind not only Japan and Korea but also
TABLE 7.2 Total FDI in Selected Countries, 1997–2001(in Millions of US$)
Country Investment Amount
United States 986,555United Kingdom 365,877China 215,925Brazil 131,663Mexico 77,948Japan 33,628Korea, Rep. of 30,040Thailand 18,902Malaysia 17,275India 14,142Israel 13,713
Source: UNCTAD 2002.

150 India and the WTO
behind Thailand and Malaysia. It has attracted only a little more than 6 percent
of the total foreign direct investment that China has received.
The amounts of investment capital that flowed into India and a group of other
countries from 1997 through 2001 are presented in table 7.3. Notice that the FDI
generally has grown over time (except from the year 2000 to 2001). It is understand-
able that Malaysia and Thailand saw a declining trend from 1998 to 2000, given the
financial crisis they went through, and despite the worldwide recession since 2000
FDI inflow to Thailand increased from the year 2000 to 2001. Even though India was
insulated from that crisis, it is noteworthy and a bit disturbing that FDI inflow to
India declined from 1997 to 1999, although it has since trended upward again.
Although the emphasis in this chapter is on the inflow of foreign capital, mul-
tilateral FDI policy from any single country’s perspective would affect outflow of
capital as well. Table 7.4 presents both inward and outward flows as a percentage
of gross capital formation. For industrial countries, FDI is pretty much a two-way
flow. For India, FDI outflow is only a trickle, but it has an increasing trend. Among
the developing countries, Malaysia’s outward orientation is the largest.
We now concentrate on India only. The time series from 1970 to 1998 (except
for the year 1990) is given in table 7.5. We see that in the 1970s there was a fluctu-
ating and very modest growth pattern of FDI—thanks to FERA. More consistent
growth has occurred since 1980 in response to the gradual liberalization of poli-
cies. Approval data are available since 1991 only.8 It is striking that the actual-to-
approved ratio is very poor except in 1991.
TABLE 7.3 Flow of FDI into India and Other Countries, 1997–2001(in Millions of US$)
Country 1997 1998 1999 2000 2001
Brazil 18,993 28,856 28,578 32,779 22,457China 44,237 43,751 40,319 40,772 46,846India 3,619 2,633 2,168 2,319 3,403Israel 1,628 1,760 2,889 4,392 3,044Japan 3,224 3,193 1,2741 8,322 6,202Korea, Rep. of 2,814 5,412 9,333 9,283 3,198Malaysia 6,324 2,714 3,895 3,788 554Mexico 14,044 11,933 12,534 14,706 24,731Thailand 3,626 5,143 3,561 2,813 3,759United Kingdom 33,229 74,324 87,973 116,552 53,799United States 103,398 174,434 283,376 300,912 124,435
Source: UNCTAD 2002.

An Indian Perspective on WTO Rules on Foreign Direct Investment 151
The sectorwise breakdown is given in table 7.6. FDI is most concentrated in the
infrastructure sector, which is consistent with the government’s policy of giving
this sector the highest priority. The actual-to-approved ratio, however, is the low-
est in this sector (as is also true of the chemicals sector)—only 13 percent. The
ratio is highest in drugs and pharmaceuticals—92 percent. Econometric analysis
taking into account industry-specific characteristics and policies is needed to
explain such wide variation.9
It seems useful at this point to recap what has been covered so far in this chap-
ter. Suggestions by various countries, including India, concerning what invest-
ment rules should be permitted in the WTO have been summarized. India’s FDI
policy over time since independence has been reviewed, and various facts and
figures on FDI in India have been presented. The next step is to evaluate India’s
policies—and, more important, to determine what future policies may be war-
ranted. But before we get to that stage we need to have an understanding of the
benefits and costs, in terms of welfare, of FDI in general and of multilateral rules,
and of what has been found empirically. We begin with theory.
TABLE 7.4 Inward and Outward FDI Flows as a Percentage of GrossFixed Capital Formation, 1997–2000
Country 1997 1998 1999 2000
Brazil In 11.8 18.6 28.2 28.4Out 0.7 1.8 1.7 2.0
China In 14.6 12.9 11.3 10.5Out 0.8 0.8 0.5 0.2
India In 4 2.9 2.2 2.3Out 0.1 0.1 0.1 0.3
Korea, Rep. of In 1.7 5.7 8.3 7.1Out 2.7 5.0 3.7 3.8
Malaysia In 14.7 14.0 22.2 16.5Out 6.2 4.4 8.1 8.8
Mexico In 18.0 13.6 12.3 12.2Out 1.4 1.5 1.4 0.8
Thailand In 7.1 20.5 13.9 10.4Out 0.9 0.5 1.3 0.2
United Kingdom In 15.1 30.2 34.9 46.4Out 28.0 49.9 80.0 101.0
United States In 7.8 11.9 18.0 17.5Out 7.2 8.9 11.1 9.6
Source: UNCTAD 2002.
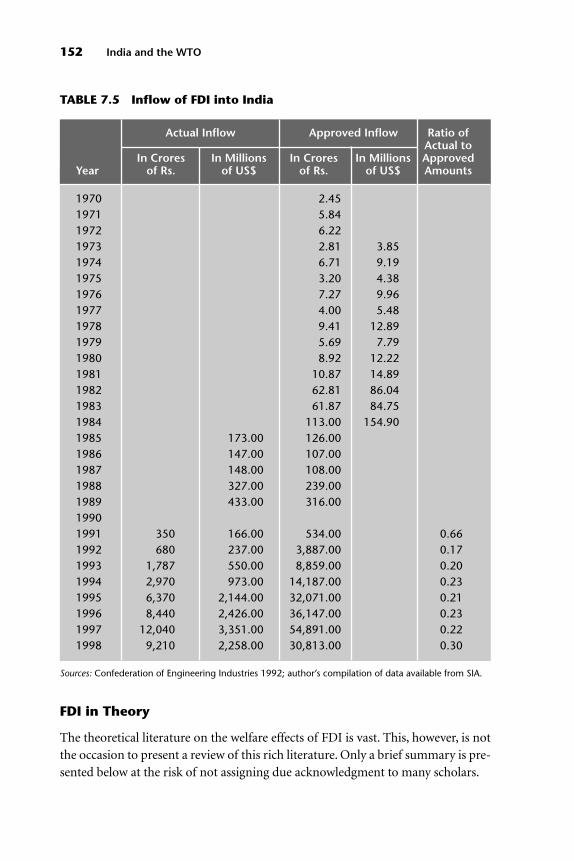
152 India and the WTO
FDI in Theory
The theoretical literature on the welfare effects of FDI is vast. This, however, is not
the occasion to present a review of this rich literature. Only a brief summary is pre-
sented below at the risk of not assigning due acknowledgment to many scholars.
TABLE 7.5 Inflow of FDI into India
Actual Inflow Approved Inflow Ratio of Actual to
In Crores In Millions In Crores In Millions ApprovedYear of Rs. of US$ of Rs. of US$ Amounts
1970 2.451971 5.841972 6.221973 2.81 3.851974 6.71 9.191975 3.20 4.381976 7.27 9.961977 4.00 5.481978 9.41 12.891979 5.69 7.791980 8.92 12.221981 10.87 14.891982 62.81 86.041983 61.87 84.751984 113.00 154.901985 173.00 126.001986 147.00 107.001987 148.00 108.001988 327.00 239.001989 433.00 316.0019901991 350 166.00 534.00 0.661992 680 237.00 3,887.00 0.171993 1,787 550.00 8,859.00 0.201994 2,970 973.00 14,187.00 0.231995 6,370 2,144.00 32,071.00 0.211996 8,440 2,426.00 36,147.00 0.231997 12,040 3,351.00 54,891.00 0.221998 9,210 2,258.00 30,813.00 0.30
Sources: Confederation of Engineering Industries 1992; author’s compilation of data available from SIA.

Benefits from Freer FDI
In the absence of any kind of distortions, the basic gains from FDI arise from its
expansionary effect on a country’s production possibility frontier (PPF) because
more capital as a primary factor of production is now available. As a consequence,
starting from a situation with a relatively restrictive regime of FDI, an increase in
FDI, given diminishing returns to capital, leaves more output net of repatriation.
The decrease in the return to capital with foreign capital at work can be seen as a
terms-of-trade gain as the country is importing capital.
The PPF can also shift out as FDI in capital and infrastructure goods as well as
services increases the aggregate supply/endowment of these inputs for production.
The preceding refers to sources of expansion of the PPF through market channels.
Probably a still greater benefit from FDI for a developing country stems from PPF
expansion by the technology-spillover effects associated with FDI. It works via
demonstration effects, labor turnover, and learning of superior technical and man-
agerial skills, for which arm’s-length trading is costly. It is also believed that FDI
from industrial countries brings in more environment-friendly technology and
hence would improve the environment in capital-importing developing countries.
TABLE 7.6 Sectorwise Breakdown of FDI in India, 1991–98 (in Crores of Rupees)
Ratio of Actual to
Actual Approved ApprovedSector Investment Investment Amounts
Infrastructure 10,898 86,341 0.13Services 4,475 17,964 0.25Drugs and pharmaceuticals 735 801 0.92Chemicals, not including fertilizers 3,473 27,418 0.13Food and food processing, including sugar 2,105 10,549 0.20Electrical equipment 3,931 9,427 0.42Other 8,893 28,573 0.31Total 34,510 181,073 0.19
Note: These figures do not take into account NRI investment because the sectoral allocations of suchinvestment are not available. Here, infrastructure includes fuel, telecommunications, transport, andcement; services includes consultancy, service (financial, banking, nonfinancial, hospitals and diagnostics,and others), hotel and tourism, and trading; food and food processing includes sugar, fermentationindustries, food processing industries, and vegetable oil and vanaspati. Other industries are defined assingle entries in the SIA publications.
Source: Author’s compilation of data available from SIA.
An Indian Perspective on WTO Rules on Foreign Direct Investment 153

Benefits from Multilateral Rules
The present international order of FDI activity is not prohibitively restrictive or
nearly so. However, at issue is whether we want more multilateral disciplines that
are binding across the board. There are at least four general benefits that may
accrue from multilateral rules. First, rules themselves imply FDI liberalization or
reforms by breaking any political inertia of discretion or “rent-keeping” inertia of
inaction. Second, rules provide further and “third-party” insurance to foreign
investors via implicit commitment, policy credibility, and reputation for liberal,
nondiscriminatory policy—in that incidence of deviation from commitments can
be challenged on a neutral ground like the WTO rather than in the courts of host
countries. Third, at present there are about 1,600-plus bilateral investment treaties
in the world economy. Multilateral rules under the WTO would substantially
reduce the transaction costs of abiding by multiple bilateral treaties and hence
would ensure greater efficiency. Fourth, rules can also be devised so as to deter
wasteful and costly competition in terms of providing subsidies by potential host
countries in attracting FDI.
Costs of Freer FDI
There is an extensive discussion in the “pure” theory of international trade and
investment on how, in the presence of distortions, foreign capital inflow may
lower welfare. For example, Brecher and Diaz-Alejandro (1977) argued that in a
tariff-distorted, small Heckscher-Ohlin economy, capital inflow would lower
welfare if the import-competing sector were capital intensive. As the economy is
small in world trade, the product-price ratio and hence the factor prices are
unchanged in such an economy. Thus an inflow of capital affects welfare only
through changes in tariff revenues. If the import-competing sector were capital
intensive, capital inflow would increase the output of this sector (by the
Rybczinski theorem) and hence tend to reduce the volume imported. This
would reduce tariff revenues (at any given level of positive tariff) and conse-
quently aggregate welfare. In a small, open economy with unemployment (a
result of distortion in the labor market), Batra (1986) has shown that the entry
of multinational firms in capital-intensive industries would reduce the econo-
mywide demand for labor and thereby exacerbate the problem of unemploy-
ment and lower total welfare. Similarly in the absence of effective competition
policy, FDI channeled through major multinational companies may lead to a
greater exercise of market power and hence result in loss of welfare in terms of
consumer surplus as well as domestic profits. Such arguments belong to the
generic theory of second best, which suggests that as long as there are some
154 India and the WTO
given distortions in an economy, attempts to minimize other distortions (i.e.,
encourage FDI) can adversely affect welfare.
In light of the theory of second best, the possible positive effects of TRIMs
on welfare can be seen as a cost of freer FDI. Consider, for example, the export
performance requirement in a tariff-ridden small economy (see Rodrik 1987).
Given that this requirement is binding, it induces more production in the
exportable sector and less in the importable sector—hence more imports and
more tariff revenues. This is a source of welfare gain as in Brecher and Diaz-
Alejandro (1977).
Probably the biggest concern about more FDI that is felt by less developed
countries involves market power. Most FDI is channeled through multinational
corporations (MNCs) that are powerful in the global market. The fear is that
when they get a foothold in a market they will wield considerable market power.
Furthermore, by driving out domestic firms through predatory practices, they can
even exert absolute monopoly power in the future.
FDI adversely affects domestic entrepreneurship and particularly infant indus-
tries. It can do so in two ways: directly through more competition and indirectly
by increasing the cost of scarce resources, for example, a domestic source of raw
material and finance. It is argued that FDI in cultural industries (such as music, or
rice for Japan, for that matter) may “pollute” a country’s unique culture.
MNCs have a global perspective in mind and care about their growth in the
global market. Hence they may use a particular host country just as a production
or distribution location. The growth of such a host nation may not be signifi-
cantly affected by the presence of FDI through MNCs.
There may be informational problems as well. Free entry to foreign markets
would help MNCs recycle their outdated technologies to uninformed and unsus-
pecting host countries. In other words, there may be technology dumping. On the
other side, because of their lack of information MNCs also may make wrong, inef-
ficient locational choices.
Inefficient competition in attracting FDI among potential host countries may
emerge, forcing host countries to offer tax holidays and thereby worsening the
budgetary position of developing countries.
International trade and FDI may be substitutes for each other. By inducing
international prices to converge, free international trade in goods would narrow
the differences in factor rewards (through product and factor-market linkages)
and would reduce the incentive for capital to move across countries. The reverse
argument also holds.
There is also the pollution haven hypothesis. FDI would encourage firms from
industrial countries to move their outdated, polluting plants to the “South.” This
would worsen the environment in the South as well as the global environment.
An Indian Perspective on WTO Rules on Foreign Direct Investment 155

FDI into skill-intensive sectors in the developing countries would increase the
relative demand for skilled workers and thereby raise the skilled–unskilled wage
gap. Thus the income distribution in these countries, presumably more unequal
than in industrial countries, would be further “worsened.”
Costs of Multilateral Rules
The cost of rules in policymaking generally lies in the lack of flexibility in the face
of new information. While a country is following some sort of prioritization,
given some information set, unanticipated changes may occur that require correc-
tive FDI policy in the short run for welfare improvement, but in the presence of
rules such corrections cannot be executed unilaterally and in time.
Furthermore, developing countries have offered particular reasons from their
perspectives as to why multilateral rules on FDI are not a good idea now. One
argument is that there are not many studies on the measurement of welfare gains
from FDI to the recipient countries. Another argument is that although there may
be potential gains from FDI, in a bargaining framework, further global liberaliza-
tion of such investment should be opposed until labor mobility (movement of
natural persons) is brought to the negotiation table as a quid pro quo.
Empirical Evidence about FDI
So much exists in theory. What does empirical evidence suggest? I have organized
various findings in two subsections. The first relates to FDI and growth in cross-
sectional studies and the second relates to empirical studies on FDI in India. Our
review, again, will be very brief but we will be more formal in terms of assigning
results to respective studies.
Empirical Studies on FDI and Growth and FDI
and Knowledge Spillover in Cross-Sectional Studies
Casual empiricism suggests that the FDI–growth link is not well established.
Korea and Taiwan, China, have done well without much emphasis on FDI.
China and Thailand have experienced high growth by resorting to high levels
of FDI. Sub-Saharan Africa has witnessed low FDI and low growth. Latin
American countries have also experienced relatively open FDI policy but with
modest growth. In technical terms the evidence on causality from FDI to growth
in cross-section studies is rather weak. Blomstrom, Lipsey, and Zejan (1994)
found that it runs more from growth to FDI than vice versa. De Mello (1997)
156 India and the WTO

An Indian Perspective on WTO Rules on Foreign Direct Investment 157
has suggested that perhaps causality should be studied in the context of country-
specific effects.
On the other hand, Borenszstein, de Gregorio, and Lee (1995) found that FDI
has a positive effect on domestic capital formation: a dollar increase in FDI results
in more than one dollar increase in total investment. It is interesting that the effect
of FDI on growth works through other variables. For example, the impact of the
education variable becomes greater in the presence of FDI. Hence, except for
causality tests, the general implication is that FDI contributes positively to eco-
nomic growth.
Eaton and Kortum (1995) found positive spillovers from foreign sources on the
economic growth of host countries. Positive spillover effects from the operation of
multinational firms in the host countries are apparent in Blomstrom, Kokko, and
Zejan (1994), Blomstrom and Persson (1983), and Schive (1990).10
With regard to the environment, the evidence on the pollution haven hypothe-
sis has been negligible or even negative. Mani and Wheeler (1997) found that, over
the period 1960–1995, pollution shifting from industrial to developing countries
has “not been a major phenomenon.” The study by OECD (1997) found that the
total investment flow into less developed countries in pollution-intensive sectors
was less in 1992 than in 1972.
Studies on India
Studies on India are limited in number. They can be divided into three categories:
those estimating the extent of foreign control in production, those concerned
with the effects of technology transfer in terms of purchase and spillover, and
those investigating the link of FDI to growth.
Foreign Control in Production This was studied by Kumar (1994) and later by
Athreye and Kapur (1999a). Foreign control is defined in terms of voting shares
owned by foreigners in a company. In Kumar (1994), a firm is considered to be
foreign controlled if 25 percent of its shares are held abroad. A somewhat different
definition is used by the RBI; there is foreign control if 25 percent of equity is held
by a single foreign investor or 40 percent of shares is held by a single foreign coun-
try. Using this definition over the sample period 1970 to 1990 Athreye and Kapur
(1999a) found that foreign control in the manufacturing sector rose from 1970 to
1976 and then fell gradually until 1990.
Technology Transfer For selected industries during the 1960s Deolalikar and
Evenson (1989) found that the flow of foreign technology had a positive effect on
158 India and the WTO
inventive activity (in terms of the number of Indian patents) in India. Basant and
Fikkert (1996) found that there is a high rate of return to Indian firms from tech-
nology purchased from outside. Research and development activity in India,
although quite small compared with industrial countries, is complementary to
technology purchase, and there are positive international spillover effects on the
productivity of Indian firms. Their sample period covers the early 1980s. Product
quality estimates of different firms in the Indian computer industry in the 1980s
and 1990s were examined by Das (1998), who found that foreign firms generally
offer better quality computers in the market.
The Linkage of FDI and Growth Aggregate growth effects of FDI—in terms of
causality tests—in the postliberalization era have been studied by Dua and
Rashid (1998). Using monthly data on actual FDI inflow and approvals, they dis-
covered no causality links between actual FDI and the growth rate of industrial
production (as a proxy for real gross domestic product [GDP]). But FDI
approvals Granger-cause industrial production. This is explained in terms of the
possible positive expectations that approvals may generate for business in general.
The lack of significant effect of the actual FDI flow, however, could result because
the FDI coming to the country in any particular month would affect the output
only after several months. In other words, with month as the unit of time, the stan-
dard lags taken in the causality test (t–1, t–2, t–3, and so forth) may not capture any
effect at all.
Keeping that in mind, I have done a simple regression analysis to find lagged
effects of (actual) FDI on industrial production. Taking available data from March
1999 backward until December 1994, I found a significant relationship when FDI
with a lag of five months is included; lags up to four months contribute very little.
The index of industrial production was first deseasonalized and then first-differ-
enced in logs (because the unit root hypothesis could not be rejected). The data
on FDI (measured in millions of U.S. dollars), however, were stationary and sub-
ject to seasonal correction only. (The results differed very little between seasonal-
ized and deseasonalized FDI data.) Hence the growth rate of industrial produc-
tion (IP) was regressed on FDI. The results are reported in table 7.7 with the
constant term, IP growth rate, at one-month lag and FDI at five-month lag as the
explanatory variables. This is, however, a very preliminary exercise. Other macro
effects of FDI need to be investigated in order to judge how robust the lagged
effects of FDI are.
On balance, then, if one were to make an overall judgment on the nature of
empirical conclusions with regard to the effects of FDI, it is positive.11 We now
argue that in principle the rationales behind FDI-restricting policies are rather
weak.

Limitations of Arguments against FDI
To be sure, no country, including India, is against FDI per se. It is a question of
whether to be more or less open to FDI, compared with the present system. Those
who support multilateral rules are championing the cause of even freer FDI.
Those who are not (e.g., India) support the status quo or even wish for a rollback
(TRIMs indefinitely). Hence “against FDI” must be interpreted as against freer
and more uniform and transparent policy intervention toward FDI than exists
currently.
We begin by noting that there is in principle a fundamental similarity between
the case for freer trade in goods and freer FDI. The central proposition of the the-
ory of international trade is that in a frictionless, distortion-free, global-market
economy, free trade is the best policy. But no economy in the world is free from
these problems. How is it then that the industrial and the developing countries
alike tend to support free trade in goods and services? Implicitly it amounts to
accepting two (sensible) principles of policy practice (PPPs):
1. Following the important works by Bhagwati, Ramaswami, and Srinivasan
(1969) and Bhagwati (1971), distortions should be handled by appropriate
policy instruments that most directly deal with the respective distortion. There
is thus no need to unnecessarily burden trade policy with “other” objectives.
An Indian Perspective on WTO Rules on Foreign Direct Investment 159
TABLE 7.7 FDI and the Growth Rate of Industrial Production in India from December 1994 to March 1999:Regression Results
Coefficient Standard error t-Statistic Probability
Constant −0.011328 0.008780 −1.290158 0.2037Industrial production (−1) −0.335726 0.136054 −2.467587 0.0176Foreign direct investment (−5) 8.12E–05 3.94E–05 2.061175 0.0452R2 0.199617 Mean dependent variable 0.004213Adjusted R2 0.163236 Standard deviation dependent 0.020904
variableStandard error of regression 0.019122 Akaike information criterion −5.014273Sum of squared residual 0.016088 Schwarz criterion −4.896178Log likelihood 120.8354 Durbin-Watson 1.895988
For example, tariffs cannot be justified on the grounds that they raise revenues
for the government. If revenues are scarce they should be mobilized more effi-
ciently through direct taxes than through trade taxes.
2. If there is no forceful theoretical support for welfare-enhancing effects of a pol-
icy intervention, the benefit of the doubt belongs to the market, not to policy
activism. That is, no intervention is the preferred choice.
The same PPPs should apply to FDI policy as well. Consider, for example, the
pollution haven hypothesis. Apart from the lack of empirical evidence, pollution
can be regulated more directly and effectively by setting appropriate pollution
standards. Restricting FDI to check pollution is clearly inefficient. In this light it
follows that the arguments against the free flow of FDI are rather weak.
Perhaps the single most important reason for the resistance toward a more
open FDI policy is the presumed market-power effect of MNCs. However, a more
open and transparent FDI policy would not invite just one MNC but many and
thereby would foster competition not only between domestic and foreign firms
but among MNCs themselves. Hence the scope to exercise market power will be
self-constraining. The Indian auto market is a highly visible example of this. If
there is evidence of predation, let this be handled by competition or antitrust pol-
icy. Lack of an effective institutional framework of competition policy should not
be taken as a refuge for imposing restrictions on FDI. A more open FDI policy
itself may indeed act as a catalyst toward the development of these institutions. In
any event the first PPP applies.
Crowding out or scaling down of domestic entrepreneurship is another con-
cern. Although such effects are true, it is equally true that downsizing of ineffi-
cient domestic firms improves rather than worsens welfare because, on one hand,
there would be rationalization and, on the other, consumers would have a spec-
trum of qualities among which to choose. Those domestic firms unable to
undertake technological innovation would be relegated to serve the lower end of
the market, whereas those who are willing and able to do so would serve, along
with the foreign firms, the high end of the market. The Indian auto market is
again a good example here. Moreover, through mergers and acquisitions and by
infusing new technology FDI can prevent some domestic industries from being
wiped out. Some recent research (Markusen and Venables 1999) also suggests
that FDI actually may encourage domestic entrepreneurship through favorable
linkage effects.
Similarly, apart from FDI encouraging domestic investment (as is seen empiri-
cally in some cases), a partial crowding out of domestic investment should not be
a concern. What should matter for welfare is the total volume of investment. Fur-
thermore, there is little rationale for rationing FDI because it may substitute for
160 India and the WTO
trade. In theory, perfect substitutability between trade in goods and factors is
based on the premises of factor-price equalization. Otherwise the differences in
factor prices tend to narrow as a result of free trade in goods, but they do not van-
ish. What remains generally true is that free trade in commodities reduces—not
eliminates—the incentive to engage in FDI. If so, this would make FDI a self-lim-
iting activity, endogenously determined by market forces. There is no valid reason
to restrict FDI just because it may restrict trade.
Consider technology dumping. It is a more probable occurrence in case of a
pure technology transfer than in the case of FDI because FDI, unlike a simple
technology transfer, involves more risk sharing by the technology-providing for-
eign firm, and so it is in the interest of MNCs to provide good technology. The
moral hazard problem in providing technology and intangible assets is solved
more efficiently with FDI than without. Put differently, FDI acts as insurance
against such dumping.
Foreign equity restrictions on joint ventures with an aim toward protecting
national interest or somehow containing market power seem misplaced, too.
Recent research has illustrated that the concept of joint venturing arises as a
response to moral hazard problems—in the provisions of inputs for which arm’s-
length transactions are very costly. Equity distribution is an efficiency parameter,
not a distributive one, so restricting foreign equity share (or for that matter domes-
tic equity share) reduces the joint economic surplus and lowers the welfare of the
foreign country and the host country (as shown in Das and Katayama 2002).
Multiple bidding for FDI by host countries through offers of tax breaks, tax
holidays, and other incentives is clearly inefficient. There is, however, some ration-
ale for tax holidays in a world of asymmetric information about the “fundamen-
tals” of a potential host country (Bond and Samuelson 1986), but in this age of the
information technology revolution, such informational problems are likely to
mitigate quickly over time. Hence competitive tax-advantage offers are dispensa-
ble. An FDI rules–based system would help eliminate these inefficiencies.
It is true that, compared with those on FDI, there are many more studies on
welfare gains from free trade in commodities. But most of them relate to indus-
trial countries. There are relatively few such studies on developing countries. Thus
when free trade in goods is acceptable in the absence of sufficient empirical esti-
mates, lack of adequate empirical studies on gains from FDI does not seem to be a
valid argument.
The argument for bunching FDI liberalization with labor mobility does not
seem to have much bite either as long as the industrial economies possess techno-
logical superiority and developing countries need foreign investment and tech-
nology to sustain a high-growth path. Given that nearly two-thirds of all world
trade is concentrated among industrial countries and huge volumes of foreign
An Indian Perspective on WTO Rules on Foreign Direct Investment 161
investment flow among them, the “threat point” of no capital and no labor mobil-
ity is much worse for the developing countries than for the industrial ones.
Turning to the environment, it is quite possible that FDI would increase pol-
lution (apart from the fact that studies to date show no such effects). But this has
to be weighed against the economic benefits from FDI. Recent research by Das
and Mehra (1999) showed that the benefits of FDI are likely to more than offset
the costs in terms of environmental deterioration and thus higher global welfare
results from FDI moving from North to South countries. The environment is a
legitimate concern, of course, but using FDI restrictions to check pollution is
inefficient.
With particular regard to TRIMs, both PPPs apply. If there is market imperfec-
tion in the form of market power, an effective competition policy is a more effi-
cient instrument to use than TRIMs. Second, the transitional period for retention
of tariff and nontariff barriers to trade would be over soon for many developing
countries, including India. Hence the scope of welfare-enhancing effects of
TRIMs is likely to be minimal at best.12
So far I have reviewed the possible negative efficiency effects of FDI. In regard
to distribution, recent research (Das 2002) has indicated that in the long run FDI
in skilled, labor-intensive sectors may not lead to more unequal distribution of
wages in a developing country. Assuming that, in addition to foreign firms,
domestic skilled workers (not unskilled workers) are potential entrepreneurs, an
increase in FDI activity would lead to a partial crowding out of domestic entre-
preneurs, thereby increasing the total pool of skilled workers for production and
lowering the relative wage. The not-so-obvious point is that such an effect is likely
to outweigh the initial positive impact on wage inequality.
Policy Recommendations for India
It is obvious that an inward-looking, domestic market–oriented growth strategy
has not been and would not be successful. An export-oriented, global-market
strategy with proper harnessing of modern technology is the ideal path to follow
for any country, including India, that aspires to be an economic force in the world.
There is already a realization of the benefit of that approach and a realization that
FDI is an important component of India’s overall growth strategy. All of this is
fine. But the problem lies in the unwillingness and resistance to embrace further
FDI reform and multilateral rules—especially the latter.
It is true that, unlike trade in goods and services, FDI is correctly viewed by both
industrial and developing countries as a more direct instrument of development
and growth. (Whether or how it is related to international trade is a subsidiary
issue.) And growth strategy should vary from country to country, depending on
162 India and the WTO
factor endowments, technology and so forth. Hence FDI policy ought to be coun-
try specific to some extent.
The key broad question here is, What kind of outward development strategy is
best suited for India? Is there a country that should serve as its role model? Policy-
makers and economists associated directly with policymaking in India generally are
quick to pinpoint differences between India and any other proposed model econ-
omy, but they offer no clear alternative strategy.13 I believe that in terms of its basic
characteristics the Chinese economy is most similar to the characteristics of India.
Because the Chinese real growth rate has averaged better than that of India and FDI
has played a very prominent role in the recent Chinese fast-track development expe-
rience, I recommend that India adopt a very proactive, liberal approach to FDI.
The next question then concerns at which sectors FDI should be targeted. It is
evident that infrastructural problems continue to be India’s biggest bottleneck, and
this is where FDI is most wanting. On the occasion of a World Bank–sponsored
conference on India in Paris in 1998, Yashwant Sinha, then India’s finance minister,
observed that India needed US$25 billion per year for investment in its infrastruc-
ture sector.14 The sectoral breakdown of GDP shows that 5 percent to 6 percent of
India’s GDP goes toward investment in this sector. For the year 1999–2000 this
translates into $21 billion (at $1 = Rs. 45). Hence there is a shortfall of $4 billion in
investment capital per year. Given the fiscal deficit and the relative inefficiency of
public sector investments, the shortfall has to be financed by private investment.
Because of the nature of technology, the scale of operation, and the risk involved,
however, it is unrealistic to expect domestic sources to fill the gap. Thus FDI
remains the only viable option for a rapid growth of this key sector in India.
The next and almost equally important target area should be India’s export
sector. In a world of free trade India must not merely specialize in the primary sec-
tor in which it has had comparative advantage traditionally. The aim should be to
develop a new base of comparative advantage—a niche—in the manufacturing
and services sector (including software). This is where the crucial role of FDI
enters. Rather than attempting to build a diversified, efficient, growing, and sus-
tained export-market base from scratch, it would be wise to encourage multina-
tional corporations, which have established global networks, to enter and build
India’s export base in the manufacturing and high-tech sectors. Again this is simi-
lar to the Chinese model.15
It is important to note that prioritization has been the hallmark of Indian plan-
ning. But during the “planning era,” it meant having a complex and heterogeneous
system of regulations. Breaking away from this legacy has been rather slow. The
current FDI policy is no doubt much more liberal in many aspects than that of the
past, but it still entails a long and varying list of positive and negative regulations—
what can or cannot be done—across different sectors. Those regulations still smack
An Indian Perspective on WTO Rules on Foreign Direct Investment 163
of complexity and heavy-handed discretion. There remains a lack of adequate
understanding that international investors weigh their current rate of return from
investment opportunities in competing host countries—historical progression
matters little in that calculation. Reform should aim for simplicity, for example,
removing many arbitrarily set caps on foreign equity in different sectors so as to
make the rate of return for international investors more attractive than their other
options.
Danger still persists with regard to any valid argument for prioritization inso-
far as it allows costly discretion to last long. A long-term timetable must be set and
preparations made for removing prioritization schemes. This is where the virtues
of multilateral rules come in. All four merits of multilateral rules discussed in the
third section above apply to India. There are examples already in India of circum-
stances in which liberalization has been introduced or quickened precisely
because of WTO obligations, for example, the amendment of the Patent Act of 1970.
The same would be true for FDI reforms. Furthermore—and quite important—as
we have seen, there is a yawning gap between FDI approvals and actual inflow in
India. Since liberalization in 1991, the ratio of actual FDI to FDI approvals is no
more than 25 percent! It should be kept in mind that there was an absolute decline
in FDI into India from 1998 to 2000, despite the facts that India was largely
immune from the “Asian crisis” and that FDI into a crisis-stricken country like
Thailand increased during that period. It is heartening that FDI into India picked
up in 2001. But the variability probably indicates the uncertainty in the minds of
international investors about the returns to their investments in India. Further
assurance and security to foreign investors are needed and can be obtained from
WTO rules. Moreover, multilateral rules limiting subsidies would help India
attract FDI without having to offer a tax holiday, as is currently being offered in
the power sector or in 100 percent export units, for example.
Between 1995 and 2001, India concluded bilateral investment treaties (BITs)
with 41 countries.16 A set of multilateral rules will simplify and streamline the
numerous procedures and provisions and therefore should reduce the transaction
costs for India in dealing with international investors and for international
investors in their dealing with India.
More concretely, India should support a design of conduct codes on the MFN
principle, aiming at gradual, time-bound removal of restrictions on FDI—
whether or not these are in the form of TRIMs—with the proviso that any alleged
deviation from its commitments may be contestable in the dispute-settlement
process. India also should stipulate strictly defined prioritization deadlines for dif-
ferent developing countries. A safeguard provision must be included, but only as a
well-defined temporary deviation from free foreign entry and only on grounds of
industry-specific ills, not macro problems.17
164 India and the WTO

Overall, in my view, there is a strong case for simplicity, commitment, and repu-
tation building, all of which are possible only through the adoption of international
rules. It is high time to shed the notion that the drive for comprehensive liberaliza-
tion has to wait until industrial countries do it first, or until some specified number
of years have elapsed.
In closing, I must draw attention to the point that these recommendations are
based on the two PPPs outlined earlier. For example, they presume the strength-
ening of antitrust legislation and enforcement. Lack of such institutional arrange-
ments has been offered as an excuse for too long in justifying discretionary, dis-
tortionary, and essentially arbitrary interventions in different spheres of economic
activity. In turn, such interventions have formed the basis for the lack of collective
effort to build procompetitive, effective institutions. This is a kind of “prisoner’s
dilemma”—in a somewhat different sense than usual—that has led to an equilib-
rium in which institutional failures and distortionary interventions prevail in a
developing country like India. Multilateral rules on FDI are a potent instrument
to break this dilemma.18
Endnotes
1. Since 2000 the world volume of FDI (both inflow and outflow) has declined, as the global econ-
omy has been in recession.
2. Indonesia was targeted because its policy came into existence after the TRIMs agreement was
reached.
3. This point was clarified for me by Aaditya Mattoo.
4. The other two are trade and competition policy and trade and government procurement.
5. During the Seattle meetings, however, the EU seemed to tone down its demand for a compre-
hensive multilateral rules system.
6. Kumar (1994) actually took the whole period from independence to 1967 as this era.
7. It is interesting that India went to a highly regulated, fixed exchange-rate system when the
global economy abandoned the Bretton Woods fixed-exchange rate system in 1973.
8. For early years until the 1980s there is probably a minor difference between the approval
amount and the actual inflow.
9. Note that the overall ratio of 19 percent is not entirely consistent with table 7.5. This is probably
because the sectoral breakdown of investments by nonresident Indians is not available and hence not
included in table 7.6.
10. Aitken, Hanson, and Harrison (1997) is an exception.
11. This conclusion is borne out also by Agrawal’s econometric research in Chapter 6 of this volume.
12. From the perspective of MNCs that face these TRIMs, Hoekman and Saggi (1999) cited survey
results showing that only 6 percent of foreign affiliates of U.S. firms felt constrained by TRIMs. Thus
TRIMs are often not binding. If so, such redundancy should be eliminated.
13. This partly explains a lack of clear development strategy in India even now.
14. For details, see www.worldbank.org (countries and regions; India; news and events; and features).
15. There are two other priority areas that are already recognized by the government, namely, the
general services sectors (e.g., financial and insurance industries) and the agricultural input sector (e.g.,
machinery, chemicals, and fertilizers for agriculture).
16. The source is the UNCTAD BIT/DTT database.
An Indian Perspective on WTO Rules on Foreign Direct Investment 165
17. India’s dispute with the United States on the length of the transition period to keep quantity
restrictions on grounds of external-payments difficulties and the WTO ruling in favor of the United
States suggest that such a provision may be ineffective anyway.
18. Agrawal offers somewhat more guarded recommendations for India’s investment policies in
Chapter 6 of this volume.
References
The word “processed” describes informally produced works that may not be available commonly
through libraries.
Aitken, Brian, Gordon H. Hanson, and Ann E. Harrison. 1997.“Spillovers, Foreign Investment, and
Export Behavior.” Journal of International Economics 43: 103–32.
Athreye, Suma S., and Sandeep Kapur. 1999a. “Foreign Controlled Firms in Indian Manufacturing:
Long-Term Trends.”Working Paper. Manchester School of Management and Birkbeck College, Manchester,
U.K.
———. 1999b. “Private Foreign Investment in India: Pain or Panacea?” Working Paper. Manchester
School of Management and Birkbeck College, Manchester, U.K.
Basant, Rakesh, and Brian Fikkert. 1996. “The Effects of R&D, Foreign Technology Purchase, and
Domestic and International Spillovers on Productivity in Indian Firms.” Review of Economics and Sta-
tistics 78: 187–99.
Batra, Ravi N. 1986. “A General Equilibrium Model of Multinational Corporations in Developing
Economies.” Oxford Economic Papers 38: 342–53.
Bhagwati, Jagdish. 1971. “The Generalized Theory of Distortions and Welfare.” In Jagdish Bhagwati,
Ronald W. Jones, Robert A. Mundell, and Jaraslov Vanek, eds., Trade, Balance of Payments, and Growth:
Papers in International Economics in Honor of Charles P. Kindleberger. Cambridge, Mass.: MIT Press.
Bhagwati, Jagdish, V. K. Ramaswami, and T. N. Srinivasan. 1969. “Domestic Distortions, Tariffs, and
the Theory of Optimum Subsidy: Some Further Results.” Journal of Political Economy 77: 1005–13.
Bhattacharya, B., and S. Palaha. 1996. Policy Impediments to Trade and FDI in India. New Delhi:
Wheeler Publishing for Indian Institute of Foreign Trade.
Blomstrom, Magnus, Ari Kokko, and Mario Zejan. 1994. “Host Country Competition and Tech-
nology Transfer by Multinationals.” Weltwirtschaftliches Archiv 130: 521–33.
Blomstrom, Magnus, Robert Lipsey, and Mario Zejan. 1994. “What Explains Developing Country
Growth?” Working Paper W-4132. National Bureau of Economic Research, Cambridge, Mass.
Blomstrom, Magnus, and Hakan Persson. 1983. “Foreign Investment and Spillover Efficiency in an
Underdeveloped Economy: Evidence from the Mexican Manufacturing Industry.” World Development
11: 493–501.
Bond, Eric, and Larry Samuelson. 1986. “Tax Holidays as Signals.” American Economic Review 76:
820–26.
Borenszstein, Eduardo, Jose de Gregorio, and Jong-Wha Lee. 1995. “How Does Foreign Investment
Affect Economic Growth?” Working Paper 5057. National Bureau of Economic Research, Cambridge,
Mass.
Brecher, Richard A., and C. F. Diaz-Alejandro. 1977. “Tariffs, Foreign Capital and Immiserizing
Growth.” Journal of International Economics 7: 317–22.
Confederation of Engineering Industries. 1992. “The Role of Foreign Direct Investment in Eco-
nomic Development: Comparison of Selected Asian Countries.” In Foreign Direct Investment and Tech-
nology Transfer in India. Washington, D.C.: United Nations.
Das, Sanghamitra. 1998. “Foreign Versus Domestic Technology, Private Versus Public Ownership
and Product Quality.” Journal of Quantitative Economics 14: 97–121.
Das, Satya P. 2002. “Foreign Direct Investment and Relative Wage in a Developing Economy.” Jour-
nal of Development Economics 67: 55–77.
166 India and the WTO
Das, Satya P., and Seichi Katayama. 2002. “International Joint Venture and Host Country Policies.”
Japanese Economic Review.
Das, Satya P. and Meeta Mehra. 1999. “North-South Capital Movement and Global Environment.”
Indian Statistical Institute, New Delhi. Processed.
De Mello, Jr., Luiz R. 1997. “Foreign Direct Investment in Developing Countries and Growth: A
Selective Survey.” Journal of Development Studies 34: 1–34.
Deolalikar, Anil, and Robert E. Evenson. 1989. “Technology Production and Technology Purchase
in Indian Industry: An Econometric Analysis.” Review of Economics and Statistics 71: 689–92.
Drabek, Zdenek. 1998. “A Multilateral Agreement on Investment: Convincing the Skeptics.” Work-
ing Paper ERAD-98–05. Economic Research and Analysis Division, World Trade Organization, June.
Dua, Pami, and Aneesa I. Rashid. 1998. “Foreign Direct Investment and Economic Activity in
India.” Indian Economic Review 33: 153–68.
Eaton, Jonathan, and Mark Gersovitz. 1984. “A Theory of Expropriation and Deviation from Per-
fect Capital Mobility.” Economic Journal 94: 16–40.
Eaton, Jonathan, and S. Kortum. 1995. “Engines of Growth: Domestic and Foreign Sources of
Innovation.” Working Paper 5207. National Bureau of Economic Research, Cambridge, Mass.
Hoekman, Bernard, and Kamal Saggi. 1999. “Multilateral Disciplines for Investment-Related Poli-
cies?” Paper presented at the Conference on Global Regionalism, February, Rome.
Kidron, Michael. 1965. Foreign Investment in India. Oxford: Oxford University Press.
Kumar, Nagesh. 1994. Multinational Enterprises and Industrial Organization: The Case of India,
2d ed. New Delhi: Saga Publications.
Mani, Muthukumara, and David Wheeler. 1999. “In Search of Pollution Havens? Dirty Industry in
the World Economy, 1960–1995.” Policy Research Working Paper. World Bank, Policy Research
Department, Washington, D.C.
Markusen, James R., and Anthony Venables. 1999. “Foreign Direct Investment as a Catalyst for
Industrial Development.” European Economic Review 43: 335–56.
OECD (Organisation for Economic Co-operation and Development). 1997. “Foreign Investment
and the Environment: An Overview of the Literature.” Report of the Negotiating Group on the Multi-
lateral Agreement on Investment. December.
Rodrik, Dani. 1987. “The Economics of Export-Performance Requirements.” Quarterly Journal of
Economics 102: 633–50.
UNCTAD (United Nations Conference on Trade and Development). 2002. World Investment
Report 2002. Division on Investment, Technology and Enterprise Development.
Yu, Eden S. H., and C-C. Chao. 1998.“On Investment Measures and Trade.” The World Economy 21:
549–61.
An Indian Perspective on WTO Rules on Foreign Direct Investment 167


169
8
India as User and Creator of
Intellectual Property:The Challenges
Post-Doha
Arvind Subramanian
For India, no aspect of the Uruguay Round has engendered as much concern,
acrimonious debate, and vitriol as TRIPS (trade-related intellectual prop-
erty rights). With some exaggeration, it came to symbolize all that was
wrong with the World Trade Organization (WTO), as well as multilateral engage-
ment, greedy multinationals, and even globalization as a whole. As with most
impassioned rhetoric, although there was some misunderstanding and misrepre-
sentation, an essential kernel of truth underlay the rhetoric. On balance, the
TRIPS agreement on its own will impose welfare costs on India, at least in the key
pharmaceuticals sector.1
Today, of course, the mood on intellectual property (IP) is vastly different. At
Seattle the presence of the IP lobby was token and concerned more with prevent-
ing serious backsliding on TRIPS than with advancing a new IP agenda. So the
good news about TRIPS for India is that in the near future, external pressure on IP
issues is going to be minimal. This is so for four reasons.
First, there is the strong influence of civil society groups within industrial
countries championing causes that can be argued to be at odds with IP protection.
For example, the sanctity of human and animal life is perceived to be at variance
with efforts to patent biotechnological inventions, and technologies such as the
terminator gene are felt to run counter to environmental protection and the
preservation of biodiversity.

Second, there is the inevitable intellectual/ideological backlash to the headlong
embrace of free markets associated with the last 10–15 years. As the pendulum
swings back, there is a greater focus now on the abuse of IP protection and a cor-
responding emphasis on competition and contestability. The recent IP-related
cases in the United States involving the prosecution of Microsoft, Intel, and the
class action suit against Monsanto exemplify this new climate.
Third, private sector pressure in IP-related industries has diminished in the last
few years, reflecting the success of the Uruguay Round. Many of the key commer-
cial issues, at least the big-ticket items such as pharmaceuticals and chemicals,
were resolved in TRIPS to the broad satisfaction of IP-related companies.
Although issues and concerns remain, they are not of the same order of magni-
tude as those that existed prior to the Uruguay Round.
Finally, developing countries have successfully conveyed the sense that the
Uruguay Round was imbalanced in its outcome, with TRIPS contributing criti-
cally to that imbalance. It would simply be too difficult now to force developing
countries to swallow more of the TRIPS pill.
On the other hand, the more sobering news is that many challenges on intel-
lectual property lie ahead for India and they will need to be addressed, even
without the external pressure. The Doha declaration can be read as a clear signal
that any pressure for increasing levels of IP protection around the world is
unlikely in the foreseeable future. And in the case of pharmaceuticals, the decla-
ration arguably can be seen as a political reaffirmation that TRIPS can be used
flexibly by developing countries to mitigate the impact of IP protection without
eliciting pressure—bilateral or through the WTO dispute settlement process—
from industrial-country trading partners.
The next phase of issues is going to differ from the previous one in one key
respect. In the past, India’s main task in IP was defensive: to resist external pres-
sure. Although obviously difficult, given the magnitude of the pressure, it was
easy to know what had to be done. Now, however, India has “to do” rather than
“not do,” which entails its own set of challenges. These challenges affect India in
each of its locations on the knowledge-creation spectrum: as net user, potential
net creator, and net creator. This chapter argues that the challenges are fivefold:
1. To use TRIPS as a mechanism for enforcing India’s market access rights in the
WTO
2. To develop policies and mechanisms that serve to mitigate the most egregious
effects of the TRIPS agreement
3. To seek changes in the TRIPS agreement that allow India to contribute con-
structively and significantly to public health crises in developing countries,
such as the AIDS crisis in Africa
170 India and the WTO

4. To identify where India’s interests lie in relation to the new technologies (plants,
biotechnology) and appropriately adapt intellectual property rights (IPR) legis-
lation as well as complementary institutions that would allow the benefits of
those technologies to be harnessed while minimizing attendant risks
5. To create workable institutions domestically that protect intellectual property
and resources created in India and would serve as a basis for seeking their repli-
cation internationally.
With a few exceptions, those challenges will be domestic and will need to be
met constructively. In this chapter, suggestions are offered on how this might be
accomplished in some areas, but in other areas more questions are raised than
are answered.
The chapter is organized as follows. The next section elaborates a proposal on
the use of TRIPS obligations as an enforcement mechanism. The third section
offers suggestions on how domestic policies need to be adapted to cope with the
TRIPS agreement. The fourth section describes how TRIPS rules must be changed
so that Indian companies can provide affordable drugs to countries that experi-
ence public health crises such as the AIDS epidemic afflicting Africa. The fifth sec-
tion poses some questions that need to be answered before arriving at policy posi-
tions in relation to the new technologies and it draws attention to the regulatory
challenges. Issues related to IP created in India are discussed next. The seventh
section addresses certain issues that have elicited strong positions in India, but
that should be spared time and effort because they are not of any real significance
for India. Section eight presents some data on patenting activity by developing
countries that shed light on India’s prospects for increasing inventive activity.
TRIPS as an Enforcement Device2
There are widespread fears that the quantitative restrictions imposed on textiles
and clothing products by industrial countries will not be eliminated by 2005, as
required by the Uruguay Round Agreement on Textiles and Clothing (ATC). The
stakes are high for India. Given the right domestic policy environment, India
stands to gain from the elimination of the quotas or to lose if there is backtracking
by trading partners. Does India have the means to ensure compliance with com-
mitments or must the country resign itself to ineffectiveness, believing outcomes
are beyond its power to influence?
I believe that India does have the means to ensure compliance, but the country
must change its draft-patent legislation to allow for retaliation in TRIPS for non-
compliance by partner countries in areas affecting India’s exporting interests. As I
demonstrate below, if designed with care such retaliation can be feasible, effective,
India as User and Creator of Intellectual Property 171

and legal. It is noteworthy that recently Ecuador has requested and been granted
authorization by the WTO to retaliate against the European Union (EU) in the
area of services and IP in the controversial bananas dispute.
Why TRIPS Is a Good Retaliatory Weapon
An effective retaliatory action must possess two features: it must inflict loss or
pain swiftly on the party being retaliated against, and to be credible it must be
beneficial to the country taking the action. Does retaliation through TRIPS satisfy
those two conditions?
Effectiveness India has undertaken serious commitments on TRIPS from
which large, multinational corporations based in industrial countries stand to
benefit enormously. For example, the requirement to grant patent protection for
pharmaceutical products will begin to reap profits for large, European and U.S.
research-based companies in the early years of the new millennium as the first
protected products come onto the market. Axiomatically, withdrawing TRIPS
benefits would be costly and painful for them. Calculations by Subramanian
(1995) and Watal (1998) have shown that the benefits of TRIPS commitments to
large pharmaceutical producers alone could be in the millions of dollars. The first
condition of retaliation is therefore satisfied.
Credibility So too is the second condition, namely, that retaliation will actually
make the retaliating country better off in welfare terms. Support for this proposition
comes from the many analyses showing that, under most circumstances, higher IP
protection accorded by India makes it worse off.3 Conversely, withdrawing TRIPS
commitments, or reducing the strength of IP protection, must make India better
off.4 This lends credibility to the threat of retaliation. It must be noted, however,
that for this proposition to hold, the withdrawal of TRIPS benefits must be accom-
panied by measures to ensure alternative sources of supply to the market—supply
that had hitherto been precluded by the IP protection (see below).
Targeting, Proportionality, and Pointedness In relation to the first condition
of inflicting pain, TRIPS also possesses other desirable properties. First, the retal-
iatory action can target the noncompliant partner country. If, for instance, the
European Union fails to eliminate a textile quota affecting India, the Indian
authorities can target IP rights granted to EU nationals as the objects of retalia-
tory action. Second, the principle of proportionality—that the retaliatory action
should be commensurate with the offending action—can be respected. The vari-
ables for achieving proportionality would be how many IP rights owners to affect
172 India and the WTO

and for how long. The third really compelling advantage of such retaliatory action
is its ability to create pressure on noncomplying constituents to revert to compli-
ance with WTO obligations. A typical process of political economy following the
threat of retaliatory action would be as follows. Say India threatens nonacceptance
of the patent applications of Pfizer and others in retaliation against U.S. textile
quotas not being removed as scheduled; Pfizer and others would then have a very
strong incentive to lobby the politicians supporting the textile industry and force
remedial action. The more pointed the retaliatory action, the greater the incentive
for the affected party to take remedial action—and that renders TRIPS an effective
retaliatory instrument.
Difficulties with TRIPS as a Retaliatory Weapon
Four difficulties present themselves: the private nature of rights, the exclusivity of
the rights conferred, the possible constraints imposed by WTO dispute settlement
rules, and the possible deterrence of foreign direct investment (FDI).
The Private Nature of Rights Although it is possible to retaliate by abrogation
of IP rights, the tactic has problems because there are crucial differences between
conventional retaliation in goods and retaliation in intellectual property. Intellec-
tual property rights are private rights justiciable domestically in the country
granting them. Once the rights have been conferred through domestic legislation
and pursuant to an act of parliament, their withdrawal can be challenged as illegal
or unconstitutional by the affected parties in the domestic courts. On the other
hand, when tariffs are raised in retaliation, the affected foreign supplier has no
direct right that he can challenge in the retaliating country’s courts. Raising a tariff
in most countries can be done through an act of the executive. Private IP rights
granted through legislation cannot so easily be withdrawn by the executive.
Exclusivity of Rights A practical complication arises when retaliating in TRIPS:
benefits will accrue to the retaliating country only if alternative sources of supply
quickly substitute for the product whose patent right has been withdrawn. Thus,
the retaliation must be such as to ensure quick alternative supplies to the market
that will dilute or eliminate the legal monopoly granted. Another complication is
that the retaliatory action must not create uncertainty for the alternative suppli-
ers. For example, if the retaliatory action has to be reversed because partner coun-
tries come back into compliance, then WTO rules would require the restoration of
IP rights. This would mean that alternative suppliers would have to cease produc-
tion, and that may cause such uncertainty that alternative suppliers would not
enter the market in the first place.
India as User and Creator of Intellectual Property 173

WTO Rules on Cross-Retaliation Do WTO rules allow cross-retaliation (for
example, TRIPS for textiles)?5 The WTO Dispute Settlement Understanding
(DSU) deals with compensation and the suspension of concessions in Article 22.
It lays down a sequential procedure for cross-retaliation, which can only be
resorted to if within-sector retaliation is not feasible or practicable.
The issue is whether such procedures could unduly circumscribe the use of
TRIPS as retaliation when partner-country infringements are in goods. This
depends very much on the interpretation of what is deemed “effective” and “prac-
ticable.” On both criteria, especially the second, complainants in developing coun-
tries can reasonably argue that retaliating in the same sector—say, other goods for
a textiles-related dispute—is ineffective because of the size of the market; more-
over, such action would amount to inflicting economic harm on themselves.
Hence, easy recourse to welfare-improving retaliation as in TRIPS should be
allowed. The outcome of the arbitration requested by the EU against the authori-
zation granted by the Dispute Settlement Body (DSB) to Ecuador allowing retali-
ation under the General Agreement on Trade in Services (GATS) and TRIPS in the
bananas dispute would be interesting to set the tone for the future use of such
cross-retaliation. If the arbitration comes out against Ecuador on this issue, India
should seriously consider options for renegotiating the DSU in this regard.6
Deterring Foreign Direct Investment The concern exists that the possibility of
retaliation will deter FDI. However, as long as the legislation is carefully drafted to
spell out the exact circumstances for retaliation and its withdrawal and is consis-
tent with international rules, FDI need not be affected. The legislation and its
judicious implementation can reassure investors that India is not intent on expro-
priating foreign property, but is merely seeking to enforce its rights in a manner
that is internationally sanctioned.7
Design of Retaliation
The difficulties described above are not insuperable. India’s draft-patent legisla-
tion can be carefully designed to ensure that the difficulties are addressed or
overcome.
The Private Nature of Rights The fact that IP rights are private rights conferred
under domestic law requires that their revocation—partial or complete (discussed
below)—must also be built into the law, particularly in countries where interna-
tional law is not self-executing. India’s domestic legislation implementing the
TRIPS agreement must clearly specify that the country’s executive reserves the
right to revoke or dilute these rights in the event that partner countries are found
174 India and the WTO

to be noncompliant with commitments that affect India’s interests. The retaliation
provisions should not engender the perception of India as a renegade state, acting
outside the pale of reason. Rather, they should be broadly consistent with interna-
tional trading rules, which will ensure their good standing in the international
arena and confer legitimacy on the retaliatory actions if they ever are used.
Exclusivity of Rights What form should retaliatory action take, considering the
problems arising from the exclusive nature of rights that are conferred? It is
important to note that retaliation merely by delaying the grant of the patent will
not satisfy the first principle of retaliation—inflicting harm on the affected party.
In the case of pharmaceuticals, for example, delaying a patent grant may not
reduce the effective economic life of the patent because regulatory approval is typ-
ically obtained long after the patent is granted. Several feasible options present
themselves.
First, retaliatory action can include the suspension of acceptance of patent or
design applications from the targeted country for the time of noncompliance.
However, nonacceptance of applications must not result in loss of priority rights
because the punitive measure would result in a loss of IP rights over the entire
duration of the right, and that action may not be proportional to the nullification
and impairment for which compensation is sought.
Second, retaliatory action could take the form of awarding compulsory
licenses. The legislation could clearly specify that they will be granted in cases
where foreign countries do not comply with WTO obligations affecting India. In
granting such licenses, the conditions that would normally be applied to them,
specified in Article 31 of TRIPS, need not be respected. Clearly, if such compul-
sory licenses were granted in pharmaceuticals or chemicals, marketing approval
for these products would also need to be granted expeditiously.
Another possibility is for the government to choose products that are reaching
the end of their patent life and to shorten or terminate their protection so that
competitors can quickly enter the market. In these cases, the problem of reversal
of the retaliatory action would not arise because the patent may expire by the time
the dispute is settled. Yet another possibility is to target copyrights and trademarks
where copying is swift and easy.
WTO Consistency The language on retaliation in domestic legislation should be
carefully drafted to ensure that the discretion to use or authorize retaliation is typ-
ically exercised only after the multilateral dispute-settlement process has worked
its way through the dispute and has decided in favor of the developing country. If
it is further specified that this discretion can only be exercised after explicit
authorization is granted by the DSB, retaliation would be strictly WTO consistent.
India as User and Creator of Intellectual Property 175

Of course, domestic legislation need not preclude entirely the possibility of
retaliatory action where partner countries are so egregiously in violation of their
commitments that retaliatory action would be warranted even in the absence of
explicit authorization by the WTO DSB. The kind of situation envisaged here
resembles that of the EU in the banana dispute. Noncompliance has been so pro-
tracted and the balance of legitimacy so overwhelmingly against the EU that it is
hard to imagine retaliatory action being seriously questioned in the WTO.
If the arguments made about the effectiveness of such retaliatory action are
right, its threat—its very presence in domestic legislation—could lead to improved
compliance by industrial countries that would typically be the targets of such
action. The threat may seldom have to be converted into a reality.
One obstacle to effective implementation of such retaliation could be the
hurdles implicit in the procedures on cross-retaliation specified in WTO dispute-
settlement rules. It may be necessary to clarify the rules to ensure that easy access
to cross-retaliation is permitted. Of course I would strenuously insist that such
clarification is unnecessary because the rules, particularly the “practicable” and
“effective” conditions, would permit a case to be made in favor of easy recourse to
retaliation in TRIPS.8
Developing Domestic Policy Instruments and Institutions
One of the key challenges of TRIPS will be to develop domestic policies and insti-
tutions so that the benefits from IP protection can be maximized and the potential
costs minimized. The policies and institutions relate to a number of areas.
Coping with TRIPS: Compulsory Licensing
and Competition Policy
As mentioned above, TRIPS will impose costs, at least in the pharmaceutical sector.
Sometime around 2005, when the first patented products come onto the market,
prices of patented drugs will be higher than they otherwise would have been by
margins that are uncertain but nevertheless positive. How should India cope?
The two most important policy instruments available to developing countries
to mitigate some of the effects of the high levels of patent protection are compul-
sory licensing and competition policies. In principle, the flexibility associated with
compulsory licensing can be exploited to dilute some of the effects of patent pro-
tection. This flexibility comes in two forms. First, countries are virtually unre-
stricted in the circumstances under which they can grant compulsory licenses.9
Second, while a number of conditions need to be fulfilled when these licenses are
granted, there is sufficient discretion available to national authorities to meet
176 India and the WTO

these conditions while diluting the monopolistic impact of the proprietary pro-
tection granted in the first place (Watal 1998).
From a TRIPS perspective, the advantages of deploying competition policy are
twofold. First, there is a wide degree of latitude in determining the optimal degree
of protection that balances the need to foster innovation while ensuring technolog-
ical diffusion. And it is understood, even in industrial countries, that this balance—
often blurred and always shifting—is determined by the joint action of IP rights
and competition policies. Put crudely, the standards set for anticompetitive prac-
tices can dilute the effects of IP rights protection without running foul of the min-
imum standards laid out in the TRIPS agreement. For example, what constitutes
abusive pricing is a question with a wide variety of answers. India can exploit this
latitude through enactment of competition policies and the mechanisms to
implement them.10
The second advantage of using competition policies follows from the language
of the TRIPS agreement. In two key respects that could be usefully harnessed by
developing countries, there is even greater flexibility in the use of compulsory
licenses when they are granted to remedy anticompetitive practices. When com-
pulsory licenses are used to remedy anticompetitive practices, the TRIPS agree-
ment provides that (a) no case must be made that the patentee was unwilling to
license the patent on reasonable commercial terms as a precondition for granting
the compulsory license, and (b) the principle that remuneration for the compul-
sory license should be “adequate” need not be respected.
In the light of the above information, two key tasks face India. First, the coun-
try needs to strengthen the patent law and implementation apparatus so that
India is able to use compulsory licensing effectively.11 A number of specific ques-
tions must be answered in creating an effective system of compulsory licensing.
What guidelines need to be provided so that the minimum procedures that TRIPS
requires—making efforts to obtain a voluntary license—are met? Is it enough if
the potential compulsory licensee writes a letter to the patent holder seeking a
voluntary license or must a minimum period of delay be allowed for a response?
How long should such a period be? TRIPS allows enough discretion for India to
write these guidelines in a way that can make the process efficient, but these
guidelines must be elaborated and enacted expeditiously.
Another important question relates to the number of compulsory licenses that
are awarded. There should be a presumption in favor of having more than one
compulsory licensee to ensure a more competitive market outcome. How will the
licensees be chosen and by whom? What expertise and market information will the
granting authority need to have before making decisions on compulsory licenses?
How will the royalty payment be determined? Article 31 (h) of TRIPS makes clear
that royalty rates should be conditioned by the value of the compulsory license
India as User and Creator of Intellectual Property 177

rather than the value of the patent. This would allow royalty to be related to the
final price charged by the licensee. The larger the number of compulsory licenses,
the lower will be final prices, thus yielding lower royalty payments.
Effectiveness of compulsory licensing will require minimizing legal uncertainty
for the licensee. If, for example, appeals against the grant of compulsory licenses
become routine and litigation protracted, the compulsory licensees will not be able
to start production, which will thwart the objective of diluting monopoly protec-
tion. India should consider creating a special administrative tribunal to hear
appeals related to compulsory licenses and dispose of them expeditiously. In fact, a
general presumption should be created that production under compulsory licenses
can take place even if an appeal is pending before the relevant administrative
authority. Safeguards to protect the interests of the compulsory licensees, provided
for under Article 31 (g) of TRIPS, need to be built into the guidelines that would
create an economic climate relatively free of uncertainty and thereby make produc-
tion under compulsory licensing an attractive proposition.
Finally, India will need to address the question of how to design regulatory
approval procedures in the event that compulsory licenses are generously awarded
so as to facilitate the easy marketing of drugs produced under such licenses.
The second task is to expeditiously implement a strengthened competition
policy and institutions so that adequate experience is gained by the time competi-
tion laws have to be used to offset the impact of the TRIPS agreement.
Changing TRIPS Rules to Address Public HealthCrises in Developing Countries12
Under the TRIPS agreement developing countries could invoke the public
health/interest exception in the TRIPS agreement to grant compulsory licenses
for the domestic production of relevant drugs, as indeed South Africa has pro-
vided for in its law. (The law is currently challenged in South Africa’s courts as
being too permissive and hence inconsistent with the TRIPS agreement.)
Although this is a feasible option for large, technologically advanced developing
countries (such as India) that can easily produce the patented drug, it may be less
feasible for the smaller African countries that would have to import the drugs.
Therefore, African countries will have to issue a compulsory license for import-
ing the drug. But where could they find these drugs at reasonable prices (that is,
at lower than monopoly prices) if the rest of the world is TRIPS compliant?
There are two possibilities:
1. From those countries that are outside the TRIPS agreement
2. From those WTO countries in which a similar compulsory licensing exception
has been invoked.
178 India and the WTO

Because the membership of the WTO is becoming comprehensive (even China
has joined the WTO), the first possibility is increasingly ruled out.
The key point here is that African countries cannot import from other WTO coun-
tries unless the latter also have invoked a similar compulsory licensing exception. In
other words, a country such as India cannot issue compulsory licenses to its firms
just to export AIDS drugs to African countries. Article 31 (f) of the TRIPS agree-
ment rules out this possibility because it requires compulsory licensing to serve
“predominantly” the local market (that is, in the country where the license is
issued). Because IP laws are territorial, the right to import does not become a right
to export unless laws in the country where production for export takes place
authorize such production.
The consequences of this restriction are not theoretical. Take the recent case of
the Indian company, CIPLA, that offered to sell AIDS drugs to Kenya at $650 per
dose. This offer was legal in India because the drugs in question were not covered
by the TRIPS agreement. They were inventions made prior to 1994, the cutoff date
for protection around the world. But in a year or two, when new AIDS drugs are
covered by the TRIPS agreement, the Indian company will not be able to make
such an offer. To do so they will have to obtain a compulsory license to serve the
Indian market; when such a license is obtained they can then export to Africa
some of their total production (much less than 50 percent, given Article 31 (f) of
the TRIPS agreement).13
If providing affordable access to Africa is indeed a serious imperative, even this
possibility that is left open under the TRIPS agreement is a very slim one. For
example, a country like Zimbabwe can obtain drugs under competitive conditions
only if other countries have successfully cleared the following hurdles for compul-
sory licensing:
• Potential compulsory licensees must have attempted to obtain a voluntary
license from the patentee on reasonable commercial terms and have been
refused within a reasonable period of time
• The patentee should be paid reasonable compensation for the compulsory
license
• Decisions by a government to grant compulsory licenses must be subject to
judicial review.
Even if those hurdles could be cleared, the delays involved could be enormous
and militate against swift responses to what is a serious crisis. What is needed is a
legal situation that clearly allows and legitimizes third-country governments (that
is, other than governments of importing countries) to grant compulsory licenses
for export so that firms such as CIPLA in India can sell AIDS drugs to African
countries in crisis. This would require a change in TRIPS rules.
India as User and Creator of Intellectual Property 179

It is important to note that a needed change in the legal situation still may not
be sufficient if extralegal pressures are exerted to prevent realizing the outcomes at
which the legal changes aim. For example, if an Indian company is willing to sell
AIDS drugs to African countries at close to marginal costs, it is easy to imagine
that both the company and the Indian government would come under pressure of
an implicit or explicit threat from the United States not to grant compulsory
licenses for export. If India or the Indian pharmaceutical company succumbs (as
happened recently to CIPLA when it offered to sell drugs to Ghana), the losers will
be the AIDS victims in Africa.14
The need for legal clarity cannot be overemphasized as recent experience indi-
cates. South Africa’s parallel import regime came under severe pressure from the
United States and its pharmaceutical companies despite the fact that parallel
imports were so clearly permitted by WTO rules. In the end, of course, the United
States relented but only after substantial countervailing pressure was exerted by
nongovernmental organizations. Of course the WTO rule helped but it was not
enough in itself to stave off pressure.
Some have argued that the TRIPS agreement requires no changes because it
allows countries to grant broad, sweeping exceptions to IP laws in the event of an
emergency, as indeed the AIDS crisis could be argued to be. But for the reasons
spelled out above, such an exception will not help African countries because even
if they suspended their IP laws, they would still have to obtain the AIDS drugs
from partner countries. Those partner countries cannot invoke similar emergency
exceptions unless the emergency is a domestic one; that is, India cannot suspend
its IP laws because of an AIDS crisis in Africa.
To be sure, any change in IP rules should not become or be seen as a license for
widespread infringement of patent rights. Appropriate safeguards can be designed
to prevent that. First, third-country production of drugs under compulsory
licenses for export can be restricted both to countries in real need and to multilat-
erally certified (by the World Health Organization [WHO]) instances of public
health problems. Second, patent holders should be provided reasonable compen-
sation for third-party use of the patent, which could be specified in advance to
avoid legal uncertainty. And finally, countries should be assigned responsibility to
prevent drugs produced under compulsory licenses from leaking into other mar-
kets and undermining legitimate patent protection.15
Thus the proposal to change TRIPS rules would run along the following lines.
In the event of a WHO-certified public health crisis in a developing country, gov-
ernments in other countries should be free to grant compulsory licenses to their
pharmaceutical companies to export the necessary drugs to the country in crisis.
Compliance with the normal procedures for granting such licenses specified in Arti-
cle 31 of the TRIPS agreement, particularly paragraph (f), should not be necessary;
180 India and the WTO

however, patentees affected by the compulsory license should be provided a nom-
inal remuneration of 2 to 4 percent. The country or countries granting the com-
pulsory license should cooperate with trading partners to ensure that drugs pro-
duced under such licenses do not find their way into markets other than those
affected by the crisis. The international community, under the aegis of the WHO,
should make concerted and expeditious efforts to ensure that drugs produced
under such licenses satisfy the regulatory criteria for marketing approval.
IP and Regulatory Policies for the New Technologies
India’s draft legislation provides plant variety protection similar to that foreseen
under UPOV (the International Union for the Protection of New Varieties of
Plants) 1978. In the patent legislation there is an exclusion for “plants and animals
and essentially biological processes for the production of plants and animals other
than microbiological processes.” Although this exemption for biotechnology is up
for review under TRIPS, it does not seem likely that India will be under external
pressure to close this exemption because of the unsettled nature of the debate in
Europe in particular.16 Nevertheless, regardless of these external influences, India
will need to assess the costs and benefits of higher IP protection in these areas.
There may be reasons to believe that the economics of IP protection in relation
to these new technologies may be different from that in the case of pharmaceuti-
cals. In pharmaceuticals, the negative welfare impact arises from the likelihood
that no real dynamic benefits will accrue to India to offset the static costs of a
more monopolistic market structure resulting from higher IP protection. In prin-
ciple there could be three dynamic benefits, which can be called the knowwho,
knowwhat, and knowwhere benefits. Higher IP protection accorded by India could
lead to increased research by Indian nationals (knowwho), on technologies or
products of interest to India (knowwhat), or in India (knowwhere). Each of those
variables creates benefits in terms of the higher profits accruing to India, the
cheaper or increased variety of products, or the increased transfer of technology.
In pharmaceuticals there was reason to believe that the scope for inducing these
benefits was small. By contrast, in agriculture there is greater scope for some if not
all of these benefits to be realized. Pray and Ramaswami (2001) showed that sizable
benefits result from private research in inputs, in the form of increased yields of
maize, sorghum, and millet. Farmers received more than 80 percent of the benefits
of increased yields. Much of this private research takes place in India, and although
multinationals carry out most of the research, there is scope for indigenous
involvement in this research capability. Thus, the dynamic benefits can be substan-
tial. For sure, enhancing research in agriculture will require a multipronged
India as User and Creator of Intellectual Property 181
approach, including greater public support and involvement (see Pray and Basant
2001), but the need for adequate proprietary protection should be considered
more seriously.
On biotechnology, three points can be made, two relating to the IP aspect—
namely, what level of IP protection should be accorded—which is distinct from
that relating to the commercial use of products that have benefited from this tech-
nology. For India, biotechnology probably resembles pharmaceuticals more than
agriculture in terms of the knowwho and knowwhere benefits. For the foreseeable
future, serious research is likely to be undertaken by large foreign companies
located outside India. The scope for the knowwhat benefits may be greater than in
the case of pharmaceuticals because it is possible that protection by India could
provide the incentives for greater research on genetically modified crops suited to
Indian agroclimatic conditions. If such research is induced, the potential gains
could be enormous. It could be the case that genetically modified technologies
hold enormous promise for Indian agriculture and for alleviating rural poverty.17
China and Argentina, and to a lesser extent Brazil, have become major users of
these technologies. More work is therefore needed to ascertain the relevance of
these dynamic benefits to India and hence to underpin policy positions relating to
IP protection.
The second point relates to the consequences of firms being able to create tech-
nological protection as an alternative to legal protection.18 (The terminator gene
and the greater research in hybrids where second-generation seeds are genetically
weak are examples of endogenously chosen technological protection.) The impli-
cation is that ultimately countries may not be able to influence the final market
structure in cases involving such technologies. If legal protection is denied, firms
may be able to secure it through technological means. Either way, creators of these
technologies will have strong market power. In such a situation, countries may
need to reevaluate their approach to IP protection. Legal IP protection could be
moot or it could be merely the lesser of two or more evils if its absence leads to
extra effort and cost in creating technological protection that will eventually be
passed on to consumers and users of such technologies. Again, more research is
necessary to understand the consequences of technological protection as an alter-
native to legal protection.
The third point refers to the commercial use of biotechnology. Concerns have
been expressed in India as in the developed countries about the ethical, environ-
mental, and safety risks associated with the new technologies. These concerns are
very real and need to be addressed. Public policy choices will have to be made
based on complex tradeoffs between economic benefits and noneconomic risks,
where the benefits and risks may be subject to deep uncertainty and arouse
strong emotions. For these choices to be made and command the public’s trust
182 India and the WTO

and confidence, there must be strong and transparent domestic institutions that
ensure that these technologies and the products derived from them are appropri-
ately regulated and the risks minimized. Institutions must provide for public
processes that promote reasoned debate and allow competing claims to be heard
and assessed. Creating these institutions or strengthening existing ones will be a
major challenge ahead.
There also may be an international challenge to the use of new technologies.
Civil-society groups in industrial countries have mounted a serious and often suc-
cessful campaign against the development of some new technologies. They have
also managed to portray their causes as universally supported. It is possible that
India assesses the tradeoff between economic benefit and noneconomic risk dif-
ferently from the industrial countries so that India’s interests may well lie in
encouraging—subject to appropriate regulatory safeguards—rather than freezing
these technologies. If that is the case, India and Indian civil society will have to
engage in this debate internationally to ensure that their interests are adequately
represented. Failure to do so may well lead to civil-society “imperialism” with
costly consequences.
Harnessing India’s Intellectual Property
Leading up to the December 1999 WTO Ministerial Meeting in Seattle, India
made proposals in the WTO seeking international protection for two types of IP
created in India: indigenous/traditional knowledge and genetic resources and
geographical indications such as Darjeeling, Basmati, and so forth. These are very
sensible and long overdue proposals, but a note of caution may be in order here.
Although seeking protection of genetic resources and traditional knowledge is
important, it is not clear at this stage how valuable in economic terms such pro-
tection will turn out to be, even if it can be feasibly implemented. This uncertainty
should condition how much India is willing to give up in any future international
negotiation to attain its goals in this area.
Genetic Resources and Indigenous Knowledge
India has advanced the notion of farmers’ rights and their right to remuneration
for the use of endoplasm, seeds, and other genetic material used by foreign compa-
nies in the pharmaceutical and biotechnology sectors (see Shiva 1993). In an ironic
reversal of the rhetoric of the 1980s when developing countries were accused of
piracy, it is now the industrial countries that stand accused of “biopiracy.”
The Convention on Biological Diversity (CBD) makes a useful start in requir-
ing registration systems that would identify and document the sources of genetic
India as User and Creator of Intellectual Property 183

material and indigenous knowledge. This could provide the basis for the sharing
of benefits from the use of such material and knowledge. The requirement in the
CBD that those who use such material should obtain the prior informed consent
of the country of origin of the material is also a useful step. One way of reconcil-
ing the TRIPS agreement and the CBD is for TRIPS to incorporate this obligation
of prior informed consent as a condition for obtaining a patent that uses genetic
resources.19
These, however, are just starting points. The goal in this area must be to devise
a system of internationally recognized proprietary rights for genetic resources and
indigenous knowledge. Such a system could represent a market-based response
for international cooperation. Its logic would be to address a potential market
failure in relation to the maintenance and creation of genetic resources and
indigenous knowledge (see Cottier 1998, Sedjo 1992, and Subramanian 1992). To
be sure, there are several unresolved issues relating to the feasible implementation
of this idea and that is where India should devote greater time, energy, and
research effort.
As a starting point, India and other developing countries must attempt to cre-
ate domestic systems for the protection of traditional knowledge, including farm-
ers’ rights. India’s efforts at pioneering legislation entailing registration of tradi-
tional knowledge and the establishment of a National Community Gene Fund are
significant developments, although it is disappointing that the notion of farmers’
rights (as opposed to farmers’ privilege) does not feature prominently in the draft
plant-variety law. If such systems can be shown to work domestically, that will
strengthen India’s case for seeking to replicate internationally. It is insufficient
now to complain against biopiracy without simultaneously offering concrete sug-
gestions for preventing it.
Implementing such a scheme will run into opposition from industrial coun-
tries. First, it will be argued that property rights cannot be accorded to things
found in nature—this principle underpins patent systems all over the world. But
the riposte must be that this legal principle does not always accord with the eco-
nomic rationale for proprietary protection, which is to reward any effort whose
fruits are ex post appropriable and hence subject to market failure. And the case
for proprietary protection for traditional knowledge and genetic resources can
be shown to be a response to this type of market failure. Second, there will be
advocacy of the voluntary cooperation route, letting pharmaceutical compa-
nies enter into contracts with countries and communities that possess such
resources, as in the case of Merck and Costa Rica. But voluntary cooperation,
though welcome, cannot be guaranteed in all instances; moreover, the terms of
such cooperation will necessarily be influenced by whether there are prior
rights to such resources. If these rights are internationally recognized and
184 India and the WTO
infringements credibly punishable, the reward for maintaining the resources will
be higher than it otherwise would be.
Geographical Indications
The EU is seeking extra protection for geographical indications originating in its
territories, such as those relating to wines and spirits. India, as mentioned, has
sought similar protection for names such as Basmati and Darjeeling. Here, too, the
principle embraced by India is appropriate. The problem will be to demonstrate
how such names, which have been in the public domain for years, can be restored
to proprietary protection. The case of the patenting of Texmati in the United States
also served to demonstrate how inadequately prepared India is and how weak its
own case was in preventing the appropriation of Indian intellectual property. For
example, because of divergence of interests domestically, India was unable to estab-
lish that Basmati was a valid geographical indication domestically. India needs to
ensure that all potentially valuable geographical indications are registered and pro-
tected domestically, which could then serve as the basis for seeking higher protec-
tion for Indian indications along the lines foreseen in Article 23 of TRIPS.
Second-Order Issues
A number of other issues have generated a lot of controversy in India. In this sec-
tion I will explain why they may be relatively unimportant and will suggest that
scarce resources be more effectively deployed elsewhere.
Extension of the “Nonviolation” Exemption
Under TRIPS, IP matters can be subject to “nonviolation” complaints as of the
year 2000. To understand what this means it is useful to recall that WTO dispute-
settlement rules provide two avenues or bases for challenging partner-country
actions (or claiming that there has been “nullification and impairment of bene-
fits”). The first basis for a challenge is the partner country’s breaching the rules of
the WTO (the “violation” route). The second basis is a partner country’s taking
action that may lead to nullification and impairment even though a rule may not
have been explicitly breached. Although somewhat arcane as a legal concept, the
essential point to note is that the hurdles for successfully mounting nonviolation
complaints are many and nearly insurmountable.20
Developing country fears on this issue stem from the perceived vulnerability
of price controls and other drugs-related policies, which, although not in overt
contravention of TRIPS rules, could be challenged for impairing the benefits
India as User and Creator of Intellectual Property 185

under the agreement. A successful nonviolation complaint may be particularly
difficult in TRIPS because IP rights are negative rights; that is, they are rights that
allow action against infringement by third parties. IP rights themselves do not
confer positive rights, such as the right to produce or market a product. To be
sure, a price control dilutes the value of the monopoly but legally IP rights do not
guarantee a monopoly. Hence, a price control, as long as it is implemented in a
manner that ensures that other producers do not infringe the patent, cannot be
seen as nullifying and impairing benefits. Of course, disallowing the nonviolation
avenue as a source of complaints would provide a cast-iron guarantee for devel-
oping countries to preserve such domestic policy options as price controls. But if
the reasoning described above is correct, the chances are not high that nonviola-
tion complaints would ever seriously threaten important domestic policies.
Hence, although it would be useful to foreclose this option, the value of such fore-
closure may not be too great.
Transfer of Technology
India has expended a lot of effort over decades seeking international mechanisms
for the transfer of technology. This is a laudable objective. But the experience of
the last 20 years in international forums suggests that there has been some lack of
clarity on how this is to be concretely achieved. For a long time, developing coun-
tries such as India were persuaded that the vehicle for attaining this objective was
multilateral action on restrictive business practices and transfer-of-technology
provisions. But it was always clear that those actions could in any case be taken by
India domestically through its own competition laws. Specific answers to the fol-
lowing questions need to be provided before a cogent position on what we should
seek internationally can be formulated: (1) what can international action do that
India cannot do on its own to ensure the transfer of technology? and (2) what
concrete actions of industrial-country governments that do not involve coercion
of their private sector corporations or that are otherwise unrealistic will help
achieve transfer of technology? It is possible that international cooperation can
help in securing improved transfer of technology by addressing negative spillovers
from industrial to developing country markets. Instances of such spillovers and
the appropriate remedial action need to be clearly identified by India and placed
on the negotiating agenda.21
Parallel Imports
The TRIPS agreement allows countries to choose whether to allow or disallow
parallel imports (that is, imports that are put on the market in another country
186 India and the WTO

with the consent of the patent holder). At stake here is whether rights holders can
prevent parallel imports and sustain price discrimination across markets or be
forced into a uniform monopoly. India holds a very strong position on this issue,
in favor of preserving the right to allow parallel imports. At first blush, that posi-
tion appears to be paradoxical. First, theory would suggest that for a small market
with a higher elasticity of demand, prices would be higher under a uniform
monopoly than under a discriminating monopoly. India should therefore argue
against parallel imports. Second, theory also suggests that it is the regime in the
larger (industrial-country) market that determines whether price equalization or
discrimination will prevail. Developing countries’ regimes appear to be irrelevant
in determining the final price outcome. Thus developing countries should not be
arguing for their right to allow parallel imports but, paradoxically, should be argu-
ing against the right of industrial countries to allow parallel imports. In this
instance, notwithstanding their best efforts, the wishes of developing countries
seem to have been granted (at least in the patent area) because of the workings of
political economy in which industrial-country producer interests (against parallel
imports in their market) have prevailed.
Standing against these theoretical arguments there seems to be the empirical
perception that developing countries can find lower-cost sources of parallel
imports (South Africa is a recent example). Given these contrasting considera-
tions, it is difficult to have a strong view in either direction. On balance, therefore,
India should probably not expend too much effort attempting to change or even
resist pressures to change the status quo.
Compulsory Licensing for Nonworking
Recently, developing countries have been attempting to resurrect the right to
grant compulsory licenses if patent owners do not “work” the patent (that is, pro-
duce the patented product) locally. India should resist raising this Lazarus from
the dead for three reasons. First, from a systemic perspective it would not be an
efficient allocative principle if all countries required that production be located in
their jurisdiction: comparative advantage could not be reasonably exploited.
Second, in the area of pharmaceuticals where compulsory licenses are most fre-
quently employed, a nonworking provision is either misguided or probably a non-
credible threat. It is misguided because it assumes that a domestic monopoly is
significantly better than an import monopoly. As an example let us say that in
response to the threat of compulsory licensing for nonworking, a pharmaceutical
company decides to locate in India to “work” the patent. The provision would
have achieved its objective of securing working but without addressing the under-
lying problem of monopolization. Working is therefore not the objective to aim for,
India as User and Creator of Intellectual Property 187
and especially not in the case of pharmaceuticals because technology transfer can
be effected through imitation rather than requiring local production. On the
other hand, where technologies cannot be easily imitated the threat of compul-
sory licensing is not credible: even if the patent owner refuses to comply with the
provision, alternative sources of production may not be easy to find.
Finally, TRIPS disallows compulsory licensing on grounds of nonworking, and
seeking to reverse this for little obvious gain could again represent an inefficient
use of negotiating coinage.
Caveat to External Pressures
Although external pressures on India in the field of IP are going to be minimal,
there is one caveat to this general presumption. This caveat relates to develop-
ments in WTO dispute settlement on IP. Ambiguity permeates the TRIPS agree-
ment. It is up to the dispute-settlement process either to resolve this ambiguity or
to entrust the task to the political (negotiating) process. There is increasing con-
cern that the dispute-settlement process in the WTO may be tending toward judi-
cial activism that may have ramifications for TRIPS and developing countries.
India will therefore need to keep a watchful eye on how TRIPS provisions are
interpreted. A few cases currently going through the dispute-settlement process
will be particularly important to monitor. They relate to the ability of countries to
facilitate quick entry of generics upon patent expiration (Canada versus EU) and
to the protection that needs to be accorded to test data (Argentina versus the
United States). If TRIPS rules are consistently interpreted to favor high IP protec-
tion, some offsetting political initiative may have to be mounted by India.
Domestic Inventive Activity: Whither India?
What scope is there for India to become a creator of knowledge and IP, and can IP
protection help? These are very difficult questions to answer because they have
multiple aspects relating not just to IP protection, but more importantly to sci-
ence and technology policy, public sector involvement in research, education, cli-
mate for investment, openness, and so forth.
Figure 8.1 and table 8.1 shed some light on where India stands relative to other
developing countries in terms of inventive activity and the evolution in such
activity across time. The data capture patenting activity in the United States by
selected developing countries, which should be a broadly appropriate gauge of
underlying research and development activity. The three parts of table 8.1 clearly
highlight the technological gap between industrial and developing countries,
which is especially pronounced for the United States and Japan.
188 India and the WTO

B. Total Patent Applications
0
1,000
2,000
3,000
4,000
5,000
6,000
7,000
8,000
1985 1986 1987 1988 1989 1990 1991 1992 1993 1994 1995 1996 1997 1998
Num
ber
of p
aten
ts
0
20
40
60
80
100
120
140
160
Num
ber
of p
aten
ts
C. Patents Granted in Chemical Sector
0
100
200
300
400
500
600
700
1985 1986 1987 1988 1989 1990 1991 1992 1993 1994 1995 1996 1997 1998
Num
ber
of p
aten
ts
0
5
10
15
20
25
30
Num
ber
of p
aten
ts
A. Total Patents Granteda
0
500
1,000
1,500
2,000
2,500
3,000
3,500
4,000
1985 1986 1987 1988 1989 1990 1991 1992 1993 1994 1995 1996 1997 1998
Num
ber
of p
aten
ts
0
10
20
30
40
50
60
70
80
90
Num
ber
of p
aten
ts
Mexico (right scale)Republic of Korea (left scale) Taiwan (China) (left scale)Chile (right scale)
Mexico (right scale)Republic of Korea (left scale) Taiwan (China) (left scale)
Chile (right scale)
Mexico (right scale)Taiwan (China) (left scale)
Republic of Korea (left scale)
FIGURE 8.1 Data on Patenting in the United States for SelectedDeveloping Countries, 1985–98
a. Vertical lines indicate date of revision of patent law.
Source: U.S. Patent and Trademark Office.
189
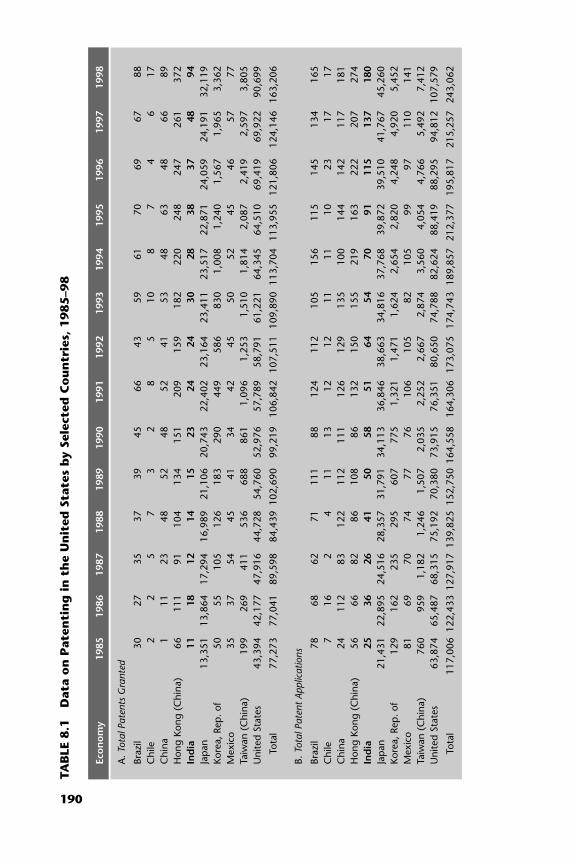
Eco
no
my
1985
1986
1987
1988
1989
1990
1991
1992
1993
1994
1995
1996
1997
1998
A. T
otal
Pat
ents
Gra
nted
Braz
il30
2735
3739
4566
4359
6170
6967
88C
hile
22
57
32
85
108
74
617
Chi
na1
1123
4852
4852
4153
4863
4866
89H
ong
Kong
(C
hina
)66
111
9110
413
415
120
915
918
222
024
824
726
137
2In
dia
1118
1214
1523
2424
3028
3837
4894
Jap
an13
,351
13,8
6417
,294
16,9
8921
,106
20,7
4322
,402
23,1
6423
,411
23,5
1722
,871
24,0
5924
,191
32,1
19Ko
rea,
Rep
. of
5055
105
126
183
290
449
586
830
1,00
81,
240
1,56
71,
965
3,36
2M
exic
o35
3754
4541
3442
4550
5245
4657
77Ta
iwan
(C
hina
)19
926
941
153
668
886
11,
096
1,25
31,
510
1,81
42,
087
2,41
92,
597
3,80
5U
nite
d St
ates
43,3
9442
,177
47,9
1644
,728
54,7
6052
,976
57,7
8958
,791
61,2
2164
,345
64,5
1069
,419
69,9
2290
,699
Tota
l77
,273
77,0
4189
,598
84,4
3910
2,69
099
,219
106,
842
107,
511
109,
890
113,
704
113,
955
121,
806
124,
146
163,
206
B. T
otal
Pat
ent
Appl
icat
ions
Braz
il78
6862
7111
188
124
112
105
156
115
145
134
165
Chi
le7
162
411
1312
1211
1110
2317
17C
hina
2411
283
122
112
111
126
129
135
100
144
142
117
181
Hon
g Ko
ng (
Chi
na)
5666
8286
108
8613
215
015
521
916
322
220
727
4In
dia
2536
2641
5058
5164
5470
9111
513
718
0Ja
pan
21,4
3122
,895
24,5
1628
,357
31,7
9134
,113
36,8
4638
,663
34,8
1637
,768
39,8
7239
,510
41,7
6745
,260
Kore
a, R
ep. o
f12
916
223
529
560
777
51,
321
1,47
11,
624
2,65
42,
820
4,24
84,
920
5,45
2M
exic
o81
6970
7477
7610
610
582
105
9997
110
141
Taiw
an (
Chi
na)
760
959
1,18
21,
246
1,50
72,
035
2,25
22,
667
2,87
43,
560
4,05
44,
766
5,49
27,
412
Uni
ted
Stat
es63
,874
65,4
8768
,315
75,1
9270
,380
73,9
1576
,351
80,6
5074
,788
82,6
2488
,419
88,2
9594
,812
107,
579
Tota
l11
7,00
612
2,43
312
7,91
713
9,82
515
2,75
016
4,55
816
4,30
617
3,07
517
4,74
318
9,85
721
2,37
719
5,81
721
5,25
724
3,06
2
TAB
LE 8
.1D
ata
on
Pat
enti
ng
in
th
e U
nit
ed S
tate
s b
y Se
lect
ed C
ou
ntr
ies,
1985–9
8
190

Eco
no
my
1985
1986
1987
1988
1989
1990
1991
1992
1993
1994
1995
1996
1997
1998
C. T
otal
Pat
ents
Gra
nted
in C
hem
ical
Sec
tor
Braz
il10
37
58
911
911
1421
1213
19C
hile
n.a.
n.a.
n.a.
n.a.
n.a.
n.a.
n.a.
n.a.
n.a.
n.a.
n.a.
n.a.
n.a.
n.a.
Chi
na1
18
1020
1416
1924
1922
2236
41H
ong
Kong
(C
hina
)n.
a.n.
a.n.
a.n.
a.n.
a.n.
a.n.
a.n.
a.n.
a.n.
a.n.
a.n.
a.n.
a.n.
a.In
dia
713
1111
1018
1516
2517
2622
3567
Jap
an3,
730
3,63
74,
113
4,27
45,
437
5,46
75,
810
6,24
26,
793
6,41
96,
115
5,94
06,
130
7,39
2Ko
rea,
Rep
. of
97
1113
2952
8310
216
418
930
232
842
462
4M
exic
o13
1324
2015
1413
1524
2117
1617
20Ta
iwan
(C
hina
)19
913
1931
5171
9314
620
230
434
942
065
6U
nite
d St
ates
11,5
2010
,496
11,3
7411
,204
13,7
8213
,075
14,1
0715
,424
16,0
4815
,401
15,1
8516
,446
18,3
3821
,537
Tota
l21
,192
19,6
2421
,640
21,7
4026
,943
25,9
5427
,586
29,3
6130
,629
29,1
8129
,311
30,6
0533
,736
40,4
45
TAB
LE 8
.1(C
onti
nued
)
191
n.a.
Not
ava
ilabl
e.
Sour
ce:U
nite
d St
ates
Pat
ent
and
Trad
emar
k O
ffice
.

In comparison with other developing countries, India does not fare too badly.
In 1998 it ranked fourth among all developing countries in terms of the number
of patents obtained, behind the Republic of Korea, Taiwan (China), and Hong
Kong (China)—the three leading nations—but ahead of Brazil, China, and Mexico.
It is interesting that in the chemical sector—which accounts for the bulk of all
patents—and in biotechnology—one of the cutting-edge sectors—India ranks
fourth among developing countries. Moreover, in biotechnology, the gap between
India and countries ahead of it is not large.
Perhaps, a more interesting issue from India’s perspective is the experience of
other developing countries that have strengthened their IP protection over the last
decade. Figure 8.1 depicts the patenting activity of four developing countries—
Chile, Korea, Mexico, and Taiwan—that undertook revisions to their patent legis-
lation over the last 10 to 15 years. Panels A and B refer, respectively, to patent
grants and applications, and Panel C depicts patents granted in the chemical sec-
tor.22 The panels illustrate that, although Korea and Taiwan, China, witnessed a
surge in patenting after their IP regimes had been strengthened (registering 20-
fold and 30-fold increases since the mid-1980s), no such effect was discernible in
Mexico or Chile, which continue to be characterized by a very low level of inven-
tive activity.
Clearly, therefore, strengthening IP protection does not appear to be a suffi-
cient condition for increased inventive activity. But is India more likely to fall
into the pattern set by Korea and Taiwan, China, or that set by Mexico and
Chile? Like the former group India has a diversified industrial and technological
base, a well-educated and highly skilled workforce (at least in selected sectors),
and some core-research capability. Looking ahead, it is possible that the
strengthening of India’s patent laws will lead to developments that resemble
more closely those of Korea and Taiwan, China, than those of Mexico and
Chile.23 Realizing this objective will require a more concerted policy effort that
goes beyond IP protection, but with the right set of policies there may be
grounds for guarded optimism.
Conclusion
Although external pressure to change intellectual property regimes has abated,
India faces other challenges—as a net user, potential net creator, and net creator
of knowledge and intellectual property. The challenges are unique in each area.
As a net user, an important challenge is to mitigate the most egregious impacts of
the TRIPS agreement, particularly in the case of pharmaceuticals. Compulsory
licensing and competition policy offer the most promising avenues for meeting
the challenge, and India needs to implement them expeditiously and render
192 India and the WTO

them effective in the near future. As a net user India can use its TRIPS obligations
to enforce its market-access rights in the WTO. Accordingly, consideration
should be given to revising the draft IP legislation to allow for retaliation in
TRIPS for failure by trading partners to adhere to their market-access commit-
ments affecting India.
On the new technologies, particularly in agriculture, India must identify its
location on the technology spectrum. There is some evidence that it could be a
potential net creator of IP. Based on such an assessment, IP rights legislation
should be designed appropriately. At the same time, strengthening complemen-
tary regulatory institutions would allow the benefits of new technologies to be
harnessed while minimizing attendant risks.
As a net creator of technology (in the area of genetic resources, traditional
knowledge, and geographical indications), the challenge is to establish workable
domestic systems for protecting such technology. Those systems could then serve
as the basis for seeking their protection internationally.
Finally, the recent experience of developing countries that share India’s knowledge-
generation characteristics suggests that India should not be overly pessimistic
about its potential to move up the knowledge spectrum even in areas, such as
pharmaceuticals and chemicals, where it is currently a net user of intellectual
property.
Endnotes
1. See Subramanian (1994, 1995) and Watal (1998) for illustrative estimates of the magnitude of
these welfare costs.
2. This section draws heavily on Subramanian and Watal (2000).
3. A lucid theoretical demonstration of this proposition is presented in Deardorff (1992). Watal
(2000b) placed maximum annual welfare losses in India from pharmaceutical patents alone at around
US$140 million. See also Subramanian (1995).
4. It should be noted that in the context of retaliation, which will be isolated instances of, rather
than systematic, dilution of IP protection, the question of the dynamic effects—of innovation and
R&D generation—will not arise. Reducing IP protection will therefore confer the static benefits with-
out leading to any dynamic efficiency losses.
5. I am grateful to Aaditya Mattoo for alerting me to this potential problem.
6. Paradoxically, in the Uruguay Round it was India that was in the forefront arguing against
cross-retaliation as a “safeguard,” fearing that it would be used to enforce obligations on TRIPS and
GATS. These “safeguards” are, of course, counterproductive to their interests. India was unable to see a
key characteristic of an asymmetric system: that compliance by the weak cannot be avoided, with or
without retaliation, but that rules and effective retaliation may be necessary to ensure compliance by
the strong. It was therefore not recognized that (1) industrial countries would not need to go as far as
cross-retaliation in goods for securing compliance by developing countries in TRIPS, and (2) develop-
ing countries had potential power through cross-retaliation in the very TRIPS obligations that many of
these countries perceived to be burdensome.
7. Most bilateral investment treaties require that intangible assets, such as IP, be protected in
accordance with national law. As long as national law also specifies clearly the circumstances under
India as User and Creator of Intellectual Property 193

which IP protection can be modified, these treaties would not be affected by the proposal on
retaliation.
8. TRIPS as retaliation offers one tantalizing possibility. Although India should use retaliation in a
manner that is strictly compatible with WTO rules, India could also choose to emulate the infamous
“Section 301” of the U.S. trade law and enlarge the scope of such retaliation to cover other situations of
potential detriment to it. Just as Section 301 prior to the Uruguay Round was wielded to cover IP rights
that were then beyond the scope of world trading rules, India could provide for retaliation if partner
countries sought to impose excessive labor or environmental standards that are currently outside
WTO rules. A difficult question is whether it is in India’s or the system’s interest to counter vigilantism
with its own image.
9. The only basis on which compulsory licenses cannot be granted is nonworking of the patent
locally, as discussed above.
10. Of course, competition policies should be motivated by the wider concern of making markets
competitive.
11. Although India’s patent laws have provided for compulsory licensing, no serious need to use it
ever arose because of the level of IP protection.
12. This section draws heavily on Subramanian (2001).
13. As long as the number of AIDS sufferers in Africa exceeds those in the countries that could be
sources of supply for cheap drugs, Article 31 (f) of TRIPS will be restrictive.
14. The cooperation of the international community in facilitating supply by the Indian company
may need to go even further. For example, drugs manufactured in third countries will need to obtain
regulatory approval either in the country of production (under compulsory license) or by other coun-
tries or the WHO.
15. In discussions of differential pricing, legitimate concerns are expressed by the pharmaceutical
companies about the leakage of “parallel goods” into rich-country markets, undermining patent pro-
tection there. However, it should be noted that this threat existed in a more serious form in a pre-
TRIPS world and was dealt with rather successfully. As long as rich-country markets have good
enforcement capability the leakage problem need not be serious. The arrival of the Internet and the
attendant increase in Internet-based sales, of course, make national enforcement more difficult, under-
lining the need for greater cooperation among countries.
16. Although Europe has formally closed this exemption, the situation has become muddied
because of the decision of the Netherlands, which voted against the European Directive, to challenge
the directive in the European Court of Justice (see Watal 2000a).
17. It was recently announced that genetically modified rice could help reduce iron-deficiency
anemia or vitamin A deficiency.
18. Although MONSANTO has recently announced a policy that the terminator technology
would not be further developed, this issue of technological protection is not likely to disappear.
19. Alternatively, as proposed by Watal (2000), the obligation of prior informed consent can be
imposed before commercialization of the patent.
20. In the entire history of the General Agreement on Tariffs and Trade/WTO, there have been
only 8 nonviolation complaints (out of a total of more than 300 complaints) and none has been suc-
cessful. The recent U.S. complaint against Japan’s domestic distribution system was dismissed by a
WTO panel.
21. For example, abuses of IP rights in foreign markets (through patent pooling or acquisition of
other rights) can inflict welfare losses on developing countries. These abuses could be more effectively
addressed at their source than at their destination, requiring the cooperation of the large countries.
This cooperation can then be embodied in multilateral rules.
22. It is interesting to look at the chemical sector because IP protection has been shown to have a
more significant impact on research and development activity in this sector than in others.
23. Lanjouw (1997) cites cases of increased research and development activity in the Indian phar-
maceutical and chemical sectors.
194 India and the WTO
India as User and Creator of Intellectual Property 195
References
Cottier, Thomas. 1998. “The Protection of Genetic Resources and Traditional Knowledge: Toward
More Specific Rights and Obligations in World Trade Law.” Journal of International Economic Law
1:555–84.
Deardorff, Alan. 1992. “Welfare Effects of Global Patent Protection.” Economica 59:35–51.
Lanjouw, Jean. 1997. “The Introduction of Pharmaceutical Product Patents In India: Heartless
Exploitation of the Poor and Suffering?” Working Paper 6366. National Bureau of Economic Research,
Cambridge, Mass.
Pray, C. E., and R. Basant. 2001. “Agricultural Research and Technology Transfer by the Private Sec-
tor in India.” In Carl E. Pray and Keith O. Fuglie, Private Investments in Agricultural Research and Inter-
national Technology Transfer in Asia. ERS Agricultural Economics Report 805 (November).
Pray, C. E., and B. Ramaswami. 2001. “Technology, IPRs, and Reform Options: Case Study of the
Seed Industry with Implications for Other Input Industries.” International Food and Agricultural Mar-
keting Review 2(Special Issue):407–20.
Shiva, Vardana. 1993. “Farmers’ Rights, Biodiversity, and International Treaties.” Economic and
Political Weekly (April 3).
Subramanian, Arvind. 1992. “Genetic Resources, Biodiversity, and Environmental Protection: An
Analysis and Proposals towards a Solution.” Journal of World Trade 26:105–09.
———. 1994. “Putting Some Numbers on the TRIPS Pharmaceutical Debate.” International Jour-
nal of Technology Management 2:252–68.
———. 1995. “Trade-Related Intellectual Property Rights and Asian Developing Countries: An
Analytical View.” In A. Panagariya, M. G. Quibria, and N. Rao, eds., The Global Trading System and
Developing Asia. Cambridge, U.K.: Cambridge University Press.
———. 2001. “The AIDS Crisis, Differential Pricing of Drugs, and the TRIPS Agreement: Two
Proposals.” Journal of World Intellectual Property 4:323–36.
Subramanian, Arvind, and Jayashree Watal. 2000. “TRIPS as an Enforcement Device for Develop-
ing Countries in the WTO.” Journal of International Economic Law 3:403–16.
Watal, Jayashree. 1998. “The TRIPS Agreement and Developing Countries—Strong, Weak or Bal-
anced Protection.” Journal of World Intellectual Property 1:281–307.
———. 2000a. Intellectual Property Rights in the World Trade Organization: The Way Forward for
Developing Countries. Oxford, U.K.: Oxford University Press.
———. 2000b. “Pharmaceutical Patents, Prices and Welfare Losses: A Simulation Study of Policy
Options for India under the WTO TRIPS Agreement.” The World Economy 23:733–52.

Although the relationship between international trade and competition
policy has been discussed in India for several years, two developments
recently have given it a new focus: the passage of a new competition law
and the likelihood of negotiations to bring aspects of competition policy into the
World Trade Organization (WTO) framework after the Fifth Ministerial Confer-
ence (Cancun) in late 2003, despite India’s strenuous opposition to such negotia-
tions. A brief recapitulation of how these developments came about is necessary
to provide the background to this chapter.
The issue of trade, investment, and competition policy first came into promi-
nence in 1996 when the WTO Ministerial Conference (Singapore) resolved to set
up two working groups—one “to examine the relationship between trade and
investment” and the other “to study issues raised by members relating to the inter-
action between trade and competition policy, including anticompetitive prac-
tices” (WTO 1996, para. 20).1 Expert groups on these subjects were set up by the
Government of India shortly thereafter, followed by the establishment of another
high-powered committee to suggest changes in Indian competition law and policy
in light of the changed environment consequent to India’s economic reforms and
the WTO regime. A new competition bill, designed to replace the Monopolies and
Restrictive Trade Practices (MRTP) Act of 1969, was tabled in the Indian parlia-
ment in August 2001, studied by a parliamentary standing committee for a year,
and finally passed with several amendments in December 2002. At the time this
chapter was last revised (March 2003), however, the government had not yet issued
the official notification that would bring the new Competition Act into force.
197
9
Trade, Investment,and CompetitionPolicy: An Indian
Perspective
Aditya Bhattacharjea

Government statements indicate that for the first year of its life, the new Compe-
tition Commission (which is still to be appointed) will undertake purely educa-
tional activities and the various sections of the Competition Act will be brought
into effect thereafter in phases.
With many other developing countries at the Doha Ministerial Conference in
2001, India insisted that the “Singapore issues” still required further study and
could not be taken up for negotiation until developing countries’ concerns about
the implementation of existing agreements were addressed (WTO 2001). Ulti-
mately a compromise was worked out: negotiations on both investment and com-
petition will take place only after the Fifth Ministerial Conference in 2003, with
modalities to be decided by explicit consensus. In almost identical paragraphs on
the two issues, the Doha declaration recognized the needs of developing countries
for enhanced support for technical assistance and capacity building, and set out
separate agendas for continuing study by the working groups.
The Working Group on Competition Policy, which is my main concern, has so
far submitted six annual reports. Following the unusual wording of its mandate,
however, it has confined itself to reporting the very different opinions of member
countries on various issues, with many of the same conflicting arguments being
repeated from one report to the next. India and many other developing countries
have emphasized the need to respect their diversity in terms of stages of develop-
ment, socioeconomic circumstances, legal frameworks, and cultural norms. They
have drawn attention to the dangers of transplanting a system that has evolved over
many years in industrial countries into economies lacking in experience, expertise,
and institutional memory. Virtually every specific proposal has met with opposi-
tion at the working group, including a proposal to extend the fundamental WTO
principle of nondiscrimination to competition policy. Consensus seems to be
emerging only with respect to the need to control international cartels, to enhance
voluntary cooperation among national authorities, and to provide technical assis-
tance for developing countries. There is considerable disagreement, however, on
whether even such limited measures should be under the aegis of the WTO.2
Irreconcilable differences have emerged more recently on the interpretation of
the decision at Doha. The European Union (EU), which has been the major pro-
ponent of the Singapore issues, claims that the Doha declaration commits all
members to negotiations, with consensus required only on “modalities”; India
maintains that negotiations cannot proceed without such a consensus, which it is
not prepared to join. As of early 2003, the state of play at the WTO suggests that
any agreement will be limited to enshrining only a few key principles in the
national competition laws of members, with provisions for special and differential
treatment for developing countries, and possibly a framework for voluntary inter-
national cooperation in investigations.
198 India and the WTO

Both the precise shape of India’s new competition regime and the fate of com-
petition policy negotiations at the WTO are thus undecided at the time of writing.
Even if no WTO agreement finally emerges, however, competition policy in India
must now operate in an economy that is far more open to international trade and
investment than it was in 1969 when the MRTP Act was passed. To contribute to
this ongoing discussion, this chapter draws on the lessons of India’s trade and
industrial reforms, particularly its less-than-satisfactory experience with competi-
tion policy, together with insights from the theoretical literature on trade and
industrial policies under imperfect competition. I will be concerned here mainly
with trade and competition policy and only tangentially with trade and invest-
ment in the course of discussing mergers and entry policy. I do not intend to go
into competition policy issues arising from the agreements on government pro-
curement and trade-related aspects of intellectual property rights (TRIPS), which
have been ably dealt with by Srivastava and Subramanian in this volume. After a
review of certain background issues in the next section of this chapter, the third
section reviews the important changes in India’s trade, investment, and competi-
tion policies, with particular emphasis on the country’s experience with the
MRTP Act. The fourth section then undertakes a compressed survey of the rele-
vant theoretical literature and uses it to evaluate the Indian economic reforms.
The fifth section examines the road ahead. This involves an assessment of the new
Competition Act, followed by suggestions for what our priorities should be in
preparation for the next ministerial conference and in any negotiations thereafter.
The final section concludes the discussion.
Background
In this section I review in an extremely compressed manner the existing interna-
tional agreements on competition policy, the recent literature on trade and com-
petition, and Indian official positions on the subject.
International Agreements on Competition Policy
At present no multilateral agreement exists. A “Set of Multilaterally Agreed Equi-
table Principles and Rules for the Control of Restrictive Business Practices” was
agreed at the United Nations Conference on Trade and Development (UNCTAD)
in 1980 and is reviewed periodically, but it remains nonbinding and unenforce-
able. International cooperation in competition policy takes the form of bilateral,
regional, or sectoral arrangements. The EU and the United States have adopted a
policy of “positive comity” in investigating each other’s complaints of anticompet-
itive conduct by firms in their jurisdiction against the interests of parties in the
Trade, Investment, and Competition Policy: An Indian Perspective 199
other jurisdiction. Competition policy clauses, which require various degrees of
consultation, coordination, and harmonization, figure in several regional agree-
ments, notably the North American Free Trade Agreement, the Andean Common
Market, and one between Australia and New Zealand. The process has gone fur-
thest in the EU, which now also requires countries in Central and Eastern Europe
to conform entirely to its competition principles as one of the preconditions for
accession. Less rigid templates for a wider multilateral agreement involving devel-
oping countries could include the 1998 Panama communiqué signed by the
United States, Canada, and nine developing countries in the Western Hemisphere,
affirming their intention to cooperate in dealing with cartels; or Article IX of the
General Agreement on Trade in Services (GATS), which deals with restrictive
business practices but requires only “full and sympathetic consideration” of
requests by other members for consultations, and with supply of “publicly avail-
able non-confidential information.”
A Review of the International Literature
Turning to the recent literature on the relationship between trade and competition
policies, three main themes stand out.3 The first theme is the complementarity or
substitutability between trade liberalization and competition policy. Trade restric-
tions facilitate anticompetitive conduct by providing a focal point or “facilitating
practice” for collusive behavior between foreign and domestic firms in the home
market. Supposedly they also enable domestic firms to engage in predatory pricing
by selling exports at less than cost, cross-subsidized by profits earned in protected
home markets. Anticompetitive practices can in turn limit the benefits of trade lib-
eralization. For example, export cartels, which are exempted by the competition
law of most countries, can adversely affect importing countries, whereas import
cartels and exclusionary vertical arrangements in distribution can be used to deny
market access to foreign suppliers, even after trade barriers are dismantled.
These arguments suggest that trade liberalization and competition policy are
complementary, but they may also be substitutes in some respects. Exposure to
import competition has long been seen as a means of imposing “market disci-
pline” on domestic producers of tradable products, forcing them to price compet-
itively even if domestic competition policy is absent or ineffective. Conversely,
competition policy may be a superior substitute for trade policy in the specific
case of antidumping measures, which have been used increasingly in place of
other protectionist policies that were outlawed or sharply circumscribed after the
Uruguay Round. Several scholars have suggested that rules against predatory pric-
ing could be less susceptible to misuse, although, as I show below, that has not
been the case in India.
200 India and the WTO

The second theme that figures in the literature relates to changes in the struc-
ture and conduct of international business. Foreign monopolization, concentra-
tion, and collusion are matters of growing concern because of stronger patent
protection under the TRIPS agreement, a wave of mega-mergers with cross-border
spillovers on competition, and a trend toward pooling and cross-licensing of
patents, with many technology licensing agreements featuring restrictions on
licensing, pricing, or exporting to third-country markets. Competition policy
authorities in the EU and the United States also have uncovered evidence of price-
fixing and international market sharing by large firms, notably in recent cases
involving vitamins and steel tubes.
Third, various arguments have been made in favor of international action on
competition policy. National authorities would have very different assessments of
international cartels or of the balance of positive and negative effects of a merger,
depending on how producers and consumers are distributed across countries. The
actions of foreign firms are difficult to regulate through the extraterritorial appli-
cation of national competition laws, especially in developing countries where such
laws and their domestic enforcement are weak or nonexistent. Even if national
laws are applicable, international cooperation is required for carrying out investi-
gations in foreign countries. It is also argued that competitive relaxation of com-
petition policy by different countries in order to attract foreign investment might
encourage a “race to the bottom,” as allegedly can happen in the case of environ-
mental policies. All these reasons make a case for international action, ranging
from consultation, technical assistance, sharing of confidential information, and
coordinated investigations by national authorities at one extreme, through har-
monization of national competition laws, to an international agreement on what
are sometimes referred to as TRAMs (trade-related antitrust measures), to estab-
lishment of a supranational authority to enforce such measures at the other
extreme. An international competition policy is seen to benefit developing coun-
tries, especially in curbing antidumping actions against their exports and (more
speculatively) in restraining collusive behavior by foreign suppliers.
Official Indian Perspectives
Official Indian documents on trade and competition policy articulate several con-
tradictory positions, which have little to do with the issues discussed above. The
stand of the two Indian committees on the subject was that more vigorous compe-
tition is always a goal worth pursuing. The first committee (Government of India,
1999; hereafter referred to as the Chakravarthy committee) boldly declared that
“COMPETITION SHOULD INFORM ALL TRADE AND MARKET POLICIES”
(para. 2.7.5, double emphasis in the original). However, it also argued for competition
Trade, Investment, and Competition Policy: An Indian Perspective 201
policy to “inhere a development dimension,” which it does not define. It further
calls for competition policy to safeguard the “public interest,” which it defines as
follows:
Consumer interest and public interest are not necessarily mutually exclusive social
goals. While public interest will take into account efficiency facets like cost minimisa-
tion, profit maximisation, optimal use of resources, etc., consumer interest will
emphasise equity facets like free competition in the market, but these are not neces-
sarily antithetical. [para. 1.4.12; emphasis in the original]
Insofar as any meaning can be discerned in that statement, it seems to see the
public interest being served by bringing about the conditions under which the First
Theorem of Welfare Economics holds (although it mixes up the theorem’s assump-
tions and conclusions), without any regard to second-best issues, not to mention
well-known alternative perspectives that see a tradeoff between market power and
economies of scale or dynamic benefits from innovation. Its conflation of con-
sumer interests with equity and “free competition” is equally incomprehensible.
The second committee (Government of India, 2000) followed a similar course in
seeking to establish conditions for free entry everywhere, extending its mandate to
recommend abolition of import restrictions and product reservations for small-
scale industries and the public sector. It presents a mixed bag, with some paragraphs
betraying the same Olympian emphasis on balancing “public interest” against “con-
sumer interest,” and others that are much more incisive and show considerable
awareness of both recent economic theory and regulatory practice in other coun-
tries. It is no more helpful than the Chakravarthy committee, however, in defining
the public interest as “something in which society as a whole has some interest, not
fully captured by a competitive market. It is an externality” (para. 3.2.0).
An Indian submission to the WTO Working Group on Competition Policy in
2001, like the Chakravarthy committee a year earlier, seemed to visualize the goal
of competition policy as bringing about conditions for the first-best welfare opti-
mum, but questions this objective on the grounds that these gains from allocative
efficiency are once-and-for-all in nature. Developing countries instead seek
dynamic gains from total factor productivity growth. The gains from interna-
tional trade, although potentially beneficial, had been cornered by those countries
that used “beggar thy neighbor” industrial policies unrestrained by competition
policy—notably Japan. The submission also expresses skepticism about develop-
ing countries’ ability to make use of positive comity or even information-sharing
arrangements, given their lack of experience with competition policy (WTO
2000). In a subsequent submission to the working group, India has asserted the
need to take action against mergers and cartels involving foreign firms, while sup-
porting an East Asian–style industrial policy of promoting “national champions”
202 India and the WTO
to take on multinationals, and permitting mergers and rationalization cartels that
would allow orderly restructuring in the face of trade liberalization. This action
would violate the core WTO principle of national treatment, against which the
Indian submission argues strongly in the context of competition policy (WTO
2002a). On the other hand, the Competition Act that was passed just a few
months later made cartels a violation per se, and contained no provisions for dis-
crimination between domestic and foreign firms.
Yet another perspective is that of the official competition agency under the
MRTP Act, the Monopolies and Restrictive Trade Practices Commission, which in
a number of recent judgments identified the “public interest” as protecting the
interest of workers and investors in Indian firms threatened by foreign competi-
tion, and stated that this “public interest” should prevail over consumer interests.4
In all these conflicting descriptions of the “public interest,” there seems to be no
recognition that there is a standard measurement of social welfare in economics—
that is, the sum of consumer surplus and producer surplus—which is widely
used to reconcile conflicting interests, especially in analyses of trade and compe-
tition policy. Because this is blind to distributional issues, many critics of reform
dismiss it, although I will show in the next section that applying this criterion to
competition policy actually calls into question the way in which reforms have
been going. I state my position on national treatment in the fifth section of the chap-
ter, and return to distributional considerations and the public interest at the very
end.
Indian Experience
I now turn to a discussion of India’s experience with investment and competition
policy.
Foreign and Domestic Entry
Doing away with restrictions on entry has arguably been the oldest and most far-
reaching aspect of India’s economic reforms. Years before privatization, financial
sector liberalization, or a more accommodating policy toward foreign investment
became even a remote possibility, reform of entry restrictions began in the mid-
1980s with gradual relaxation of the extensive and dysfunctional system of
investment licensing that had been in force since the 1950s. This system required
government approval for establishing a new unit, expanding an existing unit,
diversifying into new products, and relocating a plant. Controlling the concentra-
tion of economic power (in the form of interconnected firms under the common
control of a business group) and abuse of market dominance were among the
Trade, Investment, and Competition Policy: An Indian Perspective 203

system’s ostensible objectives. But in practice the licensing system clearly served as
a barrier to new entrants and reinforced the very industrial concentration it was
supposed to inhibit, because large business groups engaged in preemptive acquisi-
tion of licenses as an entry-deterring strategy. To oblige different business groups
and regional politicians, licensed capacity was fragmented and distributed in
noneconomical sizes.5 The 1969 MRTP Act reinforced this by requiring an addi-
tional layer of investment approvals for firms that were either “large” (in the sense
of belonging to a group whose assets exceeded a certain threshold), or “dominant”
(in the sense of commanding a market share in excess of one-fourth). With
expansion of their individual firms thwarted by the licensing regime, the groups
often engaged in conglomerate overdiversification, or set up nominally indepen-
dent rival firms in the same industry. We will see that this has a bearing on recent
merger trends.
Early reform measures in the 1980s included automatic endorsement of capac-
ity installed in excess of the licensed amount; delicensing of 25 industries; and
“broadbanding,” or allowing flexibility of product mix within a capacity limit, for
other industries. The threshold defining “large” undertakings under the 1969
MRTP Act was quintupled in 1984, which removed a large number of firms from
the further investment approvals required by the act. In 1991 this liberalization of
entry restrictions accelerated dramatically in several ways. First, all but 18 indus-
tries were removed from the purview of capacity licensing (this list was further
reduced in stages, to 6 at present). Second, the additional approvals required of
large or dominant firms under the MRTP Act were abolished altogether. Third,
the number of areas reserved for the public sector was sharply reduced (from 18
to 8 in 1991 and to 3 now). Fourth, controls on issues of equity capital were con-
siderably relaxed.
Restrictions on foreign direct investment (FDI) were also reduced substantially.
Under the Foreign Exchange Regulation Act (FERA) of 1973, foreign firms had
been restricted to an equity stake no greater than 40 percent, except in technology-
intensive or export-oriented activities. The 1991 reforms allowed for automatic
approval of proposals involving up to 51 percent foreign equity in 48 industries,
and provided lists of designated priority industries in which up to 74 percent or
100 percent foreign equity would be granted automatic approval. These industry
lists have been expanded progressively so that only agriculture, mining, petroleum
refining, and a few service sectors are now subject to equity caps. Even FDI pro-
posals involving higher foreign shareholding can be approved on a case-by-case
basis by the interministerial Foreign Investment Promotion Board.
Major obstacles to private investment remain in the reservation of almost 800
items for a conservatively defined “small-scale” sector.6 Entry is also hampered at
the level of state (provincial) authorities who must be approached for water and
204 India and the WTO

power connections, land acquisition, and environmental clearance. FDI is still
restricted in sectors under industrial licensing and in sectors where the foreign
party already has a joint venture. There is no doubt, however, that policy-created
barriers to entry have been lowered significantly.
Trade liberalization, also relevant to the competitive environment, has pro-
ceeded more slowly. Because Chapter 2 of this volume provides a detailed sum-
mary, I will be brief here. Import licensing for intermediate and capital goods was
gradually dismantled during the 1980s, but sharp increases in tariffs in the late
1980s and a substantial real depreciation of the rupee between 1985 and 1993
blunted import competition. Tariff reductions were phased in gradually, with
Indian tariff levels even now remaining higher than in most developing countries. In
the late 1990s special additional duties and a surcharge resulted in a slight reversal
of the downward trend in average tariffs (although the surcharge was revoked in
2001). Furthermore, as Chadha and coauthors noted in Chapter 2, the persisting
high tariff and nontariff barriers on imports of consumer goods actually raised
the effective protection of their domestic market as tariffs on inputs were brought
down. Stringent quantitative restrictions on the import of almost all consumer
goods were selectively relaxed only in recent years, and abolished in 2001, after
India lost its case for retaining quantitative restrictions on balance-of-payments
grounds. Most manufactured consumer goods imports remain subjected to a tar-
iff rate of 25 percent. Much higher rates are applied in highly oligopolistic sectors
such as wines and spirits (166 percent) and automobiles (61 percent for new cars;
105 percent for second-hand vehicles; and 26 percent for completely knocked
down kits—giving very high effective protection to assembly operations). This
poses competition policy issues that do not seem to be getting recognized, and to
which I return below.
Competition Policy
In this section I will examine the working of the MRTP Act, and in the following
section the provisions of the new Competition Act. This two-pronged approach is
necessary because the chapter is being revised on the cusp of the old and new
regimes and because the new Competition Commission will probably inherit the
investigative staff and possibly some of the members of the present MRTP Com-
mission, and therefore many of its perspectives. In any case the new act provides
that competition cases initiated under the MRTP Act will continue to be adjudi-
cated under its provisions by the new commission, and in appeals to the Indian
Supreme Court.
The MRTP Act covered a wide range of anticompetitive practices and provided
for fines for violation of its provisions, and criminal penalties for noncompliance
Trade, Investment, and Competition Policy: An Indian Perspective 205

with Commission orders. It armed the designated agency—the Director-General
of Investigation and Registration—with extensive investigative powers and pro-
vided for a statutory MRTP Commission to decide cases. Of particular signifi-
cance to the interface with international trade, Section 14 of the Act provided for
orders against “any party to such practice [who] does not carry on business in
India…with respect to that part of the practice which is carried on in India.” This
provision is similar to the “effects” doctrine followed in Europe and the United
States, whereby foreign firms can be prosecuted for violations of competition law
that have adverse effects in the domestic jurisdiction. However, as I show below, a
recent judgment of the Indian Supreme Court has severely qualified this power,
holding that the MRTP Act has no extraterritorial application. Section 15 pre-
vented the commission from passing orders with respect to monopolistic or
restrictive trade practices that restrict “the right of any person to export goods
from India, to the extent to which the...practice relates exclusively to...such
export”; this too is similar to exceptions made in other countries. I take up three
policy issues for detailed discussion, with special attention to their international
dimension: mergers (which were dealt with in Chapter III of the MRTP Act, under
the rubric of “Concentration of Economic Power”), cartels, and predatory pricing
(both of which figured among the “restrictive trade practices” of Chapter V.A of
the act).7
Concentration of Economic Power Several sections of Chapter III were deleted
when the act was amended at the outset of the reforms in 1991 to remove the
additional investment approval required of “large” and/or “dominant” firms.
Among these was Section 23, which required government approval of mergers,
amalgamations, and takeovers involving such firms. The Securities and Exchange
Board of India also regulates “substantial acquisition of shares and takeovers,” but
again mergers are explicitly excluded as are substantial acquisitions approved by a
majority of the shareholders of the target firm. These provisions regulate the mar-
ket for corporate control, but not through the prism of market power.
In 1994 the Indian Supreme Court put its imprimatur on the situation result-
ing from the 1991 amendment. A merger of the multinational firm Hindustan
Lever Ltd. (HLL) with the Indian firm TOMCO, both significant players in the
market for soaps and detergents, was challenged on various grounds by the HLL
employees’ union. The issue that concerns us here is that the provisions of the
MRTP Act had not been adhered to, and the commission had erred in refusing to
grant an interim injunction against the merger. The Supreme Court ruled that
after the 1991 amendment deleted the relevant section of the Act, no government
approval was required because no other provision of the act could be construed to
require such approval. The merger could be questioned only if it was not carried
206 India and the WTO

out in accordance with the provisions of the Companies Act, or involved fraud or
illegality. Beyond the provisions of the MRTP Act, the plaintiffs also argued that
the merger would result in a large share of the market being controlled by a multi-
national company, and that consumer interests might be adversely affected. On
these grounds they sought to invoke the “public interest,” which in recent years the
Court had used to provide an expansive interpretation of fundamental rights in
areas such as environmental law. In the present case, however, the Court held that
the merger could not be stopped on the grounds that it violated public interest or
public policy. The majority judgment held that the MRTP and FERA amendments
were specifically intended to allow foreign firms to do business in India more eas-
ily, and “what has been expressly authorised by the statute cannot be struck down
as being against the public policy.” Consumer interests could be taken into consid-
eration only after the fact: “As a result of the amalgamation, if it is found that the
working of the Company is being conducted in such a way which brings it within
the mischief of the MRTP Act, it would be open to the authority under the MRTP
Act to go into it and decide the controversy as it thinks fit.”8 The problem with this
legally unexceptionable position is that the residual Section 27 (which survived
the 1991 amendment of the act’s Chapter III on concentration of economic power
and allowed the government to order division of an undertaking or severance of
interconnections between undertakings) had never been used.9 And as will be
noted below, important sections dealing with the abuse of dominance were lim-
ited in their effectiveness.
After the 1991 amendment and 1994 judgment, merger control—a subject of
both lively debate and serious enforcement in industrial countries—presented an
egregious gap in Indian competition law and economic analysis, even as the real-
ity changed dramatically. By far the most comprehensive database on mergers in
India has been compiled by Agarwal (2002). Figure 9.1 identifies three phases
based on the annual intensity of merger activity, such that the highest number of
mergers in a year in one phase is lower than the lowest number in the immediately
succeeding phase. A high level of merger activity has continued in 2001 and 2002
(“The ET-CMIE M&As Survey” 2003).
Recent research on this subject can be summarized as follows. Figure 9.1 sug-
gests that the legislative changes (both delicensing and MRTP amendments) of
1984/85 and 1991 reviewed above had a distinct impact on the frequency of merg-
ers, with a lag that can be attributed to the time required for negotiating the
merger and getting through the legal process. Using both industry and firm-level
data, Agarwal (2002) found econometrically that capacity utilization was signifi-
cantly positively related to merger activity, which indicated that mergers were
undertaken for expansionary motives. Almost all investigators found that most
mergers have been horizontal. In the initial years after the 1991 amendment,
Trade, Investment, and Competition Policy: An Indian Perspective 207
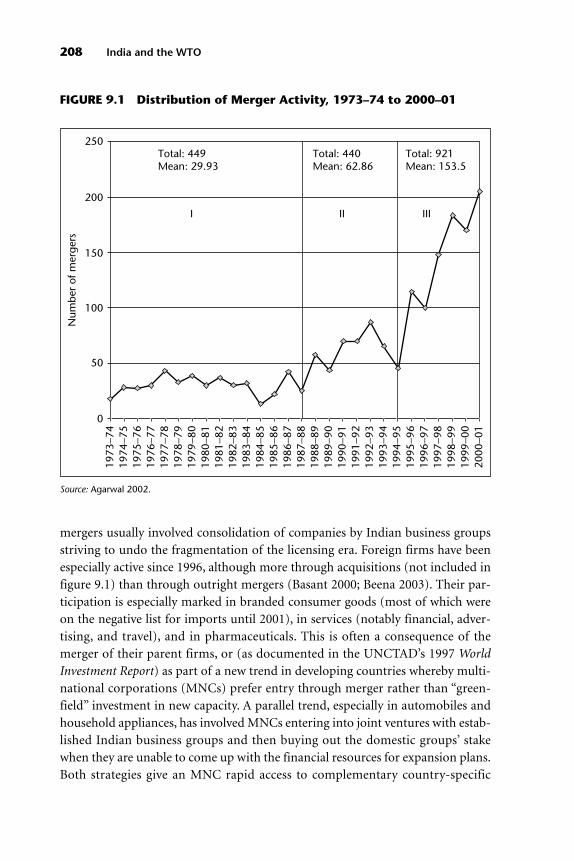
mergers usually involved consolidation of companies by Indian business groups
striving to undo the fragmentation of the licensing era. Foreign firms have been
especially active since 1996, although more through acquisitions (not included in
figure 9.1) than through outright mergers (Basant 2000; Beena 2003). Their par-
ticipation is especially marked in branded consumer goods (most of which were
on the negative list for imports until 2001), in services (notably financial, adver-
tising, and travel), and in pharmaceuticals. This is often a consequence of the
merger of their parent firms, or (as documented in the UNCTAD’s 1997 World
Investment Report) as part of a new trend in developing countries whereby multi-
national corporations (MNCs) prefer entry through merger rather than “green-
field” investment in new capacity. A parallel trend, especially in automobiles and
household appliances, has involved MNCs entering into joint ventures with estab-
lished Indian business groups and then buying out the domestic groups’ stake
when they are unable to come up with the financial resources for expansion plans.
Both strategies give an MNC rapid access to complementary country-specific
208 India and the WTO
1973
−74
1974
−75
1975
−76
1976
−77
1977
−78
1978
−79
1979
−80
1980
−81
1981
−82
1982
−83
1983
−84
1984
−85
1985
−86
1986
−87
1987
−88
1988
−89
1989
−90
1990
−91
1991
−92
1992
−93
1993
−94
1994
−95
1995
−96
1996
−97
1997
−98
1998
−99
1999
−00
2000
−01
250
200
150
100
50
0
Total: 449Mean: 29.93
I II III
Total: 440Mean: 62.86
Total: 921Mean: 153.5
Num
ber
of m
erge
rs
FIGURE 9.1 Distribution of Merger Activity, 1973–74 to 2000–01
Source: Agarwal 2002.

assets that it lacks, especially market knowledge, distribution networks, and con-
tacts in government.
MNC acquisitions often have involved financially weak or loss-making Indian
firms, or the spin-off of firms from an overdiversified Indian business group.
Khanna (1999) attributed the vulnerability of Indian companies and partners to
the mismanaged financial sector reforms in the early years of liberalization, which
resulted in both banks and individual investors burning their fingers and a subse-
quent drying up of both debt and equity markets. Poor macroeconomic manage-
ment and the consequently higher cost of capital also were significant (Basant and
Morris 2000). Kumar (2000) argued persuasively that such mergers have adverse
consequences for capital formation, the balance of payments, technology transfer,
and competition.
On this last issue, market share data compiled from company annual reports by
the Centre for Monitoring Indian Economy (CMIE 1999) showed that HLL’s mar-
ket share in soaps rose from 19.7 percent in 1992/93 (the year before the merger
with TOMCO) to 26 percent in 1997/98; in synthetic detergents and scouring
agents it rose from 33.1 percent to 46.7 percent, although CMIE (2001) indicated
that it has dipped in recent years. Market research data (Naidu 2000) put its share
of toilet soaps and shampoos at over 60 percent and detergent bars at 45 percent.
Other mergers and acquisitions have given HLL market shares of 60 percent in tal-
cum powder, 70 percent in color cosmetics, 75 percent in jams, more than 40 percent
in ketchups, and 45 percent in packaged tea. Other important mergers involving
foreign firms have been in carbonated drinks (effectively a Coke–Pepsi duopoly,
with a few minor players), storage batteries (where the Herfindahl index of con-
centration has risen from 0.268 in 1994/95 to 0.483 in 1999/2000), shaving prod-
ucts (0.04 to 0.33 in the same period), and cement (where significant merger activ-
ity began only in 1999 and data are not yet available).10
All of these amalgamations have involved market shares of a magnitude that
would attract the attention of competition authorities in most industrial coun-
tries, but in India all this merger and acquisition activity was beyond challenge.11
And these are not products for which economies of scale or technological progress
would justify greater concentration; indeed HLL outsources production of many
of these items to several independent firms and markets them under its brand
names. Note that almost all of these industries involve consumer goods, for which
effective protection has if anything increased (see Chapter 2). I should also
acknowledge, however, that apart from cases like those mentioned above, the
industrywise Herfindahl indexes calculated by Basant and Morris (2000) for
1992–98 and those reported for more recent years (presented in CMIE 2002) indi-
cate that there has been no widespread increase in industrial concentration; in
fact, concentration seems to have declined in many sectors, although to levels that
Trade, Investment, and Competition Policy: An Indian Perspective 209
are still high by international standards. On the other hand, Beena (2003) found
for a much smaller sample that the Herfindahl index did increase in most product
lines in which mergers occurred. It is difficult to say anything definite on this sub-
ject because the data source used by all such studies covers only firms listed on the
Mumbai stock exchange. Concentration indexes based on these data would there-
fore underestimate concentration because they exclude fully state-owned and
fully foreign-owned firms and joint ventures (which would be much larger than
the average for the industry), and overestimate it because they leave out unincor-
porated enterprises and private limited companies (which would be relatively
small) and imports.
Restrictive Trade Practices Restrictive trade practices (RTPs) were defined in
broad terms in one section of the act, with an illustrative list of agreements that
must be registered and deemed to be prejudicial to the public interest given in
another section, and a list of “gateways” or permissible defenses in yet another sec-
tion. The impugned agreements covered a range of horizontal and vertical
restraints, as well as price discrimination and predatory pricing. Unlike the cases
of concentration of economic power in which the MRTP Commission could only
review mergers referred to it by the government and recommend action, in the
case of RTPs it could initiate inquiries and pass its own orders. Those orders could
either require the violator to “cease and desist” from the practice or modify the
practice suitably. Sandesara (1994) and Singh (1999) documented the track record
of uneven enforcement. Because fines for noncompliance were modest and jail
terms never awarded the orders were often ignored. Most investigations have per-
tained to vertical restrictions, especially tying and resale price maintenance, and
instances of individual consumer dissatisfaction. Practices such as price fixing and
predation that have a bearing on the focus of this chapter were involved in only a
small minority of cases, with “inquiry closed” being the reported result more often
than not.
The cases tabulated by Sandesara and by Singh cover the period from the incep-
tion of the MRTP Act until 1991 and were compiled from the annual reports that
the commission is statutorily required to submit to parliament. It is not possible to
say much about the post-reform period because reports after 1993 do not provide
the necessary information about the distribution of cases by type of RTP. However,
a few quick points can be made. First, the number of inquiries initiated each year
declined in the 1990s, and a perusal of the published judgments of cases decided (a
small fraction of those initiated) shows that vertical restrictions continued to pre-
dominate between 1991 and 1998 (Basant and Morris 2000). Second, with discus-
sions at the WTO now focusing on international cartels, it is revealing that my
scrutiny of cases decided and reported between 1998 and 2002 shows that only
210 India and the WTO

three involved allegations of price fixing. In none of them could the charge be sus-
tained, even though the alleged participants were domestic companies against
which evidence should have been easier to obtain. The law’s inability to deter even
hard-core cartels was highlighted recently by a price fixing arrangement made by
several leading cement manufacturers in 2000/01 that persisted despite the com-
mission’s notice of inquiry. The names of the participants and details of their deci-
sions were reported in the press, but no effective action has been taken.
Third, other government policies actually encourage price fixing. In such
highly oligopolistic sectors as fertilizers, petroleum products, and many pharma-
ceuticals, the government itself fixes prices. And a basic tenet of anticartel policy is
undermined in India by other legislation that forces producers of packaged goods
to label them with the maximum retail price. This is obviously a measure to pro-
tect consumers from being overcharged, and under the resale price maintenance
clause of the act, the commission frequently has cited firms that prevent their dis-
tributors from charging lower prices. However, publicly declared prices are well
known to facilitate oligopolistic collusion by reducing the threat of secret dis-
counts and price wars. This labeling requirement has acquired a trade dimension
because after abolishing the remaining quantitative restrictions on imports in
2001, the government extended the requirement to imported goods to ensure a
level playing field for Indian producers. This well-intended move will certainly
facilitate collusion.
Fourth, regarding vertical restrictions, RTPs by Indian firms do not appear to
create a “Japan problem” by inhibiting market access to foreign suppliers. Accord-
ing to the United States Trade Representative’s (USTR’s) Report on Foreign Trade
Barriers for 2000 (pp. 166–67):
Both state-owned and private Indian firms engage in most types of anticompetitive
practices with little or no fear of reaction from government overseers or action from a
clogged court system. India suffers from a slow bureaucracy and regulatory bodies that
reportedly apply monopoly and fair trade regulations selectively. These practices are
not viewed as major hindrances to the sale of U.S. products and services at this time.
The USTR’s complaint is thus directed against the MRTP mechanism rather
than the practices it is supposed to regulate. The USTR’s 2001 report reproduces
the same paragraph and then adds the following: “…although U.S. industry (e.g.,
soda ash) has been denied access to the Indian market as a result of an adverse rul-
ing by the government of India’s monopolistic and restrictive trade practices com-
mission” (p. 187). An examination of this particular dispute is instructive. The fol-
lowing discussion summarizes and updates the more detailed treatment in
Bhattacharjea (2000), which provides extensive citations from the MRTP Com-
mission orders and press reports.
Trade, Investment, and Competition Policy: An Indian Perspective 211

Predatory Pricing In September 1996 the MRTP Commission imposed an
interim injunction order on the American Natural Soda Ash Corporation
(ANSAC), restraining it from cartelized exports to India, on a plea by the Alkali
Manufacturers Association of India (AMAI), alleging infringement of several sec-
tions of the MRTP Act, including cartelization, predatory pricing, and exclusion
from the American association.12 In 1997 the commission rejected ANSAC’s
review petition. It held that ANSAC was prima facie (at first view) a cartel and
asserted that Section 14 of the MRTP Act gave the commission jurisdiction “with
respect to that part of the practice which is carried on in India,” even though the
cartel itself was formed outside India. It confirmed its earlier injunction, and at
the same time allowed the individual American firms to export to India (which
ANSAC rules did not permit) but not as a cartel. The commission indicated that a
letter from an executive of ANSAC setting lower prices for exports to India than to
other countries gave rise to a possible inference of predatory pricing, but it made
no final determination on the issue. Nor did it rule on the question of public
interest and gateways, but it suggested that the possible closure of Indian produc-
ers and the unemployment of their workers would be considered relevant to the
public interest.
In February 2000, with the final verdict still out and the injunction in force, the
case became a live international political issue. In a joint letter, the USTR and U.S.
secretary of commerce asked the Indian minister for commerce and industry to
address the obstacles to market access that ANSAC was confronting, including
high tariffs and the “de facto embargo” created by the injunction. They linked the
satisfactory resolution of the problem with renewal of benefits for Indian exports
under the Generalized System of Preferences. In March 2000 the commission
again upheld the maintainability of the proceedings. It dismissed ANSAC’s fresh
contention that the case involved dumping rather than predatory pricing and as
such did not come under the MRTP Act. It held that the allegations of carteliza-
tion and predatory pricing, as well as the public interest dimension of the case,
brought it under the act. It reiterated that ANSAC was prima facie a cartel, and
that the impugned practice had an effect in India. Conflicting evidence on preda-
tory pricing submitted by the parties was found to be inconclusive, but the com-
mission again recorded a possible inference in support of the allegations.
With American soda ash thus effectively shut out of the Indian market in 1996,
other suppliers entered the picture. In 1997/98, 60 percent of soda ash imports
came from China. And in April 1998 the commission passed orders on another
petition by the AMAI—this time against a Chinese firm, restraining it from
exporting at a price below “fair market value.” A year later the AMAI asked the
commission to fix the fair market value, and in its order of May 13, 1999, finding
from the material placed before it that the Chinese firm’s selling price in its
212 India and the WTO

domestic market was US$132 per metric ton, the commission did so in the fol-
lowing terms:
The export price would certainly be slightly higher keeping in mind the margin of
profit and other factors. It would therefore be quite proper to consider the fair and
normal price of Chinese Soda Ash to be imported into India at US$150 per Metric
Tonne… It is hereby clarified that the respondents shall not be permitted to export
into India any Chinese Soda Ash below the fair and normal value of US$150 per
Metric Tonne [Alkali Manufacturers’ Association of India 1999, paras. 10 and 13].
In a third case, involving imports of float glass from Indonesia, the commission
again restrained imports at predatory prices, this time accepting the Indian indus-
try’s data on foreign costs because the respondents did not appear before the com-
mission to dispute them. The two-member majority also expressed considerable
concern about the loss of jobs and investors’ funds in the Indian float glass indus-
try, which they held to be against the public interest. The chairman of the com-
mission felt that even though the imports in question supplied less than 2 percent
of the Indian market,“in the long run this trickle will be transformed into a flood”
(All India Float Glass Manufacturers’ Association 2000, para. 21) if unchecked, and
that Indian consumers could very well afford to pay more for domestically pro-
duced float glass, which was about 12 percent more expensive than the Indonesian
product. The concurring member opined that there was no reason to expect that
Indonesia possessed comparative advantage in the production of float glass. A dis-
senting member found no evidence of pricing below costs or of intent to elimi-
nate competition, and held that injury to the domestic industry, even if it could be
proved, was relevant for claiming an antidumping remedy rather than one under
the MRTP Act.
As I have argued at greater length in Bhattacharjea (2000), these rulings were
inconsistent with earlier practice and with much of the economic analysis that
suggests that predatory pricing laws require a higher standard and are hence less
vulnerable to the kind of protectionist capture that has been witnessed in
antidumping cases. I return to this in the next section. In a far-reaching verdict
delivered in July 2002, however, the Indian Supreme Court overturned the MRTP
orders in the ANSAC and float glass cases. It did not go into the allegations of
cartelization or predatory pricing, but instead held that the wording of the MRTP
Act did not give it any extraterritorial jurisdiction. The commission could there-
fore not take action against foreign cartels or the pricing of exports to India, nor
could it restrict imports. Action could be taken only if an anticompetitive agree-
ment involving an Indian party could be proved, and that only after the goods had
been imported into India. Contrary to the commission’s alignment of the public
interest with that of the domestic industry, the Court declared that Indian industry
Trade, Investment, and Competition Policy: An Indian Perspective 213

needed to gear up to face the challenge of foreign competition.13 I discuss this
judgment in greater detail in Bhattacharjea (forthcoming). The most immediate
effect of the decision has been a government-sponsored amendment of the new
competition bill that explicitly arms the proposed Competition Commission with
the power to restrict imports. This is discussed in greater detail below.
Some Insights from Theory
This section complements the descriptive material in the one that preceded it,
retaining its emphasis on competition policy as applied to international trade and
investment in the specific areas of entry, mergers, and predatory pricing. Social
welfare and efficiency, as usually defined, will be the criteria for judging outcomes.
The analytical framework to be employed is thus firmly within the mainstream
paradigm used to analyze both trade liberalization and competition policy,
although in this case it delivers results that are at variance with current fashions.
Central to this discussion will be an important feature of developing countries:
the small size of domestic markets relative to the costs of setting up production
and marketing facilities.
Entry
An extensive body of theoretical literature from the 1980s has established what is
sometimes known as the “excess entry theorem” in the presence of oligopoly and
economies of scale. Using the standard measure of social welfare, entry has a pos-
itive effect on consumer surplus (through lower prices and greater variety), but
that effect can be outweighed by a negative effect on producer surplus as each
entrant “steals business” from existing producers and forces them to operate on a
smaller scale. Although this possibility was demonstrated in special cases by sev-
eral authors, it was shown to be quite robust by Mankiw and Whinston (1986).
There is an even older literature that assesses this problem in an open economy,
which should be at the heart of the current debate on competition policy. An early
paper by Eastman and Stykolt (1960) and an empirical investigation by Cox and
Harris (1984) attributed inefficient excess entry to high levels of protection, and
argued that trade liberalization would bring additional gains from trade by elimi-
nating monopoly distortions and encouraging exit and “rationalization” of such
industries, with the surviving firms able to produce on a larger scale. Although
their articles were based on Canadian experience, they conform to the perceived
reality of most developing countries as far as competitively supplied imports are con-
cerned. In this “small open economy” setting, free trade is the standard prescription,
and excess entry could therefore be blamed on wrong-headed protectionist policies.
214 India and the WTO

Exposure to import competition imposes “market discipline” on imperfectly
competitive domestic firms, forcing them to act as price-takers with respect to the
world price. Entry then displaces only imports or yields additional exports with
no theft of business from incumbent domestic firms.
If the number of foreign firms is limited, however, so that prices are greater
than domestic marginal costs, the business-stealing effect reappears. The first
author to recognize excess entry in an international oligopoly setting was Dixit
(1984), who showed that there could be a case for some reduction in the number
of home firms via mergers even under free trade if the share of imports was small.
The larger profits earned by a more concentrated domestic industry at the
expense of foreign firms (and foreign consumers, if some output is exported)14
could outweigh the loss to domestic consumers over some range.
As Dixit himself showed, however, free trade is not optimal under international
oligopoly. The literature on “strategic trade policy” that also emerged during the
1980s demonstrated that tariff protection could be used to shift profits from oli-
gopolistic foreign exporters to domestic firms and governments. Such optimal
tariffs are typically decreasing in the number of domestic firms, and should there-
fore dampen the tendency to excess entry. However, in Bhattacharjea (1995) I
showed that even domestic entry conditioned on a rationally anticipated, time-
consistent tariff appropriate to the post-entry market structure can result in
excessive (welfare-decreasing) entry. Indeed, with Cournot competition, although
the first domestic entrant into a market served by a foreign monopolist always
improves welfare, free domestic entry in this setting is socially excessive if it results
in any market structure more competitive than duopoly.
Nor is excess entry easily reversed by trade liberalization. If entry costs are sunk
(nonrecoverable), then the damage cannot be undone, and exposing the industry
to import competition may not get rid of the unwanted firms because the level of
profit that triggers exit is less than that which encouraged entry.15 The superfluous
entrants may then remain in the industry, with that part of their fixed costs that is
not sunk remaining a recurring social burden. Even if exit does occur, there is no
guarantee that the survivors will produce on a larger scale. As Head and Ries
(1999) have shown, with imperfect competition both the theoretical predictions
and empirical evidence on the impact of trade liberalization on firm scale are
ambiguous.
The mirror image of excess domestic entry is limited foreign entry in the form
of imports from or direct investment by oligopolistic foreign firms. A number of
authors recently have shown that the advent of the first few foreign firms in com-
petition with a domestic oligopoly decreases welfare below the autarky level. Here the
business-stealing effect dominates the procompetitive effect. I provided a detailed
survey of this literature and a unifying theoretical framework in Bhattacharjea
Trade, Investment, and Competition Policy: An Indian Perspective 215
(2002), which also showed that the welfare decline is steeper if foreign firms have
lower costs, if the domestic industry is highly concentrated, or if the private costs
of domestic production exceed social opportunity costs, all of which are likely to
occur in developing countries.16 Welfare begins to rise again only after a certain
crucial amount of foreign entry, giving a J-shaped relationship between welfare
and the number of foreign firms. With Cournot competition, linear demand, and
constant costs, I showed that welfare eventually regains the autarky level only
when foreign firms capture at least 80 percent of the home market.17 I also showed
that an optimal tariff conditioned on the market structure prevents the initial wel-
fare decline in the case of import penetration, although for various reasons stated
there this cannot be used as a practical guide to policy, and is in any case unavail-
able if foreign entry takes the form of FDI. In fact, protection can encourage “tariff-
jumping” FDI, which, as Levy and Nolan (1992) and Bhattacharjea (2002) have
shown, is more likely to be welfare reducing, even if it brings in better technology
and greater product variety.
All of the models reviewed above treat FDI and exports simply as alternative
means of entering the domestic market, differing only in the possibility of border
taxes on imports. But critics might object that if the foreign firms are part of a
multinational corporation, this framework is not adequate. An established tradi-
tion in the economic analysis of MNCs recognizes that firms invest abroad to
exploit intangible assets that inherently give them market power. UNCTAD
(1997) provided an even-handed review of the issues that arise out of this for
developing countries. It can be argued that it is precisely these proprietary assets
of MNCs that make their advent desirable for developing countries because such
assets are costly to develop and often take the form of firm-specific tacit knowl-
edge that cannot be unbundled and acquired through transfer at arm’s length.
Proponents of FDI argue that spillovers of such know-how benefit domestic
firms.
Evidence on spillovers is mixed, however, and suggests that if there is limited
domestic competition, or if domestic firms lack the ability to imitate, foreign pres-
ence can lead to negative spillovers on domestic productivity by forcing them to
contract (see Blomstrom and Kokko 1998; and Aitken and Harrison 1999). MNCs
also have financial “deep pockets” and the resources to engage in modes of non-
price competition and restrictive business practices that may be new to the host
country, making for foreign entry leading to greater concentration (UNCTAD
1997). However, the preceding analysis shows that the effects of foreign entry are
ambiguous even if FDI leads to a reduction of concentration by increasing the
total number of firms, and the foreign firms behave no differently from their
domestic counterparts. This insight needs to be set off against the undeniable
benefits of FDI. The finding that limited foreign entry is unambiguously bad for
216 India and the WTO
domestic welfare, especially if foreign firms have a cost advantage, only reinforces
the argument by UNCTAD (1997) that developing countries should be cautious
about giving “market power inducements” in the form of exclusive production or
marketing rights to attract FDI. This is especially important in infrastructure
activities like power and telecommunications, where import competition is absent
and firms may deny access to their distribution networks (where natural monop-
oly conditions prevail) and thereby block the entry of rivals at the potentially
more competitive generation/switching stages.
This analysis puts a question mark over the Indian government’s policy of
case-by-case clearance of FDI proposals involving more than 51 percent foreign
equity, without any apparent concern that foreign firms should provide competi-
tion for each other—obviously in price and quality, not in advertising wars such
as those between Coke and Pepsi. This policy was especially misguided in infra-
structure, where import discipline is absent, and in consumer goods, where
imports were restricted until recently and remain subject to high tariffs. Clearly
the guaranteed price and off-take promised to foreign firms for some of the early
post-reform power projects on the basis of negotiations rather than competitive
bidding look especially bad in this framework. These early mistakes are being rec-
tified now.
Empirical application of the kind of models surveyed above usually takes the
form of calibrated partial equilibrium models, where “outside” estimates of costs
and demand are combined with data on market structure to reproduce observed
price and output behavior, with the implied conjectural variation parameter
being obtained endogenously. Even practitioners are unhappy with this proce-
dure, and because it is designed to estimate equilibrium relationships, it is proba-
bly not suitable for an economy in transition. I offer indirect evidence of excess
entry instead. A number of sophisticated econometric studies recently have
shown that rates of total factor productivity growth (TFPG) in Indian industry
have been lower and even negative in the post-reform period (see Balakrishnan
and Pushpangadan 1998; Balakrishnan, Pushpangadan, and Kumar 2000; Srivastava
2001; Das 2001; and Unni, Lalitha, and Rani 2001). TFPG measures the increase in
output minus the increase of a weighted sum of inputs. Although there could be
various explanations for this deterioration of performance, it is consistent with
excess capacity creation, as the first and last of the articles actually have suggested.
This is because the new entrants reduce the output of existing firms without pro-
portionately reducing their fixed stocks of labor and capital.18
Recent research by Banga (2003) shows that in the second half of the 1990s
TFPG was higher in industries without FDI than in those with FDI. Her econo-
metric analysis with various control variables and foreign presence disaggregated
by source shows that TFPG was negatively related to U.S. equity participation in
Trade, Investment, and Competition Policy: An Indian Perspective 217

an industry, whereas Japanese presence had a positive effect. Firm-level analysis
showed that higher Japanese equity participation was associated with higher
TFPG in the firms in which it was present and with positive productivity
spillovers to Indian firms in the same industries. U.S. presence had neither effect.
On the basis of other evidence she compiled, Banga attributes these results to the
American firms’ relatively larger size, to technology gaps vis-à-vis domestic firms,
and to their concentration in highly oligopolistic industries with more significant
economies of scale. These factors would make their output-displacement effect
stronger and the technology spillover effects weaker than those of Japanese FDI.19
As to more informal sources, reports in the business press have blamed on
excessive entry the recessionary conditions prevailing in industries like steel,
cement, soda ash, and automobiles. Industry observers believe that comprehen-
sive restructuring through exit and merger is inevitable in the near future, but
with official help these industries are resisting the inevitable. Commercial imports
of cars, which were released from quantitative restrictions in 2001, have been sub-
ject to high rates of import duty so that the industrial structure will remain frag-
mented and continue to operate at suboptimal scales of production. The cement
industry began consolidation through mergers in 1999, but has more recently
organized a successful cartel. The soda-ash industry succeeded in obtaining
MRTP injunctions (and, more recently, antidumping duties) to protect itself from
imports. Steel similarly has been protected by antidumping duties and successive
bailouts by public sector financial institutions.
Mergers
A growing body of theoretical literature uses the number of home and foreign
firms in an international oligopoly model as policy parameters representing the
strength of merger policy. Despite tractable results being obtained only with
Cournot models with constant costs (and usually linear demand), no robust con-
clusion has emerged. Depending on the relative numbers of home and foreign
firms; on whether the firms compete in the domestic market, the foreign market,
or both; on the countries’ trade policies; and on the importance of economies of
scale, a country may want to increase or decrease the number of home firms, given
the number of foreign firms (or vice versa), and to change the number of home
firms in the same or opposite direction as that of its trading partners (see Dixit
1984; the articles summarized in Lloyd 1998; and Horn and Levinsohn 2001).
A problem with these approaches is that they deal only with small changes in
the number of firms, although it is well known that a horizontal merger among
Cournot competitors with constant costs is unprofitable for the firms themselves
because of the free-riding and expansion of output by “outsider” firms, unless it
218 India and the WTO
brings about a cost reduction or unless a substantial proportion of the firms in an
industry internalize the externality by merging. The latter action adversely affects
consumers but benefits firms, including the outsiders, whereas cost savings can
result in welfare gains, despite their adversely affecting rival firms. When firms
and consumers are distributed across countries, national competition authorities
may see different tradeoffs between the benign and malign effects of a merger. A
model by Head and Ries (1997) showed that mergers may be approved because
they increase welfare in their home jurisdictions even though they reduce world
welfare. This is more likely when the cost savings, home consumption, and post-
merger number of firms are small.
Bhattacharjea (2002) showed in the linear/Cournot framework that if domes-
tic oligopolists do not export—which is a more accurate description of develop-
ing countries—then foreign mergers can actually reduce home welfare below the
autarky level. I further showed that imposing an optimal tariff can mitigate the
consequences of foreign mergers, but the optimal tariff rate is typically inversely
related to the number of foreign firms and to their costs. Thus foreign mergers
that result in cost reductions (the sort that are profitable for the merging firms
and that foreign competition authorities are likely to approve) will entail higher
optimal tariffs and thereby put pressure on tariff bindings. As I indicated earlier,
tariffs also can induce inefficient tariff-jumping FDI, which not only leads to a loss
of tariff revenue but also forces the foreign firm(s) to relocate production to a
higher cost environment. In the case of mergers between foreign-owned sub-
sidiaries operating in the host country, the tariff remedy is unavailable and the
original conclusion applies: having too few foreign firms can be worse than having
none. With regard to the home government’s optimal response in the number of
domestic firms to change in the same or opposite direction to changes in the
number of foreign firms, I show that there is more likely to be international dis-
cordance in merger policy when home firms do not export, compared with the
reciprocal oligopoly result presented in Horn and Levinsohn (2001).
This analysis can be integrated with the earlier one on foreign entry as follows.
Whereas limited foreign entry involves descending the left branch of the J-shaped
curve relating welfare to the number of foreign firms, mergers between foreign
firms involve descending the right branch. If fixed costs relative to market size limit
the number of firms, a country that turns a blind eye to entry and foreign mergers
might end up wallowing in the trough of the J, worse off than under autarky.
Predatory Pricing
Here I will not review the large body of theory that exists (see Ordover [1998],
Tharakan [2000], and Bhattacharjea [2000] for surveys). Much of it shows that,
Trade, Investment, and Competition Policy: An Indian Perspective 219

contrary to the early skepticism of the Chicago School, “rational predation” is a
distinct possibility. But it also reveals that the commonly used Areeda-Turner test
(which involves checking to see whether the price is below the alleged predator’s
average variable costs) is neither necessary nor sufficient to establish predation.
Although there is no consensus about what other standard to apply, it is argued
that the commonly used criteria for a finding of predatory pricing do set a stricter
standard than do existing antidumping procedures. For one thing, the criteria
usually require evidence of predatory intent and market power on the part of the
alleged predator, whereas no such evidence is required in antidumping actions.
Second, the Areeda-Turner test is more exacting than the test required in dump-
ing cases, which can be satisfied by evidence of either international price discrim-
ination (a legitimate business practice that can even be beneficial to consumers in
low-income countries), or of pricing below a constructed value that typically
includes overheads (which is again normal in periods of depressed demand).
Finally, predatory pricing requires demonstration of injury to competition, rather
than to competitors as is required in antidumping suits.20
Authorities in the United Kingdom routinely investigate the market structure
of the industry concerned because forcing the exit of a rival firm is fruitless if the
victim or other firms can easily (re-)enter the market. An even stricter standard is
used in the United States. Possibly influenced by game-theoretic analyses
advanced by expert witnesses in the Matsushita (1986) and Brooke Group (1993)
cases, the U.S. Supreme Court examined the alleged predators’ prospects for
recouping losses sustained during the predatory campaign. These insights from
theory were explicitly rejected by the European Court of Justice, however, which
held in a significant decision that a “price set below average variable cost must
always be considered abusive…. Predatory pricing may be penalised whenever
there is risk that competitors will otherwise be eliminated without requiring addi-
tional proof that the undertaking in question has a realistic chance of recouping
its losses.”21
Even if we ignore the recoupment rule, it is clear that the Indian cases reviewed
above yielded outcomes that were considerably more favorable to the Indian firms
than what they could have obtained through antidumping suits.22 In looking at
evidence of price discrimination rather than pricing below costs and intent to
eliminate competition, and expressing concern at injury to the Indian industries,
the MRTP Commission applied a dumping standard rather than one on preda-
tory pricing. Evidence of severe financial injury, or even the possible closure of the
target firm(s), is not sufficient to establish predation, and concern for the interests
of workers and investors in the endangered industries ignores those of the down-
stream industries that use their products. Furthermore, even if the Indian firms
had shut down, the alleged predators would not have acquired dominant positions.
220 India and the WTO
As I have argued in Bhattacharjea (2000), the soda-ash imports that were inter-
dicted represented less than 2 percent of Indian consumption, and in the relevant
years, nonnegligible quantities were supplied to India by several countries other
than the United States and China—whose exports were targeted by AMAI. The
same was true of float glass imports from Indonesia. Nor are these products for
which brand loyalties or switching costs may lock in a dominant position acquired
by successful predation. The soda-ash cases were more in the nature of dumping,
for which WTO-compatible remedies exist.
The relief granted in ANSAC effectively shut out soda-ash imports from the
United States. In the case against the Chinese industry it took the form of a mini-
mum import price set above the exporter’s domestic market price, whereas
antidumping duties would at most have offset the dumping margin, allowed con-
sumers to benefit from further reductions in the foreign price, and brought rev-
enue to the government. I certainly am not arguing that predatory pricing never
occurs. The standard “long purse” story based on unequal financial resources may
well describe the situation in recent years, when increased competitive pressures
and crippled financial markets made Indian firms vulnerable to merger bids by
multinational corporations in industries with significant barriers to domestic and
foreign entry. It is ironic that whereas the soda-ash imports were restrained
although they were unlikely to have been predatory, the possibility of predation
for merger in other industries was never examined.
The Road Ahead
With WTO negotiations on competition policy on the horizon, the institutional
backdrop in India has been transformed by the December 2002 passage of the
Competition Act. The act is a distinct improvement on the MRTP Act in many
ways. It covers with a much more modern approach the usual three areas of anti-
competitive agreements, abuses of a dominant position, and mergers, and wisely
avoids such areas as monopolistic pricing, control of firm size, and “unfair trade
practices.” Most anticompetitive practices are now clearly defined. Predatory pric-
ing is now under the section dealing with the abuse of a dominant position, and is
explicitly defined as “the sale of goods or provision of services at a price which is
below costs, as may be determined by regulations, of production…with a view to
reduce competition or eliminate the competitors.” Several criteria are listed for
judging whether an agreement is anticompetitive, a market position is dominant,
or a merger will have an adverse effect on competition. Criteria for determining
the relevant geographical or product market are listed. The act provides for several
regional benches of the Competition Commission, as well as specialized merger
benches. It also provides for professionals to serve on the commission and in the
Trade, Investment, and Competition Policy: An Indian Perspective 221
director general’s office, and for hearing expert testimony. The fines are substan-
tial: 10 percent of turnover or three times the profits from cartelization.
On the international front, the act provides for cooperation between the Com-
petition Commission and foreign agencies. Section 3(5), like Section 15 of the
MRTP Act, exempts agreements exclusively relating to exports. Section 32 restates
the “effects” doctrine that was embedded in Section 14 of the MRTP Act, establish-
ing jurisdiction over foreign anticompetitive practices that have an effect on the
relevant market in India. In response to the Supreme Court judgment in Haridas
Exports, this has now been reinforced by an amendment inserting subsection 33(2),
explicitly giving the commission the power to restrain imports. In reinstating the
merger review powers that were deleted from the MRTP Act, the new act defines
“combinations” that are subject to challenge on the basis of alternative thresholds
for domestic and international assets or turnover. Although it boldly asserts that
“no person or enterprise shall enter into a combination which causes or is likely to
cause an appreciable adverse effect on competition within the relevant market in
India and such a combination shall be void,” it is unlikely that the Competition
Commission will be able to challenge offshore mergers. At best it can challenge the
merger of their local subsidiaries, and India can free ride on U.S. and EU authori-
ties blocking or modifying mergers in their own and each other’s jurisdictions.
Although the act is a distinct improvement over its predecessor, I share the
reservations of several commentators concerning the actual implementation of its
provisions. The multifarious criteria (13 each for determining dominance and the
anticompetitiveness of mergers!) will be of little help to a body that lacks institu-
tional memory or theoretical understanding of their significance. Fortunately, the
Competition Act does not have the MRTP Act’s provisions on unfair trade prac-
tices (see note 7), and transfers pending cases involving such practices to the con-
sumer courts to be dealt with under the Consumer Protection Act. But with its
energies devoted to those issues, which are not part of competition law as it is nor-
mally understood, the investigative, prosecutorial, and adjudicatory wings of the
commission were unable to develop an understanding of the important economic
arguments required for the enforcement of a modern competition law. The judg-
ments I have studied show a lack of appreciation of basic distinctions, such as
those between marginal costs and average total costs, comparative and absolute
advantage, predatory and discriminatory pricing, producer interests and the
“public interest,” and the partial and general equilibrium consequences of import
competition for employment. Firms were subjected to inquiries for engaging in
normal business practices, such as underutilization of capacity or raising prices
disproportionately to costs.
One may legitimately ask, then, where is the expertise required to implement
the new law in all its complexity? The revival of merger review powers in particular
222 India and the WTO

has come about as an unsatisfactory compromise. The initial proposal for manda-
tory review of proposed mergers over a certain asset or turnover threshold faced
tremendous criticism from business lobbies, and was diluted by making pre-
merger notification voluntary, with a proviso that approval would be deemed to
have been granted if no decision is reached in 90 days. But the act empowers the
commission to look into a merger up to a year after it is completed and to undo or
modify it if it sees fit to do so. The unscrambling of firms’ assets is likely to be a
hugely costly operation for which there is no official expertise, thanks to the
nonenforcement of Section 27 of the MRTP Act. Expertise is lacking even with
regard to ex ante evaluation. For more than a decade there has been no merger
regulation in India, and prior to that regulation focused more on preventing the
concentration of industrial ownership than on market power.
These problems are likely to be compounded by several amendments that were
introduced by the government when the bill was being passed in December 2002.
I have discussed these at length in Bhattacharjea (forthcoming), but some need to
be mentioned here. One amendment allows an efficiency defense for joint ven-
tures, introducing yet another criterion that will be difficult to operationalize.
Another amendment allows a “meeting the competition” defense for price discrim-
ination, without comprehending that this can serve as both an entry-deterring
strategy and a facilitating practice for collusion, and inexplicably extends this
defense to predatory pricing.
Another amendment, which is obviously a direct response to the Supreme
Court judgment overturning the MRTP injunctions on imports, inserts a new sub-
section 33(2) that allows the commission to issue temporary injunctions to restrain
any party from importing goods, if the import is likely to contravene the act’s sec-
tions on anticompetitive agreements, abuse of dominance, or combinations. Such
injunctions can be given without hearing the other party. This amendment will be
a boon for domestic producers hankering for the good old days of import control
when they could shut out import competition altogether, thanks to the require-
ment that a prospective importer produce a certificate to prove that the product
was not available in India. A similar power—on different grounds and only with
respect to imports from particular sources—will now be vested in the Competition
Commission, which does not have to hear the importer at all. The MRTP Act at
least provided gateways for the defense of RTPs. Sections 3 and 4 of the Competi-
tion Act, in contrast, make certain types of collusive agreements and abuse of dom-
inance illegal per se, subject only to the dubious defenses mentioned above, but
even they cannot be effectively considered at the injunction stage if the opposing
party is not given a hearing. And as illustrated by the two cases that were finally
decided by the Supreme Court, the injunction can remain in force for several years
during the regular hearing, the review hearing, and the appeal to the Supreme Court.
Trade, Investment, and Competition Policy: An Indian Perspective 223

There is no way the exporter, the importer, and the ultimate consumers can be
compensated for the losses they have suffered in the intervening period.
Even if collusion or abuse of dominance can be proved, an import prohibition
is surely the wrong remedy. Imports might be targeted for being priced too high
(as by a foreign merger or cartel) or too low (as by a dominant foreign firm
engaged in predatory pricing). If the prices are too high, then further restricting
competition by shutting out imports amounts to cutting off one’s nose to spite
one’s face (although the threat of an import restriction could be helpful to compel
foreign defendants to cooperate with the investigation and comply with the ulti-
mate verdict). If the prices are too low, an import restriction likely will be held to
be inconsistent with Article VI of the General Agreement on Tariffs and Trade and
the Uruguay Round Antidumping Agreement, which established a procedure for
dealing with low-valued imports and which require that domestic laws be brought
into conformity with that procedure. In 2000 the WTO Dispute Settlement Body
held that the U.S. 1916 Antidumping Act was inconsistent with these require-
ments and could not be exempted on the grounds that it was a national competi-
tion law. Ironically, India included itself as a third party in that case, on the side of
the complainants, the EU and Japan. The saving grace is that by introducing
explicit cost and dominance criteria for predatory pricing, the Competition Act
will make it more difficult to obtain the kind of injunctions against imports that
were obtained in the MRTP regime. But with both the EU and the United States
implacably opposed to replacing antidumping rules with competition principles
of this kind (see note 20), the literature on this point reviewed in the preceding
sections is now moot as far as a multilateral agreement is concerned.
Where does that leave us? With a competition act that contains problematic
provisions, a lack of expertise to interpret them, inordinate delays in delivering
judgments, and the very different understanding of competition matters dis-
played by the MRTP Commission in the predatory pricing cases, it is hardly likely
that India will succeed in obtaining the benefits of reciprocal positive comity with
advanced countries. Many of the anticompetitive practices dealt with in the
debates on trade and competition policy appear to be insignificant in India—for
example, export and import cartels and exclusionary vertical arrangements that
restrict market access to imports. This again means that we have little to offer in
terms of positive comity, little even to put on the table in multilateral negotia-
tions. Moreover, by making hard-core cartels intrinsically illegal, and by not
allowing differential treatment of domestic and foreign firms (thus providing de
jure national treatment, despite India’s arguments against it at the WTO Working
Group), the Competition Act has already satisfied the requirements of the EU,
which has been spearheading the move for a competition agreement at the WTO
(WTO 2002c). Perhaps for this reason, the EU trade commissioner recently
224 India and the WTO

declared that India’s competition regime was already “WTO-plus-plus,” and that
the country’s opposition to negotiations was purely tactical (“FDI behind India’s
Stance: Lamy” 2003, p. 2). India thus seems to be going to the 2003 Fifth WTO
Ministerial Conference with an intransigent position on competition, without
much to bargain with except perhaps an offer to bind the provisions already
enshrined in the Competition Act in exchange for other concessions.
I believe that a more proactive approach is required. One idea is to bring into
force various sections of the act at staggered intervals, as provided for in the act
itself. A good place to begin would be the section on cartels, on which there is con-
siderable international consensus. In fact it is the only specific anticompetitive
practice mandated by the Doha declaration for study by the working group.
Doing so would help to draw on the promised technical assistance from foreign
agencies and expose Indian investigators to international practices. Provided that
agricultural marketing boards and associations of small exporters can be
exempted, India could easily subscribe to an international agreement rescinding
the exemptions regarding export cartels in national competition laws, because
India is more likely a victim than a promoter of such cartels.
Merger review for domestic firms should be kept in abeyance for the time
being. Apart from the commission’s lack of expertise to evaluate mergers, Indian
industry needs to restructure after a decade of excess entry. A certain amount of
consolidation is also required to overcome the legacy of the earlier control regime,
which fragmented capacities among firms and regions and forced business groups
into excessive conglomerate diversification by checking their expansion in any one
line. A permissive approach to mergers may be required as a concomitant to fur-
ther trade liberalization, particularly because closures seem politically out of the
question and the existing policy toward what are called “sick industries” simply
keeps resources unemployed throughout extremely protracted winding-up pro-
ceedings. On the other hand, in expanding sectors like consumer nondurables,
where neither scale economies nor technological change is significant enough to
justify greater concentration, concentration probably has gone too far already, as
the market share data cited earlier show. Advertising, brand loyalties, and exten-
sive distribution networks will make the incumbents difficult to challenge.
The preceding analysis suggests, however, that both entry and mergers involv-
ing foreign firms will continue to require greater scrutiny. In particular, India must
resist an investment agreement that would entail pre-establishment national
treatment (NT) for FDI. If the market will remain oligopolistic, the theoretical
insights of the preceding section show that there is a case for denying entry to for-
eign firms that will compete with Indian firms in the home market, unless there is
clear evidence of technological spillovers. This prohibition should be applied at
the sectoral level rather than to individual firms, not only because firm-by-firm
Trade, Investment, and Competition Policy: An Indian Perspective 225

review will invite inefficiency and corruption but also because it will reinforce the
problem of limited foreign entry that represents the worst of all possible worlds.
Theory also suggests that mergers of foreign subsidiaries should be subjected to a
stricter standard because the terms of the tradeoff between higher profits and
reduced consumer surplus become more adverse with some of the profit going
abroad. Therefore, post-entry NT should be resisted as well, at least with regard to
merger policy. As a beginning, to reconcile this with the hands-off approach rec-
ommended for domestic mergers, the relevant sections of the act can be imple-
mented, but only mergers involving local subsidiaries of foreign firms should be
investigated, thereby economizing on the commission’s limited resources. (If such
discriminatory treatment is not possible because of de jure NT, the balance effec-
tively could be tilted by reducing the thresholds for international assets while rais-
ing those for domestic assets.) Exposure to the kind of evidence brought by for-
eign firms in their defense will itself be valuable for the commission and for
Indian firms. Remedies to safeguard competition, such as divestiture of brands,
plants, and shareholdings, or licensing of patents, should be applied before rather
than after the merger.
The sooner we start, the better. Having the new law in force, with some experi-
ence and expertise in its implementation, will strengthen our bargaining position
when negotiations begin, even if some of the more assertive postures have to be
surrendered in the give-and-take process. It is important, however, that the gov-
ernment’s power to exempt sectors (as provided for in Section 54 of the Competi-
tion Act) be stoutly defended in negotiations, by pointing out that such exemptions
are widely used in developed countries23 and if necessary insisting on “special
and differential treatment” as in other WTO agreements. It goes without saying
that this power should be used judiciously, with the exemptions being reviewed
periodically.
These domestic exemptions could be combined with a GATS-type positive list
approach in a multilateral agreement, which would limit commitments to partic-
ular sectors. Exempting NT for some of them (as in GATS), or keeping NT out of
a competition agreement altogether, would also allow India to rethink the princi-
ple it has conceded in the Competition Act. Both the EU and the United States
have double standards on nondiscrimination in competition policy: they oppose
most-favored-nation status for cooperation in investigations, and they violate NT
in defending the exemption of their export cartels. As the Indian government’s
submission to the working group itself points out, the arguments that make NT a
vital component of a trade agreement cannot be carried over to competition pol-
icy because not all competition policy issues are trade distorting. Keeping NT out
would allow developing countries to join the emerging consensus against interna-
tional cartels while permitting domestic cartels to rationalize production and
226 India and the WTO

enable orderly downsizing in the face of greater import competition. If anything,
the level playing field supposedly afforded by nondiscriminatory treatment of
domestic and foreign firms is actually tilted in the latter’s favor. Because competi-
tion authorities in developing countries will find it difficult to prosecute firms
based abroad, domestic firms might bear the brunt of enforcement activities
while foreign firms get away with similar infractions. Also, even if the rules are
nondiscriminatory, the costs of compliance will be higher for firms that are unfa-
miliar with them, thereby putting firms in developing countries at a competitive
disadvantage.24
Summary, Conclusion, and a Caveat
Following the introductory material, the second section of this chapter traced the
parallel developments on the subject of trade and competition policy at the WTO,
in bilateral and regional agreements, in the international academic literature, and
in Indian official circles. The third section recounted the major economic reforms
that have occurred in India in the areas of investment and trade policy, and then
undertook a detailed analysis of the working of the MRTP Act, especially with
regard to mergers and restrictive trade practices. That discussion showed that
merger and acquisition activity increased substantially, with a growing proportion
of foreign participants, after the relevant sections of the act were dropped and
restrictions on FDI were relaxed in 1991. As we saw, the MRTP Commission’s reg-
ulation of cartels and predatory pricing left much to be desired. The review of the
theoretical literature in the fourth section showed that more competition is not
always better in an oligopolistic setting, and thus liberalizing both foreign and
domestic entry can reduce welfare. It also cited recent empirical evidence on
industrial productivity growth that indirectly supports the contention that liber-
alization has led to excess entry. The theoretical literature on mergers suggested
that amalgamations of foreign-owned firms could be harmful, while the literature
on predatory pricing only reinforced the skepticism of the preceding section. The
fifth section appraised the new Competition Act, welcoming its positive features,
but warning against the lack of expertise to implement its numerous technical
provisions, and expressing concern over the amendment reinstating the commis-
sion’s ability to restrict imports. I then set out an agenda for improving India’s
bargaining position on competition policy at the WTO, involving careful scrutiny
of cartels, entry, and mergers involving foreign firms, a more relaxed attitude to
domestic mergers, and consequently a case for resisting the NT clause in possible
agreements on investment or competition.
If there is a common strand running through this chapter, it is a case for
greater economic input to the formulation and enforcement of competition policy.
Trade, Investment, and Competition Policy: An Indian Perspective 227

At a minimum, given the limited expertise that is available, economic analysis can
suggest screening devices based on empirically verifiable aspects of market and
product characteristics that will help to narrow the list of cases for investigation
and prosecution. At the subsequent stage, given that antitrust enforcement world-
wide has moved away from holding certain practices illegal per se, economics can
provide one kind of reasoning to support “rule of reason” judgments. Ex post,
economic (and even statistical) analysis of judgments can help highlight systemic
failures. Analyses of this kind show that competition policy enforcement in indus-
trial countries is not always consistent, based on economic logic, or immune to
politics. It is not as though Indian practice has been especially inept on these
counts. Economic inputs should lead to the formulation of amendments to the
competition law and guidelines for its enforcement, operationalizing the multiple
criteria in the new act. These guidelines should be widely publicized and replace
subjective case-by-case interpretations of an undefined “public interest” in arriv-
ing at verdicts. This would reduce uncertainty, delays, and legal costs.
Theorists argue that quantifiable “bright line” criteria to identify anticompeti-
tive practices, such as the Hirschman-Herfindahl concentration index for merger
review or the Areeda-Turner test for predatory pricing, are unsatisfactory. How-
ever, a more general criterion emerges from the analysis of the apparently very dif-
ferent issues of entry, mergers, and predation in this chapter. Barriers to entry cre-
ate preconditions that are conducive to “inefficient” foreign entry, sustainable
horizontal mergers and cartels, and rational predation. This suggests, as a rough
first approximation, that infrastructure and branded consumer goods (which are
likely to benefit from high effective protection for the foreseeable future) should
be high on the watch list for the competition authority. I have also suggested a
quantifiable criterion for entry barriers in Bhattacharjea (2000).
At the same time I would not completely blinker legal (and ultimately political)
judgments with economic theory, for there are many policy objectives that are
outside the ambit of the theoretical framework employed here, which privileges
“efficiency” (in the form of maximization of a particular metric of social welfare)
above all else. This has not been decisive even in industrial countries. Section 84 of
the UK Fair Trading Act of 1973, for example, recognized balanced distribution of
industry and employment as a legitimate criterion in assessing abuse of a monop-
olistic position and in reviewing mergers, and section 10 of its RTP Act (copied
with minor changes as Section 38 of the Indian MRTP Act) allowed the preven-
tion of reductions in employment or exports to be pleaded as gateway defenses of
RTPs. In Europe and Japan “crisis cartels” were permitted until fairly recently to
protect declining industries, and mergers were encouraged to create “national
champions.” Even in the United States, merger policy until the 1970s, as well as
laws to control price discrimination (such as the Robinson-Patman Act and state
228 India and the WTO

laws on fair trading), were designed to protect small businesses, regardless of effi-
ciency. And vigorous prosecution of price discrimination in the EU has more to
do with the political objective of enforcing a single market than with efficiency.
It is ironic that although the EU is leading the charge to have hard-core cartels
made illegal, during Europe’s 19th-century industrialization cartels were actually
promoted by the state in Germany and restrictive agreements were upheld by the
courts in Britain and France. Active prosecution began in these countries only in
the last 50 years (Chang 2002). The essays in Evenett, Lehmann, and Steil (2000)
expose the wide divergences on competition policy that even now remain between
the United States and the EU, and the continuing European ambivalence about
promoting “efficiency,” despite considerable convergence in the past decade.
As Scherer (1994) clearly documented, the practice of competition policy in
advanced countries often has been inconsistent within and between countries and
over time, and frequently ignorant of simple economic logic. It is unlikely that
whatever common principles they agree on at their current levels of economic
and institutional development will be in the interests of countries at much lower
levels. In India, which lacks even rudimentary unemployment insurance, protec-
tion of employment will remain a live political issue, manifested in the various
pro-producer interpretations of the “public interest” that were cited above, and in
the government’s continuing inability to reduce tariff barriers further or to intro-
duce labor market flexibility by amending the laws that make retrenchments and
closures so difficult.
This chapter has used the most narrow “efficiency” definition of social welfare,
only because it is the one that informs most theoretical approaches to the issue of
competition and market-friendly reforms. Although I take distributional goals
more seriously than most writers on this topic, I share their reservations about
using competition policy for meeting those goals. Not because I believe that mar-
ket outcomes are benign or that I believe in the mythical lump-sum taxes and
transfers that economists use to dodge the issue, but because it is difficult to
redress the inequities of the market with a law intended to promote competition.
Active prosecution of the exclusionary practices of large firms could help, as could
carefully monitored rationalization cartels, but these actions require high levels of
commitment and expertise, which have been lacking in India’s policy toward
declining industries.
My more pressing concern is that requiring recourse to an expensive judicial
process, which allows for only “win-lose” outcomes, inevitably tilts competition
policy against people who are less well-off. Why should only those who can resort
to this process be protected from the rigors of liberalization, transferring the bur-
den to others? In particular, injunctive relief in the form of an import prohibi-
tion, as I argued above, is a remedy that worsens the disease. It tackles a private
Trade, Investment, and Competition Policy: An Indian Perspective 229

anticompetitive practice by a further judicially directed restriction of competi-
tion, in a manner that is more protectionist than an antidumping duty, and possi-
bly violates WTO antidumping rules. By the same token, it inflicts costs on ulti-
mate consumers, on firms that use the product as an input, or on exporters in
totally unrelated sectors who might have to suffer the retaliation of other WTO
members. Many of these potential losers are likely to be less well-off than the large
business houses who can move the competition mechanism.
Furthermore, an unfamiliar and complex legal regime disproportionately bur-
dens small firms with the costs of compliance, placing them at a competitive dis-
advantage relative to larger domestic and foreign rivals in a manner that has noth-
ing to do with “efficiency.” One way out would be to limit enforcement to large
firms. This is already mandated by the thresholds for merger review, and is
implicit in the criteria defining dominant positions. But it could be further
strengthened by granting blanket exemptions to sectors with predominantly small
producers, or establishing a de minimis rule for participants in anticompetitive
agreements, thereby enabling the Competition Commission to concentrate on the
larger players. A more positive route would be to follow the South African Com-
petition Act in incorporating provisions that promote businesses owned by his-
torically disadvantaged people.25 Even if there is a tradeoff between efficiency and
equity, there is no particular justification for insisting on a corner solution.
Endnotes
1. All numbered WTO documents cited in this chapter are available at the WTO Web site,
www.wto.org.
2. The reports of the working group are available as WTO documents WT/WGTCP/1-6.
3. In what follows I have drawn on Scherer (1994), Utton (1995), Levinsohn (1996), Perroni and
Whalley (1996), Lee (1998), and Lloyd (1998), as well as UNCTAD (1997), WTO (1998-2001), OECD
(1998, 2000), and Government of India (1999). Several popular publications of the Consumer Unity
and Trust Society have been very informative as well.
4. See Bhattacharjea (2000) for more excerpts from the committee reports and the MRTP Com-
mission’s judgments, which show that there are many contradictory interpretations of what constitutes
the “public interest” in competition policy.
5. See Bhagwati and Desai (1970) for a thorough early critique of the licensing system.
6. A 1998 relaxation of this measure allowed larger firms to produce these items, provided they
exported at least half their output; in 2000 the textile sector, which was vital for exports, was removed
from the list.
7. I will not go into the so-called monopolistic trade practices in Chapter IV of the act, which were
defined as any practice that “unreasonably” increases prices, costs, or profits, or “unreasonably” pre-
vents or lessens competition. That chapter has fallen into disuse in recent years (see Singh 2000). Nor
do I intend to go into the “unfair trade practices” that were unwisely inserted as Chapter V.B by the
1984 amendment. That insertion led to the MRTP Commission’s limited resources being substantially
diverted to dealing with cases of individual consumer dissatisfaction relating to deficiency in service
(often nondelivery of apartments or cars booked with dealers) or to adjudicating allegations of false
advertising or misleading prize schemes. Consumers found the MRTP route far more effective than
230 India and the WTO

resorting to the Consumer Protection Act, and most of the cases now pending before the commission
fall into categories that should not have been part of a competition law in the first place.
8. Hindustan Lever Employees’ Union v. Hindustan Lever and Others, 1995 SCC 499. Quotations are
from paragraphs 73 and 71 of the majority judgment. The majority judgment also invoked an argu-
ment similar to the “failing firm defense” provided for in the United States. TOMCO was ailing and
would probably have closed down had it not merged into the stronger firm. The public interest was
identified with that of its shareholders and employees. Another judge gave a separate but concurring
judgment, acknowledging that when a merger involved a foreign company, there could be broader
public interest issues involved, but that judge found no grounds for interfering in the merger under
consideration. See Singh (2000) for a slightly different interpretation of this judgment.
9. Only two cases had been referred to the commission. One was a blatantly political move to
muzzle a newspaper that was critical of the authoritarian 1975–77 state of emergency; the reference
was retracted by the successor government. The other case was struck down by the courts.
10. The Herfindahl index, as reported in CMIE (2001), is the sum of firms’ squared market shares,
which are taken as shares of the aggregate domestic sales of the industry. (Imports of all the consumer
goods mentioned in this paragraph were negligible in the 1990s.) The index ranges from zero for an
industry with many producers to one in the case of monopoly.
11. The conference that led to this volume had a South Asian focus, so it might be appropriate to
point out that although the merger of Lipton and Brooke Bond into HLL’s parent Unilever passed
unchallenged in India, the Pakistan competition authority succeeded in getting Unilever “to withdraw
one of its brands and reduce its shareholding in Brook Bond Pakistan to 40 per cent” (UNCTAD 1997,
p. 199).
12. Promoted as an export joint venture by six producers, ANSAC was recognized by the U.S. gov-
ernment under the Webb-Pomerene Act’s exemption from American antitrust laws, whereas three of
the leading members of AMAI were under investigation for cartelization by the MRTPC.
13. Haridas Exports v. All India Float Glass Manufacturers’ Association, 2002 6 SCC 600.
14. This reasoning also provides a theoretical justification for the exemptions from competition
laws that most industrial countries grant to their firms with regard to export sales, as long as the anti-
competitive conduct does not adversely affect the home market. Because firms in developing countries
seldom have monopoly power in their export markets, this is not particularly relevant here, although
as importers, developing countries may be legitimately concerned about anticompetitive conduct by
their foreign suppliers.
15. This situation is quite apart from political economy problems involving the forced exit of
unwanted firms and their workers; in fact, extremely cumbersome procedures relating to bankruptcy
and transactions in land in India effectively make expenditures on several other assets sunk costs.
16. In industries that have been protected for a long time, equipment is likely to be obsolete and
organized labor succeeds in getting wages higher than those prevailing in the unorganized sector.
Indian industry also has been subjected to a high interest rate regime. The private costs of labor and
capital are therefore higher than the opportunity costs of these resources to society.
17. Most of the results discussed in this paragraph are derived in a homogeneous-product frame-
work. Although one would expect product differentiation to moderate the business-stealing effect of
foreign entry, as well as to provide an additional source of welfare gains in the form of greater variety,
the problem does not go away. Several authors cited in Bhattacharjea (2002) have recently shown that
limited foreign entry can reduce welfare in various differentiated product models as well.
18. In the context of organized manufacturing in India, a substantial proportion of labor input
must be considered a fixed factor because of legal restrictions on retrenchment.
19. Banga also showed that the picture is reversed for export performance: U.S. presence had pos-
itive direct and indirect effects, whereas Japanese presence had no significant effect.
20. See especially Scherer (1994), Utton (1995), and Tharakan (2000). Some members of the WTO
Working Group also expressed similar opinions, although it is significant that both the EU and the
United States argued against replacing antidumping with competition policy standards on the grounds
that antidumping was primarily a response not to exporting firms’ behavior but to government policies,
Trade, Investment, and Competition Policy: An Indian Perspective 231

such as import restrictions and weak competition policy enforcement that enabled exporters to charge
higher prices in their home countries (WTO 1998, paras. 39, 48, and 49; discussions recorded in the
1999 report went over much the same ground).
21. Tetra Pak SA v. EC Commission, 1997 CMLR 662. It should also be noted that even Matsushita
was decided by a narrow majority (five to four), with the minority rejecting the recoupment standard.
22. AMAI later succeeded in getting antidumping duties imposed as well.
23. See Khemani (2002) for a useful compilation, with economic arguments in favor of such
exemptions.
24. These arguments are advanced in the Indian communication (WTO 2002a).
25. This proviso would also exonerate the anticompetitive practices of large firms, provided they
had this desirable effect (WTO 2002b).
References
The word “processed” describes informally produced works that may not be available commonly
through libraries.
Agarwal, M. 2002. “Analyses of Mergers in India.” M.Phil. dissertation, University of Delhi.
Aitken, B. J., and A. E. Harrison. 1999. “Do Domestic Firms Benefit from Direct Foreign Invest-
ment? Evidence from Venezuela.” American Economic Review 89: 605–18.
Alkali Manufacturers’ Association of India v. Sinochem International Chemical Company and Nahar
Industrial Enterprise. 1999. Comp LJ 326.
All India Float Glass Manufacturers’ Association v. P.T. Mulia Industries and Others. 2000. CTJ 252.
Balakrishnan, P., and K. Pushpangadan. 1998. “What Do We Know about Productivity Growth in
Indian Industry?” Economic and Political Weekly 33: 2241–46.
Balakrishnan, P., K. Pushpangadan, and M. S. Kumar. 2000. “Trade Liberalisation and Productivity
Growth: Evidence from Firm-level Panel Data.” Economic and Political Weekly 35: 3679–82.
Banga, R. 2003. “The Nature, Pattern and Impact of Japanese and U.S. Foreign Direct Investments
in Indian Manufacturing.” Ph.D. dissertation, University of Delhi.
Basant, R. 2000. “Corporate Response to Economic Reforms.” Economic and Political Weekly 35:
813–22.
Basant, R., and S. Morris. 2000. “Competition Policy in India: Issues for a Globalising Economy.”
Indian Institute of Management, Ahmedabad. Processed. Executive summary published in Economic
and Political Weekly 35: 2735–47.
Beena, P. L. 2003. “Understanding the Latest Phase of the Merger Wave in India: A Comparative
Perspective.” Paper presented at the Conference on Globalisation in India, sponsored by the School of
Management of the Indian Institute of Technology, January, Bombay.
Bhagwati, J. N., and P. Desai. 1970. India: Planning for Industrialisation. Delhi: Oxford University Press.
Bhattacharjea, A. 1995. “Strategic Tariffs and Endogenous Market Structures: Trade and Industrial
Policies under Imperfect Competition.” Journal of Development Economics 47: 287–312.
———. 2000. “Predation, Protection and the ‘Public Interest.’” Economic and Political Weekly 49:
4327–36.
———. 2002. “Foreign Entry and Domestic Welfare: Lessons for Developing Countries.” Journal of
International Trade and Economic Development 11: 143–62.
———. Forthcoming. “India’s Competition Policy.” Economic and Political Weekly.
Blomstrom, M., and A. Kokko. 1998. “Multinational Corporations and Spillovers.” Journal of Eco-
nomic Surveys 12: 247–77.
Chang, H.-J. 2002. Kicking Away the Ladder: Development Strategy in Historical Perspective. London:
Anthem Press.
CMIE (Centre for Monitoring Indian Economy). Various years. Industry: Market Size and Shares.
New Delhi.
232 India and the WTO

Cox, D., and R. Harris. 1984. “Trade Liberalization and Industrial Organization: Some Estimates
for Canada.” Journal of Political Economy 93: 115–45.
Das, D. K. 2001. “Some Aspects of Productivity Growth and Trade in Indian Industry: Exploring
the Trade Liberalization–Productivity Link.” Ph.D. dissertation, University of Delhi.
Dixit, A. 1984. “Trade Policy for Oligopolistic Industries.” Economic Journal 94: 1–15.
Eastman, H., and S. Stykolt. 1960.“A Model for the Study of Protected Oligopolies.” Economic Journal
70: 336–47.
“The ET-CMIE M&As Survey.” 2003. Economic Times March 7: 13.
Evenett, S. J., A. Lehmann, and B. Steil, eds. 2000. Antitrust Goes Global: What Future for Transat-
lantic Cooperation? Washington, D.C.: Brookings Institute/Royal Institute of International Affairs.
“FDI behind India’s Stance: Lamy.” 2003. Business Standard, March 15–16, p. 2.
Government of India. 1999. Report of the Expert Group on Interaction Between Trade and Competi-
tion Policy. Ministry of Commerce.
———. 2000. Report of the High Level Committee on Competition Policy and Law. Ministry of Law,
Justice and Company Affairs.
Head, K., and J. Ries. 1997.“International Mergers and Welfare under Decentralized Competition Policy.”
Canadian Journal of Economics 30: 1104–23.
———. 1999. “Rationalization Effect of Tariff Reductions.” Journal of International Economics 47:
295–320.
Horn, H., and J. Levinsohn. 2001. “Merger Policies and Trade Liberalisation.” Economic Journal
111: 244–76.
Khanna, S. 1999. “Financial Reforms and Industrial Sector in India.” Economic and Political Weekly
34: 3231–41.
Khemani, R. S. 2002. “Application of Competition Law: Exemptions and Exceptions.” United
Nations document UNCTAD/DITC/CLP/Misc25.
Kumar, N. 2000. “Mergers and Acquisitions by MNEs: Patterns and Implications.” Economic and
Political Weekly 35: 2851–58.
Lee, K. U. 1998. Competition Policy, Deregulation and Economic Development. Seoul: Korea Institute
for Industrial Economics and Trade.
Levinsohn, J. 1996. “Competition Policy and International Trade.” In J. Bhagwati and R. Hudec,
eds., Fair Trade and Harmonization: Prerequisites for Free Trade. Cambridge, Mass.: MIT Press.
Levy, S., and S. Nolan. 1992.“Trade and Foreign Investment Policies under Imperfect Competition:
Lessons for Developing Countries.” Journal of Development Economics 37: 31–62.
Lloyd, P. J. 1998. “Globalisation and Competition Policies.” Weltwirtschaftliches Archiv 134: 161–85.
Mankiw, N. G. and M. Whinston. 1986. “Free Entry and Social Inefficiency.” Rand Journal of Eco-
nomics 27: 48–58.
Naidu, R. 2000. “Where Size Matters.” Business Standard Smart Investor April 17: 6–7.
OECD (Organisation for Economic Co-operation and Development). 1998. Complementarities
between Trade and Competition Policies. Joint Group on Trade and Competition. Paris.
———. 2000. Hard Core Cartels. Paris.
Ordover, J. A. 1998. “Predatory Pricing.” In P. Newman, ed., The New Palgrave Dictionary of Eco-
nomics and the Law. London: Macmillan Reference.
Perroni, C., and J. Whalley. 1996. “Possible Developing Country Impacts from a Competition Pol-
icy Negotiation.” In V. N. Balasubramanyam and D. Greenaway, eds., Trade and Development: Essays in
Honour of Jagdish Bhagwati. Basingstoke, U.K.: Macmillan.
Sandesara, J. C. 1994. “Restrictive Trade Practices in India, 1961–91: Experience of Control and
Agenda for Further Work.” Economic and Political Weekly 29: 2081–94.
Scherer, F. M. 1994. Competition Policies for an Integrated World Economy. Washington, D.C.:
Brookings Institute.
Singh, J. 1999. “Some Aspects of Industrial and Labour Markets in India: Perspectives from Law
and Economics.” Ph.D. dissertation, University of Delhi.
Trade, Investment, and Competition Policy: An Indian Perspective 233

———. 2000. “Monopolistic Trade Practices and Concentration of Economic Power: Some Con-
ceptual Problems in MRTP Act.” Economic and Political Weekly 35: 4437–44.
Srivastava, V. 2001. The Impact of Economic Reforms on Industrial Productivity, Efficiency and Com-
petitiveness: A Panel Study of Indian Companies. New Delhi: Industrial Development Bank of India.
Processed.
Tharakan, P. K. M. 2000. “Predatory Pricing and Anti-dumping.” In G. Norman and J.-F. Thisse,
eds., Market Structure and Competition Policy: Game Theoretic Approaches. Cambridge, U.K.: Cambridge
University Press.
UNCTAD (United Nations Conference on Trade and Development). 1997. World Investment
Report: Transnational Corporations, Market Structure and Competition Policy. New York.
Unni, J., N. Lalitha, and U. Rani. 2001. “Economic Reforms and Productivity Trends in Indian
Manufacturing.” Economic and Political Weekly 36: 3914–22.
USTR (United States Trade Representative). 2000. National Trade Estimate Report on Foreign Trade
Barriers. Washington, D.C.
———. 2001. National Trade Estimate Report on Foreign Trade Barriers. Washington, D.C.
Utton, M. A. 1995. Market Dominance and Antitrust Policy. Cheltenham, U.K.: Edward Elgar.
WTO (World Trade Organization). Various years. Reports of the Working Group on the Interaction
between Trade and Competition Policy to the General Council. WT/WGTCP/1-6. Geneva.
———. 1996. “Singapore Ministerial Declaration.” WT/MIN(96)/DEC. Geneva.
———. 1998. “Report on the Meeting of 27–28 July 1998.” WT/WGTCP/M/5. Geneva.
———. 2000. “Communication from India.” WT/WGTCP/W/149. Geneva.
———. 2001. “Communication from India.” WT/GC/W/459. Geneva.
———. 2002a. “Communication from India.” WT/WGTCP/W/216. Geneva.
———. 2002b. “Communication from South Africa.” WT/WGTCP/W/220. Geneva.
———. 2002c. “Communication from the European Community and Its Member States.”
WT/WGTCP/W/222. Geneva.
234 India and the WTO
The Government Procurement Agreement (GPA)1 is currently a plurilateral
agreement with 27 signatories. Although virtually no developing country,
including India, is a signatory to the present agreement, even industrial
countries, such as Australia and New Zealand and some Organisation for Eco-
nomic Co-operation and Development (OECD) countries, remain outside its
purview. This raises two important questions. First, what are the considerations
for a developing country (such as India) in considering becoming party to this
agreement? Second—and this question is largely connected with the first—what
needs to be done to multilateralize the agreement? This chapter will focus on the
first question because a better appreciation of the issues is important for answering
the second question.
There are two potential sources of benefit for signatories to the GPA. First, as a
result of the transparency requirements and competition resulting from the agree-
ment, the tax-paying public could get better value for money spent on govern-
ment purchases. The second benefit is an increase in export markets as a result of
235
10
India’s Accession tothe Government
ProcurementAgreement:
Identifying Costsand Benefits
Vivek Srivastava
I am grateful to Aaditya Mattoo, A. N. Varma, J. L. Bajaj, Sunil Chaturvedi, Deepak Sanan, Ajay Mahal,
and Agneshwar Sen for their material help and encouragement during the writing of this chapter.
Suchita Mehta and Rukma Biswas provided the research assistance for the original version. Prasun
Bhattacharjee provided excellent support in updating the chapter.

purchases by governments of other member countries. The general perception is
that the second source of gain is likely to be small for developing countries, so it is
important to estimate the potential gains from achieving transparency in procure-
ment procedures and from nondiscrimination in the purchase of goods and ser-
vices. It is unfortunate that economic theory does not provide clear answers.
There are cases in which discrimination can be shown to be welfare enhancing. In
addition, the benefits of conforming to the discipline of the GPA may be out-
weighed by the costs.
The apparent position of the Indian government is that although it is willing to
negotiate an agreement on transparency in government procurement, it is opposed
to extending this to a market-access agreement. Even with respect to this limited
agenda, a major problem is the inclusion of state governments and public sector
undertakings within the scope of the agreement. Although these costs have not
been explicitly documented (most likely not calculated), implicit in this decision is
the assumption that the costs of entering into an agreement like the existing GPA and
of including state governments and public enterprises in a transparency agreement
outweigh the possible benefits. There is a clear need for some concrete information
if the issue of India’s membership in the GPA or in a transparency agreement is to
be discussed in a meaningful way. There is a gap in the literature with respect to
these issues and virtually none of the relevant information is readily available for
India. This chapter takes a first step toward filling this gap.
The rest of this chapter is organized as follows. The next section provides back-
ground by briefly outlining some of the theoretical considerations involved in an
assessment of costs and benefits. The third section summarizes the salient features
of the existing GPA. The fourth section describes the procedures for government
procurement in India and the extent to which these procedures diverge from the
requirements of the GPA. The fifth section discusses the Indian government’s posi-
tion on the GPA. The sixth section offers estimates of purchases by the government
sector in India and, based on this, the seventh section summarizes the estimated
costs and benefits. The last section concludes the chapter with a summary and the
implications of the main findings and then a brief discussion of clarifications of
and changes in India’s position since this chapter was first prepared.
Theoretical Background for Assessing Costsand Benefits
There are three potential sources of gain from market access and transparency. It
is a well-known theorem in the classical theory of international trade that any
restriction on free trade reduces welfare. Thus any form of preferential treatment
of domestic firms is likely to be welfare reducing. Second, nondiscrimination
236 India and the WTO

should increase competition and minimize procurement costs. Third, lack of
transparency in procurement could lead to corruption and rent seeking. The last
two possible gains supplement the traditional “gains from trade” argument.
What are the possible costs? First, there are the costs of switching over from the
existing procurement regime. These costs depend on the divergence of the exist-
ing procurement policies from those required by the GPA and the number of enti-
ties involved. For India the costs could be high because of its federal structure, the
number of subcentral entities, and the large number of central and state public
sector enterprises. Debroy and Pursell (1997) have stated that although there
would be no problem for India to have joined the Tokyo Round GPA, this is not
true for the current GPA because of its extension to subcentral and other public
entities and to the purchase of services. Attempts must be made to estimate the
changes involved and to examine what exclusions, if any, might be justified on
these grounds.
Second, there are some theoretically justifiable arguments for preferential
treatment. The so-called New Trade Theory developed during the 1980s showed
that, in the presence of imperfect competition and increasing returns to scale,
interventions in trade could be used to shift profits to domestic firms or to gener-
ate positive externalities (see Krugman 1988, Helpman and Krugman 1986). Some
of these arguments can be extended to the case of government procurement (for
example, see Branco [1994]). In addition, there are some other possible justifica-
tions for preferential government procurement. These include the possibilities of
increasing competition through price preferences (McAfee and McMillan 1989),
reducing price-cost margins by expanding domestic output (Chen 1995), avoid-
ing problems of contract enforcement (Laffont and Tirole 1991), and realizing
economies in the presence of asymmetric information.2 Although such “strategic”
interventions are difficult to target accurately and their potential benefits are
likely to be small, they are popular with governments and the business commu-
nity (see Krugman [1987] for a discussion). For this reason it is important to
identify the potential gains from such discriminatory policies.3
The third argument against the GPA suggests that discrimination does not sig-
nificantly restrict trade and consequently the gains from nondiscrimination are
small. Baldwin (1970, 1984) and Baldwin and Richardson (1972) argued that if
domestic and foreign goods are perfect substitutes, in the presence of perfect com-
petition, preferential treatment for domestic industry will not have an effect on the
level of imports, domestic prices, output, or employment. Mattoo (1996) has
pointed out, however, that the benefits may be significant if government demand
exceeds domestic supply, if domestic and foreign goods and services are not perfect
substitutes, and if there is imperfect competition. Evidence suggests that, in a wide
variety of cases, discriminatory procurement does have an adverse effect on trade.
India’s Accession to the Government Procurement Agreement 237

Fourth, as markets become more competitive and trade becomes freer, it would
become easier to conform to the discipline of the GPA. But, at the same time, the
need for the GPA would become less pressing. With the public sector being subject
to harder budget constraints, procurement by these entities is likely to become
more efficient. On the other hand, with trade restricted through tariffs and non-
tariff barriers, the GPA may not achieve much. Thus, there is the issue of whether
the GPA is relevant in such a situation. Debroy and Pursell (1997) noted that the
procurement policy regime in India has been reformed considerably since 1991.
Important Features of the GPA
The Agreement on Government Procurement—originally negotiated during the
Tokyo Round—was renegotiated during the Uruguay Round. The revised GPA,
signed in Marrakesh on April 15, 1994, entered into force on January 1, 1996. It is
one of the World Trade Organization’s (WTO) Annex IV or Plurilateral Agree-
ments. Participation is restricted to WTO members, and it applies only to WTO
members that have signed it.
Objective, Scope, and Structure
The objective of the new GPA is to contribute to the “liberalization and expansion
of world trade” by eliminating discrimination against and between foreign prod-
ucts, services, and suppliers; by enhancing the transparency of laws and practices;
and by ensuring fair, prompt, and effective enforcement of international provi-
sions on government procurement.
Its scope is wider than that of the Tokyo Round agreement. It covers procure-
ment of goods, services (including construction services), and lease, rental, and hir-
ing arrangements. It has been extended to purchases by subcentral government enti-
ties as well as other government entities and to such enterprises as public utilities.4
One of its central features is that, in government purchases covered by the agree-
ment, signatories must give most-favored-nation (MFN) treatment (nondiscrimina-
tion) and national treatment to products and services of the other signatories. It
specifies the need to comply with detailed procedures to ensure that potential for-
eign suppliers are given a real chance to compete for government contracts.
Transparency and Tendering Procedures
Transparency is a key element of the agreement, and the requirements are listed in
a comprehensive set of rules that form the bulk of the agreement. These require-
ments include rules regarding technical specifications, tendering procedures,
238 India and the WTO
qualification of suppliers, invitation to tender, selection procedures, time limits,
documentation requirements, procedures for award and negotiation, limited ten-
dering, transparency, and publication of awards and of reasons why tenders have
failed.
Three methods of tendering—open, selective, and limited—are permitted,
with open and selective tendering being the preferred methods. All three may be
complemented by competitive negotiation. Under open tendering, any interested
supplier may submit a bid in response to a call for tenders. Selective tendering
involves preselected potential suppliers and usually is intended to speed up the
tendering process. Under limited tendering procedures, the buyer contacts spe-
cific suppliers individually. This is only permitted under special circumstances
and may not be used as a means of reducing competition, discriminating among
suppliers, or providing protection to domestic producers or suppliers.
Special Treatment of Developing Countries
Article V of the agreement provides for special consideration to be given to devel-
oping countries. The provisions of this article recognize the needs of developing
countries to safeguard their balance of payments, promote the development of
domestic industry in rural and backward areas, foster the development of other
sectors, support industrial units dependent on government procurement, and
encourage economic development through regional or global arrangements. In
this context, developing countries can negotiate exclusions from national treat-
ment. Industrial countries are expected to provide technical assistance, on request,
to developing countries.
Challenge Procedure
A unique feature of the agreement is the challenge procedure that is independent
of the WTO’s dispute-settlement mechanism. This procedure allows firms to
protest during as well as after completion of the decisionmaking process. Each
member country is required to set up a reviewing procedure using a court or some
independent review authority. Suppliers who feel that a purchasing entity has not
lived up to the rules can pursue a complaint with that entity. Procedures must
allow rapid interim measures to be taken, including suspension of the procure-
ment process if necessary. The signatories must provide for correction of a breach
of the agreement or compensation for loss or damages suffered. Multilateral mon-
itoring and the threat of the WTO dispute-settlement procedures put pressure on
purchasing entities to abide by the disciplines of the agreement.
India’s Accession to the Government Procurement Agreement 239

Procedures and Practices in India
In principle, the government procurement system is set up to ensure the purchase
of good-quality products in the most economic and efficient manner. The stated
procurement policy is expected to allow the maximum level of competition
among bidders and to make the processes of bidding and decisionmaking trans-
parent. In spite of this policy, government purchases often are the subject of con-
troversy and are a potential source of corruption (Debroy and Pursell 1997). As
Hoekman (1998) has pointed out, it is difficult to estimate the extent to which the
actual practice diverges from the formal rules and procedures.
The central government, the state governments, and the three tiers of local gov-
ernment—village, intermediate, and district—make up the various levels of gov-
ernment in India. In addition to these strata, there are the centrally and state-
owned enterprises. There is no single uniform law governing procurement by all
of these government entities. In this section I will discuss briefly some of the fea-
tures of the procurement system that are relevant to this chapter.5
Although there is no legal definition of government procurement, as exist for
most other activities of government, there are fairly detailed sets of procedures
and rules governing procurement and procurement by government entities. The
general principles governing procurement by the central government are laid
down in the General Financial Rules (GFRs) of the Ministry of Finance. The pur-
chase procedures followed by various government departments have evolved in
line with these general principles. The Directorate General of Supplies and Dis-
posal (DGS&D) under the aegis of the Department of Supply is the central pur-
chasing organization of the Government of India. As a result of decentralization
in the 1970s, the role of the DGS&D is restricted to finalizing rate contracts for
“common use” items. The role of the DGS&D has been declining gradually and,
even in nominal terms, purchases by the directorate have fallen from Rs. 24.0 billion
in 1995/96 to Rs. 16.6 billion in 1998/99. Other ministries and departments and
departmental undertakings have been delegated powers enabling them to make
their own purchases. Similarly, the procedures followed by state governments are
based on the states’ financial rules and a number of states have the equivalent of a
central-stores purchasing organization.6
Procurement Methods
The rules provide for purchases based on advertisements (open tender), direct
invitation to a limited number of firms (limited tender), invitation to one firm
only (single tender), and negotiation with one or more firms.7 Tender notices are
generally publicized through the Indian Trade Journal, a monthly bulletin issued
240 India and the WTO

by the DGS&D, and are now available on the NIC-NET of the National Informat-
ics Centre (NIC). For global tenders, notices are also published or disseminated
through Indian embassies. In the case of the railways, all tenders above a value of
Rs. 0.3 million are invited by open advertisements in the national newspapers.
The specifications for procurement normally are quite comprehensive and
generally are drafted on the basis of national or international standard specifica-
tions.8 There is a well-defined registration procedure to establish “reliable and reg-
ular sources” of supply for government purchases. The DGS&D registers firms
interested in government purchases as approved contractors for supply of stores
of various descriptions. Similarly, the National Small Industries Corporation reg-
isters such firms in the small-scale sector, and Indian Railways also has an analo-
gous registration procedure.
Preferential Treatment
According to the purchase policy, all the suppliers—whether domestic or inter-
national—are to be treated at par and no preference is given to domestic suppli-
ers.9 According to the Indian government, “domestic bidders are treated on par
with foreign bidders and the ultimate price available to the user department is
the determining criterion.”10 However, with a view to encouraging the small-scale
sector, village industries, certain kinds of women’s organizations, and public
enterprises, some preferential treatment is allowed. Generally such preferential
treatment discriminates against domestic as well as foreign firms not belonging to
these categories and, in this sense, foreign firms get “national treatment.” Debroy
and Pursell (1997) provided a comprehensive review of the policy and an analysis
of its impact. I will discuss here the main features of this policy and some recent
changes.
Preference for the Public Sector
As is well known, a large public sector developed in India as a result of the policies
initiated in 1956.11 Prior to the reforms initiated in 1991, public sector enterprises
(PSEs) were not only protected from competition through reservation, but there
were also policies that mandated that both central government departments and
public sector enterprises apply price and purchase preference in favor of the pub-
lic sector. The preference for the public sector also applied to construction and
service enterprises and was extended to state-level PSEs.
Since that time some significant changes have occurred. The list of industries
reserved for the public sector has now been reduced significantly. The system of
price preferences has been discontinued, although the practice of using private
India’s Accession to the Government Procurement Agreement 241
sector bids to allow public sector units to submit a fresh bid continues. This sys-
tem of “purchase preference” has been extended, with some modifications, to
orders placed until March 31, 2000. Under this provision a government enterprise
whose bid is within 10 percent of that of a large private unit is allowed to revise its
price downward and is eligible for a parallel-rate contract. Given the emphasis on
privatization and reform of the public sector, such purchase preferences are now
an anachronism.
Preference for the Small-scale Sector
Policies aimed at protecting and promoting artisans and small-scale firms have
constituted an important element of India’s traditional economic policies. These
include reserving a large number of products for production by small-scale firms.
The small-scale sector also is protected through compulsory purchase and price
preferences on procurement imposed on central government ministries, depart-
ments, and PSEs. The purchase-preference system requires that specified products
be procured exclusively from small-scale firms. In addition, a system of price pref-
erence exists: if the price offered by the small-scale unit is not more than 15 percent
above the price offered by a large unit, the product has to be purchased from the
small-scale sector. This condition applies not only to central ministries and
departments, but also to central public undertakings. If the competition is with
the duty-inclusive price of imports, the implied preferential margin is higher with
respect to the duty-free price of imports. As in the case of the public sector, the
small-scale sector is exempted from the payment of earnest money and tender
fees. So far, the protection of artisans and small-scale firms, and the subsidies and
preferences directed to them, have not been touched by the reforms. Between
1994/95 and 1998/99, purchases by DGS&D from the small-scale sector were
about 8–10 percent of the directorate’s total purchases.12
Preferences for Indigenous Production
Before 1991 foreign firms’ direct investment in India was discouraged. The maxi-
mum foreign equity permitted in joint ventures was 40 percent. There were com-
plicated clearance procedures and controls over the terms of technical agreements
between local and foreign firms. Government procurement was used directly to
favor indigenous production over imports. Both a price and purchase preference
in favor of domestic production used to exist. The system of price preference was
abolished in 1992. Purchase preference was also scrapped. In some cases, however,
the preference for Indian providers of services, if not of goods, continues to apply.
242 India and the WTO

Redress of Grievances and Settlement of Dispute
According to the government, regular interaction is maintained with the suppliers
as well as tenderers so as to have necessary feedback and also to remove the griev-
ances of the suppliers. The primary objective is to provide “guidelines and coun-
seling” in all procedural and contractual matters pertaining to DGS&D procure-
ment. The grievances relating to delays in action concerning purchases and
inspection are resolved. There is also a Standing Review Committee functioning
under the DGS&D. Unresolved issues pertaining to contracts are settled through
arbitration, which is part of the general conditions of the contract.
India’s Procurement Policy and the GPA: Areas of Divergence
The major differences are with respect to the national treatment, transparency,
and challenge and review provisions of the GPA. With a number of price and pur-
chase preferences still in place, India’s policies are at odds with the requirements
of Article III. Although Article V provides some flexibility to developing coun-
tries, and exclusions are possible, the long-term objective of the GPA is do away
with any kind of preferential treatment in purchases. To promote greater trans-
parency in transactions, Article XVIII requires that information on winning con-
tracts be made public. It also makes it mandatory for each entity, on request, to
provide pertinent information concerning the reasons for rejection and the char-
acteristics and relative advantages of the selected tender. This could be a major
problem area because the procurement policies in place in India do not have any
such provision. In general India has the reputation of being one of the most
opaque countries in which to do business. As noted in the previous section, the
GPA lays down a detailed challenge procedure (Article XX), which has no parallel
in the existing rules and procedures in India insofar as there is no independent
adjudicating authority, and the concerned department generally deals with dis-
putes. An aggrieved party obviously always has access to a regular court of law.
India’s Position13
Like most other developing countries, India did not sign the Tokyo Round GPA
and is not a signatory to the current GPA. India, however, has dropped its opposi-
tion to a multilateral agreement on transparency in government procurement, a
long-standing demand of various multilateral agencies as well as some of its trad-
ing partners (“Not Good Enough” 1999). This is one of the new issues that has
arisen from the initiatives of the Singapore Ministerial Conference of December
1996 and is likely to be part of the Millennium Round negotiations. The Working
India’s Accession to the Government Procurement Agreement 243

Group on Transparency in Government Procurement had been set up by the
Singapore Ministerial Conference to study the existing practices and develop ele-
ments for inclusion in a suitable agreement.
India’s biggest problem with any government procurement agreement is with
the “national treatment” requirement. As noted above, the procurement policies
of the government give preference to various categories of companies based on
size and location. Such practices are based on the view that government procure-
ment is an important instrument for directing investment to “desirable” sectors,
less privileged social groups, and underdeveloped regions of the country. In view
of these concerns, the Indian government is only willing to go along with a suit-
able transparency agreement that steers clear of market-access issues.
Two other important areas of concern for India are the definition and scope of
government procurement and the issue of procurement methods. With regard to
the former, it is felt that a broad definition that includes government entities at the
subcentral level and other public entities would be difficult for a quasi-federal
state like India with multiple levels of government and with a large number of
public sector enterprises. Any agreement should be restricted to the central gov-
ernment. It is also held that the service sector and lease arrangements should be
beyond the purview of the agreement. Further, it is believed that the methods of
procurement have no bearing on transparency, and that there should be no
restriction on the choice of procurement method other than those placed by
domestic legislation. In addition, it is felt that existing domestic review and appeal
procedures are available and should not be a part of any transparency agreement.
Last, India maintains that the proposed transparency agreement should recognize
the special needs of developing countries and should incorporate a special clause
in this regard.14
India clearly is not ready to negotiate any agreement that goes beyond trans-
parency. In fact, it is feared that the transparency agreement might be the forerun-
ner for an agreement involving “national treatment.” As noted above, the position
is that this would deprive the government of an important instrument of develop-
ment policy. Although the existing plurilateral GPA provides for exemptions from
national treatment for certain categories of industries, these exemptions have to
be negotiated with the other members. Finally, the government feels applying the
WTO dispute-settlement mechanism to any transparency arrangement is unwar-
ranted, and that effective domestic review procedures should suffice in any such
agreement.
Participants at the Doha (Fourth) Ministerial Conference in November 2001
agreed that negotiation on the GPA will take place after the Fifth Session of the
Ministerial Conference and will build on progress made in the Working Group on
Transparency in Government Procurement. It has been agreed that negotiations
244 India and the WTO

will be limited to transparency aspects and will not restrict the scope for countries to
give preference to domestic supplies and suppliers.
Estimating the Value of Government Purchases
In this section I present estimates of the total value of government procurement in
India, with separate estimates for the central government, state governments,15
and public sector undertakings (PSUs). No estimates of the value of government
purchases are available for India. The estimates presented here are largely based
on publicly available data and should only be treated as being broadly indicative
of the scale of government purchases. Although there is scope for improving these
estimates, beyond a point the increase in accuracy is not likely to be commensu-
rate with the effort involved in achieving it.
Central Government Purchases
Estimates of purchases by central government ministries and departments are
provided in table 10.1. In view of the large scale of their purchases, and the fact
that purchases of goods and services (primarily construction contracts) account
for a larger share of their expenditures, estimates for the ministries of railways and
telecommunications are presented separately.16 Defense purchases are also excluded
because these are exempt from the provisions of the GPA.
It is reasonably straightforward to arrive at the estimate of central government
expenditure with some government procurement component (row 14 of table 10.1).17
Based on this, the expenditure on purchase of goods and services is estimated to
be Rs. 128.21 billion (US$2.9 billion) in 1999/00 and Rs. 186.37 billion ($4.0 billion)
in 2000/01.18 Without additional data at the ministry/department level it is not
possible to estimate exactly what proportion of spending will be above the GPA
thresholds. However, expenditures on individual items are likely to be small in
the case of “office expenses,” “motor vehicles,” “clothing and tentage,” and
“minor works.” If these items are excluded, the remaining items account for about
80 percent of total purchases. Two sets of estimates, provided in the last two rows of
table 10.1, are based on the assumptions that about 40 percent (“Subject to GPA–1”)
and 60 percent (“Subject to GPA–2”) of these purchases would be above the GPA
thresholds.19
Railways and Telecommunications
The estimates for purchases by railways and the telecommunication departments
are presented in tables 10.2 and 10.3.
India’s Accession to the Government Procurement Agreement 245

246 India and the WTO
TABLE 10.1 Central Government Expenditures, ExcludingRailways and Telecommunications (in billions of rupees)
1998/99 1999/00 2000/01(RE) (RE) (BE)
GDP at current prices 17,626.00 19,504.51 21,809.86Nonplan expenditure 2,135.42 2,243.43 2,503.87
Share of GDP (percent) 12.0 12.0 11.0Plan outlay (including IEBR) 884.80 963.09 1173.34
Share of GDP (percent) 5.0 5.0 5.0Total expenditure by governmentdepartments and ministries 3,020.22 3,206.52 3,677.21
Share of GDP (percent) 17.0 16.0 17.0Total expenditure on railways andtelecommunications 209.40 228.50 294.04Total expenditure by government departments and ministries (excluding railways and telecommunications) 2,810.82 2,978.02 3,383.17Nonplan expenditure with no central government procurementcomponent 1,888.38 1977.96 2232.41Plan expenditure with no central government procurement component 301.08 357.35 368.25Total expenditure with no central government procurement component 2,189.46 2,335.31 2,600.66Pay and allowances (including travel) of central ministries (excluding railways and telecommunications) 151.89 215.34 161.29Central government expenditure with some government procurementcomponent 469.47 427.37 621.22
Share of GDP (percent) 3.0 2.0 3.0Expenditure on purchases of goods and services 140.84 128.21 186.37Purchases subject to GPA–1 (at 30%) 42.25 38.46 55.91Purchases subject to GPA–2 (at 50%) 70.42 64.11 93.19
BE budget estimates; GDP gross domestic product; GPA Government Procurement Agreement; IEBRinternal and extrabudgetary resources; RE revised estimates.
Source: Ministry of Finance 1998, 1999, 2000.
Railways The railway budget provides data on items that involve purchase of
goods and services. The expenditure on items 2, 3, 4, and 5 (table 10.2) adds up to
about Rs. 113.74 billion for 1999/00 (US$2.6 billion),20—about 37 percent of the
total expenditure of Rs. 309 billion ($7.1 billion)—and Rs. 133.33 billion for

India’s Accession to the Government Procurement Agreement 247
2000/01 ($2.9 billion)—about 38 percent of the total expenditure of Rs. 355.52
($7.6 billion). Based on the assumptions that one-third or two-thirds of the pur-
chases will be above the GPA thresholds, I present two estimates for the value of
purchases likely to be subject to the GPA (see table 10.2).
Telecommunications To make the estimates for the department of telecommu-
nications I have relied on information provided in the central government
budget. The estimates presented in table 10.3 are based on the assumption that the
expenditures on the capital account on items 1 to 6 have a purchase content of 75
percent, and that the revenue expenditure on “engineering” has a procurement
content of 30 percent. Adjustments for thresholds are as in the case of the railways.
State Government Purchases
In the case of state governments, the share of expenditure on procurement in total
expenditure is likely to be higher than for the central government because state gov-
ernments spend less toward loans and grants to lower tiers of government. In view
of this I have estimated the share of purchases in total expenditures at the rate of
5 percent to 6 percent.21 The estimates for the consolidated expenditure of state
governments on the purchase of goods and services are presented in table 10.4.22
In view of the smaller scale of operations of individual state governments, and the
TABLE 10.2 Estimates of Purchases by Railways (in billions of rupees)
1998/99 1999/00 2000/01(RE) (RE) (BE)
Total working expenses 284.00 309.09 355.52Purchase of miscellaneous stores 5.23 5.06 6.35Purchase of fuel 13.42 15.91 19.22Purchase of stores for maintenance — 39.08 41.77Budget for new construction — 59.65 73.32Expenditure with government — 113.74 133.33procurement component
Share of total expenditure (percent) — 37.0 38.0Subject to GPA–1 — 37.91 44.44Subject to GPA–2 — 75.83 88.89
BE budget estimates; GPA Government Procurement Agreement; RE revised estimates.
—Not available.
Source: Ministry of Railways 1999a,b, 2000a,b.
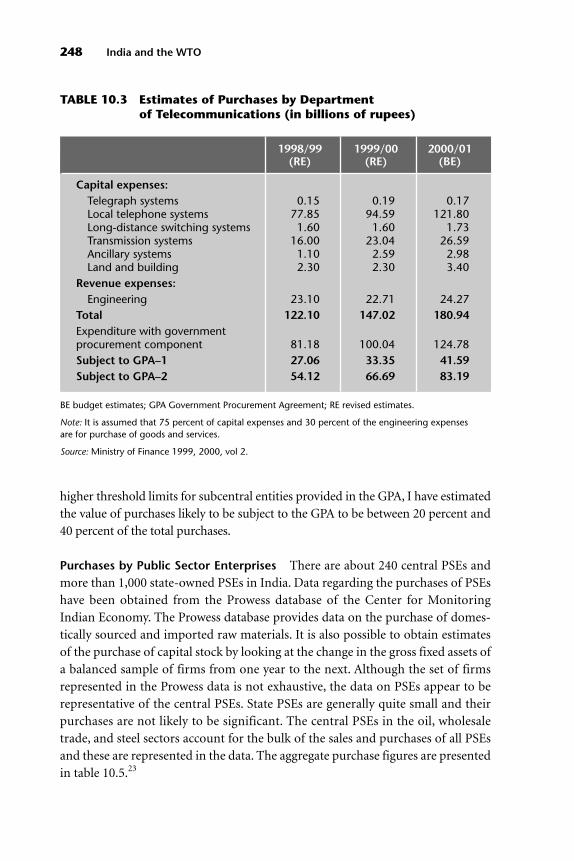
248 India and the WTO
TABLE 10.3 Estimates of Purchases by Department of Telecommunications (in billions of rupees)
1998/99 1999/00 2000/01(RE) (RE) (BE)
Capital expenses:Telegraph systems 0.15 0.19 0.17Local telephone systems 77.85 94.59 121.80Long-distance switching systems 1.60 1.60 1.73Transmission systems 16.00 23.04 26.59Ancillary systems 1.10 2.59 2.98Land and building 2.30 2.30 3.40
Revenue expenses:Engineering 23.10 22.71 24.27
Total 122.10 147.02 180.94Expenditure with governmentprocurement component 81.18 100.04 124.78Subject to GPA–1 27.06 33.35 41.59Subject to GPA–2 54.12 66.69 83.19
BE budget estimates; GPA Government Procurement Agreement; RE revised estimates.
Note: It is assumed that 75 percent of capital expenses and 30 percent of the engineering expenses are for purchase of goods and services.
Source: Ministry of Finance 1999, 2000, vol 2.
higher threshold limits for subcentral entities provided in the GPA, I have estimated
the value of purchases likely to be subject to the GPA to be between 20 percent and
40 percent of the total purchases.
Purchases by Public Sector Enterprises There are about 240 central PSEs and
more than 1,000 state-owned PSEs in India. Data regarding the purchases of PSEs
have been obtained from the Prowess database of the Center for Monitoring
Indian Economy. The Prowess database provides data on the purchase of domes-
tically sourced and imported raw materials. It is also possible to obtain estimates
of the purchase of capital stock by looking at the change in the gross fixed assets of
a balanced sample of firms from one year to the next. Although the set of firms
represented in the Prowess data is not exhaustive, the data on PSEs appear to be
representative of the central PSEs. State PSEs are generally quite small and their
purchases are not likely to be significant. The central PSEs in the oil, wholesale
trade, and steel sectors account for the bulk of the sales and purchases of all PSEs
and these are represented in the data. The aggregate purchase figures are presented
in table 10.5.23

India’s Accession to the Government Procurement Agreement 249
TABLE 10.4 State Government Expenditures (in billions of rupees)
BE budget estimates; GPA Government Procurement Agreement; RE revised estimates.
Note: The “Subject to GPA” estimates are based on the assumptions that 20 percent (GPA–1) to 50 percent (GPA–2) of expenditures are likely to be above the GPA thresholds.
Source: Reserve Bank of India 1999, 2000.
TABLE 10.5 Purchases by Public Sector Enterprises (in billions of rupees)
1991/92 1997/98
Public sector Total raw materials 669.00 1,400.04Imported raw materials 175.10 261.80Share of imports (percent) 26.0 19.0Change in fixed assets — 346.20Imports of capital equipment — 24.90Total procurement — 1,746.60Subject to GPA–1 — 383.95Subject to GPA–2 — 593.23
Private sector Total raw materials 506.95 1,453.20Imported raw materials 43.80 217.50Share of imports (percent) 9.0 15.0
—Not available.
Source: Center for Monitoring Indian Economy Prowess database.
1999/00 2000/011996/97 1997/98 1998/99 (RE) (BE)
Development expenditure 1,320.08 1,452.68 1645.04 1983.22 2083.32Nondevelopment expenditure 620.95 717.67 864.74 1101.37 1254.84Other expenditure 86.66 111.00 153.83 171.75 169.51Total expenditure 2,027.69 2,281.35 2,663.61 3,256.34 3,507.67
Estimated expenditure on purchase of goods and services:At 5% of total expenditure 101.38 114.07 133.18 162.82 175.38At 6% of total expenditure 121.66 136.88 159.82 195.38 210.46Subject to GPA–1 24.33 27.38 31.96 39.08 42.09Subject to GPA–2 48.66 54.75 63.93 78.15 84.18
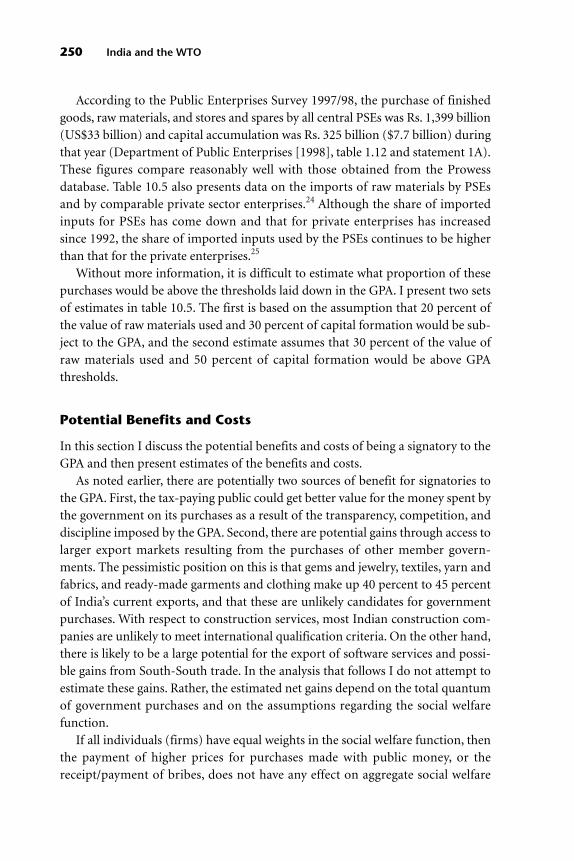
250 India and the WTO
According to the Public Enterprises Survey 1997/98, the purchase of finished
goods, raw materials, and stores and spares by all central PSEs was Rs. 1,399 billion
(US$33 billion) and capital accumulation was Rs. 325 billion ($7.7 billion) during
that year (Department of Public Enterprises [1998], table 1.12 and statement 1A).
These figures compare reasonably well with those obtained from the Prowess
database. Table 10.5 also presents data on the imports of raw materials by PSEs
and by comparable private sector enterprises.24 Although the share of imported
inputs for PSEs has come down and that for private enterprises has increased
since 1992, the share of imported inputs used by the PSEs continues to be higher
than that for the private enterprises.25
Without more information, it is difficult to estimate what proportion of these
purchases would be above the thresholds laid down in the GPA. I present two sets
of estimates in table 10.5. The first is based on the assumption that 20 percent of
the value of raw materials used and 30 percent of capital formation would be sub-
ject to the GPA, and the second estimate assumes that 30 percent of the value of
raw materials used and 50 percent of capital formation would be above GPA
thresholds.
Potential Benefits and Costs
In this section I discuss the potential benefits and costs of being a signatory to the
GPA and then present estimates of the benefits and costs.
As noted earlier, there are potentially two sources of benefit for signatories to
the GPA. First, the tax-paying public could get better value for the money spent by
the government on its purchases as a result of the transparency, competition, and
discipline imposed by the GPA. Second, there are potential gains through access to
larger export markets resulting from the purchases of other member govern-
ments. The pessimistic position on this is that gems and jewelry, textiles, yarn and
fabrics, and ready-made garments and clothing make up 40 percent to 45 percent
of India’s current exports, and that these are unlikely candidates for government
purchases. With respect to construction services, most Indian construction com-
panies are unlikely to meet international qualification criteria. On the other hand,
there is likely to be a large potential for the export of software services and possi-
ble gains from South-South trade. In the analysis that follows I do not attempt to
estimate these gains. Rather, the estimated net gains depend on the total quantum
of government purchases and on the assumptions regarding the social welfare
function.
If all individuals (firms) have equal weights in the social welfare function, then
the payment of higher prices for purchases made with public money, or the
receipt/payment of bribes, does not have any effect on aggregate social welfare

India’s Accession to the Government Procurement Agreement 251
(unless foreigners gain), although there is an impact on distribution. There are, of
course, other channels through which the prevalence of corruption can have an
adverse impact on social welfare. To the extent that transparency in government
procurement leads to a reduction in rent-seeking activities and lower levels of cor-
ruption, and to the extent that corruption lowers economic growth, impedes
development, and undermines political legitimacy,26 there are gains to be had on
this account. Because malfeasance in the award of government contracts and pur-
chases is only one of many sources of corruption, it is not possible to separate the
impact of this source of corruption from the “public bad” generated by corrup-
tion in general. For this reason I focus here on the direct gains that could accrue
exclusively as a result of the reduction in procurement costs that result from the
disciplines imposed by the GPA. I do not attempt to estimate the gains from a pos-
sible reduction in rent-seeking activities. The concern with corruption in public
procurement is largely a concern with issues of distribution rather than efficiency.
I will assume that social welfare is lowered if public spending buys fewer (and/or
poorer quality) goods and services than what is possible even though this may be
matched by private gains for politicians, bureaucrats, producers, or other individ-
uals. Any gains on account of reduction in rent-seeking activities are excluded
and, to the extent these are positive, the estimated benefits will be higher. I also do
not attempt to estimate possible gains from trade resulting from nonpreferential
procurement. As noted earlier, this depends on the relative scale of government
purchases. Attempting an estimate of this is beyond the scope of the present exer-
cise and is left as a subject for future research.
The extent of the social loss therefore depends on the relative weights attached
to the losers and the gainers, the total quantum of public funds misused, and the
total saving that could be generated. If we ignore the externalities associated with
corruption, the upper bound to this loss is provided by the total value of govern-
ment purchases subject to the discipline of the GPA.
These benefits need to be compared with the costs associated with acceding to
the GPA. There may be some administrative costs related to switching over to the
new system and adhering to its procedural requirements. In addition, as noted ear-
lier, there could be some costs associated with the removal of preferential treatment.
Estimated Benefits
Estimates of the total value of government expenditure above GPA thresholds are
consolidated in table 10.6. The estimates for government, including the state gov-
ernments, range from about 0.78 percent to 1.6 percent of gross domestic product
(GDP). The estimates for public sector enterprises are considerably higher, rang-
ing from about 3.5 percent to 5.9 percent of GDP.

252 India and the WTO
1997
/98
1998
/99
1999
/00
2000
/01
Min
imum
Max
imum
Min
imum
Max
imum
Min
imum
Max
imum
Min
imum
Max
imum
Cen
tral
gov
ernm
ent
——
42.2
570
.42
38.4
664
.11
55.9
193
.19
Railw
ays
——
36.3
572
.71
37.9
175
.83
44.4
488
.89
Tele
com
mun
icat
ions
——
27.0
654
.12
33.3
566
.69
41.5
983
.19
Tota
l cen
tral
g
ove
rnm
ent
——
105.
6619
7.25
109.
7220
6.63
141.
9426
5.27
Shar
e of
GD
P(p
erce
nt)
——
0.6
1.1
0.6
1.1
0.7
1.2
Stat
e go
vern
men
ts—
—31
.96
63.9
339
.08
78.1
542
.09
84.1
8To
tal g
ove
rnm
ent
——
137.
6226
1.18
148.
8028
4.78
184.
0334
9.45
10%
of g
over
nmen
tex
pen
ditu
re—
—13
.76
26.1
214
.88
28.4
818
.40
34.9
520
% o
f gov
ernm
ent
exp
endi
ture
——
27.5
252
.24
29.7
656
.96
36.8
169
.89
Shar
e of
GD
P(p
erce
nt)
——
0.8
1.5
0.8
1.5
0.8
1.6
Publ
ic s
ecto
r en
terp
rises
384.
959
3.2
431.
0966
4.38
482.
8274
4.11
545.
2582
8.77
Gra
nd
to
tal
——
609.
991,
003.
9267
6.26
1,11
4.33
784.
491,
283.
06Sh
are
of G
DP
(per
cent
) —
—3.
55.
73.
55.
73.
65.
9G
DP
——
17,6
26.0
017
,626
.00
19,5
04.5
119
,504
.51
21,8
09.8
621
,809
.86
TAB
LE 1
0.6
Co
nso
lid
ated
Go
vern
men
t P
rocu
rem
ent
Esti
mat
es (
in b
illi
on
s o
f ru
pee
s)
—N
ot a
vaila
ble.
Not
e:Fi
gure
s in
ital
ics
are
estim
ated
or
extr
apol
ated
.
Sour
ce:A
utho
r’s c
alcu
latio
ns.

According to the estimates in table 10.6, the maximum value for this is
Rs 265.3 billion (US$5.7 billion) for the year 2000/01 if only the central govern-
ment is subject to the GPA. The numbers are accordingly higher if state govern-
ment and PSE purchases are included. The matrix in table 10.7 presents different
estimates of the potential social gain based on different combinations of the
assumptions regarding the extent of savings of public funds and the relative
weight attached to gainers. The estimates range from Rs. 26.53 billion ($568 mil-
lion) to Rs. 132.64 billion ($2.8 billion) or between 0.1 percent and 0.6 percent of
GDP. Realistically, the savings is unlikely to be greater than 30 percent. Based on
Domberger, Hall, and Lee (1995), Hoekman (1998) has stated that competitive
tendering and outsourcing could produce savings of about 20 percent without
compromising quality. Transparency International (1997) notes that noncompet-
itive procedures may increase costs by about 30 percent. According to a recent
study reported by the World Bank (2000), about 51 percent of the respondents
stated that for government contracts they paid bribes either “always,” “usually,” or
“frequently.” According to 54 percent of the respondents, the payments amounted
to between 2 percent and 9 percent of the contract value.
To the extent that discrimination is welfare increasing, the savings will be
lower. If the entire savings is treated as a social gain, this amounts to about
0.36 percent of GDP. (Similar calculations, including the spendings of state gov-
ernments and PSEs, are presented in Appendix 4.) The estimates of social gain,
assuming that accession to the GPA results in a 30 percent savings, are presented
in table 10.8. To put some further perspective on these numbers, I have also
expressed them as a percentage of the fiscal deficit. These calculations show that
the social gain would be between 0.36 percent and 1.76 percent of GDP. If these
could be translated into savings for the central government, its fiscal deficit could
be reduced by about 7.15 percent to 34.60 percent, depending on what entities are
included.
India’s Accession to the Government Procurement Agreement 253
TABLE 10.7 Potential Gains, Central Government Only (in billions of rupees)
Savings
Relative Weight of Gainers 50% 30% 20%
100% 132.64 79.58 53.0575% 99.48 59.69 39.7950% 66.32 39.79 26.53
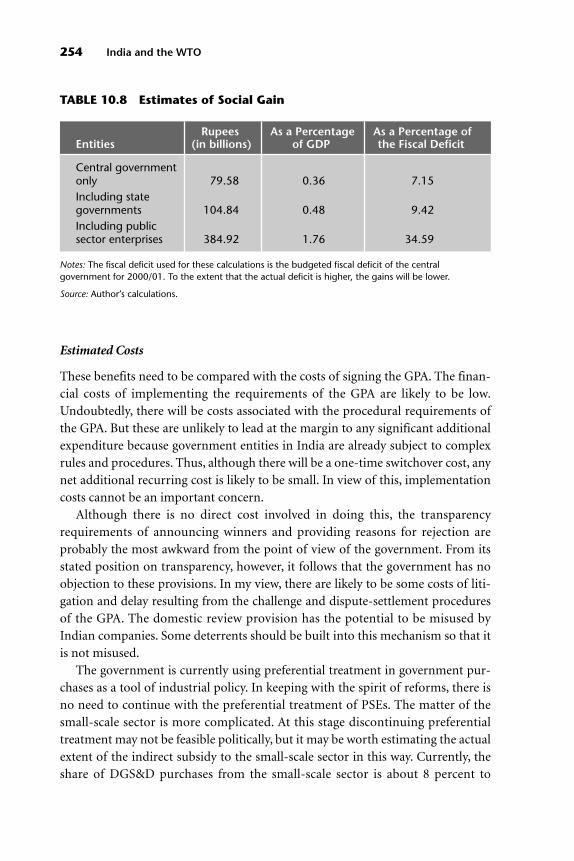
254 India and the WTO
Estimated Costs
These benefits need to be compared with the costs of signing the GPA. The finan-
cial costs of implementing the requirements of the GPA are likely to be low.
Undoubtedly, there will be costs associated with the procedural requirements of
the GPA. But these are unlikely to lead at the margin to any significant additional
expenditure because government entities in India are already subject to complex
rules and procedures. Thus, although there will be a one-time switchover cost, any
net additional recurring cost is likely to be small. In view of this, implementation
costs cannot be an important concern.
Although there is no direct cost involved in doing this, the transparency
requirements of announcing winners and providing reasons for rejection are
probably the most awkward from the point of view of the government. From its
stated position on transparency, however, it follows that the government has no
objection to these provisions. In my view, there are likely to be some costs of liti-
gation and delay resulting from the challenge and dispute-settlement procedures
of the GPA. The domestic review provision has the potential to be misused by
Indian companies. Some deterrents should be built into this mechanism so that it
is not misused.
The government is currently using preferential treatment in government pur-
chases as a tool of industrial policy. In keeping with the spirit of reforms, there is
no need to continue with the preferential treatment of PSEs. The matter of the
small-scale sector is more complicated. At this stage discontinuing preferential
treatment may not be feasible politically, but it may be worth estimating the actual
extent of the indirect subsidy to the small-scale sector in this way. Currently, the
share of DGS&D purchases from the small-scale sector is about 8 percent to
TABLE 10.8 Estimates of Social Gain
Rupees As a Percentage As a Percentage ofEntities (in billions) of GDP the Fiscal Deficit
Central government only 79.58 0.36 7.15Including state governments 104.84 0.48 9.42Including public sector enterprises 384.92 1.76 34.59
Notes: The fiscal deficit used for these calculations is the budgeted fiscal deficit of the centralgovernment for 2000/01. To the extent that the actual deficit is higher, the gains will be lower.
Source: Author’s calculations.

10 percent of the total purchases. Even if all of these purchases involve a price
preference of 15 percent (which they do not), the total “subsidy” to the small-scale
sector is only about 1.2 percent to 1.5 percent of the total expenditure. If consid-
ered necessary, this easily can be paid out as an explicit subsidy through a suitable
mechanism. The other sectors receiving preferential treatment are very small and
insignificant, and getting exclusions for them should not be difficult.
Conclusion
The major requirements of the GPA are nondiscrimination, competitive tendering,
and transparency, together with a domestic review mechanism and the WTO dispute-
settlement mechanism. The possible benefits from such an agreement are two-fold.
One source of gain is through better market access and gains from trade and the sec-
ond source is through the cost savings and quality gains likely to result from the dis-
ciplines imposed by the GPA. To the extent that corruption is reduced, there are gains
that follow from the reduction in negative externalities that arise from corruption.
On the other hand, there are some potential benefits from discrimination. As
things stand, India, like many other developing countries, is not in favor of the mul-
tilateralization of the GPA but is now willing to negotiate a limited transparency agree-
ment. In this chapter I have attempted to identify and quantify (where possible) the
costs and benefits to India of acceding to such an agreement.
In view of the composition of India’s current export basket, I have assumed
that the only significant source of gain can be from the potential savings in gov-
ernment resources that result from the disciplines of the GPA. The gains from
market access are likely to be negligible. According to my estimates the maximum
savings that is possible for central government purchases is Rs. 79.58 billion
(US$1.7 billion). This figure would increase to Rs. 104.84 billion ($2.2 billion) if
state governments were included and to close to Rs. 385 billion ($8.2 billion) if all
public enterprises were included. In my view, the inclusion of the latter is not jus-
tified. PSEs should be treated as commercial entities, and government decisions
should not be forced on them. As these entities are privatized or increasingly sub-
ject to hard budget constraints over time, efficiency will follow. Although India
has a federal structure and state government purchases are not subject to central
government decisions, it should be possible (albeit somewhat difficult) to ask state
governments to conform to the disciplines of such an agreement. At the first stage,
as in the case of the United States, all states need not be included. Thus the realis-
tic upper bound figure is probably close to Rs. 105 billion ($2.2 billion). These
gains chiefly follow from the transparency and competition-promoting provi-
sions of the GPA. The gains will be larger to the extent that there are some indirect
benefits resulting from the reduction of corruption in general.
India’s Accession to the Government Procurement Agreement 255

Of course, the constitutional (legal) implication of the central government
making a commitment on behalf of state governments is important. The central
government will probably need to enter into agreements with individual states.
The inclusion of state governments can only be voluntary and will, if at all, have to
be done in stages. Purchases by local governments are likely to be small. In view of
this, it should be easy enough to negotiate their exclusion. Failing this, they can
easily be excluded through the thresholds.
Obviously there will be some costs of putting in place the appropriate
processes and procedures. At present, there are fairly complex procedural require-
ments for purchases by government entities, so even though there will be a one-
time switchover cost, any net additional recurring costs are likely to be small.
Therefore, implementation costs cannot be an important concern. One possible
cost could result from the misuse (overuse) of the domestic review provision in
India, where there is a high propensity to litigate and where unsuccessful domes-
tic firms are likely to overuse it. Some deterrent should be built in to minimize
that possibility.
I have noted that there may be efficiency costs associated with the ultimate
removal of preferential treatment. Although any significant social loss is unlikely
to result from this, there may be significant political costs because both the small-
scale sector and the public sector are powerful constituencies.27
Although corruption is an internal issue and not a trade issue, adopting trans-
parent procedures can send positive signals for foreign investors. For some of the
reasons that I have noted, although India may not be ready for the GPA, there
should be no problem in negotiating a transparency agreement. When doing this,
it needs to be borne in mind that any transparency agreement is, most likely, a
precursor to a market access agreement. It also must be noted that, in view of the
relatively small scale of its purchases, India’s bargaining position on its own is not
likely to be very strong. Because these exclusions have to be negotiated “the scope
to pursue such policies is therefore inherently limited by the relative negotiating
power of the country seeking to apply them” (Hoekman 1998, pp. 252–53).
India’s opposition to the multilateralization of the GPA suggests that there are
some positive net costs perceived to be associated with it. But it is not clear
whether the perceived costs have been weighed against the potential benefits. Even
if government procurement is used as a means of promoting domestic industry, it
is important to estimate what the costs of doing this are and whether cost savings
from nondiscriminating and competitive purchasing could be used for directly
subsidizing this. I hope that the very preliminary estimates presented in this chap-
ter will provide a starting point for such analysis.
Since this chapter was written, the Indian position on the GPA has been articu-
lated more clearly, and there have been some changes in the stand now taken by
256 India and the WTO
India against what is reported in the chapter. My understanding of the Indian gov-
ernment’s current position on these issues is summarized here.28
• Definition of terms—”Transparency” is interpreted as meaning the provision
of complete information on the procurement system and should not involve
any obligation to follow specified procurement methods and procedures. The
“content” should be best left to that prescribed in the applicable national laws
or the procedures of the procuring entities.
• Scope and coverage—India has a multitiered and decentralized system of gov-
ernment and each level has its own procurement procedures. This decentral-
ization is efficient and, hence, encouraged. In view of this structure, universal
coverage of all procuring entities is neither required nor feasible. Moreover,
procurement at lower levels of government is likely to be of low value. In addi-
tion, public sector enterprises and services should be kept outside the purview
of any future obligations on transparency.
• Information on national laws and procurement opportunities—The require-
ment to provide information as a transparency issue is not contested, but
prescriptions as to “what information” and “where it is to be made available”
are not justified. Although providing information on individual procurement
opportunities should be transparent, the rules should not be prescriptive and
will vary according to the capacity of the member country. In the spirit of decen-
tralization, the DGS&D has now been abolished.
• Procurement procedures—It is the government’s case that there is already
transparency in procurement methods, time periods, tendering methods, qual-
ification procedures, decisions on qualifications, decisions on contract awards,
and so forth, and there is no need for any additional (prescriptive) conditions
for these procedures. Although, in practice, details of winning bidders are
widely publicized, debriefing unsuccessful bidders will be cumbersome and
costly.
• Dispute settlement mechanism—Because only the issue of transparency is
being considered by the working group there is no need to link this with the
WTO’s dispute-settlement mechanism or understanding. This is a trans-
parency (not an access) issue so punitive action such as the settlement mecha-
nism is not justified.
• Other matters related to transparency—The government believes that
the principles on which domestic systems are designed incorporate most
of the suggestions expressed by members of the working group. For example,
the procuring agencies that have the wherewithal have established Web sites
not only for providing information but also for accepting applications, com-
plaints, and so forth. These sites improve efficiency and add value for users of a
India’s Accession to the Government Procurement Agreement 257

particular system, including adding value in the form of controlling the extent
of graft. However, these systems have to reflect the local conditions and cannot
be subject to overriding and externally imposed conditions.
Appendix 1: Other Examples of GovernmentProcurement Practices
In this appendix I provide examples of government procurement practices for
the State Government of Himachal Pradesh and the National Thermal Power
Corporation.29
State Government of Himachal Pradesh
Government purchases in Himachal Pradesh (HP) are governed by the “Proce-
dures and Rules for the Purchase of Stores by all Departments and Offices of the
Government of Himachal Pradesh,” which are published as an appendix to the HP
financial rules. The purchase of stores by all departments of the state of Himachal
Pradesh is generally made through a central agency called the Himachal-Pradesh
Stores Department. As in the case of the DGS&D, the Stores Department enters
into rate contracts for articles of common use.
Preferential Treatment According to these rules there is a preference for stores
produced and manufactured wholly or partially in India in general and in HP par-
ticularly. Up to some predetermined limit, the rules favor products of cottage and
small-scale industries in HP over manufactured goods of large-scale industries of
equal standard, even if the price of the former is higher. Currently, a 15 percent
price preference is given to products of cottage industries and small-scale indus-
trial units located in the state, whereas the corresponding figure for medium- and
large-scale industrial units in the state is 3 percent. Items manufactured by gov-
ernment enterprises can be purchased directly by the concerned departments,
provided these are not manufactured by any cottage or small-scale industries
within HP. In general, a preference is given to HP over other states and to articles
of domestic origin over those of foreign origin. Articles manufactured abroad,
with a preference to Commonwealth countries (!), are imported only when suit-
able Indian products are not available.
Tendering Procedures The limited tender system is adopted only for meeting
urgent requirements. The emergency must be established and certified by the
procuring office. These tenders can be invited only for indents of less than Rs.
10,000 (approximately US$220), and they require submission of tenders by at
258 India and the WTO

least six suppliers. For indents greater than Rs. 10,000 in value, tenders are invited
through advertisement. It is specified in the tender notice that the power is
reserved to reject any or all of the tenders received without assignment of reason.
A period of three weeks from the date of publication is assigned for the receipt of
tenders, except in the case of urgent demands when the period may be reduced to
two weeks. The single-tender system is used in the case of articles of proprietary
nature that are available from only one source. When accepting tenders other than
the lowest, approval from higher authorities has to be sought.
Dispute Settlement Mechanism There is a provision for a tenderer to make an
appeal against the award of a rate contract to the Secretary (Industry) or any other
authority as notified by the government. After the contract has been awarded, all
disputes arising with respect to the contract or the rights and liabilities of the par-
ties involved can be referred for arbitration to an officer appointed by the Govern-
ment of Himachal Pradesh. The decision of the arbitrator is final and binding on
the parties.
National Thermal Power Corporation
The stated objective of the procurement system is to make available the required
equipment, materials, works, and services of desired quality at the right time and
to ensure fair competition to all prospective bidders. The procurement process of
a power project at the National Thermal Power Corporation (NTPC)—a PSE—
divides the entire work into smaller well-defined groupings of equipment and
services called “contract packages.” The packages are classified according to the
services required from the contractor (supply, supply-and-supervision of erec-
tion, supply-and-erection, civil and structural works, or consultancy), the avail-
ability of external assistance (from the International Development Association
[IDA] or other financing agencies like the Asian Development Bank or World
Bank), the mode of tendering to be adopted (international competitive bidding
and domestic competitive bidding), and the extent of engineering coordination
and value of the package (corporate contract package or site package).
Bidding documents define the responsibilities and liabilities of the owner and
the contractor, and they include unambiguous instructions to bidders, technical
specifications, and data requirements and forms for the bid proposal. Qualifying
requirements indicate specific details of a bidder’s requisite experience in addition
to general requirements regarding his or her capacities and capabilities. The date
and time of completion of the work, as stipulated in the bidding document, are
incorporated in the Letter of Award. To ensure that the owner does not suffer due
to the unavailability of spares during the full life of the equipment, the contractor
India’s Accession to the Government Procurement Agreement 259

has to ensure the long-run availability of spares. If unable to do so, the owner can
purchase spares at the risk and cost of the contractor. In evaluating a bid, bidding
documents are taken as the base. The contract is awarded to the lowest evaluated,
qualified, and technically and commercially responsive bidder.
From 1981/82 until 1998/99 most of the contracts awarded by the NTPC used
domestic competitive bidding as the mode of tendering. Even with international
competitive bidding procedures, however, more contracts have been awarded to
Indian bidders than to foreign bidders. Thus, under GPA rules, Indian companies
may not lose too many contracts. The NTPC follows a purchase and price prefer-
ence policy in accordance with central government regulations.
Finally, disputes that may arise between the contractor and the owner during
the execution of the work are referred to the engineer concerned. In case he or she
does not give a written notice of decision within 30 days or if either party is dis-
satisfied with the decision given, the matter may be referred for arbitration. The
decision of the majority of the arbitrators is final and binding on the parties.
Appendix 2: Estimating Central Government Purchases
The starting points for these estimates are the central government budget docu-
ments for 1999/00 and 2000/01. I have relied primarily on the information on the
nonplan expenditure by “Broad Categories,” the plan outlays by “Heads of Devel-
opment,” and the detailed “Demand for Grants” contained in the “Expenditure
Budget” volumes of the budget documents. This information is supplemented
with information on grant-wise and object-of-expenditure-wise data for the two
years. The relevant figures and calculations are presented in table 10.A.1. In view
260 India and the WTO
TABLE 10.A.1 Shares of Total Expenditure for Items InvolvingGovernment Purchases
Item Share (percent)
Supplies and materials 6.7Major works 3.0Minor works 1.5Office expenses 1.3Machinery and equipment 1.1Motor vehicles 0.2Clothing and tentage 0.1Total 14.0
Source: Author’s calculations.

of the large scale of their purchases and the fact that purchases of goods and ser-
vices (primarily construction contracts) account for a larger share of their expen-
ditures, the ministries of railways and telecommunications are excluded from
these calculations.30 Estimates for those departmental undertakings are pre-
sented separately.
The sum of the plan and nonplan outlays, including the internal and extra-
budgetary resources (IEBR), gives the total expenditure by the different min-
istries and departments of the central government. This is estimated to be over
Rs. 3,000 billion (over US$71 billion31) for the three years for which the estimates
are presented and, at current prices, it works out to 16 percent to 17 percent of
GDP. From this I subtract that part of the government expenditure on railways
and telecommunications that is reflected in the central government budget. I
also subtract those components of the plan and nonplan expenditures that
clearly have no element of government procurement. In the case of the former,
this is restricted to the plan assistance provided by the central government to
states and union territories. For the nonplan expenditures, this includes interest
payments, expenditure on subsidies, writeoff of state government loans, welfare
payments, payments to the International Monetary Fund, and grants and loans
to state governments and union territories. All defense expenditures are
excluded because related purchases are outside the purview of the GPA. From
this I also subtract the expenditure on pay and allowances of central govern-
ment ministries and departments (excluding the provision for railways and
telecommunications).32 This leaves a total of about Rs. 427 billion ($9.8 billion)
for 1999/00 and Rs. 621 billion ($13.3 billion) for 2000/01, a share of approxi-
mately 2 percent to 3 percent of GDP. This composite expenditure is on items
for which further disaggregation is not possible, based on the budget docu-
ments, and clearly involves expenditures on items other than purchases of goods
and services. In an attempt to sharpen the estimates further, I have used data
on object-wise expenditures by central departments and ministries for the year
1998/99. The various objects of expenditure are listed in table 10.A.2. The
items “supplies and materials,” “major works,” “minor works,” “office expenses,”
“machinery and equipment,” “motor vehicles,” and “clothing and tentage”
involve government expenditure on the purchase of goods and services.33 I use
these data to estimate the shares of these items in the total expenditure. To make
the figures comparable, I excluded demand numbers 29 (interest payments), 30
(transfer to state and union territory governments), and 32 (repayment of bor-
rowings) because the first two have been accounted for in the calculations and
the third is an accounting entry. Data for demand number 16, pertaining to the
department of telecommunications, were also excluded. In addition, I excluded
expenditures on salaries and wages, overtime allowances, pensions, travel, and
India’s Accession to the Government Procurement Agreement 261

arms and ammunition. Of the remaining expenditure, the share of the items
involving government purchases is about 14 percent (see table 10.A.1). This,
however, is likely to be an underestimate because subsidies, grants, and loans
and advances are included in the denominator in these calculations although in
part they have been accounted for before arriving at the composite figure in
table 10.A.1. If those three objects of expenditure are also excluded, the share of
the seven items involving procurement works out to about 38 percent. This is
clearly an overestimate and the true value lies somewhere between the two per-
centages. Assuming the share to be 30 percent,34 the government expenditure on
purchase of goods and services works out to Rs. 140.84 billion ($3.32 billion)
for 1998/99, Rs.128.21 billion ($2.94 billion) for 1999/00, and Rs. 186.37 billion
($3.99 billion) for 2000/01.
262 India and the WTO
TABLE 10.A.2 Objects of Expenditure
Demand Demand Number Item Number Item
1 Repayment of borrowings 24 Advertising and publicity2 Interest 25 Rents, rates, and taxes3 Loans and advances 26 Suspense4 Grants-in-aid 27 Wages5 Share of taxes and duties 28 Motor vehicles6 Subsidies 29 Arms and ammunition7 Investments 30 Overtime allowances8 Salaries 31 Foreign travel expenses9 Supplies and materials 32 Other capital expenditures
10 Exchange variations 33 Other administrative11 Other charges expenditures
12 Pension charges 34 Clothing and tents
13 Major works 35 Petroleum, oil, and
14 Contributions lubricants
15 Writeoffs and losses 36 Publications
16 Minor works 37 Reserves
17 Office expenses 38 Scholarships and stipends
18 Machinery and equipment 39 Secret service expenditures
19 Professional services 40 Royalties
20 Other contractual services 41 Rewards
21 Interaccount transfers 42 Lump-sum provision
22 Domestic travel expenses 43 Depreciation
23 Cost of rations 44 Deduct recoveries
Notes: Items in bold involve government purchases. Items are listed in order of importance.
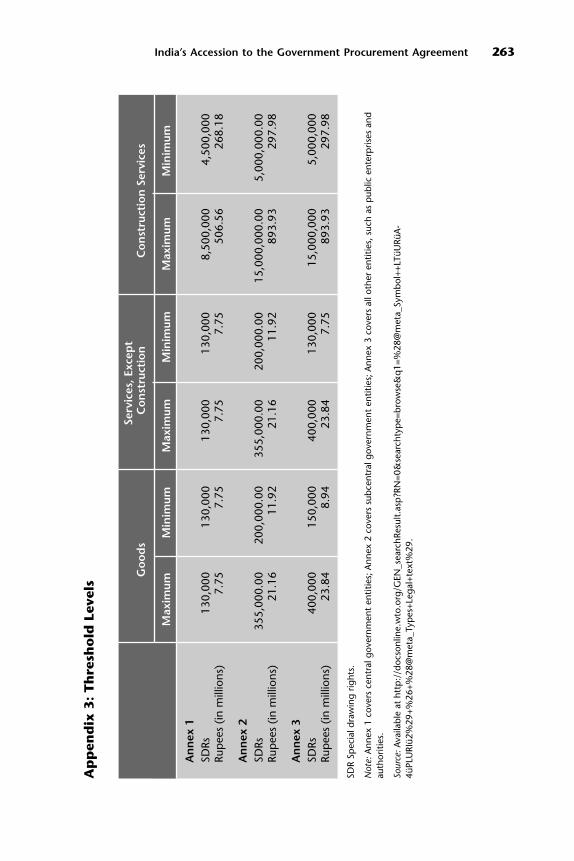
Ap
pen
dix
3: T
hre
sho
ld L
evel
s
India’s Accession to the Government Procurement Agreement 263
Serv
ices
, Exc
ept
Go
od
sC
on
stru
ctio
nC
on
stru
ctio
n S
ervi
ces
Max
imum
Min
imum
Max
imum
Min
imum
Max
imum
Min
imum
An
nex
1SD
Rs
130,
000
130,
000
130,
000
130,
000
8,50
0,00
04,
500,
000
Rup
ees
(in m
illio
ns)
7.75
7.75
7.75
7.75
506.
5626
8.18
An
nex
2SD
Rs35
5,00
0.00
200,
000.
0035
5,00
0.00
200,
000.
0015
,000
,000
.00
5,00
0,00
0.00
Rup
ees
(in m
illio
ns)
21.1
611
.92
21.1
611
.92
893.
9329
7.98
An
nex
3SD
Rs40
0,00
015
0,00
040
0,00
013
0,00
015
,000
,000
5,00
0,00
0Ru
pee
s (in
mill
ions
)23
.84
8.94
23.8
47.
7589
3.93
297.
98
SDR
Spec
ial d
raw
ing
right
s.
Not
e:A
nnex
1 c
over
s ce
ntra
l gov
ernm
ent
entit
ies;
Ann
ex 2
cov
ers
subc
entr
al g
over
nmen
t en
titie
s; A
nnex
3 c
over
s al
l oth
er e
ntiti
es, s
uch
as p
ublic
ent
erp
rises
and
auth
oriti
es.
Sour
ce:A
vaila
ble
at h
ttp
://d
ocso
nlin
e.w
to.o
rg/G
EN_s
earc
hRes
ult.
asp
?RN
=0&
sear
chty
pe=
brow
se&
q1=
%28
@m
eta_
Sym
bol+
+LTü
URü
A-
4üPL
URI
ü2%
29+%
26+%
28@
met
a_Ty
pes
+Leg
al+t
ext%
29.
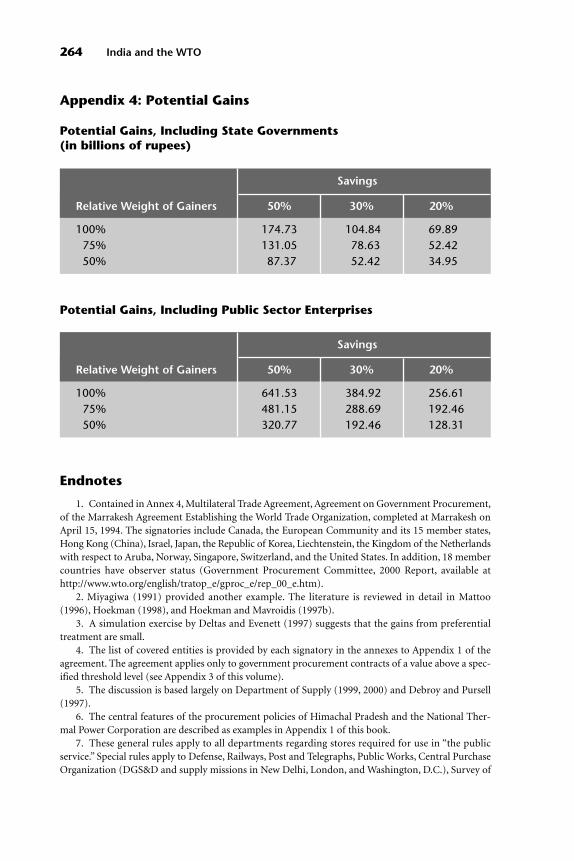
Endnotes
1. Contained in Annex 4, Multilateral Trade Agreement, Agreement on Government Procurement,
of the Marrakesh Agreement Establishing the World Trade Organization, completed at Marrakesh on
April 15, 1994. The signatories include Canada, the European Community and its 15 member states,
Hong Kong (China), Israel, Japan, the Republic of Korea, Liechtenstein, the Kingdom of the Netherlands
with respect to Aruba, Norway, Singapore, Switzerland, and the United States. In addition, 18 member
countries have observer status (Government Procurement Committee, 2000 Report, available at
http://www.wto.org/english/tratop_e/gproc_e/rep_00_e.htm).
2. Miyagiwa (1991) provided another example. The literature is reviewed in detail in Mattoo
(1996), Hoekman (1998), and Hoekman and Mavroidis (1997b).
3. A simulation exercise by Deltas and Evenett (1997) suggests that the gains from preferential
treatment are small.
4. The list of covered entities is provided by each signatory in the annexes to Appendix 1 of the
agreement. The agreement applies only to government procurement contracts of a value above a spec-
ified threshold level (see Appendix 3 of this volume).
5. The discussion is based largely on Department of Supply (1999, 2000) and Debroy and Pursell
(1997).
6. The central features of the procurement policies of Himachal Pradesh and the National Ther-
mal Power Corporation are described as examples in Appendix 1 of this book.
7. These general rules apply to all departments regarding stores required for use in “the public
service.” Special rules apply to Defense, Railways, Post and Telegraphs, Public Works, Central Purchase
Organization (DGS&D and supply missions in New Delhi, London, and Washington, D.C.), Survey of
264 India and the WTO
Potential Gains, Including State Governments (in billions of rupees)
Savings
Relative Weight of Gainers 50% 30% 20%
100% 174.73 104.84 69.8975% 131.05 78.63 52.4250% 87.37 52.42 34.95
Potential Gains, Including Public Sector Enterprises
Savings
Relative Weight of Gainers 50% 30% 20%
100% 641.53 384.92 256.6175% 481.15 288.69 192.4650% 320.77 192.46 128.31
Appendix 4: Potential Gains

India, Stationery and Printing, and other departments responsible for large purchases (Debroy and
Pursell 1997).
8. Indian standard specifications are formulated by the Bureau of Indian Standards.
9. This is not true of all state governments. See, for example, the description of the practices in the
state of Himachal Pradesh (Appendix 1).
10. See the Government of India’s response to question 9 of the WTO Questionnaire on Govern-
ment Procurement Services (document S/WPGR/W/11/Add. 14, dated January 17, 1997).
11. In March 1998 there were 240 central PSEs (see Department of Public Enterprises 1998) and
almost 1,000 state PSEs, including electricity boards.
12. The year 1997/98 with a 13.3 percent share is an exception.
13. When this chapter was originally written, no official document describing India’s position was
available. The discussion in this section was based on newspaper reports, unofficial documents, and
conversations with people familiar with the subject. Now, following the Doha Ministerial Declaration,
India’s official position is more clear.
14. Similar to Article V of the current GPA.
15. Although there are three levels of local government below the state governments, I have not
attempted any estimates for these because no data are available. The value of purchases by these local
governments is likely to be small and their transactions (except, possibly, in rare cases) are unlikely to
be of values larger than the threshold levels in the GPA.
16. In any case, the railways budget is presented and voted separately from the central government
budget.
17. The procedure is described in some detail in Appendix 2 of this book.
18. Rupees (Rs.) refers to Indian rupees and conversion to U.S. dollars is based on exchange rates
of US$1 = Rs. 42.4 for 1998/99, $1 = Rs. 43.6 for 1999/00, and $1 = Rs. 46.7 for 2000/01.
19. These work out to be 30 percent to 50 percent of the total.
20. For the last item—“new construction”—I have assumed that 10 percent of the expenditure is
for control and supervision.
21. According to the estimates presented in table 10.1, the central government expenditure on
purchase of goods and services was 4.7 percent of total expenditure in 1998/99, approximately 4 percent
of total expenditure in 1999/00, and is expected to be 5.1 percent of total expenditure in 2000/01.
Available evidence for Himachal Pradesh shows that the main items involving purchases during
1998/99 were machinery and equipment (Rs. 272 million), materials and supplies (Rs. 466 million),
and major works (Rs. 366 million). The estimated procurement content of these purchases works out
to a little more than 5 percent of the state’s total expenditure of Rs. 4.1 billion during that year.
22. The estimate of “net purchase of commodities and services” by administrative departments of
the state governments (Rs. 123.6 billion for 1996/97) presented in the National Accounts Statistics (see
CSO 1998) is somewhat higher than my high estimate of Rs. 121.7 billion. This is also true for the esti-
mate of central government expenditure on the same item, which is estimated to be Rs. 221.1 billion
during 1996/97 or about 6.1 percent of total expenditure.
23. It was not possible to get consistent data beyond 1997/98. These figures have been extrapolated
to get the estimates for later years presented in table 10.6.
24. The comparison is with private enterprises in the same sectors.
25. The bulk of the difference is accounted for by the imports of crude oil and petroleum products.
26. These issues are discussed in detail in Elliot (1997) and Jain (1998).
27. This is reflected in the fact that there has not been any significant privatization in spite of a
number of government initiatives in this direction. Also, there has been no serious debate within gov-
ernment regarding continuation of the reservations for the small-scale sector, although there is
enough evidence to suggest that such reservation may be costly.
28. In the absence of any formal documentation of the official position, this is based on newspa-
per reports and discussions with government officials familiar with the subject.
29. The section on National Thermal Power Corporation is based on Bajaj (1995).
India’s Accession to the Government Procurement Agreement 265
30. In any case, the railway budget is presented and voted separately from the central government
budget.
31. The conversion rates for Indian rupees to U.S. dollars used here are US$1 = Rs. 42.4 for
1998/99, $1 = Rs. 43.6 for 1999/00, and $1 = Rs. 46.7 for 2000/01.
32. These data are also available in the Expenditure Budget volume of the central government
budget documents.
33. The entire expenditure on these items cannot be assumed to be on purchases and contracts
because these may include some expenditure on control and supervision.
34. This is probably marginally higher than the actual share.
Bibliography and References
Bajaj, Harbans L. 1995. “Managing Contracts for Power Projects.” Paper presented at the Interna-
tional Conference on Contract Management in the Construction Industry, New Delhi.
Baldwin, R. E. 1970. “Restrictions on Government Expenditure.” In R. E. Baldwin, ed., Nontariff
Distortions of International Trade. Washington D.C.: Brookings Institution Press.
———. 1984. “Trade Policies in Developed Countries.” In R. W. Jones and P. B. Kenen, eds., Hand-
book of International Economics, Vol. 1. Amsterdam: North Holland.
Baldwin, R. E., and J. D. Richardson. 1972. “Government Purchasing Policies, Other NTBs, and the
International Monetary Crisis.” In H. English and K. Hay, eds., Obstacles to Trade in the Pacific Area.
Ottawa: Carleton School of International Affairs.
Branco, F. 1994. “Favoring Domestic Firms in Procurement Contracts.” Journal of International
Economics 37: 65–80.
Chen, Xianquin. 1995. “Directing Government Procurement as an Incentive of Production.” Jour-
nal of Economic Integration 10: 130–40.
CSO (Central Statistical Organization). 1998. National Accounts Statistics 1998. Department of Sta-
tistics, Ministry of Planning and Programme Implementation, Government of India. New Delhi.
Debroy, Bibek, and Gary Pursell. 1997. “Government Procurement Policies in India.” In Bernard
Hoekman and Petros Mavroidis, eds., Law and Policy in Public Purchasing: The WTO Agreement on
Government Procurement. Ann Arbor: University of Michigan Press.
Deltas, George, and Simon Evenett. 1997. “Quantitative Estimates of the Effects of Preference Poli-
cies.” In Bernard Hoekman and Petros Mavroidis, eds., Law and Policy in Public Purchasing: The WTO
Agreement on Government Procurement. Ann Arbor: University of Michigan Press.
Department of Public Enterprises. 1998. Public Enterprises Survey 1997–98, Vol. 1. Ministry of
Industry, Government of India, New Delhi.
Department of Supply. 1999. Annual Report 1998–99. Ministry of Commerce, Government of
India, New Delhi.
Department of Supply. 2000. Annual Report 1999–00. Ministry of Commerce, Government of
India, New Delhi.
Domberger, Simon, Christine Hall, and Eric Ah Lik Lee. 1995. “The Determinants of Price and
Quality in Competitively Tendered Contracts.” Economic Journal 105: 1454–70.
Elliot, Kimberly Ann, ed. 1997. Corruption and the Global Economy. Washington, D.C.: Institute for
International Economics.
Ganesan, A. V. 1999. “Seattle Ministerial Conference of WTO: Agenda for India.” Discussion Paper.
Indian Council for Research on International Economic Relations, New Delhi, August.
Helpman, Elhanan, and Paul R. Krugman. 1986. Market Structure and Foreign Trade. Cambridge,
Mass.: MIT Press.
Hoekman, Bernard. 1998. “Using International Institutions to Improve Public Procurement.”
World Bank Research Observer 13: 249–69.
Hoekman, Bernard, and Michel Kostecki. 1995. The Political Economy of the World Trading System:
From GATT to WTO. Oxford, U.K.: Oxford University Press.
266 India and the WTO
Hoekman, Bernard, and Petros Mavroidis, eds. 1997a. Law and Policy in Public Purchasing: The
WTO Agreement on Government Procurement. Ann Arbor: University of Michigan Press.
———. 1997b. “Multilateralizing the Agreement on Government Procurement.” In Bernard
Hoekman and Petros Mavroidis, eds., Law and Policy in Public Purchasing: The WTO Agreement on
Government Procurement. Ann Arbor: University of Michigan Press.
Jain, Arvind K., ed. 1998. Economics of Corruption. Boston: Kluwer Academic Publishers.
Krugman, Paul R. 1987. “Is Free Trade Passé?” Journal of Economic Perspectives 1: 131–44.
———. 1988. Strategic Trade Policy and the New International Economics. Cambridge, Mass.: MIT
Press.
Laffont, J. J., and Jean Tirole. 1991. “Auction Design and Favouritism.” International Journal of
Industrial Organization 9: 9–42.
Mattoo, Aaditya. 1996. “The Government Procurement Agreement: Implications of Economic
Theory.” World Economy 19: 695–720.
McAfee, R. Preston, and John McMillan. 1989. “Government Procurement and International
Trade.” Journal of International Economics 26: 291–308.
Ministry of Finance. 1998. Expenditure Budget, Vols. 1 and 2. Ministry of Finance, Government of
India, June.
———. 1999. Expenditure Budget, Vols. 1 and 2. Ministry of Finance, Government of India, New
Delhi, February.
———. 2000. Expenditure Budget, Vols. 1 and 2. Ministry of Finance, Government of India, New
Delhi, February.
Ministry of Railways (Railway Board). 1999a. The Demand for Grants for Expenditure of the Central
Government on Railways, 1999–2000, Part I. Government of India, New Delhi.
———. 1999b. Explanatory Memorandum on Railway Budget 1999–2000. Government of India,
New Delhi.
———. 2000a. The Demand for Grants for Expenditure of the Central Government on Railways, Part
I. Government of India, New Delhi.
———. 2000b. Explanatory Memorandum on Railway Budget. Government of India, New Delhi.
Miyagiwa, K. 1991. “Oligopoly and Discriminatory Government Procurement Policy.” American
Economic Review 81: 291–308.
”Not Good Enough.” 1999. Economic Times, August 4.
Reserve Bank of India. 1999. Handbook of Statistics on Indian Economy. Mumbai.
Reserve Bank of India. 2000. Handbook of Statistics on Indian Economy. Mumbai.
Transparency International. 1997. The TI Source Book: Applying the Framework. Berlin.
WTO (World Trade Organization) Secretariat. 1999. Guide to the Uruguay Round Agreements. The
Hague, Netherlands: Kluwer Law International.
World Bank. 2000. India: Policies to Reduce Poverty and Accelerate Sustainable Development. Report
19471-IN. Washington, D.C.
India’s Accession to the Government Procurement Agreement 267

During the rounds of multilateral trade negotiations promoted by the Gen-
eral Agreement on Tariffs and Trade (GATT), especially since the
Kennedy Round in the 1960s, the world has witnessed a significant reduc-
tion in import tariffs. Lately there also has been a reduction in the unilateral appli-
cation of quotas and other forms of nontariff barriers (NTBs). A considerable
number of NTBs still exist, however, in the shape of technical regulations and
standards. Technical regulations and standards (including sanitary and phytosan-
itary controls) are not in themselves trade barriers, but their use or adoption may
create new obstacles to trade and provide protection to domestic producers.
The Agreement on Technical Barriers to Trade (TBT) and the Agreement on
Sanitary and Phytosanitary Measures (SPS) define the international rights and
obligations of member countries with respect to the development or application
of standards-related measures that affect trade.1 They are based on the principle
that countries have a right to adopt and apply such measures as long as they do
not restrict international trade more than is necessary or unavoidable. Although
these agreements have established certain standards for their application, dis-
agreements among countries about these measures often involve complex issues
not specifically addressed by the text of the agreements.
The perceptions and the institutional capacities of developing countries are
significantly different from those of industrial countries in implementation of
the TBT and SPS agreements under the World Trade Organization (WTO).
269
11
Technical Barriers to Trade and the
Role of IndianStandard-Setting
Institutions
Mohammed Saqib
Developing countries fear that technical barriers may become increasingly impor-
tant in the future and thereby become significant barriers to trade. Among the diffi-
culties in the technical aspects of trade identified by the developing countries are the
high cost of adaptation, the irrelevance of foreign standards to local conditions, the
lack of timely and adequate information and consequent transaction costs, the diffi-
culties in understanding the requirements and in testing for and monitoring them,
the perceived lack of scientific data for specific threshold or limiting values, and the
uncertainty that arises from rapidly changing requirements in overseas market.
The major issue facing developing countries is implementation, which leads to
the question of domestic capacity building. This chapter reviews the existing insti-
tutional or infrastructure framework created to comply with the TBT/SPS Agree-
ments and the approach for addressing NTB measures. It also highlights the areas
in which India should seek international technical and financial assistance to fully
implement the TBT/SPS Agreements.
The chapter is based on a preliminary survey of exporters, government and
nongovernment institutions, and various regulatory authorities and reports of the
Indian Government.
The first section of the chapter provides a literature survey and identifies some
of the products that have met NTBs in the international market. The second sec-
tion reviews the status of the domestic institutional structure responsible for
implementing the TBT and SPS Agreements. The third section deals with the
international institutional framework. The final section provides conclusions and
policy recommendations.
Literature Survey
In this section I present a brief literature survey concerning standards as well as a
discussion of the SPS and TBT Agreements and NTBs raised by these agreements.
Standards perform a number of vital functions if used fairly. They facilitate
market transactions, reduce the cost of uncertainty, increase the elasticity of sub-
stitution, promote economies of scale, provide guidelines or focal points around
which enterprises can organize their production processes, and serve as bench-
marks of technological capabilities and guarantees of compatibility with other
components or with networks (Maskus and Wilson 2000).
Standards, however, can become barriers to trade when they vary among coun-
tries. The cost of complying with standards may be higher for foreign than for
domestic firms, and that implicitly creates a trade barrier. Where regulatory
authorities require product testing in the importing country to ensure compliance
with that country’s health or safety regulations, foreign suppliers will find them-
selves at a disadvantage if their products are subject to stricter tests or higher fees
270 India and the WTO

than those required for domestic products (ITC/CS 1999). This process is referred
to as “conformity assessment” and some would argue that it presents the largest
potential technical barrier to trade (Maskus and Wilson 2000). Conformity assess-
ment is vulnerable to nontransparency, delays, arbitrary inspection, and redundant
tests and is susceptible to being used as protection by domestic firms. The costs of
uncertainty in complying with such procedures may well persuade foreign enter-
prises to withdraw from key markets.
Developing countries generally are less likely to have well-developed testing
facilities for certification and accreditation. They will be unlikely to reach mutual
recognition agreements with other countries, and they may find it difficult to
reach the standards set especially by developed market economies. Trade between
developing countries may also be constrained by both the inability to meet inter-
nationally agreed standards and the refusal to recognize the standards of other
countries. The solution to this problem lies in harmonizing standards at the
international level and in developing guidelines for determining conformity to
standards (ITC/CS 1999). It can be argued that international harmonization is
virtually impossible, but some form of coordination has the potential to expand
market access for developing countries (Maskus and Wilson 2000).
The SPS Agreement
The SPS Agreement establishes international rules on how to apply sanitary and
phytosanitary measures. It acknowledges a country’s right to protect itself from
risks to human, animal, and plant life and health, and it confirms the need to con-
strain countries from using such measures as excuses to create unnecessary barri-
ers to trade. In short, the purpose of the agreement is to enable the legitimate pro-
tection of life and health while not giving rise to illegitimate protectionism.
Protectionism in this regard is defined as trade barriers beyond what is required to
meet a country’s desired protection levels. The approach taken to address these
two issues simultaneously is to require that SPS measures be based on sound sci-
ence. In this way, only measures truly aimed at protecting life and health are
allowed, and measures that are either not related to life and health issues at all or
that are excessively strict are ruled out.
The two basic principles of the agreement are nondiscrimination and scientific
justification. The principle of nondiscrimination is described in Article 2.3 of the
agreement: It states that a measure shall not discriminate against or between trading
partners more than necessary to reach the goal of sanitary and phytosanitary pro-
tection. This principle is equivalent to the GATT basic principle of most-favored-
nation privileges. The principle of scientific justification of SPS measures is spelled
out in Article 2.2: Any SPS measure must be backed by scientific justification.
Technical Barriers to Trade and the Role of Indian Standard-Setting Institutions 271

The special concerns of developing countries are addressed explicitly in the
agreement in several regards. The general functioning of the agreement is the
same for industrial and developing countries. The differences occur mainly in
the implementation of the agreement and in the obligations to provide technical
assistance to other members.
The regulation of SPS measures can be divided into four cases:
1. In areas where international standards already exist, the agreement encour-
ages international harmonization based on international standards. It must be
clear that this does not necessarily imply identical worldwide standards but
rather standards that have some basic relationship to the same reference
points.
2. In areas where no international standards exist, measures for individual mem-
ber countries are permitted if they are based on a risk assessment and are
nondiscriminatory.
3. If a country does not find that the protection level provided by an international
standard is high enough, it may implement stricter measures. Again, this right
is conditional on a formal risk assessment and the obligation that measures are
to be nondiscriminatory.
4. Finally, when not enough scientific evidence enables a proper risk assessment,
temporary measures are allowed. This right is also conditional. Temporary
measures must be reviewed after a certain time and the implementing country
must seek additional evidence.
Technical assistance for developing countries (Article 9 of the SPS Agreement)
encourages members to provide technical assistance to developing countries. It
refers to general technical assistance to help developing countries comply with
SPS measures in their export markets. It addresses the situation that exists when
developing countries have to undertake “substantial investments” to fulfill the
requirements of an importing member country. In such a situation the importer
is encouraged to provide the technical assistance that will enable the developing
country to maintain and expand its market access. But it does not contain any
commitments.
This lack of technical assistance and commitments has been criticized by devel-
oping countries who believe that the existing level of assistance falls short of the
immense needs, and that the types of assistance are often inappropriate (Henson
and Loader 2001). Several developing countries have called for a more organized
approach to the provision of technical assistance related to SPS requirements.
Furthermore, it is argued that providing such assistance should be bound to spe-
cific commitments by the industrial countries (WTO 1998a, b).
272 India and the WTO

An example of a specific proposal to address these issues is a proposal by the
countries of the Association of Southeast Asian Nations to create a trust fund
within the WTO that would channel technical assistance to developing countries.
The Fourth WTO Ministerial Conference, held in Doha in November 2001, also
addressed the issue of technical assistance. But the discussions led only to a
repeated call for financial and technical assistance, without offering specific com-
mitments (WTO 2001). It should be noted that some of the problems that devel-
oping countries face regarding SPS measures are related directly to their overall
level of economic development. According to Henson and Loader (2001, p. 98),
examples include “…the efficacy of prevailing systems of SPS controls, develop-
ment of scientific and technical expertise and access to modern testing meth-
ods.” Such problems will be difficult to solve by technical assistance measures
that are more appropriate for isolated problems within an overall sound stan-
dards infrastructure.
Another major problem with SPS measures as they apply to international trade
is that they are different in different countries and are often complicated and are
subject to frequent changes. Exporters therefore face great uncertainty about the
state of SPS legislation in their export markets. In the agreement, member coun-
tries are obliged to establish notification points as well as inquiry points. This
obligation is aimed at improving access to information both for foreign exporters
who wish to access the national markets and for the country’s own exporters in
need of information about foreign markets. Whereas notification and inquiry
points were created rapidly in industrial countries, the process has been slower in
developing countries, with many least-developing countries especially still not
having established such points (Brouder, Loader, and Henson 2000).
Moreover, the transparency provision in the SPS Agreement is the obligation
that a member country implementing SPS measures that differ from international
standards or in areas where no international standards exist must notify the new
measure to other WTO member countries. Increased transparency has given rise
to more intergovernmental discussion of SPS measures. An example of that is the
discussion in the SPS Committee that followed the notification of a proposal by
the European Union (EU) to introduce new limits on aflatoxin in foodstuffs
(Otsuki, Wilson, and Sewadeh 2001).2
One can conclude that, in principle, the SPS Agreement should help develop-
ing countries maintain and expand their market access for food and agricultural
products by preventing the implementation of SPS measures that cannot be justi-
fied scientifically and by improving transparency and encouraging harmoniza-
tion. However, it was the industrial countries that negotiated the agreement. The
developing countries signed on without active participation in the negotiation
process and without any deep understanding of the contents and implications of
Technical Barriers to Trade and the Role of Indian Standard-Setting Institutions 273

the agreement. Developing countries have come to realize that it is difficult and
sometimes impossible for many of them to make sure that the disciplines agreed
on are practiced.
There are two fundamental problems with the implementation of the SPS
Agreement. First, there is a wide gap between the financial, human, and technical
resources of a very large number of developing countries and the resources
demanded if participation in the agreement is to be effective. The implementation
costs of the agreement may be considerable. The issue of those costs leads to the
second fundamental problem of the agreement—the extent of harmonization of
international standards that is desirable from the perspective of a developing
country. In the agreement, standards that achieve a higher protection level than
international standards will be considered, but standards that achieve a lower pro-
tection level will be ruled out. This is contrary to developing countries’ interest
because the food safety problems they experience differ radically from the ones
addressed by international standards. This problem is a major source of high
implementation costs. The issue can and should be taken care of either by gener-
ous financial and technical assistance or by drafting exceptions for a limited num-
ber of poor countries.
Nontariff Barriers The SPS and TBT Agreements were added to the WTO so
that, at whatever levels are deemed appropriate, no country would be prevented
from taking measures necessary to ensure the quality of its imports; human, ani-
mal, and plant life and the health of the environment would be protected; and
deceptive practices would be prevented. But these agreements are subject to the
requirements that measures are not applied in a manner that constitutes arbitrary
or unjustifiable discrimination between countries where the same conditions pre-
vail or a disguised restriction on international trade, and that measures are other-
wise in accordance with the provisions of the agreements. Experience, however,
has been contrary to those requirements. Barriers in the name of technical regula-
tions exist along the boundaries of trading nations.
SPS and TBT technical specifications have been a major source of NTBs and
are likely to continue to be so in the future.3 This fact is not difficult to infer
because the SPS Agreement specifies that a country may introduce or maintain a
higher level of SPS protection than that achieved by an international standard if
there is scientific justification or when the country determines that a higher level
of protection would be appropriate. In fact, the latter is often chosen to explain
many overly stringent SPS measures in the EU and the United States.
The following are some examples of the measures perceived by Indian
exporters to be NTBs disguised under (arguable) logic on various grounds such as
quality, manufacturing process, certification, testing methods, and environmental
274 India and the WTO

protection. The following discussion is based on the field survey that I conducted
via personal interviews using an unstructured questionnaire.
Product-related Nontariff Barriers: Peanut Exports Peanut exporters believe that
foreign governments put NTBs on their imports of agricultural products in order to
sustain their domestic agriculture. Exporters also may have to make distress sales
when buyers refuse shipments based on domestic import standards. Indian exporters
therefore may have to depend on the domestic market or the South Asian Association
for Regional Cooperation for business sustenance. Their foreign customers have
informed them that new and stricter regulations will apply after December 31, 2000.
Some of the problems faced by exporters appear to be genuine. For example,
they find that different testing procedures and conformity assessment standards
are required in different markets. Each test costs Rs. 6,000. Nobody has told them
of the justification for most of the tests. In fact, the EU tests exports from the Arab
Republic of Egypt and India, but not exports from Argentina and the United States.
Another problem is that although there is no import duty on 50-kg bags, there
is a duty on 5-kg bags. This discrepancy is because the foreign governments want
to discourage retail consignments. Exporters also face problems regarding geneti-
cally modified peanuts. Although some years ago one foreign government encour-
aged the use of genetically modified organisms (GMOs), another now has asked
for an assurance that the peanuts supplied do not contain GMOs.
A more detailed study was done by the Joint Expert Committee on Food Addi-
tives (JECFA 1997) on the issue of aflatoxin in peanuts because this appeared to be
a major threat to peanut exports. The European Commission in Brussels has spec-
ified tolerance limits for aflatoxin contamination in peanuts and has established
testing methods. The proposed levels are 10 parts per billion (ppb) (5 ppb of B1 [a
kind of pathogen]) for raw material and 4 ppb (2 ppb of B1) for consumer-ready
products. The new proposed sampling plan is similar to the Dutch Code, that is,
the analysis is to be done based on a three-test Dutch Code methodology from a
randomly drawn 30-kg sample. The new testing procedure, which is much more
rigorous than is currently in force, requires that the lot be rejected if any of the
three tests are found to exceed the limit.
This step procedure is unwarranted from a scientific standpoint, according to
various agencies and governments. Laboratory tests on small animals such as rats
that were given feed highly contaminated with B1 on a daily basis have found that
aflatoxin can cause liver cancer, but there is no clear evidence to prove that afla-
toxins are carcinogenic in humans. This fact should be viewed against the possi-
bility that aflatoxin contamination of some peanuts in a shipment does not signal
aflatoxin contamination of the entire shipment. Statistically one would expect to
find one contaminated nut in a sample of, say, 5,000–10,000 uncontaminated nuts.
Technical Barriers to Trade and the Role of Indian Standard-Setting Institutions 275

Experts have concluded that 75 percent of the lots rejected under the proposed
procedure would be below the established tolerance, that is, 75 percent of the
rejected lots would be uncontaminated material.
Furthermore, in many supplying countries where peanut consumption is
very high (such as Argentina, China, India, South Africa, the United States, and
Vietnam), there have been no findings that aflatoxin in peanuts led to increases in
liver cancer.
According to a report by the Joint Expert Committee on Food Additives
(JECFA 1997) of the World Health Organization (WHO) and the Food and Agri-
culture Organization of the United Nations (FAO), aflatoxin contamination of
foodstuffs is very low among EU nations and only a few members of the popula-
tion suffer from hepatitis B. Considering the estimated risk at 20 ppb, there will be
0.0041 cases of cancer per 100,000 population annually. Considering the risk at
10 ppb, there will be 0.0039 cases per 100,000 population annually. Those statistics
show that the downward adjustment of the standard from 20 ppb to 10 ppb would
reduce the estimated cancer risk only by approximately two cancer cases annually
per 1 billion people. It seems improbable that there would be any measurable risk
differential between the hypothetical standards (20 ppb and 10 ppb) in popula-
tions with a low incidence of hepatitis B, as in the EU countries. This low risk can
be compared with the possibility that denying export markets to farmers in a
developing country like India could result in starvation deaths in multiples of the
estimated harm to life in Europe.
The JECFA previously recommended that maximum permissible aflatoxin lev-
els be fixed as low as possible. Now, however, on the basis of further data, the com-
mittee has modified its recommendation to reducing the intake as far “as is rea-
sonably possible.” Furthermore, it should be noted that the JECFA’s risk estimates
are based on data that made no allowance for the substantial reduction in afla-
toxin contamination achieved by mechanical removal of the nut skins and by the
use of optical and electronic methods for sorting the nuts. The risk computations
thus are based on aflatoxin levels that are no longer applicable. The new data
should be taken into account when the future EU tolerance limits are specified.
For example, the Codex Alimentarius Commission had proposed a maximum
limit of 15 ppb.
The European Snack Association’s Nut Working Group has already expressed
concern about the testing program and analytical methodologies through the
CIAA (the European Food and Beverage Association). The American Peanut
Council has submitted documents showing significant increase in costs and rejec-
tions arising from the use of a multisample system. In the United Kingdom, where
approximately 25 percent of the peanuts imported into Europe are consumed, the
Ministry of Agriculture has stated that the proposals were more stringent than were
276 India and the WTO

required by current U.K. regulations and could result in unacceptable costs to both
industry and enforcement, without any prospect of improved consumer safety.
Despite these protests, the revised draft of the sampling plan still recommends a
multiple sampling system. It is evident that such a change will have very serious
implications for the peanut industry. It is also important to note that the EU pro-
posal may contravene the GATT/WTO agreement by erecting artificial barriers
and seriously discriminating against a number of producing countries, particu-
larly developing countries such as India.
Barriers Related to Production and Process MethodsMango Pulp Many codes of regulation as well as European SPS measures link
the quality of a product with its production processes.4 In India, where most pri-
mary production takes place in unorganized, small-scale units, such primary-
level quality assurance is difficult to attain. Thus the EU demand that each
mango farmer keep records of the use of its mangoes in processing mango pulp
is cumbersome. The EU justification for this measure is that the farmer whose
mangoes were bad can be traced in case a consignment of mango pulp is found
to be harmful. However, as long as a pulp processor observes strict quality checks
at the point where mango pulps from various orchards enter the processing unit,
records of farmers may not be necessary. In such a situation, a pulp processor
and exporter can ensure strict compliance with quality norms at the factory’s
entry point.
Milk Products The EU standard for milk and milk products requires that checks
originate from the level of primary production, and it lays down the conditions of
maintaining animals, types of feed to be given, and the monitoring of these regu-
lations. Under Indian conditions, a dairy farm may have just one or two draught
animals, and milk from a number of such holdings is commonly pooled before it
is processed. It is impossible to monitor every animal. Therefore, the quality is
determined at the processing unit’s entry point and the milk is appropriately
treated to ensure the destruction of any pathogens. The final product is thereby
safe. It is necessary to stress the quality of the final product, which may be attained
through a flexible systems approach. It is neither feasible nor desirable to stan-
dardize a specific systems approach.
Likewise, the EU has directed that raw milk must originate from cows or buffa-
los, which in the case of cows yields at least 2 liters of milk a day. In the Indian sit-
uation this is simply impractical. Similarly, the animal-health requirements stipu-
lated by the EU are far in excess of the requirements of the International Animal
Health Code of the International Office of Epizootics (IOE).5 The International
Animal Health Code does not include any conditions specifically related to milk and
Technical Barriers to Trade and the Role of Indian Standard-Setting Institutions 277
milk products for diseases like rinderpest, pestedes petits ruminants, bluetongue,
sheep pox, and goat pox. But EU animal-health-attestation conditions specify that
the animals must belong to holdings that were not under restrictions due to foot-
and-mouth disease (FMD). Therefore, whereas IOE requirements for FMD are
specific in nature, the EU directives are general and have included the conditions
for livestock diseases like rinderpest.
In 1997 the EU circulated a directive stating that, when dry milk was exported,
the package should clearly mention that buffalo milk was used and that, ideally,
there should be an illustration of a buffalo on the package. This is likely to create a
psychological barrier in the mind of a consumer who is used to drinking cow’s
milk, although in terms of health both cow and buffalo milk are perfect substi-
tutes for making milk powder. On opposition from countries like India, the EU
directive was withdrawn.
Barriers Related to Testing Procedures: Egg Products The acceptance of a
sanitary standard is based on the acceptance of certain test results. Some test
results, however, can be disputed. For example, in 1997 Company O, a Bangalore-
based egg products–exporting company, sent egg powder to Japan. Japan reported
BHC (beta isomer) levels in the Indian product far in excess of permitted levels of
0.01 parts per million (ppm). To investigate this report composite samples were
analyzed in laboratories in Bangalore and Belgium. Both analyses reported that
the BHC level was below the detectable limit of 0.01 ppm. The inference to be
drawn from this case is that if laboratory results can vary, then products that have
been tested as fit for export in Indian laboratories can be declared unfit for accep-
tance at international borders. When both parties stick to their test results, how
can credibility be brought about in laboratory tests?
Barriers Related to Certifications: Tires Brazil requires that tires being
exported to Brazil have “En-Metro” (EM) marking on them. EM is the national
standard for tires in Brazil, rather like the “Agmark” for foods in India. For the
Indian tire exporter, however, obtaining EM certification is expensive. To receive
the EM certificate, an Indian exporter must defray the lodging and miscella-
neous expenses of a Brazilian team of experts who travel to India and visit the
prospective exporter’s tire plant. The Automotive and Tyre Manufacturers Asso-
ciation of India quotes the sum total of these expenses at an average of
US$20,000 ($1,100 of which is the direct cost for the certificate). Certification
lasts only one year, so the exporter must invite and pay for the Brazilian team of
experts every 12 months! Except for a few major Indian tire manufacturers (e.g.,
Apollo, JK, and Modi Rubber), many smaller potential tire exporters from India
cannot export tires to Brazil because certification is prohibitively expensive.
278 India and the WTO

Assuming that Brazilian tire manufacturers also must be certified, it is apparent
that the cost they would incur would total little more than the $1,100 for the
certificate itself. It is interesting to note that although the EM team has been
traveling from Brazil to do inspections in India every year, formal EM certifi-
cates have not been issued at all for the last two years, and exports of Indian tires
to Brazil have continued.
Mexico offers another example of a certification barrier. Imported tires there
must carry “Norm” certification, which is awarded to each tire imported rather
than to the tire company. To get this certificate, $40,000–$50,000 has to be paid to
different certifying agencies of Mexico.
Environmental Barriers: Steel Australia and New Zealand have imposed extremely
stringent environmental laws and raised objections to the usage of wooden dun-
nage by an Indian steel company. As a consequence the company has used treated
wood and wood substitutes, which are more expensive and in short supply. Fur-
thermore, fumigation of containers is required, and the cost for that is $400 per
container.
Packaging, Marking, and Language Barriers Barriers related to packaging,
marking, and language include printing of minimum import prices in countries
like Brazil and Syria, and the requirement that texturized yarn be supplied in
equal-length packages in some European markets. It also has been reported that
Germany poses significant problems for Indian exporters of engineering products
because German technical regulations are rarely made available in English. Indian
exporters employ translators at their own expense, but the Germans argue that the
translations do not accurately present the German specifications. Indian exporters,
therefore, are always apprehensive of falling short of German norms. This appre-
hension obviously damages export potential.
Domestic Institutional Framework
The domestic institutional framework is the most important aspect of imple-
menting the SPS and TBT Agreements. A weak institutional framework adds to
the woes of exporters who are already facing NTBs from other countries. In India
trade is regulated by a plethora of policy announcements and multiple regulatory
authorities. This section of the chapter, which describes the significant domestic
policies and institutions, is based on interviews and government reports.6
Export/Import Policy of India
The Export and Import Policy (EXIM Policy) of India is drawn up for a period of
five years, with some changes being effected in an annual review in April and
Technical Barriers to Trade and the Role of Indian Standard-Setting Institutions 279
other changes taking place when necessary. The current EXIM Policy is applica-
ble for the years 2003–2008. There is a negative list for exports and for imports
comprising prohibited, restricted (licensed), and canalized items.7 India’s domes-
tic environmental concerns (related to health and conservation) and multilater-
ally agreed environmental measures (e.g., CITES and Montreal Protocol) are
implemented through these lists. There are many export-promotion measures
built into the EXIM Policy, including the grant of special import licenses for
firms having ISO certification. There is a separate chapter on quality, where ISO-
compliant firms are rewarded and quality complaints are addressed.
Export promotion councils and certain (commodity) boards and (export
development) authorities are given special status in the EXIM Policy. They grant
membership to exporters so that some exporters become eligible to receive certain
licenses and benefits, such as duty-free advance licenses for inputs for export pro-
duction. Other relevant incentives include duty concession on import of capital
goods used for export production, duty-free imports for 100 percent export-
oriented units and units in export-processing zones, some fast-track mechanisms
for import clearances, and additional benefits for export and trading houses
showing export performance beyond a certain threshold.
Rules and Regulations on Product Standards
The Ministry of Food and Consumer Affairs is the main government agency
dealing with product standards, although each ministry or department also has
its own system of framing and publishing product standards. State governments
also have systems for adopting standards, notably in the area of weights and
measures. For the products under consideration in this chapter, the main rules
and regulations are contained in the Prevention of Food Adulteration Act, the
Export Inspection and Quality Control Act, and regulations for spice quality. A
notable point in product standardization in India is that, although the enforce-
ment agencies have means of enforcing these rules in domestic units, there is lit-
tle possibility of enforcing them on imported goods. One reason for this could be
that the Indian consumer market was comparatively closed until recently, and
few imported goods entered. With the passage of time, it would be advisable for
the concerned agencies to devise systems to enforce the rules on imported goods.
Today the producers of imported goods seem to receive even better than national
treatment because they are seldom subjected to the same enforcement proce-
dures as are the domestic producers of similar goods. A review of the packaging
rules has been initiated by the Ministry of Food and Consumer Affairs in 1999
order to apply the same rules to imported goods as are applied to domestic
goods.
280 India and the WTO
Export Promotion Institutions
The Indian government has been emphasizing export promotion since the late
1960s. One result of this emphasis has been the proliferation of export promotion
councils and authorities. These agencies have been playing a dual role for product
promotion—first as nodal agencies for disbursement of export subsidies (a func-
tion that has declined considerably since liberalization and the removal of subsi-
dies like the cash compensatory scheme), and second as the nodal points for inter-
action between the industry and the government. Some of these agencies, notably,
the Marine Product Export Development Authority and Agriculture Produce
Export Development Authority, have been actively involved in implementing
policies related to product standards.
Standard-setting Bodies
Indian goods have repeatedly faced restrictions on entry into foreign countries
because of alleged noncompliance with certain standards, norms, or regulations
established by the importing country. Apparently products made under Indian
standards were not fit to be accepted abroad, so either Indian standards and hence
the products made under them were not good enough, or the Indian standards
were reasonable, but the product was being harassed at international borders on
the pretext of unduly stringent foreign standards.
There are approximately 24 standard-setting bodies (SSBs) and a host of regu-
lating agencies at the central government level as well as at state levels. Some of the
most important domestic standard-setting and implementation authorities are
the Bureau of Indian Standards (BIS); the Food and Agriculture Department
(FAD); the National Accreditation Board for Testing and Calibration Laboratories
(NABL); the Central Committee for Food Standards (CCFS); the Ministry of
Food Processing Industry; the Standardization, Testing and Quality Certificate
(STQC); and the National Quality Council (NQC).
In the following discussion I will identify the procedures of standard setting,
their implementation, and problems that occur with them. I also will note the
coordination among various standard-setting bodies and how well equipped
these organizations are to meet the challenges posed by the WTO.
Bureau of Indian Standards Of some 24 standard-setting bodies in India, the
Bureau of Indian Standards (BIS) is the premier organization. It sets voluntary
standards, which may be made mandatory by government action. The bureau’s
organizational hierarchy is depicted in figure 11.1.
The procedure for setting up a standard in the BIS is the same as anywhere in
the world. The request for a standard comes from a consumer or organization.
Technical Barriers to Trade and the Role of Indian Standard-Setting Institutions 281

A divisional council of the BIS considers the request. The BIS then puts together a
committee with a convenor and members from interested groups, and that com-
mittee drafts a standard. When approved, the standard is circulated for comments
before its adoption. All BIS standards are voluntary unless they are adopted by the
central government and made mandatory by the concerned ministry.
The BIS has been identified as the “enquiry point” for all TBT-related issues
under Article 10.1 of the TBT Agreement, which states,
Each member shall ensure that an enquiry point exists which is able to answer all
reasonable enquiries from other members and interested parties in other member
countries as well as to provide the relevant documents.
In the simplest terms, notification means that whenever an Indian SSB sets a
technical regulation that differs from the existing international regulation on the
same item, the rest of the world must be informed about it. This is helpful for any
country wishing to export that item to India. Such notification informs the
exporting country of the minimum technical requirements that it must meet
specifically for the Indian market. Notification can be made to the WTO via the
BIS or through the Ministry of Commerce, and it must be made in a format pre-
scribed by the WTO and readily available from BIS or the WTO. According to
Article 10.6 of the TBT Agreement,
282 India and the WTO
Director General (DG) - BIS
Additional DG technical(formulation)
Additional DG marks(implementation)
25 standard formulationcommittees
5 regional offices headed by Dy. DG(Technical Support Department)
2 or 3 branch offices under everydeputy DG (headed by directors)or inspection offices
FIGURE 11.1 BIS Organizational Hierarchy
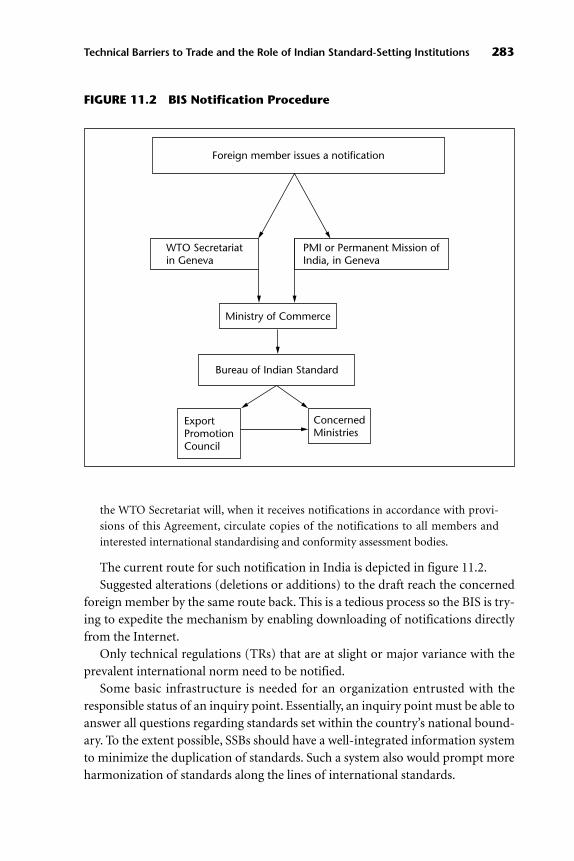
the WTO Secretariat will, when it receives notifications in accordance with provi-
sions of this Agreement, circulate copies of the notifications to all members and
interested international standardising and conformity assessment bodies.
The current route for such notification in India is depicted in figure 11.2.
Suggested alterations (deletions or additions) to the draft reach the concerned
foreign member by the same route back. This is a tedious process so the BIS is try-
ing to expedite the mechanism by enabling downloading of notifications directly
from the Internet.
Only technical regulations (TRs) that are at slight or major variance with the
prevalent international norm need to be notified.
Some basic infrastructure is needed for an organization entrusted with the
responsible status of an inquiry point. Essentially, an inquiry point must be able to
answer all questions regarding standards set within the country’s national bound-
ary. To the extent possible, SSBs should have a well-integrated information system
to minimize the duplication of standards. Such a system also would prompt more
harmonization of standards along the lines of international standards.
Technical Barriers to Trade and the Role of Indian Standard-Setting Institutions 283
Foreign member issues a notification
Ministry of Commerce
Bureau of Indian Standard
ExportPromotionCouncil
ConcernedMinistries
WTO Secretariatin Geneva
PMI or Permanent Mission ofIndia, in Geneva
FIGURE 11.2 BIS Notification Procedure
To this point, however, nothing much has been done about creating such an
integrated process. The stark absence of a national notification system in India is
noteworthy. The BIS reported an effort that it was making in conjunction with the
Ministry of Commerce to create an awareness program for evolving a national
notification system, but the response of other SSBs has been lukewarm.
Relative apathy has been observed toward Article 2.9.2 of the TBT Agreement.
That article states the following:
Whenever a relevant international standard does not exist or the technical content of
the proposed technical regulation is not in accordance with the technical content of
the relevant international standard, and if the technical regulation may have a signif-
icant effect on trade of other members, members shall notify other members
through the WTO secretariat of the products to be covered by the proposed techni-
cal regulation, together with a brief indication of its objective and rationales. Such
notification shall take place at an appropriate stage, when amendments can still be
introduced and comments taken into account.
In India the body setting the new technical regulation can make such a notifi-
cation either directly or through the BIS. On behalf of the WTO, the ISO/IEC
(International Electrochemical Commission) produces weekly a roster of SSBs
that have adopted a notification system.
All SSBs are obligated to adopt the Code of Good Practice (CGP) for prepar-
ing, adopting, and applying standards, as set out in Annex 3 of the TBT Agree-
ment. Article C of Annex 3 states,
Standardising bodies that have accepted or withdrawn this Code shall notify this fact
to the ISO/IEC Information Centre in Geneva. The notification shall include the
name and address of the body concerned and the scope of its current and expected
standardization activities. The notification may be sent either directly to the ISO/IEC
Information Centre, or through the national member body of ISO/IEC or preferably
through the relevant national member or international affiliate of ISONET, as
appropriate.
The CGP calls for transparency in preparing standards. To that purpose, Section J
of Annex 3 states,
At least once every six months, the standardising body shall publish a work pro-
gramme containing its name and address, the standards it is currently preparing and
the standards it has adopted in the preceding period. A standard is under prepara-
tion from the moment a decision is taken to develop a standard until that standard
has been adopted. The titles of specific draft standards shall, upon request, be pro-
vided in English, French or Spanish. A notice of the existence of the Work Pro-
gramme shall be published in a national or, as the case may be, regional publication
of standardisation activities.
284 India and the WTO

Apparently there is a twin obligation on the SSB. First it must notify the WTO
that it has accepted the CGP, and then it must notify the WTO that it has prepared
a work programme. According to Section J of Annex 3,
the work programme shall for each standard indicate, in accordance with any
ISONET rules, the classification relevant to the subject matter, the stage attained in
the standard’s development, and the references of any international standards taken
as a basis. No later than at the time of publication of its work programme, the stan-
dardising body shall notify the existence thereof to the ISO/IEC Information Centre
in Geneva. The notification shall contain the name and address of the standardising
body, the name and issue of the publication in which the work programme is pub-
lished, the period to which the work programme applies, its price (if any), and how
and where it can be obtained. The notification may be sent directly to the ISO/IEC
Information Centre or preferably through the relevant national member or interna-
tional affiliate of ISONET, as appropriate.
In India, only the BIS has duly accepted the Code of Good Practice and notified
the WTO of that acceptance and of its work program. Surely it is not that the
other SSBs have not notified the WTO because they maintain no record of stan-
dards they set. These SSBs must maintain an index, a catalogue, or some written
documents to record their activities. Those records might not be called a work
program, but their contents would contain more or less the requisites of the work
program. So what has stopped them from giving notice? Apparently it is apathy
and lack of consciousness about their responsibilities toward the WTO.
Whereas notification signifies disparity between a national and an international
standard, equivalence between a national and an international standard is denoted
by the term “harmonization.” According to Article 2.4 of the TBT Agreement,
where technical regulations are required and relevant international standards exist
or their completion is imminent, members shall use them or the relevant parts of
them, as a basis for their technical regulations except when such international stan-
dards or relevant parts would be an ineffective or inappropriate means for the fulfil-
ment of the legitimate objectives pursued, for instance because of fundamental cli-
matic or geographical factors or fundamental technological problem.
Obviously such a clause has been added to bring down trade barriers regarding
standards. Harmonized standards (technical regulations actually) enable all con-
cerned trading partners to decipher the rules or technical regulations in the same
way. Harmonization involves a careful analysis of the Indian standards vis-à-vis
the international ones. Thereafter, the Indian standard is harmonized, to the
extent feasible. Of course, not all items have international standards, and even
when an international standard exists local conditions may propel the Indian SSB
to set a national standard that differs from the international one. In such a case,
Technical Barriers to Trade and the Role of Indian Standard-Setting Institutions 285
however, the onus lies on the SSB to justify the difference. Hence, harmonization
can be done only on limited standards. Thus far, the BIS has harmonized more
than 4,000 standards, in accordance with EU/ISO norms, and harmonization for
many other standards is under way there.
Food and Agriculture Department The Food and Agriculture Department
(FAD) was established in 1956 in the BIS. The FAD deals with standardization in
the field of food and agriculture, including processed food, agricultural inputs,
agricultural machinery, and livestock husbandry.
There is a committee for each product group. The committee consists of 30–40
members or participants who represent industries, consumer groups, research
groups, exporters, and government ministries. The BIS sends only one member per
meeting to serve as the technical secretary. All of the representatives have some
expertise on the subject under the purview of the committee. The FAD maintains a
database of resourceful people who could be invited to be members of each com-
mittee. Each committee must meet once a year and with a six-month interval
between meetings. At each meeting, matters may relate to review of an existing stan-
dard, finalization of a standard on which work began after discussions at the last
meeting, or a new standard to be set up because no standard on the subject exists.
Any member of the committee may put forward a proposal to establish a stan-
dard for a particular good that has not been done before because no need had been
perceived. Such cases are now becoming particularly significant because, post-
WTO, SPS-related issues have grown in importance, and many countries have
begun to use SPS measures not only to protect the health and sanitation levels of
their domestic consumers but also to erect NTBs. Committee members have real-
ized that much work needs to be done to limit possible contaminants in food.
There are standards and regulations for some of these under the BIS and the Pre-
vention of Food Adulteration Act (PFA), but even the existing standards have to be
reviewed in light of newer and stricter specifications being issued for exports by
Codex Alimentarius and the EU. The BIS has set approximately 17,000 standards
so far, and the FAD has set 1,720 standards. The FAD also harmonizes standards
with Codex or EN. It must be remembered that these standards are voluntary.
Many standards have not been harmonized because local Indian conditions for
producing these commodities require that differences be accommodated. Quite
often, industry representatives on technical committees are reluctant to change a
standard because the revision would entail a change in production procedures or
equipment and thereby increase production costs. Such attitudinal rigidity has
been observed but to date it has posed no major problem.
The FAD is currently certifying for ISO 9000 and ISO 15000 (the former
deals with general quality control and the latter is the standards terminology for
286 India and the WTO
Hazard Analysis Critical Control Point [HACCP]). At present, eight companies
have taken up HACCP certification from the FAD. These include Mother-Dairy
and Pepsi Foods Ltd. (Another agency that issues HACCP certificates in India is
SGS India Ltd.) Members of the FAD are called in for consultations with the
health ministry when a new technical regulation on food products is to be
designed.
National Accreditation Board for Testing NABL is India’s premier laboratory
accreditation center.8 It performs testing and calibration of laboratories. The test-
ing is repetitive in nature, that is, the tests may be done again, either under a sur-
veillance program or otherwise. NABL exists under and is funded by the Ministry
of Science and Technology. Following a period of five years, however, NABL is
supposed to begin garnering its own resources, chiefly through revenues gener-
ated in the form of charges from laboratories seeking accreditation. An accredita-
tion certificate expires after three years.
NABL accredits laboratories, not products. It does not certify research and
development laboratories because tests in those facilities are not repeatable. (Stan-
dards for products are certified by the BIS.) Accreditation is provided by a team of
experts who are either on the permanent payroll of NABL or are hired for their
expert consultancy.
The TBT and SPS Agreements encourage use of international standards where
such standards exist instead of reliance on national standards that are specific to
only one market. Customers increasingly are using international standards when
specifying technical requirements.
The International Laboratory Accreditation Cooperation (ILAC), which is an
informal international forum of laboratory accrediting bodies, has played a major
role in establishing international standards for laboratory testing. In 1993 the
ISO/IEC published ISO/IEC Guide 5B, developed by ILAC, as the standard system
for the accreditation of testing, calibration, and measurement laboratories. To
avoid expensive and unnecessary retesting of goods, ILAC promotes the concept
of bilateral and multilateral recognition arrangements among laboratory accredi-
tation bodies in various countries. Multilateral agreements are based on interna-
tional peer evaluation by an international assessment team of accreditation
experts in quality assurance and experts in different technical fields.
Thus NABL’s current role in facilitating international trade is rather nonfunc-
tional. What good is lab accreditation if all goods have to be tested at both
places—at port of exit and at port of entry? NABL must get its accreditation sys-
tem recognized by more countries so that Indian goods carrying test reports
issued by NABL-accredited labs are accepted readily without additional tests in
foreign countries. Such recognition would greatly reduce the interim time
Technical Barriers to Trade and the Role of Indian Standard-Setting Institutions 287

between shipping and final consumption of Indian goods, thereby reducing the
chances of decay and increasing the credibility of the Indian goods.
Central Committee for Food Standards The CCFS, set up at the federal level,
has nine subcommittees dealing with different subjects, such as cereals, oils and
fats, milk and milk products, and so forth. The subcommittees first generate data
to support a new proposal or a revision to existing standards in cooperation with
laboratories, industry, and consumers. Then the proposal is sent to the CCFS,
which is chaired by the director general of health services and comprises five con-
sumer members, two government experts, three representatives from industry,
and representatives from all states, the BIS, and related ministries. If the new or
revised standard is agreed on at the CCFS level, a notice period of 60–90 days is
open for public reaction before the standard is notified. Standards generated by
this committee are mandatory, unlike those of the BIS.
The issue of harmonization is of special concern to developing countries inter-
ested in expanding their export markets, and it was discussed at the June 1998
meeting of the WTO. The standards imposed by the Codex Alimentarius Com-
mission are used as guidelines by Indian SSBs, but for various reasons, partici-
pants from industrial countries have largely dominated the Codex. The Indian
voice is often drowned out by the majority, which comprises representatives from
industrial countries. Consequently, many Codex standards are not relevant to or
feasible for India. For example, because of the differing dietary habits of industrial
countries, India has chosen to adopt Codex limits for fruits and vegetables, but
only half of those limits for food grains.
Codex standards, however, are relevant for India’s exports and noncompliance
may create disputes, as the following examples suggest:
• In 1955 India strongly objected to the requirement of labeling milk and milk
products with the picture of a buffalo. India questioned the justification of
such a measure.
• Codex reduced the permissible level of sulphur dioxide in sugar from 70 ppb to
20 ppb. As the world’s largest exporter of sugar, India took strong exception to
this measure. A paper was presented that illustrated the technological infeasi-
bility of this requirement and the fact that the original level posed no signifi-
cant health hazards.
• Codex fixed the permissible level of aflatoxin in milk and milk products at 0.05
ppb. The Indian level is 30 ppb. The Codex limit is based on the assumption
that monthly per capita consumption of these products is 1,500 gm, whereas a
realistic assumption for India would be 300–400 gm. The European Commu-
nity won this case.
288 India and the WTO
In some cases Indian standards are more stringent than international ones. The
relevant factors in this respect are nutritional status, dietary practices, and techno-
logical feasibility. For instance, India does not allow the use of artificial sweeteners
in chocolates or the use of artificial colors and flavors in edible oils. The permissi-
ble limits are calculated on the basis of Acceptable Daily Intake (ADI) per kilogram
of body weight. Technological constraints and dietary status are as significant as
safety considerations in determining food standards.
As far as exports are concerned, the Export Inspection and Quality Control Act
is applicable. Information about this is available from the Ministry of Commerce
and the Export Inspection Council of India. It is important to note that the viola-
tion of international standards by an individual exporter also affects the reputa-
tion of the exporting country. Hence, organizations such as the Agricultural and
Processed Food Products Export Development Authority (APEDA) provide sub-
sidies and other assistance to Indian exporters to ensure that standards are met.
The Ministry of Health maintains four central food laboratories, one each at
Calcutta, Ghaziabad, Mysore, and Pune. The former two are under the ministry’s
direct administrative control, and the latter two are supported through annual
grants.
Ministry of Food Processing The Ministry for Food Processing Industry pro-
vides norms, technical regulations, and standards for fruit and vegetable process-
ing. It thus specifies the following:
• That machine and equipment parts that touch the food be made of stainless
steel
• That water for washing and cleaning should be potable
• That running water should be available at all times
• That there should be in-house laboratories
• That qualified food technologists must assess the quality of the food.
Standards for processed edibles are specified by section A16 of the 1954 PFA
Act. Most of those standards pertain to chemical contents, physical characteristics,
contaminant levels, and additive levels in food so as to ensure safety of consumers’
health.
The ministry has made no efforts so far to harmonize their standards or to get
in touch with the BIS to create a national notification system.
Department of Electronics Standardization, Testing and Quality CertificationSTQC is India’s premier testing and calibration agency for electronic items. Its 22
laboratories situated all over India are duly certified by the NABL and are well
Technical Barriers to Trade and the Role of Indian Standard-Setting Institutions 289

equipped for testing electronic items. It is noteworthy that STQC itself does not
set any standards. Rather, when a party comes to the STQC to acquire a certificate,
the STQC asks that party with what standard it would like to comply. When the
party has expressed its desired standard, the STQC tests and certifies the product
against that standard.
Within India consumers do not ask for very high quality in electronic products
and they are usually quite uninformed about existing standards, so not many pro-
ducers for the domestic market seek this agency’s certification. Exporters are its
chief clients because the STQC tests and certifies against International Elec-
trotechnical Commission norms (IEC). The STQC is considered a competent
authority and foreign parties duly accept its certification. Moreover, the STQC
enters into two types of international contracts—international certification
schemes and mutual recognition agreements—both of which demand reciprocity.
Therefore, if the STQC agrees to accept the certification of an equivalent body in
the exporting country, then STQC certification of India’s electronic exports would
be duly recognized in that country.
The STQC’s role in standard formulation is on an ad hoc basis directly and on
an ongoing basis indirectly. The normal procedure for setting an international
standard takes about six years and for setting a national standard two to three
years, so when a standard is required quickly, the STQC addresses the standard
much faster. It consults the manufacturers, consumers, and other SSBs about the
standard. For example, because no standard for color televisions existed in India,
the STQC quickly produced one that was later adopted by the Department of
Telecommunications and the BIS. Although it does not set standards, it helps to
construct standards that are later to be adopted by the agency involved. Likewise
for personal computers, the first standards in the country were set up by the STQC.
Although created by the BIS, almost all standards for electronic items are actually
decided by the STQC (whose members dominate the BIS electronic experts com-
mittee), because STQC has a memorandum of understanding with the BIS.
Prior to 1991, manufacturers in small-scale industries (SSI) dominated the BIS
committees because, by government policy, these products were reserved for SSI.
SSI diluted product quality because it was too costly a proposition for them to
aspire to superior quality, so the national standard remained less than superior.
Now, however, with increasing export awareness, the standards are being formed
according to IEC norms.
Because standards are not set by the STQC, there is little it can do in the har-
monization process. It does, however, reserve an opinion on the current harmo-
nization status of standards and technical regulations in the field of electronics.
According to the STQC, much harmonization cannot be done in India because of
the lack of facilities for testing and certifying harmonized standards. In fact, the
290 India and the WTO

basic infrastructure in the country does not permit much to be done. For exam-
ple, the EU levels allow for standards with respect to electricity fluctuations of ±10
percent, whereas fluctuations allowed by Indian standards are ±20 percent. Of
course, international standards often are far more stringent than those allowable
by any level. The EU and the United States have some standards that are quite
stringent based on the IEC norms. India clearly does not have enough laboratories
to certify these standards. Generally there is a feeling that U.S. standards are not
always justifiable, and there is international pressure on the United States to
amend its standards. Where feasible, the STQC is following the EU norms.
Because the EU asks for marking of “Compliance with EU,” the STQC provides
such marking on the EU’s behalf. Under the WTO, procedures for certification or
calibration have to be submitted by the STQC to the BIS. The STQC admits, how-
ever, that it has done nothing so far in that direction.
National Quality Council A national scheme for the formation of national
quality councils was prepared in 1992 to serve the following chief purposes:
• To mobilize resources to ensure that goods and services are designed to match
consumer needs, expectations, and desires in terms of their specifications,
delivery, and competitive price, and that goods and services produced consis-
tently conform to standards and are produced at the optimum cost at which
the consumer will buy.
• To raise quality consciousness in the country, both in industry (manufacturing
and service) and among consumers, by launching a nationwide quality cam-
paign and establishing a national standards information inquiry service.
• To encourage third-party certification of goods and services and third-party
certification of quality-management systems (ISO 9000 standards or equiva-
lent) at the enterprise level, with a view to minimizing the need for multiple
assessments by the consumers.
• To facilitate the upgrading of testing and calibration laboratories and encour-
age the development of a unified national laboratory accreditation system to
ensure that the test reports become acceptable in the world market.
• To raise the level of training for personnel engaged in quality control activities,
including assessors and trainers, and to encourage their third-party certification.
• To obtain mutual recognition with similar national schemes of India’s major
trading partners.
• To meet effectively the challenge of new and demanding European accredita-
tion standards and legislation. Its most advantageous aspect would be the fact
that all efforts would be made to bring about maximum possible national and
international recognition of the scheme. This would greatly help in increasing
the acceptance of Indian goods abroad.
Technical Barriers to Trade and the Role of Indian Standard-Setting Institutions 291

The structure of the NQC has been established, but its effects have not yet
started to percolate at levels where it is required. At this time, it is nonoperational.
International Institutional Framework
World Trade Organization
The General Agreement on Tariffs and Trade has been the beacon of the multi-
lateral trading system since 1948. As a result of the Uruguay Round of multi-
lateral trade negotiations, the World Trade Organization came into being on
January 1, 1995, subsuming GATT under it. Article XX of the GATT allows
member countries to deviate from their obligations under the agreement in the
case of three types of trade measures, among other things. Those measures are
ones necessary to protect human, animal, or plant life or health; ones relating
to the conservation of exhaustible natural resources if such measures are made
effective in conjunction with restrictions on domestic production or consump-
tion; and ones necessary to secure compliance with laws or regulations not oth-
erwise inconsistent with GATT rules. Such unilateral measures, however, have
to pass a composite trade test. The trade test has three components: no arbi-
trary discrimination, no unjustifiable discrimination, and no disguised trade
protection. It is often called the least-trade-restrictiveness test. Jurisprudence
has shown that the second type of trade measure has become the most potent
tool for making GATT-compliant unilateral trade measures pursuant to envi-
ronmental objectives.
International Organization for Standardization The ISO is the most impor-
tant of the international standard-setting organizations. It is a world federation
of 123 national standards bodies, an international nongovernmental organiza-
tion with a majority of its members coming from the public sector. Its core busi-
ness is the development, approval, and promulgation of consensus-based inter-
national standards. Unlike the WTO, however, majority voting is practiced in this
organization.
The ISO develops standards through 200 technical committees split into about
650 subcommittees and 2,000 working groups. It also develops guides for stan-
dard setting. In preparing these guides, the ISO works with specific users of stan-
dards, including those in the private sector. All of its standards and guides are vol-
untary in nature but, given the organization’s international credibility and wide
acceptance, its standards have considerable trade effects. Those who can afford it
apply for ISO certification. The certification is a costly process by Indian stan-
dards. It may take Rs.100,000–Rs. 500,000 to get certified, apart from the cost of
maintaining the certificate. The ISO 9000 series is the general quality certification
292 India and the WTO

standard, but there also is an environmental management standard—the ISO
14000 series. India has about 5,000 ISO 9000 companies; some 100 companies
have received ISO 14000 certification.
Codex Alimentarius Commission The Codex Alimentarius Commission, a U.N.
body, compiles agreed standards, guidelines, and other recommendations into the
Codex Alimentarius, the Codex Food Code (CFC). The CFC tries to create harmo-
nized standards. Prior to the SPS Agreement, the CFC could be adopted, applied, or
ignored at the discretion of a government. Within the agreement, however, CFC
has been adopted as the benchmark. Therefore, countries that do not impose stan-
dards higher than those of the CFC have the right to seek these standards for their
imports. The Codex Alimentarius has incorporated Hazard Analysis Critical Con-
trol Point (HACCP) plans and principles as an integral part of the CFC. Volume V
of the Food Code sets standards for a number of specific fish and fish products.
Marine export was banned by the EU in 1997 and HAACP was adopted officially as
the standard by government agencies for the first time in the marine sector.
Hazard Analysis Critical Control Point System The Hazard Analysis Critical
Control Point system is being used increasingly as a food safety system all over the
industrial world. When properly applied, it is a set of preliminary steps and prin-
ciples that yields a systematic method for identifying significant hazards and
properly applying preventive measures so that food-borne hazards are prevented,
eliminated, or reduced to an acceptable level. With emerging international and
national agreement on HACCP principles, their application would create a com-
monality of understanding of the development, implementation, and maintenance
of a food safety system. Having these commonly understood principles, many
food processors require their suppliers to have an HACCP system for producing
the ingredients that they supply. Application of the system offers widely under-
stood principles for identifying significant risks and means of controlling them.
Being able to identify the most likely sources of food-borne hazards by imple-
menting effective, documented systems will enable the industry to focus more
attention on those sources.
Conclusions and Recommendations
The study on which this chapter is based indicates that Indian exports face a num-
ber of NTBs in the forms of very high standards, testing procedures, environmen-
tal considerations, packaging requirements, and so on. It is also evident from the
survey that these prohibitive standards lack sufficient scientific proof of a protec-
tive effect on the health and environment of the importing country. But the impact
of these barriers on the value of trade for a broad range of Indian exportable
Technical Barriers to Trade and the Role of Indian Standard-Setting Institutions 293

commodities is potentially extensive, results in a variety of trade effects, and creates
additional costs for Indian industry and government. Therefore, India is increas-
ingly concerned that certain technical and sanitary/photosanitary measures may be
inconsistent with WTO provisions and may unfairly impede the flow of trade.
It is also evident from my research that the Indian government is not well posi-
tioned to address these issues. Trade associations and key government officials
have identified these barriers as an increasingly important issue in trade, but they
have difficulty defining the nature and scope of the problem, partly because of the
complex nature of the issue itself and partly for other reasons. For example, they
lack complete information on the number of measures that affect India’s exports,
they are unsure how many measures that have been identified may be inconsistent
with WTO provisions, and they do not have reliable estimates of the effects such
measures have had on exports.
Many government, trade, regulatory, and research entities have some responsi-
bility for addressing such measures, but there is no single entity directing and
coordinating overall government efforts. Some entities’ roles and responsibilities
regarding these measures are not clearly defined, and these entities have had diffi-
culty coordinating their activities. Government entities lack comprehensive data
on which to address these measures and they do not know what progress has been
made to address them.
No process has been developed to jointly evaluate measures and determine
which ones the government should address, and in what order. When the govern-
ment decides to challenge a measure, multiple entities with conflicting viewpoints
have made it difficult to develop a unified approach and to decide which cases
should be referred to the WTO for dispute resolution. Coordinated goals, objectives,
and performance measurements related to government efforts do not yet exist.
One important recommendation for all of the standard-setting and implemen-
tation bodies is to create an exclusive set-up for documenting data on WTO com-
pliance activities. These organizations have to be made aware of their responsibil-
ities in the WTO and they must learn how they can play a more active part in
setting standards at the international level.
My survey also revealed that the lack of coordination among standard-setting
bodies leads to duplication in standards and confusion in implementation. What
is needed is integration among standard-setting bodies, harmonization, and
national notification of standards.
The Bureau of Indian Standards as a nodal agency for standards coordination
and notification for the WTO is well aware of its obligations under the TBT and
SPS Agreements. But the BIS, structured today with multiple responsibilities and
lacking authority and coordination with other SSBs, may find it difficult to cope
with increasing demands of the WTO. Therefore a separate body—something like
294 India and the WTO
a national quality council in collaboration with the BIS—should be established so
that there is a body fully committed to standard-related matters in the WTO.
To upgrade quality in India, expertise is needed from countries that have tested
quality measures on their farms, but inviting such expertise is a costly proposi-
tion. Therefore I recommend that the WTO/FAO promote and perhaps sponsor
experts to assist developing countries improve their quality.
India is inadequately represented in international standard-setting meetings.
Repeatedly it has been reported that most of the Codex standards are set even
when there is very little participation by developing nations, including India. The
Codex committees are dominated by members from industrial countries so the
standards set by them are most often not viable for the developing countries.
Standards set by Codex are made with the food and agricultural practices of the
industrial economies in mind, but those practices are vastly different from the
practices prevalent in developing economies. India must be better represented in
standard-setting procedures.
As far as testing facilities are concerned, India’s existing laboratories are poorly
equipped with machines and skilled manpower, and that has led to the poor rep-
utation of test results in international markets. Exporters therefore resort to
multinational testing facilities, which are more expensive. Laboratory accredita-
tion is voluntary and carries no accountability, so the number of inappropriately
equipped and staffed laboratories has mushroomed, and many of the labs resort
to issuing fake certificates. India, therefore, should invoke technical and financial
assistance provisions in the WTO agreements to upgrade its testing facilities.
And most important of all, India must set her house in order as far as WTO
commitments are concerned.The seriousness of the WTO commitments is still
not recognized by various government and semi-government authorities respon-
sible for implementing these commitments. The lack of coordination, communi-
cation, and interaction among government agencies is leading to delays and
duplication of efforts, and that leads to suffering of businesses unable to exploit
the benefits of globalization. The government agencies responsible for standard
setting and implementation should realize that it is too late to ask, “Why?” and
time to inquire “How?”
Endnotes
1. The TBT and SPS Agreements are described in more detail below.
2. The notification led to a wide range of responses from WTO delegations, including from
some African and other developing countries. The EU subsequently decided to amend its proposed
legislation, thereby meeting some but not all of the criticism that emerged. Developing countries
have nevertheless brought forward complaints about the functioning of the transparency mechanism.
They have complained that the notification procedure does not work properly. Although industrial
Technical Barriers to Trade and the Role of Indian Standard-Setting Institutions 295

countries generally notify changes in legislation, they rarely take into account developing coun-
tries’ comments and the desire of developing countries for a formal mechanism for dealing with
comments.
3. Technical specifications can be divided into three types of standards relevant to primary and
processed goods. Packaging standards regulate a broad range of container attributes, from dimensions
to biodegradability of packaging material, to realize a wide range of regulatory goals. Process standards
(sometimes referred to as production standards) dictate the means (inputs, production technology, or
both) by which firms are to realize different regulatory targets. Product standards specify the ends
(characteristics of a product related to its size, weight, or any number of other attributes). A product
standard for imported tea, for example, might state that the product must be free of any trace of
residue, a status that could be objectively verified by phytosanitary authorities in the importing coun-
try by means of tests on shipments at the border.
4. A process standard alternatively might stipulate, for example, that a product must be processed
by a specific method. Economists usually argue that product standards are more efficient regulatory
tools than are process standards because the former allow heterogeneous firms to choose the technol-
ogy that minimizes the resource costs of achieving a specific regulatory target but the latter do not. It
has also been pointed out in the context of food safety regulations, however, that process standards can
sometimes be the optimal regulatory option. A Hazard Analysis Critical Control Point system, which
includes flexible process standards designed to reduce microbial contamination in food, might be
superior to specific product standards, given the expense of microbiological tests and the recurrent
nature of the pathogen hazard. The costs of enforcement and the degree of administrative discretion in
enforcement are also important considerations in any evaluation of the relative efficiency of process or
product standards.
5. According to Article 2.1.1.20 of the International Animal Health Code of the OIE, for import of
milk and milk products from the countries considered infected with foot-and-mouth disease (FMD)
or rinderpest, the veterinary authorities of exporting countries are required to produce an interna-
tional sanitary certificate attesting that the exported products originate from herds or flocks that were
not subject to any restrictions resulting from FMD at the time of milk collection and that products
have been processed to ensure the destruction of the FMD virus according to the procedures laid down
in the article.
6. Because of space limitations, many details of India’s standards policies and institutions are not
included in what follows. Further details are available from the author on request.
7. Canalized items are those items that can be traded only by a government agency like the State
Trading Corporation.
8. Laboratory accreditation is the formal recognition, authorization, and registration of a labora-
tory that has demonstrated its capability, competence, and credibility to carry out the tasks it is claiming
to be able to do. The body granting the formal recognition records the accredited laboratory in a regis-
ter, which is published periodically. The accredited laboratory is authorized to issue certificates, test
reports, and reports of chemical analysis, which are recognized and accepted under the logo of the inter-
national laboratory accreditation body. Accreditation provides an independent third-party assessment
of a laboratory’s technical competence and consistency in the interpretation of international standards.
References and Bibliography
The word “processed” describes informally produced works that may not be available commonly
through libraries.
Anderson, Kym, B. Hoekman, and A. Strutt. 1999. “Agriculture and the WTO: Next Steps.”
Washington, D.C.: World Bank. Processed. <www.worldbank.org/trade>
Bhagwati, Jagdish. 1997. “The Demands to Reduce Domestic Diversity among Trading Nations.”
In Jadish Bhagwati and Robert E. Hudec, eds., Trade and Harmonization: Prerequisites for Free Trade?
Vol. 2. Cambridge, Mass.: MIT Press.
296 India and the WTO
Bhattacharyya, B. 1999. Non-Tariff Measures on India’s Exports: An Assessment. Occasional Paper
16. New Delhi: Indian Institute of Foreign Trade.
Bredhal, Maury E., and Kenneth W. Forsythe. 1989. “Harmonizing Phytosanitary and Sanitary
Regulations.” World Economy 12(2): 189–206.
Brouder, Anne-Marie, Rupert Loader, and Spencer Henson. 2000. “Constraints to Small-Scale Food
Processing in Sub-Saharan Africa.” Conference presentation, April 14–17, University of Manchester,
U.K.
Caswell, Julie A., and N. H Hooker. 1996. “HACCP as an International Trade Standard.” American
Journal of Agricultural Economics 78(3): 775–79.
CDR (Centre for Development Research). 1999. Reviewing the SPS Agreement: A Developing
Country Perspective. Working Paper 2.3. Copenhagen.
Das, Bhagirath Lal. 1998. An Introduction to the WTO Agreement: Trade and Development Issues and
the World Trade Organization. London: Zed Books and Third World Network.
———. 1999. The World Trade Organization: A Guide to the Framework for International Trade.
London: Zed Books and Third World Network.
Dawson, Richard J. 1999. “Impact of WTO on Codex Alimentarius and Its Implications for the
South Asian Region.” In Benoit Blarel, Garry Pursell, and Alberto Valdes, eds., Implications of the
Uruguay Round Agreement for South Asia: The Case of Agriculture. Washington, D.C.: World Bank.
Deardorff, Alan V., and Stern, Robert M. 1998. Measurement of Non-Tariff Barriers. Ann Arbor:
University of Michigan Press.
Desai, B. M., V. K. Gupta, and N. V. Namboodiri. 1991. Food-Processing Industries: Development and
Financial Performance. New Delhi: Oxford and IBH Publishing.
FAO (Food and Agricultural Organization). 1998. Possible Implications of Sanitary and Phytosani-
tary Measures for Exports of Oilseed-Based Products to the European Union. Rome.
———. 1999. “The Importance of Food Quality and Safety for Developing Countries.” Report to
the Committee on World Food Security. 25th Session, Rome, May 31–June 3. <www.fao.org/docrep/
meeting/x1845e.htm>
FICCI (Federation of Indian Chambers of Commerce and Industry). 2000.“Study on Comparative
Trade Policy Analysis to Assess Barriers to Trade.” New Delhi. Processed.
Giles, J. A. 1997. Trade Opportunities in the International Processed Horticultural Markets. Geneva:
UNCTAD.
Government of India, Ministry of Commerce. 1999. “Non-Tariff Barriers (NTBs) Faced by India:
Preliminary Report.” Economic Division. New Delhi. Processed.
Gulati, Ashok. 1999. “From Market Access to Domestic Policy.” Economic Times, November 3, p. 7.
Gupta, Deepak. 1999. “Codex Alimentarius Commission and SPS Agreement.” Delhi: Ministry of
Health Unpublished paper.
Henson, Spencer, and Rupert Loader. 1999. “Impact of Sanitary and Phytosanitary Standards on
Developing Countries and the Role of the SPS Agreement.” Agribusiness 15(3): 355–69.
———. 2001. Barriers to Agricultural Exports from Developing Countries: The Role of Sanitary
and Phytosanitary Requirements. World Development 29(1): 85–102.
Hooker, Neal H., and Julie A. Caswell. 1999. “A Framework for Evaluating Nontariff Barriers to
Trade Related to Sanitary and Phytosanitary Regulation.” Journal of Agricultural Economics 50(1).
Indian Institute of Foreign Trade. 2000.“WTO Consistency of Trade Policy of Select Partner Coun-
tries of India.” New Delhi.
ITC/CS (International Trade Center, UNCTAD/WTO, and Commonwealth Secretariat). 1999.
Business Guide to the World Trading System, 2nd ed. Geneva and London.
JECFA (Joint FAO/WHO Expert Committee on Food Additives). 1997. Paper presented at the
Forty-ninth Meeting, June 17–26, Rome.
Lall, Sanjay. 1999. “India’s Manufactured Exports: Comparative Structure and Prospects.” World
Development 27(10): 1769–86.
Martin, Will, and L. Alan Winters. 1996. The Uruguay Round and the Developing Countries.
Cambridge, U.K.: Cambridge University Press.
Technical Barriers to Trade and the Role of Indian Standard-Setting Institutions 297
Maskus, Keith E., and J. S. Wilson. 2001. “A Review of Past Attempts and New Policy Context.” In
Keith E. Maskus and J. S. Wilson, eds., Quantifying the Impact of Technical Barriers to Trade: Can It Be
Done? Ann Arbor: University of Michigan Press.
Maskus, Keith E., and J. S. Wilson. 2000. “Quantifying the Impact of Technical Barriers to Trade: A
Review of Past Attempts and New Policy Context.” Washington, D.C.: World Bank. Processed.
Maskus, Keith E., J. S. Wilson, and T. Otsuki. No date. “Quantifying the Import of Technical Barri-
ers to Trade: A Frame Work for Analysis.” Washington, D.C.: World Bank. Processed.
Mehta, Rajesh. 1999. Tariff and Non-Tariff Barriers of Indian Economy: A Profile. New Delhi:
Research and Information System for the Non-Aligned and Other Developing Countries.
Mehta, Rajesh, and S. K. Mohanty. 1999. WTO and Industrial Tariffs: An Empirical Analysis for India.
New Delhi: Research and Information System for the Non-Aligned and Other Developing Countries.
Michalopoulos, Constantine. 1998. “The Participation of the Developing Countries in the WTO.”
Policy Research Working Paper. World Bank, Washington, D.C.
Mukerji, Ananda. 2000. “Developing Countries and the WTO.” Journal of World Trade 34(6): 33–74.
National Research Council. 1995. Standards, Conformity Assessment and Trade. Washington, D.C.
OECD (Organisation for Economic Co-Operation and Development). 1997. Indicators of Tariff
and Non-Tariff Trade Barriers. Paris.
Otsuki, Tsunehiro, John S. Wilson, and Mirvat Sewadeh. 2000. “A Race to the Top? A Case Study of
Food Safety Standards and African Exports.” Policy Research Working Paper. World Bank, Washington,
D.C.
Panagariya, Arvind. 1999. “The WTO Trade Policy Review of India, 1998.” In J. N. Bhagwati, A.
Panagarya, and T. N. Srinivasan, Lectures on International Trade. Cambridge, Mass.: MIT Press.
Pederson, Jorgen Dige. 2000. “Explaining Economic Liberalisation in India: State and Society Per-
spectives.” World Development 28(2): 265–82.
Porter, Michael. 1990. The Competitive Advantage of Nations. London: Macmillan Press.
Research and Information System for the Non-Aligned and Other Developing Countries, and the
Association of Indian Automobile Manufacturers. 1999. The WTO Regime and Its Implications for the
Indian Automobile Industry. New Delhi.
RGICS (Rajiv Gandhi Institute for Contemporary Studies). No date. “Report on TBT and SPS.”
Report submitted to the Ministry of Commerce, Government of India. New Delhi. Processed.
Roberts, Donna. 1998. “Preliminary Assessment of the Effects of the WTO Agreement on Sanitary
and Phytosanitary Trade Regulations.” Journal of International Economic Law 1(3): 377–405.
Saqib, Mohammed. 2000. “Technical Barriers to Trade and Role of Indian Standard Institutions.”
Working Paper 19. Rajiv Gandhi Institute for Contemporary Studies, Delhi.
Singhal, Anirudh. 2000.“The Sanitary and Phytosanitary Measures Agreement.” Working Paper 12.
Rajiv Gandhi Institute for Contemporary Studies, Delhi.
Trebilcock, Michael J., and Robert Howse. 1999. The Regulation of International Trade, 2nd ed.
London: Routledge.
UNCTAD (United Nations Conference on Trade and Development). 2000. A Positive Agenda for
Developing Countries: Issues for Future Trade Negotiations. New York: United Nations.
Unnevehr, Laurian J., and H. H. Jenson. 1996. “HACCP as a Regulatory Innovation to Improve
Food Safety in the Meat Industry.” American Journal of Agricultural Economics 78(3): 764–69.
Wignarajah, Ganesh, and G. Ikiara. 1999. “Adjustment, Technological Capabilities and Enterprise
Dynamics in Kenya.” In Sanjay Lall, ed. The Technological Response to Import Liberalisation in Sub-
Saharan Africa. London: Macmillan Press.
WTO (World Trade Organization). 1998a. The SPS Agreement and Developing Countries. Geneva.
———. 1998b. Trade Policy Review: India, 1998. Geneva.
———. 1999. Review of the Operation and Implementation of the Agreement on Application of San-
itary and Phytosanitary Measures. Geneva.
———. 2001. “Preparation for the Fourth Session of the Ministerial Conference: Draft Ministerial
Declaration.” Revision. October 27.
298 India and the WTO

Enhancing understanding and strengthening policy coordination in the area
of trade, environment, and development are of key interest to India. Since
the beginning of the 1990s this has become particularly relevant for several
domestic and external reasons, including the economic liberalization policy that
India has followed since 1991, the increasing importance of the environment in
influencing market access and export competitiveness, and the inclusion of the
environment on the international trade agenda of the World Trade Organization
(WTO).
On the other hand, the changing character of the international debate on trade
and environment can be traced to three distinct streams of influence. The first
stream is related to the ongoing discussions in the WTO Committee on Trade and
Environment (CTE) that are fairly well structured around distinct agenda items
with a well-defined work program. In fact, this has constituted the cornerstone for
most debates on trade and environment for a good part of the last decade. The
special sessions of the CTE have also explored on a preliminary basis the different
negotiating issues. These negotiating issues, outlined in paragraph 30 of the Doha
Ministerial Declaration, however, mark a departure from the theoretical debates
on trade and environment in the CTE. The second strand of the debate has origi-
nated from disputes related to trade and environment that have been taken up by
the WTO. These panels and the related appellate bodies have subtly but surely
changed interpretations of articles contained in the General Agreement on Tariffs
and Trade (GATT).
299
12
Trade andEnvironment: Doha
and Beyond
Veena Jha

The third stream of influence originates from the new mandate, largely cham-
pioned by the European Union (EU), that appears to be emerging from the WTO
process itself. According to this new mandate, which is closely related to the dis-
cussions on agriculture, trade, and environment, linkages appear to have an evo-
lutionary character—that is, the exact nature of the linkage will evolve according
to the character of the trade agreements that emerge from the negotiations. Envi-
ronmental considerations have also featured in the discussions on multifunction-
ality that has emerged in the context of discussions on agricultural liberalization.
For example, environmental considerations in a possible multilateral agreement
on investment would be substantively different from the way that they have been
addressed in the Agreement on Trade-Related Aspects of Intellectual Property
Rights (TRIPS). Of course, the bargaining processes as well as the interest groups
that will emerge from these future negotiations are also difficult to determine.
What is clear is that India will have to develop expertise on the environmental
aspects of several trade agreements and not simply remain confined to the agenda
items of the CTE. This need for expertise reinforces India’s need for an integrated
approach to trade, investment, environment, technology, and other aspects of
globalization.
Keeping such a framework in mind, this chapter proceeds as follows. The first
section briefly outlines the negotiating history of trade and environment in the
WTO, emphasizing the position of the major players in the current debate on
trade and environment. The second section outlines how India’s agenda on trade
and environment has evolved in part as a response to the interests of industrial
countries and in part because of the problems that industrial countries have expe-
rienced. Outlined are those issues on which India has developed a defensive
agenda and those on which it has developed a proactive agenda. The section also
links India’s position to its experiences in the area of market access and environ-
mentally sound technologies because these explain the position that India has
taken at the WTO.
The third section discusses the developments that have taken place outside the
framework of the CTE. These include the developments through dispute-settlement
processes and through the buildup to the Doha Ministerial Meeting of the WTO.
These developments are important and may change the complexion of the discus-
sions on trade and environment. Their implications and India’s need to respond
to the dynamic nature of this interface are briefly outlined there.
The fourth section lays down the fundamentals of India’s environmental policy
that has been enunciated without a consideration of its trade interests. It is a com-
prehensive body of legislation adequate to protect India’s environment, thus
showing that India’s capacity to implement environmental laws is in no way sub-
verted by its trade interests or its WTO obligations.
300 India and the WTO

The final section contains recommendations on those specific items regarding
trade and the environment for which India may wish to suggest changes in trade
rules, and those on which it may wish to safeguard the status quo. The chapter also
will outline further policy-oriented research activities that may be needed to fos-
ter India’s more informed participation in the Doha Development Agenda of
negotiations on trade and environment.
Negotiating History of Trade and Environmentin the WTO
The discussion begins with some background and then considers recent deve-
lopments.
Background
Since 1995 the WTO has subsumed the role of the GATT, which was formed in
1948, as the cornerstone of an open international trading system and forum for
multilateral negotiations. For many years, the multilateral trading system essen-
tially dealt with the evolution of rules for traded products. Concepts of sustain-
able development and environmental protection in trade rules only came to be
recognized in the Uruguay Round (1986–93). The GATT Group on Environ-
mental Measures and International Trade (EMIT Group), though set up in 1971,
remained largely inactive until 1991 when the tuna–dolphin case brought envi-
ronmental issues to the fore. As a result, the environmental policies leading to
trade effects were examined.
In the new WTO, the EMIT Group was replaced by the Committee on Trade
and Environment, following the decision to do so reached in Marrakesh in April
1994. The CTE’s role is to examine the relationship between trade measures and
environmental measures in order to promote sustainable development and to rec-
ommend appropriate modifications of the provisions of the multilateral trading
system, whenever required. In addition to the areas covered by the EMIT Group,
the CTE encompasses such new areas as services and TRIPS.
Paragraph 31 of the Ministerial Declaration at Doha (WTO 2001) states that
With a view to enhancing the mutual supportiveness of trade and environment, we
agree to negotiations, without prejudging their outcome, on:
(i) the relationship between existing WTO rules and specific trade obligations set
out in multilateral environmental agreements (MEAs). The negotiations shall
be limited in scope to the applicability of such existing WTO rules as among
parties to the MEA in question. The negotiations shall not prejudice the WTO
rights of any Member that is not a party to the MEA in question;
Trade and Environment: Doha and Beyond 301

(ii) procedures for regular information exchange between MEA Secretariats and the
relevant WTO committees, and the criteria for the granting of observer status;
(iii) the reduction or, as appropriate, elimination of tariff and non-tariff barriers to
environmental goods and services.
Here is the essential point that requires clarification in this negotiating proposal at
Doha: although there has been no consensus in the CTE to negotiate these issues,
how will the Ministerial Declaration bring about results that are different from the
CTE? Does this proposal appear to suggest that, although the CTE has failed to
achieve a consensus, the issue can be negotiated in a negotiating committee? More-
over, the CTE spent a lot of time, without success, trying to reach consensus on
what constitutes an MEA. Therefore it is not clear what would come of negotia-
tions on issues that have not been agreed to in the CTE. Despite several meetings of
the special session of the CTE, a clear agenda has not emerged. Recent statements
by the EU appear to suggest that environment may only be of some optical value in
its negotiating position (see WTO Committee on Trade and Environment 2003b).
Concerns of Industrial Countries Versus Those of Developing Countries
There are divergent environmental concerns in the Doha Development Agenda
(see UNCTAD 1999). Industrial countries generally are keen to include environ-
mental and sustainable development considerations on the agenda for the new
negotiations for the following reasons:
• There are renewed concerns about the possible environmental effects of fur-
ther trade liberalization, which call for greater integration of trade and envi-
ronmental regimes.
• In a broad process of trade negotiations covering a wide range of issues trade-
offs can be identified. Hence, including environment in several agreements will
make it easier for industrial economies to make gains elsewhere, especially on
issues such as agriculture for the Cairns group.
• Policymakers in industrial countries realize that any negotiating agenda that
does not pay adequate attention to the environment will not generate political
support.
Developing countries generally are reluctant to engage in a new round of trade
negotiations for the following reasons (Khor 1999):
• They believe that the Uruguay Round failed to improve market access for
developing countries.
302 India and the WTO

• They are dissatisfied with the way the new WTO rules have dealt with impor-
tant development-related areas, such as the protection of intellectual property
rights, special and differential treatment, and other implementation-related
issues.
• Because they have inadequate capacities, developing countries have been
unable to use the WTO system to pursue their interests.
Developing countries generally are even more wary of entering negotiations on
the environment for the following reasons (Shaheen 1999):
• Their perception is that entering negotiations will lead to increased protection-
ism and unilateral measures directed against them.
• The current trade and environment debate seems inclined toward accommo-
dation of measures to restrict, rather than promote, trade. The agenda on envi-
ronmental goods and services is unlikely to yield substantial trade benefits for
them. On the other hand, they risk getting in non-product-related process and
production methods (PPMs) through the back door (see WTO Committee on
Trade and Environment 2003a).
• Not much progress has been made in implementing Agenda 21 from the Earth
Summit in 1992 in terms of providing supportive measures to developing
countries, such as finance, access to environmentally sound technologies
(ESTs), and capacity building.
India, however, has a very different agenda on trade and environment.
Although some of the reactions are purely defensive, India is also pursuing a
proactive agenda as outlined in the next section.
Issues That Figure Prominently on India’s Agenda
In this section I discuss several aspects of India’s policies on trade and the envi-
ronment, including its resistance to WTO rule changes, ecolabeling, mainstream-
ing the environment, and environmental reviews.2
Defensive Agenda
India appears resistant to changes in the WTO rules in a number of areas, as noted
here. Some developed countries, in particular the EU, may continue to press for an
adaptation of GATT Article XX to further accommodate the use of trade measures
specifically mandated by MEAs, although recent decisions by the Appellate Body
in the Shrimp–Turtle case may have reduced such pressure. In this context India
Trade and Environment: Doha and Beyond 303

has indicated that allowing unilateral trade measures based on non-product-
related PPMs could result in imposing domestic environmental policies on trad-
ing partners.3 India’s view is that current WTO rules and practices are adequate to
address any inconsistencies that might arise between trade measures used in
MEAs and WTO rules. After all, there has never been a dispute between WTO
rules and MEAs, and the conflict is therefore more hypothetical than real. More-
over, such actions may lead to the use of trade measures for protectionist purposes
and for pressuring countries to join MEAs, which may not serve their economic
interests.
India has put forward the view that an MEA can only be regarded as multilat-
eral if (a) it has been negotiated under the United Nations; (b) there has been
effective participation in the negotiations by countries belonging to different geo-
graphical regions and by countries at different stages of economic and social
development; and (c) the Agreement should provide procedures for accession of
countries that are not its original members on terms that are equitable in relation
to the terms of its original participants. India’s proposal also includes an indicative
list of specific trade measures contained in some MEAs. Thus India has attempted
to define the scope of the mandate of the Doha Declaration (see WTO 2003).
Whereas environmental standards can properly be set at the national level for
effects that are confined to national boundaries, the same does not apply when the
domain of the effect is international, or even global. In the case of such issues as
greenhouse gases, ozone-depleting substances (ODS), or the conservation of
threatened species, international agreements are essential. They mandate specific
actions to address the environmental problems that arise, and they specify how
the responsibility for the actions is to be divided among countries. Frequently, the
required actions include some form of restriction on trade.
For example, under the Montreal Protocol India has to phase out its produc-
tion and consumption of chlorofluorocarbons (CFCs) by 2006. Just prior to the
signing of the Protocol, heavy investment was made in the CFC industry, and
many manufacturing plants have yet to complete their payback periods. The
choice of substitutes also was not clear as much will depend on the market for
substitutes. Information about CFC-free technology as well as new investment in
non-CFC technology was urgently required. According to Das (2000), the incre-
mental costs for the phase-out of ODS in India have been estimated by the India
Country Programme at US$1.964 billion for all sectors. However, only about $49
million worth of proposals had been approved for funding by July 1998. Few for-
eign companies have shown a desire to share their CFC-free technology.
Although the alternative ESTs and finance may not be forthcoming, the nega-
tive trade effects immediately come into play. The adjustment costs relating to
technology, substitute raw materials, and retooling range from 30 percent to
304 India and the WTO

35 percent with respect to refrigerators and 10 percent in the case of automobile air
conditioners. Because those costs are not readily coverable from the Montreal Fund,
India’s reluctance to enter into MEAs that entail significant costs is understandable.
This also explains India’s stand on the use of trade measures for environmental pur-
poses as the country does not want to be coerced with trade measures into joining
agreements. Although global environmental problems have to be addressed cooper-
atively, there is an emphasis on common but differentiated responsibilities for these
problems that may or may not entail the use of trade measures.
Paragraph 6 of the Ministerial Declaration (WTO 2001) states
We are convinced that the aims of upholding and safeguarding an open and non-
discriminatory multilateral trading system, and acting for the protection of the envi-
ronment and the promotion of sustainable development can and must be mutually
supportive. We take note of the efforts by Members to conduct national environmen-
tal assessments of trade policies on a voluntary basis. We recognize that under WTO
rules no country should be prevented from taking measures for the protection of
human, animal or plant life or health, or of the environment at the levels it considers
appropriate, subject to the requirement that they are not applied in a manner which
would constitute a means of arbitrary or unjustifiable discrimination between coun-
tries where the same conditions prevail, or a disguised restriction on international
trade, and are otherwise in accordance with the provisions of the WTO Agreements.
In its official briefing to the press following the Doha Ministerial the EU con-
cluded that paragraph 6 of the Doha Declaration provides adequate cover for
invoking measures on the basis of the precautionary principle (WTO 2001).
Ecolabeling
Ecolabeling programs are a fact of the international marketplace. In view of the
growing importance of such programs in commercial transactions between
industrial and developing countries and the increasing use of comprehensive life-
cycle criteria and indicators for these programs, the challenge is how to accommo-
date ecolabeling programs in the Technical Barriers to Trade (TBT) Agreement
without compromising basic GATT rules. The situation is complicated by the lack
of an agreed interpretation on whether private, voluntary ecolabeling schemes are
within the scope of the GATT/TBT.
Discussions in the CTE have focused on multicriteria, ecolabeling schemes,
especially those that are based on non-product-related PPMs. Although the effects
of “type-1” ecolabeling on the marketplace and international trade,4 particularly
imports from developing countries, have been limited, the interest in ecolabeling
in the context of international trade appears at least in part attributable to the fact
that, from a conceptual and trade policy point of view, it involves many complex
Trade and Environment: Doha and Beyond 305

issues, such as PPMs, the definition of international standards, and equivalency.
Little progress has been made thus far in dealing with the PPM issue in the context
of ecolabeling. In particular, the debates in the WTO and the International Orga-
nization for Standardization (ISO)5 have made very little progress in developing
the concept of “equivalency.”
There may be some advantages for India in clarifying the status of ecolabeling
with respect to the TBT Agreement, but there may be some disadvantages, too.
Clarifying the status of ecolabeling with respect to WTO rules may result in
greater WTO discipline in certain sectors (forest products, textiles, cut flowers)
where Indian export competitiveness may be adversely affected by such schemes.
According to a study conducted in India by Bharucha (1997), small producers are
most likely to be adversely affected by ecolabeling schemes. In some cases, certifi-
cation costs alone would amount to 50 percent of total production costs. It may
provide an opportunity to force greater WTO discipline for purely private pro-
grams and nongovernmental organization (NGO) campaigns again in areas
where trade has been adversely affected. It may reduce pressure for unilateral
measures by providing information as an alternative to an outright ban; that is, let
the consumer decide.
There is an equal risk in establishing precedents, particularly if such precedents
apply to labor and human rights issues. There is also a risk that clarifying the sta-
tus of ecolabeling schemes versus WTO rules would encourage the wider use of
ecolabeling in international trade and thereby often foster protectionist intent. It
also may become more difficult to challenge an ecolabeling measure.
Very few, if any, examples can be found where type I ecolabels have allowed
India to obtain price premiums, improved market shares, or environmental per-
formance. Ecolabels may have potentially adverse or at best neutral trade effects
on India. It is arguable that India may actually turn the system to its advantage by
marketing “ecofriendly” products such as “green cotton” labels and the possible
use of natural fibres such as jute in packaging. Because Indian exporters do not
possess the capacity to obtain certification, however, the possible negative effects
may outweigh the potential benefits of clarifying WTO rules with respect to ecola-
beling. Opportunities provided by ecolabeling and consumer sensitivity in
Organisation for Economic Co-operation and Development (OECD) markets
would in any case accrue to India with or without the clarification of trade rules in
this respect. The rules as they exist provide greater certainty in case such measures
become barriers to trade.
An added complication introduced in the context of ecolabeling has been the
precautionary principle. This principle is usually invoked to justify protective
measures taken in the absence of full scientific certainty, such as the potential
health hazards of a pesticide. This principle has generated a lot of controversy in a
306 India and the WTO
North-North context as well as the North-South context. The reason is whereas
the EU upholds the principle, the United States feels all measures should be based
on sound science, and overdependence on the principle could undermine sound
science (WTO 1999).
It is also ironic that ecolabeling, which was strongly championed by Canada
and the United States, is now being questioned by those countries in the context of
genetically modified organisms (GMOs). The countries disagree that labeling
requirements for products containing GMOs would be needed. The United States
in particular asserts that there is no need for such labeling because the products
are safe and testing for traces of GMOs would be prohibitively expensive and
complicated. It would require segregating GMO from non-GMO crops during
cultivation, transport, and any consequent industrial production. This separation
would entail unnecessary costs. The irony is that when countries of the South had
raised similar questions regarding ecolabeling of textiles and footwear, their argu-
ments were dismissed on the grounds that, if consumer preference so dictated,
then such consumer preferences should be catered to. It is interesting that the
issue of consumer preference has not been given much emphasis in discussions on
GMOs (ICTSD 1998, p. 2).
This issue is further complicated in cases of conflictual science. The beef hor-
mones case is a clear example of such a conflict. The EU’s Scientific Committee on
Veterinary Measures said that there was a “substantial body of recent scientific evi-
dence that hormones exerted both tumour initiating and tumour producing
effects.” Although such risk was nonquantifiable, the fact that it existed should be
enough to undertake trade-restrictive measures. The United States, on the other
hand, quoted a joint panel of scientific experts from the World Health Organization
and the Food and Agriculture Organization of the United Nations, which recon-
firmed that residues of the hormones in question would not have a harmful effect if
administered in accordance with good veterinary practices (ICTSD 1999a,b).
Mainstreaming Environment
Calls for mainstreaming environmental considerations in the WTO and the forth-
coming negotiations seem to be inspired by two concerns. One is the perceived
lack of progress achieved in the CTE. Proponents of mainstreaming argue that
transferring specific issues to negotiating bodies may prompt quicker progress.
They also argue that tradeoffs can be identified in a process of negotiations cover-
ing a wide range of issues. The other concern is ensuring that trade liberalization
fully enhances its potential contribution to sustainable development.
With regard to the first concern, India has argued that the trade and environ-
ment agenda requires greater balance if progress is to be made. The country has
Trade and Environment: Doha and Beyond 307

strongly opposed transferring issues from the CTE to negotiating bodies, and has
constantly reiterated that this goes beyond the Marrakesh mandate. India’s con-
cerns include the following:
• Certain mainstreaming proposals appear to focus on the accommodation of
measures that tend to restrict trade on environmental grounds, rather than to
promote trade.
• Mainstreaming may affect the balance of interests between industrial and
developing countries that was established in the CTE work program.
• Certain proposals on mainstreaming may affect the consensus-based process.
• Mainstreaming would diffuse the WTO work on trade and environment and
make it more difficult for developing country experts with environmental
expertise to participate effectively (see Jha and Vossenaar 1999b).
With regard to the second concern, India attaches importance to promoting
the integration of trade and environment in the pursuit of sustainable develop-
ment, and reiterates the view that such integration should take place nationally
rather than through the multilateral trading system.
In assessing the effects of changes in the terms under which trade is carried out, it
is important to recognize that observed increased levels of pollution are not them-
selves evidence that the policy is undesirable. If the liberalization policy is successful,
there will be an increase in economic activity, which may well result in some increase
in environmental damage. The important policy point is to ensure that the cost of
such damage is kept to a minimum for any given increase in economic activity.
Because of the inward-looking import substitution policies followed in the
past, India’s trade is currently a little less than 0.7 percent of the total world trade
(Government of India 2002). In 1991, however, India embarked on a new strategy
of economic growth through trade liberalization. Major exports are leather prod-
ucts, tea, dyestuffs, agriculture and marine products, and textiles. The volume of
trade is too low to have an impact on the environment. Moreover, India has a
comprehensive set of environmental policies that can mitigate any possible nega-
tive consequences of liberalized trade. Given that trade liberalization is not an
important causative factor of environmental degradation in India and that other
domestic factors are of paramount significance, it is not surprising that India has
resisted any effort to mainstream environment into WTO agreements and sees lit-
tle purpose in conducting environmental reviews of trade agreements.
The Doha Declaration according to the EU has mainstreamed environment by
giving a special role to the WTO CTE—sustainable development and environ-
mental concerns throughout the negotiations. This is reflected in paragraph 32 of
the Ministerial Declaration (WTO 2001):
308 India and the WTO

We instruct the Committee on Trade and Environment, in pursuing work on all items
on its agenda within its current terms of reference, to give particular attention to:
(i) the effect of environmental measures on market access, especially in relation to
developing countries, in particular the least-developed among them, and those
situations in which the elimination or reduction of trade restrictions and dis-
tortions would benefit trade, the environment and development;
(ii) the relevant provisions of the Agreement on Trade-Related Aspects of Intellec-
tual Property Rights; and
(iii) labeling requirements for environmental purposes.
Work on these issues should include the identification of any need to clarify relevant
WTO rules. The Committee shall report to the Fifth Session of the Ministerial Con-
ference, and make recommendations, where appropriate, with respect to future
action, including the desirability of negotiations. The outcome of this work as well
as the negotiations carried out under paragraph 31(i) and (ii) shall be compatible
with the open and non-discriminatory nature of the multilateral trading system,
shall not add to or diminish the rights and obligations of Members under existing
WTO agreements, in particular the Agreement on the Application of Sanitary and
Phytosanitary Measures, nor alter the balance of these rights and obligations, and
will take into account the needs of developing and least-developed countries.
Environmental Reviews
So far environmental impact assessments (EIAs) have been used mainly in the
evaluation of projects. There is little practical experience, particularly in India,
with EIAs of trade policies. The challenges are to promote the integration of envi-
ronment and economics and to anticipate potentially adverse scale effects of trade
liberalization. However, there is a need to avoid undue pressures to carry out
overly complicated EIAs that might further adversely affect trade liberalization
and distract from emerging efforts in India to integrate environmental considera-
tions into economic policymaking.
Some points need to be stressed. First, it is generally recognized that any assess-
ment of environmental effects should be carried out under the responsibility of
national governments. Second, EIAs are not only a tool for minimizing negative
environmental effects; their principal objective is to focus on and to be used in
promoting sustainable development. In a broad sense EIAs promote the integra-
tion of environment and economics. Third, EIAs should not narrowly focus on
scale effects, but should also examine income and technology effects. It also may
be necessary to examine “with” and “without” scenarios, that is, to examine the
environmental effects of economic growth patterns that would evolve in the
absence of the proposed trade agreement.
Trade and Environment: Doha and Beyond 309

Given these considerations, India has generally opposed mandatory environ-
mental review of trade agreements. The Doha Declaration has allowed for volun-
tary EIAs and for exchange of assessment information among members.
Proactive Agenda: Promote Changes in WTO Rules
The issues discussed in this section include the Agreement on Trade-Related
Aspects of Intellectual Property Rights (TRIPS), market access, domestically pro-
hibited goods, and the Doha Ministerial Meeting.
The Agreement on Trade-related Intellectual Property Rights
Developed countries have emphasized that TRIPS is meant to foster innovation. It
has been noted, however, that in several cases there may be a tradeoff between the
positive effects of intellectual property rights (IPRs) on the generation of environ-
mentally sound technologies and the negative effects of IPRs on dissemination of
technologies.6 Through its review mechanisms the TRIPS agreement must find
ways and means of balancing these two effects. It is important to bring to the dis-
cussion the empirical evidence gathered on the dissemination of ESTs in relation
to the use of IPRs. Trademarks and trade secrets may also affect the dissemination
of ESTs.
India is concerned that the agreement and more specifically its implementa-
tion do not necessarily promote the dissemination of ESTs or the protection of
biodiversity. The system of IPRs should also find a way to recognize indigenous
technologies, knowledge, and systems of species preservation because these may
be of considerable value in protecting biodiversity.7
Ironically the system of IPRs may obstruct research and development. First,
innovations in biotechnology for the agricultural sector have traditionally been
dependent on land races.8 Without granting adequate protection to land races, as
Halle (1999) noted, TRIPS may erode the very germplasm that forms the basis of
biotechnological innovations. Secondly, granting protection to plant varieties
would imply that plant breeders and researchers would be forced to buy patented
material at exorbitant prices if they are allowed access to it at all. This would dis-
courage research, especially in a country like India where there is a cash con-
straint. It is also to be noted that most research on plant varieties in South Asian
countries largely takes place in the public domain and is not subject to patents.
This makes it widely accessible to a number of agriculturists, and changing this
system may even endanger national objectives, such as food security. Third, grant-
ing broad-based protection to life forms instead of genes that produce those char-
acteristics would block further research into effective ways of producing those
310 India and the WTO

characteristics. This may lead to a crisis in the patents system, elements of which
can be seen already in countries such as the United States. It would have a partic-
ularly chilling effect on public research for which funding is in most cases difficult
to obtain and to justify (for further discussion, see Runnalls and Cosbey [1996]).
Similarly, in the manufacturing sector TRIPS may
• affect technology transfer by restricting the use of compulsory licensing mech-
anisms by the Indian government. The procedures at best are cumbersome.
• increase the price of goods and technologies as industries become increasingly
concentrated.
• adversely affect innovation, especially in the area of ESTs.
In view of those considerations, the WTO may need to take account of the fol-
lowing factors in the review of TRIPS:
• Shorten the life term of some EST patents.
• Make the procedures for compulsory licensing of ESTs less cumbersome.
• Exclude life forms from patentability and ensure compatibility between the
Bio-diversity Convention and TRIPS.
• Grant protection for traditional knowledge through systems other than
patents.
• Extend protection under geographical indications to products other than
wines and spirits.
Under the Montreal Protocol India’s experience with the technological aspect
of the transition away from ODS use and production demonstrates the case of an
ODS-producing country where this industry is dominated by domestically owned
firms that are emphatic about wishing to purchase the alternative technology
without losing their majority equity holding to technology suppliers.9
Among the affected sectors, India’s experience demonstrates two distinct
trends:
1. A smooth transition in which the alternative technology exists and is easily
accessible, commercially viable, and not covered by IPRs. For example, this
applies to the foam sector where alternatives exist and to the insecticide spray–
manufacturing subsector of the aerosol sector where alternatives are economi-
cally viable.
2. A negative experience and difficulties in effecting a phaseout in sectors where
the technology or processes linked with it are under IPRs, with only a few tech-
nology owners, and in sectors where the alternative technology is not yet well
Trade and Environment: Doha and Beyond 311

established or is disputed. In the metered-dose inhaler subsector of the aerosol
sector and the fire protection systems sector, the transition process has been
stymied because the technology is covered by IPRs. In the refrigeration and air-
conditioning sectors, the technology options are not clear-cut.
Moreover, because the technology owners are a few multinationals, the bar-
gaining power of Article 5 nations such as India has been limited in the process of
purchasing the alternative technology.10 Prices are exorbitant and negotiations
with technology suppliers do not get very far because the only options offered to
domestic producers are export curtailment of the alternative or the provision of
majority equity to the technology supplier.
There is an additional problem associated with financial support in the context
of technology switch: the domestic development of such technology is not funded
unless the nation agrees not to demand finance for the transfer of technology in
the pertinent sector at any stage. In the face of such a strong commitment, Indian
firms have preferred to self-finance the development of the alternative technolo-
gies. This explains the strong position India has taken on TRIPS and on dissemi-
nation of ESTs (see Government of India 1996).
There has been some acceptance of this view in the Doha Declaration (WTO
2001). Paragraph 19 of the declaration states the following:
We instruct the Council for TRIPS, in pursuing its work programme including
under the review of Article 27.3(b), the review of the implementation of the TRIPS
Agreement under Article 71.1 and the work foreseen pursuant to paragraph 12 of
this Declaration, to examine, inter alia, the relationship between the TRIPS Agree-
ment and the Convention on Biological Diversity, the protection of traditional
knowledge and folklore, and other relevant new developments raised by Members
pursuant to Article 71.1. In undertaking this work, the TRIPS Council shall be
guided by the objectives and principles set out in Articles 7 and 8 of the TRIPS
Agreement and shall take fully into account the development dimension.
Market Access
Safeguarding market access for products exported by developing countries has
been discussed extensively at the WTO and remains an issue of key concern for
India. India may be more vulnerable to environmental measures because of the
composition of its exports and because small and medium enterprises, which
account for a large share of exports, may find it difficult to meet environmental
standards.
The erosion of preferential market access and other trade preferences that may
be accentuated as the result of a new WTO round may have adverse effects on the
312 India and the WTO
exports of countries such as India and may reduce their ability to achieve sustain-
able development through trade. Much emphasis has been placed in this context
on identifying “win-win” opportunities in trade and environment. “Win-win” sit-
uations arise when the removal or reduction of trade restrictions (e.g., high tariffs,
tariff escalation, and remaining nonobstacles to trade) and distortions has the
potential to yield both direct economic benefits for developing countries and pos-
itive environmental results (WTO Secretariat 1996). Much of the discussion so far
has concentrated on removing trade distortions in such sectors as fisheries, agri-
culture, and energy. More research is needed to explore win-win scenarios, which
would be of benefit to India in the area of textiles and similar goods, instead of
restricting such discussions to agriculture and fisheries.
There have been instances of Indian exporters having to make changes in their
production methods and in input uses to meet the environmental standards of
OECD countries. Examples of this are the following (see Bharucha 1997):
• A ban on pentachlorophenol (PCP), a fungicide used by the leather industry,
that was initiated by Germany, resulted in a short-term setback for the Indian
leather industry’s exports. The Indian leather industry had to go through dra-
matic alterations in its changeover to substitute chemicals, and these PCP sub-
stitutes are roughly 10 times costlier.
• India’s export of tea has been affected by concerns from importing countries
regarding the pesticide residue levels in Indian tea.
• In the early 1980s Indian shipments of marine products were detained on
account of salmonella contamination. Production methods had to be changed
quickly to meet importers’ standards.
There have been obstacles in the packaging requirements of importing coun-
tries. For example, aluminum packages have been replaced by paper packages in
the case of Indian tea. Although India generally has been able to adapt to the
changing requirements of the importers, in most cases there have been cost
increases on account of switching over to other inputs and delays in export orders.
There may be a resulting loss of competitiveness and consequent reduction in
market access.
A 1999 study conducted by the United Nations Conference on Trade and
Development (UNCTAD) focused on process-based standards, such as hazard
analysis at critical control points (HACCP).11 It showed that several such stan-
dards may be totally inappropriate for India and may even have serious social con-
sequences. Of the 400-odd shrimp firms in India, only 80 would be able to comply
with the standards. Many of the others would simply become subcontractors to
those firms that have been able to meet the standard. Moreover, in a country
Trade and Environment: Doha and Beyond 313
Au: year?
where potable drinking water is difficult to obtain, the requirement that floors
and ceilings of facilities certified by HACCP be washed with potable water can be
considered excessively wasteful (see Kaushik and Saqib 2000).
The increasing number and variety and the frequent changes in the regulations
cause problems, especially for smaller producers trying to keep themselves
informed. Also, producers find the regulations to be cumbersome and complex,
and the costs of meeting them make their exports noncompetitive. They also
sometimes have the effect of reducing the price of the products or reducing added
value, and may either be unnecessary for meeting the environmental objective or
inappropriate to the conditions of the exporting country.
The Doha Declaration has increased the cover provided to environmental
measures as can be seen from paragraph 6 of the Declaration. Although the tradi-
tional safeguards have been inserted, they are unlikely to prove adequate should
environment be used as a disguised form of protectionism.
Domestically Prohibited Goods
India is concerned about the health and environmental effects of imports in cases
in which the domestic sale of such products has been prohibited or severely
restricted in the exporting country. Indian importers need adequate information
about the risk that such products could pose to public health and the environ-
ment. Apart from information problems, they may also lack the infrastructure
(including testing facilities) and other capabilities to monitor and control imports
of domestically prohibited goods. Industrial countries, on the other hand, argue
that a number of multilateral agreements and instruments already address this
issue. Although duplication is to be avoided, there is a need to examine whether
existing instruments, such as the prior informed consent procedure, are sufficient
from India’s perspective to prevent environmental damage from such imports,
particularly with regard to product coverage and procedures (WTO 1998).
Evidence collected by UNCTAD and other agencies appears to indicate that
there is some empirical basis for the positions taken by India, and that they do not
stem merely from political fears (see Jha and Hoffmann 2000). Moreover, as the
next section will show, trade concerns have not led to a “regulatory chill” in the
environment field. India continues to maintain a comprehensive body of environ-
mental legislation.
Developments at the Doha Ministerial Meeting
At the November 2001 WTO Ministerial Meeting at Doha, there was a significant
shift of attention to environment in the Ministerial Declaration. Looking at the
314 India and the WTO

fine print of the declaration, it appears that environment has been mainstreamed.
Paragraph 6 of the Ministerial Declaration states that
We recognize that under WTO rules no country should be prevented from taking
measures for the protection of human, animal or plant life or health, or of the envi-
ronment at the levels it considers appropriate, subject to the requirement that they
are not applied in a manner which would constitute a means of arbitrary or unjusti-
fiable discrimination between countries where the same conditions prevail, or a dis-
guised restriction on international trade, and are otherwise in accordance with the
provisions of the WTO Agreements.
According to the official briefing by the European Commission (WTO 2001),
this language provides enough cover for formulating measures on the basis of the
precautionary principle and for the labeling of environmentally friendly products.
The United States views this as giving it enough cover for unilateral measures,
whereas India views it as the tradeoff that they had to make for getting the EU to
reduce their agricultural subsidies. It is also India’s view that putting in WTO safe-
guards from the chapeau of Article XX gives them enough protection against
measures that could be designed to protect trade.
Environmental Regulation in India
The overall framework of environmental legislation in India is set by the National
Conservation Strategy and Policy Statement on Environment and Development
issued by the Ministry of Environment and Forests (MOEF) in June 1992. The
Indian constitution enjoins the “States to take measures to protect and improve
the environment and to safeguard the forests and wildlife in the country.” It also
makes it a “fundamental duty of every citizen to protect and improve the natural
environment including forests, lakes and rivers and wildlife, and to have ecological
compassion for the living creatures.”
Recognizing the severe problems related to the issue of air and water pollu-
tion, the Policy Statement for Abatement of Pollution, 1992, identifies the follow-
ing steps to integrate environmental considerations into decisionmaking at all
levels:
• prevent pollution at the source
• encourage, develop, and apply the best available and practicable technical
solutions
• ensure that the polluter pays for the pollution and control arrangements
• focus on protection of heavily polluted areas and river stretches
• involve the public in decisionmaking.
Trade and Environment: Doha and Beyond 315
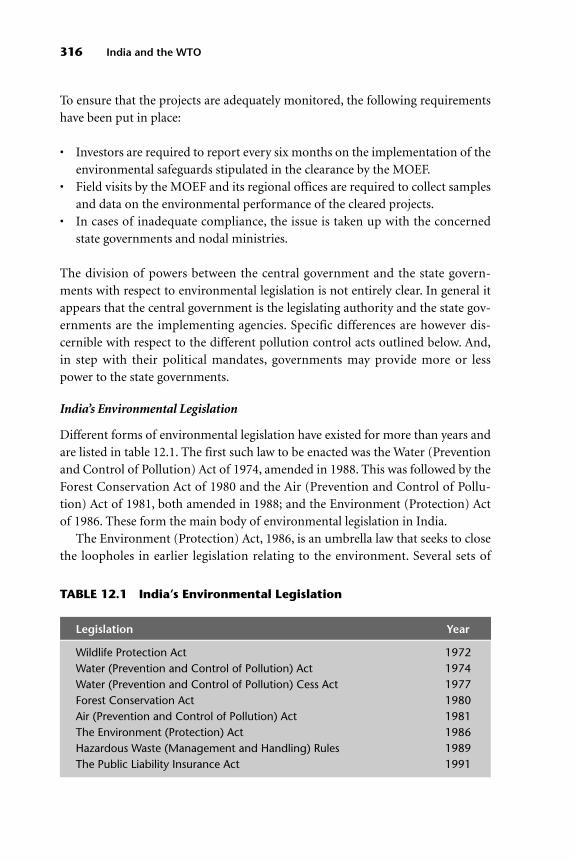
To ensure that the projects are adequately monitored, the following requirements
have been put in place:
• Investors are required to report every six months on the implementation of the
environmental safeguards stipulated in the clearance by the MOEF.
• Field visits by the MOEF and its regional offices are required to collect samples
and data on the environmental performance of the cleared projects.
• In cases of inadequate compliance, the issue is taken up with the concerned
state governments and nodal ministries.
The division of powers between the central government and the state govern-
ments with respect to environmental legislation is not entirely clear. In general it
appears that the central government is the legislating authority and the state gov-
ernments are the implementing agencies. Specific differences are however dis-
cernible with respect to the different pollution control acts outlined below. And,
in step with their political mandates, governments may provide more or less
power to the state governments.
India’s Environmental Legislation
Different forms of environmental legislation have existed for more than years and
are listed in table 12.1. The first such law to be enacted was the Water (Prevention
and Control of Pollution) Act of 1974, amended in 1988. This was followed by the
Forest Conservation Act of 1980 and the Air (Prevention and Control of Pollu-
tion) Act of 1981, both amended in 1988; and the Environment (Protection) Act
of 1986. These form the main body of environmental legislation in India.
The Environment (Protection) Act, 1986, is an umbrella law that seeks to close
the loopholes in earlier legislation relating to the environment. Several sets of
316 India and the WTO
TABLE 12.1 India’s Environmental Legislation
Legislation Year
Wildlife Protection Act 1972Water (Prevention and Control of Pollution) Act 1974Water (Prevention and Control of Pollution) Cess Act 1977Forest Conservation Act 1980Air (Prevention and Control of Pollution) Act 1981The Environment (Protection) Act 1986Hazardous Waste (Management and Handling) Rules 1989The Public Liability Insurance Act 1991

rules relating to various aspects of the management of hazardous chemicals,
wastes, microorganisms, and so forth have been notified under this act. The law
gives the central government the power to set quality standards for air, water, and
soil in specified areas and for specified purposes. The act covers the maximum
allowable concentrations of various environmental pollutants as well as the proce-
dures and safeguards for handling hazardous substances and related restrictions,
the restrictions regarding the location of industry, and the procedures and safe-
guards for preventing industrial accidents that may cause environmental pollu-
tion. If a particular state so desires, however, it may set more but not less stringent
standards with respect to a specified category of industries within its jurisdiction.
Those industries that must obtain consent under the Water Act, the Air Act, or
both, or that need authorization under the Hazardous Waste (Management and
Handling) Rules of 1989 must submit an environmental audit report to the con-
cerned state authority by September 30th of each year, according to the Environ-
ment Protection Act (see also Jha 1998).
In addition to legislation covering water, air, and the environment, the nonen-
vironmental Factories Act, amended in 1987, made it mandatory for hazardous
manufacturing units to submit to the government a detailed disaster manage-
ment plan and an assessment of the unit’s possible environmental impact. The
amendments to this act also made the top nonexecutive officers—such as the
chairpersons of these companies—liable for prosecution in case of an accident.
These amendments followed the Bhopal gas disaster, when the Indian Govern-
ment was unable to sue the top executive of Union Carbide posted in India at the
time.
Other relevant legislation includes the Public Liability Insurance Act of 1991,
which is a further strengthening of the government’s powers to legislate. This act
imposes on the owner of a company that handles hazardous chemicals the liability
to provide immediate relief in case of death or injury to any person or of damage to
property resulting from an accident that occurs while handling any of the specified
hazardous chemicals. To meet this liability, the owner has to take out an insurance
policy of an amount equal to its “paid-up capital” or up to Rs. 500 million, whichever
is less. The policy must be renewed every year. The owner also has to pay to the cen-
tral government’s environment relief fund (ERF) an amount equal to its annual
premium. The liability of the insurer is limited to US$10 million to $15 million per
accident, up to a maximum of $30 million a year or up to the tenure of the policy.
Any claims in excess of this liability will be paid from the ERF. Payment under this
act is only for immediate relief; owners must provide the final compensation, if
any, arising from legal proceedings. This law also was passed following the Bhopal
disaster and was meant to ensure that the suffering undergone by the victims
would never be repeated.
Trade and Environment: Doha and Beyond 317

Fiscal Incentives to Encourage Control and Prevention of Pollution
To encourage conservation, donations given by the corporate sector for conserva-
tion of nature and natural resources are exempt from income tax. A depreciation
allowance of 30 percent is also permitted on devices and systems installed in indus-
trial units to minimize pollution or conserve natural resources. To encourage
plants to shift from congested urban areas, capital gains made in moving from
urban to other areas are exempt from taxes if they are used for acquiring land and
building production facilities in nonurban areas. Excise and custom-duty exemp-
tions or reductions are given for the use of environmentally friendly raw materials.
This formidable body of law is also meant to ensure that industrial develop-
ment, including export industries, does not sacrifice environmental interests; that
industries are accountable to citizens; and that polluting industries are made to
pay in accordance with the polluter-pays principle. Therefore, linking trade with
the environment would not serve India’s environmental interests as much as
increasing the capacity to implement its formidable body of environmental legis-
lation. The country’s existing laws and its interest in protection of the citizenry
and the environment explain India’s reluctance to engage in discussions on
changes in trade rules for environmental purposes. India, however, may be forced
to rethink this linkage because trade and environment disputes may change the
balance of rights and obligations at the WTO.
Evolutionary Developments in Trade and EnvironmentOutside the CTE
Dispute settlement is a mechanism through which the carefully created balance of
the CTE may be disturbed. Successive interpretations by panels and appellate
bodies have expanded the scope of subparagraphs (b) and (g) in Article XX, where
there is no consensus to do so through the CTE. It is important to examine the
impact of this evolutionary interpretation of Article XX, subparagraphs (b) and
(g), on the trade and environment debate. The precedent-setting value is immense.
Other panels and appellate bodies may find it difficult to ignore these interpreta-
tions especially because of pressure groups that have developed around trade and
environment. This section of the chapter investigates the evolutionary aspects of
the Shrimp–Turtle panel and how proposals in the WTO Dispute Settlement
Understanding (DSU) seek to rectify some of the imbalances created by the
Shrimp–Turtle and Asbestos panels (WTO Appellate Body Report 1998).
In 1997 India, Malaysia, Pakistan, and Thailand requested the establishment of
a WTO panel to consider U.S. trade restrictions on shrimp imports. Under the
authority of the U.S. Endangered Species Act (ESA), the United States imposed
318 India and the WTO

embargoes on the import of shrimp from a number of its trading partners in
order to protect the sea-turtle population. Under the ESA, access to U.S. shrimp
markets is conditional on a certification that a country has adopted conservation
policies that the United States considers to be comparable to its own in terms of
regulatory programs and incidental taking. The United States unsuccessfully
argued that this trade measure satisfied GATT Article XX(g).
The panel issued its final report to the parties on April 6, 1998. It rejected the
U.S. argument on the basis of its interpretation of the chapeau to Article XX, and
Article XX(g) was not considered in particular. The panel found that the U.S.
measure constituted unjustifiable discrimination between countries where the
same conditions prevail. The United States appealed the panel’s interpretation of
Article XX(g).
The appellate body delivered its report on October 12, 1998. It found fault with
the panel’s interpretation; considered Article XX(g); and decided that although
the embargo served an environmental objective that is recognized as legitimate
under the Article, the measure was applied in a manner that constituted arbitrary
and unjustifiable discrimination between members of the WTO, contrary to the
requirements of the chapeau of Article XX.
In the Asbestos case the appellate body stated, “In justifying a measure under
Article XX(b) of the GATT 1994, a Member may also rely, in good faith, on scien-
tific sources which, at that time, may represent a divergent, but qualified and
respected, opinion. A Member is not obliged, in setting health policy, automati-
cally to follow what, at a given time, may constitute a majority scientific opinion.”
Thus while allowing members freedom, this freedom is qualified. In the amicus
brief submitted to the appellate body, the Foundation for International Law and
Development and others have stated, “Science is not the sole arbiter of objective,
non-discriminatory policymaking. The precautionary principle, which informs
the interpretation of this and other aspects of the WTO Agreements, entitles reg-
ulators to act with precaution without having to meet a set threshold of scientific
certainty” (see Foundation for International Law and Development 2001).
But the appellate body does not seem to have given explicit permission for
applying the precautionary principle beyond the provisions of the Technical Bar-
riers to Trade Agreement. It still places emphasis on science although the coun-
tries are not bound by majority opinion. On the other hand, however, applying
the precautionary principle is not a matter of scientific evidence, majority or
minority opinion, so it is difficult to come to definite conclusions about the appli-
cation of the precautionary principle from this appellate decision. In this case the
scientific evidence was against asbestos and asbestos-based products, and it was
relatively easy to substantiate the claim with scientific evidence. But in other cases
it may not be so easy (WTO Appellate Body Report 2001).
Trade and Environment: Doha and Beyond 319
An interesting dilemma emerges with the appellate body decision. Although its
decision appears to have broadened the scope of measures that clearly would be
considered acceptable under GATT Article XX and it has opened the way for seek-
ing inputs from NGOs and perhaps other lobbyists, the decision also has brought
to the fore the numerous grounds under which such measures would be considered
discriminatory. In fact, there may be a plethora of reasons by which trade measures
for meeting nontrade objectives may be de facto “arbitrary and unjustifiably dis-
criminatory.” It is not the panel or appellate body decision that is of great concern,
but rather the trend toward judicial activism that panels may inadvertently encour-
age. Whereas committees of the WTO may fail to achieve something for lack of
consensus, panels and appellate bodies set aside the need for consensus.12
And, although the DSU makes clear that the dispute-settlement process cannot
add to or subtract from the rights and obligations of the members under the
WTO and its annexed agreements, by a gradual process of citing earlier rulings
and adopting them as their own, panels and the appellate body may be spearhead-
ing a process of judicial activism that eventually will change the balance of rights
and obligations. The solution lies in a review of the DSU process that may also
consider giving guidelines on such issues to the Dispute Settlement Body.
Conclusions and Recommendations
Whereas trade and environment issues were confined to a well-defined and bal-
anced agenda by the 1994 Marrakesh Agreement in the Uruguay Round, the 2001
WTO Doha Ministerial Declaration appears to have mainstreamed environment
in the WTO agenda. Mainstreaming may require very different skills and capaci-
ties in India. To date, India has adequately addressed its interests by focusing
specifically on a few issues, but the evolving nature of discussions would entail the
development of special capacities, including research into the environmental
aspects of practically all negotiations. Although the research initially might focus
on such areas as agriculture, TRIPS, the Technical Barriers to Trade Agreement,
subsidies, investment, and other issues that are likely to be negotiated in the new
round.
What follows are eight recommendations for a capacity-building agenda in
India.
1. There is a need to improve implementation of supportive measures under
multilateral environmental agreements and to examine to what extent the
multilateral trading system can help remove possible obstacles to better imple-
mentation. Such improvement would be particularly relevant for the transfer-
of-technology provisions in the MEAs. Sharing experiences with countries at
320 India and the WTO

similar stages of development may help in better implementing supportive
measures. This could be done both at the CTE and in the working group on
technology transfer created by the Doha Ministerial Declaration. Submissions
by India in both the CTE and the working group have highlighted this need.
Work carried out by UNCTAD has indicated a key need to share research
results between developing countries at the stage of developing technologies.
The India’s Department of Science and Technology could provide vital input to
this process.
2. There is a need to examine the consistency of TRIPS provisions and the Biodi-
versity Convention, especially in the areas of biological resources and tradi-
tional knowledge systems.13 The Government of India has proposed that the
country of germplasm origin be indicated in all patent applications for
biotechnological innovations. It should also be indicated whether prior
informed consent was obtained for the biological genetic resource or tradi-
tional knowledge so that mutual benefit-sharing arrangements can be made.
Such documentation should be attached to the patent application. To this end
the government has registered a database on traditional knowledge with the
World Intellectual Property Organisation. But because such databases cannot
be comprehensive, it is important to devise systems that could prevent misap-
propriation and generate benefits. The national Biodiversity Action Plan has
begun the task of collecting and recording information and the biodiversity
law provides for prior-informed-consent mechanisms. India will need to work
with other like-minded countries to generate a framework for unique mecha-
nisms for protecting traditional knowledge.
3. There is a need to strongly resist unilateral measures on the grounds that all
unilateral measures that are extrajurisdictional and based on nonproduct-
related process and production methods would fail the chapeau test of GATT
Article XX. A comparative evaluation of WTO jurisprudence in this context
would be useful. India’s Ministry of Commerce has begun discussion groups
on the evolution of WTO law in this field, but India needs to generate public
awareness of these issues and to develop a media strategy.
4. Implementation of TRIPS Articles 67 and 66.2 on transfer of technologies to
developing countries and to the least-developed countries is needed. Article
67 obliges industrial country members to provide, on request and on mutu-
ally agreed terms and conditions, technical and financial cooperation to
developing countries. Article 66.2 obliges industrial country members to pro-
vide incentives to enterprises and institutions in their territories for the pur-
pose of promoting and encouraging technology transfer to least-developed
countries. As these are binding obligations and not best-endeavor clauses,
developing countries should call for a review of the policies that industrial
Trade and Environment: Doha and Beyond 321

countries have formulated to implement the two articles. It is also necessary to
examine how the DSU would regard nonimplementation of these articles.
The role of the working group on technology transfer in the WTO will be vital
in this context.
5. A mechanism should be devised under the existing code of good practices for
voluntary measures to avoid the use of trade-discriminatory measures based
on PPM-related requirements. UNCTAD has proposed to set up a consultative
mechanism between developing and industrial countries to promote analysis,
debate, and consultations to address the following issues:
• The key trends in environmental policies (sectors, measures).
• The most important ongoing and planned general initiatives concerning
environmental and health protection that may result in new standards and
regulations with potential significant implications for developing countries.
Which sectors and products may be affected? What response measures are
available? What are the conditions and needs of developing countries? How
could relevant information on certification, private sector standards and
codes, buyers’ requirements, and supply-chain management be collected and
disseminated?
6. There is a need to build consensus on certain concepts to be considered in
developing and implementing newly emerging environmental measures with
trade effects, particularly for India. The role of sound science and the concept
of risks that nonfulfillment may create also need to be examined in greater
detail, particularly with a view to understanding the appropriate balance
between trade distortions and environmental and health risks.
7. It may be necessary to examine whether differential treatment for small and
medium-size enterprises (SMEs) is available within the existing framework of
WTO rules, because a large proportion of India’s exports comes from SMEs.
Several organizations that provide support services to SMEs could be involved
in this process. Industrial clusters that support SMEs need to improve aware-
ness on these emerging standards.
8. A lesson drawn from the ecolabeling discussions is that that there may be a
need to define “an international standard,” and that a true international stan-
dard requires effective and representative participation of WTO member states
at all levels of development. Similarly, there is a need to support the effective
participation of India in international standard setting.14 In this context, dis-
cussions in the Bureau of Indian Standards and the Ministry of Health have
highlighted the need for changing India’s role from a “standard taker to a stan-
dard setter.” This would require investing in technologies, entering into mutual
recognition agreements and, above all, creating a substantial research fund.
322 India and the WTO

There are encouraging indications in two sectors—leather and tea—that India
is emerging as a standard setter there.
Endnotes
1. This draws on Eglin (1995). Eglin is a former director, Trade and Environment Division, WTO
Secretariat.
2. The discussion on issues in this section draws heavily on Jha and Vossenaar (1999a).
3. “Obviously this would be a recipe for protectionism and restriction of market access for devel-
oping countries’ exports—with inevitable negative consequences for sustainable development.” See
Governments of the Dominican Republic, Egypt, Honduras, and Pakistan (1999). This statement was
supported by India.
4. Type 1 ecolabeling refers to ecolabels awarded by a third party for products that meet preset envi-
ronmental criteria, according to the terminology used by the ISO. See Zarrilli, Jha, and Vossenaar (1997).
5. In the ISO, progress has been made in developing guidelines on transparency, conformity
assessment, and mutual recognition.
6. See the findings of the IPR commission established by the Department for International Devel-
opment, Government of the United Kingdom, which furnished its report in 2002. Its Web site address
7. In accordance with the TRIPS Agreement, to be patentable an invention must be new, must
involve an inventive step, and must be capable of industrial application. TRIPS seems to contemplate
only the Northern industrialization model of innovation. It fails to address the more informal, com-
munal system of innovation through which farmers in the South produce, select, improve, and breed
crop and livestock varieties. Thus, Southern germplasm achieves an inferior status to that of contem-
porary biotechnologists’ varieties. The intellectual property of Southern farmers is apparently denied
recognition and hence protection. See WWF (1999).
8. Land races refer to the genetic diversity of species that farmers rely on for improving the genetic
stock of seeds.
9. For comprehensive coverage of India’s experience in accessing ESTs under the Montreal Proto-
col, see Watal (2000).
10. Article 5 of the Montreal Protocol includes a list of countries that are eligible for receiving
assistance from the Multilateral Fund.
11. Hazard Analysis at Critical Control Points (HACCP) with Respect to the Shrimp Sector under
a 1999 project for strengthening capacities to promote trade and environment policy coordination,
jointly pursued by the Government of India, UNCTAD, and the United Nations Development Pro-
gramme, under project IND/97/955.
12. See Pakistan’s proposal on the review of the DSU submitted to the General Council
(WT/GC/W/62).
13. The international law of treaties uses various criteria to determine which treaty takes priority.
Under the rule that later treaties take priority over earlier treaties, the TRIPS Agreement (which was
agreed to at the end of the Uruguay Round in December 1993 and signed in April 1994) would take
priority over the Convention on Biological Diversity (CBD) (which was agreed to in May 1992). How-
ever, under the rule that more specific treaties take priority over general treaties, because the CBD’s lan-
guage on IPRs in the context of transfer of technology for biodiversity objectives is more specific than
that of the TRIPS Agreement, the CBD would take priority. It is also to be noted that Article 16.5 of the
CBD states: “The contracting parties, recognizing that patents and other intellectual property rights
may have an influence on the implementation of the convention, shall cooperate in this regard subject
to national legislation and international law in order to ensure that such rights are supportive of, and do
not run counter to, its objectives” [emphasis added].
14. For example, if reducing the standard of aflatoxins from 5 to 2 parts per billion increases the
risk of cancer by 2 per billion people, such a standard is appropriate.
Trade and Environment: Doha and Beyond 323

Bibliography and References
Bharucha, Vasantha. 1999. “The Impact of Environmental Standards and Regulations Set in For-
eign Markets on India’s Exports.” In Veena Jha, Grant Hewison, and Maree Underhill, eds., Trade Envi-
ronment and Sustainable Development: A South Asian Perspective. London: Macmillan.
Das, Shipra. 2000. “India: Effects of Trade and Positive Measures in the Montreal Protocol on
Selected Indian Industries.” In Veena Jha and Ulrich Hoffmann, eds., Achieving Objectives of Multilat-
eral Environmental Agreements: Lessons from Empirical Studies. Geneva: UNCTAD.
Eglin, Richard. 1995. “World Trade and the Environment Volume II, House of Commons, Session
1995-96, Environment Committee.” Fourth Report: Memorandum by the WTO (WTE 14) Trade and
Environment Division. London.
Focus on the Global South. 2000. “Why Reform of the WTO Is the Wrong Agenda.” Bangkok: Uni-
versity of Bangkok.
Foundation for International Law and Development. 2001. Amicus Brief Submitted to Appellate
Body. London.
Government of India. 1996. “The Relationship of the TRIPS Agreement to the Development and
Transfer of Environmentally-Sound Technologies and Products.” Non-paper for the WTO Committee
on Trade and Environment. June. Geneva.
———. 2002. Economic Survey of India 2002. Delhi.
Governments of Cameroon, Côte d’Ivoire, Nigeria, Sri Lanka, and Zaire. 1998. Technical Note on
Domestically Prohibited Goods. MTN.GNG/W/18, November 17.
Governments of the Dominican Republic, Egypt, Honduras, and Pakistan. 1999. “Trade and Envi-
ronment: A Developing Countries’ Perspective.” Statement presented at the High-Level Symposium on
Trade and Environment, March 15–16, Geneva.
Halle, Mark. 1999. “IPRs and CBD.” Paper presented at the Conference on International Trade and
Environment. Supported by the SEMA Project, April 9–10, Hanoi.
“Hazard Analysis at Critical Control Points (HACCP) with Respect to the Shrimp Sector,” under a
Joint Government of India/UNCTAD/UNDP Project on “Strengthening Capacities to Promote Trade
and Environment Policy Co-ordination.” 1999. Export of fresh, frozen, and processed fish and fishery
products (Quality Control, Inspection Council of India, New Delhi).
ICTSD (International Centre for Trade and Sustainable Development). 1998. Bridges between
Trade and Sustainable Development, Vol. 2, September, Geneva, Switzerland.
———. 1999a. Bridges between Trade and Sustainable Development, Vol. 3, January-February.
———. 1999b. Bridges between Trade and Sustainable Development, Vol. 3, March.
Jha, Veena. 1998. “Investment: Liberalization and Environment—Conflicts and Compatibilities in
the Case of India.” Copenhagen: UNCTAD and Copenhagen Business School.
Jha, Veena, and Ulrich Hoffman, eds. 2000. Achieving Objectives of Multilateral Environmental
Agreements: Lessons from Empirical Studies. Geneva: UNCTAD.
Jha, Veena, and Rene Vossenaar. 1999a. “Breaking the Deadlock: A Positive Agenda on Trade, Envi-
ronment and Development” In Gary P. Sampson and W. Bradnee Chambers, eds., Trade, Environment
and the Millennium. Tokyo: United Nations University.
———. 1999b. “Mainstreaming Environment in the WTO Agreement.” Paper presented at an UNC-
TAD Seminar on Trade and Environment in the Philippines, November 8–11, Los Banos, Philippines.
Kaushik, Atul, and Mohammed Saqib. 2000. “Market Access Effects of Environmental Stan-
dards.” Paper prepared for a joint Government of India/UNCTAD/UNDP Project on “Strengthening
Capacities to Promote Trade and Environment Policy Co-ordination, under Project Number
IND/97/955.
Khor, Martin. 1999. “Trade, Environment and Sustainable Development: A Developing Country
View of the Issues Including in the WTO.” Context paper presented to the WTO High-Level Sympo-
sium on Trade and Environment, March 15–16, Geneva.
Runnalls, David, and Aaron Cosbey. 1996. “The Sustainable Development Effects of WTO TRIPS
Agreement: A Focus on Developing Countries.” Paper presented at the Second Annual Sustainable
324 India and the WTO

Development Conference, sponsored by the International Institute on Sustainable Development,
August 4–10, Islamabad.
Shaheen, Magda. 1999. “Trade and Environment: How Real Is the Debate?” In Gary P. Sampson and
W. Bradnee Chambers, eds., Trade, Environment and the Millennium. Tokyo: United Nations University.
UNCTAD (United Nations Conference on Trade and Development). 1999. “Seattle Ministerial
Conference—Trade and Environment: Current Proposals and Their Possible Implications for Devel-
oping Countries.” Geneva.
Watal, Jayshree. 2000. “Transfer of Technology Issues under the Montreal Protocol.” In Veena Jha
and Ulrich Hoffmann, eds., Achieving Objectives of Multilateral Environmental Agreements. Geneva:
UNCTAD.
WTO (World Trade Organization). 1994. Communication from the Chairman, Decision on Trade
and Environment. Special Distribution (UR-94-0085). MTN.TNC/W/141, March 29.
———. 1997. Note by Secretariat on Environmental Benefits of Removing Trade Restrictions and
Distortions on Committee on Trade and Environment. WTO/CTE/W/67, November 7.
———. 1999. Submission by the United States to the High-Level Symposium on Trade and Envi-
ronment, March 15–16, Geneva.
———. 2001. WTO Ministerial Doha: Assessment of Results for EU. Memo, WT/MIN(01)/DEC/W/1
November 14. < http://trade-info.cec.eu.int/europa/2001newround/p14.php>.
———. 2002a. Note by the Secretariat on the Environmental Effects of Services Trade Liberaliza-
tion on Committee on Trade and Environment. WT/CTE/W/218, October 3.
———. 2002b. Synthesis Report Contributed by UNEP on Committee on Trade and Environment,
Enhancing Synergies and Mutual Supportiveness of MEAs and the WTO. WT/CTE/W/213, June 12.
———. 2003. Submission by India under Paragraph 31(i) of the Doha Work Programme.
TN/TE/W/23, February 20.
WTO Appellate Body Report. 1998. United States—Import Prohibition of Certain Shrimp and
Shrimp Products. WT/DS58/AB/R. U.S.C.A. 1531-44, October 12.
———. 2001. European Communities—Measures Affecting Asbestos and Asbestos-Containing Prod-
ucts. WT/DS135/AB/R, April 5.
WTO Committee on Trade and Environment. 2003a. Report to the Fifth Session of the WTO Min-
isterial Conference, First Draft. JOB(03)/73, April 10.
———. 2003b. Special Session. TN/TE/S/3/REV.1, April 24.
WTO Secretariat. 1996. Singapore Ministerial Declaration. WT/CTE/1, November 12.
WWF (World Wildlife Fund). 1999. “The UN Biodiversity Convention and the WTO TRIPS
Agreement.” Discussion Paper. Gland, Switzerland.
Zarrilli, Simonetta, Veena Jha, and Rene Vossenaar, eds. 1997. Ecolabeling and International Trade.
London: Macmillan.
Trade and Environment: Doha and Beyond 325


One of the more commented upon facts about the Indian economy is its
small and dwindling importance in world trade. At the time of indepen-
dence, India accounted for more than 2 percent of world exports and
imports, but by the early 1990s this share had declined to about half a percent
(figure 13.1). A plausible case can be made that India’s economic fortunes have been
related to this de facto international disengagement that is attributable, at least in
part, to India’s inward-looking economic and trade policies. Protectionist polices, in
turn, have shaped India’s attitude to participation in the multilateral trading system,
in both the old General Agreement on Tariffs and Trade (GATT) and its successor,
the World Trade Organization (WTO). India’s stance in the GATT/WTO has always
tended to be defensive, seeking freedom to use restrictive policies—two prongs of
the so-called special and differential treatment embraced by developing countries as
a whole.1 Since the early 1990s India has embarked on serious trade and economic
reform, without, however, a corresponding change in the nature of its multilateral
engagement. This chapter examines whether India should adopt a proactive role in
the multilateral arena founded on its recent adoption of more open policies.
327
13
India and theMultilateral Trading
System Post-Doha:Defensive or
Proactive?
Aaditya Mattoo and Arvind Subramanian
The authors would like to thank Carsten Fink, Francis Ng, Marcelo Olarreaga, Natalia Tamirisa, and
especially Garry Pursell and Randeep Rathindran for their valuable input. Thanks are also due to
Malina Savova for providing excellent research assistance. The views expressed in this chapter do not
necessarily reflect those of the institutions with which the authors are associated. Errors and excesses
remain our own.

The launch of a new round of comprehensive multilateral trade negotiations in
November 2001, two years after the debacle at Seattle, provides an opportunity for
India to reassess its traditional strategy. India’s position in the run-up to the launch
was characteristically but perhaps not unjustifiably defensive. Among other things
India sought to (a) keep out the new issues (competition, investment, and govern-
ment procurement) altogether from the scope of future negotiations; (b) encour-
age progress in the implementation of Uruguay Round agreements, particularly
accelerated liberalization of access in textiles and clothing; and (c) increase the flex-
ibility afforded by the Trade-Related Aspects of Intellectual Property Rights
(TRIPS) agreement in the use of compulsory licensing. India was not clearly asso-
ciated with those voices pushing for greater and faster liberalization of global mar-
kets in goods and services. This chapter presents the case for a changed strategy.
In the following section we spell out the advantages to India of actively pursuing
greater market openness in the current round of negotiations, while acknowledging
the limits of such a strategy. The next section analyzes the issues that have emerged
in some of the negotiating areas in the WTO. The third section offers concrete pro-
posals that Indian negotiators might adopt in future discussions in the WTO.
Multilateral Engagement: Whether and How
A major challenge facing India is how to institute and sustain good economic
policies. This challenge is a primarily domestic one. Good policy should be
geared, first of all, to injecting competition in the domestic economy. In the area
of goods, this will involve reducing trade barriers; in services, competition also
328 India and the WTO
0.0
0.5
1.0
1.5
2.0
2.5
1950 1955 1960 1965 1970 1975 1980 1985 1990 1995 2000
Share in exports
Share in imports
FIGURE 13.1 India’s Share in World Imports and Exports(Percentage)
Source: United Nations Comtrade Statistics.

requires eliminating barriers to entry. But good policy for both goods and services
also includes judicious regulation, both to remedy market failures and to achieve
social objectives efficiently.
It is clear that multilateral engagement cannot be an end in itself. Domestic
policy priorities cannot be subordinated to the needs of such engagement nor
must domestic reform be held entirely hostage to external bargaining imperatives.
The important question is whether multilateral engagement can be harnessed to
serve the ends of good domestic policies. Can it contribute meaningfully to over-
all policy reform, and if so how?
Multilateral engagement and the consequent international commitments
undertaken by countries necessarily entail a loss in sovereignty—the freedom that
countries possess to make unconstrained choices. Globalization is ultimately a
process of erosion of sovereignty induced by conscious policy actions or forced by
market and technological developments. But sovereignty is not an absolute, over-
whelming consideration that should trump all others. It can be partially and
strategically ceded to further domestic policy reform and to secure an open trad-
ing system, which India, as a large and growing trader, has some ability to shape. A
number of factors argue in favor of a reassessment of India’s approach to sover-
eignty and to the terms of its multilateral engagement.
Engagement as Facilitating Domestic Reform and Enhancing
Access through Credible Bargaining
The GATT/WTO is a quintessentially mercantilist bargaining framework in which
concessions to open each other’s markets are exchanged between economies.
These concessions are legally binding commitments not to make policies affecting
market access more restrictive than a certain stated level. Thus a country may
commit not to raise its tariffs on bananas above 20 percent or commit to allow at
least five foreign banks to enter its market. It is important to recognize that actual
conditions of access may be, and often are, more liberal than those that are legally
bound—actual tariffs on bananas may be only 10 percent and more than five for-
eign banks may be allowed to enter. Traders and investors value both the actual
liberalization of markets and the legal guarantee of access.
To see when multilateral engagement can both facilitate domestic reforms and
make it possible to extract concessions from trading partners, it is useful to exam-
ine three situations.
If a country is wedded to self-sufficiency, as India and other developing coun-
tries were until recently, it cannot be a bargainer. If a country is not willing to
open its markets, it does not have the most obvious means of inducing its trading
partners to do so. Under so-called special and differential treatment, developing
India and the Multilateral Trading System Post-Doha: Defensive or Proactive? 329

countries sought—indeed, could only seek—limited preferential access as suppli-
cants because of their own unwillingness to liberalize, rather than genuine non-
preferential access as equal partners.2
Paradoxically a country credibly committed to reform and able to implement it
successfully cannot be a credible bargainer either. Partner countries can basically
free-ride on the internal commitment knowing that a refusal to engage in bar-
gaining will not alter their market-access interests. The situation does not change
much if a reformer proceeds with liberalization unilaterally but refuses to bind the
openness under the WTO in the hope of extracting concessions because the value
to partner countries of a binding by a credible reformer such as Singapore or
Chile is small, given the low probability of policy reversal.
A third situation, and one that applies to India in the current context, arises in
relation to a willing reformer whose ability to implement reform is constrained by
domestic opposition. In this case, domestic reform could be facilitated if a govern-
ment could demonstrate that domestic opening brought payoffs in terms of
increased access abroad. Those who gain from the increased access—whether
exporters of textiles, software, professional services, or other products—could
represent a countervailing voice to groups (import-competing industries) that are
resistant to reform. How effective such a strategy could be for Indian policymak-
ers is unclear, but selling reform domestically should be that much easier if some
external payoffs can be demonstrated.
China’s agreement with the United States on its accession to the WTO illus-
trates this political economy at work. In fact, in China’s case the external payoff, at
least in the U.S. market, is really not in getting increased access but in securing
existing access because it already receives most-favored-nation (MFN) status in
the United States.3 China considers that its task of domestic reform is easier to sell
and implement merely by pointing to the increased security of existing access.
Crucially, the need for improved foreign access to facilitate domestic reform
(by easing the domestic political constraints) makes a country a more credible
bargainer and enables it to extract more meaningful concessions from trading
partners.4 Such a country can credibly say, “if I get less, I can deliver less domestic
liberalization” in a manner that neither an unwilling reformer nor a wholly credi-
ble reformer can say.
We would underscore here that the possibility of bargaining does not imply
that unilateral reform should be delayed or held back to secure market access ben-
efits. Indeed, much of the reform is likely to be implemented unilaterally. How-
ever, this process can be facilitated by multilateral engagement, and, to that extent,
the latter becomes important to address.
The distinction made above between alternative situations is important
because there are some people who argue that India should focus on pushing
330 India and the WTO
domestic reform without necessarily deepening its multilateral engagement. “Lib-
eralize tariffs and investment unilaterally but don’t necessarily bind them” is a
typical line taken by such observers. To us, such a view is founded on a simplistic
or overly sanguine view about the prerequisites for successful reform. It renounces
the use of forces that could be harnessed to secure domestic reform. And it for-
sakes the possibility of credibly extracting concessions from trading partners.
Engagement as Commitment to Good Policies
Of course there is some value to multilateral engagement and ceding sovereignty
even if concessions cannot be extracted from partners. Sovereignty or the freedom
to choose could be the freedom to choose badly. Indian trade policymaking has been
a sad testament to poor, unconstrained choices that might have benefited from
being constrained. Such constraints foster good policies in two respects: by provid-
ing guarantees against reversal of current policies and by facilitating future reform.
Even if we ignore the dirigiste days of the 1960s and 1970s, there have been
instances of policy reversal that might have benefited from some loss of sover-
eignty via a previous commitment to good policy. Despite undertaking commit-
ments to bind tariffs in the Uruguay Round in 1994, India availed itself of large
amounts of flexibility in the form of the wedge between the bound tariff and the
actual tariff, particularly in agriculture. In 1996 and 1997, in the face of fiscal pres-
sures, the government decided to raise tariffs and use up some of the water in the
tariff. From the government’s perspective, the decision to provide for a cushion or
a maneuvering margin was vindicated by its subsequent actions. But from a wel-
fare perspective, this freedom that the government had was counterproductive.
Had the Uruguay Round bindings been really binding, they would have forced the
government to choose a superior instrument—one that was neutral between
imports and domestically produced goods—to meet its fiscal needs.5
One reason for the reluctance of the government to liberalize immediately is
the perceived need to protect the incumbent domestic suppliers from immediate
competition—either because of the infant-industry type of argument or to facili-
tate “orderly exit.” And one reason for the failure of infant-industry policies in the
past, and the innumerable examples of perpetual infancy, was the inability of the
government to commit itself credibly to liberalize at some future date—either
because it has a stake in the national firm’s continued operation or because it is
vulnerable to pressure from interest groups that benefit from protection. The
WTO offers a valuable mechanism to overcome this difficulty. In the services
negotiations, for instance, many governments precommitted to future liberaliza-
tion, thus striking a balance between the reluctance to unleash competition
immediately and the desire not to be held hostage in perpetuity to the weakness of
India and the Multilateral Trading System Post-Doha: Defensive or Proactive? 331
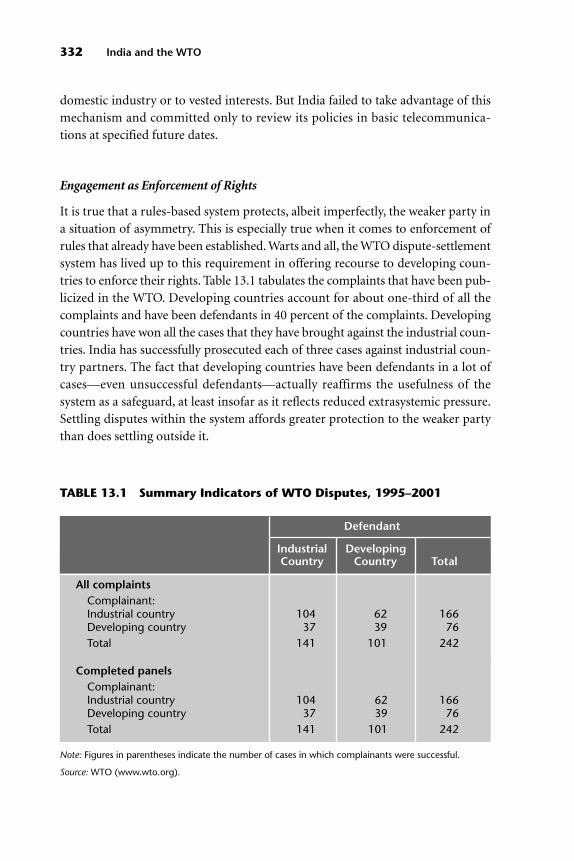
domestic industry or to vested interests. But India failed to take advantage of this
mechanism and committed only to review its policies in basic telecommunica-
tions at specified future dates.
Engagement as Enforcement of Rights
It is true that a rules-based system protects, albeit imperfectly, the weaker party in
a situation of asymmetry. This is especially true when it comes to enforcement of
rules that already have been established. Warts and all, the WTO dispute-settlement
system has lived up to this requirement in offering recourse to developing coun-
tries to enforce their rights. Table 13.1 tabulates the complaints that have been pub-
licized in the WTO. Developing countries account for about one-third of all the
complaints and have been defendants in 40 percent of the complaints. Developing
countries have won all the cases that they have brought against the industrial coun-
tries. India has successfully prosecuted each of three cases against industrial coun-
try partners. The fact that developing countries have been defendants in a lot of
cases—even unsuccessful defendants—actually reaffirms the usefulness of the
system as a safeguard, at least insofar as it reflects reduced extrasystemic pressure.
Settling disputes within the system affords greater protection to the weaker party
than does settling outside it.
332 India and the WTO
TABLE 13.1 Summary Indicators of WTO Disputes, 1995–2001
Defendant
Industrial DevelopingCountry Country Total
All complaintsComplainant: Industrial country 104 62 166Developing country 37 39 76Total 141 101 242
Note: Figures in parentheses indicate the number of cases in which complainants were successful.
Source: WTO (www.wto.org).
Completed panelsComplainant: Industrial country 104 62 166Developing country 37 39 76Total 141 101 242
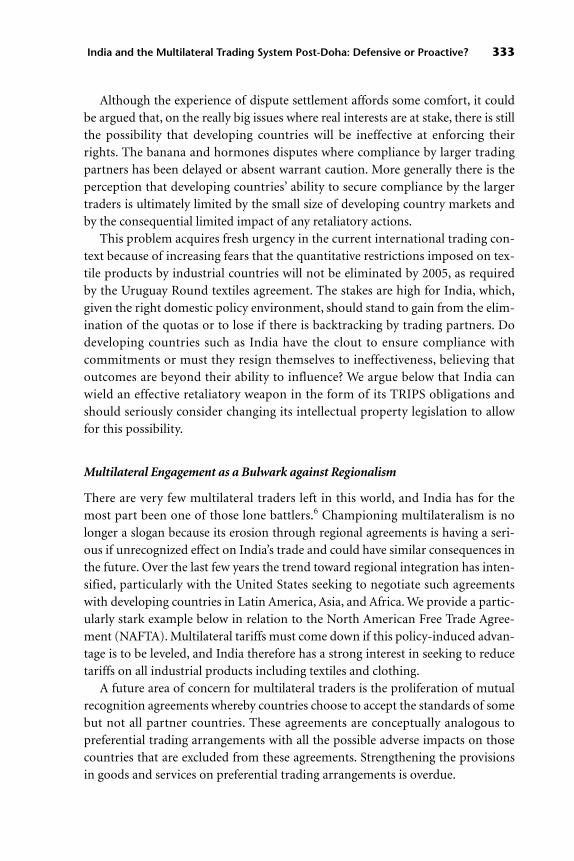
Although the experience of dispute settlement affords some comfort, it could
be argued that, on the really big issues where real interests are at stake, there is still
the possibility that developing countries will be ineffective at enforcing their
rights. The banana and hormones disputes where compliance by larger trading
partners has been delayed or absent warrant caution. More generally there is the
perception that developing countries’ ability to secure compliance by the larger
traders is ultimately limited by the small size of developing country markets and
by the consequential limited impact of any retaliatory actions.
This problem acquires fresh urgency in the current international trading con-
text because of increasing fears that the quantitative restrictions imposed on tex-
tile products by industrial countries will not be eliminated by 2005, as required
by the Uruguay Round textiles agreement. The stakes are high for India, which,
given the right domestic policy environment, should stand to gain from the elim-
ination of the quotas or to lose if there is backtracking by trading partners. Do
developing countries such as India have the clout to ensure compliance with
commitments or must they resign themselves to ineffectiveness, believing that
outcomes are beyond their ability to influence? We argue below that India can
wield an effective retaliatory weapon in the form of its TRIPS obligations and
should seriously consider changing its intellectual property legislation to allow
for this possibility.
Multilateral Engagement as a Bulwark against Regionalism
There are very few multilateral traders left in this world, and India has for the
most part been one of those lone battlers.6 Championing multilateralism is no
longer a slogan because its erosion through regional agreements is having a seri-
ous if unrecognized effect on India’s trade and could have similar consequences in
the future. Over the last few years the trend toward regional integration has inten-
sified, particularly with the United States seeking to negotiate such agreements
with developing countries in Latin America, Asia, and Africa. We provide a partic-
ularly stark example below in relation to the North American Free Trade Agree-
ment (NAFTA). Multilateral tariffs must come down if this policy-induced advan-
tage is to be leveled, and India therefore has a strong interest in seeking to reduce
tariffs on all industrial products including textiles and clothing.
A future area of concern for multilateral traders is the proliferation of mutual
recognition agreements whereby countries choose to accept the standards of some
but not all partner countries. These agreements are conceptually analogous to
preferential trading arrangements with all the possible adverse impacts on those
countries that are excluded from these agreements. Strengthening the provisions
in goods and services on preferential trading arrangements is overdue.
India and the Multilateral Trading System Post-Doha: Defensive or Proactive? 333
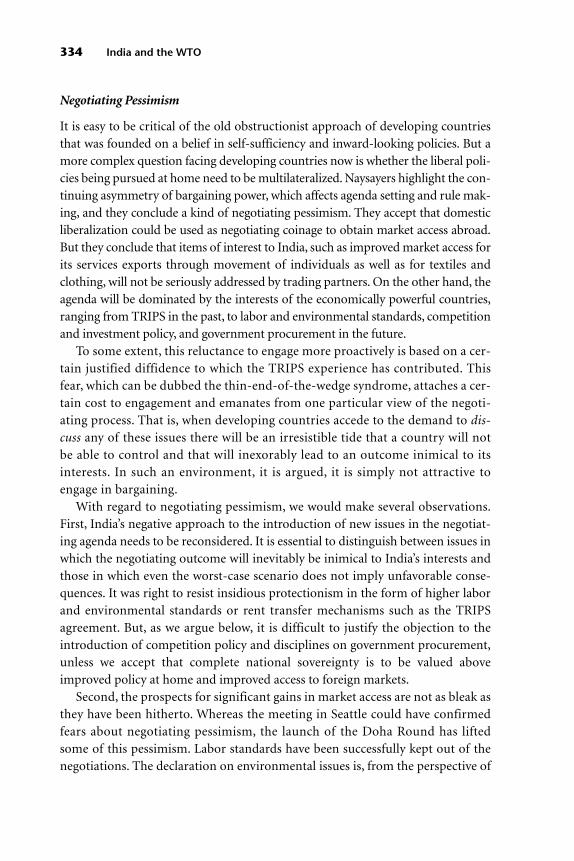
Negotiating Pessimism
It is easy to be critical of the old obstructionist approach of developing countries
that was founded on a belief in self-sufficiency and inward-looking policies. But a
more complex question facing developing countries now is whether the liberal poli-
cies being pursued at home need to be multilateralized. Naysayers highlight the con-
tinuing asymmetry of bargaining power, which affects agenda setting and rule mak-
ing, and they conclude a kind of negotiating pessimism. They accept that domestic
liberalization could be used as negotiating coinage to obtain market access abroad.
But they conclude that items of interest to India, such as improved market access for
its services exports through movement of individuals as well as for textiles and
clothing, will not be seriously addressed by trading partners. On the other hand, the
agenda will be dominated by the interests of the economically powerful countries,
ranging from TRIPS in the past, to labor and environmental standards, competition
and investment policy, and government procurement in the future.
To some extent, this reluctance to engage more proactively is based on a cer-
tain justified diffidence to which the TRIPS experience has contributed. This
fear, which can be dubbed the thin-end-of-the-wedge syndrome, attaches a cer-
tain cost to engagement and emanates from one particular view of the negoti-
ating process. That is, when developing countries accede to the demand to dis-
cuss any of these issues there will be an irresistible tide that a country will not
be able to control and that will inexorably lead to an outcome inimical to its
interests. In such an environment, it is argued, it is simply not attractive to
engage in bargaining.
With regard to negotiating pessimism, we would make several observations.
First, India’s negative approach to the introduction of new issues in the negotiat-
ing agenda needs to be reconsidered. It is essential to distinguish between issues in
which the negotiating outcome will inevitably be inimical to India’s interests and
those in which even the worst-case scenario does not imply unfavorable conse-
quences. It was right to resist insidious protectionism in the form of higher labor
and environmental standards or rent transfer mechanisms such as the TRIPS
agreement. But, as we argue below, it is difficult to justify the objection to the
introduction of competition policy and disciplines on government procurement,
unless we accept that complete national sovereignty is to be valued above
improved policy at home and improved access to foreign markets.
Second, the prospects for significant gains in market access are not as bleak as
they have been hitherto. Whereas the meeting in Seattle could have confirmed
fears about negotiating pessimism, the launch of the Doha Round has lifted
some of this pessimism. Labor standards have been successfully kept out of the
negotiations. The declaration on environmental issues is, from the perspective of
334 India and the WTO

a developing country, fairly narrow. There is a commitment on the part of indus-
trial countries to contemplate market opening in agriculture. Recently the
United States proposed the complete elimination of tariffs on industrial prod-
ucts. There is a political reaffirmation that TRIPS should not impede access to
essential medicines. Significantly, there is increasing recognition of the common-
ality of interests among industrial countries facing demographic challenges in
the form of aging populations and rising dependency ratios, and developing
countries in relation to the temporary movement of labor. And although a range
of new issues—competition, investment, and government procurement—have
been put on the negotiating agenda, we argue that these are not obviously issues
that India should be defensive about. Of course there have been some disap-
pointments—namely, the lack of commitment by industrial countries to con-
sider or commit to faster and deeper liberalization in the textiles and clothing
sectors. But, on balance, the Doha Ministerial Conference marks a notable
change in the negotiating environment.
Negotiating pessimism is therefore an empirical proposition that needs to be
tested seriously. India has never really done so because of its own unwillingness to
make concessions and open its markets. And, internationally, India has aligned
itself consistently with countries that have argued for closed rather than open
policies. The way to test negotiating pessimism and even ameliorate it is for India
to align itself with coalitions that form on a shared premise of liberal policies.
Coalitions need not be fixed but could vary, depending on the issue. For example,
India’s natural allies should be the Cairns group in agriculture, Japan and Hong
Kong (China) on antidumping, and the European Union (EU) on investment and
competition policies.
Of course there is no guarantee of success in the short term. In the longer term,
however, good arguments and proliberalization coalitions can be successful.
Moreover, if India is identified as a strong and clear voice in favor of open com-
petitive markets, its opposition to disguised protectionism in the form of inclu-
sion of labor or environmental standards will be more credible. The opposition
will be seen as founded on substance rather than ritual defensiveness. Under such
circumstances India should now take advantage of the negotiations to try to
secure the kind of outcomes outlined below on each of the issues based on a
recognition of its interest in an open trading system.
Issues in Selected Sectors7
This section analyzes the issues that have emerged in some of the negotiating areas
in the WTO.
India and the Multilateral Trading System Post-Doha: Defensive or Proactive? 335
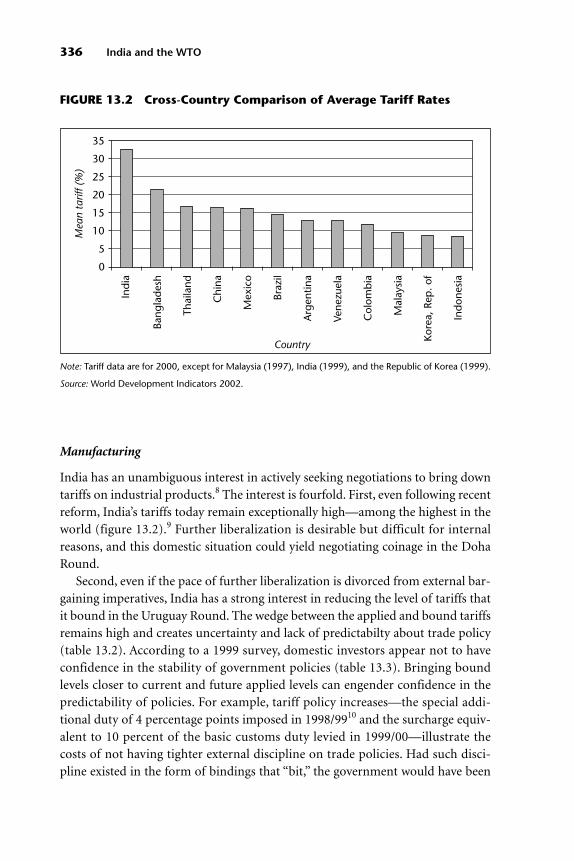
Manufacturing
India has an unambiguous interest in actively seeking negotiations to bring down
tariffs on industrial products.8 The interest is fourfold. First, even following recent
reform, India’s tariffs today remain exceptionally high—among the highest in the
world (figure 13.2).9 Further liberalization is desirable but difficult for internal
reasons, and this domestic situation could yield negotiating coinage in the Doha
Round.
Second, even if the pace of further liberalization is divorced from external bar-
gaining imperatives, India has a strong interest in reducing the level of tariffs that
it bound in the Uruguay Round. The wedge between the applied and bound tariffs
remains high and creates uncertainty and lack of predictabilty about trade policy
(table 13.2). According to a 1999 survey, domestic investors appear not to have
confidence in the stability of government policies (table 13.3). Bringing bound
levels closer to current and future applied levels can engender confidence in the
predictability of policies. For example, tariff policy increases—the special addi-
tional duty of 4 percentage points imposed in 1998/9910 and the surcharge equiv-
alent to 10 percent of the basic customs duty levied in 1999/00—illustrate the
costs of not having tighter external discipline on trade policies. Had such disci-
pline existed in the form of bindings that “bit,” the government would have been
336 India and the WTO
0
5
10
15
20
25
30
35
Indi
a
Bang
lade
sh
Thai
land
Chi
na
Mex
ico
Braz
il
Arg
entin
a
Vene
zuel
a
Col
ombi
a
Mal
aysi
a
Kore
a, R
ep. o
f
Indo
nesi
a
Country
Mea
n ta
riff (
%)
FIGURE 13.2 Cross-Country Comparison of Average Tariff Rates
Note: Tariff data are for 2000, except for Malaysia (1997), India (1999), and the Republic of Korea (1999).
Source: World Development Indicators 2002.

India and the Multilateral Trading System Post-Doha: Defensive or Proactive? 337
TABLE 13.2 Bound Tariff Rates and Effective Rates of Duty
a. Following the reform package contained in the 1993/94 budget. The auxiliary duty was merged withthe basic customs duty in the 1993/94 budget.
b. Effective MFN rate (i.e., actual rates applied where basic rates have been reduced by exempt rates).However, many exempt rates cannot be incorporated, such as where the exempt rate applies to only apart of the Harmonized Commodity Description and Coding System six-digit tariff line. The effectiverate also excludes specific exemptions.
c. Included only items bound during the Uruguay Round. The bound rates do not include thecommitments under the Information Technology Agreement.
Note: Standard deviation is provided in parentheses. Tariff averages consider only those tariff lines withad valorem rates (year beginning April 1).
Sources: UNCTAD, World Bank, Government of India, and selected WTO Secretariat estimates.
Effective Effective Effective Bound Rate of Rate of Rate of Rate ofDutya Dutyb Duty Dutyc by
1993/94 1997/98 2001/02 Year 2005
Average unweighted tariff (percent)Agriculture 43 26 (16) 33 94 (33)Mining 70 25 (13) 22 36 (9)Manufacturing 73 36 (10) 33 52 (41)Whole economy 71 35 (15) 32 54 (42)
Average unweighted tariff by stage of processing (percent)Unprocessed 50 25 (16) 29 74 (40)Semiprocessed 75 35 (9) 32 44 (23)Processed 73 37 (17) 33 56 (51)
forced to raise revenues through alternative, trade-neutral, and hence less costly
measures.
Third, reductions in tariffs by partner countries will have important market-
access effects for India. Further reductions, particularly in tariffs on textiles and
clothing, are likely to improve India’s terms of trade and to yield sizable welfare
benefits. One particularly important aspect of these market access effects—and
perhaps the most compelling reason for seeking cuts in tariffs in the textiles,
clothing, and leather sectors—relates to trade diversion. In the current environ-
ment such reductions are necessary to arrest the trade diversion that MFN traders
such as India have suffered as a result of regional agreements. We present one
example—in relation to NAFTA in figure 13.3—that brings this impact home
starkly. It is likely that there are similar effects in the EU market stemming from
preferential arrangements between the EU on the one hand and Eastern European
and Mediterranean countries on the other.

Figure 13.3 shows the evolution in India’s and Mexico’s exports to the United
States before and after NAFTA. Between 1994 and 2001, Mexico’s manufacturing
exports to the United States and Canada grew by about US$70 billion, whereas
India registered an increase of US$5 billion. In clothing, where India is ensured a
certain absolute quantitative outcome by virtue of the Multifibre Arrangement
(MFA) quotas, India’s share of total U.S. and Canadian imports declined after
NAFTA: between 1994 and 2001, India’s share declined by 0.5 percentage points,
from 3.9 to 3.4 percent. Over the same period Mexico’s share rose from 4.7 percent
to 11.0 percent, an increase of more than 6.0 percentage points, translating into
US$7 billion of additional exports. In the case of clothing, NAFTA opened up a
preference margin for Mexico equal to the implicit tariff on India’s export quotas.
Even after the abolition of the MFA, when the implicit tariff comes down, the
margin of preference will decline but will remain substantial—between 15 and
40 percent, depending on the product line. MFN tariffs must come down if this
policy-induced advantage is to be leveled. India therefore has a strong interest in
seeking to reduce tariffs on all industrial products, especially textiles and clothing.
Can these trade diversion costs be offset through alternative means (e.g., by
disciplining the use of GATT Article XXIV? This is unlikely for two reasons: first,
there already are too many large preferential traders who are likely to resist the
338 India and the WTO
TABLE 13.3 Predictability, Responses, and Availability of Rules and Regulations(Percentage of respondent ratings under different categories)
AverageStrongly Slightly Slightly Strongly Score
Agree Agree Agree Disagree Disagree Disagree 1999
Score 6 5 4 3 2 1
Predictability of government rules and regulations 2 7 46 29 12 4 3.46
Predictability ofpolicy changes in the annual central budget 2 3 45 33 9 8 3.32
Advance infor-mation to firms about the changes affecting them 0 18 11 35 25 11 3.00
Source: CII survey of 210 private sector firms (World Bank 2000).

fundamental changes to Article XXIV that are necessary to address the trade
diversion inflicted on third countries. Second, even if these changes can be
effected, they will not be applied retroactively. The effects of all past regional
agreements, including NAFTA and the EU-Eastern European agreements, cannot
be undone through rulemaking; they will have to be addressed by eliminating the
trade-diverting effects of regionalism at the source—the MFN tariff.
India and the Multilateral Trading System Post-Doha: Defensive or Proactive? 339
140,000
120,000
100,000
80,000
60,000
40,000
20,000
02000
Manufacturing Exports to theUnited States and Canada
Manufacturing Exports to theUnited States and Canada
19981996
Year Year199419921990
Valu
e of
exp
orts
(U
S$ m
illio
ns)
0
2
4
6
8
10
12
Mar
ket
shar
e (%
)200019981996199419921990
India MexicoIndia Mexico NAFTA
10,000
9,000
8,000
7,000
6,000
5,000
4,000
3,000
2,000
1,000
02000
Clothing Exports to the United Statesand Canada
Clothing Exports to the United Statesand Canada
19981996
Year199419921990
Valu
e of
exp
orts
(U
S$ m
illio
ns) 14
0
2
4
6
8
10
12
Mar
ket
shar
e (%
)
India Mexico
200019981996
Year199419921990
India Mexico
FIGURE 13.3 Exports of India and Mexico to the North AmericanMarket, 1990–2001
Source: United Nations Comtrade Statistics.
Agriculture
Agriculture11 illustrates most starkly the disjunction between India’s domestic
policies and its external negotiating position. High tariffs for manufacturing,
combined until recently with restrictions on exports of agricultural products,
have led to an incentive structure that taxes rather than protects agriculture. And
although manufacturing tariffs have been reduced and most export restrictions
have been eliminated, manufacturing continues to be favored relative to agricul-
ture. India’s multilateral position, however, is one of defensiveness seeking the
freedom to protect rather than exploiting actual and potential comparative
advantage by seeking an open regime internationally.
India’s average applied tariffs in agriculture are 33 percent whereas bound rates in
the WTO are 94 percent, a wedge of 61 percentage points (table 13.2). In about
83 percent of agricultural tariff lines, the wedge is greater than 50 percent (table 13.4).
Until the recent tariff increases, major items such as rice, wheat, pulses, and sugar
were virtually fully integrated with world markets (except of course for the export
quantitative restrictions) even though the bound rate was extremely high.12 On
domestic support noted in table 13.4B, the total aggregate measure of support
(AMS) tends to be negative, suggesting taxation rather than protection of agricul-
ture. On export competition, until recently Indian agricultural exporters did not
receive any direct export subsidies. However, there was some support in the form of
exemption of agricultural export profits from income tax and subsidies on freight
and for certain floricultural and horticultural exports.
At the same time, India has significant actual and potential agricultural exports
in rice, sugar, dairy products, cotton, and processed foods, and in the long run
even in cereals. These exporting possibilities will be more fully realized as the dis-
crimination against agriculture is fully eliminated.
This combination of a relatively unprotected domestic regime and potential
comparative advantage means that India has a real interest in seeking to eliminate
protection in international agricultural markets. India’s sugar and dairy exporters
have already expressed a serious interest in reducing barriers to their exports. As
in manufacturing, India also suffers from the preferences granted to competing
suppliers in sectors such as sugar. It therefore has a real interest in reducing agri-
cultural tariffs as well.
And yet, India’s position is defensive, continuing to focus on the freedom to
safeguard food security.13 The country should seriously consider aligning itself
with the Cairns group of agricultural exporters consistent with an overall strategy
of forming coalitions based on a liberalizing ideology. In this regard, many of the
specific proposals presented in Gulati (1999), including the elimination of export
subsidies, elimination of tariff quotas, moving from aggregate AMS to product-
specific commitments, and disciplining blue box measures,14 merit consideration.
340 India and the WTO

India and the Multilateral Trading System Post-Doha: Defensive or Proactive? 341
TABLE 13.4 Indicators of Indian Agricultural Trade
A. Difference in Uruguay Round Final Bound Rates and MFNTariff Rates, Number of Lines by Different Range Groups
Range (UR-TR) Number of Linesa
UR-TR ≥ 75 40150 ≤ UR-TR < 75 15525 ≤ UR-TR < 50 2910 ≤ UR-TR < 25 390 ≤ UR-TR < 10 41UR-TR < 0 8Total 673
TR = MFN tariff rate as announced in the Government of India Budget 1999/00.UR = Uruguay Round final bound rates.
a. Tariff Lines at six-digit Harmonized Commodity Description and Coding System (HS) or subgroups ofsix-digit HS including only agricultural products.
B. Aggregate Measure of Support to Indian Agriculture(Selected Crops)
Product Nonproduct Specific Support Specific Support Total AMS(as % of Value of (as % of Value of (as % of Value of
Year Agricultural Output) Agricultural Output) Agricultural Output)
1986 –34.29 2.25 –32.041987 –32.08 3.2 –28.881988 –35.54 3.32 –32.221989 –36.97 3.39 –33.581990 –31.78 3.36 –28.421991 –62.23 3.6 –58.631992 –69.31 3.46 –65.851993 –54.75 3.14 –51.611994 –43.27 3.4 –39.871995 –44.09 3.9 –40.191996 –45.84 3.62 –42.221997 –32.16 4.12 –28.041998 –41.89 3.49 –38.4
Source: Gulati 1999.
Intellectual Property15
The main issues in TRIPS are using TRIPS as a device for ensuring partner country
compliance; developing domestic policies and institutions to offset some of the
more egregious effects of TRIPS16 and harness the benefits of intellectual property
(IP) protection in other areas; and developing mechanisms for national and inter-
national protection for IP produced in India.17
TRIPS as an Enforcement Device How can the commitment by industrial
countries to remove all the MFA textile quotas (“walk off the cliff”) on January 1,
2005, be enforced? The answer seems to be that if the industrial countries renege
on their commitment in textiles, developing countries should withdraw or threaten
to withdraw their TRIPS obligations. In principle, cross-retaliation in TRIPS could
be a weapon for developing countries, but the peculiarities of IP make it more dif-
ficult than in other areas.18 In a recent proposal (Subramanian and Watal [2000]
and Chapter 8 in this volume), it is argued that such cross-retaliation, if designed
with care, can be feasible, effective, and probably legal.
The essence of the proposal is that India should alter its IP legislation to spec-
ify that the Indian executive retains the right to revoke some of the IP rights of
foreign patent owners in the event that partner countries fail to comply with com-
mitments that affect India’s market access. Specifying that this revocation would
only be pursuant to a WTO authorization to retaliate would preserve its WTO
legality. Several options present themselves in terms of the form and timing of the
revocation. However, one question that needs to be considered is whether current
rules that allow retaliation across sectors only as a final resort circumscribe the
ability of countries to use such retaliation effectively. India should be able to argue
that retaliation within goods for noncompliance by partners in goods is not “prac-
ticable.” Retaliation in TRIPS has the attractive property that, if implemented, it
would be welfare enhancing and therefore credible and practicable. The ability to
use TRIPS as a retaliation device would also address broader concerns about the
asymmetry of the WTO dispute-settlement process and the lack of retaliatory
power for developing countries.19
Developing Domestic Policies and Institutions The two most important pol-
icy instruments available to India to mitigate some of the effects of the high levels
of patent protection are compulsory licensing and competition policies. India
therefore needs both to implement its new competition policy (see Chapter 9 in
this volume) and to develop the capability to use compulsory licensing effectively.
The flexibility afforded by compulsory licensing comes in two forms. First, coun-
tries are virtually unrestricted in the circumstances under which they can grant
342 India and the WTO

compulsory licenses.20 Second, although a number of conditions need to be ful-
filled when these licenses are granted, it is possible for national authorities to meet
those conditions and yet dilute the monopolistic impact of the proprietary pro-
tection granted in the first place (Watal 2000).
The advantages of deploying competition policy are twofold. First, there is
some latitude in determining the optimal degree of protection that balances the
need to foster innovation while ensuring technological diffusion and consumer
protection. For example, what constitutes abusive pricing is a question that will
admit a wide variety of answers.
The second advantage follows from the language of the TRIPS agreement.
There is even greater flexibility in the use of compulsory licenses—in two key
respects—when they are granted to remedy anticompetitive practices,21 which
could be harnessed usefully by India.
A really crucial public policy issue that arises in relation to use of new tech-
nologies (biotechnology, including genetic modification) is how to harness their
benefits while minimizing the attendant risks to consumer safety, biodiversity,
health, and the environment. In India, as in other countries, opposition to the use
of these technologies can be vocal and sometimes extreme. But if these concerns
are to be addressed, there must be a domestic regulatory body and process that
makes informed and transparent public policy choices and commands public
trust. Existing institutions need to be strengthened along the lines of the Food and
Drug Administration (FDA) in the United States.
Indian Intellectual Property: Genetic Resources, Indigenous Knowledge, andGeographical Indications India and other developing countries have made sen-
sible proposals seeking greater protection for “intellectual property” generated in
these countries in the form of indigenous knowledge and geographical indica-
tions.22 But a challenging agenda of research and policy lies ahead. How extensive
are genetic resources and indigenous knowledge and to what uses can they be put?
How important is the potential economic value of these resources? And, finally,
how should a proprietary right be created that is enforceable internationally, and
that rewards agents, including traditional communities, for preserving and creat-
ing such resources and knowledge? Similar questions arise in relation to geograph-
ical indications. How can names in the public domain be restored to proprietary
protection? In these areas a credible international negotiating position can be built
if such systems of protection are instituted within India and shown to be workable.
In relation to the new technologies, India’s involuntary response seems to be to
favor low levels of protection—for plant varieties and biotechnological inven-
tions. But this is not a position that is based on underlying research. A case could
be made that stronger proprietary protection in these areas could generate some
India and the Multilateral Trading System Post-Doha: Defensive or Proactive? 343
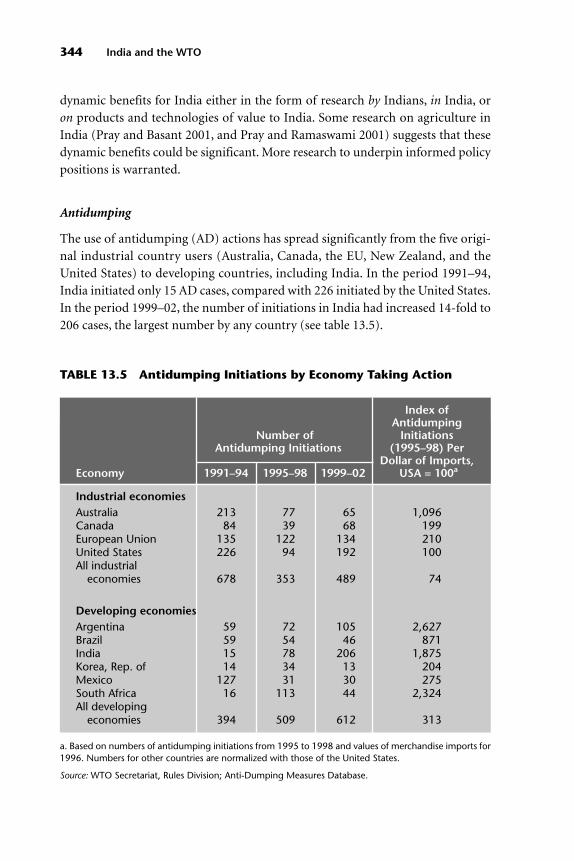
dynamic benefits for India either in the form of research by Indians, in India, or
on products and technologies of value to India. Some research on agriculture in
India (Pray and Basant 2001, and Pray and Ramaswami 2001) suggests that these
dynamic benefits could be significant. More research to underpin informed policy
positions is warranted.
Antidumping
The use of antidumping (AD) actions has spread significantly from the five origi-
nal industrial country users (Australia, Canada, the EU, New Zealand, and the
United States) to developing countries, including India. In the period 1991–94,
India initiated only 15 AD cases, compared with 226 initiated by the United States.
In the period 1999–02, the number of initiations in India had increased 14-fold to
206 cases, the largest number by any country (see table 13.5).
344 India and the WTO
TABLE 13.5 Antidumping Initiations by Economy Taking Action
a. Based on numbers of antidumping initiations from 1995 to 1998 and values of merchandise imports for1996. Numbers for other countries are normalized with those of the United States.
Source: WTO Secretariat, Rules Division; Anti-Dumping Measures Database.
Index ofAntidumping
Number of Initiations Antidumping Initiations (1995–98) Per
Dollar of Imports, Economy 1991–94 1995–98 1999–02 USA = 100a
Industrial economiesAustralia 213 77 65 1,096Canada 84 39 68 199European Union 135 122 134 210United States 226 94 192 100All industrial
economies 678 353 489 74
Developing economiesArgentina 59 72 105 2,627Brazil 59 54 46 871India 15 78 206 1,875Korea, Rep. of 14 34 13 204Mexico 127 31 30 275South Africa 16 113 44 2,324All developing
economies 394 509 612 313

Concurrently, India is a major victim of AD actions—in fact, one of the worst
hit if measured in terms of AD actions per dollar of exports (table 13.6). Whereas
the loss associated with the latter resonates easily with policymakers and the pub-
lic, the domestic use of AD also represents a major threat.
The only justifiable use of AD—to correct predatory price behavior by foreign-
ers—requires exporters to have market power. This is implausible in the Indian
context because in a number of AD actions there were imports from 20 or more
countries. In those cases where suppliers were few, discipline was present in the
form of rival domestic firms (see World Bank 2000).
Given the fact that the cost of protection increases at an increasing rate, AD
action by India is worse in its impact than elsewhere because it is levied on top of
tariffs that are high and certainly higher than for other AD users. AD could turn
out to be the nocturnal Penelope: undoing the liberalization unleashed by the tar-
iff reductions. Furthermore, the experience in other countries has been that AD
actions are typically taken against the most efficient suppliers. This in turn signals
other exporters to raise prices, thereby inflicting terms-of-trade losses.
India and the Multilateral Trading System Post-Doha: Defensive or Proactive? 345
TABLE 13.6 Antidumping Initiations by Exporting Economy
a. Numbers for other countries are normalized with those of the United States.
Source: WTO Secretariat, Rules Division; Anti-Dumping Measures Database.
Index ofAntidumping
Number of Initiations Antidumping Initiations (1995–98) Per
Dollar of Exports, Economy 1991–94 1995–98 1999–02 US = 100a
Industrial economiesFrance 26 8 13 34Germany 35 30 28 70Italy 16 16 14 77Japan 32 23 46 67United Kingdom 20 16 18 74United States 70 48 42 100
Developing economiesBrazil 50 23 38 585China 115 94 154 751India 24 21 43 779Korea, Rep. of 50 40 81 385Taiwan, China 31 30 323Thailand 26 21 50 451
The serious costs of AD to India both as victim and as perpetrator mean that it
should push strongly for the reform of AD provisions. The most intellectually
coherent approach would be to fold AD into competition law provisions on preda-
tion that would provide the appropriate safeguards against protectionist use of AD.
Alternatively, AD laws should be required to incorporate buyer and consumer inter-
ests and provide meaningful representation for such interests in AD proceedings.
India’s proposals have focused on specific provisions and have amounted to tin-
kering at the margin rather than eradicating the menace altogether.
Services23
As already mentioned, India’s posture in international trade negotiations has been
surprisingly defensive despite the significant autonomous reforms of recent years
and the growing stake in more open markets abroad. The main reasons have been
the desire to retain discretion in the design of domestic reform, and pessimism
about whether multilateral trade negotiations can deliver improved access in areas
of export interest. The most important initiatives undoubtedly need to be taken at
the domestic level, but there remains scope for constructive use of the multilateral
trading system both in realizing credible domestic liberalization and in securing
market access abroad.
India’s Uruguay Round (1993–94) commitments on services were conservative,
reflecting not even the limited openness that prevailed then and quite far from the
liberalization that has taken place in recent years. The government will need to
decide whether to offer to bind the current regime and, more important, whether
to liberalize further either unilaterally or as part of the Doha negotiations. The
challenge is to ensure that these decisions reflect good economic policy rather
than the dictates of political economy or negotiating pressure. It is useful, there-
fore, to recall what we have learned about services trade liberalization:
• There are substantial gains both from successful domestic liberalization, espe-
cially in key infrastructure services like telecommunications, transport, and
financial services, and from improved access to foreign markets.
• Successful domestic liberalization requires:
• Emphasis on competition more than a change of ownership
• Credibility of policy and liberalization programs
• Domestic regulations to remedy market failure and pursue legitimate social
goals efficiently.
• Effective market access requires:
• Elimination of explicit restrictions
• Disciplines on implicit regulatory barriers.
346 India and the WTO

Priorities for Domestic Reform In the past, the untrammelled freedom to choose
policy in services led to restrictive policy choices. In each of the three key infrastruc-
ture sectors—transport, telecommunications, and financial services—there was a
reluctance to introduce meaningful competition through unimpeded entry. Limited
liberalization to foreign participation was grudgingly allowed with limitations on
both equity and numbers, thus perpetuating imperfectly competitive structures.
There were significant policy reversals, for example, in power and telecommunica-
tions, with resultant loss to policy credibility. Moreover, the multilateral route was not
used to any significant extent to liberalize or to precommit to future liberalization.
In the last few years there have seen significant changes in policy. It is fortunate
that in basic telecommunications a complex policy of dividing the country into
distinct duopolistic markets for fixed telephony has been abandoned. The
Telecommunications Policy of 1999 announced the elimination of all restrictions
on entry in the local, domestic long-distance (since August 2000), and interna-
tional segments (since April 2002) (see Chapter 5 of this volume). The liberal-
ization has resulted in a significant reduction in prices, although they are still
high even compared with those of other developing countries (see figure 13.4).
India and the Multilateral Trading System Post-Doha: Defensive or Proactive? 347
0
1
2
3
4
5
6
7
Chi
na
Indi
a
Indo
nesi
a
Kore
a, R
ep. o
f
Mal
aysi
a
Sing
apor
e
Country
Pric
e pe
r th
ree
min
utes
(U
S$)
1996 Current
FIGURE 13.4 Comparison of International Long-Distance Tariffs(Telecom) for Selected Asian Countries, 2002
Source: World Bank Trade in Services Database.

The one remaining restriction is on foreign ownership, which is still limited in
basic telecommunications to a maximum of 49 percent.
There has also been liberalization in maritime transport services. There is now
no restriction on foreign investment in either shipping or ports. The pretense of
adhering to the restrictive United Nations Conference on Trade and Development
(UNCTAD) liner code for cargo sharing has been abandoned, even though ship-
pers are still obliged to use domestic flagged vessels if they charge internationally
competitive prices. The air transport regime for passenger transportation is, how-
ever, far less liberal than that for freight. Although there are no restrictions on for-
eign direct investment (FDI) in the latter segment, FDI in the former is limited to
40 percent and investment by foreign airlines is prohibited! Whereas the regime
for cross-border supply of freight services is comparatively open, the passenger
segment is carved up into cosy duopolistic arrangements under various bilateral
air service agreements, as in most other countries. It remains to be seen whether
these recent policy developments will offset the transport cost disadvantage faced
by Indian exporters, for example, of textiles. As figure 13.5 shows, this disadvan-
tage relative to competitors in Asia ranged from 30 to 40 percent.
The picture in financial services is more uneven. Recent liberalization of insur-
ance services eliminated all restrictions on new entry but restricted foreign own-
ership to 26 percent. In banking, branches of foreign banks are still subject to
quantitative restrictions but in the recent 2003–04 budget, the limit on foreign
348 India and the WTO
0.00
5.00
10.00
15.00
20.00
25.00
30.00
35.00
40.00
45.00
India Indonesia Malaysia China
Tran
spor
t co
st m
argi
n as
a r
atio
of
Sing
apor
e tr
ansp
ort
cost
mar
gin
FIGURE 13.5 Estimated Transport Cost Margins for Exports ofTextiles to the United States, Using Singapore as aBenchmark, 2000
Source: Bureau of Economic Analysis and the World Bank.

ownership of domestic banks was raised from 49 percent to 74 percent. Further-
more, the voting rights restriction for any person holding shares of a banking
company to a maximum of 10 percent is apparently going to be removed by a
suitable amendment of the Banking Regulation Act of 1949.
In each of these key services areas, the elimination of restrictions has been
accompanied by a strengthening of regulation. The Telecommunications Regula-
tory Authority of India, formed in 1997, today implements all the provisions of the
WTO’s Reference Paper on regulatory principles for telecommunications, even
though India has not incorporated some in its schedule—such as the provision of
interconnection under nondiscriminatory terms and conditions and the cost-based
setting of rates. New regulators for ports are already in place and in a position to
implement the requirements of the WTO’s model schedule on nondiscriminatory
access to essential port services. The Securities and Exchange Board of India already
implements many of the rules on transparency proposed by the United States in the
current round of services negotiations—such as consultation with stakeholders
prior to the development of new regulations. The new Insurance Development and
Regulatory Authority, established in 2000, is arguably in a position to do the same, as
is the Reserve Bank of India, which regulates banking services.
In sum, India’s domestic policy regime in services has come a long way from
past protectionism.24 Even though some restrictions persist—notably on foreign
ownership in financial and telecommunications services—India is now in a posi-
tion to take a far more aggressive position in services negotiations to deal with for-
eign barriers to its exports. Restrictions on the international movement of its ser-
vice providers severely impede India’s exports of services. Greater freedom of
temporary movement—notionally incorporated in the WTO’s services agreement
but still highly restricted—would enable India and other developing countries to
export not only professional services but also the labor component of construc-
tion, distribution, transport, and a range of other services.25 That India has a
strong comparative advantage in some of the highly skilled and labor-intensive
sectors is beyond doubt and table 13.7 emphasizes this point in the case of soft-
ware services. India also has a growing stake in cross-border exports of a variety of
services, which face few restrictions today but over which hangs the Damocletian
sword of regulatory impediments, like privacy legislation in the EU, and other
forms of creeping protectionism, such as recent restrictions on outsourcing work
on state government contracts in the United States. We consider now how India
can address these impediments in the WTO context.
Securing Market Access: Natural Persons There is no doubt that the Uruguay
Round outcome in services was unbalanced. The much-touted tradeoff between
modes of delivery simply did not take place. Although antipathy to commitments
India and the Multilateral Trading System Post-Doha: Defensive or Proactive? 349

on labor mobility in partner countries was a major contributing factor, an unwill-
ingness on the part of India to open its domestic services markets made its
demands for labor mobility difficult to sustain. With India opening its markets,
that bargaining dynamic can change and the prospects for serious intermodal
tradeoffs—obtaining labor movement in return for allowing increased commer-
cial presence for foreign service providers—must be greater now. Also, severe
shortages of skilled labor in the United States and elsewhere and the powerful
constituency of high-technology companies lobbying for relaxation of visa limits
make this a propitious time to put labor mobility squarely on the negotiating
agenda.26
350 India and the WTO
TABLE 13.7 Cross-Country Comparisons of Costs of Software Services
Cost Per Line Average Salary of of Code (US$) Programmer (US$)
Country Development Support Development Support
Australia n.a. n.a. 34,940 30,644Austria n.a. n.a. 33,000 33,000Brazil n.a. n.a. 20,032 20,032Canada 10 0.6 35,156 33,846China n.a. n.a. 28,266 16,366Colombia n.a. n.a. n.a. 16,000Denmark 19 1.1 n.a. n.a.England 11 0.7 38,785 38,179Estonia n.a. n.a. 12,000 8,000France 13 0.8 36,750 41,250Germany 22 1.3 42,058 34,848Greece 6 0.4 n.a. n.a.India 5 0.3 3,638 4,316Ireland 10 0.6 n.a. n.a.Israel 11 0.6 n.a. n.a.Italy 10 0.6 17,655 17,655Japan 21 1.2 n.a. n.a.Mexico n.a. n.a. 10,843 13,292Netherlands n.a. n.a. 33,994 47,069Scotland n.a. n.a. 24,842 n.a.Switzerland 27 1.6 48,869 48,869United States 18 1.1 46,550 43,395
Note: Data refer to 1996–98 averages.
Source: Adapted from Rubin (1999).

India’s past defensive position on services liberalization impeded the possibil-
ity of credibly advancing India’s labor-related services through intermodal trade-
offs. More specifically, the resistance to the use of horizontal formulas in negotia-
tions and the insistence on a request-and-offer approach may be ill advised.
Mattoo and Olarreaga (2000) have elaborated a specific proposal, based on the use
of formulas, which can serve to extract meaningful commitments on the move-
ment of individual service suppliers from trading partners.
In essence this proposal would require a country to provide increased “foreign
labour content entitlements” to their domestic firms in relation to the country’s
increased exports of services.27 The proposal offers several advantages. First, it is
internationally symmetric. All countries would be obliged to create such entitle-
ments, although how much they are used would be determined by sound eco-
nomic considerations of modal comparative advantage. The entitlements would
be international rather than bilateral. Second, the proposal is based on a balance
of concessions, an appealing principle in trade negotiations. Exporters of labor
services would receive benefits commensurate with efforts to open up their
domestic services markets.
Electronic Commerce
WTO members have decided that electronic delivery of products will continue
to be free from customs duties. For the moment this commitment is temporary
and political, but there are proposals to make it durable and legally binding.
Two aspects of the commitment are notable. First, only electronic transmis-
sions are covered; goods ordered through electronic means but imported
through normal channels are explicitly excluded. Second, the standstill/prohi-
bition applies only to customs duties; there is no mention of other forms of
restrictions.
It is fortunate that most electronic commerce is already free of barriers (except
those created by differences in standards), and so the objective is really to bind this
existing openness to preclude the introduction of new barriers. But is duty-free
electronic commerce the appropriate route?
India was initially opposed to the decision on duty-free treatment for elec-
tronic commerce28 because of concern that it would hurt tariff revenue. More
recently, however, there has been a change in position. Perhaps thanks to the
growing importance of software exports, India has now joined the many countries
that support the existing political decision to make duty-free treatment for elec-
tronic commerce legally binding. We would argue that the initial inhibitions and
the current enthusiasm are both misplaced and do not further India’s real com-
mercial interests.
India and the Multilateral Trading System Post-Doha: Defensive or Proactive? 351

The initial inhibitions were founded on fears of revenue loss. Mattoo and
Schuknecht (2000) estimated the tariff revenue that countries collected from
these products.29 Even if all delivery of digitizable media products moved
online—an unlikely prospect—the revenue loss would be minimal. India would
lose 0.4 percent of tariff revenue and 0.1 percent of total revenue.
The current enthusiasm is equally misplaced because the value of liberating
e-commerce from duties is either superfluous or virtually devoid of value.
Because the bulk of such commerce concerns services, the relevant regime is that
established by the General Agreement on Trade in Services (GATS) regime on
cross-border trade. This agreement allows countries to decide whether to commit
to market access (i.e., not to impose quotas), and to national treatment (i.e., not to
discriminate in any way against foreign services and suppliers). If a country has
already made such a commitment, then any further promise not to impose duties
is superfluous because customs duties inherently discriminate against foreign
services. If a country has not made such a commitment, then the promise not to
impose customs duties is worth little, because a country remains free to impede
access through discriminatory internal taxation—which has been carefully
excluded from the scope of the decision. Worse, the prohibition of such duties
may induce recourse to quotas, which ironically are permissible in spite of being
economically inferior instruments.
Hence, the focus on duty-free treatment is misplaced. The objective for coun-
tries like India should rather be to push trading partners into making deeper and
wider commitments under the GATS on cross-border trade regarding market
access (which would preclude quantitative restrictions) and national treatment
(which would preclude all forms of discriminatory taxation).
Table 13.8 summarizes the current state of commitments on cross-border sup-
ply in some of the areas in which developing countries have an export interest. Of
the total WTO membership of more than 130, only 56 and 54 members, respec-
tively, have made commitments in software implementation and data processing;
and only about half of these commitments guarantee unrestricted market access,
and a similar proportion guarantee unqualified national treatment. In all profes-
sional services there are commitments from 74 members, but less than one-fifth
ensure unrestricted market access and national treatment, respectively. There
clearly remains considerable scope for widening and deepening commitments.
Government Procurement
There are many good reasons to liberalize government procurement. Some bene-
fits are analogous to those arising from the liberalization of trade, but to these
must be added the budgetary benefits of efficient procurement and significant
352 India and the WTO

reductions in rent-seeking, which is rampant in procurement. Thus both the con-
sumer and the taxpayer will benefit. But WTO experience shows that most indus-
trial and developing countries are reluctant to immediately accept full liberaliza-
tion of procurement.
In Chapter 10 of this volume, Srivastava estimates for India that the total value
of purchases by the central and state governments and public enterprises, which
in principle could be subject to international government procurement rules,
varies between 3.5 and 5.9 percent of gross domestic product (GDP). For certain
procurement contracts, a price preference of 15 percent is given to indigenous
equipment suppliers, requiring that at least 20 percent value must be added in
India. In the shipping sector, price preferences up to 30 percent apply to Indian
bidders on procurement contracts. If more efficient procurement practices can be
implemented domestically, Srivastava calculates that the total savings could be as
much as 1.8 percent of GDP or about US$8 billion. Even if only a fraction of the
estimated savings is realized, the gain could be substantial.
It is clear once again that India has exercised the freedom to choose in ways
that are probably very costly for consumers and taxpayers. Even if it had chosen
wisely, it is reasonable to ask whether a multilateral agreement can add to national
legislation that often contains similar provisions to mitigate agency problems.
One of the biggest problems in procurement is that of moral hazard on the part of
the procurer. For instance, a recent survey conducted by the Confederation of
India and the Multilateral Trading System Post-Doha: Defensive or Proactive? 353
TABLE 13.8 GATS Commitments on Modes 1 and 2 in SelectedService Sectors
Note: Full = full commitment; part = partial commitment; no = no commitment.
Percentage may not add up to 100 due to rounding.
Source: Compiled by authors.
Market Access National Treatment
NumberCross-Border Cross-Border
ofSupply (%) Supply (%)
Sector/Subsector Countries Full Part No Full Part No
Professional services 74 19 17 64 14 10 76
Computer and related services
Consultancy service related to the installation of computer hardware 51 57 20 24 51 22 27
Software implementation 56 54 27 20 48 29 23
Data processing 54 54 26 20 46 31 22
Indian Industries shows that procurement contracts frequently involve corrup-
tion. The significant benefit of a multilateral agreement is in helping to overcome
national agency problems in procurement by creating mechanisms for reciprocal
international monitoring supported by multilateral enforcement. It achieves this
by shifting the legal scope for monitoring from dispersed taxpayers, who may have
little interest in monitoring individual procurement decisions, to the bidders for
contracts, who have a significant stake.
Two elements of a possible multilateral agreement are crucial in this context.
First, the agency problem is mitigated by creating obligations on the procurer to
be transparent. Second, foreign suppliers are given the opportunity to challenge
the decisions of the procurer before national courts or independent and impartial
review bodies. As a starting point, it would seem both desirable and feasible for
India to be open to commitments on increased transparency and strengthened
enforcement.30 This is in fact the raison d’être of the Working Group on Trans-
parency in Government Procurement.
In addition to improved domestic policy, government procurement offers the
potential for making negotiating linkages. Foreign suppliers can only effectively
contest the market for government procurement if they are not unduly handi-
capped by restrictive trade measures. Hence, the creation of genuine international
competition for procurement contracts depends crucially on the liberalization of
trade. It would, therefore, be natural for developing countries to make their will-
ingness to accept disciplines on government procurement dependent on future
negotiations on market access for goods and under the GATS on measures affect-
ing trade in services.
For instance, one of the most important service sectors in the context of gov-
ernment procurement is construction. Yet in the GATS, members have usually not
bound themselves to grant market access to the supply of construction services
through the presence of natural persons, except for certain limited categories of
intracorporate transferees. The assurance that workers can be temporarily moved
to construction sites would greatly increase the benefit of nondiscriminatory gov-
ernment procurement for developing countries. The same applies to procurement
of other services, such as software and transport.
Standards and Related Domestic Regulations
Effective market access for both goods and services requires the elimination not
only of explicit restrictions, but also of implicit barriers created by standards and
other domestic regulations. In goods, environmental standards (for shrimp)
and safety standards (for certain types of apparel) have affected Indian exports.
354 India and the WTO
In services, trade-restrictive effects have arisen from a variety of qualification and
licensing requirements in professional and many other services.31
There are in principle three international routes to dealing with such barriers:
harmonization of national regulations (leading possibly to the creation of inter-
national standards); mutual recognition; and strengthening multilateral disci-
plines on national standards. These routes need to be complemented by an
upgrade in domestic standards.
Harmonization In both goods and services, where countries have varying pref-
erences for quality, including in relation to safety and the environment, harmo-
nization is probably not desirable (see Bhagwati and Hudec 1996). In the case of
services, the difficulty of harmonization is revealed by the absence of widely
accepted international standards. Where such standards exist, as in banking or
maritime transport, meeting them is seen as a first step toward acceptability,
rather than as a sufficient condition for market access.
Mutual Recognition Agreements India’s concern about mutual recognition
agreements (MRAs) is justified because the agreements are like sector-specific
preferential arrangements. If regulatory barriers are prohibitively high (i.e., if you
start from autarky), then recognition can only be trade creating. But if they are
not, then selective recognition can have discriminatory effects and lead to trade
diversion away from those who are left out of MRAs. India’s attempt to address
the problem by requiring that developing countries be allowed to join MRAs,
however, is not tenable and ignores a basic fact: MRAs are voluntary; they cannot
be made to happen. A multilateral agreement cannot oblige countries to conclude
MRAs—just as any provision such as GATS Article V or GATT Article XXIV can-
not make regional integration happen.
So what is to be done? Multilateral disciplines must be used to ensure that
MRAs do not become a means of discrimination and exclusion. These disciplines
operate at two levels: the general rules on preferential arrangements (GATT Article
XXIV for goods and GATS Article V) and the specific rules for MRAs (in the
Agreement on Technical Barriers to Trade for goods and GATS Article VII). Both
sets of rules need to be strengthened and enforced. It would seem that Article
XXIV, which disallows discrimination between countries in regard to domestic
measures (including standards and regulation), would not allow MRAs to be jus-
tified as elements of integration agreements. However, the Agreement on Techni-
cal Barriers to Trade, which encourages the conclusion of MRAs, should not be
interpreted as permitting discrimination through MRAs. A clarification of this
point is essential.
India and the Multilateral Trading System Post-Doha: Defensive or Proactive? 355

In services, Article V on integration agreements does not explicitly preclude
MRAs, and several countries have chosen to publicize their MRAs under this pro-
vision. However, GATS Article VII, dealing specifically with recognition, strikes a
delicate balance by allowing such agreements, provided they are not used as a
means of discrimination and third countries have the opportunity to accede or
demonstrate equivalence. It should be clarified that this provision, with its desir-
able nondiscriminatory and open-ended nature, overrides GATS Article V as far
as MRAs are concerned.
Multilateral Disciplines Based on the “Necessity” Test In our view, the most
important strategy for addressing barriers is to strengthen multilateral disciplines
on standards per se. The trade-inhibiting effect of the entire class of domestic reg-
ulations can be disciplined by complementing the national treatment obligation
with a generalization of the so-called necessity test. This test essentially leaves gov-
ernments free to deal with economic and social problems, provided that any
measures taken are not more trade restrictive than necessary to achieve the rele-
vant objective.
This test is already part of the Uruguay Round Agreement for goods and the
recently established disciplines in the accountancy sector. It would seem desirable
to use the test to create a presumption in favor of an economically efficient choice
of policy in remedying market failure and in pursuing noneconomic objectives.32
For instance, in the case of professionals like doctors, a requirement to requalify
would be judged unnecessary because the basic problem—inadequate informa-
tion about whether they possess the required skills—could be remedied by a less
burdensome test of competence.
This test could also be applied to situations in which a country is contemplat-
ing trade-restrictive measures on the grounds that environmental or labor stan-
dards in a partner country are too low. The necessity test would not seek to deny a
country’s right to be concerned about environmental and labor problems in other
countries, but would subject the instruments it chooses to critical scrutiny. The
following questions would be posed—are trade restrictions the best instrument to
address the relevant problem, and would alternatives to the trade restriction, say,
compensation or international negotiation, be more efficient in attaining the
country’s objectives?
Upgrading of Domestic Standards Finally, India must upgrade its standards
and related institutions consistent with domestic preferences for quality. This
would strengthen the case for obtaining foreign recognition and would allow
foreign technical barriers to be challenged credibly. For instance, the poor stan-
dards of a few professional colleges in the country and their willingness to
356 India and the WTO

award certificates without adequate examinations penalize all members of the
profession seeking to work abroad by legitimizing the imposition of elaborate
requalification requirements.
Competition Policy
Following decades-long reliance on the Monopolies and Restrictive Trade Practices
Act, India recently enacted a new competition law (see Bhattarchjea, Chapter 9 in
this volume). This law could be used to further efficiency and welfare in a number
of areas. For example, competition policy, coupled with compulsory licensing,
offers one avenue for mitigating some of the most egregious effects of the TRIPS
agreement. Competition policy would also need to address the concentration of
production in several sectors sometimes associated with the entry of foreign
investors. Domestically, the challenge for India will be to build the institutional
capacity to implement the complex provisions of the law. Furthermore, there is
always a large and irreducible discretionary component in competition law, which
needs to be exercised in a manner that promotes efficiency rather than arbitrari-
ness and the favoring of vested interests.
In the light of these developments, should India embrace efforts to have multi-
lateral disciplines on competition policies? A negative response could be based on
the fear that multilateral disciplines will constrain the implementation of India’s
own competition policy or on the view that multilateralism can add little to
national efforts. On the first point, it should be noted that any future rules are
likely to be very general and probably not very ambitious. Competition policy
standards, practices, and institutions are divergent enough between industrial
countries to militate against very detailed and specific multilateral rulemaking.
On the second point, there are a number of cases where multilateral engage-
ment on competition policy can bring about outcomes that could benefit India.
Reform of antidumping to bring it within the fold of competition policy is one
case in point, but the prospects of this happening in the near future are dim, given
the opposition of the United States and the EU. The most coherent multilateral
case for a competition policy rests on the possibility of negative spillovers across
markets that need cooperation to ensure an outcome that maximizes global wel-
fare. Several examples of potential interest to India can be found. In the shipping
market, international cartelization may be inflicting terms-of-trade losses on
India. Excessively high levels of intellectual property protection can inhibit the
transfer of technology. Foreign export cartels may charge excessively high prices.
In all of these cases, although domestic competition policy could attempt to
redress the anticompetitive impact, redress may be relatively ineffective because of
jurisdictional problems or because remedial measures (e.g., refusing domestic
India and the Multilateral Trading System Post-Doha: Defensive or Proactive? 357
market access to foreign owners of intellectual property rights or foreign suppliers
of essential products access) may not be credible. Enforcement can be more effec-
tive when taken at the source, involving the cooperation of partner countries.
On balance it would seem that the most substantial gains for India would arise
from effectively implementing its own competition policy. Multilateral rules on
competition policy are likely to provide net benefits. Even though these benefits
may not be large, because the prospects of addressing the proliferation of
antidumping are slim, India may wish to consider adopting a cautiously open
position toward multilateral rules on competition policy.
Investment
The strongest analytical case for multilateral rules on FDI stems from the prolif-
eration of investment incentives that creates policy-induced distortions in FDI
flows without augmenting their aggregate size. In view of the superior ability of
richer countries to grant such incentives, multilateral rulemaking on investment
could be unambiguously beneficial for developing countries such as India. Given
the widespread use of these incentives by industrial countries (not just at federal
but also at subfederal levels), the prospects for disciplining them are likely to be
slim.
Thus if multilateral discipline on investment incentives is ruled out, can a case
still be made for a multilateral agreement on investment? It generally would be
acknowledged that clear benefits derive from a liberal domestic regime for FDI. In
the case of India, despite considerable and ongoing liberalization, FDI continues to
be regulated in an ad hoc manner, thus imposing serious costs (see Das, Chapter 7
in this volume). The issue is whether multilateral rules on investment are necessary
and desirable or whether FDI regimes should be determined unilaterally. Even
strong advocates for multilateral disciplines on tariffs tend to be less enthusiastic
about such disciplines on FDI.
It is puzzling why the case for multilateral rules on FDI is different from that
for conventional trade policy or for trade in services that, after all, involves open-
ing domestic markets to FDI. Theoretically, should countries have greater flexibil-
ity in designing an FDI regime for cars and electronics than for banks and
telecommunications? If anything, the need for regulation, which is so intrinsic to
services and which qualifies to some extent the nature and pace of opening up to
FDI, is not as strong in the case of FDI in goods.
The arguments in favor of multilateral engagement made above—facilitating
domestic reform and providing a means of precommitment to good domestic
policies—seem to be no less relevant to FDI in goods than to conventional trade
policy. Moreover, under the new competition policy India, like all other countries,
358 India and the WTO

India and the Multilateral Trading System Post-Doha: Defensive or Proactive? 359
can prevent the acquisition and abuse of market power by, and regulate other
anticompetitive practices of, foreign (and domestic) firms. The interesting ques-
tions then are whether there is need for additional discretion to regulate FDI and
whether this will be unduly circumscribed by multilateral rules. One example
would seem to be measures designed to ensure the transfer of technology and the
training of local workers.33 There is undoubtedly a need for more research on
whether other safeguards should be built into an investment agreement to pre-
serve the freedom to pursue national objectives. But again blanket opposition to
any investment agreement is not easy to comprehend.
Concrete Proposals
We now present a set of concrete proposals that India could consider in the ongo-
ing Doha trade negotiations. These are summarized in table 13.9.
• Industrial tariffs: It is in India’s interest to reduce its bound and actual tariffs
and to seek to reduce tariffs in industrial countries, especially in textiles, cloth-
ing, and footwear. The latter is particularly urgent in view of the large trade-
diversion costs imposed on India consequent to preferential arrangements
such as NAFTA. Reforms to Article XXIV, even if feasible, will not compensate
for the trade diversion from existing preferential agreements.
• Agricultural reform: Given India’s actual and potential comparative advantage
in agriculture, and the policy regime, which for the most part taxes rather than
protects the sector, there is good reason for a change in India’s negotiating
position. Defensiveness could cede to active advocacy of global free trade in
agriculture. India could even consider joining the Cairns group in supporting
full liberalization of international agricultural markets.
• Services: Although the most serious challenges are domestic (enhancing
domestic competition and improving the regulatory framework), India should
be open to multilateral disciplines on services liberalization. This openness
could serve as the basis for creating credible negotiating linkages through a for-
mula approach, trading domestic liberalization for increased mobility of indi-
vidual service providers. At the same time, India should press for strengthened
multilateral disciplines on domestic regulations under the GATS to address
implicit barriers posed by technical regulations, qualification, and licensing
requirements.
• Electronic commerce: While supporting the current limited initiatives to liberal-
ize ecommerce, India should push actively for commitments under the GATS
on cross-border services trade to secure market access (by prohibiting quantita-
tive restrictions) and to preclude all forms of discrimination (by guaranteeing
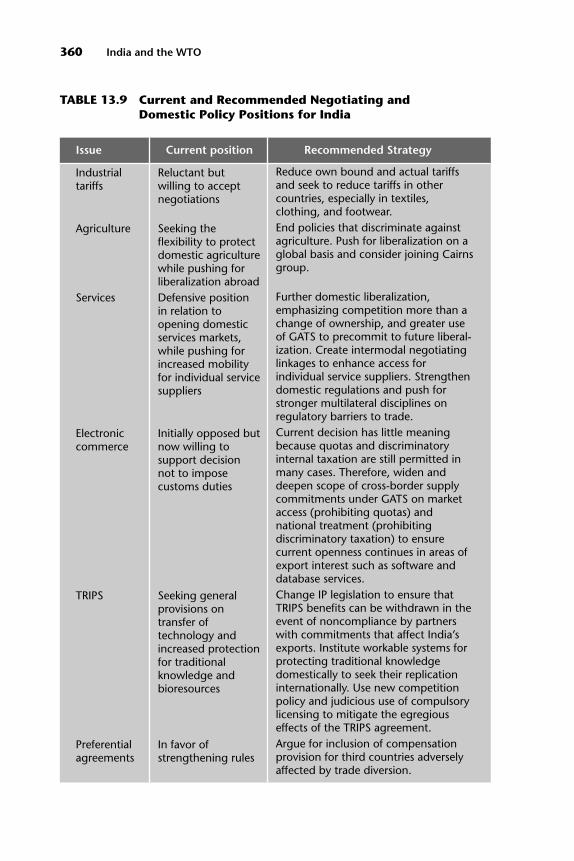
360 India and the WTO
TABLE 13.9 Current and Recommended Negotiating andDomestic Policy Positions for India
Issue Current position Recommended Strategy
Industrial tariffs
Agriculture
Services
Electroniccommerce
TRIPS
Preferentialagreements
Reluctant butwilling to acceptnegotiations
Seeking theflexibility to protectdomestic agriculturewhile pushing forliberalization abroad Defensive positionin relation toopening domesticservices markets,while pushing forincreased mobilityfor individual servicesuppliers
Initially opposed butnow willing tosupport decisionnot to imposecustoms duties
Seeking generalprovisions ontransfer oftechnology andincreased protectionfor traditionalknowledge andbioresources
In favor of strengthening rules
Reduce own bound and actual tariffsand seek to reduce tariffs in othercountries, especially in textiles,clothing, and footwear.End policies that discriminate againstagriculture. Push for liberalization on aglobal basis and consider joining Cairnsgroup.
Further domestic liberalization,emphasizing competition more than achange of ownership, and greater useof GATS to precommit to future liberal-ization. Create intermodal negotiatinglinkages to enhance access forindividual service suppliers. Strengthendomestic regulations and push forstronger multilateral disciplines onregulatory barriers to trade.Current decision has little meaningbecause quotas and discriminatoryinternal taxation are still permitted inmany cases. Therefore, widen anddeepen scope of cross-border supplycommitments under GATS on marketaccess (prohibiting quotas) andnational treatment (prohibiting discriminatory taxation) to ensurecurrent openness continues in areas ofexport interest such as software anddatabase services.Change IP legislation to ensure thatTRIPS benefits can be withdrawn in theevent of noncompliance by partnerswith commitments that affect India’sexports. Institute workable systems forprotecting traditional knowledgedomestically to seek their replicationinternationally. Use new competitionpolicy and judicious use of compulsorylicensing to mitigate the egregiouseffects of the TRIPS agreement.Argue for inclusion of compensationprovision for third countries adverselyaffected by trade diversion.

national treatment). Again, India should support strengthened disciplines on
regulatory barriers to services trade.
• TRIPS: India should change its intellectual property legislation to ensure that
TRIPS benefits can be withdrawn in the event of noncompliance by partners
with commitments that affect India’s exports. Simultaneously, it should seek to
clarify WTO dispute-settlement procedures to prevent the within-sector retalia-
tion rule from becoming an obstacle to such action. Domestically it should
institute workable systems for protecting intellectual property in order credibly
to seek their replication internationally. The new competition policy, combined
India and the Multilateral Trading System Post-Doha: Defensive or Proactive? 361
TABLE 13.9 (Continued)
Issue Current position Recommended Strategy
Competitionpolicy
Standards
Governmentprocurement
Investment
Antidumping
Opposed
Pushing forinclusion in MRAs
Opposed to laborstandards
Opposed
Opposed
Seeking to limitscope for foreignaction
Strengthen implementation of newcompetition law and be open to thedevelopment of meaningful multilateraldisciplines, which ideally would alsocover antidumping.Strengthen disciplines on MRAs toensure that they are nondiscriminatory.Push for multilateral disciplines ondomestic regulations in goods andservices based on the necessity test.Improve domestic standards. On laborstandards, be proactive in the ILO whileresisting attempts to bring the issueinto the WTO.Be open to creation of multilateraldisciplines, but link them to theelimination of barriers to trade in goodsand services so that foreignprocurement contracts can becontested in areas of comparativeadvantage, such as labor services.Be willing to discuss multilateraldisciplines, but examine case forpreserving discretion beyond thatprovided by strengthened competitionpolicy. Curtail domestic use of antidumping.Argue for drastic reform of multilateralantidumping rules to eliminate currentprotectionist use, ideally by subjectingthem to competition policy.
with judicious use of compulsory licensing, can help mitigate the most egre-
gious effects of the TRIPS agreement.
• Preferential agreements: The real problem with GATT Article XXIV and GATS
Article V is the lack of compensation for third parties adversely affected by
trade diversion. Such compensation should be incorporated into the rules.
Furthermore, there should be a clear reaffirmation that MRAs cannot be used
as a means of discrimination.
• Competition policy: India should ensure effective implementation of its new
competition law and be open to discussing multilateral disciplines on competi-
tion policy. These disciplines should include outlawing practices that involve
negative international spillovers, such as export cartels (as in shipping), and
bringing antidumping within the ambit of competition policy.
• Standards: India should ensure that MRAs are not used as a means of dis-
crimination. To this end, the Agreement on Technical Barriers to Trade
would need to be clarified, as would the relationship between GATS Articles
V and VII to establish the primacy of the latter. At the same time, it should
push for multilateral disciplines on domestic regulations in goods and ser-
vices based on the necessity test. On labor standards, India should be proac-
tive in the International Labour Organisation (ILO) to ensure universal
adherence to the basic ILO conventions while resisting attempts to bring the
issue into the WTO.
• Government procurement: Given the potential gains from more efficient and
transparent government procurement, India should be willing to undertake
multilateral disciplines on government procurement. At the same time it
should seek to create natural linkages with the elimination of barriers to trade
in goods and services so that it can meaningfully contest foreign procurement
contracts in areas of its comparative advantage, such as labor services.
• Investment: Liberalization of India’s FDI regulations will continue to yield sub-
stantial benefits. The new domestic competition law can regulate anticompeti-
tive behavior of foreign (and domestic) firms. Subject to preserving the discre-
tion necessary to regulate FDI consistent with desirable domestic objectives
(e.g., facilitating transfer of technology), India could be open to considering
multilateral rules on investment.
Conclusion
Trade can be an engine for growth. In the past this engine has sputtered, owing to
India’s policies rather than its geography. The challenges ahead for India now lie in
implementing sound domestic policies that increase competition in, and improve
the contestability of, domestic markets. These challenges are, above all, domestic.
362 India and the WTO

However, active multilateral engagement can be incrementally helpful in facilitat-
ing domestic reform and gaining access for India’s exports of goods and labor
services.
The value of such engagement might be limited if prospects for securing
increased market access seem dim. Such negotiating pessimism is not without
basis, but the launch of a new round of negotiations at Doha marks an improve-
ment over the fiasco at Seattle. In any case, this pessimism needs to be credibly
tested by a willingness on India’s part to open its markets in return for improved
access. Success in this regard is not ensured, but its chances can be improved if
India aligns itself with countries that coalesce on a shared premise of sound open
policies. Liberalization-based coalitions (which can differ across issues) can be an
effective force for reform internationally with beneficial internal consequences.
The success of developing countries such as India in resisting demands for the
inclusion of backdoor protectionism at the Seattle and Doha Ministerial Confer-
ences is testimony to this possibility. In the long run, the power of good arguments
buttressed by India’s growing economic weight should not be underestimated.
Endnotes
1. The other prong was to seek preferential access for one’s own exports in industrial country markets.
2. Of course this suited the protectionist interests in industrial countries because it allowed them
to procrastinate on liberalizing the two sectors in which developing countries had intrinsic compara-
tive advantage—agriculture and textiles.
3. This is an oversimplification because in some sectors, such as textiles and clothing, arguably
there will be increased access.
4. The Indian experience with TRIPS illustrates this point. The fact of the considerable domestic
opposition to higher patent protection prompted trading partners to realize that without offsetting
compensation it would be extremely difficult for India to accede to their TRIPS demands.
5. There are several other examples of benefits from binding international rules. For instance,
WTO rulings will lead to the elimination of quotas that India has long and inappropriately maintained
for balance-of-payments reasons. Even though India’s commitments to phase out local content
requirements under the TRIMs agreement have not prevented the recent re-imposition of such
requirements in the automobile sector, they could be challenged by partner countries.
6. The recent initiatives in the South Asian region are an exception to India’s general preference for
multilateralism.
7. Some of the information in the following subsections is drawn from WTO (1993, 1999).
8. See Hertel and Martin (2001) and Chapter 2 of this volume for a quantification of the benefits
accruing from further global liberalization of manufacturing tariffs.
9. In the 2003/04 budget, the unweighted average customs duty declined to 26.8 percent. Allowing
for the approximate average incidence of the special additional duty, the average unweighted protective
rate is now about 32.7 percent.
10. Although this measure was intended to rectify negative protection by imposing a tax on
imported goods whose domestic counterparts already faced a 4 percent sales duty, the manner in
which the tax was levied afforded some extra protection to domestically produced goods.
11. This section draws heavily on Gulati (1999).
12. However, state-trading enterprises continue to influence trade in agricultural products.
India and the Multilateral Trading System Post-Doha: Defensive or Proactive? 363
13. As Gulati (1999) argued, food security concerns can be adequately addressed through policies
other than domestic trade protection.
14. Direct payments under production-limiting programs are provided in accordance with the
provisions of Article 6.5 of the Agreement on Agriculture.
15. This section draws heavily on Subramanian (1999) and Chapter 8 of this volume.
16. The Uruguay Round TRIPS agreement did impose costs on India, particularly in the pharma-
ceutical sector (see Subramanian 1995), which are likely to be felt in the early part of the 21st century.
17. There are a number of issues that have generated well-entrenched and occasionally extreme
positions, such as compulsory licensing for nonworking, parallel imports, transfer of technology, and
restrictive business practices. These issues, however, are either not seriously important or are mis-
guided (see Subramanian [1999] for a fuller discussion). They should be spared negotiating effort and
time.
18. To see why, it is important to recall that IPRs are private rights conferred through domestic
legislation. Whereas it is easy to raise tariffs in retaliation, to withdraw private rights granted through
domestic legislation would be very difficult, perhaps even unconstitutional in many legal systems. Fur-
thermore, withdrawing rights would be of little value unless alternative sources of production for the
patented product can be found.
19. It is notable that Ecuador has taken similar steps in retaliating against the European Union for
its failure to remedy the WTO inconsistencies in its banana import regime.
20. The only grounds on which compulsory licenses cannot be granted is nonworking of the
patent locally.
21. When compulsory licenses are used to remedy anticompetitive practices, the TRIPS agreement
provides that (a) no case needs to be made that the patentee was unwilling to license the patent on rea-
sonable commercial terms as a precondition for granting the compulsory license; and (b) the principle
that remuneration for the compulsory license should be “adequate” need not be respected.
22. On geographical indications, it might be sensible for India to form an alliance with the EU,
which is a major demandeur in this area.
23. Services trade will refer in our discussion not only to cross-border delivery, as in the case of
goods, but also to supply through the establishment of firms and the movement of individuals.
24. There remains a need to improve policies to help poor people obtain access to essential ser-
vices in liberalized markets. India has taken important steps in telecommunications, but much more
needs to be done in other sectors like education, health, and transport. Such action is not only socially
desirable but also necessary to make liberalization politically feasible.
25. Such temporary movement offers arguably the neatest solution to the dilemma of how best to
manage international migration, enabling gains to be realized from trade while averting social and
political costs in host countries and brain drain from poor countries. Recent research finds that if
OECD countries were to allow temporary access to foreign service providers equal to just 3 percent of
their labor force, the global gains would be over US$150 billion—more than the gains from the com-
plete liberalization of all trade in goods.
26. The notions of the United States as the unrivaled center of technology and the role of techno-
logical progress in motoring the 1990s U.S. economic expansion resonate very deeply with the U.S.
public. They may be loathe to countenance any obstacles to this march of progress, even if it involves
greater imports of labor-related services.
27. In a way Bill Gates’ recent testimony before the U.S. Congress arguing for the need to allow
more software engineers to enter the country so as to maintain international competitiveness is not far
removed from the suggested scheme.
28. In principle all types of products can be advertised and purchased over electronic networks.
But the scope of the WTO decision not to impose duties is more limited. It requires that a final prod-
uct be presented as digitalized information and transmitted electronically, typically over the Internet.
The bulk of the products that can be supplied in this manner are services, financial, legal, customized
software, and so forth. Some information and entertainment products typically characterized as
364 India and the WTO

goods, such as books, standardized software, music, and videos, embody digitalized information that
also can be supplied electronically over the Internet.
29. Services are not subject to customs duties as far as we know. So we need concern ourselves only
with the fiscal implications if international trade in digitizable products currently classified as goods
shifts to the Internet, and if no tariffs are levied on such products. The estimates are reasonably reliable
for the most important categories where trade and tariff data were available for the most important
countries. A few data problems persist as volume data for some products facing specific tariffs were not
available, sometimes the tariff rate was not provided, and applied tariff rates for some of the smaller
countries were not available.
30. It also has been suggested that countries could continue to maintain preference margins, but
agree to bind them and make them subject to unilateral or negotiated reductions in a manner analo-
gous to tariffs.
31. The requirement of registration with, or membership in, professional organizations can also
constitute an obstacle for a person wishing to provide the service on a temporary basis. For instance, in
the United States requirements to practice medicine for foreign-qualified doctors vary from state to
state. Candidates also must pass the qualifying examination of the Educational Commission for Foreign
Medical Graduates, and then undergo a period of graduate medical education at a hospital in the
United States.
32. This argument is developed in Mattoo and Subramanian (1998).
33. It is relevant that India has reserved the right to impose these requirements on foreign invest-
ment under the GATS, on which any investment agreement is likely to be modeled.
References
The word “processed” describes informally produced works that may not be available commonly
through libraries.
Bhagwati, J., and Robert Hudec, eds. 1996. Fair Trade and Harmonization: Prerequisites for Free
Trade? Cambridge, Mass.: MIT Press.
Gulati, Ashok. 1999. “Agriculture and the New Trade Agenda in the WTO 2000 Negotiations: Inter-
ests and Options for India.” Delhi: Institute for Economic Growth. Processed.
Hertel, T. W., and W. Martin. 2001. “Liberalizing Agriculture and Manufactures in a Millenium
Round: Implications for Developing Countries.” In Bernard Hoekman and W. Martin, eds., Developing
Countries and the WTO. Oxford, U.K.: Blackwell.
Mattoo, Aaditya, and M. Olarreaga. 2000. “Liberalizing Mode 4 under the GATS: A Proposed Solu-
tion.” Policy Research Working Paper 2373. World Bank, Policy Research Department, Washington, D.C.
Mattoo, Aaditya, and L. Schuknecht. 2000. “Trade Policies for Electronic Commerce.” Policy
Research Working Paper 2380. World Bank, Policy Research Department, Washington, D.C.
Mattoo, Aaditya, and A. Subramanian. 1998. “Regulatory Autonomy and Multilateral Disciplines:
The Dilemma and a Possible Resolution.” Journal of International Economic Law 1: 303–22.
Pray, C. E., and R. Basant. 2001. “Agricultural Research and Technology Transfer by the Private Sec-
tor in India.” Indian Institute of Management Working Paper 99-06-03. June. Ahmedabad, India.
Processed.
Pray, C. E., and B. Ramaswami. 2001. “Technology, IPRs and Reform Options: Case Study of the
Seed Industry with Implications for Other Input Industries.” Paper presented at the NCAER-IE6.
Processed.
Rubin, Howard. 1999. “Global Software Economics.” New York: Hunter College, Department of
Computer Science, and Rubin Systems Inc.
Subramanian, Arvind. 1995. “The Impact of TRIPS on Asian Developing Countries: An Analytic
View.” In Arvind Panagariya, ed., The Uruguay Round and Asian Developing Countries. Cambridge,
U.K.: Cambridge University Press.
India and the Multilateral Trading System Post-Doha: Defensive or Proactive? 365

———. 1999. “TRIPS and Developing Countries: The Seattle Round and Beyond.” Paper pre-
sented at the Conference on Developing Countries and the New Multilateral Round of Trade Negotia-
tions, November 5–6, Harvard University.
Subramanian, Arvind, and Jayshree Watal. 2000. “TRIPS as an Enforcement Device in the WTO for
Developing Countries.” Journal of International Economic Law 3(3): 403–16.
Watal, Jayshree. 2000. Intellectual Property Rights in the World Trade Organization: The Way For-
ward for Developing Countries. Oxford, U.K.: Oxford University Press.
World Bank. 2000. Policies to Reduce Poverty and Accelerate Sustainable Development, Report
19471-IN. Washington, D.C.
WTO (World Trade Organization). 1993. Trade Policy Review of India 1993. Geneva.
———. 1999. Trade Policy Review of India 1999. Geneva.
366 India and the WTO

Pradeep Agrawal is professor of economics and holds the Reserve Bank of India
Chair Unit at the Institute of Economic Growth in New Delhi.
Anjali Bhardwaj is a senior program officer with Winrock International in New
Delhi.
Aditya Bhattacharjea teaches industrial organization and international economics
at the Delhi School of Economics, University of Delhi.
Drusilla K. Brown is associate professor of economics at Tufts University,
Medford, Massachusetts.
Rajesh Chadha is reader (associate professor) in the department of economics,
Hindu College, University of Delhi, and honorary adviser (chief economist) at the
National Council of Applied Economic Research, New Delhi.
Satya P. Das is professor of economics, Indian Statistical Institute.
Alan V. Deardorff is John W. Sweetland professor of international economics and
professor of economics and public policy at the University of Michigan.
Veena Jha is the project coordinator for UNCTAD in New Delhi, affiliated with
the International Trade Division of UNCTAD in Geneva.
Rajat Kathuria is professor of economics at the International Management Insti-
tute, New Delhi, and a consultant with the Telecom Regulatory Authority of India.
Sanjay Kathuria is currently a senior economist in the Caribbean Country Man-
agement Unit of the World Bank in Washington, D.C.
Will J. Martin is a lead economist in the Development Research Group of the
World Bank in Washington, D.C.
367
ContRIBUTORS

368 India and the WTO
Aaditya Mattoo is lead economist in the Development Research Group of the
World Bank in Washington, D.C.
Mohammed Saqib is a fellow with the Rajiv Gandhi Institute for Contemporary
Studies, Rajiv Gandhi Foundation, New Delhi.
Harsha Vardhana Singh is secretary and principal adviser for the Telecom Regu-
latory Authority of India.
Anita Soni is head of the treasury management and budget division of Bharat
Sanchar Nigam Limited, New Delhi.
Vivek Srivastava heads the India Country Team of the World Bank’s Water and
Sanitation Program-South Asia, Washington, D.C.
Robert M. Stern is professor of economics and public policy (emeritus) at the
University of Michigan, Ann Arbor.
Arvind Subramanian is an advisor in the Research Department of the Interna-
tional Monetary Fund in Washington, D.C.

Index
accountancy standards, 356
aflatoxin contamination
in milk and milk products, 288
in peanuts, 275–76
Africa
AIDS drugs and, 178–81
FDI in sub-Saharan countries, 156
Agarwal, M., 207
Agreement on Sanitary and Phytosanitary
Measures. See Sanitary and Phy-
tosanitary (SPS) Agreement
Agreement on Technical Barriers to Trade.
See Technical Barriers to Trade (TBT)
Agreement
Agreement on Textiles and Clothing (ATC),
18, 62, 171
Multifibre Arrangement phase-out. See
Multifibre Arrangement (MFA)
Agreement on Trade-related Investment
Measures (TRIMs)
FDI provisions, 141, 143–44, 155, 162
India’s stance on, 4, 19, 145, 159
Agricultural and Processed Food Pro-
ducts Export Development Autho-
rity, 289
agriculture
See also food safety
Cairns group, 302, 335, 340
Doha Development Agenda
computational analysis of impact on
India, 21, 30–36
India’s stance on, 359
domestic support for, 340, 341t13.4
employment projections, 38, 39t2.8,
40t2.9
genetically modified crops, 181, 182, 275,
307
genetic resources and indigenous knowl-
edge, protection of, 183–85
legislation for IP protection, 181–82, 193
liberalization of trade in, 10, 15, 17, 30,
36, 335, 340
peanut exports, 275–77
tariff rates and lines, 17, 340, 341t13.4
Uruguay Round and, 18
Agriculture Produce Export Development
Authority, 281
AIDS drugs for African countries, 178–81
Air Act of 1981, 316
airlines. See transport sector
air pollution, 315, 316, 317
See also environmental issues
Alkali Manufacturers Association of India
(AMAI), 212–13, 221
American Natural Soda Ash Corp. (ANSAC),
212, 221
American Peanut Council, 276
Andean Common Market and competition
policy, 200
anticompetitive policy. See competition
policy
antidumping measures, 344–46, 344t13.5,
345t13.6
See also technology dumping
competition policy and, 200, 220, 224,
230
369
Note: f indicates figures, t indicates tables and n indicates notes.

float glass, 213
injunctions on imports in violation of,
224
negotiating stance for India, 11, 335
soda ash, 212, 221
steel, 218
antitrust measures
See also competition policy
legislation, 165
rule of reason judgments and, 228
TRAMs (trade-related antitrust mea-
sures), 201
Areeda-Turner test for predatory pricing,
220, 228
Asbestos case, 318, 319
Association of Southeast Asian Nations, 273
ATC. See Agreement on Textiles and Cloth-
ing
Athreye, Suma S., 157
Australia-New Zealand
competition policy, 200
steel industry export restrictions to, 279
tariff reductions, impact of, 36
automobile industry
FDI and, 124t6.2, 160
multinational corporations’ entry into
developing countries, 208
recessionary conditions, 218
tariffs, 205, 218
tire exports, 278–79
Automotive and Tyre Manufacturers Asso-
ciation of India, 278
Baldwin, R.E., 237
bananas trade dispute, retaliation by Ecuador,
172, 174, 176
Banga, R., 217, 218
Bangladesh
See also South Asian countries
textile industry, 51
banking. See financial services
Banking Regulation Act of 1949, 349
barriers to trade. See nontariff barriers
(NTBs); tariffs; technical barriers
to trade
Basant, Rakesh, 158
Batra, Ravi N., 154
beef hormones, 307
Beena, P.L., 210
Bernard, Andrew, 51
Bhagwati, Jagdish, 50, 159
Bharat Sanchar Nigam Limited (BSNL),
82–88, 100
Bhardwaj, A., 3, 48, 52, 62
Bharucha, Vasantha, 306
Bhattacharjea, A., 213, 214, 215–16, 219,
221, 223, 228
Bhopal gas disaster, 317
bilateral investment treaties (BITs), 164
Biodiversity Action Plan, 321
Biodiversity Convention, 321
biotechnology
IP protection for, 169, 182, 310, 321, 343
public policy issues associated with, 182,
343
TRIPS and, 181, 310–11, 321
BIS. See Bureau of Indian Standards
BITs (bilateral investment treaties), 164
Blejer, Mario I., 125
Blomstrom, Magnus, 156, 157
Borenszstein, Eduardo, 157
Brazil
FDI and, 144, 145, 149t7.2, 150t7.3,
151t7.4
packaging, marking, and language require-
ments for exports to, 279
patenting and, 182, 190t8.1, 192
tire exports to, 278–79
Brecher, Richard A., 131, 154
broadcasting, convergence with telecom-
munications, 97–98
Brooke Group case (U.S. 1993), 220
Brown, Drusilla K., 20, 74
BSNL. See Bharat Sanchar Nigam Limited
Bureau of Indian Standards (BIS), 281–86,
294, 322
Central Committee for Food Standards
(CCFS), 288–89
Code of Good Practice adopted by, 285
Food and Agriculture Department (FAD),
286–87
notification procedure, 282–84, 283f11.2,
294
organization of, 282f11.1
370 India and the WTO

Cairns group, 302, 335, 340
cartels
See also competition policy
Competition Act outlawing, 203, 224
EU stance on, 229
export and import cartels, 200, 357
MRTP Commission rulings against, 212
Panama communiqué for dealing with,
200
CBD (Convention on Biological Diversity),
183–84
cement industry, 209, 211, 218
Central Committee for Food Standards
(CCFS), 288–89
central government purchases, 245, 246t10.1,
260–64
objects of expenditure, 262t10.A.2
shares of total expenditures, 260t10.A.1
threshold levels, 263t10.A.3
Centre for Monitoring Indian Economy,
209, 248
CFCs, 304
Chadha, Rajesh, 20, 41
Chakravarthy committee on competition,
201–02
Chelliah, Raja J., 15, 16
Chile and patenting, 189f8.1, 190t8.1, 192
China
accession to WTO and agreement with
U.S., 330
FDI comparison, 120, 121f6.1, 136, 137,
150, 150t7.3, 163
FDI into and out of, 149, 156
genetically modified crops, 182
patenting comparison, 190t8.1, 192
soda ash market in India, 212–13, 221
textile industry, 50
comparison, 55, 57, 58, 61, 62
chlorofluorocarbons (CFCs), 304
CIPLA and sale of AIDS drugs, 179, 180
clothing products. See Textiles
Codex Alimentarius Commission, 276, 288,
293, 295
combinations. See mergers
Committee on Trade and Environment
(CTE). See World Trade Organiza-
tion (WTO)
Communications Commission of India
(CCI), 98, 99, 108
Communications Convergence Bill (draft),
98, 108
Company O and egg product exports, 278
Competition Act (new), 6, 205, 221–27,
357
cartel provisions, 203, 224
comparison to MRTP Act, 221–24
discrimination between domestic and
foreign firms, not included, 203, 224
“effects” doctrine, 222
injunctions on imports, 223–24
mergers, 222–23, 225
not yet in force, 197
shortcomings of, 224–27
unfair trade practices, 222
Competition Commission (new), 221–22
injunctions on imports, 223
lack of expertise on, 222, 223, 224, 225
competition policy
See also Competition Act (new); Monop-
olies and Restrictive Trade Prac-
tices (MRTP) Act
Chakravarthy committee (1999) on,
201–02
changes in structure of international
business and, 201
Cournot competition, 216, 218–19
excess entry theorem and, 214–18
history of Indian policies, 203–05
India’s perspectives on, 201–03, 328,
357–58, 362
international agreements on, 199–200
international cooperation to enforce
policy, 201
international literature review, 200–01
mergers. See mergers
negotiating stance for India, 10, 199,
225, 226, 335
predatory pricing, 200, 210, 212–14,
219–21
price fixing, 6, 201, 210
restrictive trade practices (RTPs), 210–
11
second committee (2000) on, 202
small business protections, 230
Index 371

strategic trade policy, 215
telecommunications, 100–02, 108
market structure, 88t5.5
textile industry, future trends, 63
total factor productivity growth (TFPG)
and, 217
TRIPS and, 176–78
vertical restrictions, 211
WTO submission from India, 202–03
computer software. See software industry
conservation efforts. See environmental
issues
Constitution of India and environmental
protection, 315
construction industry and government
procurement, 354
consumer goods
import licensing of, 15
liberalization of trade in, 17
mergers of manufacturers, 209
Uruguay Round and tariffs, 17, 18
Consumer Protection Act, 222
consumer welfare and telecommunications,
100, 110
Convention on Biological Diversity (CBD),
183–84
corruption
government contracting and, 253, 255,
354
multinational corporations involved in
mergers or market entry, 226
in textile industry, 60
cotton-based products, bias for, 58–60
Cournot competition, 216, 218–19
Cox, D., 214
CTE (Committee on Trade and Environ-
ment). See World Trade Organiza-
tion (WTO)
cultural industries and FDI, 155
dairy farms, standards for exports, 277–78
Das, Sanghamitra, 158
Das, Satya P., 162
Debroy, Bibek, 237, 238, 241
de Gregorio, Jose, 157
De Mello, Luiz R., Jr., 156
Deolalikar, Anil, 157
devaluation of rupee, 147
developing countries
See also specific countries
antidumping measures, 344, 344t13.5,
345t13.6
competition enforcement agencies in,
227
Doha Development Agenda and, 1,
302–03
environmental concerns of, 302–03
FDI and, 117–18, 142, 144, 155–56, 217
Government Procurement Agreement
and, 236, 239, 244
Multifibre Arrangement abolition, pur-
suit of, 47
patenting, comparison with industrial
countries, 188, 189f8.1, 190t8.1,
192
SPS agreement and, 269–70, 273–74
standard-setting systems and, 271
tariff reduction, impact on Asian
economies, 30, 36, 37
TBT agreement and, 269–70
technical assistance for, 272–73, 321–22
TRIPS and, 176
unwillingness to liberalize markets, 329–
30
Diaz-Alejandro, C.F., 131, 154
Directorate General of Supplies and Dis-
posal (DGS&D), 240–41
See also government procurement in
India
abolishment of, 257
grievances, 243
small-scale sector preference, 242, 254–
55
disaster management plan, 317
dispute settlement
environmental issues, 318–20
government procurement in India, 243,
257
WTO system, 9, 318, 320, 332–33
summary indicators (1995–2001),
332t13.1
dividend payments and FDI, 148
Dixit, A., 215
Doha Development Agenda, 1
372 India and the WTO

agricultural liberalization, 21, 30–36,
31t2.7
combined liberalization, 22, 34t2.7, 37–38
computational analysis of impact on
India, 2–3, 20–22, 30–41, 43
computational scenarios, 20–22
economies and regions of the model,
21t2.4
results, 30–38, 31t2.7
sectors of production, 21t2.5
environmental issues. See environmen-
tal issues
manufacturing liberalization, 32t2.7,
36–37
services liberalization, 22, 33t2.7, 37–38,
67–80
See also services sector
strategies for India to follow in negotia-
tions, 10–11, 359–63, 360t13.9
See also specific sectors
technical assistance for developing coun-
tries, 273
Domberger, Simon, 253
Dua, Pami, 158
Eastman, H., 214
Eaton, Jonathan, 157
ecolabeling, 305–07
e-commerce. See electronic commerce
economy of India
See also liberalization of trade policy;
specific sectors
good policies
engagement as commitment to, 331–
32
need for, 328–35
reform, 13
See also Competition Act (new)
multilateral engagement and, 329–
31
service sectors, 347–49
shrinking importance in world trade,
327, 328f13.1
possibility to make significant gains,
334–35
survey of domestic investors on govern-
ment policies, 336, 338t13.3
trade as catalyst for, 362–63
Ecuador and retaliation in bananas trade
dispute, 172, 174, 176
effective rates of protection (ERPs)
adjustment for inefficient service sec-
tors, 70–71
by sector (1997/98), 72t4.2
egg products, testing procedures, 278
EIAs (environmental impact assessments),
309–10
Elebhri, A., 55
electronic commerce, 351–52
GATS commitments, 352, 353t13.8
India’s stance on, 10, 359–60
Electronics Standardization, Testing and
Quality Certification Department
(STQC), 289–91
EMIT Group (GATT Group on Environ-
mental Measures and International
Trade), 301
employment
FDI and employment effects, 161–62
labor movement from developing to
industrial countries, 335, 349–51
mergers and, 225
by sector, 38, 39t2.8, 40t2.9
services liberalization and employment
effects, 74, 75t4.3
software development and wages, 73–74
endangered species, 304, 318
energy sector
foreign direct investment in, 121, 124t6.2,
148
public sector enterprises (PSEs) in, 248
Environment Act of 1986, 316–17
environmental impact assessments (EIAs),
309–10
environmental issues, 8, 299–325
air and water pollution, 315, 316
alternative technology, costs and other
prohibitive factors, 312
chlorofluorocarbons (CFCs), 304
conservation and prevention of pollu-
tion, 318
costs related to, 304–05
developing vs. industrial countries, 302–03
dispute settlement, 318–20
Index 373

Doha Ministerial Declaration and, 314–
15, 320
domestically prohibited goods and, 314
ecolabeling, 305–07
endangered species, 304
environmental impact assessments (EIAs),
309–10
greenhouse gases, 304
hazardous substances, 317
India’s agenda, 303–10, 313, 320–23
mainstreaming, 307–09
market access and, 312–14, 322
ozone-depleting substances (ODS), 304
pollution haven hypothesis and FDI,
155, 157, 162
precautionary principle vs. scientific
certainty, 306–07, 315
SPS protections. See Sanitary and Phy-
tosanitary (SPS) Agreement
steel industry export restrictions to
Australia and New Zealand, 279
volume of trade and, 308
environmental regulation in India, 315–18
central vs. state government role, 316, 317
fiscal incentives, 318
legislation, 316t12.1
ERPs. See effective rates of protection
ETEs. See export tax equivalents
European Court of Justice on predatory
pricing, 220
European Snack Association’s Nut Work-
ing Group, 276
European Union
anticompetition
accession requirement, 200
antidumping rules, 224
complaints against U.S., 199–200
India’s Competition Act and, 224–25
outlawing of cartels, 229
crisis cartels in, 228
on Doha declaration, 198
electronics standards, 290
environmental issues and precautionary
principle, 307
food safety and exports to
beef hormones, 307
mango pulp, 277
milk and milk products, 277–78
peanuts, 275–77
geographical indications, IP protection
for, 185
price discrimination enforcement, 229
retaliation against in banana dispute,
172, 174, 176
SPS measures used in, 274
tariff reductions, impact of
agriculture, 30, 36
manufacturing, 37
services, 37
textiles exports to, 52–54, 53t3.1, 62, 339
Evenett, S.J., 229
Evenson, Robert E., 157
excess entry theorem, 214–18
Export and Import Policy (EXIM Policy)
of India, 15, 279–80
Export Inspection and Quality Control
Act, 280, 289
export promotion councils and authori-
ties, 280, 281
exports. See specific commodity, sector, or
agreement
export tax equivalents (ETEs), 3, 51–54, 62
Factories Act, 317
FAD (Food and Agriculture Department),
286–87
FATS (foreign affiliate trade in services),
69
FDI. See foreign direct investment
FERA. See Foreign Exchange Regulation
Act
FIDB. See Foreign Investment Promotion
Board
Fikkert, Brian, 158
financial services, 68, 348–49
foreign direct investment in, 19, 124,
124t6.2
fish and marine products
Codex Alimentarius, 293
Marine Product Export Development
Authority, 281
salmonella contamination, 313
tariffs, 17
float glass and predatory pricing, 213, 221
374 India and the WTO
Food and Agriculture Department (FAD),
286–87
food safety, 274–78
Agricultural and Processed Food Prod-
ucts Export Development Author-
ity’s role, 289
beef hormones, 307
Central Committee for Food Standards
(CCFS), 288–89
Codex Alimentarius Commission’s role,
276, 288, 293
egg products, 278
fish and marine products, 281, 293, 313
Food and Agriculture Department’s role,
286–87
fruit and vegetable processing standards,
289
Hazard Analysis Critical Control Point
(HACCP), 287, 293
mango pulp, 277
milk and milk products, 277–78, 288
Ministry of Food and Consumer Affairs,
role of, 280
Ministry of Food Processing, role of, 289
peanuts, 275–77
spices, 280
sugar, 288
tea, 313
foot-and-mouth disease, 278
foreign affiliate trade in services (FATS), 69
foreign direct investment, 4–5, 117–67,
358–59
approval system by Indian agencies,
148–49, 204
availability of institutional credit and,
126–27
benefits from liberalization, 153, 163,
216, 362
comparison with other countries, 150t7.3
China and East Asia, 120, 121f6.1,
136, 137, 156, 163
costs of liberalization, 154–56
cross-sectional studies on FDI-growth
relationship, 156–57
decline in, 164
developing countries’ vs. industrial coun-
tries’ policies, 142, 144, 217
empirical evidence about, 156–58
export base, building via, 163
flows into India, 5, 120–24, 149–51,
152t7.5, 216
empirical studies of, 157–58
as percent of GDP, 121f6.1
by sector, 151, 153t7.6
share of major investing economies,
122t6.1
flows into selected countries, 149t7.2
foreign control of production, 157
GATS and, 141, 144
growth of, 141
history of Indian policies, 5, 118–20,
146–51, 203–05
impact on capital formation, 157
gross fixed capital and inward/outward
FDI flows, 150, 151t7.4
impact on cultural industries, 155
impact on domestic entrepreneurship,
160, 216
impact on GDP growth, 4, 19, 127,
131–36
empirical studies of, 158, 159t7.7
Granger causality test, 135, 135t6.7,
136, 137–38, 158
inflows as percent of GDP, 121f6.1
in South Asia (1995–1996), 133t6.5,
134t6.6
impact on national investors, 4, 124–31,
136
econometric procedure used in
model, 127
results of estimation, 128–31, 129t6.3,
129t6.4
variables affecting investment func-
tions, 125–27
infrastructure and, 151, 153t7.6, 163
liberalization era, 147–48, 203
multilateral investment agreement
considered at 2001 Doha meeting,
145
pros and cons, 358–59
multilateral rules
benefits of, 154, 165
bilateral investment treaties (BITs) and,
164
Index 375
costs of, 156
India’s stance on, 159, 362
multinational corporations as channels
for, 155, 160, 163, 225
nationalization and, 142
policy recommendations for India, 162–
65
principles of policy practice (PPPs) and,
160, 165
priority sectors, 148
pros and cons of, 143t7.1, 159–62, 216–17
retaliation for non-elimination of textile
quotas and, 174
Seattle WTO Ministerial Meeting on, 145
in services sector, 19, 71, 121, 124t6.2,
148, 153t7.6
tariffs and, 219
technology transfer, studies of, 157–58
in textiles, 55
theoretical approaches to, 152–56
in transport sector. See transport sector
TRIMs and, 141, 143–44, 155, 159, 162
WTO rules on, 141–67
India’s stance on, 146
WTO working groups’ report on, 144
Foreign Exchange Regulation Act (FERA),
119, 147, 204, 207
Foreign Investment Promotion Board
(FIPB), 120, 204
Foundation for International Law and
Development, 319
free trade
FDI and, 161
intellectual property and, 170
principles of policy practice (PPPs) and,
159–60
fruit and vegetable processing standards,
289
Fry, Maxwell J., 125
GDP, effect of FDI on. See foreign direct
investment
General Agreement on Tariffs and Trade
(GATT), 2, 13
See also World Trade Organization (WTO)
change in articles by WTO panels and
appellate bodies, 299
Group on Environmental Measures and
International Trade (EMIT Group),
301
India as founding member, 17
injunctions on imports most likely in
violation of, 224
purpose of, 329
General Agreement on Trade in Services
(GATS), 3, 67
compared to MSITS and FATS, 69
Doha negotiations on. See Doha Devel-
opment Agenda
e-commerce and, 352, 353t13.8
FDI provisions, 141, 144
India’s stance on, 4, 10, 19, 69–70, 76,
352
mutual recognition agreements (MRAs),
355–56
restrictive business practices (Article IX),
200
scope of, 69
telecommunications sector, 102–3
genetically modified organisms (GMOs),
181, 182
ecolabeling and, 307
peanuts, 275
geographical indications, IP protection for,
185, 343–44
Germany
packaging, marking, and language require-
ments for exports to, 279
pentachlorophenol (PCP) ban initiated
by, 313
global mobile personal communications
by satellite (GMPCS), 86, 88
GMOs. See genetically modified organisms
Government Procurement Agreement
(GPA), 6, 235–67
benefits, 6, 235–38, 250–53, 253t10.7,
255, 264
challenge procedure, 239
costs of, 236–38, 250–51, 254–55
developing countries under, 236, 239,
244
differences from India’s procurement
policy, 7, 243
estimated costs, 253–55
376 India and the WTO

features of, 238–39
India’s position on, 236, 243–45, 256–58,
328, 352–54, 362
objective, scope, and structure, 238, 257
preferential treatment, 241
procurement methods, 240–41
public sector preference, 241–42
transparency and tendering procedures,
6, 238–39, 244, 257
government procurement in India, 240–43,
352–54
See also Directorate General of Supplies
and Disposal (DGS&D)
accession to GPA, reform required for,
255–57
central government including state gov-
ernment purchasing, 255–56
central government purchases, 245,
253t10.7, 260–64
objects of expenditure, 262t10.A.2
shares of total expenditures, 260t10.A.1
threshold levels, 263t10.A.3
construction industry and, 354
corruption and, 253, 255, 354
differences from GPA, 7, 243
grievances and settlement of disputes,
243, 257
example of Himachal Pradesh, 259
indigenous production preferences,
242
methods of procurement, 240–41
position on GPA, 11, 236, 243–45, 256–
58, 352–54, 362
preferential treatment of suppliers, 241
example of Himachal Pradesh, 258
public sector enterprises (PSEs) and,
241–42, 248–50, 249t10.5, 255,
259–60
benefits from GPA accession includ-
ing, 264
example of National Thermal Power
Corp., 259–60
railways, 241, 245–47, 247t10.2
small-scale sector preference, 242,
254–55
social gain from accession to GPA, 253,
254t10.8
state government purchases, 247–48,
249t10.4, 255–56
example of Himachal Pradesh, 258–59
telecommunications, 245–47, 248t10.3
transparency and tendering procedures,
244, 257, 362
example of Himachal Pradesh, 258–59
value of government purchases, 7,
245–50, 251, 252t10.6, 253
GPA. See Government Procurement Agree-
ment
Granger causality test and FDI impact on
GDP, 135, 135t6.7, 136, 137–38
greenhouse gases, 304
grievances. See dispute settlement
gross domestic product (GDP) and FDI.
See foreign direct investment
Gulati, Ashok, 340
Gulf war, 147
H1-B visas, 73–74
HACCP. See Hazard Analysis Critical Con-
trol Point
Hall, Christine, 253
Halle, Mark, 310
Handlooms (Reservations of Articles for
Production) Act of 1985, 60
repeal of, 61
Hank Yarn Obligation, 60, 61
Haridas Exports, 222
harmonization between national and inter-
national standards, 285–86, 294, 355
electronics, 290
food processing, 289
food standards, 288
Harris, R., 214
Harrison, Glenn, 54
Hazard Analysis Critical Control Point
(HACCP), 287, 293, 313–14
hazardous substances, 317
Head, K., 215, 219
health. See food safety; pharmaceuticals;
Sanitary and Phytosanitary (SPS)
Agreement
Henson, Spencer, 273
Herfindahl index for merger review, 209,
210, 228
Index 377
Hertel, Thomas, 54, 55
high technology. See technological devel-
opments
Himachal Pradesh, procurement practices
of, 258–59
Hindustan Lever Ltd. merger with TOMCO,
206, 209
Hoekman, Bernard, 71, 74, 253
Horn, H., 219
ILAC (International Laboratory Accredita-
tion Cooperation), 287
ILO (International Labour Organisation),
11, 362
imports
See also Export and Import Policy (EXIM
Policy) of India; tariffs; specific com-
modity, sector, or agreement
cartels, 200
injunctions against, 223–24
parallel imports under TRIPS, 186–87
quantitative restrictions (QRs) on
imports, 14–15, 17, 18, 205
special import licenses (SILs), 16–17,
280
Indian Competition Act. See Competition
Act (new)
Indian Trade Journal, 241–42
indigenous knowledge. See traditional
knowledge, protection of
industrial countries
See also specific countries
antidumping measures, 344t13.5, 345t13.6
commonality of interests among, 335
environmental concerns of, 302–03
FDI and, 142, 144
patenting, comparison with developing
countries, 188, 189f8.1, 190t8.1, 192
Information Technology Agreement and
tariff rates, 18, 19
infrastructure sector and FDI, 151, 153t7.6,
163
injunctions on imports, 223–24
Insurance Development and Regulatory
Authority, 349
insurance sector, 68, 348
foreign direct investment in, 19
intellectual property, 5, 169–95, 342–44
See also TRIPS (trade-related intellec-
tual property rights)
developing domestic policy instruments
and institutions, 176–78
domestic inventive activity in India,
188–92
comparison of developing countries,
188, 189f8.1, 190t8.1, 192
external pressures and, 188
genetically modified crops, protection
of, 181–85
geographical indications, protection for,
185, 343–44
India’s proposals for WTO protection,
183–85, 192–93, 342–44
indigenous knowledge, protection of,
183–85, 343–44
legislation needed to protect patents,
177, 342–43
licensing, 176–78, 342–43
new technologies and regulatory poli-
cies, 5, 181–83
“nonviolation” exemption, 185–86
nonworking of patents, 187–88
parallel imports, 186–87
plants, patent protection for, 181, 310
public health crises in developing coun-
tries and, 178–81
transfer of technology and, 157–58, 186,
321–22, 357
International Animal Health Code of the
International Office of Epizootics,
277–78
International Laboratory Accreditation
Cooperation (ILAC), 287
International Labour Organisation (ILO),
11, 362
International Monetary Fund’s definition
of trade in services, 68, 69
International Telecommunication Union,
107
International Union for the Protection of
New Varieties of Plants (UPOV), 181
Internet, 86, 89, 91, 104
regulatory reform, 106
summary of ISP policy (1999), 111
378 India and the WTO

investment
See also foreign direct investment; Monop-
olies and Restrictive Trade Practices
Commission
history of Indian policies, 203–05
multilateral investment agreement, 145,
358–59
negotiating stance for India, 11, 328,
335, 362
ISO, 292–93
9000, certification of Food and Agri-
culture Department, 286–87, 292–
93
14000, environmental management stan-
dard, 293
15000, certification of Food and Agri-
culture Department, 286–87
ISO-compliant firms and special import
licenses, 280
ISO/IEC Guide 5B (1993), 287
Japan
crisis cartels in, 228
patenting comparison, 190t8.1
tariff reductions, impact of
agriculture, 30, 36
manufacturing, 37
services, 37
total factor productivity growth (TFPG)
associated with Japanese invest-
ment, 218
Jensen, J.B., 51
Joint Expert Committee on Food Additives
(JECFA), 275, 276
Kapur, Sandeep, 157
Kathuria, Sanjay, 3, 48, 52, 62
Khan, M., 125
Khanna, S., 57, 209
Kidron, Michael, 146
Kokko, Ari, 157
Korea
FDI in India and, 121
FDI into and out of, 149, 156
patenting comparison, 189f8.1, 190t8.1,
192
Kortum, S., 157
Krishna, Kala, 50
Kumar, Nagesh, 157, 209
labor. See employment
laboratory testing and accreditation,
287–88, 295
language requirements for exports, 279
Latin American and FDI, 156
leather industry, 313, 323
See also textiles
Lee, Eric Ah Lik, 253
Lee, Jong-Wha, 157
Lehmann, A., 229
Levinsohn, J., 219
Levy, S., 216
liberalization of trade policy, 13–46
agriculture, 10, 15, 17, 30, 36, 335, 340
computable general equilibrium (CGE)
model for estimating effects of, 14,
31t2.7, 74, 76
costs of, 215
Doha Development Agenda, computa-
tional analysis of impact on India,
2–3, 20–22, 30–38
employment effects, 74, 75t4.3
Export and Import (EXIM) Policy to
simplify policy, 15
Harmonized System (HS) of trade clas-
sification, 15
India’s position on, 327–66
indigenous clearance, 15
pessimism toward, 334–35
quantitative restrictions (QRs) on imports,
14–15, 17, 18
reluctance on part of government to lib-
eralize, 331–32
sectoral impact, 30–41, 335–59
See also specific sectors
of Doha Development Agenda, 38,
40t2.9, 41
of Uruguay Round, 38, 39t2.8, 41
service sectors, 10, 74–75, 346–51
special import licenses (SILs), 16–17,
280
textiles. See Multifibre Arrangement
(MFA)
unilateral liberalization, 41, 42t2.10
Index 379

Uruguay Round, computational analysis
of impact on India, 2, 20–30
licensing
consumer goods, import licensing of, 15
export promotion councils, benefits of,
280
intellectual property produced in India,
342–43
telecommunications, 82, 84, 101, 102,
107–8
See also telecommunications
trade restrictive procedures, 119, 205
TRIPS and patent protection for phar-
maceuticals, 176–78, 192
nonworking provisions, 187–88
Lipsey, Robert, 156
Loader, Rupert, 273
Mahanagar Telephone Nigam Limited
(MTNL), 82–88, 100, 104–5
Malaysia and decline of FDI in, 5
mango pulp, 277
Mani, Muthukumara, 157
Mankiw, N.G., 214
Manual of Statistics of International Trade
in Services (MSITS; UN 2002), 69
manufacturing sector
competitiveness reduced by inefficient
service sectors, 70–71
computational analysis of Uruguay
Round impact and, 21, 30
Factories Act, 317
FDI and foreign control of, 157
liberalization in trade restrictions, 15,
36–37
benefits for India, 38
India’s stance on, 336–39
mergers. See mergers
TRIPS and, 311
Uruguay Round and, 18, 38, 39t2.8, 356
Marine Product Export Development
Authority, 281
marine products. See fish and marine
products
marking requirements for exports, 279
Martin, Will, 48, 55
Matsushita case (U.S. 1986), 220
Mattoo, Aaditya, 237, 351, 352
Mauritius and FDI in India, 121
Mehra, Meeta, 162
mergers
Competition Act provisions, 221, 222–
23
Herfindahl index for merger review,
209, 210, 228
horizontal restrictions, 218–19
MRTP Act provisions, 206–10
permissive approach needed, 225
theoretical literature on, 218–19
trends, 6, 207–09, 208f9.1
Mexico
See also North American Free Trade
Agreement (NAFTA)
patenting comparison, 189f8.1, 190t8.1,
192
tariff reductions, impact of, 36
textile industry, 50
tire exports to, 279
MFA. See Multifibre Arrangement
MFN. See most-favored nation (MFN)
status
MIGA. See Multilateral Investment Guar-
antee Agency
milk and milk products, 277–78, 288,
340
minerals sector and private investment,
148
Ministry of Communications and Infor-
mation Technology, 104–5
Ministry of Environment and Forests,
315–16
Ministry of Food and Consumer Affairs,
280
Ministry of Food Processing, 289
Misra, Sanjeev, 60
Monopolies and Restrictive Trade Prac-
tices Commission, 203, 205–06, 210,
212, 220
See also Monopolies and Restrictive
Trade Practices (MRTP) Act
Monopolies and Restrictive Trade Prac-
tices (MRTP) Act, 6, 148, 205–14
comparison to new Competition Act,
221–24
380 India and the WTO
“effects” doctrine, 206
investment approvals under, 204
mergers, 206–10
predatory pricing, 212–14
proposed legislation to replace, 197
restrictive trade practices (RTPs), 210–11
unfair trade practices, 222
Montreal Protocol, 304, 311
most-favored-nation (MFN) status
of China, 330
Government Procurement Agreement
provision, 238
of India, 17, 337
MRAs (mutual recognition agreements),
355–56
MSITS (Manual of Statistics of International
Trade in Services; UN 2002), 69
MTNL. See Mahanagar Telephone Nigam
Limited
Multifibre Arrangement (MFA)
abolition, 2, 3, 47–66, 171, 335
dispute-settlement system of WTO as
option, 333
using TRIPS as retaliatory weapon for
non-elimination, 172–76, 193, 333,
342
basic economics of, 48–51
computational analysis of Uruguay
Round impact, 20, 29
exports to U.S. and European Union,
52–54, 53t3.1
effect of NAFTA, 333, 337–38, 339f13.3
export tax equivalents and, 3, 51–54,
62
market equilibrium
in absence of quotas, 49f3.1
in presence of quotas, 49f3.2
nontariff barriers (NTBs) and, 51
quotas and export restrictions, 48,
50–51, 338
multilateral investment agreement
considered at 2001 Doha meeting, 145
pros and cons, 358–59
Multilateral Investment Guarantee Agency
(MIGA), 120, 148
multilateral trade negotiations, 8–9
India’s stance on, 327–66
liberalization under Uruguay Round
and Doha Development Agenda,
14, 41, 42t2.10, 43
technical barriers, 327–66
See also technical barriers to trade
multinational corporations
entry into developing countries, 208–09,
216
FDI and, 155, 160, 163
scrutiny for entry and mergers involving,
225
mutual recognition agreements (MRAs),
355–56
NAFTA. See North American Free Trade
Agreement
National Accreditation Board for Testing
(NABL), 287–88
National Community Gene Fund, 184
National Conservation Strategy and Policy
Statement on Environment and
Development, 315
National Council of Applied Economic
Research-University of Michigan
computable general equilibrium
(CGE) model. See liberalization of
trade policy
nationalization and foreign direct invest-
ment, 142
National Quality Council, 291–92
National Task Force on Information Tech-
nology and Software Development,
73
National Telecom Policy of 1994 (NTP 94),
4, 82, 88–91, 108
National Textile Policy of 2000, 61
National Thermal Power Corp., procure-
ment practices, 259–60
Nepal. See South Asian countries
New Telecom Policy of 1999 (NTP 99), 82,
88–91, 347
goals of, 99–100
interconnection between service provi-
ders, 92–93
Internet service providers, 86, 111
recommendatory role of TRAI under,
107
Index 381

TRAI recommendations to help imple-
ment, 114–15
New Trade Theory, 23, 28–29, 237
New Zealand. See Australia-New Zealand
NIC-NET, 241
Nolan, S., 216
nontariff barriers (NTBs), 51, 205, 269–70,
274–75, 293–94
See also food safety; technical barriers to
trade
nonworking of patents, 187–88
North American Free Trade Agreement
(NAFTA)
competition policy, 200
effect on South Asian exports, 54–55
impact on multilateral engagement, 9,
333, 337–38, 339f13.3, 359
NTBs. See nontariff barriers
NTP 94. See National Telecom Policy of
1994
NTP 99. See New Telecom Policy of 1999
Olarreaga, M., 351
Open General License (OGL) list of good
to be traded, 147
outsourcing
government procurement, savings from,
253
in textile industry, 57–58
U.S. companies sending software devel-
opment work to India, 73, 349
ozone-depleting substances, 304
packaging, marking, and language require-
ments, 279, 280, 313
Pakistan. See South Asian countries
Panama communiqué for dealing with
cartels, 200
patents. See intellectual property
PCP ban, 313
peanut exports and nontariff barriers,
275–77
pentachlorophenol (PCP) ban, 313
Persson, Hakan, 157
pessimism toward liberalization of trade
policy, 334–35
pesticides, 306, 313
pharmaceuticals
AIDS drugs for African countries, 178–
81
legislation for IP protection, 181, 193
nonworking of patents, 187–88
TRIPS and, 170, 172, 173, 176, 192
liberal licensing, 178, 335
plants, patent protection for, 181, 310
See also biotechnology
Pohit, Sanjib, 20
Pray, C.E., 181
predatory pricing, 200, 210, 212–14, 219–
21
Prevention of Food Adulteration Act, 280
price fixing, 6, 201, 210
procurement practices of government. See
government procurement in India
PSEs. See public sector enterprises
Public Enterprises Survey (1997/98), 250
public health. See pharmaceuticals; Sani-
tary and Phytosanitary (SPS)
Agreement
Public Liability Insurance Act of 1991, 317
public sector enterprises (PSEs), 241–42,
248–50, 249t10.5, 255
benefits from GPA accession including,
264
example of National Thermal Power
Corp., 259–60
Pursell, Gary, 237, 238, 241
quantitative restrictions (QRs) on imports,
14–15, 17, 18, 205
railways
See also transport sector
FDI and, 19
procurement practices, 241, 245–47,
247t10.2
Ramaswami, B., 181
Ramaswami, V.K., 159
Rashid, Aneesa I., 158
regional trade arrangements
competition agreements, 199
impact on multilateral engagement, 333
textile industry, 50, 54–55
trade diversion and, 10, 54–55, 337, 362
382 India and the WTO

Reserve Bank of India, 120, 148–49
restrictive trade practices (RTPs), 210–11
Richardson, J.D., 237
Ries, J., 215, 219
Robinson-Patman Act, 228
royalty payments under TRIPS, 177–78
Rutherford, T., 54
Sandesara, J.C., 210
Sanitary and Phytosanitary (SPS) Agree-
ment, 7, 19, 271–79
See also food safety
Bureau of Indian Standards, role under,
281–86, 294
See also Bureau of Indian Standards
(BIS)
domestic institutional framework for
implementing, 279–92
export inconsistencies, 273
harmonization between national and
international standard, 286
NTBs and, 274–75
technical assistance for developing coun-
tries, 272–73
transparency provision, 273
Scherer, F.M., 229
Schive, C., 157
Schuknecht, L., 352
sea turtles as endangered species, 318–
19
Secretariat for Industrial Assistance/
Foreign Investment Promotion
Board, 148–49
Securities and Exchange Board of India,
206, 349
services sector
See also specific type of service (e.g., tele-
communications)
Doha Development Agenda
computational analysis of impact on
India, 21, 37, 74, 75t4.3, 76
India’s stance on, 359
domestic reform, 347–49
effect on effective rates of protection
(ERPs), 70–71
foreign affiliate trade in services (FATS),
69
foreign direct investment in, 19, 71,
153t7.6
GATS and, 3, 67, 69–70, 76
See also General Agreement on Trade
in Services (GATS)
growth of, 81
IMF definition of, 68
liberalization of trade in, 10, 74–75,
346–51
Manual of Statistics of International
Trade in Services (MSITS; UN
2002), 69
software case study, 71–74
types of trade in services, 68–69
value of trade in services, 70t4.1
settlement. See dispute settlement
shipping and mailing services, 68
See also transport sector
Shrimp-Turtle case, 303, 318–19
Singapore Ministerial Conference (1996)
See also specific working groups
competition in trade study by working
groups, 5–6, 197
See also Working Group on Competi-
tion Policy
India’s stance on implementing Singapore
issues, 198, 243
Singh, J., 210
Sinha, Yashwant, 163
small businesses
competition protections, 230
ecolabeling requirements and, 306
electronics, 290
environmental issues and market access,
312, 314, 322
government procurement in India
National Small Industries Corpora-
tion registers, 241
small-scale sector preference, 242,
254–55
soda ash, 212, 218, 221
software industry
case study of India’s success, 3, 71–73
cross-country comparison of costs, 349,
350t13.7
outsourcing from U.S. to India, 73,
349
Index 383

Uruguay Round and tariffs, 18
South Asian Association for Regional
Cooperation, 275
South Asian countries and FDI, 118,
127–36, 150, 150t7.3, 156
special import licenses (SILs), 16–17, 280
spices, quality assurance for, 280
SPS. See Sanitary and Phytosanitary (SPS)
Agreement
Sri Lanka. See South Asian countries
Srinivasan, T.N., 19, 159
standard-setting systems, 8, 281–95, 354–
57
See also food safety; specific headings
starting with “ISO”
Bureau of Indian Standards, 281–86,
294, 322
Code of Good Practice to be adopted by
standard-setting bodies, 284–85
domestic bodies involved in, 281–92
domestic product standards, 280, 356–
57
Electronics Standardization, Testing and
Quality Certification Department
(STQC), 289–91
export promotion institutions and, 281
India’s participation in, 8, 11, 295, 322,
362
international institutional framework,
292–93
literature review, 270–79
National Accreditation Board for Test-
ing (NABL), 287–88
National Quality Council, 291–92
“necessity” test for, 356, 362
negotiating stance for India, 11
Sanitary and Phytosanitary (SPS) Agree-
ment, 271–79
shortcomings of, 294–95
strengthening of multilateral disciplines
on standards, 356
state governments
environmental regulation, 316, 317
purchasing, 247–48, 249t10.4, 258–59
steel industry, 218
export restrictions to Australia and
New Zealand, 279
public sector enterprises (PSEs) in, 248
Steil, B., 229
STQC (Electronics Standardization, Testing
and Quality Certification Depart-
ment), 289–91
strategic trade policy, 215
Stykolt, S., 214
subcontracting in textile industry, 57–58
Subramanian, Arvind, 172
sugar, 288, 340
Suphachalasai, S., 48
Supreme Court of India on MRTP Act pro-
visions, 206–07, 222, 223
Supreme Court, U.S., on predatory pric-
ing, 220
synthetic fibers, textile industry bias against,
58–60
removal of, 61
Taiwan
patenting comparison, 189f8.1, 190t8.1,
192
textile industry, 57
Tan, L., 50
tariffs
See also specific items subject to (e.g., agri-
culture, telecommunications, textiles)
bound rates and applied rates of duty,
18, 18t2.3, 331, 337t13.2
agriculture, 340, 341t13.4
manufacturing, 336
cross-country comparison of average
rates, 336f13.2
electronic commerce and, 351–52
FDI and, 219
India’s stance on reductions, 10, 15–16,
336–39, 359
justification for, 160
nontariff barriers. See nontariff barriers
(NTBs)
by products, average import-weighted
rates (1990–1998), 16, 17t2.2
protective increases, 15
reductions, 119–20, 205, 269
of Uruguay Round and Doha Devel-
opment Agenda, 14
structure from 1990/91 to 1997/98, 16t2.1
384 India and the WTO

telecommunications, 93–96
Tarr, D., 54
taxation
agricultural export profits, exemption
for, 340
conservation and prevention of pollu-
tion, exemption for, 318
FDI, incentives for, 161
hank yarn, exemption for, 60
Tax Reforms Committee, 15–16
TBT Agreement. See Technical Barriers to
Trade (TBT) Agreement
TDSAT (Telecom Dispute Settlement and
Appellate Tribunal), 105
tea, 323
packaging of, 313
pesticide residue and, 313
technical assistance for developing coun-
tries
expertise for agricultural testing and
standards, 295
Sanitary and Phytosanitary (SPS) Agree-
ment, 272–73
technology transfer as goal of, 321–22
technical barriers to trade, 7, 269–98, 354–57
See also Technical Barriers to Trade
(TBT) Agreement
documentation on WTO compliance
activities needed, 294
Export and Import Policy (EXIM Pol-
icy) of India, 279–80
food safety, 274–78
See also food safety
literature review, 270–79
mutual recognition agreements (MRAs),
355–56
standards, 281–95
See also standard-setting systems
Technical Barriers to Trade (TBT) Agree-
ment, 7, 19, 269
Bureau of Indian Standards’ role, 282,
294
domestic institutional framework for
implementing, 279–92
ecolabeling programs and, 305–07
environmental precautionary principles
and, 319
harmonization. See harmonization bet-
ween national and international
standards
India’s stance on, 362
mutual recognition agreements (MRAs),
355
NTBs and, 274–75
technological developments
FDI and, 119, 120, 153, 157–58
Internet and e-commerce. See electronic
commerce; Internet
IP and regulatory policies for, 181–83
transfer of technology and, 186, 321
telecommunications, 99–100
technology dumping, 155, 161
Telecom Dispute Settlement and Appellate
Tribunal (TDSAT), 105
telecommunications, 3–4, 81–116
See also Telecommunications Regulatory
Authority of India (TRAI)
basic services
providers and areas of operation, 82,
84, 84t5.2, 90–91, 101
subscriber base, 83t5.1
Bharat Sanchar Nigam Limited (BSNL),
82–88, 100
broadcasting and, 97–98
cellular-mobile market, 84, 86, 109, 110
court decisions on, 102
providers and areas of operation,
87t5.4
subscriber base, 85t5.3
tariff restructuring, 96
chronology of deregulation, 112–13
competition, 100–02, 108
market structure, 88t5.5
consumer welfare, 100, 110
convergence of technologies, 97–99, 106
existing structure of sector, 82–88
foreign direct investment in, 19, 121,
124t6.2, 348
global mobile personal communications
by satellite (GMPCS), 86, 88
government procurement, 245–47,
248t10.3
government retention of licensing pow-
ers, 107–8
Index 385
interconnection issues, 91–93, 104, 109
International Telecommunication Union’s
views, 107
Internet. See Internet
key policy issues, 91–108
long-distance services, 84, 101–2, 347f13.4
Mahanagar Telephone Nigam Limited
(MTNL), 82–88, 100, 104–5
National Telecom Policy of 1994. See
National Telecom Policy of 1994
(NTP 94)
New Telecom Policy of 1999. See New
Telecom Policy of 1999 (NTP 99)
quality of service, 100
regulatory reform, assessment of, 106–8,
110–11
regulatory structure, 102, 104–5
revenue contribution of, 109
by different subscriber groups, 95t5.6
tariffs, 93–96, 101–2
technological developments, 99–100
trade in services of, 68
value-added services, 82, 86, 110
WTO issues, 102–4
Telecommunications Regulatory Authority
of India (TRAI), 4, 86, 102, 105, 108,
349
on interconnection issues, 93, 104, 109
licensing powers, 107–8
recommendations from to help imple-
ment NTP 1999, 114–15
recommendatory role of, 107
regulatory reform and, 106
Telecommunications Tariff Order, 86,
94, 96
Textile Policy of 1985, 59
textiles
See also Multifibre Arrangement (MFA)
bias against synthetic fibers, 58–60
removal of, 61
comparison of India with other South
Asian countries, 57–58
competition in future, 63
decentralized production, 57–58
disincentives to factory production,
57–58, 61
domestic policy constraints in India, 57–61
employment rates, projections, 38, 39t2.8,
40t2.9, 41
fabricators and subcontracting, 57–58
foreign direct investment in, 55, 124t6.2
handloom sector policy, 60, 61
Hank Yarn Obligation, 60, 61
imported fabrics for export production,
61–62
key policy imperatives, 61–62
machinery by country, average number
by each apparel export firm, 64n14
National Textile Policy of 2000, 61
powerlooms, 60
tariff rates on, 17, 18, 337
transport cost margins for exports to
U.S., 348, 348f13.5
welfare effects of reforms that raise pro-
ductivity in, 55–56, 55t3.2
tire exports, 278–79
TOMCO merger with Hindustan Lever
Ltd., 206, 209
total factor productivity growth (TFPG),
217–18
trade barriers. See nontariff barriers (NTBs);
tariffs; technical barriers to trade
trade diversion. See regional trade arrange-
ments
trademarks. See intellectual property;
TRIPS (trade-related intellectual
property rights)
trade-related intellectual property rights.
See TRIPS
trade secrets. See intellectual property;
TRIPS (trade-related intellectual
property rights)
traditional knowledge, protection of,
183–85, 311, 312, 321, 343–44
TRAI. See Telecommunications Regulatory
Authority of India
TRAMs (trade-related antitrust measures),
201
transfer of technology. See intellectual prop-
erty
Transparency International’s estimate of
noncompetitive government pro-
curement, 253
transport sector, 68, 348
386 India and the WTO

See also automobile industry
airlines, 348
competition and cartels, 357
foreign direct investment in, 121, 124t6.2,
148, 348
maritime transport services, 348
textile exports and transport cost mar-
gins, 348, 348f13.5
travel services, 68
TRIMs. See Agreement on Trade-related
Investment Measures
TRIPS (trade-related intellectual property
rights)
AIDS crises and needed drugs, 178–81
biotechnology and. See biotechnology
Committee on Trade and Environment
(CTE), role of, 301
compulsory licensing and competition
policy, 176–78
nonworking of patents, 187–88
Convention on Biological Diversity (CBD)
and, 184
developing domestic policy instruments
and institutions for, 176–78
drug licensing. See pharmaceuticals
as enforcement device, 5, 171–76
environmental considerations and, 8,
300, 310–12
negotiating stance for India, 10, 170–71,
188, 192–93, 310, 321, 328, 361
using TRIPS as retaliatory weapon for
non-elimination of textile quotas,
172–76, 193, 333, 342
“nonviolation” complaints, 185–86
parallel imports, 186–87
royalty payments, 177–78
Turkey
tariff reductions, impact of, 36
textile industry, 50, 55
unilateral liberalization of trade policy, 41,
42t2.10
United Kingdom
Fair Trading Act of 1973, 228
FDI in India and, 121
FDI into and out of, 149
peanut testing standards, 276–77
United Nations Conference on Trade and
Development (UNCTAD), 145–46,
199, 216
environmental concerns and, 313, 314,
322
liner code for cargo sharing, 348
World Investment Report (1997), 208, 217
United Nations Manual of Statistics of
International Trade in Services
(MSITS 2002), 69
United States
anticompetition complaints against U.K.,
199–200
Antidumping Act of 1916, 224
antitrust laws, 228
electronics standards, 290
Endangered Species Act, 318–19
environmental issues and scientific cer-
tainty, 307
exports of textiles to, 52–54, 53t3.1, 62
FDI into and out of, 149
food safety
beef hormones, 307
genetically modified organisms, 307
as investor in India, 121, 147
merger policy, 228–29
patenting comparison, 190t8.1
pharmaceutical sector and AIDS drugs
for Africa, 180
SPS measures used in, 274
tariff reductions, impact of
agriculture, 30
manufacturing, 37
services, 37
total factor productivity growth (TFPG)
associated with U.S. investment,
217–18
United States Trade Representative (USTR)
Report on Foreign Trade Barriers (2000
& 2001), 211
requesting ANSAC’s access to Indian
market, 212
University of Michigan computable gen-
eral equilibrium (CGE) model. See
liberalization of trade policy
UPOV (International Union for the Protec-
tion of New Varieties of Plants), 181
Index 387

Uruguay Round, 301
abolition of textile quotas. See Multifi-
bre Arrangement (MFA)
combined liberalization effects, 21, 30
computational analysis of impact on
India, 2, 20–30, 43
computational scenarios, 20–22
economies and regions of the model,
21t2.4
elimination of MFA quota constraints,
29
Heckscher-Ohlin model compared, 28
New Trade Theory features used in,
23, 28–29
results of liberalization, 23–30, 24t2.6
sectors of production, 21t2.5
Stolper-Samuelson theorem, 28
General Agreement on Trade in Ser-
vices. See General Agreement on
Trade in Services (GATS)
injunctions on imports most likely in
violation of Antidumping Agree-
ment, 224
manufactured goods and reduced tar-
iffs, 21, 30
standards setting, 356
tariff-binding commitments by devel-
oping countries, 17–18, 331, 336
TRIPS and, 170
vegetable processing standards, 289
Watal, Jayashree, 172
Water Act of 1974, 316
water pollution, 315, 316, 317
See also environmental issues
Wheeler, David, 157
Whinston, M., 214
wines and spirits
geographical indications, IP protection
for, 185
tariffs, 205
Working Group on Competition Policy,
197, 198, 225
Indian submission to, 202–03
Working Group on Transparency in Gov-
ernment Procurement, 243–44,
354
World Bank study on government con-
tracting, 253
World Intellectual Property Organisation’s
database on traditional knowledge,
321
World Trade Organization (WTO), 2, 13
See also General Agreement on Tariffs
and Trade (GATT)
Committee on Trade and Environment
(CTE), 299, 301–02, 321
ecolabeling programs and, 305
mainstreaming of environmental
issues, 308–09
competition. See Working Group on
Competition Policy
cross-retaliation, availability of, 174
dispute-settlement system, 9, 318, 320,
332–33
summary indicators (1995–2001),
332t13.1
foreign direct investment rules, 141–67
India as founding member, 17
India’s stance in, 327
institutional framework for standards,
292–93
least-trade restrictiveness test of, 292
purpose of, 329
SPS. See Sanitary and Phytosanitary (SPS)
Agreement
TBT. See Technical Barriers to Trade
(TBT) Agreement
telecommunications issues, 102–4
TRIPS. See TRIPS (trade-related intel-
lectual property rights)
Zejan, Mario, 156, 157
388 India and the WTO