india and the coronavirus pandemic
TRANSCRIPT


India and the Coronavirus Pandemic:
Economic Losses for Households
Engaged in Tourism and Policies for
Recovery
Study sponsored by
The Ministry of Tourism, Government of India
September 2021
NATIONAL COUNCIL OF APPLIED ECONOMIC RESEARCH
NCAER India Centre, 11 Indraprastha Estate, New Delhi 110002. INDIA.
© National Council of Applied Economic Research, 2021
All rights reserved. The material in this publication is copyrighted. NCAER encourages the
dissemination of its work and will normally grant permission to reproduce portions of the work
promptly. For permission to reprint any part of this work, please send a request with complete
information to the publisher below.
Published by
Professor Anil K. Sharma
Secretary and Operations Director
National Council of Applied Economic Research
NCAER India Centre
11, Indraprastha Estate, New Delhi–110 002
Tel: +91-11-2345 2657, 6120 2698
www.ncaer.org
Publications Coordinator Jagbir Singh Punia The findings, interpretations, and conclusions expressed are those of the authors and do not necessarily
reflect the views of the Governing Body or Management of NCAER.
Study Team
Project Leader: Dr Poonam Munjal
Consultant: Dr Dripto Mukhopadhyay
Research Team: Mr K. A. Siddiqui, Mr Devender Pratap, Mr Asrar Alam
Editor: Ms Anupma Mehta
Secretarial Assistance: Ms Shashi Singh
India and the Coronavirus Pandemic: Economic Losses for Households Engaged in Tourism and Policies for Recovery
National Council of Applied Economic Research i
Foreword
The advent of the Coronavirus or COVID-19 pandemic since March 2020 has led
to multiple challenges for both economies and health systems across the world. The
outbreak of the disease continued globally for several months, claiming the lives of
millions of people while simultaneously triggering a decline in almost all economies. In
India, although the severity of the first wave of the disease reduced somewhat towards
the end of 2020, the arrival in early 2021 of the second wave, which is still continuing in
many countries, dealt another shock to economies, with the fear of a third wave
compounding the situation and adversely affecting both economic revival and people’s
confidence. The repeated lockdowns announced by various governments to arrest the
spread of the disease, wherein only the sale of essential commodities was exempted, also
brought all economic activity to a standstill for sustained periods. Even after
announcing phased unlocking, most of the countries have had to follow strict protection
norms for resuming productive activities in order to ensure the safety of their
populations. Among the businesses that have been most profoundly affected by the
pandemic, the tourism and hospitality businesses have taken big hits.
India is among the countries that have been worst affected by the pandemic. With
a consistent rise in the number of infections and mortalities, the Indian Government has
been compelled to implement a slew of measures entailing social distancing, community
lockdowns, work-from-home, self-imposed or mandatory quarantines, and curbs on
crowding by shutting down or curtailing rail and air travel, and inter-state public road
transport, all of which have brought tourism activities to a near-halt for several months.
Since India is one of the favoured tourist destinations for both domestic and
international tourists due to its unique natural endowments, culture, and hospitality, its
tourism industry generates employment opportunities for millions of job-seekers.
Tourism is estimated to have directly contributed 2.7 per cent to GDP and 6.7 per cent to
the employment of the country in 2019-20. If indirect contribution were to be included
in these estimates, the corresponding shares would go up to 5.2 per cent and 15.3 per
cent, respectively. However, the pandemic has not only jeopardised the growth
prospects of the sector but also caused a significant economic slump, which the sector
would take some time to recover from.
It is, therefore, critical for policy-makers to assess the economic repercussions of
the pandemic in real time to facilitate policy initiatives for restoring and supporting
livelihoods for households without compromising on their health and protection. It is in
this context that NCAER has conducted this study with the objective of measuring the

India and the Coronavirus Pandemic: Economic Losses for Households Engaged in Tourism and Policies for Recovery
National Council of Applied Economic Research ii
actual impact of the pandemic on the tourism sector in India in terms of loss of income
and employment both overall in the sector as well as in individual households. The
study also provides a roadmap for recovery of the sector, outlining various policy
recommendations that would enable the sector to achieve its pre-pandemic status.
I take this opportunity to thank Shri Arvind Singh, Secretary, Ministry of
Tourism, for initiating this critical and timely study. The NCAER team is grateful to him
for providing valuable comments, allowing us to enrich and bolster the report. The team
also wishes to thank other senior officials in the Ministry of Tourism, including Mr Gyan
Bhushan, Economic Adviser; Ms Rupinder Brar, Additional Director General; and Mr
Rakesh Kumar Verma, Joint Secretary, for offering their insights in carrying out this
study. The team also expresses its gratitude to all the officials of the Market Research
Division, Ministry of Tourism, including Ms Anita Baghel, Additional Director General;
Mr Fakhre Alam, Director; Ms Kirti Gaikwad, Deputy Director; Mr Vinod Kumar,
Assistant Director; and Mr Ujjaval Srivastava, Assistant Director, for their continued
support through the course of the study.
The NCAER team that undertook this study, led by Dr Poonam Munjal, Senior
Fellow, included Mr K.A. Siddiqui, Senior Fellow; Mr Devender Pratap Rana, Fellow;
and Mr Asrar Alam, Senior Research Analyst. The team was also supported by an
external Consultant, Mr Dripto Mukhopadhyay. I hope that this study will not only help
drive policy for the recovery of the tourism sector in India but also prove to be a useful
contribution in the long run to the literature on tourism for both policy-makers as well
as the research fraternity.
New Delhi Dr Poonam Gupta
September 2021 Director General, NCAER

India and the Coronavirus Pandemic: Economic Losses for Households Engaged in Tourism and Policies for Recovery
National Council of Applied Economic Research iii
Contents
Foreword .............................................................................................................................................................. i
Executive Summary ........................................................................................................................................... v
I. Background .................................................................................................................................................. 1
II. Key Objectives of the Study ....................................................................................................................... 4
III. Approach and Methodology ...................................................................................................................... 5
IV. Impacts of the Pandemic on the Tourism Economy, Employment and Income ................................ 7
IV.1. The Tourism Economy in a Normal Situation ........................................................................................................... 7
IV.2. The Tourism Economy during the Covid-19 Pandemic ........................................................................................ 9
Impact due to the Supply-side Shock ..................................................................................................... 10
Impact due to the Demand-side Shock .................................................................................................. 12
Impact due to the Inbound and Domestic Demand Shocks ................................................................ 14
Share of the TDGVA in the Overall GVA................................................................................................ 15
Estimated Loss in Jobs during the Study Period .................................................................................. 15
Estimated Loss in Household Income during the Study Period ........................................................ 19
IV.3. Tourism Economy Going Forward—Future Outlook .......................................................................................... 22
V. Perspectives on the Tourism Industry Recovery Measures ................................................................ 28
VI. Recommendations for the Revival of Tourism in India ....................................................................... 36
VI.1. Promotion of Domestic Tourism ................................................................................................................................... 37
VI.2. Diverting Outbound Tourists to Domestic Trips .................................................................................................. 40
VI.3. Target Incentives to Industries Contributing Most to the Tourism Economy ....................................... 41
VI.4. Other Recommendations ................................................................................................................................................... 42
Appendix I ..................................................................................................................................................... 43
Table A1: GVA by Industries ....................................................................................................................................................... 43
Table A2: TIRs and TDGVA to Estimate Impact due to Overall Economic Slowdown (Rs. lakh) ......... 44
Table A3: TIRs and TDGVA to Estimate Impact due to Combined Demand Shock ..................................... 45
Table A4: TIRs and TDGVA to Estimate Impact due to Inbound Tourism Demand Shock ..................... 46
Table A5: TIRs and TDGVA to Estimate Impact due to Domestic Tourism Demand Shock .................... 47
Table A6: Estimated Number of Total jobs in Tourism-characteristic Industries ......................................... 48
Table A7: Estimated Number of Employees in Tourism-characteristic Industries ....................................... 48
Table A8: Estimated Number of Self-employed in Tourism-characteristic Industries ............................... 49
Table A9: Estimated Wage and Non-wage Income in Major Tourism-characteristic Industries (at
Constant Prices) ..................................................................................................................................................................... 49
Table A10: Estimated Number of tourist Arrivals by Forms of Tourism and across Different
Scenarios .................................................................................................................................................................................... 50
Appendix II ....................................................................................................................................................... 51
Table A12: Quarterly Estimated Domestic Tourist Arrivals ....................................................................................... 51
Appendix III ...................................................................................................................................................... 52
Table A13: Aggregation Scheme of Household Income ................................................................................................ 52
Appendix IV ...................................................................................................................................................... 54
Table A14: Schematic Structure of the SAM ....................................................................................................................... 56

India and the Coronavirus Pandemic: Economic Losses for Households Engaged in Tourism and Policies for Recovery
National Council of Applied Economic Research iv
India and the Coronavirus Pandemic: Economic Losses for Households Engaged in Tourism and Policies for Recovery
National Council of Applied Economic Research v
Executive Summary
Background
The spread of Coronavirus has impacted the tourism sector drastically all over the world.
Be it aviation or hospitality, transportation, tour operators or eateries, every activity
related to tourism has been adversely affected in an unprecedented manner. India has
been no exception. During the first wave itself, the sector was affected the most among all
other economic sectors. The industry saw gradual signs of recovery, post-October 2020,
for the next three-four months. However, the sudden surge in cases from March 2021
onward stalled tourism activities almost completely except for a few special occasions to
selective locations.
This grim scenario triggers a thorough understanding of the estimated losses at a granular
level and how to recuperate in the coming days. A roadmap on recovery is a must not only
because tourism is the largest contributor to the economy and employment, but also
because a large chunk of the population of the country is directly or indirectly linked to
activities in the tourism sector. However, the implementation of any policy measures to
support the tourism sector and the affected households requires a systematic estimation
of the losses and requirements of relief. Thus, resilient policies are needed to address
these challenges at all levels to put back the tourism sector on the path it was traversing
before the pandemic.
This study captures the economic losses resulting from the changes experienced during
the entire period of the pandemic with the help of data from different sources that reflect
changes over the said period. The study also probed the likely recovery phases of the
tourism sector post the pandemic in order to understand how the sector would regain its
pre-pandemic position.
Objectives of the Study
This study aims to assess the estimated loss to the economy and to the income of
households because of the COVID-19 pandemic. The key objectives of the study are:

India and the Coronavirus Pandemic: Economic Losses for Households Engaged in Tourism and Policies for Recovery
National Council of Applied Economic Research vi
Quantify the sector-wise (or industry-wise) direct and indirect impacts of tourism
activities on the overall economy, and especially on household income, which may be
further disaggregated into different types of households like formal and informal;
Quantify the sector-wise loss in income, and in the overall economy and of the
household sector; and also the loss in jobs due to the impact of the Coronavirus pandemic
on the tourism sector;
Estimate the impact of the gradual opening up of domestic tourism activities and the
sectors related to tourism;
Estimate the likely impact of the opening of international tourism, in a phased manner;
and
Propose policy measures appropriate for providing relief to the tourism sector, in
general, and households involved in tourism-related activities, in particular, based on
feedback received from various stakeholders.
Approach and Methodology
The study captures the impact of the pandemic on the Indian tourism sector from a 360
degree perspective. It looks into the sectoral activity level to understand its contribution
to employment and GDP, and finally into the income loss, especially for households that
are directly or indirectly involved with tourism activities. The study has also used macro-
economic modelling including the Input-Output model and Social Accounting Matrix.
This facilitated capturing of the multiplier effects that reflect the economy-wide impacts
emanating from the loss of tourism activities.
In order to quantify the economic impact of the fall in tourism activities on Gross Value
Added (GVA), the study estimated the values of Tourism Direct GVA (TDGVA) from the
following perspectives:
Tourism economy in a normal situation;
Tourism economy due to the supply-side shock caused by the COVID-19 pandemic;
Tourism economy due to the demand-side shock caused by the COVID-19
pandemic, which can be further dissected into:
o Inbound tourism demand-side shock; and
o Domestic tourism demand-side shock.

India and the Coronavirus Pandemic: Economic Losses for Households Engaged in Tourism and Policies for Recovery
National Council of Applied Economic Research vii
The TDGVA for each tourism industry has been estimated by applying the Tourism
Industry Ratios (TIRs) on the industry’s overall GVA. The TIRs indicate the part of GVA
which is on account of Tourism. This has been done in the Supply and Use Table (SUT)
framework of the Tourism Satellite Account (TSA). In a normal situation and in the case
of an impact caused by a supply shock, the TIRs are assumed to be the same as those
derived in the TSA for 2015-16.
In order to estimate the impact of the demand-side shock, the study required an
estimation of tourism demand during the study reference period, which covers the
pandemic situation, that is, the first three quarters of 2020-21 [till the latest data on GDP
are available from the Ministry of Statistics and Programme Implementation, (MoSPI)].
This, in turn, required the estimates of inbound and domestic tourist arrival during the
same period, which were provided by the Ministry of Tourism (MoT). The new TIRs were
derived by applying the quarter-wise year-on-year fall in the number of inbound and
domestic tourists on the inbound and domestic tourism expenditure, respectively.
Further, in order to estimate the loss in jobs in the tourism sector, the key data source
used in this study were the employment data obtained from the Periodic Labour Force
Survey (PLFS) conducted by MoSPI. The PLFS provides annual employment estimates.
In order to derive the estimates at the quarterly level, employment elasticities were used.
The study also estimates the loss in jobs by work status, that is, employees and the self-
employed.
Besides, the study estimates the impact on income of the households engaged in tourism
activities. The income estimates have also been categorised into income drawn by
employees (wage income) and income earned by the self-employed (non-wage income).
The data for this exercise were sourced from the National Accounts Statistics, 2021, and
through estimation at the sectoral level. In addition, estimation was also done at the
quarterly level using the SUT framework of TSA and using the growth estimated in the
number of employees and self-employed respectively.
This study also presents the expected outlook for the tourism sector in the coming years
and answers questions on the time required for the revival of the sector and the expected
time by which the tourism economy will reach the pre-pandemic levels. This points to the
number of years lost due to the pandemic, the aftermath of which continues to be felt.
This is followed by a section on Recommendations proposed for the revival of the tourism
sector in India, based on international experiences and feedback from stakeholders.
India and the Coronavirus Pandemic: Economic Losses for Households Engaged in Tourism and Policies for Recovery
National Council of Applied Economic Research viii
Key Findings
The Tourism Economy in a Normal Situation
The Tourism Satellite Account (TSA) is an important tool for estimating the
contributions of tourism to the economy. According to the second and third TSAs,
the tourism sector contributed as much as 6.8 per cent and 5.2 per cent directly
and indirectly to the country’s total GDP. The direct shares for these years were 3.7
per cent and 2.7 per cent, respectively.
For the present study, we have also derived the income multiplier to estimate the
impact of an increase in tourism demand on the overall household income of the
economy through the preparation of a Social Accounting Matrix (SAM). This is
because SAM constitutes not only the production account but also incorporates the
household account. Hence, it presents the transactions between the production
sectors and the households drawing income from these sectors. The SAM-based
multiplier analysis reveals that the income multiplier of the tourism sector is
1.6332. Hence, if the tourism demand or tourism expenditure increases by, say, Rs.
1 crore, then owing to the direct and indirect linkages among the sectors of the
economy, the overall household income of the economy is expected to increase by
Rs. 1.63 crore.
The Tourism Economy during the COVID-19 Pandemic
The impact of the pandemic on tourism has been captured through the estimation of
TDGVA for all the three quarters of 2020-21, and across the following aspects in such a
way that the impact of the pandemic due to different types of shocks has been captured
separately.
Impact due to the Supply-side Shock: This relates to the overall economic
slowdown during 2020-21 and assumes that tourism was rather resilient and
continued as before. Hence, this scenario takes into account only the supply-
side shock. Therefore, the TIRs are assumed to remain the same for all the
quarters of 2020-21 as those for pre-pandemic years. The findings are as
follows:
o While the overall economy fell by 20.1 per cent in Q1, and by 5.1 per cent
in Q2, and grew at a positive rate of 4.3 per cent in Q3, all in nominal
terms, the tourism economy or TDGVA saw a much greater fall of 42.8
India and the Coronavirus Pandemic: Economic Losses for Households Engaged in Tourism and Policies for Recovery
National Council of Applied Economic Research ix
per cent in Q1, and 15.5 per cent in Q2, and continued to experience
negative growth even in Q3, recording a fall of 1.1 per cent.
Impact due to the Demand-side Shock: This refers to the impact of the
pandemic on the tourism economy, with both the supply-side shock emanating
from the economic slowdown and the demand-side shock resulting from the
limited tourism activity in the country during the three quarters of the study.
The limited tourism activity translates into a huge reduction in tourism
expenditure incurred by all types of tourists— inbound, domestic, and
outbound. Hence these estimates reflect the most likely loss in TDGVA. The
findings are as follows:
o It is estimated that the TDGVA plummeted by as much as 93.3 per cent
in Q1 of 2020-21 over its level during the same quarter of the previous
year. It picked up slightly to post a fall of 79.5 per cent in Q2 and that of
64.3 per cent in Q3, but continued to remain at an extremely low level,
and in fact, in negative territory, while overall the economy posted a
positive growth of 4.3 per cent in Q3.
Impact due to Inbound Demand-side Shock: This refers to the independent impact
of a fall in the inbound tourism expenditure, assuming that all other forms of
tourism remained the same during the study reference period. The TDGVA is
estimated to have decreased by 61.7 per cent in Q2 of 2020-21 over the same
quarter of 2019-20. Going forward, this is estimated to have fallen by 38.0 per cent
in Q2 and 25.7 per cent in Q3.
Impact due to Domestic Demand-side Shock: This refers to the independent
impact of a fall in domestic tourism expenditure, assuming that all other forms of
tourism remained the same. Notably, the negative impact of a fall in domestic
tourism activity is much more significant than that of inbound tourism activity.
The fall in domestic tourism activity in all the three quarters is estimated to be 20
to 30 percentage points higher than that in the case of inbound tourism.
Estimated Loss in Jobs during the COVID-19 Pandemic
A significant number of jobs were lost in the tourism sector once the lockdown was
implemented. However, once the unlock phases started and the economy was opened up,
the recovery was fast. The findings are as follows:
India and the Coronavirus Pandemic: Economic Losses for Households Engaged in Tourism and Policies for Recovery
National Council of Applied Economic Research x
As many as 14.5 million jobs, out of an estimated 34.8 million active jobs during
the pre-pandemic period of 2019, are expected to have been lost as a repercussion
of the pandemic and the resultant lockdown in the first quarter of 2020-21. This is
equivalent to a fall of 41.7 per cent.
In terms of absolute numbers, the loss of jobs has been more pronounced in the
case of salary/wage earners, 7.8 million of whom were left without jobs during Q1.
However, in terms of a percentage fall, the self-employed were hit harder as their
number fell by 42.8 per cent, as compared to regular employees with full-time jobs,
whose number shrunk by 40.7 per cent.
As the economy, in general, and tourism activity, in particular, started picking up
during the subsequent quarters of the years, many jobs are estimated to have
gradually returned in these quarters. Till the third quarter, however, the deficit in
the number of tourism jobs was still estimated to be 1.8 million.
Estimated Loss in Household Income during the COVID-19 Pandemic
The impact on income is estimated to be much more severe as compared to the
impact in terms of loss of jobs. This could be due to the cut in salaries, which
explains the huge loss in wage income and the much higher loss in non-wage
income among business owners who did not just pay salaries to their staff but were
also required to incur other committed expenditures like payment of rent, utility
bills, and so on.
While wage income fell by 41.6 per cent in Q1, non-wage income, that is, the
income of the self-employed or business owners nosedived by 124.4 per cent. It is
for this reason that many businesses did not just witness a severe fall in income
but also posted a deficit in Q1.
Going forward, with a pick-up in activities, the income levels have shown an
improvement but a negative growth of 3.4 per cent in the case of wage income and
21.2 per cent in the case of non-wage income has recorded, both in Q3.
On the other hand, in sharp contrast to the tourism household income, the total
household income saw a steeper drop in income levels in the case of wage income
or the salaried income of employees. This is because while tourism industries are
mostly service industries, overall the economy also includes a large proportion of
the primary sector and manufacturing industries, both of which are highly labour-
intensive.

India and the Coronavirus Pandemic: Economic Losses for Households Engaged in Tourism and Policies for Recovery
National Council of Applied Economic Research xi
Tourism Economy Going Forward—Future Outlook
With the gradual opening up of international borders, restoration of the confidence to
travel among the public, success of the vaccination drive, and the lessons learnt from
previous waves of infections, tourism activity is soon expected to move towards normalcy.
In order to present our outlook for the sector, we have envisaged the following three
scenarios for all forms of tourism, that is, inbound, domestic, and outbound, as also for
outbound tourists diverted to domestic trips:
• Optimistic;
• Most likely; and
• Pessimistic.
These scenarios are based on assumptions made using our judgement of the likely
situation going forward. The key findings are as follows:
It is expected that the tourism economy, in terms of tourism expenditure, will
regain its pre-pandemic level by 2024-25, primarily driven by domestic
tourism. As regards inbound tourism, its revival is expected to be slower and it
is not likely to reach the pre-pandemic level before 2026-27, even as per the
optimistic scenario.
On the other hand, domestic tourism (complemented by the outbound-turned
domestic tourism) is likely to reach the pre-pandemic level much sooner, that
is, by 2024-25, even as per the pessimistic scenario.
Recommendations for the Revival of Tourism in India
The proposed recommendations for facilitating the revival of the tourism sector are as
follows:
Promotion of Domestic Tourism: An average domestic trip costs much less than
other types of trips, that is, only Rs. 5,429, as compared to the corresponding prices
of Rs. 2.10 lakhs for an inbound trip and Rs. 14,286 as pre-trip and about Rs.
60,000 on-trip for an outbound trip. However, given its huge volume in terms of
the number of trips, the total tourism expenditure incurred by domestic tourists is
over 70 per cent of the total internal tourism expenditure. Hence, the contribution
of tourism to the economy is mainly on account of domestic tourism.
Diverting Outbound Tourists to Domestic Trips: This can be achieved through
various innovative measures such as creating an enticing bucket for domestic
destinations, developing a new approach such as that of ‘working holidays’ or ‘work

India and the Coronavirus Pandemic: Economic Losses for Households Engaged in Tourism and Policies for Recovery
National Council of Applied Economic Research xii
from home by travelling to an interesting destination’, and promoting regional or
local destinations.
Targeting Incentives to Industries Contributing the Most to the Tourism Economy:
The data on tourism expenditure reveal that of all the tourism characteristic
products and services, food-providing services, road transport services, and
healthcare-providing services account for close to 80 per cent of the total tourism
expenditure. Hence, government policies need to be prioritised and targeted
towards these important industries.
The other broad recommendations include:
o Re-establishing trust in travel and tourism among travellers;
o Adherence to safety and mandatory health and hygiene protocols to the
highest standards possible;
o Ensuring that the protocols are also mandatorily followed by tourists:
o Adoption of a high-value, low-volume (HVLV) approach (as followed in
Bhutan);
o Urging the Government to be responsive by preparing a Tourism Recovery
Plan;
o Providing tax benefits, subsidies, and incentives to industry players to
enable them to sustain themselves and overcome the pandemic shock;
o Integrating public health with tourism;
o Issuance of vaccine certificates;
o Creating a healthy environment which would act as a natural barrier to
future pandemics;
o Promoting and exploiting technological innovations like digital marketing,
and creation of virtual tours;
o Using digital services to improve the customer safety experience and
adapting quickly to changes in the health context in local areas;
o Targeting support for vulnerable communities;
o Supporting businesses in diversifying their revenue sources;
o Identifying and targeting a diverse customer base; and
o Maintaining customer and employee confidence.
It is imperative for policy measures to take into account all the above key areas identified
in the proposed recommendations, in order to foster the immediate revival and
subsequent growth of the tourism industry in the country post the COVID-19 pandemic.

India and the Coronavirus Pandemic: Economic Losses for Households Engaged in Tourism and Policies for Recovery
National Council of Applied Economic Research 1
India and the Coronavirus Pandemic
Economic Losses for the Households in Tourism and the Policies
for Recovery
I. Background
The spread of Coronavirus has had a drastic impact on the tourism sector all over the
world. Be it aviation or hospitality, transportation, tour operators or eateries, every
activity related to tourism has been adversely affected in an unprecedented manner. India
has been no exception. The decline in tourist arrivals or movements in India started in
February 2020 itself. However, this trend reached its trough when the lockdown was
declared by the Central and State Governments in late March 2020. Besides, there were
cancellations of travel by people owing to the fears of Coronavirus infection, without the
universal adoption of preventive measures such as wearing of masks, social distancing,
and hand hygiene.
There is no doubt that the pace of recovery of the economies has been fragile but some
efforts have been made by governments. This is especially true for the tourism sector in
India and any other country. The reason for this is
the imposition of economic, psychological as well as
certain restrictions in movements irrespective of
locations, for almost the entire year 2020 because of
the first wave of the pandemic. However, when
COVID cases started declining in the country post
the first wave and the situation started moving
towards normalcy, albeit with the prescribed
precautions being taken, the second wave hit the country in March 2021.
Unfortunately, because of several reasons including the ability of the virus to change its
strain and a delay in vaccination programmes, the second wave proved to be more
devastating than the first. Between April and May 2021, the total infected population
crossed more than 20 million and the number of daily infected people touched more than
4 lakhs. The lack of adequate infrastructure and supply chains not only increased fatalities
but also led to widespread panic among the general population.
With the imposition of lockdowns by both the Central and State governments, around 15th
May the number of daily infected came down to about 3.25 lakhs around 15 May 2021.
Although the sheer number of infected people was still alarming, the good news was the
India’s GDP is estimated to have
contracted by 8.0 per cent in real
terms in 2020-21 because of the
pandemic in the country. This implies
an overall economic loss of Rs. 11.6
trillion.
India and the Coronavirus Pandemic: Economic Losses for Households Engaged in Tourism and Policies for Recovery
National Council of Applied Economic Research 2
declining trend for about a week, though the number of daily deaths in the country kept
rising. This trend was an indication that perhaps the second wave had reached its peak
and one could expect to see a flattening of the curve within the forthcoming month or
fortnight. However, concern about the pandemic situation has persisted, especially in
view of the overwhelming shortage of vaccines. Presently, with new companies having
been given permission to sell vaccines in India and also with reports that state
governments are planning to procure vaccines through global tenders, perhaps the hope
of controlling the situation would be materialised.
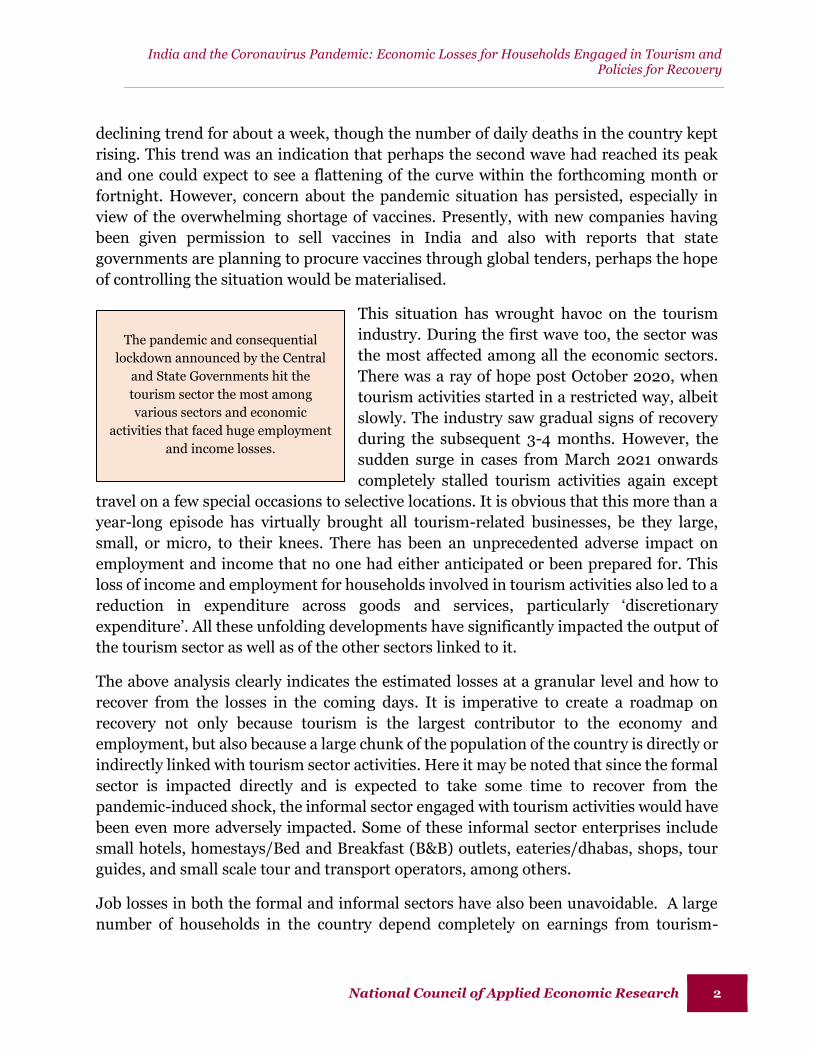
This situation has wrought havoc on the tourism
industry. During the first wave too, the sector was
the most affected among all the economic sectors.
There was a ray of hope post October 2020, when
tourism activities started in a restricted way, albeit
slowly. The industry saw gradual signs of recovery
during the subsequent 3-4 months. However, the
sudden surge in cases from March 2021 onwards
completely stalled tourism activities again except
travel on a few special occasions to selective locations. It is obvious that this more than a
year-long episode has virtually brought all tourism-related businesses, be they large,
small, or micro, to their knees. There has been an unprecedented adverse impact on
employment and income that no one had either anticipated or been prepared for. This
loss of income and employment for households involved in tourism activities also led to a
reduction in expenditure across goods and services, particularly ‘discretionary
expenditure’. All these unfolding developments have significantly impacted the output of
the tourism sector as well as of the other sectors linked to it.
The above analysis clearly indicates the estimated losses at a granular level and how to
recover from the losses in the coming days. It is imperative to create a roadmap on
recovery not only because tourism is the largest contributor to the economy and
employment, but also because a large chunk of the population of the country is directly or
indirectly linked with tourism sector activities. Here it may be noted that since the formal
sector is impacted directly and is expected to take some time to recover from the
pandemic-induced shock, the informal sector engaged with tourism activities would have
been even more adversely impacted. Some of these informal sector enterprises include
small hotels, homestays/Bed and Breakfast (B&B) outlets, eateries/dhabas, shops, tour
guides, and small scale tour and transport operators, among others.
Job losses in both the formal and informal sectors have also been unavoidable. A large
number of households in the country depend completely on earnings from tourism-
The pandemic and consequential
lockdown announced by the Central
and State Governments hit the
tourism sector the most among
various sectors and economic
activities that faced huge employment
and income losses.

India and the Coronavirus Pandemic: Economic Losses for Households Engaged in Tourism and Policies for Recovery
National Council of Applied Economic Research 3
related activities for sustenance. The current situation also indicates that tourism
activities will take time to recover even after the spread of COVID-19 is brought under
control and normal life can be resumed in the country with people becoming less
vulnerable to the risk of contracting the disease. The revival of confidence to travel among
tourists after the COVID-19 shock may take some time, though some green shoots are
already visible with the initiation of domestic tourism to some extent.
The obvious income losses for households engaged in the tourism sector call for urgent
policy interventions. However, any policy measures to support the tourism sector and the
affected households necessitate a systematic
estimation of the losses and relief requirements.
This, in turn, points to the need for resilient
policies to address these challenges at all levels to
put the tourism sector back on the path it was
traversing before the pandemic. All stakeholders
and policy makers need to adopt innovative and
sensitive approaches, and identify the vulnerable enterprises to counter the adverse
situation confronting the tourism sector during the last one year. According to the latest
TSA for reference year 2015-16, the direct share of tourism in GDP and employment is
estimated at 2.7 per cent and 5.4 per cent, respectively. These shares increase to 5.2 per
cent and 12.4 per cent, respectively, when direct as well as indirect contributions are taken
into account.1 The loss to the economy caused by the absence of tourism may exceed what
the sector contributes directly, as it depends critically on the impact on other sectors with
which the tourism sector has strong inter-linkages, like accommodation and food-
providing services, transport services, and recreational and cultural activities.
Evidently, the loss to income of households associated with tourism has also resulted in
further loss due to the reduced demand for goods and services in the economy. Hence, it
is equally important to estimate the total loss to the economy caused by the decline of
tourism due to the pandemic, as it is to estimate the benefits of tourism by virtue of its
contribution to economy. Even more important is the need to assess the losses incurred
by households which draw income from the tourism related industries and the multiplier
impact of this income loss on the economy. After the gradual relaxation of the lockdown
and concomitant restrictions on the movement of goods and people in most of the States,
there were signs of at least partial revival in tourism activities. However, the second wave
of the pandemic since March 2021 again severely impacted the tourism sector. The second
wave did not only restrict movement due to the high daily numbers of infected persons,
1 “The Third Tourism Satellite Account of India, 2015-16.” Report 20181102, November 2018, New Delhi: National Council of Applied Economic Research (NCAER).
The tourism sector contributes 5.2 per
cent to India’s GDP and 12.4 per cent
to India’s employment according to
India’s Third Tourism Satellite
Account (TSA) (2015-16).

India and the Coronavirus Pandemic: Economic Losses for Households Engaged in Tourism and Policies for Recovery
National Council of Applied Economic Research 4
but also had a severe adverse impact on the confidence of the people to travel. This study
captures the economic losses resulting from the changes experienced during the entire
period of the pandemic, using data from different sources. The study has also probed the
likely recovery phases of the tourism sector post the pandemic in order to understand the
how the sector would be able to regain its pre-pandemic position. Various country
experiences have been added as best practices that may be implemented in India for
developing a future roadmap for recovery of the sector. This would help policymakers in
decision-making based on the impacts captured on a more or less real-time basis.
II. Key Objectives of the Study
This study aims to assess the estimated loss to the economy and to the income of
households caused by the COVID-19 pandemic. The key objectives of the study are to:
Quantify the sector-wise (or industry-wise) direct and indirect impacts of tourism
activities on the overall economy as a whole and especially on household income, which
may be further disaggregated into different types of households like formal and informal;
Quantify the loss in income, sector-wise, and in the overall economy and of the
household sector; and also the loss in jobs due to the impact of the Coronavirus pandemic
on the tourism sector;
Estimate the impact of a gradual opening up of domestic tourism activities and the
sectors related to tourism;
Estimate the likely impact of opening of international tourism, in a phased manner; and
Propose appropriate policy measures for providing relief to the tourism sector, in
general, and households involved in tourism-related activities, in particular, based on the
feedback received from various stakeholders.

India and the Coronavirus Pandemic: Economic Losses for Households Engaged in Tourism and Policies for Recovery
National Council of Applied Economic Research 5
III. Approach and Methodology
The study captures the impact of the pandemic on the Indian tourism sector from a 360
degree perspective. It has looked into the sectoral activity level to understand its
contribution to employment and GDP, and finally into the income loss, especially for
households that are directly and indirectly involved with tourism activities. Since it is not
reasonably possible to obtain these macro perspectives, especially the direct and indirect
or spill-over effects, through a simple analysis of the numbers, the study has used macro-
economic modelling, including the Input-Output Model and Social Accounting Matrix.
This has facilitated assessment of the multiplier effects reflecting the economy-wide
impacts emanating from the loss of tourism activities. The study is based on secondary
data available from different sources, especially
pertaining to the macro-economic parameters,
tourist arrivals, and employment. The study
constructs different scenarios on tourism activities
for understanding the trajectory of the recovery
path. In order to quantify the economic impact of a
fall in tourism activities on Gross Value Added
(GVA), the study estimates the values of Tourism
Direct GVA (TDGVA) from the following
perspectives:
Tourism economy in a normal situation;
Tourism economy due to the supply-side shock during the COVID-19 pandemic;
Tourism economy due to the demand-side shock during the COVID-19 pandemic,
which can be further categorised as:
o Inbound tourism demand-side shock; and
o Domestic tourism demand-side shock.
The TDGVA for each tourism industry is estimated by applying the Tourism Industry
Ratios (TIRs) on the industry’s overall GVA. This has been done in the Supply and Use
Table (SUT) framework of the Tourism Satellite Account (TSA). Hence, a TIR of, say, 72
per cent for a particular industry suggests that of the total GVA of this industry, 72 per
cent, is on account of tourism activities or on account of the demand generated by tourists.
In a normal situation and in the case of an impact due to the supply shock, the TIRs are
assumed to be the same as derived in the TSA for 2015-16.
Using Macro-economic modelling
including the Input-Output model and
the Social Accounting Matrix, this
study has captured the multiplier
effects that reflect the economy-wide
impact of the loss resulting from a fall
in tourism activities.
India and the Coronavirus Pandemic: Economic Losses for Households Engaged in Tourism and Policies for Recovery
National Council of Applied Economic Research 6
In order to estimate the impact of the demand-side shock, the study needed to estimate
the tourism demand during the study reference period, which covers the pandemic, that
is, the first three quarters of 2020-21 [(this is the period till which the latest data on GDP
are available from the Ministry of Statistics and Programme Implementation, (MoSPI)].
This in turn, necessitated procuring estimates of inbound and domestic tourist arrival
during the same period. The month-wise data on International Tourist Arrivals (ITAs)
and the annual data on Domestic Tourist Visits (DTVs) were obtained from the Ministry
of Tourism (MoT). The study imputed the quarter-wise number of domestic tourists (as
discussed in Appendix II). The new TIR was derived by applying the quarter-wise year-
on-year fall in the number of inbound and domestic tourists on the inbound and domestic
tourism expenditure, respectively. In the combined demand-side shock, the fall in both
inbound and domestic tourism expenditure was considered. However, in the case of the
individual demand-side shock arising from inbound and domestic tourism, the fall was
assumed in only inbound tourism expenditure in the first case, and in only domestic
tourism in the latter case.
Further, in order to estimate the loss of jobs in the tourism sector, the key data source
used in this study were the employment data obtained from the Periodic Labour Force
Survey (PLFS) conducted by MoSPI. The PLFS provides annual employment estimates.
In order to derive the estimates at the quarterly level, employment elasticities were used.
The employment elasticity for an industry is the ratio of the percentage change in
employment to the percentage change in GVA for that industry over a period of time.
Since the PLFS data are available for 2017-18 and 2018-19 only, the study derived the
point elasticity using the employment and GVA growth seen between these two years. It
may be noted that the study also estimates the loss in jobs by work status, that is, jobs lost
for both employees and the self-employed.
In addition, the study estimates the impact on income of the households engaged in the
tourism activities. The income estimates have also been categorised into those drawn by
employees (wage income) and those earned by the self-employed (non-wage income). In
order to estimate the wage and non-wage incomes, various statements on “Output, Value
Added, Compensation of employees and Operating Surplus by industry” from the
National Accounts Statistics, NAS-2021, were referred to. However, these provide the
annual estimates. The quarterly estimates of wage and non-wage incomes were thus
derived using the percentage growth estimated in the number of employees and the self-
employed, respectively. The detailed methodology is given in Appendix III.
This study also presents the expected outlook for the tourism sector in the coming years
and answers the questions on the time required for the revival in the sector and the period

India and the Coronavirus Pandemic: Economic Losses for Households Engaged in Tourism and Policies for Recovery
National Council of Applied Economic Research 7
by when the tourism economy is expected to reach the pre-pandemic levels. This points
to the number of years lost due to the pandemic, the aftermath of which is still persisting.
The concluding sections of the study present the experiences of the other countries and
their responses to tackle the pandemic situation and to revive the economy, as a whole,
and the tourism sector, in particular. This is followed by a section on recommendations
proposed for the revival of the tourism sector in India, based on international experiences
and feedback from stakeholders.
The following section presents all the dimensions of the study, discussed above, along
with the key findings.
IV. Impacts of the Pandemic on the Tourism Economy, Employment and
Income
This section delineates the estimated impacts on various macro-economic parameters
linked with tourism activities in the country. Since these economic parameters were
estimated on the basis of different envisaged situations, their analyses and findings are
presented in accordance with the relevant situations to make the study more
comprehensive and reader-friendly.
IV.1. The Tourism Economy in a Normal Situation
The tourism sector has been a significant contributor to the value generation,
employment, and foreign exchange earnings of any economy. The Tourism Satellite
Account (TSA) is an important tool for estimating these contributions to the economy.
For India, the latest TSA was prepared for the reference year of 2015-16. This was the
Third TSA for India. This and the previous TSA for 2009-10 were both based on the
framework suggested by the United Nations World Tourism Organisation (UNWTO) in
its publication “Tourism Satellite Account: Recommended Methodological Framework –
2008” (TSA: RMF-2008).
These TSAs estimate both the direct and
indirect contributions of tourism to the
country’s GDP. The indirect
contributions result from the spill-over
effects of an economic activity owing to
its inter-linkages with all the other
Figure 1: Share of Tourism in Overall GDP
3.7 2.7
6.85.2
2 0 0 9 - 1 0 2 0 1 5 - 1 6Direct Direct+Indirect
Source: 2nd and 3rd TSA of India, NCAER.
India and the Coronavirus Pandemic: Economic Losses for Households Engaged in Tourism and Policies for Recovery
National Council of Applied Economic Research 8
economic activities. According to the second and third TSAs, the direct and indirect
contributions of the tourism sector to the country’s total GDP were 6.8 per cent and 5.2
per cent, respectively. The corresponding figures for the direct shares for these years were
3.7 per cent and 2.7 per cent, respectively (Figure 1).
The direct and indirect shares have been obtained through the derivation of the GVA
multiplier, which stood at 1.9236, according to the Third TSA. The interpretation of this
multiplier is that if the tourism demand increases by one unit, the overall GVA of the
economy is estimated to increase by 1.9236 units, owing to the activities triggered in other
sectors of the economy due to the increased demand for tourism.
For the present study, we have also derived the income multiplier for estimating the
impact of an increase in the demand for tourism on the overall household income of the
economy. For this purpose, a Social Accounting Matrix (SAM) has been prepared for the
normal year of 2018-19. The SAM is used to capture the direct as well as indirect impacts
on household income. It may be noted here that an Input-Output (IO) Table was prepared
as part of the Third TSA in order to derive the direct and indirect contribution of tourism
to the overall economy. However, for the current study, the SAM has been prepared
instead as it is more appropriate for estimating the impact on household income.
Following are the key differences between an IO Table and a SAM:
SAM is an extension of an IO Table.
An IO Table is a production account which presents the transactions among
the production sectors of the economy. On the other hand, SAM not only
constitutes the production account but also incorporates the household
account. Hence, it presents the transactions between the production sectors
and the households drawing income from these sectors.
An IO Table quantifies the impact of a sector, say tourism, on the overall
economy whereas SAM also quantifies the impact on income earned by
different types of households, thereby enabling more specific and focused
policy recommendations to assist the sector and the economy as a whole.
For this study, SAM is based on the production sectors, as given in the SUT
framework of the Third TSA. Hence, it comprises a total of 24 production
sectors, of which 11 are the tourism-characteristic sectors, 8 are tourism-
connected sectors, and 5 are non-tourism-specific sectors.

India and the Coronavirus Pandemic: Economic Losses for Households Engaged in Tourism and Policies for Recovery
National Council of Applied Economic Research 9
The multipliers based on the IO Table reflect the direct and indirect impacts of
an increased or reduced demand on the overall economy. On the other hand,
SAM-based multipliers present this impact on the income of the households
engaged in different economic activities.
In summary, the IO model captures the economic impact of a sector while SAM
helps in capturing the socio-economic impact of that sector while also
incorporating the impact on the household sector.
The SAM-based multiplier analysis reveals that the income multiplier of the tourism
sector is 1.6332. Hence, if the tourism demand increases by one unit, then, owing to the
direct and indirect linkages among the sectors of the economy, the overall income is
expected to increase by 1.6332 units.
As an example, if the tourism expenditure increases by just Rs. 1 crore (the original
tourism expenditure for 2018-19 is estimated at Rs. 11.8 lakh crore), then the overall
household income of the economy is expected to increase by Rs. 1.63 crore. This indicates
the impact that the tourism sector has on the incomes drawn by households.
IV.2. The Tourism Economy during the Covid-19 Pandemic
This section presents the estimated impact of the
pandemic and its after-effects on the tourism sector.
The pandemic not only resulted in restrictions on the
movement of people, especially during the lockdown
period, but also caused huge losses in the demand for
tourism, as generated by tourists while they are on a
trip. The study estimates the TDGVA for the first, second, and third quarters of 2020-21,
that is, the period for which the data on the overall GVA are available from MoSPI.2 The
same have also been estimated for the corresponding quarters of the previous year, in
order to derive the year-on-year fall in TDGVA during 2020-21.
According to the COVID-19 timeline for India (Figure 2), the first quarter of 2020-21
witnessed a lockdown and also a curfew in some areas of many States. The movement of
people and many economic activities were restricted during this lockdown period.
Towards the end of the first quarter (Q1), that is, on June 8, 2020, Unlock 1.0 was
2 The quarterly estimates of sectoral GVA have been sourced from the CSO’s Press Release, dated 26th February, 2021.
This study estimates the Tourism
Direct Gross Value Added
(TDGVA) for the first, second, and
third quarters of FY 2020-21.

India and the Coronavirus Pandemic: Economic Losses for Households Engaged in Tourism and Policies for Recovery
National Council of Applied Economic Research 10
announced under which the government allowed re-opening of malls, hotels, restaurants,
and places of worship. In the second quarter (Q2), several Unlock measures (Unlock 2.0
to Unlock 4.0) were announced, including resumption of train and flight services. With
the tapering down of COVID-19 new cases, onset of festivals, occurrence of social
ceremonies and people getting desperate to travel, some amount of domestic tourism
activities started during the third quarter (Q3), with due Standard Operating Procedures
(SOPs) and exhorting people to follow precautions.
Figure 2: COVID-19 India Timeline
Source: NCAER compilation
The impact of the pandemic on tourism, through the estimation of TDGVA, has been
captured for all these three quarters and across the following aspects:
Impact due to the Supply-side Shock
This relates to the overall economic slowdown during 2020-21 and assumes that
tourism was rather resilient and continued as before. Hence, this scenario takes
into account only the supply-side shock. Therefore, for all the quarters of 2020-21,
the TIRs are assumed to remain the same as those for the pre-pandemic years.

India and the Coronavirus Pandemic: Economic Losses for Households Engaged in Tourism and Policies for Recovery
National Council of Applied Economic Research 11
The GVA by all industries, on which the TIRs are applied to derive the TDGVA, are
presented in Table A1, Appendix I. Further, the TIRs used in estimating the supply-
side shock (in this case, TIRs have been kept unchanged), are presented in Table
A2, Appendix I. Also presented are the TDGVA figures based on these TIRs, for all
the quarters of reference.
Figure 3 presents the impact of pandemic on the TDGVA during the three quarters
of 2020-21, resulting from the overall economic slowdown and assuming that the
TIRs remained the same as in the TSA year of 2015-16.
Figure 3: Impact on TDGVA due to Supply-side Shock (% Change over the Previous Year)
Source: NCAER computations.
Figure 3 shows that while the overall economy showed a decline of 20.1 per cent,
in nominal terms, in the first quarter of 2020-21, the tourism economy or TDGVA
saw a much greater fall of 42.8 per cent in the same quarter. In Q2, when some
economic activities started picking up, the overall economy saw a milder fall of 5.1
per cent over the same quarter of the previous year. The economy grew at a positive
rate of 4.3 per cent in Q3, owing to several unlocking measures undertaken by the
government. However, TDGVA continued to record negative growth even in Q3
when it posted a fall of 1.1 per cent. The supply-side slowdown, particularly in the
service industries, took a toll on the tourism sector throughout the first three
quarters of 2020-21.
10.77.6
-20.1
-5.1
4.3
10.1 10.9
-42.8
-15.5
-1.1
FY19 FY20 Q1 Q2 Q3
FY2020 - 21
GVA_Economic slowdown TDGVA_Economic slowdown

India and the Coronavirus Pandemic: Economic Losses for Households Engaged in Tourism and Policies for Recovery
National Council of Applied Economic Research 12
Impact due to the Demand-side Shock
In this section, we estimate the impact of the pandemic on the tourism economy,
given both the supply-side shock emanating from the economic slowdown and the
demand-side shock resulting from the limited tourism activity in the country
during the three quarters under study. The limited tourism activity translates into
a huge reduction in tourism expenditure incurred by all types of tourists—inbound,
domestic, and outbound.
The tourism expenditure has been estimated using the per-tourist expenditure and
the estimated number of tourists by all forms of tourism. The figures for the per-
tourist expenditure by all forms of tourism have been obtained from the Third
TSA-2015-16, after adjusting for a price change between 2015-16 and 2020-21. The
number of inbound tourists during the three quarters of the study period has been
obtained from the MoT and the number of domestic tourists is estimated by using
the annual estimates on DTVs provided by the MoT. The methodology for
disaggregating the annual estimates into quarterly estimates is discussed in
Appendix II.
Figure 4 presents the impact of the pandemic on the TDGVA during the three
quarters of 2020-21, resulting from both the overall economic slowdown and from
the loss in tourism demand or tourism expenditure. The values of TIRs, derived
after taking into account the fall in tourist arrivals and tourism expenditure, for all
the three quarters are given in Appendix I Table A3. Also presented are the values
of TDGVA.

India and the Coronavirus Pandemic: Economic Losses for Households Engaged in Tourism and Policies for Recovery
National Council of Applied Economic Research 13
Figure 4: Impact on TDGVA due to Supply and Demand Shocks (% Change over the Previous Year)
Source: NCAER computations.
Figure 4 presents the most likely loss in
TDGVA resulting from the significant
drop in tourist arrivals, and hence in
tourism expenditure, during the
pandemic. It is estimated that TDGVA
plummeted by as much as 93.3 per cent
in Q1 of 2020-21 over its level in the
same quarter of previous year. It picked
up slightly to post a fall of 79.5 per cent in Q2 and that of 64.3 per cent in Q3, but
continued to remain at an extremely low level and in negative territory while
overall the economy posted a positive growth of 4.3 per cent in Q3.
The fall in TDGVA seen in Figure 4 has been estimated to result from the combined
fall in tourist arrivals of all types—inbound, domestic, and outbound. While
outbound tourism expenditure accounts for just 3 per cent of the tourism
expenditure, the inbound and domestic tourism expenditure are the key
contributors to the total tourism expenditure. The following section estimates the
impact of a fall in inbound tourism expenditure and domestic tourism expenditure,
independently of each other.
10.7
-20.1
-5.14.3
10.1 10.9
-42.8
-15.5
-1.1
10.9
-93.3
-79.5
-64.3
FY19 FY20 Q1 Q2 Q3
FY21
GVA_Economic slowdown
TDGVA_EconomicslowdownTDGVA_with estimated fallin arrivals
While the overall economy contracted
by 20.1 per cent in Q1 of FY 2020-21, in
nominal terms, the tourism economy
plummeted by a mammoth 93.3 per
cent in the same quarter, showing no
respite even in Q3 of FY 2020-21.

India and the Coronavirus Pandemic: Economic Losses for Households Engaged in Tourism and Policies for Recovery
National Council of Applied Economic Research 14
Impact due to the Inbound and Domestic Demand Shocks
While Figure 4 showed the combined impact of the demand shock arising from the
fall in inbound, domestic, and outbound tourism expenditure, Figure 5 presents
the impact of a fall in inbound tourism expenditure and domestic tourism
expenditure separately and independently of each other.
Figure 5: Impact on TDGVA due to the Inbound and Domestic Demand Shocks (% Change over the Previous Year)
Source: NCAER computations.
In addition to the combined impact, Figure 5 captures the independent impact of
a fall in inbound tourism expenditure, assuming that all other forms of tourism
remained the same during the reference period of the study. The TDGVA is
estimated to have decreased by 61.7 per cent in Q2 of 2020-21 over the same
quarter of 2019-20. Going forward, this is estimated to have fallen by 38.0 per cent
in Q2 and 25.7 per cent in Q3. The corresponding estimated tourism expenditures
and TIRs, resulting from the fall in only inbound tourist arrivals, are presented in
Table A4, Appendix I.
Similarly, Figure 5 also captures the independent impact of domestic tourism
expenditure, assuming that all other forms of tourism remained the same. Notably,
10.1 10.9
-42.8
-15.5
-1.1
10.1 10.9
-93.3
-79.5
-64.3
10.1 10.9
-61.7
-38.0
-25.7
-82.7
-66.6
-49.8
FY19 FY20 Q1 Q2 Q3
FY21
TDGVA_Economic slowdown
TDGVA_with estimated fallin arrivals
TDGVA_Impact of inboundonly
TDGVA_Impact of domesticonly

India and the Coronavirus Pandemic: Economic Losses for Households Engaged in Tourism and Policies for Recovery
National Council of Applied Economic Research 15
the negative impact of the fall in domestic tourism activity is much more significant
than that of inbound tourism activity. The fall in domestic tourism in all the three
quarters is estimated to be 20 to 30 percentage points higher than that in the case
of inbound tourism. The corresponding estimated tourism expenditures and TIRs,
resulting from the fall in only domestic tourist arrivals, are presented in Table A5,
Appendix I.
Share of the TDGVA in the Overall GVA
In normal circumstances or in a Business-as-usual (BAU) scenario, tourism
directly contributes about an average of 2.76 per cent to the overall GVA. This is
the average of the past years’ shares, starting from the Third TSA year, that is,
2015-16. However, as a result of the pandemic and subsequent fall in the TDGVA,
as discussed in previous sections, the share of tourism to the overall economy also
moderated significantly. Figure 6 presents the changing shares of the TDGVA in
the overall GVA during the period under study, that is, the first three quarters of
2020-21.
Figure 6: Share of the TDGVA to the Overall GVA (%)
Source: NCAER computations.
Estimated Loss in Jobs during the Study Period
2.01
0.24
1.35
0.61
2.54
0.62
1.87
1.01
2.50
0.90
1.87
1.27
TDGVA_Economicslowdown
TDGVA_with estimatedfall in arrivals
TDGVA_Impact ofinbound only
TDGVA_Impact ofdomestic only
Q1 Q2
In the BAU scenario, the share of the TDGVA is assumed to be 2.76% of the overall GVA

India and the Coronavirus Pandemic: Economic Losses for Households Engaged in Tourism and Policies for Recovery
National Council of Applied Economic Research 16
With regard to employment, the number of jobs in the entire tourism-
characteristic industries is referred to as ‘tourism employment’, as per the
recommendations made by the United Nations World Tourism Organisation
(UNWTO). This is because relating employment to a specific product or group of
products of a given establishment is a complex issue in measuring tourism direct
employment.
For this reason, tourism employment, referring to the employment strictly related
to the goods and services (tourism-characteristic, tourism-connected, and other)
acquired by visitors and produced by either the tourism industries or other
industries cannot be assessed directly. Its measurement would require the use of
techniques that go beyond the present recommendations by UNWTO. As a result,
the recommendations in UNWTO’s Tourism Satellite Account: Recommended
Methodological Framework: 2008 are restricted to employment in tourism-
characteristic industries.
These tourism-characteristic industries are as follows:
Accommodation services/Hotels;
Food and beverage serving services/Restaurants;
Railway passenger transport services;
Road passenger transport services;
Water passenger transport services;
Air passenger transport services;
Transport equipment rental services;
Travel agencies and other reservation services;
Cultural and religious services;
Sports and other recreational services; and
Health and medical related services.
In this study, the jobs have also been categorised as self-employed (or business
owners) and employees (or salary/wage earners) to understand which category
suffered more during the pandemic, in terms of the loss in work as also loss of
income.
The data on employment (number of jobs) have been sourced from the PLFS for
2018-19, conducted by MoSPI. For the later years, employment elasticities have
been used to derive the estimated number of jobs. The monthly surveys conducted

India and the Coronavirus Pandemic: Economic Losses for Households Engaged in Tourism and Policies for Recovery
National Council of Applied Economic Research 17
by the Centre for Monitoring Indian Economy (CMIE) on Unemployment Rates in
India have also been referred to.
The study estimated job losses, both as a direct impact and as a direct plus indirect
impact of the pandemic. In order to estimate the direct jobs in the tourism
industry, employment elasticities were calculated at the sub-sectoral level. These
sub-sectoral level estimates were aggregated to obtain the overall industry level
estimates. The direct plus indirect jobs were calculated using the employment
multiplier derived in the Third TSA for India. The estimates on tourism
employment, by categories, are presented in Tables A6 to A8, Appendix I.
At the aggregate level, the loss of jobs in the tourism sector, both direct and a
combination of direct and indirect, is presented in Figure 7. Figures 8 and 9
present the jobs lost among employees and the self-employed. A significant
number of jobs were lost in the tourism sector after implementation of the
lockdown.. However, the recovery was fast once the unlock phases started and the
economy was opened up. Tourism industry jobs showed a significant upturn
during Q2 and Q3 of FY 2020-21.
India and the Coronavirus Pandemic: Economic Losses for Households Engaged in Tourism and Policies for Recovery
National Council of Applied Economic Research 18
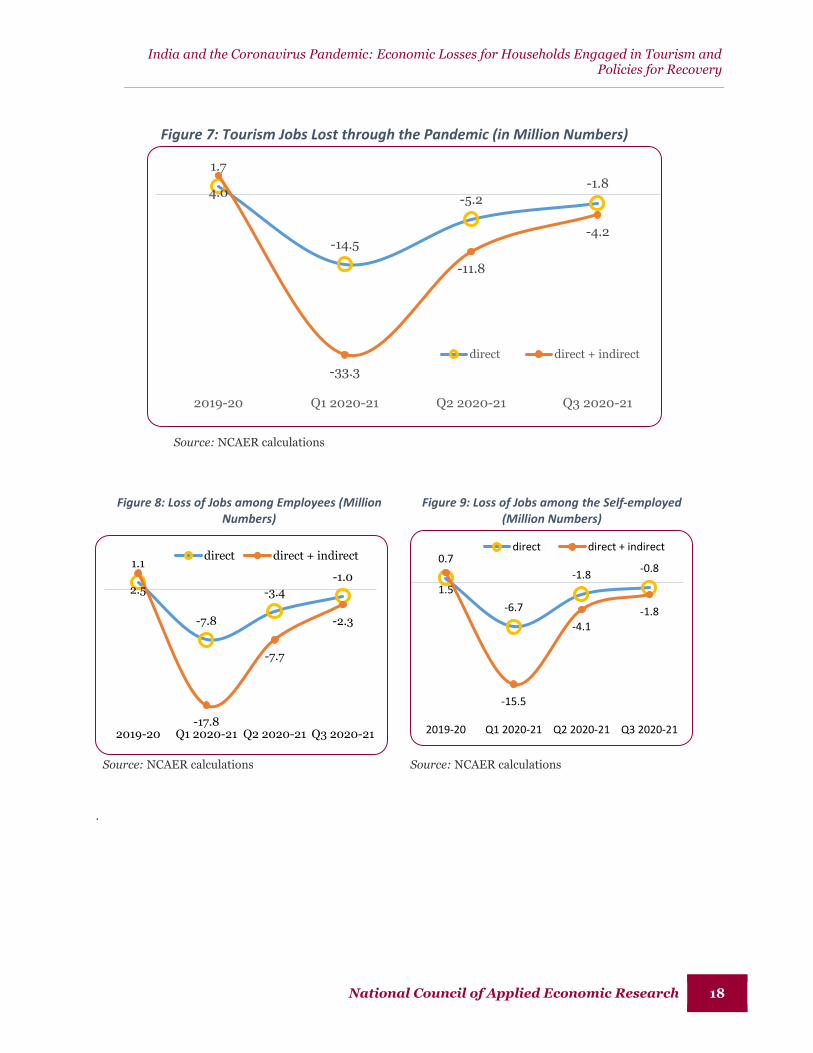
Figure 7: Tourism Jobs Lost through the Pandemic (in Million Numbers)
Source: NCAER calculations
Figure 8: Loss of Jobs among Employees (Million Numbers)
Figure 9: Loss of Jobs among the Self-employed (Million Numbers)
Source: NCAER calculations Source: NCAER calculations
.
1.7
-14.5
-5.2
-1.84.0
-33.3
-11.8
-4.2
2019-20 Q1 2020-21 Q2 2020-21 Q3 2020-21
direct direct + indirect
1.1
-7.8
-3.4
-1.02.5
-17.8
-7.7
-2.3
2019-20 Q1 2020-21 Q2 2020-21 Q3 2020-21
direct direct + indirect 0.7
-6.7
-1.8-0.8
1.5
-15.5
-4.1
-1.8
2019-20 Q1 2020-21 Q2 2020-21 Q3 2020-21
direct direct + indirect
India and the Coronavirus Pandemic: Economic Losses for Households Engaged in Tourism and Policies for Recovery
National Council of Applied Economic Research 19
As many as 14.5 million jobs, out of an
estimated 34.8 million jobs during the pre-
pandemic period of 2019, are expected to
have been lost as a repercussion of the
pandemic and the resultant lockdown in the
first quarter of 2020-21. This is equivalent
to a fall of 41.7 per cent. With about 80.7 per
cent3 of the total jobs in tourism-characteristic industries being informal in nature,
such an extent of job loss is quite expected.
In terms of absolute numbers, the loss of jobs was more pronounced in the case of
salary/wage earners, 7.8 million of whom were left without jobs during Q1.
However, in terms of a percentage fall, those with the status of self-employed were
hit harder as their number fell by 42.8 per cent, as compared to employees, whose
number shrunk by 40.7 per cent.
With the estimated employment multiplier (as derived in the Third TSA) of 2.2931,
which is an indicator of the spillover effects of the loss in tourism jobs, a total of
33.3 million jobs are expected to have been lost in Q1.
As the economy, in general, and tourism activity, in particular, started picking up
in the subsequent quarters, many jobs are estimated to have gradually returned in
these quarters. Till the third quarter, however, there was still an estimated deficit
of 1.8 million tourism jobs.
Estimated Loss in Household Income during the Study Period
The impact of loss of jobs is felt in the income of households engaged in tourism
activities, both as their principal and subsidiary activities. For this study, the
household income has also been categorised into that drawn by employees (as
wage income) and that earned by the self-employed (as non-wage income).
The NAS statements provide the values of these incomes by a broad industry level.
These are categorised into the 24 tourism-specific and non-specific industries. The
methodology to estimate the wage and non-wage income by tourism industries is
3 Derived from the PLFS-2018-19 survey data by classifying the workers into formal and informal based on the type of enterprise they work in, their work status, and nature of the job contract.
An estimated 14.5 million tourism
jobs were lost and employees thrown
out of the workforce as a
repercussion of the pandemic and the
resultant lockdown in Q1 of 2020-21.
India and the Coronavirus Pandemic: Economic Losses for Households Engaged in Tourism and Policies for Recovery
National Council of Applied Economic Research 20
described in Appendix III. The estimated wage and non-wage incomes by the
major tourism-characteristic industries are presented in Table A9, Appendix I.
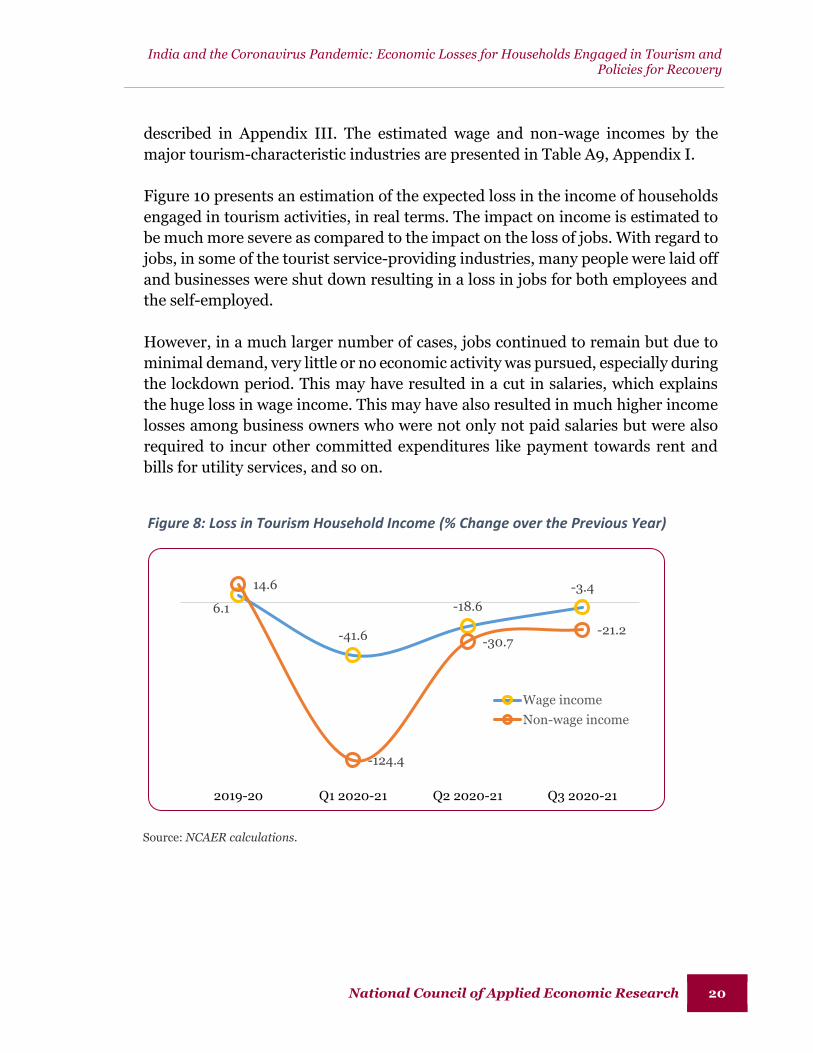
Figure 10 presents an estimation of the expected loss in the income of households
engaged in tourism activities, in real terms. The impact on income is estimated to
be much more severe as compared to the impact on the loss of jobs. With regard to
jobs, in some of the tourist service-providing industries, many people were laid off
and businesses were shut down resulting in a loss in jobs for both employees and
the self-employed.
However, in a much larger number of cases, jobs continued to remain but due to
minimal demand, very little or no economic activity was pursued, especially during
the lockdown period. This may have resulted in a cut in salaries, which explains
the huge loss in wage income. This may have also resulted in much higher income
losses among business owners who were not only not paid salaries but were also
required to incur other committed expenditures like payment towards rent and
bills for utility services, and so on.
Figure 8: Loss in Tourism Household Income (% Change over the Previous Year)
Source: NCAER calculations.
6.1
-41.6
-18.6
-3.414.6
-124.4
-30.7-21.2
2019-20 Q1 2020-21 Q2 2020-21 Q3 2020-21
Wage income
Non-wage income

India and the Coronavirus Pandemic: Economic Losses for Households Engaged in Tourism and Policies for Recovery
National Council of Applied Economic Research 21
Figure 10 shows that while the wage income fell by 41.6 per cent in Q1, the non-
wage income, that is, the income of the self-employed or business owners
nosedived by 124.4 per cent. This indicates that many businesses not only
witnessed a severe fall in income but also posted a deficit in Q1. Interestingly, the
disaggregation of the estimated income by industries shows that the food and
beverage serving industries (including restaurants, dhabas, and so on) accounted
for the highest fall in non-wage income. Going forward, with a pick-up in activities,
the income levels also showed an improvement but continued to post a negative
growth of 3.4 per cent in the case of wage income and 21.2 per cent in the case of
non-wage income, both in Q3.
Figure 11 shows the fall in the overall household income of the economy. In sharp
contrast to the tourism household income, the total household income saw a
steeper drop in income levels in the case of wage income or salary income of the
employees. This is because while tourism industries are mostly service industries,
the overall economy also includes a large proportion of the primary sector and
manufacturing industries, both of which are highly labour-intensive. Clearly,
tourism industries bore the brunt of the pandemic much more severely than the
overall economy.
Figure 9: Loss in Overall Household Income (% Change over the Previous Year)
Source: NCAER calculations.
5.2
-24.8
-9.0
3.0
3.3 -5.1
1.1
1.6
2019-20 Q1 2020-21 Q2 2020-21 Q3 2020-21
Wage income
Non-wage income

India and the Coronavirus Pandemic: Economic Losses for Households Engaged in Tourism and Policies for Recovery
National Council of Applied Economic Research 22
IV.3. Tourism Economy Going Forward—Future Outlook
The previous sections discussed the impact of the pandemic on the tourism economy with
respect to the TDGVA, employment, and household income, in 2020-21. This section
presents our outlook for the future, given the possibility of a third wave of COVID-19
infections and also the possibility of its fading away with time, which is expected to result
in a very strong rebound in tourism activity and the tourism economy, as a whole.
With the gradual opening up of international borders, revival of confidence to travel
among people, success of the vaccination drive, and the lessons learnt from the previous
waves of COVID-19 infection, tourism activity is expected to move towards normalcy
soon. Besides, a new form of tourists are likely to emerge, that is, potential outbound
tourists who will switch from international travel to domestic trips to exotic destinations
in India like Srinagar, Goa, and Rajasthan, among others. These tourists are already being
seen in the country.
In order to put forward our outlook, we have built the following three scenarios for all
forms of tourism, that is, inbound, domestic, and outbound, and also outbound tourists
who have switched to domestic trips:
• Optimistic;
• Most likely; and
• Pessimistic.
Starting with the most likely scenario, which is also quite realistic, the assumptions that
have been taken into account, with respect to all forms of tourism are delineated below.
Assumptions for Domestic Tourism—Most likely Scenario
• The current wave reached its peak somewhere by the end of May. Hence, we consider
the peak to be in May-end.
• Considering similar trends as those noticed during the first wave, the impact of the
second wave will be minimised (in terms of the detection of new infections) by around
August-end.
• In that case, with State governments allowing movement within and across the
borders, and people regaining the confidence to travel, tourism activities should
resume by around October 2021.

India and the Coronavirus Pandemic: Economic Losses for Households Engaged in Tourism and Policies for Recovery
National Council of Applied Economic Research 23
• This leaves us with about six months that can be considered for renewed but restricted
tourism activities during FY 2021-22.
• Therefore, assuming that all other conditions remain the same as in 2020-21, a similar
number of domestic trips/tourists or slightly less can be assumed to take place (it may
be noted that in 2020 also, tourism activity started during August/September).
• However, with the second wave having had a much higher impact, prospective tourists
would have much lower confidence to travel as compared to the first wave. This will
also result in the implementation of more stringent measures by State governments in
the wake of the second wave.
• On the other hand, in case an adequate number of vaccinations are done pan India,
the response rate to travel activities could attain the same level as that of last year.
• If the above scenario occurs and COVID is brought under control at the end of FY
2021-22, one may expect buoyancy in tourism in FY 2022-23 and 2023-24.
• We can assume that with the suppressed desire to travel because of restrictions and
reduced confidence levels during FY 2021-22, a 50 per cent increase can easily be seen
in subsequent years provided the COVID situation is brought completely under
control.
• Similarly FY 2023-24 can also see a significant upturn and a similar increase in the
number of tourists could be seen (in terms of absolute numbers). Again, the
assumption is that COVID remains under control.
• From 2024-25 onward, we should expect buoyant years, provided COVID is controlled
(25 per cent growth every year).
Assumptions for Inbound Tourism—Most likely Scenario
• In normal circumstances, about 24 per cent of the total ITAs are from Bangladesh.
About 35 per cent of these arrive in India for business or medical purposes.
• Assuming a figure of 25 per cent of the pre-pandemic level for Bangladesh tourists and
20 per cent for others in FY21-22, the expected ITA is about 60 per cent lower than
that of FY20-21.
• At least 30 per cent of the pre-pandemic level is expected in FY22-23, with enough
people vaccinated, safety measures implemented, and COVID under control.
• Assume a rebound in tourism activity thereon and an annual 30 per cent increase
every year thereafter.

India and the Coronavirus Pandemic: Economic Losses for Households Engaged in Tourism and Policies for Recovery
National Council of Applied Economic Research 24
Assumptions for Outbound Tourism—Most likely Scenario
• About 20 per cent of the pre-pandemic level tourists start travelling abroad, mostly
for medical, educational, or business purposes, with the expectation of relaxation in
international travel restrictions.
• Thereon, 10 per cent growth is assumed every year.
• About 30 per cent of the potential outbound tourists take domestic trips, with the
return of confidence and the urge to travel.
• A 25 per cent annual growth in such outbound-turned-domestic tourists is envisaged.
• Outbound tourists, being high-profile tourists, are assumed to spend about five times
more on domestic trips as compared to the average expenditure on a domestic trip.
Assumptions for All Forms of Tourism—Optimistic Scenario
• A figure of 5 per cent more than that in the most likely scenario is assumed for all
forms of tourism except outbound tourists, for which our expectation remains the
same as in the most likely scenario.
Assumptions for All Forms of Tourism—Pessimistic Scenario
• If there is a third wave of COVID-19, we assume that it would start from October 2021
and its impact would last till December 2021.
• However, the government will be much more prepared to face the third wave after the
second wave experience. Also, it is anticipated that by that time, around 50 per cent of
the population would have been vaccinated.
• Hence, inbound tourism activities would take place more or less for about three
months in FY 2021-22 and would account for 80 per cent of the tourist activity as
envisaged in the most likely scenario, for all the years after FY 2021-22.
• Domestic tourists are assumed to constitute 60 per cent of the total number of tourists
in FY 2020-21.
• A rebound in domestic tourism is assumed to occur in FY 2022-23, with twice the
number expected in FY2021-22.
• A similar buoyancy is assumed for the next year.
• We assume a 25 per cent annual growth thereon.
• We assume that about 20 per cent of the outbound-turned-domestic tourists at the FY
2020-21 level will travel in FY 2021-22.
• A 25 per cent annual increase thereon is assumed.
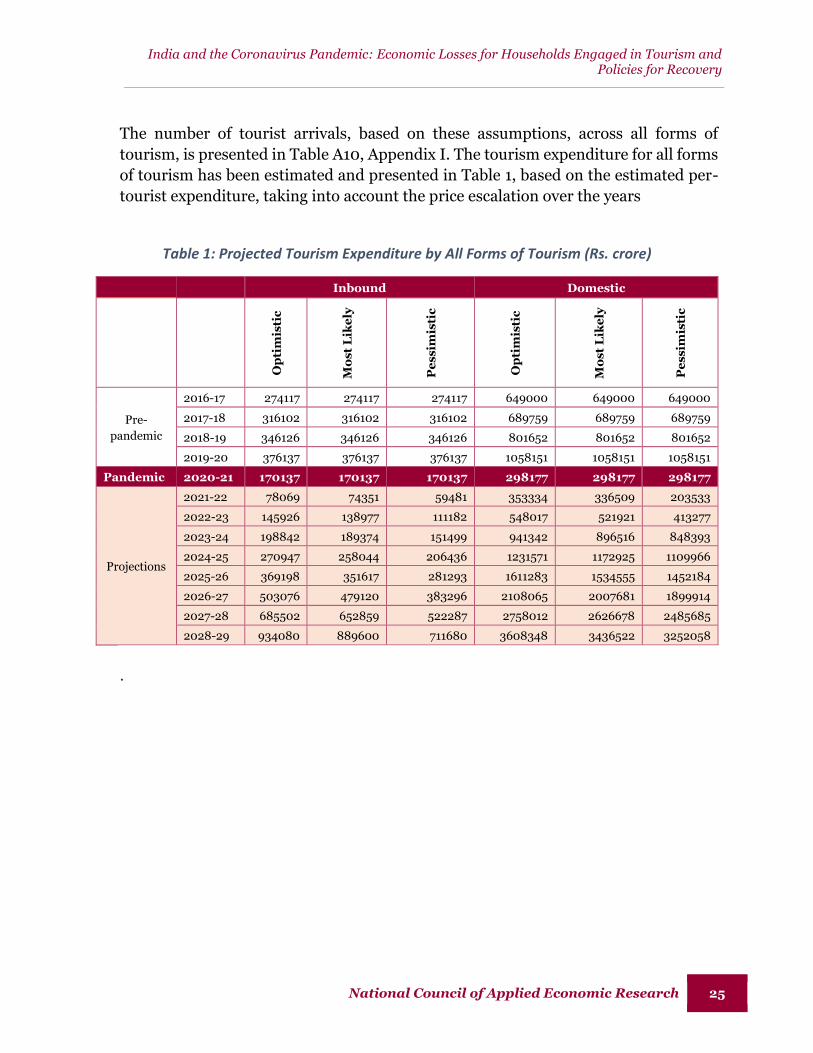
India and the Coronavirus Pandemic: Economic Losses for Households Engaged in Tourism and Policies for Recovery
National Council of Applied Economic Research 25
The number of tourist arrivals, based on these assumptions, across all forms of
tourism, is presented in Table A10, Appendix I. The tourism expenditure for all forms
of tourism has been estimated and presented in Table 1, based on the estimated per-
tourist expenditure, taking into account the price escalation over the years
Table 1: Projected Tourism Expenditure by All Forms of Tourism (Rs. crore)
Inbound Domestic
Op
tim
isti
c
Mo
st
Lik
ely
Pe
ssim
isti
c
Op
tim
isti
c
Mo
st
Lik
ely
Pe
ssim
isti
c
Pre-
pandemic
2016-17 274117 274117 274117 649000 649000 649000
2017-18 316102 316102 316102 689759 689759 689759
2018-19 346126 346126 346126 801652 801652 801652
2019-20 376137 376137 376137 1058151 1058151 1058151
Pandemic 2020-21 170137 170137 170137 298177 298177 298177
Projections
2021-22 78069 74351 59481 353334 336509 203533
2022-23 145926 138977 111182 548017 521921 413277
2023-24 198842 189374 151499 941342 896516 848393
2024-25 270947 258044 206436 1231571 1172925 1109966
2025-26 369198 351617 281293 1611283 1534555 1452184
2026-27 503076 479120 383296 2108065 2007681 1899914
2027-28 685502 652859 522287 2758012 2626678 2485685
2028-29 934080 889600 711680 3608348 3436522 3252058
.
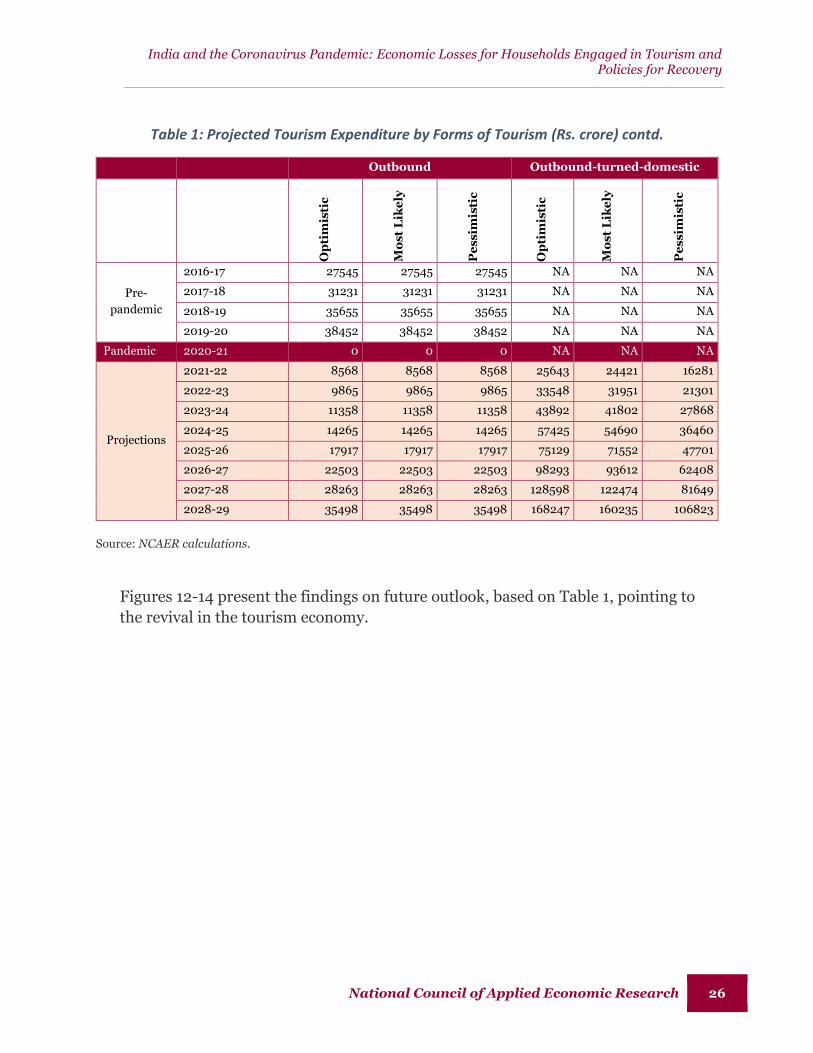
India and the Coronavirus Pandemic: Economic Losses for Households Engaged in Tourism and Policies for Recovery
National Council of Applied Economic Research 26
Table 1: Projected Tourism Expenditure by Forms of Tourism (Rs. crore) contd.
Outbound Outbound-turned-domestic
Op
tim
isti
c
Mo
st
Lik
ely
Pe
ssim
isti
c
Op
tim
isti
c
Mo
st
Lik
ely
Pe
ssim
isti
c
Pre-
pandemic
2016-17 27545 27545 27545 NA NA NA
2017-18 31231 31231 31231 NA NA NA
2018-19 35655 35655 35655 NA NA NA
2019-20 38452 38452 38452 NA NA NA
Pandemic 2020-21 0 0 0 NA NA NA
Projections
2021-22 8568 8568 8568 25643 24421 16281
2022-23 9865 9865 9865 33548 31951 21301
2023-24 11358 11358 11358 43892 41802 27868
2024-25 14265 14265 14265 57425 54690 36460
2025-26 17917 17917 17917 75129 71552 47701
2026-27 22503 22503 22503 98293 93612 62408
2027-28 28263 28263 28263 128598 122474 81649
2028-29 35498 35498 35498 168247 160235 106823
Source: NCAER calculations.
Figures 12-14 present the findings on future outlook, based on Table 1, pointing to
the revival in the tourism economy.

India and the Coronavirus Pandemic: Economic Losses for Households Engaged in Tourism and Policies for Recovery
National Council of Applied Economic Research 27
Figure 10: Outlook for Inbound Tourism Expenditure (Rs. lakh crore)
Source: NCAER calculations.
Figure 11: Outlook for Domestic (including Outbound-turned-domestic) Tourism Expenditure (Rs. lakh crore)
Source: NCAER calculations.
3.8
1.7
0.9
1.7
2.3
3.1
4.2
5.7
3.8
1.7
0.8
1.6
2.2
2.9
4.0
5.5
3.8
1.7
0.7
1.3
1.7
2.4
3.2
4.4
0
1
2
3
4
5
6
7
2019-20 2020-21 2021-22 2022-23 2023-24 2024-25 2025-26 2026-27
Optimistic Most Likely Pessimistic
10.6
3.03.5
5.5
9.4
12.3
10.6
3.0
2.0
4.1
8.5
11.1
0.0
2.0
4.0
6.0
8.0
10.0
12.0
14.0
2019-20 2020-21 2021-22 2022-23 2023-24 2024-25
Optimistic Most Likely Pessimistic

India and the Coronavirus Pandemic: Economic Losses for Households Engaged in Tourism and Policies for Recovery
National Council of Applied Economic Research 28
Figure 12: Outlook for Total Internal Tourism Expenditure (Rs. lakh crore)
Source: NCAER calculations.
With the assumptions stated above, it is expected
that the tourism economy, in terms of tourism
expenditure, will regain its pre-pandemic level by
2024-25, primarily driven by domestic tourism.
As regards inbound tourism, its revival is
expected to be slower and is likely to reach the
pre-pandemic level not sooner than 2026-27,
even as per the optimistic scenario.
However, even as per pessimistic scenario, domestic tourism (complemented by the
outbound-turned domestic tourism) is likely to reach the pre-pandemic level much
sooner, that is, by 2024-25.
V. Perspectives on the Tourism Industry Recovery Measures
It has been observed in the past that the tourism industry quickly bounces back after
natural disasters or even pandemics or epidemics. The experiences from episodes of
outbreak of Ebola, Severe Acute Respiratory Syndrome (SARS), or natural disasters like
earthquakes or floods in past years point to this pattern. Governments at all levels have
14.7
4.7 4.5
7.2
11.8
15.5
14.7
4.7
2.8
5.5
10.3
13.6
0
2
4
6
8
10
12
14
16
18
2019-20 2020-21 2021-22 2022-23 2023-24 2024-25
Optimistic Most Likely Pessimistic
The tourism sector is likely to reach
its pre-pandemic levels by 2024-25,
with the current optimistic and
pessimistic conditions envisaged.

India and the Coronavirus Pandemic: Economic Losses for Households Engaged in Tourism and Policies for Recovery
National Council of Applied Economic Research 29
aided the industry’s recovery by attracting investments through tax breaks, lenient land-
use rules, and other measures (Brouder, 20204; Ioannides and Gyimothy, 20205). The
recovery strategies require effective and timely coordination, implementation of relevant
crisis management techniques, responsive relationships among all the stakeholders
involved including Governments, recognition of risks and opportunities, and timely and
scalable interventions (Alves et al., 20206; Fitriasari, 20207). Before international travel
can resume, domestic tourism will boost the resumption of the tourism industry in the
wake of the pandemic. Other factors, including technological resilience, local
belongingness, and customer and employee confidence, may help build industry
resilience, which is the need of the hour.
Four key elements relating to recovery of this industry, as identified by researchers, are
essential for responding to the current situation. It is imperative to implement all these
in tandem with well-crafted policy measures. These key elements are:
1. Government responsiveness;
2. Technological innovation;
3. Local belongingness; and
4. Customer and employee confidence.
Promoting these elements can provide an opportunity to develop the industry from a new
perspective which would fulfil the requirements of the new normal or the new economic
order. The dimensions of the new normal that can be targeted through these measures
are:
Sustainable tourism;
Well-being of the society towards a lager goal;
Mitigating climate change; and
Engaging local communities.
Different countries have taken various measures to address the tourism recovery process.
A summary of these measures is given in Table 2. If these efforts are clubbed into broad
4 Lew, Alan and Cheer, Joseph and Haywood, Michael and Brouder, Patrick and Salazar, Noel B. (2020). “Visions of travel and tourism after the global COVID-19 transformation of 2020.” Tourism Geographies. 1-12. 10.1080/14616688.2020.1770326. 5 Ioannides, Dimitri and Gyimóthy, Szilvia. (2020). “The COVID-19 crisis as an opportunity for escaping the unsustainable global tourism path.” Tourism Geographies. 22. 1-9. 10.1080/14616688.2020.1763445. 6 Alves, Lok, Luo, and Hao, 2020. “Crisis Management for Small Business during the COVID-19 Outbreak: Survival, Resilience and Renewal Strategies of Firms in Macau.” Research Square. 7 Fitriasari, Fika. (2020). “How do Small and Medium-sized Enterprises (SME) survive the COVID-19 outbreak?” Journal Inovasi Ekonomi. 5. 10.22219/jiko.v5i3.11838.
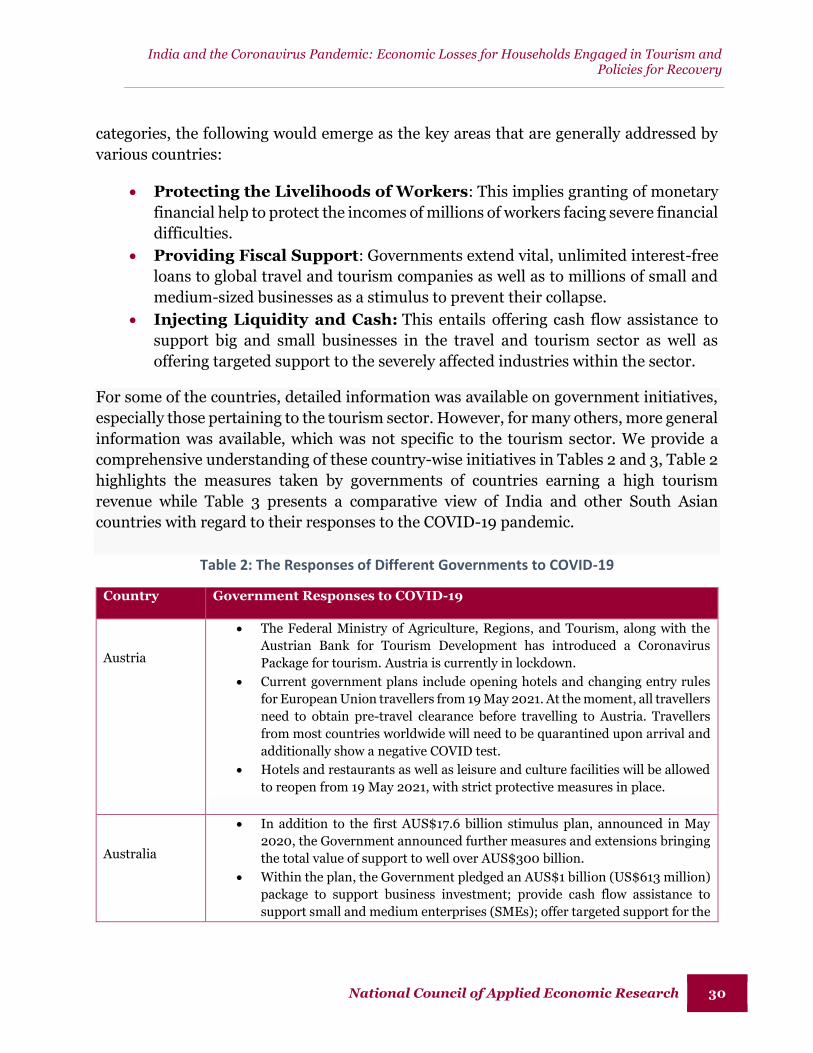
India and the Coronavirus Pandemic: Economic Losses for Households Engaged in Tourism and Policies for Recovery
National Council of Applied Economic Research 30
categories, the following would emerge as the key areas that are generally addressed by
various countries:
Protecting the Livelihoods of Workers: This implies granting of monetary
financial help to protect the incomes of millions of workers facing severe financial
difficulties.
Providing Fiscal Support: Governments extend vital, unlimited interest-free
loans to global travel and tourism companies as well as to millions of small and
medium-sized businesses as a stimulus to prevent their collapse.
Injecting Liquidity and Cash: This entails offering cash flow assistance to
support big and small businesses in the travel and tourism sector as well as
offering targeted support to the severely affected industries within the sector.
For some of the countries, detailed information was available on government initiatives,
especially those pertaining to the tourism sector. However, for many others, more general
information was available, which was not specific to the tourism sector. We provide a
comprehensive understanding of these country-wise initiatives in Tables 2 and 3, Table 2
highlights the measures taken by governments of countries earning a high tourism
revenue while Table 3 presents a comparative view of India and other South Asian
countries with regard to their responses to the COVID-19 pandemic.
Table 2: The Responses of Different Governments to COVID-19
Country Government Responses to COVID-19
Austria
The Federal Ministry of Agriculture, Regions, and Tourism, along with the
Austrian Bank for Tourism Development has introduced a Coronavirus
Package for tourism. Austria is currently in lockdown.
Current government plans include opening hotels and changing entry rules
for European Union travellers from 19 May 2021. At the moment, all travellers
need to obtain pre-travel clearance before travelling to Austria. Travellers
from most countries worldwide will need to be quarantined upon arrival and
additionally show a negative COVID test.
Hotels and restaurants as well as leisure and culture facilities will be allowed
to reopen from 19 May 2021, with strict protective measures in place.
Australia
In addition to the first AUS$17.6 billion stimulus plan, announced in May
2020, the Government announced further measures and extensions bringing
the total value of support to well over AUS$300 billion.
Within the plan, the Government pledged an AUS$1 billion (US$613 million)
package to support business investment; provide cash flow assistance to
support small and medium enterprises (SMEs); offer targeted support for the

India and the Coronavirus Pandemic: Economic Losses for Households Engaged in Tourism and Policies for Recovery
National Council of Applied Economic Research 31
Country Government Responses to COVID-19
most severely affected sectors, including travel and tourism; and make
household stimulus payments that will benefit the wider economy.
The Government pledged AUS$1 billion to support those sectors, regions, and
communities that have been disproportionately affected by the economic
impacts of COVID-19, including those heavily reliant on industries such as
tourism, agriculture, and education.
Australia’s ‘JobKeeper’ programme is helping to keep more Australians in
jobs and supporting businesses affected by the significant economic impact of
COVID-19. It is worth over AU$100 billion and has been adapted over time in
response to the evolving circumstances.
The Government also implemented cash injections and subsidies specifically
to enable certain tourism businesses to stay afloat. Tourism support covers
aviation programmes, regional tourism packages, business tourism grants,
and infrastructure investments.
It is estimated that the Government’s tax relief package to reduce the personal
income tax burden and encourage business investment would create around
100,000 jobs by the end of 2021-22 and boost GDP by around AU$6 billion
in 2020-21 and AU$19 billion in 2021-22.
Brazil
The National Development Bank has opened a working capital loan in the
tourism industry for SMEs. An airline relief package has also been prepared.
The analysis of the public policies suggests that these may have temporarily
reduced the main negative impacts of the pandemic on the various segments
that constitute the production chain of tourism, especially when it comes to
the maintenance of jobs and income through emergency financial aid.
Canada
The Government passed a C$107 billion (USD 75 billion) package in
emergency aid and economic stimulus. Through its measures, the
Government is providing up to $27 billion in direct support to Canadian
workers and businesses, plus $55 billion through tax deferrals to help meet
cash needs and stabilise the economy.
General support for individuals includes increasing the maximum annual
Canada Child Benefit (CCB) payment amounts by $300 per child; postponing
the individual tax filing date; and mortgage deferrals and loan re-
amortisation, among others, for homeowners. Support for people facing
unemployment includes a taxable benefit of C$2,000 a month through the
Canada Emergency Response Benefit (CERB) and includes, among others,
people quarantined and those helping a sick family member; up to $5 billion
in support to workers not eligible for Employment Insurance (EI) benefits;
and up to $900 bi-weekly, for up to 15 weeks for, among others, the self-
employed, those who are quarantined or sick with COVID-19 but do not
qualify for EI sickness benefits, and parents who require care or supervision
due to school closures.

India and the Coronavirus Pandemic: Economic Losses for Households Engaged in Tourism and Policies for Recovery
National Council of Applied Economic Research 32
Country Government Responses to COVID-19
Support for businesses includes amendments to the eligibility for the Work
Sharing Program, which provides benefits to workers who agree to reduced
normal working hours; a temporary wage subsidy equal to 10 per cent of the
remuneration paid during that period for small employers; more than $10
billion of additional support, largely targeted to SMEs; tax deferrals; lowering
the Domestic Stability Buffer to allow large banks to inject $300 billion of
additional lending; a 75 per cent wage subsidy for businesses; up to $40
billion in lending for SMEs; stable funding to banks and mortgage lenders to
continue lending; and providing up to $25 billion to eligible financial
institutions to provide Government-guaranteed and funded interest-free
loans to small businesses.
China
The Ministry of Culture and Tourism and the Industrial and Commercial
Bank of China (ICBC) signed a strategic cooperation agreement to help
cultural and tourism enterprises. ICBC is providing RMB100 billion credit
lines for affected cultural and tourism enterprises and making financing
succession arrangements to meet capital needs through "anti-epidemic loan",
"employment loan", and "tax loan", among others, so as to help privately-
owned enterprises and small-medium-micro culture and tourism enterprises.
The Civil Aviation Administration of China’s measures includes tax relief and
subsidies; VAT exemptions for revenues from transporting anti-epidemic
materials and express delivery; waiving airlines' payment to the civil aviation
development fund starting from 1 January 2021; and more.
What’s more, local Governments came up with credit risk-sharing policies to
increase bank lending to SMEs and the People's Bank of China offered 500
billion yuan of re-lending and rediscount funding to help small banks provide
low-cost funds to SMEs and the agricultural sector.
France
The French Government announced a plan of €45 billion to support the
economy, of which around €35 billion are dedicated to the deferral of social
and tax charges of companies. The self-employed were also considered in
these measures.
Within the €45 billion plan, €8.5 billion have been dedicated to the funding
of short-time working/partial unemployment measures. To use short-time
working, companies pay compensation equal to 70 per cent of the gross salary
(around 84 per cent of the net salary) to employees; employees with minimum
wage or less are 100 per cent compensated.
The State will also fully reimburse partial unemployment for wages up to
€6,927 gross monthly, that is, 4.5 times the minimum wage.
The Government is also implementing an exceptional guarantee scheme up
to €300 billion to support the bank financing of companies to facilitate those
banks granting loans to businesses of all sizes to preserve employment. In
addition, French banks have committed to postponing the reimbursement of
corporate loans for up to six months, free of charge.

India and the Coronavirus Pandemic: Economic Losses for Households Engaged in Tourism and Policies for Recovery
National Council of Applied Economic Research 33
Country Government Responses to COVID-19
Based on recommendations from the Tourism Sector Committee—a
committee created by the Government and comprised of Atout France and
both public and private sector actors—a draft ordinance has been put together
to support the cash flow of tourism operators in the face of cancellations.
Hong Kong
SAR
Following the $30 billion measures under the Anti-epidemic Fund and the
$120 billion relief package in the 2020-21 budget, the Hong Kong SAR
Government announced a new round of measures totalling $130 billion with
wide coverage, aiming to safeguard employment and the self-employed;
provide extra relief to those sectors hard hit by the epidemic, and pave the
way for post-epidemic economic recovery. These measures include an $81
billion Employment Support Scheme, as well as sector-specific initiatives
totalling $21 billion.
For the travel and tourism sector, the Government provided all licensed travel
agents with cash subsidies ranging from HK$20,000 to HK$200,000;
provided travel agents' staff and active freelance tourist guides and tour
escorts holding a valid pass with a monthly subsidy of $5,000 each for six
months and provided licensed hotels with cash subsidies between
HK$300,000 to HK$400,000.
Other relief measures for the industry included a one-off subsidy of
HK$10,000 for each tourist coach driver, waiving the monthly rent and
management fees of the operator of Kai Tak Cruise Terminal for six months,
as well as providing subsidies to cruise lines in the form of refunds of berth
deposits for cancelled ship calls during the suspension of immigration service.
Another round of support for travel agents, tourist guides, and tourist coach
drivers was announced in September 2020 and those who had received
previous support were contacted directly about the additional support.
New Zealand
The Government announced a $12.1 billion package to support New
Zealanders and protect their jobs from the global impact of COVID-19. The
package represents 4 per cent of GDP and is more than the total of all three
budgets’ new operating spending in this term of Government put together.
The package includes $5.1 billion in wage subsidies for affected business in all
sectors and regions as of 17 March; $126 million in COVID-19 leave and self-
isolation support; $2.8 billion income support for the most vulnerable; and
$2.8 billion in business tax changes to free up cash flow, including a
provisional tax threshold lift.
This cash injection is on top of the $12 billion New Zealand Upgrade
Programme announced in January. The Government will open a NZ$900
million (US$580 million) loan facility to the national carrier as well as an
additional NZ$600 million relief package for the aviation sector.
Key measures introduced include the re-introduction, from the 2020-21
income year, of a 2 per cent DV depreciation deduction for commercial and
industrial buildings, including hotels and motels; an emergency policy rate

India and the Coronavirus Pandemic: Economic Losses for Households Engaged in Tourism and Policies for Recovery
National Council of Applied Economic Research 34
Country Government Responses to COVID-19
cut to 0.25 per cent, for at least 12 months, by the reserve bank; and a Small
Business Cashflow Loan scheme, offering up to $100,000 to firms employing
50 or fewer full-time equivalent employees.
In September 2020, the Government announced a scheme to pay travel
agents to secure refunds or credit for cancelled travel plans on behalf of
consumers.
Portugal
The Government launched over 30 initiatives to protect workers and families
and mitigate the economic impacts of COVID-19.
It placed particular emphasis on the travel and tourism sector by establishing
a dedicated €60 million credit line for micro-businesses in the sector and by
working closely with Turismo de Portugal to bolster national capacity to
respond to the challenges resulting from COVID-19.
Business support measures include extraordinary support for the
maintenance of employment contracts in a company in the amount of two-
thirds of the remuneration, and ensuring 70 per cent of Social Security, the
remainder being borne by the employer; offering training scholarships in the
Institute for Employment and Vocational Training in Portugal (IEFP); the
extension of deadlines for the payment of taxes and other declarative
obligations; exceptional financial support for employees and the self-
employed who have to stay at home to accompany their children aged up to
12 years; guaranteeing social protection for trainees and trainers in the course
of training actions; and more.
The Government approved State-guaranteed credit lines including €200
million for travel agencies, recreational services enterprises, and event
organisers, of which €75 million are for micro and small businesses; €900
million for hotels and accommodation establishments, of which €300 million
are for micro and small businesses; rent relief; and more. Turismo de Portugal
has created a €60 million support line for tourism micro-enterprises.
For residents, all Turismo de Portugal’s Tourism Schools are now delivering
online classes and the tuition fees were suspended during this period.
Together with private sector associations Turismo de Portugal has made
available a fund of €250,000 to support accommodation and hotel owners
with electricity, water, gas, and cleaning costs.
Singapore
The Government rolled out several policies and measures to support the
travel and tourism sector with a focus on confidence-building and providing
aid.
To build confidence, the Government is providing support for professional
environmental cleaning and disinfection costs for hotels that provided
accommodation for suspected/confirmed cases. Singapore created a Clean
Certification to provide assurance to locals and visitors on tourism venues and
facilities implementing rigorous preventive measures.

India and the Coronavirus Pandemic: Economic Losses for Households Engaged in Tourism and Policies for Recovery
National Council of Applied Economic Research 35
Country Government Responses to COVID-19
Among other measures to support the sector, Singapore also waived the
licence fees for STB-licensed hotels, travel agents, and tourist guides for
2020; reduced by 50 per cent the industry participation fees for STB-led
tradeshows; enhanced the training scheme, and funding up to 90 per cent of
training course fees and trainer fees; provided salary support through
Workforce Singapore of up to 70 per cent of fixed monthly salaries, capped at
$2,000 per month per employee for the training duration for up to six
months; provided licensed self-employed tourist guides with wage support of
$1,000 to assist with some of their basic living expenses, provided they are
Singaporean citizens or permanent residents; implemented rebates on
aircraft landing and parking charges as well as rental rebates for shops and
cargo agents at Changi; and more.
The Government is ready to consider further measures if and when necessary.
United
Kingdom
The Chancellor set out a package of targeted measures currently amounting
to £330 billion to support public services, people, and businesses. The
measures include but are not limited to, 12-month business rates holiday for
all retail, hospitality, and leisure businesses in England; grant funding of
£25,000 for retail, hospitality, and leisure businesses with property with a
rateable value of more than £15,000 and less than £51,000; small business
grant funding of £10,000 for all businesses in receipt of small business rate
relief or rural rate relief; the Coronavirus Business Interruption Loan
Schemes (CBILS) offering Government-guaranteed loans of up to £5 million
for SMEs, up to £50 million of finance for larger businesses, and up to £5
million for others that cannot access the CIBLS; cash grants of up to 80% of
their normal profits for self-employed individuals; and short-term debt
options through the Bank of England for larger companies.
The Government also stepped in to pay wages with the Job Retention Scheme;
a grant covered 80 per cent of wages up to £2,500 for those employees on
furlough kept on payroll as well as national insurance and pension
contributions. Revised wage support is available from 1 November 2020.
Tourism-specific support includes the Destination Management Resilience
Scheme, which re-purposes £1.3 million of DEF funding to help support
DMOs so they can lead the recovery of the industry in their area. The Scottish
Government is providing two funding packages worth £15 million to support
T&T.
Source: NCAER compilation using different sources including OECD, WTTC, etc.
In addition to the countries mentioned in Table 2, we have also tried to examine the
initiatives taken by the Governments of South Asian countries in response to the COVID-
19 pandemic to support the tourism sector. The World Bank collated these initiatives from
all the South Asian countries on different support initiatives that were apt for the survival
and recovery of the tourism sector.

India and the Coronavirus Pandemic: Economic Losses for Households Engaged in Tourism and Policies for Recovery
National Council of Applied Economic Research 36
Table 3: Summary of COVID-19 Response Activities by Governments in South Asia
Support Initiatives
Ba
ng
lad
es
h
Bh
uta
n
Ind
ia
Ma
l-d
ive
s
Ne
pa
l
Pa
kis
tan
Sr
i L
an
ka
Cash grants/subsidies/transfers (or similar) Yes Yes Yes Yes
Wage subsidies Yes Yes
Tax rebates/relief/extension Yes Yes Yes yes
Loans/loan repayment support Yes Yes Yes Yes Yes
Rules alleviation Yes Yes Yes Yes
Licence fee waivers for businesses Yes
Fees/bills waivers Yes Yes Yes
Training or mentoring incentives/programmes Yes
Loans or grants for upgrades Yes
Strategic programme launch for tourism Yes Yes
Tourism communications or crisis task force Yes Yes Yes Yes Yes Yes Yes
Health/sanitation certification for tourism Yes
Monitoring tourism industry data Yes
Support for industry to address contamination Yes Yes Yes Yes
Repurposing tourism assets for crisis operations Yes Yes Yes Yes Yes
Retraining tourism workers to support the health crisis Yes Yes
National carriers waiving cancellation fees Yes Yes Yes Yes Yes Yes
Maintaining cargo operations of national carriers Yes Yes Yes Yes Yes Yes Yes
Ports waiving port-related fees Yes Yes
Source: World Bank. (2020). “COVID-19 and Tourism in South Asia: Opportunities for Sustainable Regional
Outcomes.” Washington, D.C.: The World Bank Group.
VI. Recommendations for the Revival of Tourism in India
This section discusses the recommendations proposed for the revival of the Indian
tourism industry, which are based on the profile of Indian tourists and other countries’
experiences. These are also based on the feedback received from the tourism industry
stakeholders like the Federation of Indian Chambers of Commerce and Industry (FICCI)
Tourism Committee, Confederation of Indian Industry (CII) National Committee on
Tourism and Hospitality, Associated Chambers of Commerce and Industry of India
(ASSOCHAM), PHDCCI Tourism Committee, PATA (Pacific Asia Travel Association)
India Chapter, Responsible Tourism Society of India (RTSOI), Indian Association of

India and the Coronavirus Pandemic: Economic Losses for Households Engaged in Tourism and Policies for Recovery
National Council of Applied Economic Research 37
Tourism Parks and Industries (IATPI), Indian Golf Union, World Travel and Tourism
Council India Initiative (WTTCII), Adventure Tour Operators Association of India
(ATOAI), Association of Domestic Tour Operators of India (ADTOI), Indian Association
of Tour Operators (IATO), Travel Agents Association of India (TTAI), Travel Agents
Federation of India (TAFI), India Convention Promotion Bureau (ICPB), Internet and
Mobile Association of India (IAMAI), Federation of Associations in Indian Tourism and
Hospitality (FAITH), and Association of Buddhist Tour Operators (ABTO).
The proposed recommendations are detailed below.
VI.1. Promotion of Domestic Tourism
With the current restrictions on international travel to and from several countries, and
their likely continuation amid worries of a third wave of COVID-19 in India, both inbound
and outbound tourism would be the most adversely impacted. However, if the State
borders remain open, there is a possibility of the domestic industry holding steady.
Although a domestic trip costs only about a fraction of an international trip (both inbound
and outbound), statistics reveal that in terms of the total demand generated by all forms
of tourism, domestic tourism is the key driving force, given its huge incomparable volume.
Figures 15 and 16 present the per-tourist expenditure and percentage distribution of
tourism expenditure incurred by all forms of tourism (including expenditure incurred by
outbound tourists during their trips abroad)8 estimated for the pre-pandemic year of
2019-20.
8 The figure for outbound tourism expenditure has been obtained from the Reserve Bank of India’s Balance of Payments statements, in which the debit value under the ‘Travel’ head is considered as expenditure incurred by Indian residents abroad.
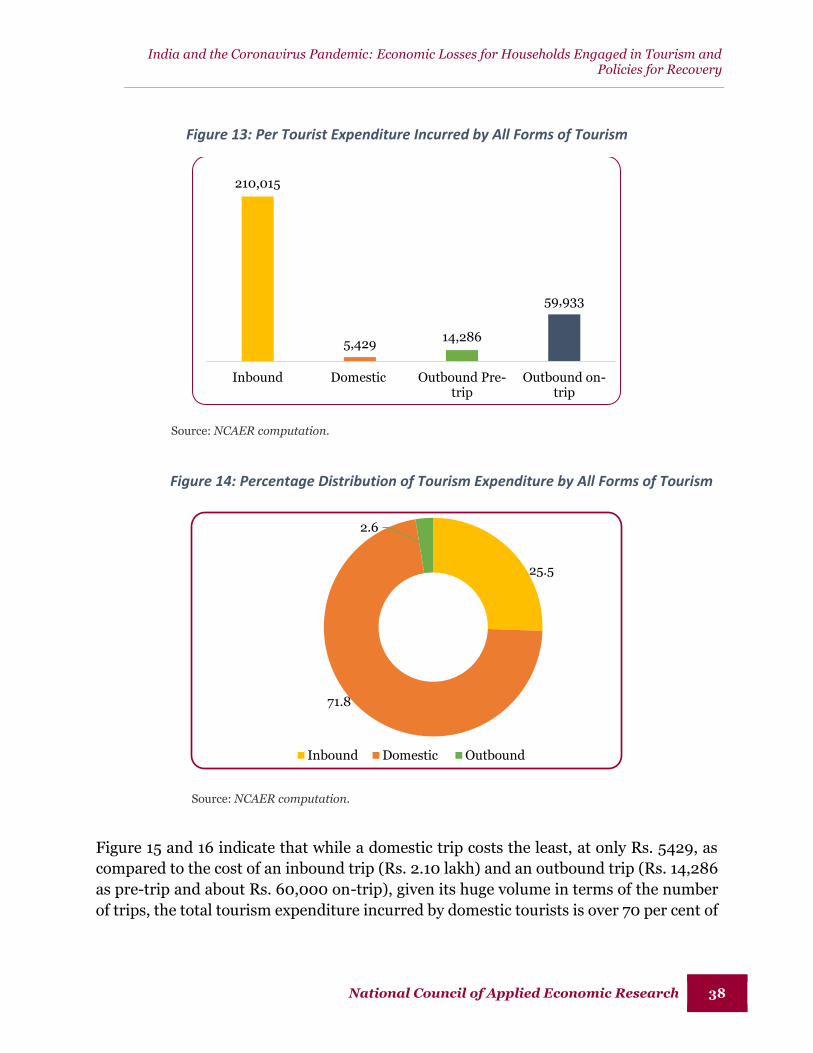
India and the Coronavirus Pandemic: Economic Losses for Households Engaged in Tourism and Policies for Recovery
National Council of Applied Economic Research 38
Figure 13: Per Tourist Expenditure Incurred by All Forms of Tourism
Source: NCAER computation.
Source: NCAER computation.
Figure 15 and 16 indicate that while a domestic trip costs the least, at only Rs. 5429, as
compared to the cost of an inbound trip (Rs. 2.10 lakh) and an outbound trip (Rs. 14,286
as pre-trip and about Rs. 60,000 on-trip), given its huge volume in terms of the number
of trips, the total tourism expenditure incurred by domestic tourists is over 70 per cent of
210,015
5,42914,286
59,933
Inbound Domestic Outbound Pre-trip
Outbound on-trip
25.5
71.8
2.6
Inbound Domestic Outbound
Figure 14: Percentage Distribution of Tourism Expenditure by All Forms of Tourism

India and the Coronavirus Pandemic: Economic Losses for Households Engaged in Tourism and Policies for Recovery
National Council of Applied Economic Research 39
the total internal tourism expenditure. Hence, the contribution of tourism to the economy
is mainly on account of domestic tourism.
Besides, domestic tourism is more resilient to natural calamities or pandemics as trips
undertaken especially for social, health, and business purposes seldom get severely
impacted unless there are extreme situations like the imposition of a curfew.
This study, therefore, recommends that domestic tourism should be promoted much
more aggressively than inbound tourism. The Government has already launched several
initiatives to boost domestic tourism like the ‘Dekho Apna Desh’ campaign under which
tourists are rewarded if they visit at least 15 destinations in the country in a year and
submit pictures of the trips. There is also need for State-level promotions of such schemes.
Further, given the prevalent conditions, the minimum number of trips to be taken under
this scheme may be relaxed.
We propose the following possible boosters for domestic tourism:
Rural tourism: This is popular among people living in urban settings, wishing to
escape from the hustle and bustle of the cities to experience calm in serene rural
locations and to treat themselves to lavish village cuisine. Encouraging rural
tourism will offer immense opportunities to tourism business entities in the
regional and rural destinations. The expected policy stimulus to encourage people
to visit regional and rural areas will help in boosting the recovery of tourism.
Affordable accommodation: Policies by both the Central as well as State
governments should encourage accommodation alternatives that can provide
staying facilities at affordable prices and also in remote areas while also providing
a unique experience to tourists. This should include facilities like homestays,
camping, bed and breakfast (B&B) arrangements, and short-term rentals, among
other things. Some of the digital platforms connecting consumers to low-cost
accommodation, such as AirBnB, Makemytrip, and Goibibo should be encouraged
to connect with more homestays and such options, albeit with a monitoring
mechanism so that the accommodation owners are also able to reap the benefits.
The homestays are becoming particularly popular due to their affordability,
hygienic conditions, provision of privacy, and capacity to host tourists arriving in
large groups.
Road trips: The pandemic affected travel by air and railways the most due to the
restricted operations of flights and trains. In such a situation, people resorted to
short road trips when the previous wave subsided. With better infrastructure and
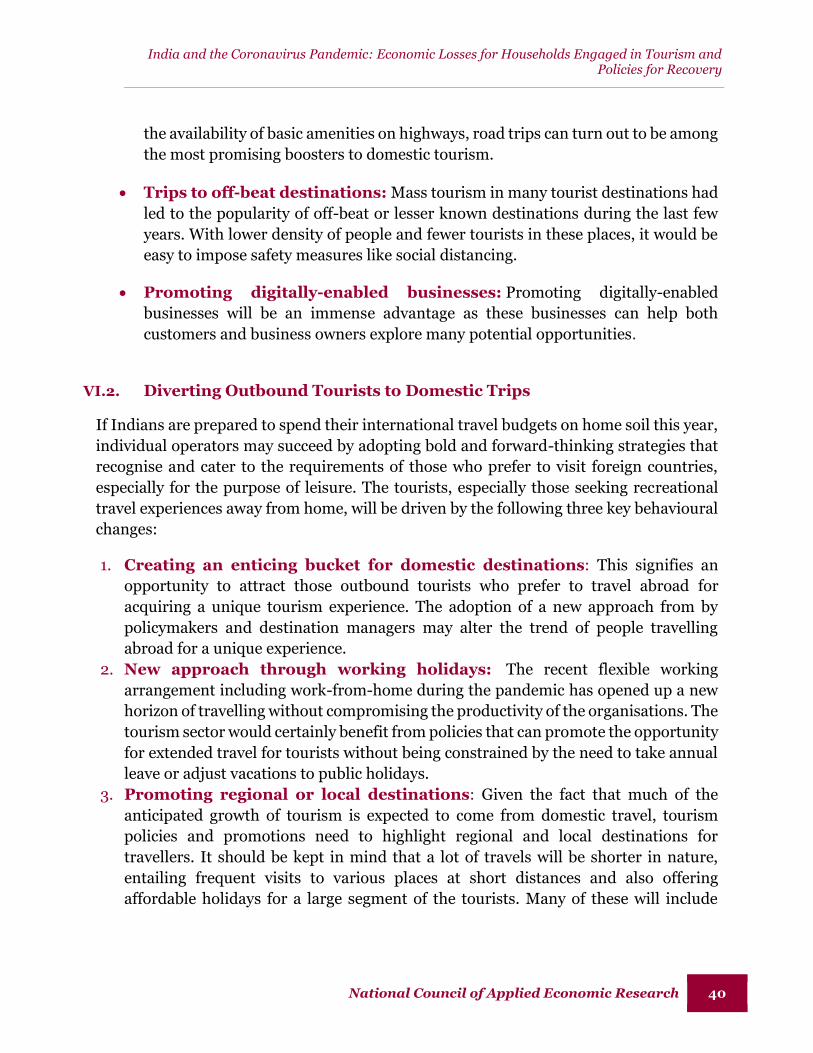
India and the Coronavirus Pandemic: Economic Losses for Households Engaged in Tourism and Policies for Recovery
National Council of Applied Economic Research 40
the availability of basic amenities on highways, road trips can turn out to be among
the most promising boosters to domestic tourism.
Trips to off-beat destinations: Mass tourism in many tourist destinations had
led to the popularity of off-beat or lesser known destinations during the last few
years. With lower density of people and fewer tourists in these places, it would be
easy to impose safety measures like social distancing.
Promoting digitally-enabled businesses: Promoting digitally-enabled
businesses will be an immense advantage as these businesses can help both
customers and business owners explore many potential opportunities.
VI.2. Diverting Outbound Tourists to Domestic Trips
If Indians are prepared to spend their international travel budgets on home soil this year,
individual operators may succeed by adopting bold and forward-thinking strategies that
recognise and cater to the requirements of those who prefer to visit foreign countries,
especially for the purpose of leisure. The tourists, especially those seeking recreational
travel experiences away from home, will be driven by the following three key behavioural
changes:
1. Creating an enticing bucket for domestic destinations: This signifies an
opportunity to attract those outbound tourists who prefer to travel abroad for
acquiring a unique tourism experience. The adoption of a new approach from by
policymakers and destination managers may alter the trend of people travelling
abroad for a unique experience.
2. New approach through working holidays: The recent flexible working
arrangement including work-from-home during the pandemic has opened up a new
horizon of travelling without compromising the productivity of the organisations. The
tourism sector would certainly benefit from policies that can promote the opportunity
for extended travel for tourists without being constrained by the need to take annual
leave or adjust vacations to public holidays.
3. Promoting regional or local destinations: Given the fact that much of the
anticipated growth of tourism is expected to come from domestic travel, tourism
policies and promotions need to highlight regional and local destinations for
travellers. It should be kept in mind that a lot of travels will be shorter in nature,
entailing frequent visits to various places at short distances and also offering
affordable holidays for a large segment of the tourists. Many of these will include

India and the Coronavirus Pandemic: Economic Losses for Households Engaged in Tourism and Policies for Recovery
National Council of Applied Economic Research 41
more young professionals, older families, and backpackers who look for adventures
and unique experiences through tourism.
VI.3. Target Incentives to Industries Contributing Most to the Tourism
Economy
The data on tourism expenditure reveal that of all the tourism-characteristic products and
services, food and beverage providing services, road passenger transport services, and
healthcare providing services account for close to 80 per cent of the total tourism
expenditure on tourism-characteristic goods and services. The percentage distribution of
all tourism-characteristic goods and services, taken as an average of the previous six years
(2015-16 to 2019-20) is presented in Figure 17.
Figure 17 suggests that the largest contributor to tourism is healthcare providing services
(33.9 per cent), indicating the popularity of medical tourism in the country. In the
aftermath of the pandemic, medical tourism is likely to contribute even more as people
are willing to travel to other States or districts in search of better medical facilities. Food
providing services, which include restaurants and dhabas, among others, account for
another 25.4 per cent of the tourism activity, and road passenger transport, which is the
most popular transport service among domestic tourists, accounts for 18.5 per cent of the
total tourism expenditure on characteristic goods and services.
Figure 15: Percentage Distribution of Expenditure across Tourism-characteristic Goods and Services (%)
1. Source: NCAER computation
0.3
0.5
1.3
1.4
2.5
2.9
3.1
10.2
18.5
25.4
33.9
Transport equipment rental services
Cultural and religious services
Travel agencies and other reservation services
Water passenger transport services
Air passenger transport services
Accommodation services/Hotels
Railway passenger transport services
Sports and other recreational services
Food and beverage serving services/Restaurants
Road passenger transport services
Health and medical related services

India and the Coronavirus Pandemic: Economic Losses for Households Engaged in Tourism and Policies for Recovery
National Council of Applied Economic Research 42
Hence, if the government policies are to be prioritised and targeted towards the most
important industries catering to tourists, they should focus on the three key industries of
healthcare providing services, food providing services, and road passenger transport
services.
VI.4. Other Recommendations
Some of the other recommendations are as follows:
• Re-establish trust in travel and tourism among tourists.
• Ensure adherence to safety and mandatory health and hygiene protocols to the
highest standards possible.
• Make Protocols mandatory for tourists also.
• Adopt a High-Value, Low-Volume (HVLV) approach (as that followed in Bhutan).
• Seek Government responsiveness for preparing a Tourism Recovery Plan.
• Provide tax benefits, subsidies, and incentives to industry players so that they can
survive and overcome this pandemic shock.
• Integrate public health with tourism.
• Secure the issuance of vaccine certificates.
• Create a healthy environment which is a natural barrier against future pandemics.
• Promote technological innovations like digital marketing and virtual tours in the
tourism industry.
• Increase the use of digital services to improve the customer safety experience and
adapt quickly if the health context in the local area changes.
• Offer targeted support for the vulnerable communities.
• Support businesses in diversifying revenue sources.
• Identify and target a diverse customer base.
• Maintain customer and employee confidence.
It is imperative for the policy measures to take into account all the above key areas which
are identified in the proposed recommendations, in order to foster the growth of the
tourism industry in the country. Simultaneously, it is also important to consider that a
large portion of the households involved in the tourism sector belong to the informal
sector and do not have the bargaining power enjoyed by the formal sector players.
Therefore, it is critical for the policy measures to reach the last mile representatives of the
tourism sector so that the measures prescribed as the policy recommendations percolate
to the bottom of the pyramid relevant to the tourism sector.

India and the Coronavirus Pandemic: Economic Losses for Households Engaged in Tourism and Policies for Recovery
National Council of Applied Economic Research 43
Appendix I
TABLE A1: GVA BY INDUSTRIES (RS. LAKH)
2019-20 2020-21
2018-19 2019-20 Q1 Q2 Q3 Q1 Q2 Q3
Agriculture and allied 301627676 339403252 74890000 64121000 109671700 78869400 68744000 117785000
Mining, other manufacturing, construction, electricity, gas and water supply
265444606 254795227 65058627 62242128 61816502 40799262 60817910 63369952
Trade 195429813 212442883 52003470 50008842 52495107 31101716 46374811 50758879
Transport freight services
52090903 55391244 13559112 13039043 13687299 1181126 7672595 11421247
All non-tourism specific services
766837936 840357022 217141110 224381117 197663731 191287005 210899881 211969060
Accommodation services/Hotels
2467124 2719902 665799 640262 672094 398195 593736 649865
Food and beverage serving services/Restaurants
15601829 17200376 4210446 4048951 4250251 2518141 3754723 4109678
Railway passenger transport services
2464982 2727464 667650 642042 673962 -2627 23379 119988
Road passenger transport services
20958168 22070430 5402576 5195357 5453652 670146 4316485 6104411
Water passenger transport services
1215828 1422106 348115 334762 351406 20671 75192 153702
Air passenger transport services
1155473 1950335 477419 459107 481932 28349 103122 210793
Transport equipment rental services
221790 250847 72176 77178 63385 68696 71928 67868
Travel agencies and other reservation services/Supporting and auxiliary transport activities
1002278 1047241 256352 246520 258776 15337 89722 149637
Cultural and religious services
426913 482842 138927 148557 122006 132229 138451 130635
Sports and other recreational services
8049651 9104231 2619543 2801112 2300477 2493246 2610570 2463194
Health and medical related services
28320877 32753902 7882304 8428650 6922223 7502270 7855304 7411842
Readymade garments 7710075 7606419 1613235 1596773 1544981 796286 1469357 1454694
Processed food 26073908 25886817 5972260 5911314 5719579 4599358 5948441 5772716
Alcohol and tobacco products
6995211 6924361 2246343 2223419 2151302 1729954 2237384 2171289
Travel related consumer goods
4393327 4232536 963155 953326 922405 499797 889120 889353
Footwear 7816 7527 1623 1607 1555 801 1479 1464
Soaps, cosmetics and glycerine
2576478 2528962 495812 490752 474834 312689 484656 505194
Gems and jewellery 642839 620544 189208 187277 181203 119326 184951 192789
Books, journals, magazines, stationery, etc.
4405776 4207854 846138 837503 810339 533626 827101 862149
Total TDGVA 1716121274 184613432
6 457721400 449016600 468690700 365675000 426184300 488725400
Source: NCAER computations.

India and the Coronavirus Pandemic: Economic Losses for Households Engaged in Tourism and Policies for Recovery
National Council of Applied Economic Research 44
TABLE A2: TIRS AND TDGVA TO ESTIMATE IMPACT DUE TO OVERALL
ECONOMIC SLOWDOWN (RS . LAKH)
2019-20 2020-21
TIR for All the Years, Quarters
2018-19 2019-20 Q1 Q2 Q3 Q1 Q2 Q3
Agriculture and allied
0.0000 0 0 0 0 0 0 0 0
Mining, other manufacturing, construction, electricity, gas and water supply
0.0021 5470 5251 1341 1283 1274 841 1253 1306
Trade 0.7864 1536860 1670651 408955 393270 412822 244584 364692 399168
Transport freight services
2.3684 1233696 1311860 321127 308810 324163 27973 181714 270495
All non-tourism specific services
1.3731 10529730 11539248 2981643 3081059 2714193 2626631 2895943 2910624
Accommodation services/Hotels
71.3609 1760562 1940947 475121 456897 479612 284155 423695 463750
Food and beverage serving services/Restaurants
54.2109 8457886 9324472 2282519 2194971 2304098 1365106 2035468 2227892
Railway passenger transport services
69.8046 1720671 1903896 466051 448175 470457 -1834 16320 83758
Road passenger transport services
52.4399 1099044
5 11573714 2833106 2724441 2859890 351424 2263561 3201148
Water passenger transport services
3.7996 46197 54035 13227 12720 13352 785 2857 5840
Air passenger transport services
81.0964 937047 1581652 387169 372319 390830 22990 83628 170946
Transport equipment rental services
38.0000 84280 95322 27427 29328 24086 26104 27333 25790
Travel agencies and other reservation services/ Supporting and auxiliary transport activities
51.2532 513699 536744 131389 126349 132631 7861 45985 76694
Cultural and religious services
20.1000 85809 97051 27924 29860 24523 26578 27829 26258
Sports and other recreational services
5.7156 460084 520360 149722 160100 131486 142503 149209 140786
Health and medical related services
29.5841 8378489 9689961 2331912 2493544 2047880 2219482 2323924 2192730
Readymade garments
0.0001 8 8 2 2 2 1 2 2
Processed food 0.0003 72 72 17 16 16 13 16 16
Alcohol and tobacco products
0.0061 428 423 137 136 132 106 137 133
Travel related consumer goods
0.0131 577 555 126 125 121 66 117 117
Footwear 0.0002 0 0 0 0 0 0 0 0
Soaps, cosmetics and glycerine
0.0014 37 36 7 7 7 4 7 7
Gems and jewellery 0.0328 211 204 62 62 60 39 61 63
Books, journals, magazines, stationery, etc.
0.0009 38 36 7 7 7 5 7 7
Total TDGVA 46742297 51846498 12838993 12833480 12331640 7345419 10843757 12197528
Source: NCAER computations.

India and the Coronavirus Pandemic: Economic Losses for Households Engaged in Tourism and Policies for Recovery
National Council of Applied Economic Research 45
TABLE A3: TIRS AND TDGVA TO ESTIMATE IMPACT DUE TO COMBINED
DEMAND SHOCK
Tourism Industry Ratios (%) 2020-
21 2020-21 (Rs. Lakh)
Q1 Q2 Q3 Q1 Q2 Q3
Agriculture and allied 0.0000 0.0000 0.0000 0 0 0
Mining, other manufacturing, construction, electricity, gas and water supply
0.0004 0.0005 0.0007 146 313 440
Trade 0.0651 0.1754 0.2607 20238 81356 132333
Transport freight services 0.2268 0.5819 0.9473 2678 44644 108194
All non-tourism specific services 0.2378 0.3433 0.4622 454785 723978 979675
Accommodation services/Hotels
4.8129 16.2375 19.3641 19165 96408 125841
Food and beverage serving services/Restaurants
4.3785 12.7098 18.0095 110257 477219 740133
Railway passenger transport services
6.6588 17.1047 27.8131 -175 3999 33372
Road passenger transport services
5.0211 12.8835 20.9751 33648 556116 1280407
Water passenger transport services
0.3226 0.9105 1.3321 67 685 2047
Air passenger transport services 7.3333 19.4031 30.5226 2079 20009 64340
Transport equipment rental services
3.2605 9.0297 13.4940 2240 6495 9158
Travel agencies and other reservation services/Supporting and auxiliary transport activities
3.9229 11.1937 16.1725 602 10043 24200
Cultural and religious services 1.3057 4.5642 5.2227 1726 6319 6823
Sports and other recreational services
0.3538 1.2480 1.4129 8820 32581 34802
Health and medical related services
2.7775 7.1988 11.5890 208373 565486 858955
Readymade garments 0.0000 0.0000 0.0000 0 0 1
Processed food 0.0000 0.0001 0.0001 2 4 5
Alcohol and tobacco products 0.0011 0.0015 0.0021 18 34 45
Travel related consumer goods 0.0023 0.0033 0.0044 11 29 39
Footwear 0.0000 0.0001 0.0001 0 0 0
Soaps, cosmetics and glycerine 0.0002 0.0004 0.0005 1 2 2
Gems and jewellery 0.0057 0.0082 0.0111 7 15 21
Books, journals, magazines, stationery, etc.
0.0001 0.0002 0.0003 1 2 2
Total TDGVA 864690 2625738 4400835
Source: NCAER computations.

India and the Coronavirus Pandemic: Economic Losses for Households Engaged in Tourism and Policies for Recovery
National Council of Applied Economic Research 46
TABLE A4: TIRS AND TDGVA TO ESTIMATE IMPACT DUE TO INBOUND
TOURISM DEMAND SHOCK
Tourism Industry ratios (%) 2020-21 2020-21 (Rs. Lakh)
Q1 Q2 Q3 Q1 Q2 Q3
Agriculture and allied 0.0000 0.0000 0.0000 0 0 0
Mining, other manufacturing, construction, electricity, gas and water supply
0.0013 0.0013 0.0013 533 795 828
Trade 0.4854 0.5257 0.5320 150965 243791 270061
Transport freight services 2.1429 2.1786 2.1843 25310 167159 249472
All non-tourism specific services 0.8709 0.8709 0.8709 1665981 1836796 1846108
Accommodation services/Hotels 13.0247 23.0807 24.6653 51864 137038 160291
Food and beverage serving services/Restaurants
29.0625 33.2799 33.9444 731836 1249567 1395006
Railway passenger transport services 62.7670 63.8616 64.0340 -1649 14930 76833
Road passenger transport services 47.4482 48.2395 48.3642 317972 2082251 2952349
Water passenger transport services 2.3595 2.6078 2.6470 488 1961 4068
Air passenger transport services 64.4030 66.9611 67.3642 18258 69052 141999
Transport equipment rental services 25.2721 27.3727 27.7037 17361 19689 18802
Travel agencies and other reservation services/Supporting and auxiliary transport activities
27.6546 30.9701 31.4926 4241 27787 47125
Cultural and religious services 2.2041 5.3129 5.8028 2915 7356 7580
Sports and other recreational services 0.5019 1.3715 1.5086 12515 35805 37159
Health and medical related services 25.6452 26.2552 26.3513 1923972 2062427 1953120
Readymade garments 0.0001 0.0001 0.0001 1 1 1
Processed food 0.0002 0.0002 0.0002 8 10 10
Alcohol and tobacco products 0.0039 0.0039 0.0039 67 87 84
Travel related consumer goods 0.0083 0.0083 0.0083 42 74 74
Footwear 0.0001 0.0001 0.0001 0 0 0
Soaps, cosmetics and glycerine 0.0009 0.0009 0.0009 3 4 5
Gems and jewellery 0.0208 0.0208 0.0208 25 39 40
Books, journals, magazines, stationery, etc. 0.0005 0.0005 0.0005 3 4 5
Total TDGVA 4922710 7956623 9161022
Source: NCAER computations.

India and the Coronavirus Pandemic: Economic Losses for Households Engaged in Tourism and Policies for Recovery
National Council of Applied Economic Research 47
TABLE A5: TIRS AND TDGVA TO ESTIMATE IMPACT DUE TO DOMESTIC
TOURISM DEMAND SHOCK
Tourism Industry Ratios (%) 2020-21 2020-21 (Rs. Lakh)
Q1 Q2 Q3 Q1 Q2 Q3
Agriculture and allied 0.0000 0.0000 0.0000 0 0 0
Mining, other manufacturing, construction, electricity, gas and water supply
0.0004 0.0005 0.0007 146 313 440
Trade 0.2937 0.3638 0.4427 91350 168697 224707
Transport freight services 0.4295 0.7489 1.1087 5073 57457 126623
All non-tourism specific services 0.2378 0.3433 0.4622 454785 723978 979675
Accommodation services/Hotels 61.8578 63.2264 64.7684 246314 375398 420907
Food and beverage serving services/Restaurants 28.3023 32.4163 37.0514 712692 1217143 1522695
Railway passenger transport services 12.8679 22.2193 32.7552 -338 5195 39302
Road passenger transport services 9.5099 16.5811 24.5480 63730 715720 1498508
Water passenger transport services 1.7314 2.0709 2.4533 358 1557 3771
Air passenger transport services 21.8449 31.3565 42.0730 6193 32335 88687
Transport equipment rental services 15.1766 18.8452 22.9785 10426 13555 15595
Travel agencies and other reservation services/Supporting and auxiliary transport activities
22.7311 26.6864 31.1427 3486 23943 46601
Cultural and religious services 18.9408 19.0906 19.2593 25045 26431 25159
Sports and other recreational services 5.2867 5.3114 5.3392 131810 138657 131515
Health and medical related services 6.2379 10.0492 14.3433 467987 789398 1063101
Readymade garments 0.0000 0.0000 0.0000 0 0 1
Processed food 0.0000 0.0001 0.0001 2 4 5
Alcohol and tobacco products 0.0011 0.0015 0.0021 18 34 45
Travel related consumer goods 0.0023 0.0033 0.0044 11 29 39
Footwear 0.0000 0.0001 0.0001 0 0 0
Soaps, cosmetics and glycerine 0.0002 0.0004 0.0005 1 2 2
Gems and jewellery 0.0057 0.0082 0.0111 7 15 21
Books, journals, magazines, stationery, etc. 0.0001 0.0002 0.0003 1 2 2
Total TDGVA 2219098 4289864 6187402
Source: NCAER computations.

India and the Coronavirus Pandemic: Economic Losses for Households Engaged in Tourism and Policies for Recovery
National Council of Applied Economic Research 48
TABLE A6: ESTIMATED NUMBER OF TOTAL JOBS IN TOURISM-CHARACTERISTIC INDUSTRIES
2019-20 2020-21
Q1 Q2 Q3
Accommodation services/Hotels 923490 552061 818328 842980
Food and beverage serving services/Restaurants
9173388 6487413 8412917 8591184
Railway passenger transport services 803115 331587 350538 417054
Road passenger transport services 13718723 6690899 12361511 12935789
Water passenger transport services 92942 -12511 6013 29868
Air passenger transport services 57331 25793 31333 38468
Transport equipment rental services 120590 110412 117680 121079
Travel agencies and other reservation services/Supporting and auxiliary transport activities
954700 429775 599577 719225
Cultural and religious services 1120680 752752 1015500 1138357
Sports and other recreational services 1611566 351876 1251458 1672085
Health and medical related services 6248999 4593640 4702773 6508857
Total Tourism Jobs (Sum of above) 34825523 20313698 29667629 33014945
Source: NCAER computations.
TABLE A7: ESTIMATED NUMBER OF EMPLOYEES IN TOURISM-CHARACTERISTIC INDUSTRIES
2019-20 2020-21
Q1 Q2 Q3
Accommodation services/Hotels 784984 469263 695595 716550
Food and beverage serving services/Restaurants
3952135 2794947 3624504 3701306
Railway passenger transport services 779221 321722 340109 404646
Road passenger transport services 5959283 2906463 5369723 5619184
Water passenger transport services 89406 -12035 5784 28732
Air passenger transport services 57331 25793 31333 38468
Transport equipment rental services 55824 51112 54477 56050
Travel agencies and other reservation services/Supporting and auxiliary transport activities
652168 293585 409579 491312
Cultural and religious services 515724 346408 467322 523859
Sports and other recreational services 908147 198289 705220 942251
Health and medical related services 5316545 3908193 4001041 5537627
Total Tourism Jobs (Sum of above) 19070769 11303740 15704688 18059985
Source: NCAER computations.

India and the Coronavirus Pandemic: Economic Losses for Households Engaged in Tourism and Policies for Recovery
National Council of Applied Economic Research 49
TABLE A8: ESTIMATED NUMBER OF SELF-EMPLOYED IN TOURISM-CHARACTERISTIC INDUSTRIES
2019-20 2020-21
Q1 Q2 Q3
Accommodation services/Hotels 138505 82798 122733 126430
Food and beverage serving services/Restaurants 5221253 3692466 4788413 4889878
Railway passenger transport services 23894 9865 10429 12408
Road passenger transport services 7759440 3784436 6991788 7316605
Water passenger transport services 3535 -476 229 1136
Air passenger transport services - - - -
Transport equipment rental services 64766 59299 63203 65028
Travel agencies and other reservation services/ Supporting and auxiliary transport activities
302532 136190 189998 227913
Cultural and religious services 604956 406344 548178 614498
Sports and other recreational services 703419 153588 546238 729834
Health and medical related services 932454 685447 701732 971230
Total Tourism Jobs (Sum of above) 15754754 9009958 13962941 14954960
Source: NCAER computations.
TABLE A9: ESTIMATED WAGE AND NON-WAGE INCOME IN MAJOR TOURISM-CHARACTERISTIC INDUSTRIES (AT CONSTANT PRICES)
2019-20 2020-21
Q1 Q2 Q3
Wage Income
Accommodation services/Hotels 725212 221565 582617 616043
Food and beverage serving services/Restaurants
4106543 3611461 3966372 3999231
Road passenger transport services 3486589 1026274 3011453 3212498
Other Transport services 2664495 1238909 1415756 1690718
Others 18600985 11186280 15113248 19054127
Total Tourism Wage Income 29583825 17284488 24089446 28572616
Non-wage Income
Accommodation services/Hotels 1306665 1195821 1275282 1282638
Food and beverage serving services/Restaurants
12490205 -19737634 3365655 5504593
Road passenger transport services 13581648 1001987 11152265 12180212
Other Transport services 941519 962549 955790 950294
Others 10717126 7050956 10303274 10827691
Total Tourism Non-wage Income 39037162 -9526322 27052265 30745428
Source: NCAER computations.
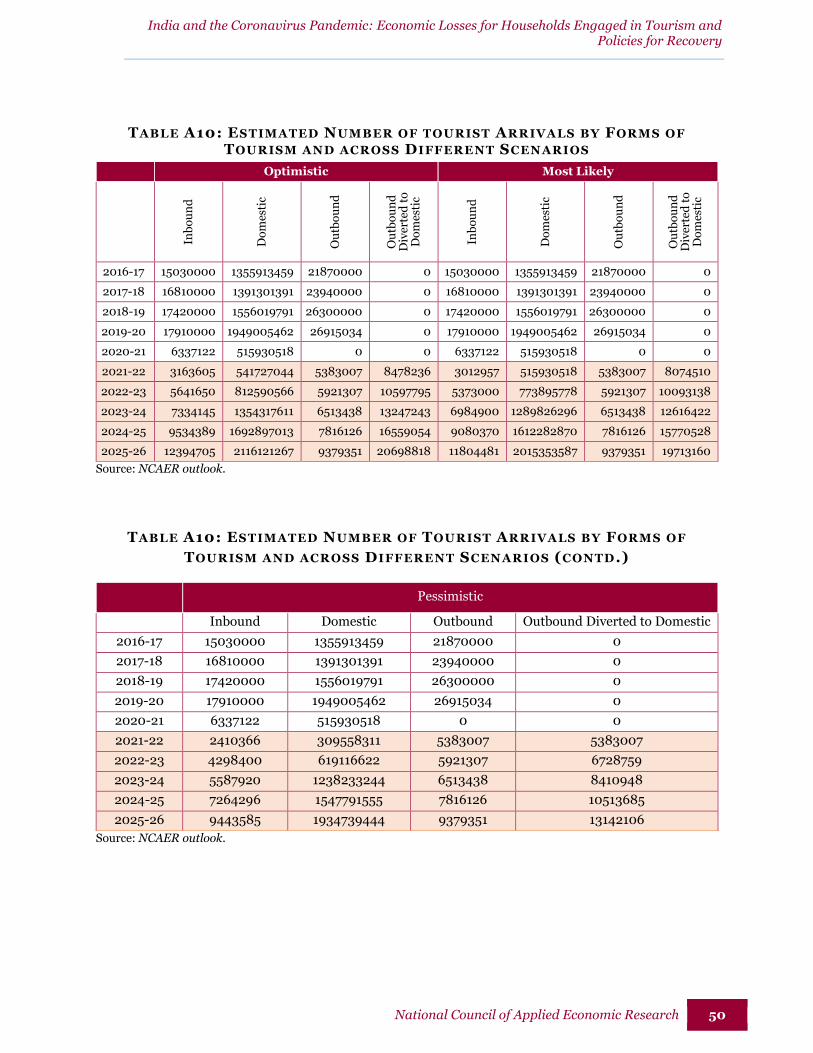
India and the Coronavirus Pandemic: Economic Losses for Households Engaged in Tourism and Policies for Recovery
National Council of Applied Economic Research 50
TABLE A10: ESTIMATED NUMBER OF TOURIST ARRIVALS BY FORMS OF
TOURISM AND ACROSS DIFFERENT SCENARIOS Optimistic Most Likely
Inb
ou
nd
Do
mes
tic
Ou
tbo
un
d
Ou
tbo
un
d
Div
erte
d t
o
Do
mes
tic
Inb
ou
nd
Do
mes
tic
Ou
tbo
un
d
Ou
tbo
un
d
Div
erte
d t
o
Do
mes
tic
2016-17 15030000 1355913459 21870000 0 15030000 1355913459 21870000 0
2017-18 16810000 1391301391 23940000 0 16810000 1391301391 23940000 0
2018-19 17420000 1556019791 26300000 0 17420000 1556019791 26300000 0
2019-20 17910000 1949005462 26915034 0 17910000 1949005462 26915034 0
2020-21 6337122 515930518 0 0 6337122 515930518 0 0
2021-22 3163605 541727044 5383007 8478236 3012957 515930518 5383007 8074510
2022-23 5641650 812590566 5921307 10597795 5373000 773895778 5921307 10093138
2023-24 7334145 1354317611 6513438 13247243 6984900 1289826296 6513438 12616422
2024-25 9534389 1692897013 7816126 16559054 9080370 1612282870 7816126 15770528
2025-26 12394705 2116121267 9379351 20698818 11804481 2015353587 9379351 19713160
Source: NCAER outlook.
TABLE A10: ESTIMATED NUMBER OF TOURIST ARRIVALS BY FORMS OF
TOURISM AND ACROSS DIFFERENT SCENARIOS (CONTD .)
Pessimistic
Inbound Domestic Outbound Outbound Diverted to Domestic
2016-17 15030000 1355913459 21870000 0
2017-18 16810000 1391301391 23940000 0
2018-19 17420000 1556019791 26300000 0
2019-20 17910000 1949005462 26915034 0
2020-21 6337122 515930518 0 0
2021-22 2410366 309558311 5383007 5383007
2022-23 4298400 619116622 5921307 6728759
2023-24 5587920 1238233244 6513438 8410948
2024-25 7264296 1547791555 7816126 10513685
2025-26 9443585 1934739444 9379351 13142106
Source: NCAER outlook.

India and the Coronavirus Pandemic: Economic Losses for Households Engaged in Tourism and Policies for Recovery
National Council of Applied Economic Research 51
Appendix II
Estimation of Number of Tourist Arrivals on a Quarterly Basis
The annual estimates (January-December, 2020) of DTVs were obtained from the MoT, according to which
there were a total of 556.07 million DTVs during 2020. These estimates excluded the DTVs undertaken in
the states of Maharashtra, Delhi, and Jharkhand. The values for these three States were imputed using their
shares in the previous year’s values of DTV. Hence the number of DTVs obtained was estimated at 614.66
million.
The DTV was further converted into Domestic Tourist Arrivals (DTAs) so that the per-tourist domestic
expenditure may be applied on them, to derive the total domestic tourism expenditure. The estimated DTA
works out to be 515.9 million for 2020.
In order to disaggregate the annual DTA into quarterly estimates, we have made certain assumptions. Table
A12 presents the estimated DTA and assumptions used to derive these estimates.
TABLE A12: QUARTERLY ESTIMATED DOMESTIC TOURIST ARRIVALS
DTA (million) Assumptions
January – December 2020 515.9 -
Q4 FY 2019-20 120.0 23% of annual*
Q1 FY 2020-21 45.3 -90% (q-o-q)
Q2 FY 2020-21 130.8 -75% (q-o-q)
Q3 FY 2020-21 219.8 -58% (q-o-q)**
Source: RBI, MoT and NCAER computations.
Note: *This is assumed using the proportion of DTAs who travel during the months of January-March, as obtained from the Domestic Tourism Survey, 2014-15. It is assumed that the same proportion of people travelled in the pre-pandemic quarter. **The estimate for Q3 is derived as a residual.
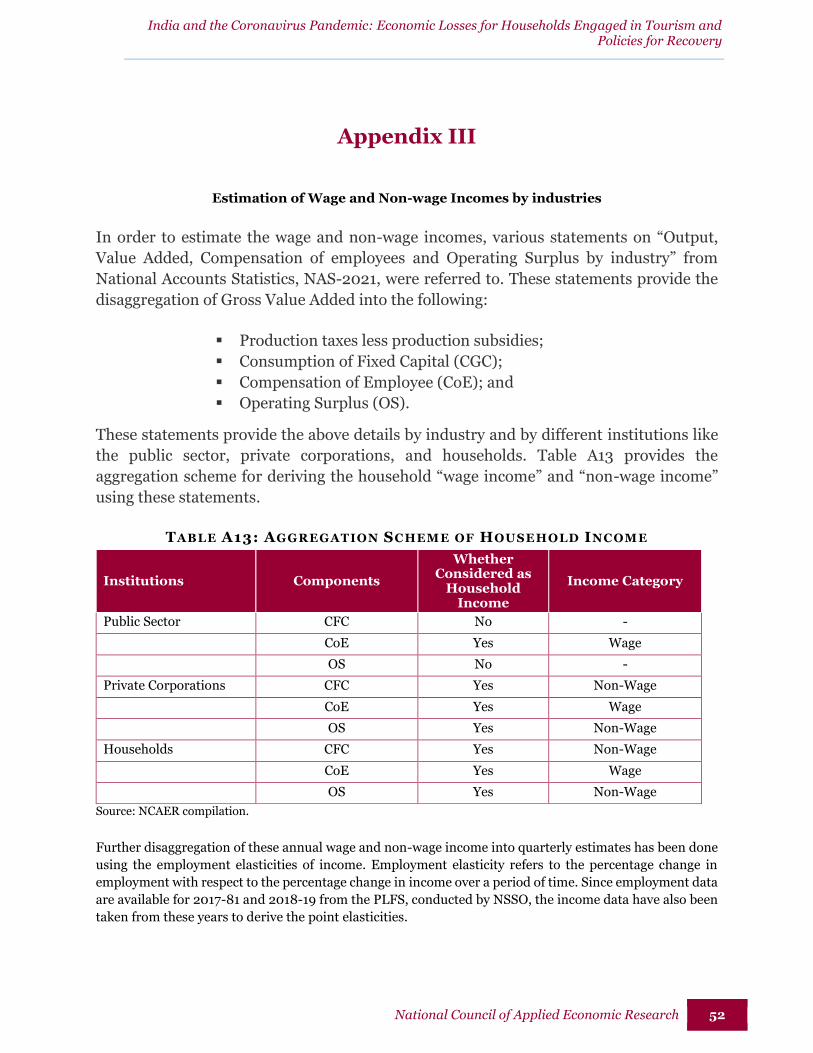
India and the Coronavirus Pandemic: Economic Losses for Households Engaged in Tourism and Policies for Recovery
National Council of Applied Economic Research 52
Appendix III
Estimation of Wage and Non-wage Incomes by industries
In order to estimate the wage and non-wage incomes, various statements on “Output,
Value Added, Compensation of employees and Operating Surplus by industry” from
National Accounts Statistics, NAS-2021, were referred to. These statements provide the
disaggregation of Gross Value Added into the following:
Production taxes less production subsidies;
Consumption of Fixed Capital (CGC);
Compensation of Employee (CoE); and
Operating Surplus (OS).
These statements provide the above details by industry and by different institutions like
the public sector, private corporations, and households. Table A13 provides the
aggregation scheme for deriving the household “wage income” and “non-wage income”
using these statements.
TABLE A13: AGGREGATION SCHEME OF HOUSEHOLD INCOME
Institutions Components
Whether Considered as
Household Income
Income Category
Public Sector CFC No -
CoE Yes Wage
OS No -
Private Corporations CFC Yes Non-Wage
CoE Yes Wage
OS Yes Non-Wage
Households CFC Yes Non-Wage
CoE Yes Wage
OS Yes Non-Wage
Source: NCAER compilation.
Further disaggregation of these annual wage and non-wage income into quarterly estimates has been done
using the employment elasticities of income. Employment elasticity refers to the percentage change in
employment with respect to the percentage change in income over a period of time. Since employment data
are available for 2017-81 and 2018-19 from the PLFS, conducted by NSSO, the income data have also been
taken from these years to derive the point elasticities.

India and the Coronavirus Pandemic: Economic Losses for Households Engaged in Tourism and Policies for Recovery
National Council of Applied Economic Research 53
With the estimation of employment, by status of work (that is, employees and self-employed) and by
quarters of 2019 and 2020, the elasticities have been used to derive the percentage change in income at the
quarterly level, which in turn, are used to derive the quarterly estimates. The elasticities are computed
separately for wage and non-wage incomes and for each tourism characteristic industry.
𝐸𝑚𝑝𝑙𝑜𝑦𝑚𝑒𝑛𝑡 𝑒𝑙𝑎𝑠𝑡𝑖𝑐𝑖𝑡𝑦 𝑓𝑜𝑟 𝐸𝑚𝑝𝑙𝑜𝑦𝑒𝑒𝑠 =𝑃𝑒𝑟𝑐𝑒𝑛𝑡 𝑐ℎ𝑎𝑛𝑔𝑒 𝑖𝑛 𝑛𝑢𝑚𝑏𝑒𝑟 𝑜𝑓 𝑒𝑚𝑝𝑙𝑜𝑦𝑒𝑒𝑠
𝑃𝑒𝑟𝑐𝑒𝑛𝑡 𝑐ℎ𝑎𝑛𝑔𝑒 𝑖𝑛 𝑤𝑎𝑔𝑒 𝑖𝑛𝑐𝑜𝑚𝑒
𝐸𝑚𝑝𝑙𝑜𝑦𝑚𝑒𝑛𝑡 𝑒𝑙𝑎𝑠𝑡𝑖𝑐𝑖𝑡𝑦 𝑓𝑜𝑟 𝑆𝑒𝑙𝑓𝑒𝑚𝑝𝑙𝑜𝑦𝑒𝑑 =𝑃𝑒𝑟𝑐𝑒𝑛𝑡 𝑐ℎ𝑎𝑛𝑔𝑒 𝑖𝑛 𝑛𝑢𝑚𝑏𝑒𝑟 𝑜𝑓 𝑠𝑒𝑙𝑓𝑒𝑚𝑝𝑙𝑜𝑦𝑒𝑑
𝑃𝑒𝑟𝑐𝑒𝑛𝑡 𝑐ℎ𝑎𝑛𝑔𝑒 𝑖𝑛 𝑛𝑜𝑛 − 𝑤𝑎𝑔𝑒 𝑖𝑛𝑐𝑜𝑚𝑒
Hence the derived estimates of wage and non-wage incomes at the quarterly level are presented in Table
A9, Appendix I.

India and the Coronavirus Pandemic: Economic Losses for Households Engaged in Tourism and Policies for Recovery
National Council of Applied Economic Research 54
Appendix IV
Description of Social Accounting Matrix
The Social Accounting Matrix (SAM) presents the economic transactions among the following
institutional accounts:
Production Account: Its rows depict the use of production sectors as inputs in
other production sectors. The columns depict the cost of production of each
production sector. The production account comprises the following 25 sectors,
including the “Tourism” sector, which has been created as a separate sector using
the Tourism Product Ratios and Tourism Industry Ratios, obtained in the Third
TSA:
Agriculture and allied
Mining, other manufacturing, construction, electricity
Trade
Transport freight services
All non-tourism specific services
Accommodation services/Hotels
Food and beverage serving services/Restaurants
Railway passenger transport services
Road passenger transport services
Water passenger transport services
Air passenger transport services
Transport equipment rental services
Travel agencies and other reservation services
Cultural and religious services
Sports and other recreational services
Health and medical related services
Readymade garments
Processed food
Alcohol and tobacco products
Travel related consumer goods
Footwear
Soaps, cosmetics and glycerine
Gems and jewellery
Books, journals, magazines, stationery, etc.
Tourism
India and the Coronavirus Pandemic: Economic Losses for Households Engaged in Tourism and Policies for Recovery
National Council of Applied Economic Research 55
Factors of production: This comprises the following two categories:
Labour (Wage), and
Capital (Non-wage).
The rows depict the wage and non-wage incomes drawn from each production
sector. The columns depict the flow of wage and non-wage incomes into
different categories of the household account.
Households: The rows of this account depict the income earned by the
households and the columns depict the private household consumption
expenditure incurred by households on the purchase of goods and services
produced by the production sectors.
Net Indirect Taxes: This account includes:
Net taxes (taxes less subsidies) paid by the production sectors on
the production, and
Net taxes (taxes less subsidies) paid on the products.
The rows depict the taxes paid by the production sectors whereas the columns
present the flow of these taxes to the government account.
Government Account: The row of this account presents the income earned by
the government from the production account in the form of indirect taxes; the
income earned by the government from the household account in the form of direct
taxes; and the income earned by the government on the export of goods and
services.
Capital Account: This account presents the savings in the row vector, which
include household savings, and savings by public non-financial and public-
financial corporations. In the column vector, this presents the use of production
sectors as Gross Capital Formation or to meet the investment demand.
Rest of the World: This account presents the imports in the row vector and
exports in the column vector.
The schematic structure of the SAM featuring these accounts is presented in Table A14.
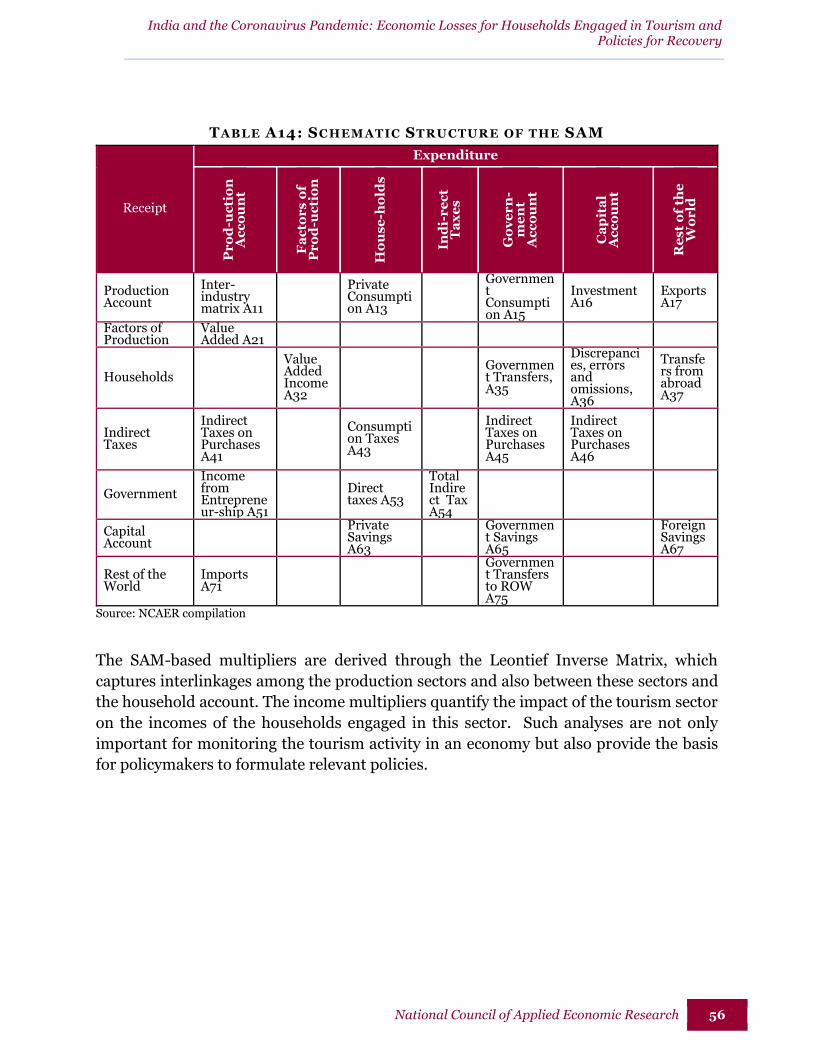
India and the Coronavirus Pandemic: Economic Losses for Households Engaged in Tourism and Policies for Recovery
National Council of Applied Economic Research 56
TABLE A14: SCHEMATIC STRUCTURE OF THE SAM
Receipt
Expenditure
Pr
od
-uc
tio
n
Ac
co
un
t
Fa
cto
rs
of
Pr
od
-uc
tio
n
Ho
us
e-h
old
s
Ind
i-r
ec
t T
ax
es
Go
ve
rn
-m
en
t A
cc
ou
nt
Ca
pit
al
Ac
co
un
t
Re
st
of
the
W
or
ld
Production Account
Inter-industry matrix A11
Private Consumption A13
Government Consumption A15
Investment A16
Exports A17
Factors of Production
Value Added A21
Households
Value Added Income A32
Government Transfers, A35
Discrepancies, errors and omissions, A36
Transfers from abroad A37
Indirect Taxes
Indirect Taxes on Purchases A41
Consumption Taxes A43
Indirect Taxes on Purchases A45
Indirect Taxes on Purchases A46
Government
Income from Entrepreneur-ship A51
Direct taxes A53
Total Indirect Tax A54
Capital Account
Private Savings A63
Government Savings A65
Foreign Savings A67
Rest of the World
Imports A71
Government Transfers to ROW A75
Source: NCAER compilation
The SAM-based multipliers are derived through the Leontief Inverse Matrix, which
captures interlinkages among the production sectors and also between these sectors and
the household account. The income multipliers quantify the impact of the tourism sector
on the incomes of the households engaged in this sector. Such analyses are not only
important for monitoring the tourism activity in an economy but also provide the basis
for policymakers to formulate relevant policies.

