india analysis report - fairdip2016. the gdp value of india represents 3.65 percent of the world...
TRANSCRIPT


India Analysis Report
Framework:• Introduction• Economic View• Growth & Consumer Credit Reports• Opportunities• Conclusion
Introduction
Before the advent of British rule, India had an independent economy. It was largely primary sector economy and the major occupations were agriculture, handicrafts, and many other primary sector works. During the British rule, India’s economy be-came a net raw material supplier and a net importer of fi nished products.
The economy of Indian subcontinent was as low as the other developing countries and it has come up slowly and steadily as time went by. Being a huge expanse, the Indian population has got varied resources and type of people. The Indian Economy has grown since the time of the Indus valley civilization. The days during the rule of the East India Company had been a serious downturn as the villages grew dependent on the East Indian merchants and had stopped normal farming activities. The raw materials were bought at much cheaper rates than from any other countries and the fi nished goods were forced down to the people of this continent at an exorbitant rate.
The acceleration of structural reforms is bringing a new growth impetus. The New Economic Policy (NEP) was introduced in 1991 which accelerated the structural re-forms in bringing a new growth impetus. Beginning with mid-1991, the government had made some radical changes in its policies bearing on trade, foreign investment exchange rate, industry, fi scal discipline etc. the various elements, when put togeth-er, constitute an economic policy which marks a big departure from what has gone before. The thrust of the NEP has been towards creating a more competitive environ-ment in the economy as a means to improving the productivity and effi ciency if the systems. This was to be achieved by removing the barriers to entry and the restric-tions on the growth of fi rms.
The Goods and Services Tax (GST), implemented from July 2017, should help make India more of a single market and thus spur productivity, investment, competitive-ness, job creation and incomes. The abolition of the Foreign Investment Promotion Board, which reviewed foreign investment programs, should promote FDI inflows. The central government’s initiative to rank individual states on the ease of doing business

is opening a new era of structural reforms. Many states have already modernized regulations and administrative procedures and some are experimenting with reforms of land acquisition and labor regulations.
There is little room for further cuts in interest rates. Consumer price inflation hovered below 4% at the end of 2016 and in early 2017, reflecting partly demonetization, but also the success of the flexible inflation targeting framework. Ongoing structural re-forms, including efforts to reduce the fragmentation of agricultural markets and land plots, and to develop the irrigation network, should help avoid inflation spikes in the future. In the short term, however, keeping inflation around 4% – the mid-point offi -cial inflation target – will be challenging given the roll-out of the GST and the upward adjustment in house rent allowance and in wages for state government employees.
The combined defi cit and debt of the central government and states are relative-ly high. The central government has committed to reduce its defi cit further in FY 2017/18 by better targeting fertiliser, petroleum and food subsidies. At the state level, current spending has tended to rise while investment targets have not always been met. The recent write-off of bank loans to farmers in the largest state will push up public debt, especially if other states follow suit. It could also undermine credit disci-pline and exacerbate income inequality since it will not benefi t the poorest farmers, who rely predominantly on informal money lenders rather than banks.
Making growth more inclusive would require raising more revenue from property and personal income taxes to fi nance better social and physical infrastructure. Re-cent initiatives to benchmark states’ social policies and outcomes, including health, sanitation and education, will strengthen incentives to improve the quality of public services. However, providing quality services to all would require rising public spend-ing. Doubling public spending on health to 2.5% of GDP by 2025, as envisaged in the latest National Health Policy, and developing affordable housing for the poor would be welcome. It could be fi nanced by removing the tax expenditures that benefi t the rich most, freezing the personal income thresholds from which rates apply, reducing tax evasion and implementing fairer property taxation.
Economic ViewGDP Annual Growth:
Gross domestic product (GDP) is the monetary value of all the fi nished goods and services produced within a country’s borders in a specifi c time period. GDP includes all private and public consumption, government outlays, investments, private inven-tories, paid-in construction costs and the foreign balance of trade (exports are added, imports are subtracted).
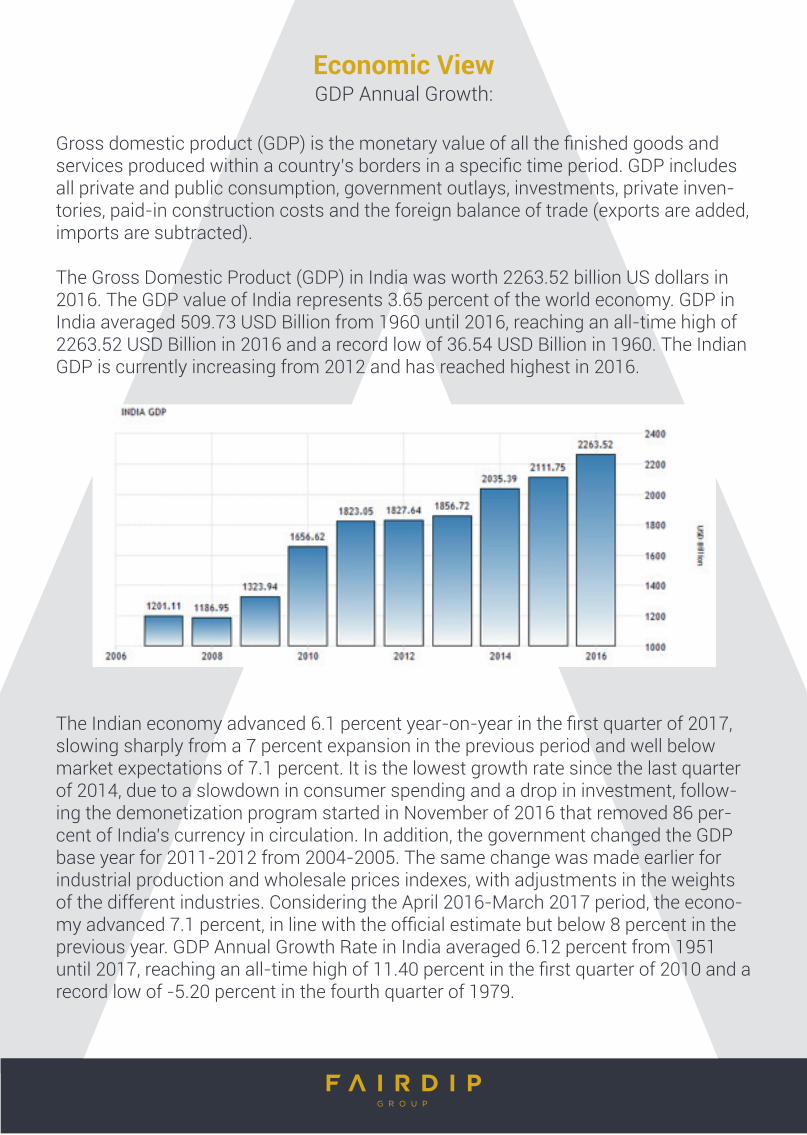
The Gross Domestic Product (GDP) in India was worth 2263.52 billion US dollars in 2016. The GDP value of India represents 3.65 percent of the world economy. GDP in India averaged 509.73 USD Billion from 1960 until 2016, reaching an all-time high of 2263.52 USD Billion in 2016 and a record low of 36.54 USD Billion in 1960. The Indian GDP is currently increasing from 2012 and has reached highest in 2016.
The Indian economy advanced 6.1 percent year-on-year in the fi rst quarter of 2017, slowing sharply from a 7 percent expansion in the previous period and well below market expectations of 7.1 percent. It is the lowest growth rate since the last quarter of 2014, due to a slowdown in consumer spending and a drop in investment, follow-ing the demonetization program started in November of 2016 that removed 86 per-cent of India’s currency in circulation. In addition, the government changed the GDP base year for 2011-2012 from 2004-2005. The same change was made earlier for industrial production and wholesale prices indexes, with adjustments in the weights of the different industries. Considering the April 2016-March 2017 period, the econo-my advanced 7.1 percent, in line with the offi cial estimate but below 8 percent in the previous year. GDP Annual Growth Rate in India averaged 6.12 percent from 1951 until 2017, reaching an all-time high of 11.40 percent in the fi rst quarter of 2010 and a record low of -5.20 percent in the fourth quarter of 1979.

As per the data, the per capita net national income (current prices) during 2016-17 is estimated to be Rs 1,03,007 showing a rise of 10.4 per cent as compared to Rs 93,293 during 2015-16 with the growth rate of 7.4 percent.
The data of last 5 year on the basis of GDP growth rate, annual growth rate, constant price, fi xed capital formation, national product, per capita income, agriculture is fol-lowing:

Growth & Consumer Credit Reports
To compare the growth & to understand the economic situation of India in a better way we can take a view of comparison of Russia with the strongest economies of the world. Let`s go through the comparison summary.
India vs. United States
GDP Growth Rate in the United States went down to 0.70 percent in Q1 2017 from 2.10 percent in Q4 2016, but, it is increasing for the next quarters. The Indian econ-omy advanced 6.1 percent year-on-year in the fi rst quarter of 2017, slowing sharply from a 7 percent expansion in the previous period.
India vs. Euro Area
GDP Growth Rate in the Euro Area was last registered at 0.50 percent in Q1 2017. The Indian GDP advanced 6.1 percent year-on-year in the fi rst quarter of 2017, slowing sharply from a 7 percent expansion in the previous period.

GDP Growth Rate in Philippines went down to 1.10 percent in Q1 2017 from 1.80 percent in Q4 2016. United Kingdom GDP Growth Rate declined to 0.20 percent in Q1 2017 from 0.70 percent in Q4 2016.
India vs. United Kingdom
United Kingdom GDP Growth Rate increased to 2 percent in 2017 from 1.8 percent in 2016. The Indian GDP advanced 6.1 percent year-on-year in the fi rst quarter of 2017, slowing sharply from a 7 percent expansion in the previous period.
The comparison of India with the major economies show that the GDP annual growth rate of US, UK & Euro Area is expected to rise in the coming years but GDP annual growth rate of India is anticipated to be falling.
Consumer Credit:
The term consumer credit refers to all kinds of credit employed by individuals that are not collateralized by real estate or fi nancial assets such as stocks and bonds and not used for business purposes. It includes instalment credit for automobiles, home repair and modernization, appliances, education, large recreational items, and re-volving credit on credit cards. There are many ways to classify consumer credit into categories, including use, method of generation (direct and indirect closed-end credit, non-instalments credit, and open-end credit), and kind of fi nancial institution gener-ating the loan (depository institutions, fi nance companies, credit unions, others).
Consumer credit is considered a good indicator of the potential future spending levels seen in the Personal Consumption and Retail Sales reports, and shows the extent to which benchmark interest rates such as the fed funds rate and prime rate have man-

ifested themselves at the consumer level (it can take six months to a year for macro interest rates to work their way down to consumers).
These factors are important when investors consider that consumers make up more than two-thirds of total GDP consumption. If consumers stop spending or face a credit crunch, GDP will not be able to grow much. Investors in consumer cyclical stocks should be keenly interested in consumers’ ability to spend more in the future.Consumer credit fi gures have a lot of seasonal and inherent volatility, so investors should always review the current report for adjustments to prior periods, paying par-ticular attention to revisions to year-over-year growth. Long-term trends are the most studied portion of the report, both in the total outstanding balances as well as the change in overall interest rates being charged.
The Conference Board has tapped consumer credit as a lagging indicator, and uses a ratio of consumer credit to personal income as a component of its Index of Lagging Indicators. The Fed operates on the theory that consumers will not signifi cantly in-crease their borrowing levels until their personal incomes increases enough to justify the higher debt load. As such, borrowing may show the largest increases when the economy is already coming out of a recession, rather than during the worst of it.
How helpful consumer credit reports are for investors can be listed out in points as follows:
Strengths: • Contains detailed breakdown of loan fi gures, such as average maturity and pre vailing interest rates.• Data is provided with and without seasonal adjustments. • Release shows comparisons against previous month, previous year, and also against results from the last fi ve years.
Weaknesses:• Only total growth in outstanding loans is shown; there is no way of knowing if consumer payments have fallen off or if new loan growth has slowed based on a falling consumer credit number (and vice versa). • Absence of home-equity debt provides for an incomplete picture. • Because it comes out after the consumer confi dence report and retail sales reports for the month, some analysts will not look as intently at the consumer credit fi gures month to month, instead reviewing multi-period trends once or twice a year. Consumer Spending in India increased to 18483 INR Billion in the fi rst quarter of 2017 from 17809.14 INR Billion in the fourth quarter of 2016. Consumer Spending in India averaged 9987.55 INR Billion from 2004 until 2017, reaching an all-time high of 18483 INR Billion in the fi rst quarter of 2017 and a record low of 4469.88 INR Billion in the third quarter of 2004.:

Consumer Credit refers to credit granted to an individual especially to fi nance the pur-chase of consumer goods or to defray personal expenses. Consumer Credit for India is Baa3 (positive) which is stable. This implies that the investors fi nd Indian market safe to invest.
Consumer confi dence is an economic indicator that measures the degree of opti-mism that consumers feel about the overall state of the economy and their person-al fi nancial situation. Consumer Confi dence in India increased to 136 in the fourth quarter of 2016 from 133 in the third quarter of 2016. Consumer Confi dence in India averaged 122.90 from 2009 until 2016, reaching an all-time high of 136 in the fourth quarter of 2016 and a record low of 92 in the fi rst quarter of 2010.

Opportunities
In the world of today, India has re-emerged as an economic powerhouse and this re-emergence of India can easily be the most sensational success story of our times. Indian economy started to gain some real momentum a few years ago when the top international companies started to move their manufacturing facilities to India and not just that, they also started to outsource all sorts of jobs to India whether they were related to marketing, management or customer service. The most lucrative part of this international co-operation was that these global companies also got a chance to sell their products within India as the rise of the Indian consumer market was mas-sive. This trend has continued for several years now and hence the overall economic growth is clearly visible. India is a land which is full of diversity and its vibrant democ-racy has encouraged its people to involve and participate in this growth.
It is important to know that since 2011, over 65% of Indian GDP has come from the domestic consumption, unlike China where domestic consumption averaged around 40% of its GDP. Today, at a massive 9 trillion USD, India is the third largest econo-my of the world in purchasing power parity terms and only China and the USA are ahead of India. It is widely believed by the economists that Purchasing power parity is a more accurate and realistic way to understand the real economic condition of a country as it takes the costs of living into account. India is the third largest economy of the world in PPP terms.

The economic power is going back to the east and that is why many international fi nancial institutions are starting to take interest in India’s growth even though the mainstream international media still does not give enough coverage to the develop-ment stories of India.
In PPP terms, India’s GDP should easily overtake the GDP of USA before 2030. A successful implementation of GST (Goods and service tax) is going to give the GDP a good boost. It has to be noted that the recent demonetization did not bring the GDP down as predicted by many experts and it has actually encouraged people to do more cashless transactions and in the long run, it should be positively affecting the GDP of India as well. India is going to have a young population for years to come in. Being a democracy, India does slow down a bit in decision making, but in the long run, this is India’s real strength. It is because of its democracy that India is powered by 1.3 bil-lion brains. Another massive advantage that India has is that it is developing in times when the technology is digital. In the tiniest of Indian villages, thousands of new in-novations and experiments are taking place every day as the information which used to be available in the libraries or universities is now available in a smartphone. It also has to be noted that India has to import crude oil to meet its energy needs and the fall in Global crude oil prices are in India’s favour as well.
Consumer prices in India increased 2.18 percent year-on-year in May of 2017, slow-ing from a 2.99 percent rise in April and well below market expectations of 2.6 per-cent. The inflation hit a new record low for the second month as food prices fell for the fi rst time ever led by pulses and vegetables. Inflation Rate in India averaged 7.06 percent from 2012 until 2017, reaching an all-time high of 12.17 percent in November of 2013 and a record low of 2.18 percent in May of 2017.
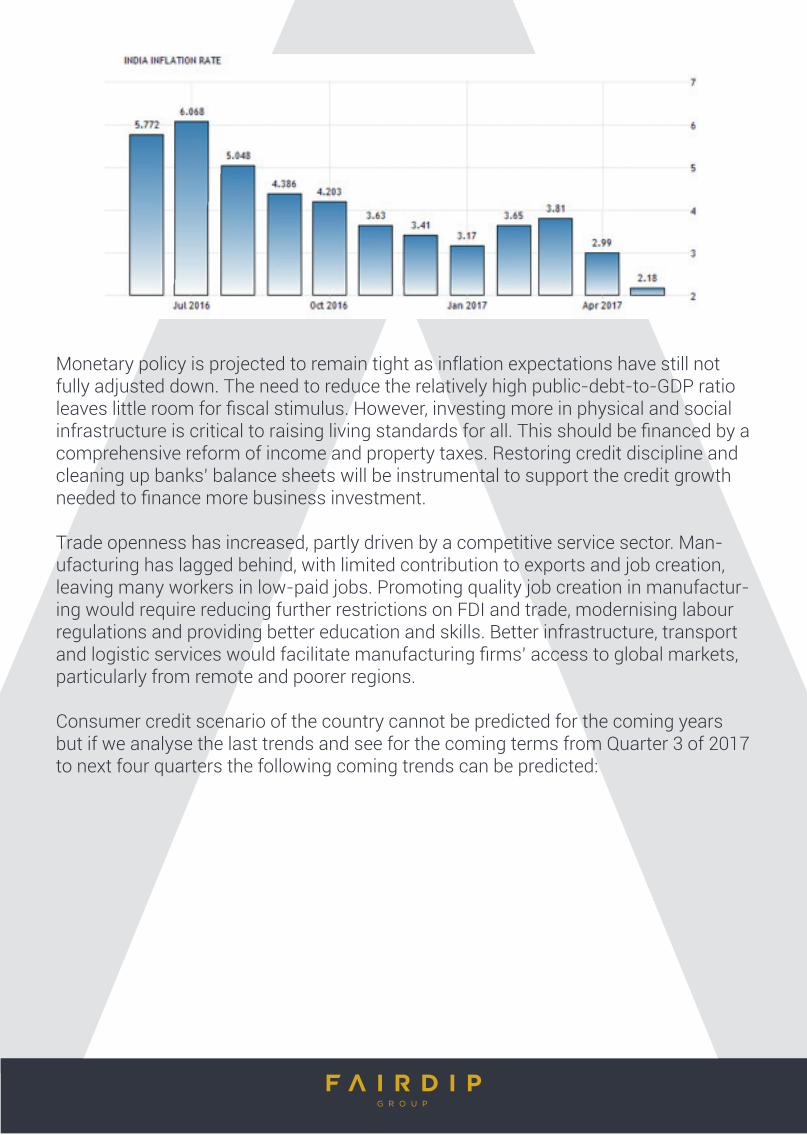
Monetary policy is projected to remain tight as inflation expectations have still not fully adjusted down. The need to reduce the relatively high public-debt-to-GDP ratio leaves little room for fi scal stimulus. However, investing more in physical and social infrastructure is critical to raising living standards for all. This should be fi nanced by a comprehensive reform of income and property taxes. Restoring credit discipline and cleaning up banks’ balance sheets will be instrumental to support the credit growth needed to fi nance more business investment.
Trade openness has increased, partly driven by a competitive service sector. Man-ufacturing has lagged behind, with limited contribution to exports and job creation, leaving many workers in low-paid jobs. Promoting quality job creation in manufactur-ing would require reducing further restrictions on FDI and trade, modernising labour regulations and providing better education and skills. Better infrastructure, transport and logistic services would facilitate manufacturing fi rms’ access to global markets, particularly from remote and poorer regions.
Consumer credit scenario of the country cannot be predicted for the coming years but if we analyse the last trends and see for the coming terms from Quarter 3 of 2017 to next four quarters the following coming trends can be predicted:

Conclusion
The credit scores provide signals and information to investors and servicing agents in a fashion to default potential. Over the forecast period, the consumer spending is ex-pected to increase in the coming years which imply that there would be GDP growth. Also, the consumer credit is expected to be stable which means consumers can eas-ily borrow money and repay those debts on time, and then the economy is stimulated resulting in economic growth.
Growth is projected to increase further. The recent increase in capacity utilisation, coupled with the rebound in industrial production for capital goods and manufactur-ing indices, bodes well for a gradual revival of private investment. The implementation of the GST, by lowering the price of capital goods, and the cut in the corporate income tax rate should also support investment. Inflation will likely increase from the low levels in early 2017, but will remain within the authorities’ target band. The revival of (import-intensive) corporate investment, higher oil prices and lower remittance flows will be reflected in a larger current account defi cit. The prospect of further structur-al reform is a clear positive risk for growth. The deterioration in the quality of banks’ portfolios, as shown by the increase in nonperforming loans and stressed assets, risks damping investment and growth. India, as a net commodity importer, would suffer from higher commodity prices. Protectionist measures could restrict exports of goods and services and thus harm the economy’s potential to create quality jobs.