index of national fundraising performance
TRANSCRIPT

8/14/2019 Index of National Fundraising Performance
http://slidepdf.com/reader/full/index-of-national-fundraising-performance 1/22
Index of NationalFundraising Performance2009 Second Calendar Quarter Results
Prepared byHelen Flannery, Rob Harris, and Carol RhineSeptember 2009

8/14/2019 Index of National Fundraising Performance
http://slidepdf.com/reader/full/index-of-national-fundraising-performance 2/22
Q2 2009 Index of National Fundraising Performance
Copyright 2009 Target Analytics | www.blackbaud.com/targetanalytics 1
Target Analytics Index of
National Fundraising Performance2009 Second Calendar Quarter Results
About the Index of National Fundraising Performance..............................................2 Q2 2009 Index Participants.......................................................................................3 Q2 2009 Summary ....................................................................................................4 Overall Index Performance .......................................................................................5 Industry Sector Performance ....................................................................................9
Societal Benefit ............................................................................................................................................ 11 Religion ........................................................................................................................................................ 12 International Relief........................................................................................................................................ 13 Human Services ........................................................................................................................................... 14 Health........................................................................................................................................................... 15 Environment ................................................................................................................................................. 16 Arts & Culture ............................................................................................................................................... 17 Animal Welfare ............................................................................................................................................. 18
References..............................................................................................................19 Industry Sectors Used in the Index .........................................................................20 Looking Ahead ........................................................................................................21 Index Methodology..................................................................................................21 About Medians ........................................................................................................21 Participation ............................................................................................................21 Online Resources ...................................................................................................21 About Target Analytics............................................................................................21

8/14/2019 Index of National Fundraising Performance
http://slidepdf.com/reader/full/index-of-national-fundraising-performance 3/22
Q2 2009 Index of National Fundraising Performance
Copyright 2009 Target Analytics | www.blackbaud.com/targetanalytics 2
About the Index of National FundraisingPerformanceThe Target Analytics Index of National Fundraising Performance analyzes direct marketing giving for many of
the largest non-profit organizations in the country. For the twelve months ending Q2 2009, Target Analyticsevaluated transactions from 77 organizations, including over 36 million donors and more than 68 million giftstotaling almost $2 billion in revenue.
The Target Index reports on direct marketing giving only; direct mail is the dominant revenue source for mostorganizations but web, telemarketing, canvassing, and other gifts considered to be direct marketing are alsoincluded. Individual payments greater than $5,000, soft credits, and matching gift payments are excluded.
Quarterly results are reported on a calendar year basis. This report includes results through June 2009. Indexfindings are based on analysis of actual donor transactions, not survey responses from fundraisers. Allcalculated measures have been reviewed by participants for accuracy.

8/14/2019 Index of National Fundraising Performance
http://slidepdf.com/reader/full/index-of-national-fundraising-performance 4/22
Q2 2009 Index of National Fundraising Performance
Copyright 2009 Target Analytics | www.blackbaud.com/targetanalytics 3
Q2 2009 Index Participants
Animal WelfareASPCA
Humane Society of the United StatesInternational Fund for Animal WelfarePeople for the Ethical Treatment of Animals
Arts & CultureColonial Williamsburg FoundationNational Law Enforcement Officers Memorial FundNational Trust for Historic PreservationNational World War II MuseumThe Smithsonian InstitutionUnited States Holocaust Memorial Museum
EnvironmentDefenders of WildlifeEarthjustice
Environmental DefenseGreenpeace U.S.A.National Parks Conservation AssociationNational Wildlife FederationNatural Resources Defense CouncilThe Nature ConservancyThe Ocean ConservancySierra ClubTrout UnlimitedThe Wilderness SocietyWorld Wildlife Fund
HealthALSAC / St. Jude Children’s Research HospitalAlzheimer’s Association
American Cancer SocietyAmerican Diabetes AssociationAmerican Health Assistance FoundationAmerican Heart AssociationAmerican Lung AssociationArthritis FoundationChildren's Cancer Research FundCystic Fibrosis FoundationEaster SealsThe Foundation for AIDS ResearchJuvenile Diabetes Research FoundationMarch of DimesMayo ClinicMultiple Sclerosis Association of AmericaNational Multiple Sclerosis SocietySpecial Olympics
Human ServicesAmerican Indian Relief Council
Cal Farley’s Boys RanchCovenant HouseFeeding AmericaParalyzed Veterans of AmericaSt. Labre Indian SchoolUnited States Olympic Committee
International ReliefAmeriCaresCARECatholic Relief ServicesDoctors Without BordersHabitat for Humanity InternationalHeifer Project InternationalInternational Rescue Committee
Mercy CorpsOperation SmileOxfam AmericaProject HOPESave the ChildrenU.S. Fund for UNICEF
ReligionNational Shrine of St. JudeSisters of St. Francis of AssisiSisters of St. Francis - PETSociety of the Divine SaviorMissionary Association of Mary Immaculate
Societal Benefit
American Association of University WomenAmerican Civil Liberties UnionAmnesty InternationalAnti-Defamation LeagueCenter for Science in the Public InterestHuman Rights CampaignNARALNational Committee to Preserve
Social Security & MedicarePlanned ParenthoodPublic CitizenSouthern Poverty Law Center

8/14/2019 Index of National Fundraising Performance
http://slidepdf.com/reader/full/index-of-national-fundraising-performance 5/22
Q2 2009 Index of National Fundraising Performance
Copyright 2009 Target Analytics | www.blackbaud.com/targetanalytics 4
Non-Profit Direct Marketing Revenue andDonor Declines Continued in Q2 2009as Economy Remained Weak
Q2 2009 Summary
During 2008, most of the organizations in the index had downturns in many key measures of fundraising whichappeared to be caused, or at least exacerbated, by a weak economy. These negative trends have intensified inthe first half of 2009 and were widespread across the index.
All of the key metrics that we analyze in the index declined overall for the first half of 2009 as compared to thefirst half of 2008. All but one of the industry sectors analyzed in the index had revenue declines over this period,and all but one sector had declines in donors. Overall revenue per donor declined in the first half of 2009, as it
did in our Q1 2009 index analysis; revenue per donor declines were experienced by two-thirds of theorganizations in the index.
Index organizations have seen gradual declines in donor numbers for over three years, since the U.S. GulfCoast hurricanes of 2005. These donor declines increased in magnitude in the fourth quarter of 2008 and in thefirst two quarters of 2009, suggesting that the recession is accelerating the rate of file size shrinkage.
Index donor declines are due primarily to declines in new donor acquisition. New donor numbers have fallenfaster than overall donor numbers since 2005, when relief and animal welfare organizations experienced a largeinflux of new donors as a result of U.S. Gulf Coast hurricanes. New donor numbers have fallen three timesfaster since the recession began than they had in either of the previous two years.
International relief and animal welfare organizations have generally had the strongest fundraising performancesin the index in recent years, but even they have begun to see declines in some key measures in 2009. Thehuman services sector, on the other hand, has performed more strongly during the recession than any other
sector. Since human services organizations provide aid to the disadvantaged, this may be where many donorsfeel they should concentrate their giving during these hard economic times.
In evaluating Q2 2009 year-to-date trends, it is important to remember that rates of growth and decline for thefirst half of the year are often greater than eventual year-end results because they are calculated on relativelysmaller numbers of gifts and revenue amounts.

8/14/2019 Index of National Fundraising Performance
http://slidepdf.com/reader/full/index-of-national-fundraising-performance 6/22
Q2 2009 Index of National Fundraising Performance
Copyright 2009 Target Analytics | www.blackbaud.com/targetanalytics 5
Overall Index PerformanceAll index results are medians unless otherwise specified.
Year-to-Year Change
All of the key metrics analyzed in the index were down overall from the first half of 2008 to the first half of 2009(see Fig. 1).
Index revenue declined a median 7.7% from Q2 2008 year-to-date to Q2 2009 year-to-date. This continuesdeclines that we saw at the end of 2008 and in the first quarter of 2009. Revenue declines were widespreadacross the index; only 18% of the organizations in the index had positive revenue growth over the period.
Donor numbers in the index fell a median 3.5% from Q2 2008 YTD to Q2 2009 YTD. Donors have beendeclining consistently for the past three years; the index has not experienced positive year-to-year donor growthsince the 2005 U.S. Gulf Coast hurricanes. 34% of the organizations in the index had positive donor growthfrom Q2 2008 YTD to Q2 2009 YTD.
Donor declines are, again, due primarily to declines in new donor numbers, which fell 7.6% from the first half of2008 to the first half of 2009. Fewer than a third (32%) of the organizations in the index had positive new donor
growth over the period.
Retention rates also fell in the first half of 2009 by a median 1.6% from the same period in the previous year andreactivation rates fell a median 3.0%. We evaluate retention and reactivation rates with caution in the first half ofthe year, however, since last year’s donors have only had six months in which to renew; these trends could shiftif renewals or reactivations accelerate in the second half of the year.
From 2004 to 2008 revenue per donor has grown every quarter, making up for donor declines and allowingoverall revenue to continue to grow. In the first half of 2009, however, revenue per donor declined 2.6% from thefirst half of 2008. Just 35% of the organizations in the index had revenue per donor increases over this period.
Fig. 1: Overall Index Medians
0.2%
-3.1%
-3.2%
3.4%
-2.2%
-5.5%
-1.6%
-7.5%
-7.7%
-3.5%
-7.6%
-2.6%
-1.6%
-3.8%
-2.0%
-3.0%
Revenue
Donors
New Donors
Rev / Donor
Overall Retention
1st-Year Retention
Multi-Year Retention
Reactivation
Q2 2007 YTD to Q2 2008 YTD
Q2 2008 YTD to Q2 2009 YTD
Year-over-Year Change
in Key Measures
% of Organizations with
Positive Change
53%
35%
40%
69%
34%
32%
42%
35%
18%
34%
32%
35%
36%
36%
35%
40%
8/14/2019 Index of National Fundraising Performance
http://slidepdf.com/reader/full/index-of-national-fundraising-performance 7/22
Q2 2009 Index of National Fundraising Performance
Copyright 2009 Target Analytics | www.blackbaud.com/targetanalytics 6
Single Quarter Trends
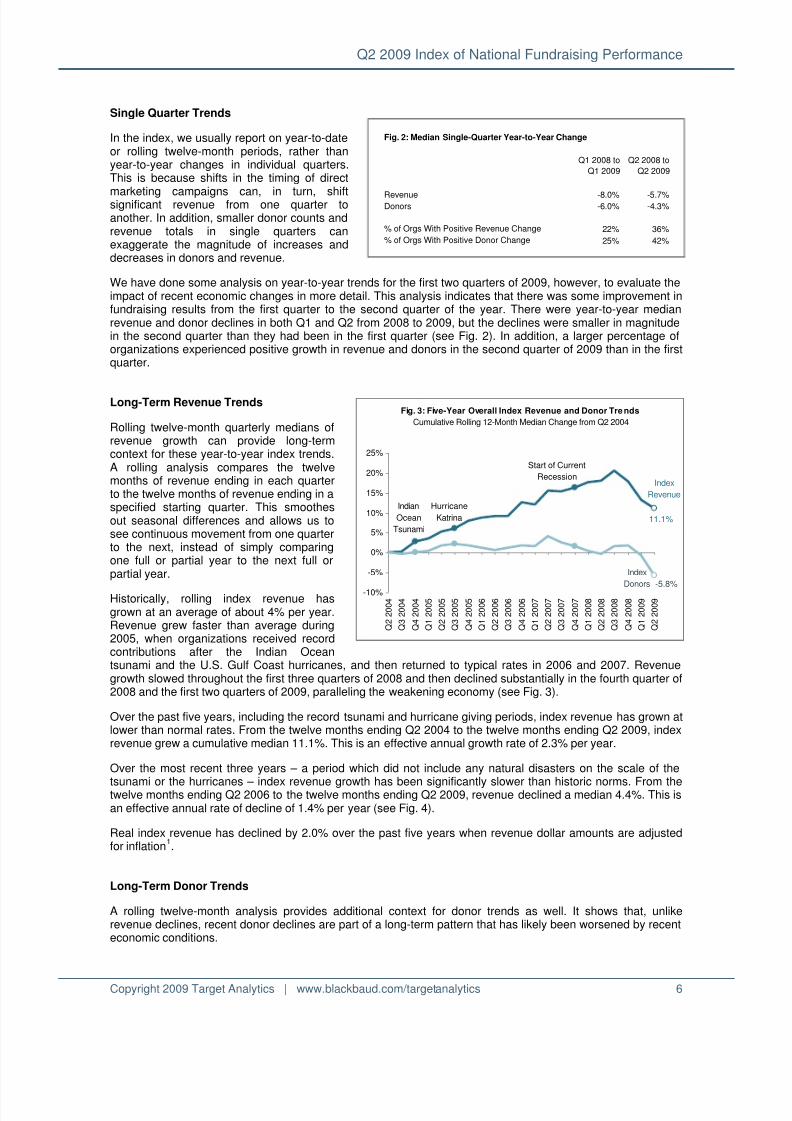
In the index, we usually report on year-to-dateor rolling twelve-month periods, rather thanyear-to-year changes in individual quarters.This is because shifts in the timing of direct
marketing campaigns can, in turn, shiftsignificant revenue from one quarter toanother. In addition, smaller donor counts andrevenue totals in single quarters canexaggerate the magnitude of increases anddecreases in donors and revenue.
We have done some analysis on year-to-year trends for the first two quarters of 2009, however, to evaluate theimpact of recent economic changes in more detail. This analysis indicates that there was some improvement infundraising results from the first quarter to the second quarter of the year. There were year-to-year medianrevenue and donor declines in both Q1 and Q2 from 2008 to 2009, but the declines were smaller in magnitudein the second quarter than they had been in the first quarter (see Fig. 2). In addition, a larger percentage oforganizations experienced positive growth in revenue and donors in the second quarter of 2009 than in the firstquarter.
Long-Term Revenue Trends
Rolling twelve-month quarterly medians ofrevenue growth can provide long-termcontext for these year-to-year index trends.A rolling analysis compares the twelvemonths of revenue ending in each quarterto the twelve months of revenue ending in aspecified starting quarter. This smoothesout seasonal differences and allows us tosee continuous movement from one quarterto the next, instead of simply comparingone full or partial year to the next full orpartial year.
Historically, rolling index revenue hasgrown at an average of about 4% per year.Revenue grew faster than average during2005, when organizations received recordcontributions after the Indian Oceantsunami and the U.S. Gulf Coast hurricanes, and then returned to typical rates in 2006 and 2007. Revenuegrowth slowed throughout the first three quarters of 2008 and then declined substantially in the fourth quarter of2008 and the first two quarters of 2009, paralleling the weakening economy (see Fig. 3).
Over the past five years, including the record tsunami and hurricane giving periods, index revenue has grown atlower than normal rates. From the twelve months ending Q2 2004 to the twelve months ending Q2 2009, indexrevenue grew a cumulative median 11.1%. This is an effective annual growth rate of 2.3% per year.
Over the most recent three years – a period which did not include any natural disasters on the scale of the
tsunami or the hurricanes – index revenue growth has been significantly slower than historic norms. From thetwelve months ending Q2 2006 to the twelve months ending Q2 2009, revenue declined a median 4.4%. This isan effective annual rate of decline of 1.4% per year (see Fig. 4).
Real index revenue has declined by 2.0% over the past five years when revenue dollar amounts are adjustedfor inflation
1.
Long-Term Donor Trends
A rolling twelve-month analysis provides additional context for donor trends as well. It shows that, unlikerevenue declines, recent donor declines are part of a long-term pattern that has likely been worsened by recenteconomic conditions.
Fig. 2: Median Single-Quarter Year-to-Year Change
Q1 2008 to
Q1 2009
Q2 2008 to
Q2 2009
Revenue -8.0% -5.7%Donors -6.0% -4.3%
% of Orgs With Positive Revenue Change 22% 36%
% of Orgs With Positive Donor Change 25% 42%
Fig. 3: Five-Year Overall Index Revenue and Donor Tre nds
Cumulative Rolling 12-Month Median Change from Q2 2004
11.1%
-5.8%-10%
-5%
0%
5%
10%
15%
20%
25%
Q 2 2 0 0 4
Q 3 2 0 0 4
Q 4 2 0 0 4
Q 1 2 0 0 5
Q 2 2 0 0 5
Q 3 2 0 0 5
Q 4 2 0 0 5
Q 1 2 0 0 6
Q 2 2 0 0 6
Q 3 2 0 0 6
Q 4 2 0 0 6
Q 1 2 0 0 7
Q 2 2 0 0 7
Q 3 2 0 0 7
Q 4 2 0 0 7
Q 1 2 0 0 8
Q 2 2 0 0 8
Q 3 2 0 0 8
Q 4 2 0 0 8
Q 1 2 0 0 9
Q 2 2 0 0 9
Indian
Ocean
Tsunami
Hurricane
Katrina
Index
Revenue
Index
Donors
Start of Current
Recession
8/14/2019 Index of National Fundraising Performance
http://slidepdf.com/reader/full/index-of-national-fundraising-performance 8/22
Q2 2009 Index of National Fundraising Performance
Copyright 2009 Target Analytics | www.blackbaud.com/targetanalytics 7
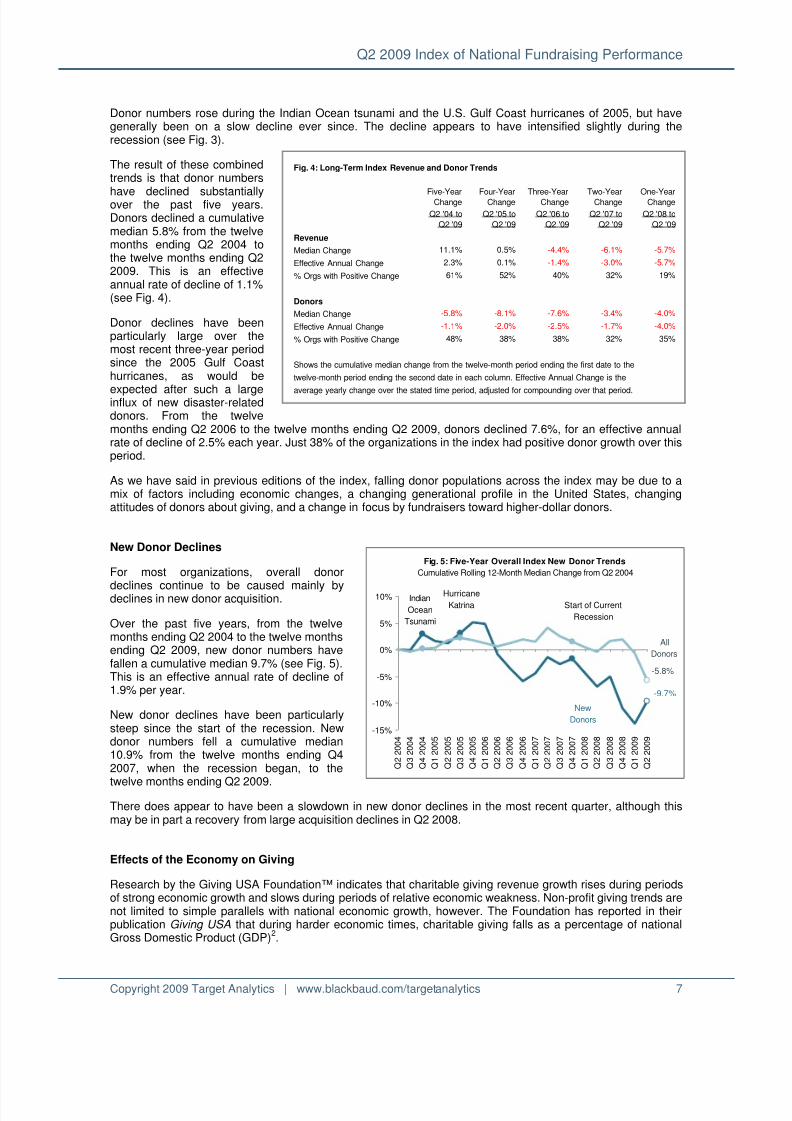
Donor numbers rose during the Indian Ocean tsunami and the U.S. Gulf Coast hurricanes of 2005, but havegenerally been on a slow decline ever since. The decline appears to have intensified slightly during therecession (see Fig. 3).
The result of these combinedtrends is that donor numbers
have declined substantiallyover the past five years.Donors declined a cumulativemedian 5.8% from the twelvemonths ending Q2 2004 tothe twelve months ending Q22009. This is an effectiveannual rate of decline of 1.1%(see Fig. 4).
Donor declines have beenparticularly large over themost recent three-year periodsince the 2005 Gulf Coasthurricanes, as would be
expected after such a largeinflux of new disaster-relateddonors. From the twelvemonths ending Q2 2006 to the twelve months ending Q2 2009, donors declined 7.6%, for an effective annualrate of decline of 2.5% each year. Just 38% of the organizations in the index had positive donor growth over thisperiod.
As we have said in previous editions of the index, falling donor populations across the index may be due to amix of factors including economic changes, a changing generational profile in the United States, changingattitudes of donors about giving, and a change in focus by fundraisers toward higher-dollar donors.
New Donor Declines
For most organizations, overall donor
declines continue to be caused mainly bydeclines in new donor acquisition.
Over the past five years, from the twelvemonths ending Q2 2004 to the twelve monthsending Q2 2009, new donor numbers havefallen a cumulative median 9.7% (see Fig. 5).This is an effective annual rate of decline of1.9% per year.
New donor declines have been particularlysteep since the start of the recession. Newdonor numbers fell a cumulative median10.9% from the twelve months ending Q42007, when the recession began, to the
twelve months ending Q2 2009.
There does appear to have been a slowdown in new donor declines in the most recent quarter, although thismay be in part a recovery from large acquisition declines in Q2 2008.
Effects of the Economy on Giving
Research by the Giving USA Foundation™ indicates that charitable giving revenue growth rises during periodsof strong economic growth and slows during periods of relative economic weakness. Non-profit giving trends arenot limited to simple parallels with national economic growth, however. The Foundation has reported in theirpublication Giving USA that during harder economic times, charitable giving falls as a percentage of nationalGross Domestic Product (GDP)
2.
Fig. 4: Long-Term Index Revenue and Donor Trends
Five-Year
Change
Four-Year
Change
Three-Year
Change
Two-Year
Change
One-Year
Change
Q2 '04 to
Q2 '09
Q2 '05 to
Q2 '09
Q2 '06 to
Q2 '09
Q2 '07 to
Q2 '09
Q2 '08 to
Q2 '09
Revenue
Median Change 11.1% 0.5% -4.4% -6.1% -5.7%
Effective Annual Change 2.3% 0.1% -1.4% -3.0% -5.7%
% Orgs with Positive Change 61% 52% 40% 32% 19%
Donors
Median Change -5.8% -8.1% -7.6% -3.4% -4.0%
Effective Annual Change -1.1% -2.0% -2.5% -1.7% -4.0%
% Orgs with Positive Change 48% 38% 38% 32% 35%
Shows the cumulative median change from the twelve-month period ending the first date to the
twelve-month period ending the second date in each column. Effective Annual Change is the
average yearly change over the stated time period, adjusted for compounding over that period.
Fig. 5: Five-Year Overall Index New Donor Trends
Cumulative Rolling 12-Month Median Change from Q2 2004
-9.7%
-5.8%
-15%
-10%
-5%
0%
5%
10%
Q 2 2 0 0 4
Q 3 2 0 0 4
Q 4 2 0 0 4
Q 1 2 0 0 5
Q 2 2 0 0 5
Q 3 2 0 0 5
Q 4 2 0 0 5
Q 1 2 0 0 6
Q 2 2 0 0 6
Q 3 2 0 0 6
Q 4 2 0 0 6
Q 1 2 0 0 7
Q 2 2 0 0 7
Q 3 2 0 0 7
Q 4 2 0 0 7
Q 1 2 0 0 8
Q 2 2 0 0 8
Q 3 2 0 0 8
Q 4 2 0 0 8
Q 1 2 0 0 9
Q 2 2 0 0 9
Indian
Ocean
Tsunami
Hurricane
Katrina
New
Donors
All
Donors
Start of Current
Recession
8/14/2019 Index of National Fundraising Performance
http://slidepdf.com/reader/full/index-of-national-fundraising-performance 9/22
Q2 2009 Index of National Fundraising Performance
Copyright 2009 Target Analytics | www.blackbaud.com/targetanalytics 8
This means that as the economy slows down, not only does giving slow down as well, but it also declines as aproportion of the average American’s spending dollar. In recessionary periods, financially-strapped people shifttheir spending priorities away from charities, compounding the effects of an economic decline on fundraising.
Long-term revenue growth patterns for the Target Analytics index support both of these findings. Median indexrevenue growth generally parallels national economic performance and tends to grow more slowly than GDP
during periods of relative economic hardship.
According to the National Bureau of Economic Research, the United States economy has been in recessionsince December 2007
3. Many of the economic indicators we track in our quarterly index analysis reflect this,
performing weakly throughout 2008 and into the first half of 2009. Gross Domestic Product declined -1.0% in thesecond quarter of 2009, after a decline of -6.4% the previous quarter
4. The unemployment rate was 9.5% in
June 2009, up from 4.9% in December 20075. In June 2009, Standard and Poor’s S&P 500 Index was at only
62% of its December 2007 value6.
Again, recent index results track recent economic patterns closely. We have reported overall revenue declinesin the last five editions of the index (Q2 2008 through Q2 2009), with the most recent period showing some ofthe steepest downturns.
8/14/2019 Index of National Fundraising Performance
http://slidepdf.com/reader/full/index-of-national-fundraising-performance 10/22
Q2 2009 Index of National Fundraising Performance
Copyright 2009 Target Analytics | www.blackbaud.com/targetanalytics 9
Industry Sector Performance All sector results are medians unless otherwise specified.
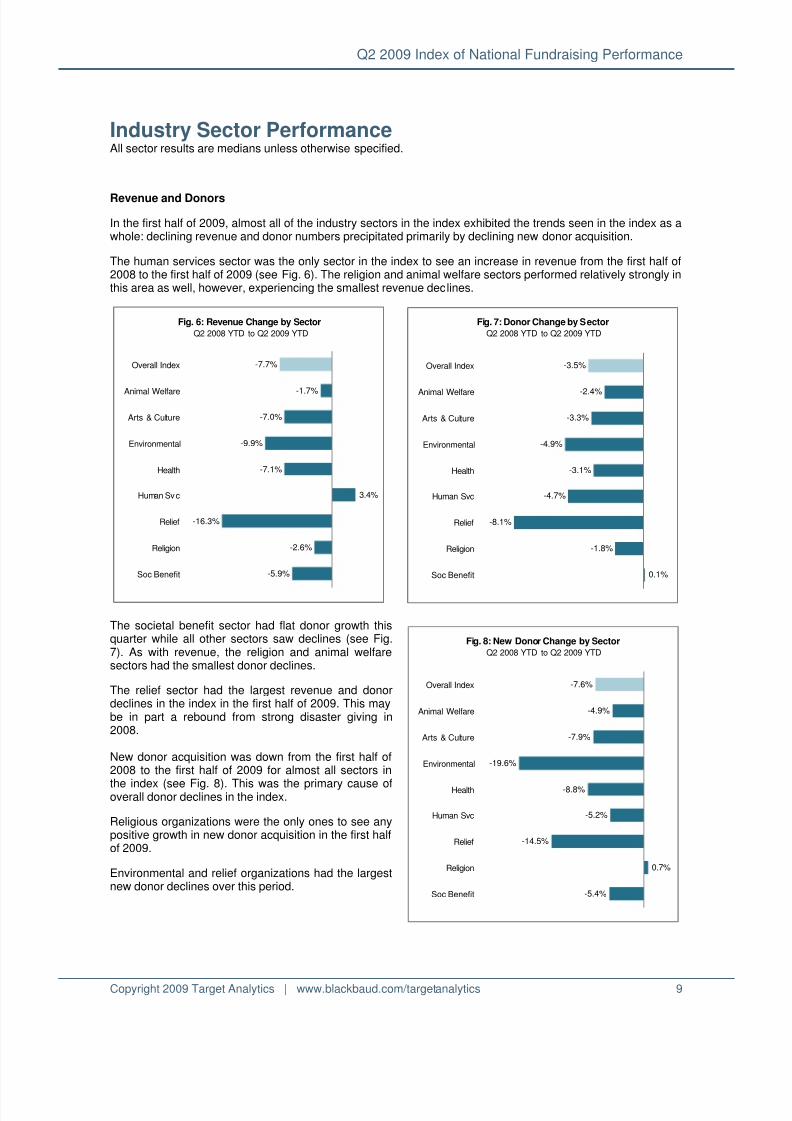
Revenue and Donors
In the first half of 2009, almost all of the industry sectors in the index exhibited the trends seen in the index as awhole: declining revenue and donor numbers precipitated primarily by declining new donor acquisition.
The human services sector was the only sector in the index to see an increase in revenue from the first half of2008 to the first half of 2009 (see Fig. 6). The religion and animal welfare sectors performed relatively strongly inthis area as well, however, experiencing the smallest revenue declines.
The societal benefit sector had flat donor growth thisquarter while all other sectors saw declines (see Fig.7). As with revenue, the religion and animal welfaresectors had the smallest donor declines.
The relief sector had the largest revenue and donordeclines in the index in the first half of 2009. This maybe in part a rebound from strong disaster giving in2008.
New donor acquisition was down from the first half of2008 to the first half of 2009 for almost all sectors in
the index (see Fig. 8). This was the primary cause ofoverall donor declines in the index.
Religious organizations were the only ones to see anypositive growth in new donor acquisition in the first halfof 2009.
Environmental and relief organizations had the largestnew donor declines over this period.
Fig. 6: Revenue Change by SectorQ2 2008 YTD to Q2 2009 YTD
-7.7%
-1.7%
-7.0%
-9.9%
-7.1%
3.4%
-16.3%
-2.6%
-5.9%
Overall Index
Animal Welfare
Arts & Culture
Environmental
Health
Human Svc
Relief
Religion
Soc Benefit
Fig. 7: Donor Change by SectorQ2 2008 YTD to Q2 2009 YTD
-3.5%
-2.4%
-3.3%
-4.9%
-3.1%
-4.7%
-8.1%
-1.8%
0.1%
Overall Index
Animal Welfare
Arts & Culture
Environmental
Health
Human Svc
Relief
Religion
Soc Benefit
Fig. 8: New Donor Change by SectorQ2 2008 YTD to Q2 2009 YTD
-7.6%
-4.9%
-7.9%
-19.6%
-8.8%
-5.2%
-14.5%
0.7%
-5.4%
Overall Index
Animal Welfare
Arts & Culture
Environmental
Health
Human Svc
Relief
Religion
Soc Benefit

8/14/2019 Index of National Fundraising Performance
http://slidepdf.com/reader/full/index-of-national-fundraising-performance 11/22
Q2 2009 Index of National Fundraising Performance
Copyright 2009 Target Analytics | www.blackbaud.com/targetanalytics 10
Retention Rates
Retention rate trends in this second-quarter analysis show the relative success of renewal efforts halfwaythrough the year. It is important to remember that mid-year rates are not always entirely predictive of eventualyear-end results, since last year’s donors have so far only had six months in which to renew.
First-year retention rates were down across all sectors from the first half of 2008 to the first half of 2009,sometimes substantially (see Fig. 9). The human services, animal welfare, and international relief sectors hadthe largest first-year retention rate declines over the period.
Multi-year retention rates are more varied across different industry sectors (see Fig. 10).
Human services organizations had the greatest multi-year retention rate increases in the index – despite alsohaving had the greatest first-year retention rate declines. This indicates that although organizations in this sectorare struggling to renew a large population of newly-acquired donors, they have a multi-year donor base that iscoming back at atypically high rates during this time of need.
Relief organizations had the greatest declines in multi-year retention; this may be part of the general reboundthat relief organizations are experiencing after several years of strong disaster-related fundraising.
Individual sector results are explained in more detail on the following pages.
Fig. 9: First-Year Retention Rate
Change by SectorQ2 2008 YTD to Q2 2009 YTD
-3.8%
-6.6%
-2.2%
-4.3%
-1.8%
-8.0%
-5.1%
-3.8%
-2.2%
Overall Index
Animal Welfare
Arts & Culture
Environmental
Health
Human Svc
Relief
Religion
Soc Benefit
Fig. 10: Multi-Year Retention Rate
Change by SectorQ2 2008 YTD to Q2 2009 YTD
-2.0%
-1.3%
-1.1%
-2.7%
1.0%
3.2%
-4.1%
-0.6%
-2.5%
Overall Index
Animal Welfare
Arts & Culture
Environmental
Health
Human Svc
Relief
Religion
Soc Benefit
8/14/2019 Index of National Fundraising Performance
http://slidepdf.com/reader/full/index-of-national-fundraising-performance 12/22
Q2 2009 Index of National Fundraising Performance
Copyright 2009 Target Analytics | www.blackbaud.com/targetanalytics 11
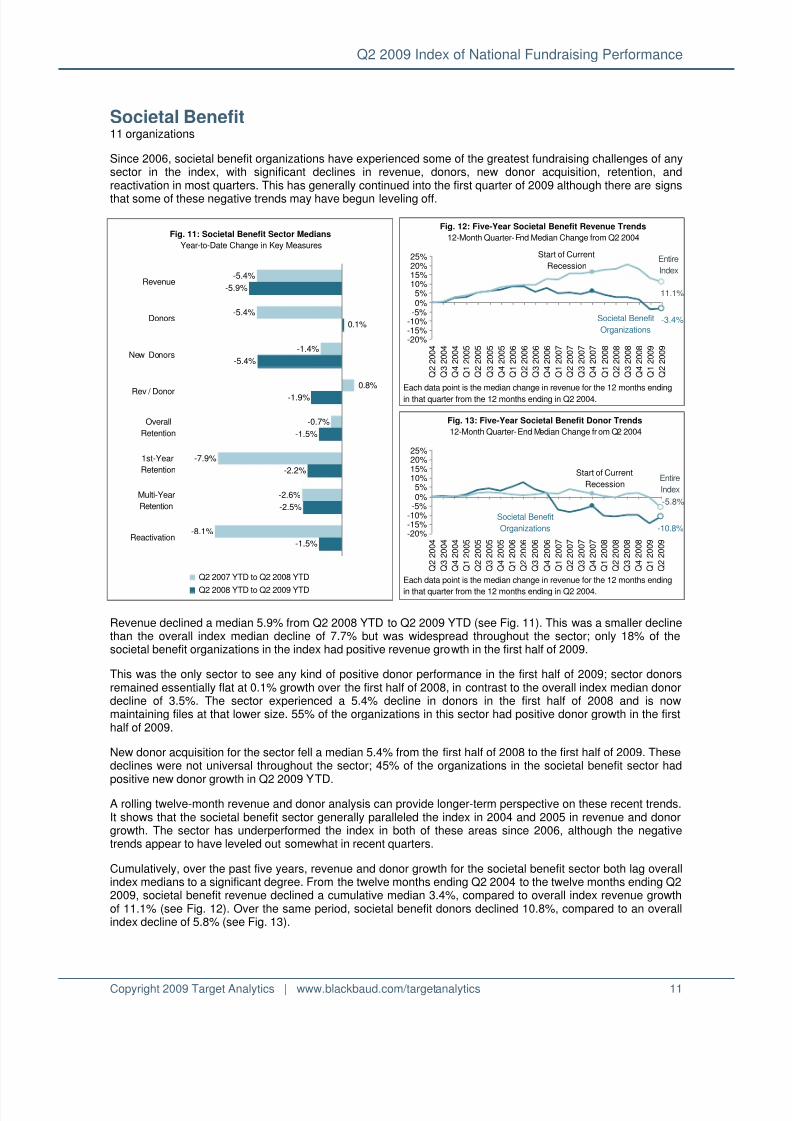
Societal Benefit 11 organizations
Since 2006, societal benefit organizations have experienced some of the greatest fundraising challenges of anysector in the index, with significant declines in revenue, donors, new donor acquisition, retention, andreactivation in most quarters. This has generally continued into the first quarter of 2009 although there are signs
that some of these negative trends may have begun leveling off.
Revenue declined a median 5.9% from Q2 2008 YTD to Q2 2009 YTD (see Fig. 11). This was a smaller declinethan the overall index median decline of 7.7% but was widespread throughout the sector; only 18% of thesocietal benefit organizations in the index had positive revenue growth in the first half of 2009.
This was the only sector to see any kind of positive donor performance in the first half of 2009; sector donorsremained essentially flat at 0.1% growth over the first half of 2008, in contrast to the overall index median donordecline of 3.5%. The sector experienced a 5.4% decline in donors in the first half of 2008 and is nowmaintaining files at that lower size. 55% of the organizations in this sector had positive donor growth in the firsthalf of 2009.
New donor acquisition for the sector fell a median 5.4% from the first half of 2008 to the first half of 2009. Thesedeclines were not universal throughout the sector; 45% of the organizations in the societal benefit sector hadpositive new donor growth in Q2 2009 YTD.
A rolling twelve-month revenue and donor analysis can provide longer-term perspective on these recent trends.It shows that the societal benefit sector generally paralleled the index in 2004 and 2005 in revenue and donorgrowth. The sector has underperformed the index in both of these areas since 2006, although the negativetrends appear to have leveled out somewhat in recent quarters.
Cumulatively, over the past five years, revenue and donor growth for the societal benefit sector both lag overallindex medians to a significant degree. From the twelve months ending Q2 2004 to the twelve months ending Q22009, societal benefit revenue declined a cumulative median 3.4%, compared to overall index revenue growthof 11.1% (see Fig. 12). Over the same period, societal benefit donors declined 10.8%, compared to an overallindex decline of 5.8% (see Fig. 13).
Fig. 11: Societal Benefit Sector Medians
Year-to-Date Change in Key Measures
-5.4%
-5.4%
-1.4%
0.8%
-0.7%
-7.9%
-2.6%
-8.1%
-5.9%
0.1%
-5.4%
-1.9%
-1.5%
-2.2%
-2.5%
-1.5%
Revenue
Donors
New Donors
Rev / Donor
Overall
Retention
1st-Year
Retention
Multi-Year
Retention
Reactivation
Q2 2007 YTD to Q2 2008 YTD
Q2 2008 YTD to Q2 2009 YTD
Fig. 12: Five-Year Societal Benefit Revenue Trends
12-Month Quarter-End Median Change from Q2 2004
-3.4%
11.1%
Entire
Index
-20%-15%-10%-5%0%5%
10%15%20%25%
Q 2 2 0 0 4
Q 3 2 0 0 4
Q 4 2 0 0 4
Q 1 2 0 0 5
Q 2 2 0 0 5
Q 3 2 0 0 5
Q 4 2 0 0 5
Q 1 2 0 0 6
Q 2 2 0 0 6
Q 3 2 0 0 6
Q 4 2 0 0 6
Q 1 2 0 0 7
Q 2 2 0 0 7
Q 3 2 0 0 7
Q 4 2 0 0 7
Q 1 2 0 0 8
Q 2 2 0 0 8
Q 3 2 0 0 8
Q 4 2 0 0 8
Q 1 2 0 0 9
Q 2 2 0 0 9
Societal Benefit
Organizations
Each data point is the median change in revenue for the 12 months ending
in that quarter from the 12 months ending in Q2 2004.
Start of Current
Recession
Fig. 13: Five-Year Societal Benefit Donor Trends
12-Month Quarter-End Median Change fr om Q2 2004
-10.8%
Entire
Index
-5.8%
-20%-15%-10%-5%0%5%
10%15%20%25%
Q 2 2 0 0 4
Q 3 2 0 0 4
Q 4 2 0 0 4
Q 1 2 0 0 5
Q 2 2 0 0 5
Q 3 2 0 0 5
Q 4 2 0 0 5
Q 1 2 0 0 6
Q 2 2 0 0 6
Q 3 2 0 0 6
Q 4 2 0 0 6
Q 1 2 0 0 7
Q 2 2 0 0 7
Q 3 2 0 0 7
Q 4 2 0 0 7
Q 1 2 0 0 8
Q 2 2 0 0 8
Q 3 2 0 0 8
Q 4 2 0 0 8
Q 1 2 0 0 9
Q 2 2 0 0 9
Societal Benefit
Organizations
Each data point is the median change in revenue for the 12 months ending
in that quarter from the 12 months ending in Q2 2004.
Start of Current
Recession
8/14/2019 Index of National Fundraising Performance
http://slidepdf.com/reader/full/index-of-national-fundraising-performance 13/22
Q2 2009 Index of National Fundraising Performance
Copyright 2009 Target Analytics | www.blackbaud.com/targetanalytics 12
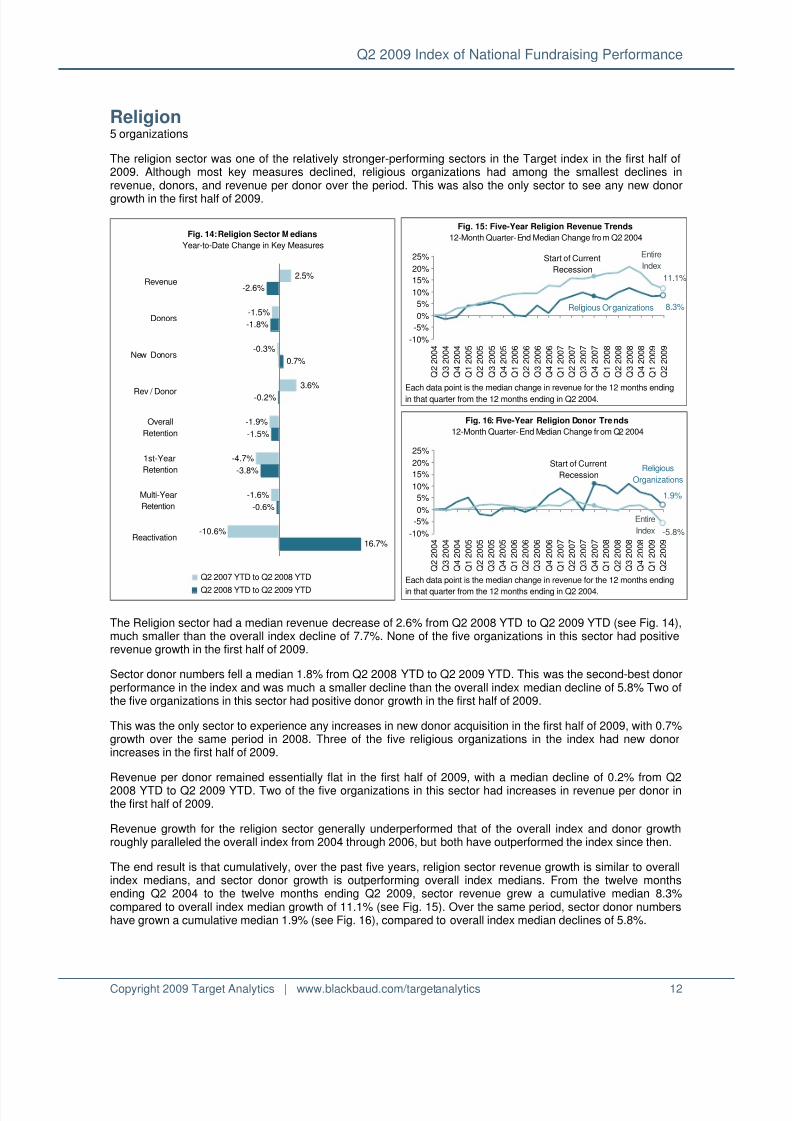
Religion5 organizations
The religion sector was one of the relatively stronger-performing sectors in the Target index in the first half of2009. Although most key measures declined, religious organizations had among the smallest declines inrevenue, donors, and revenue per donor over the period. This was also the only sector to see any new donor
growth in the first half of 2009.
The Religion sector had a median revenue decrease of 2.6% from Q2 2008 YTD to Q2 2009 YTD (see Fig. 14),much smaller than the overall index decline of 7.7%. None of the five organizations in this sector had positiverevenue growth in the first half of 2009.
Sector donor numbers fell a median 1.8% from Q2 2008 YTD to Q2 2009 YTD. This was the second-best donorperformance in the index and was much a smaller decline than the overall index median decline of 5.8% Two ofthe five organizations in this sector had positive donor growth in the first half of 2009.
This was the only sector to experience any increases in new donor acquisition in the first half of 2009, with 0.7%growth over the same period in 2008. Three of the five religious organizations in the index had new donorincreases in the first half of 2009.
Revenue per donor remained essentially flat in the first half of 2009, with a median decline of 0.2% from Q22008 YTD to Q2 2009 YTD. Two of the five organizations in this sector had increases in revenue per donor inthe first half of 2009.
Revenue growth for the religion sector generally underperformed that of the overall index and donor growthroughly paralleled the overall index from 2004 through 2006, but both have outperformed the index since then.
The end result is that cumulatively, over the past five years, religion sector revenue growth is similar to overallindex medians, and sector donor growth is outperforming overall index medians. From the twelve monthsending Q2 2004 to the twelve months ending Q2 2009, sector revenue grew a cumulative median 8.3%compared to overall index median growth of 11.1% (see Fig. 15). Over the same period, sector donor numbershave grown a cumulative median 1.9% (see Fig. 16), compared to overall index median declines of 5.8%.
Fig. 14: Religion Sector M edians
Year-to-Date Change in Key Measures
2.5%
-1.5%
-0.3%
3.6%
-1.9%
-4.7%
-1.6%
-10.6%
-2.6%
-1.8%
0.7%
-0.2%
-1.5%
-3.8%
-0.6%
16.7%
Revenue
Donors
New Donors
Rev / Donor
Overall
Retention
1st-Year
Retention
Multi-Year
Retention
Reactivation
Q2 2007 YTD to Q2 2008 YTD
Q2 2008 YTD to Q2 2009 YTD
Fig. 15: Five-Year Religion Revenue Trends
12-Month Quarter-End Median Change from Q2 2004
8.3%
Entire
Index
11.1%
-10%
-5%
0%
5%
10%
15%
20%
25%
Q 2 2 0 0 4
Q 3 2 0 0 4
Q 4 2 0 0 4
Q 1 2 0 0 5
Q 2 2 0 0 5
Q 3 2 0 0 5
Q 4 2 0 0 5
Q 1 2 0 0 6
Q 2 2 0 0 6
Q 3 2 0 0 6
Q 4 2 0 0 6
Q 1 2 0 0 7
Q 2 2 0 0 7
Q 3 2 0 0 7
Q 4 2 0 0 7
Q 1 2 0 0 8
Q 2 2 0 0 8
Q 3 2 0 0 8
Q 4 2 0 0 8
Q 1 2 0 0 9
Q 2 2 0 0 9
Religious Organizations
Each data point is the median change in revenue for the 12 months ending
in that quarter from the 12 months ending in Q2 2004.
Start of Current
Recession
Fig. 16: Five-Year Religion Donor Trends
12-Month Quarter-End Median Change fr om Q2 2004
1.9%
-5.8%
Entire
Index-10%
-5%
0%
5%
10%
15%
20%
25%
Q 2 2 0 0 4
Q 3 2 0 0 4
Q 4 2 0 0 4
Q 1 2 0 0 5
Q 2 2 0 0 5
Q 3 2 0 0 5
Q 4 2 0 0 5
Q 1 2 0 0 6
Q 2 2 0 0 6
Q 3 2 0 0 6
Q 4 2 0 0 6
Q 1 2 0 0 7
Q 2 2 0 0 7
Q 3 2 0 0 7
Q 4 2 0 0 7
Q 1 2 0 0 8
Q 2 2 0 0 8
Q 3 2 0 0 8
Q 4 2 0 0 8
Q 1 2 0 0 9
Q 2 2 0 0 9
Religious
Organizations
Each data point is the median change in revenue for the 12 months ending
in that quarter from the 12 months ending in Q2 2004.
Start of Current
Recession

8/14/2019 Index of National Fundraising Performance
http://slidepdf.com/reader/full/index-of-national-fundraising-performance 14/22
Q2 2009 Index of National Fundraising Performance
Copyright 2009 Target Analytics | www.blackbaud.com/targetanalytics 13
International Relief 13 organizations
The international relief sector has seen some of the greatest growth in the index over the past five years. Relieforganizations have had significant increases in both revenue and donors following several major disasters and,until now, have been able to retain a substantial portion of this disaster-related fundraising during non-disaster
years. The sector is now experiencing steep declines in many key measures, although at least part of this maybe a rebound from strong disaster giving in 2008.
Revenue for the international relief sector declined a median 16.3% from Q2 2008 YTD to Q2 2009 YTD,compared to an overall index median revenue decline of 7.7% over the same period (see Fig. 17). Only 8% ofthe organizations in the relief sector had revenue increases in the first half of 2009.
Donors to international relief organizations declined 8.1% from Q2 2008 YTD to Q2 2009 YTD, compared to anoverall index median donor decline of 3.5% over the same period. Only 23% of the organizations in this sectorhad donor increases in the first half of 2009.
This sector had strong new donor acquisition through the end of 2008 but numbers of new donors fell for thesector by a median 14.5% from Q2 2008 YTD to Q2 2009 YTD.
Rolling revenue and donor trends can give a longer-term context for recent relief sector performance. The
Indian Ocean tsunami of December 2004 generated record disaster-related revenue and donor acquisition inboth 2004 and 2005. The sector experienced another small spike in both revenue and donors in 2008, whichmay in part reflect disaster giving related to a cyclone in Myanmar and an earthquake in China.
Although revenue is now on the decline, revenue and donors for the international relief sector are both still upsignificantly over pre-tsunami numbers.
Relief sector revenue grew a cumulative 30.4% from the twelve months ending Q2 2004 to the twelve monthsending Q2 2009 (see Fig. 18). The index as a whole had only 11.1% growth over the same five-year period.Donor numbers grew a cumulative 29.0% for the relief sector, compared to an overall index median donordecline of 5.8% (see Fig. 19).
Fig. 17: International Relief Sector Medians
Year-to-Date Change in Key Measures
10.7%
-0.3%
-2.1%
7.2%
9.0%
0.8%
5.6%
1.8%
-16.3%
-8.1%
-14.5%
-8.9%
-3.9%
-5.1%
-4.1%
-24.3%
Revenue
Donors
New Donors
Rev / Donor
Overall
Retention
1st-Year
Retention
Multi-Year
Retention
Reactivation
Q2 2007 YTD to Q2 2008 YTDQ2 2008 YTD to Q2 2009 YTD
Fig. 18: Five-Year Relief Revenue Trends
12-Month Quarter-End Median Change from Q2 2004
30.4%
11.1%-25%
0%
25%
50%
75%
100%
125%
150%
Q 2 2 0 0 4
Q 3 2 0 0 4
Q 4 2 0 0 4
Q 1 2 0 0 5
Q 2 2 0 0 5
Q 3 2 0 0 5
Q 4 2 0 0 5
Q 1 2 0 0 6
Q 2 2 0 0 6
Q 3 2 0 0 6
Q 4 2 0 0 6
Q 1 2 0 0 7
Q 2 2 0 0 7
Q 3 2 0 0 7
Q 4 2 0 0 7
Q 1 2 0 0 8
Q 2 2 0 0 8
Q 3 2 0 0 8
Q 4 2 0 0 8
Q 1 2 0 0 9
Q 2 2 0 0 9
Relief
Organizations
Each data point is the median change in revenue for the 12 months ending
in that quarter from the 12 months ending in Q2 2004.
Indian
Ocean
Tsunami
Burma Cyclone &
China Earthquake
Hurricane
Katrina
Entire Index
Fig. 19: Five-Year Relief Donor Trends
12-Month Quarter-End Median Change from Q2 2004
29.0%
-5.8%-25%
0%
25%
50%
75%
100%
125%
150%
Q 2 2 0 0 4
Q 3 2 0 0 4
Q 4 2 0 0 4
Q 1 2 0 0 5
Q 2 2 0 0 5
Q 3 2 0 0 5
Q 4 2 0 0 5
Q 1 2 0 0 6
Q 2 2 0 0 6
Q 3 2 0 0 6
Q 4 2 0 0 6
Q 1 2 0 0 7
Q 2 2 0 0 7
Q 3 2 0 0 7
Q 4 2 0 0 7
Q 1 2 0 0 8
Q 2 2 0 0 8
Q 3 2 0 0 8
Q 4 2 0 0 8
Q 1 2 0 0 9
Q 2 2 0 0 9
Relief
Organizations
Each data point is the median change in revenue for the 12 months ending
in that quarter from the 12 months ending in Q2 2004.
Indian
Ocean
Tsunami
Burma Cyc lone
& China Earthquake
Hurricane
Katrina
Entire Index
8/14/2019 Index of National Fundraising Performance
http://slidepdf.com/reader/full/index-of-national-fundraising-performance 15/22
Q2 2009 Index of National Fundraising Performance
Copyright 2009 Target Analytics | www.blackbaud.com/targetanalytics 14
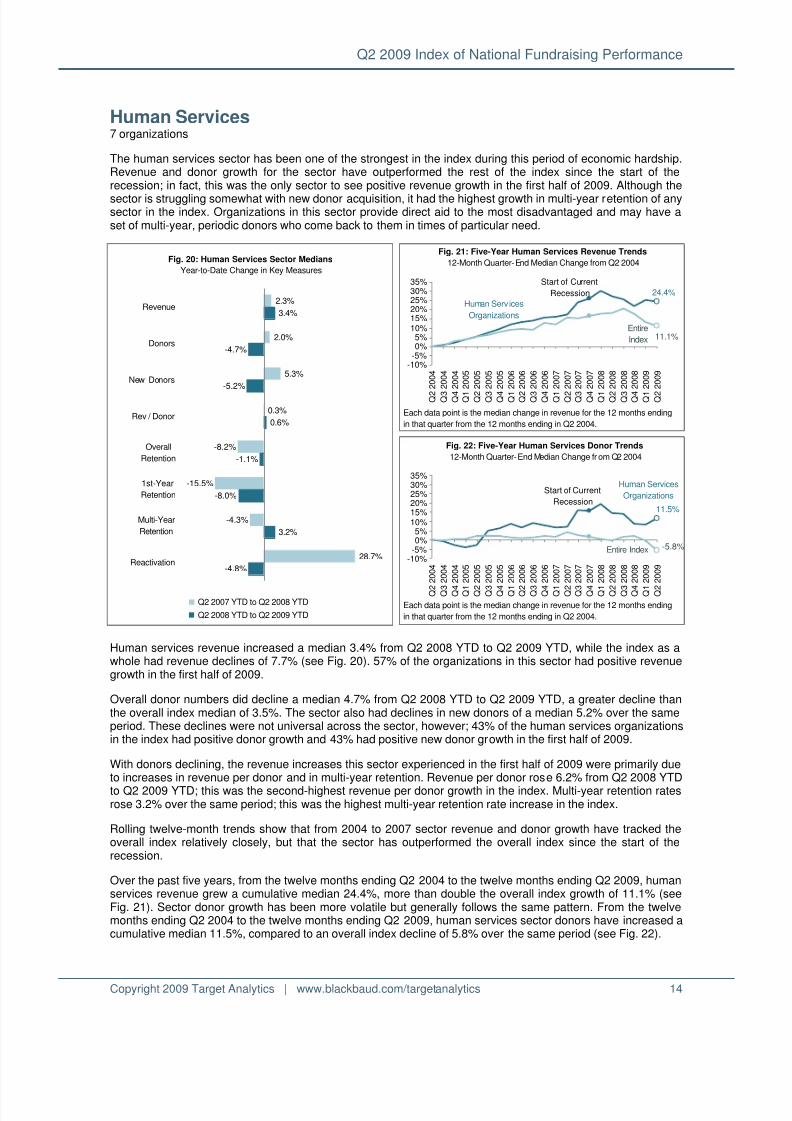
Human Services 7 organizations
The human services sector has been one of the strongest in the index during this period of economic hardship.Revenue and donor growth for the sector have outperformed the rest of the index since the start of therecession; in fact, this was the only sector to see positive revenue growth in the first half of 2009. Although the
sector is struggling somewhat with new donor acquisition, it had the highest growth in multi-year retention of anysector in the index. Organizations in this sector provide direct aid to the most disadvantaged and may have aset of multi-year, periodic donors who come back to them in times of particular need.
Human services revenue increased a median 3.4% from Q2 2008 YTD to Q2 2009 YTD, while the index as awhole had revenue declines of 7.7% (see Fig. 20). 57% of the organizations in this sector had positive revenuegrowth in the first half of 2009.
Overall donor numbers did decline a median 4.7% from Q2 2008 YTD to Q2 2009 YTD, a greater decline thanthe overall index median of 3.5%. The sector also had declines in new donors of a median 5.2% over the sameperiod. These declines were not universal across the sector, however; 43% of the human services organizationsin the index had positive donor growth and 43% had positive new donor growth in the first half of 2009.
With donors declining, the revenue increases this sector experienced in the first half of 2009 were primarily dueto increases in revenue per donor and in multi-year retention. Revenue per donor rose 6.2% from Q2 2008 YTDto Q2 2009 YTD; this was the second-highest revenue per donor growth in the index. Multi-year retention ratesrose 3.2% over the same period; this was the highest multi-year retention rate increase in the index.
Rolling twelve-month trends show that from 2004 to 2007 sector revenue and donor growth have tracked theoverall index relatively closely, but that the sector has outperformed the overall index since the start of therecession.
Over the past five years, from the twelve months ending Q2 2004 to the twelve months ending Q2 2009, humanservices revenue grew a cumulative median 24.4%, more than double the overall index growth of 11.1% (seeFig. 21). Sector donor growth has been more volatile but generally follows the same pattern. From the twelvemonths ending Q2 2004 to the twelve months ending Q2 2009, human services sector donors have increased acumulative median 11.5%, compared to an overall index decline of 5.8% over the same period (see Fig. 22).
Fig. 20: Human Services Sector Medians
Year-to-Date Change in Key Measures
2.3%
2.0%
5.3%
0.3%
-8.2%
-15.5%
-4.3%
28.7%
3.4%
-4.7%
-5.2%
0.6%
-1.1%
-8.0%
3.2%
-4.8%
Revenue
Donors
New Donors
Rev / Donor
Overall
Retention
1st-Year
Retention
Multi-Year
Retention
Reactivation
Q2 2007 YTD to Q2 2008 YTD
Q2 2008 YTD to Q2 2009 YTD
Fig. 21: Five-Year Human Services Revenue Trends
12-Month Quarter-End Median Change from Q2 2004
24.4%
11.1%Entire
Index
-10%-5%0%5%
10%15%20%25%30%35%
Q 2
2 0 0 4
Q 3
2 0 0 4
Q 4
2 0 0 4
Q 1
2 0 0 5
Q 2
2 0 0 5
Q 3
2 0 0 5
Q 4
2 0 0 5
Q 1
2 0 0 6
Q 2
2 0 0 6
Q 3
2 0 0 6
Q 4
2 0 0 6
Q 1
2 0 0 7
Q 2
2 0 0 7
Q 3
2 0 0 7
Q 4
2 0 0 7
Q 1
2 0 0 8
Q 2
2 0 0 8
Q 3
2 0 0 8
Q 4
2 0 0 8
Q 1
2 0 0 9
Q 2
2 0 0 9
Human Services
Organizations
Each data point is the median change in revenue for the 12 months ending
in that quarter from the 12 months ending in Q2 2004.
Start of Current
Recession
Fig. 22: Five-Year Human Services Donor Trends
12-Month Quarter-End Median Change fr om Q2 2004
11.5%
-5.8%
-10%-5%0%5%
10%15%20%25%30%35%
Q 2
2 0 0 4
Q 3
2 0 0 4
Q 4
2 0 0 4
Q 1
2 0 0 5
Q 2
2 0 0 5
Q 3
2 0 0 5
Q 4
2 0 0 5
Q 1
2 0 0 6
Q 2
2 0 0 6
Q 3
2 0 0 6
Q 4
2 0 0 6
Q 1
2 0 0 7
Q 2
2 0 0 7
Q 3
2 0 0 7
Q 4
2 0 0 7
Q 1
2 0 0 8
Q 2
2 0 0 8
Q 3
2 0 0 8
Q 4
2 0 0 8
Q 1
2 0 0 9
Q 2
2 0 0 9
Human Services
Organizations
Each data point is the median change in revenue for the 12 months ending
in that quarter from the 12 months ending in Q2 2004.
Start of Current
Recession
Entire Index
8/14/2019 Index of National Fundraising Performance
http://slidepdf.com/reader/full/index-of-national-fundraising-performance 16/22
Q2 2009 Index of National Fundraising Performance
Copyright 2009 Target Analytics | www.blackbaud.com/targetanalytics 15
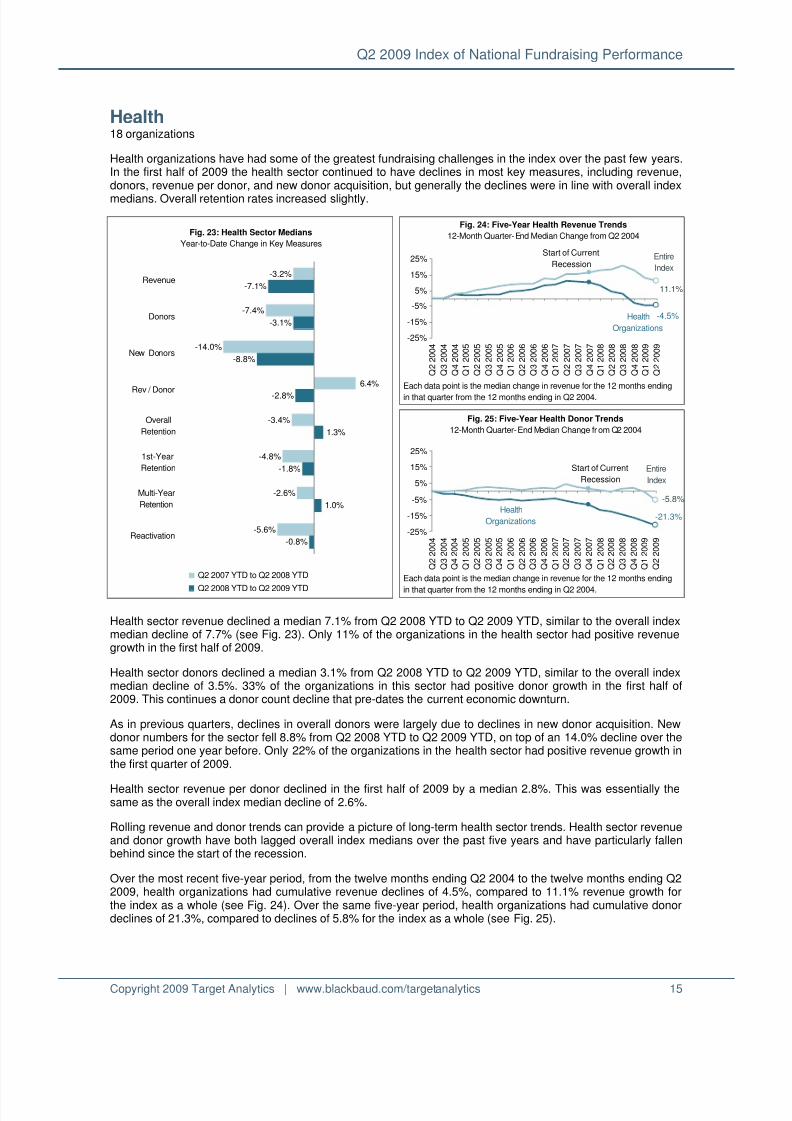
Health 18 organizations
Health organizations have had some of the greatest fundraising challenges in the index over the past few years.In the first half of 2009 the health sector continued to have declines in most key measures, including revenue,donors, revenue per donor, and new donor acquisition, but generally the declines were in line with overall index
medians. Overall retention rates increased slightly.
Health sector revenue declined a median 7.1% from Q2 2008 YTD to Q2 2009 YTD, similar to the overall indexmedian decline of 7.7% (see Fig. 23). Only 11% of the organizations in the health sector had positive revenuegrowth in the first half of 2009.
Health sector donors declined a median 3.1% from Q2 2008 YTD to Q2 2009 YTD, similar to the overall indexmedian decline of 3.5%. 33% of the organizations in this sector had positive donor growth in the first half of2009. This continues a donor count decline that pre-dates the current economic downturn.
As in previous quarters, declines in overall donors were largely due to declines in new donor acquisition. Newdonor numbers for the sector fell 8.8% from Q2 2008 YTD to Q2 2009 YTD, on top of an 14.0% decline over thesame period one year before. Only 22% of the organizations in the health sector had positive revenue growth inthe first quarter of 2009.
Health sector revenue per donor declined in the first half of 2009 by a median 2.8%. This was essentially thesame as the overall index median decline of 2.6%.
Rolling revenue and donor trends can provide a picture of long-term health sector trends. Health sector revenueand donor growth have both lagged overall index medians over the past five years and have particularly fallenbehind since the start of the recession.
Over the most recent five-year period, from the twelve months ending Q2 2004 to the twelve months ending Q22009, health organizations had cumulative revenue declines of 4.5%, compared to 11.1% revenue growth forthe index as a whole (see Fig. 24). Over the same five-year period, health organizations had cumulative donordeclines of 21.3%, compared to declines of 5.8% for the index as a whole (see Fig. 25).
Fig. 23: Health Sector Medians
Year-to-Date Change in Key Measures
-3.2%
-7.4%
-14.0%
6.4%
-3.4%
-4.8%
-2.6%
-5.6%
-7.1%
-3.1%
-8.8%
-2.8%
1.3%
-1.8%
1.0%
-0.8%
Revenue
Donors
New Donors
Rev / Donor
Overall
Retention
1st-Year
Retention
Multi-Year
Retention
Reactivation
Q2 2007 YTD to Q2 2008 YTD
Q2 2008 YTD to Q2 2009 YTD
Fig. 24: Five-Year Health Revenue Trends
12-Month Quarter-End Median Change from Q2 2004
-4.5%
11.1%
Entire
Index
-25%
-15%
-5%
5%
15%
25%
Q 2 2 0 0 4
Q 3 2 0 0 4
Q 4 2 0 0 4
Q 1 2 0 0 5
Q 2 2 0 0 5
Q 3 2 0 0 5
Q 4 2 0 0 5
Q 1 2 0 0 6
Q 2 2 0 0 6
Q 3 2 0 0 6
Q 4 2 0 0 6
Q 1 2 0 0 7
Q 2 2 0 0 7
Q 3 2 0 0 7
Q 4 2 0 0 7
Q 1 2 0 0 8
Q 2 2 0 0 8
Q 3 2 0 0 8
Q 4 2 0 0 8
Q 1 2 0 0 9
Q 2 2 0 0 9
Health
Organizations
Each data point is the median change in revenue for the 12 months ending
in that quarter from the 12 months ending in Q2 2004.
Start of Current
Recession
Fig. 25: Five-Year Health Donor Trends
12-Month Quarter-End Median Change fr om Q2 2004
-21.3%
Entire
Index
-5.8%
-25%
-15%
-5%
5%
15%
25%
Q 2 2 0 0 4
Q 3 2 0 0 4
Q 4 2 0 0 4
Q 1 2 0 0 5
Q 2 2 0 0 5
Q 3 2 0 0 5
Q 4 2 0 0 5
Q 1 2 0 0 6
Q 2 2 0 0 6
Q 3 2 0 0 6
Q 4 2 0 0 6
Q 1 2 0 0 7
Q 2 2 0 0 7
Q 3 2 0 0 7
Q 4 2 0 0 7
Q 1 2 0 0 8
Q 2 2 0 0 8
Q 3 2 0 0 8
Q 4 2 0 0 8
Q 1 2 0 0 9
Q 2 2 0 0 9
Health
Organizations
Each data point is the median change in revenue for the 12 months ending
in that quarter from the 12 months ending in Q2 2004.
Start of Current
Recession
8/14/2019 Index of National Fundraising Performance
http://slidepdf.com/reader/full/index-of-national-fundraising-performance 17/22
Q2 2009 Index of National Fundraising Performance
Copyright 2009 Target Analytics | www.blackbaud.com/targetanalytics 16
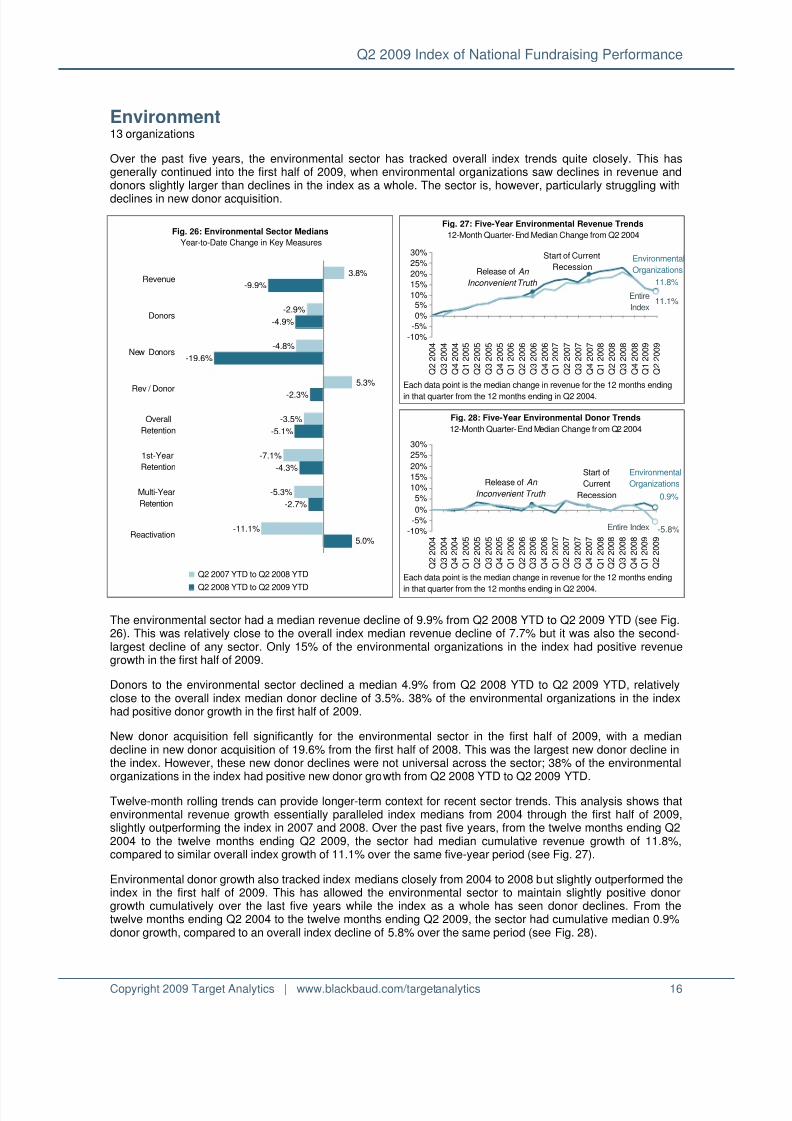
Environment 13 organizations
Over the past five years, the environmental sector has tracked overall index trends quite closely. This hasgenerally continued into the first half of 2009, when environmental organizations saw declines in revenue anddonors slightly larger than declines in the index as a whole. The sector is, however, particularly struggling with
declines in new donor acquisition.
The environmental sector had a median revenue decline of 9.9% from Q2 2008 YTD to Q2 2009 YTD (see Fig.26). This was relatively close to the overall index median revenue decline of 7.7% but it was also the second-largest decline of any sector. Only 15% of the environmental organizations in the index had positive revenuegrowth in the first half of 2009.
Donors to the environmental sector declined a median 4.9% from Q2 2008 YTD to Q2 2009 YTD, relativelyclose to the overall index median donor decline of 3.5%. 38% of the environmental organizations in the indexhad positive donor growth in the first half of 2009.
New donor acquisition fell significantly for the environmental sector in the first half of 2009, with a mediandecline in new donor acquisition of 19.6% from the first half of 2008. This was the largest new donor decline inthe index. However, these new donor declines were not universal across the sector; 38% of the environmentalorganizations in the index had positive new donor growth from Q2 2008 YTD to Q2 2009 YTD.
Twelve-month rolling trends can provide longer-term context for recent sector trends. This analysis shows thatenvironmental revenue growth essentially paralleled index medians from 2004 through the first half of 2009,slightly outperforming the index in 2007 and 2008. Over the past five years, from the twelve months ending Q22004 to the twelve months ending Q2 2009, the sector had median cumulative revenue growth of 11.8%,compared to similar overall index growth of 11.1% over the same five-year period (see Fig. 27).
Environmental donor growth also tracked index medians closely from 2004 to 2008 but slightly outperformed theindex in the first half of 2009. This has allowed the environmental sector to maintain slightly positive donorgrowth cumulatively over the last five years while the index as a whole has seen donor declines. From thetwelve months ending Q2 2004 to the twelve months ending Q2 2009, the sector had cumulative median 0.9%donor growth, compared to an overall index decline of 5.8% over the same period (see Fig. 28).
Fig. 26: Environmental Sector Medians
Year-to-Date Change in Key Measures
3.8%
-2.9%
-4.8%
5.3%
-3.5%
-7.1%
-5.3%
-11.1%
-9.9%
-4.9%
-19.6%
-2.3%
-5.1%
-4.3%
-2.7%
5.0%
Revenue
Donors
New Donors
Rev / Donor
Overall
Retention
1st-Year
Retention
Multi-Year
Retention
Reactivation
Q2 2007 YTD to Q2 2008 YTD
Q2 2008 YTD to Q2 2009 YTD
Fig. 27: Five-Year Environmental Revenue Trends
12-Month Quarter-End Median Change from Q2 2004
11.8%
Entire
Index11.1%
-10%
-5%
0%
5%10%
15%
20%
25%
30%
Q 2 2 0 0 4
Q 3 2 0 0 4
Q 4 2 0 0 4
Q 1 2 0 0 5
Q 2 2 0 0 5
Q 3 2 0 0 5
Q 4 2 0 0 5
Q 1 2 0 0 6
Q 2 2 0 0 6
Q 3 2 0 0 6
Q 4 2 0 0 6
Q 1 2 0 0 7
Q 2 2 0 0 7
Q 3 2 0 0 7
Q 4 2 0 0 7
Q 1 2 0 0 8
Q 2 2 0 0 8
Q 3 2 0 0 8
Q 4 2 0 0 8
Q 1 2 0 0 9
Q 2 2 0 0 9
Release of An
Inconvenient Truth
Environmental
Organizations
Each data point is the median change in revenue for the 12 months ending
in that quarter from the 12 months ending in Q2 2004.
Start of Current
Recession
Fig. 28: Five-Year Environmental Donor Trends
12-Month Quarter-End Median Change fr om Q2 2004
0.9%
-5.8%-10%
-5%
0%
5%
10%
15%
20%
25%
30%
Q 2 2 0 0 4
Q 3 2 0 0 4
Q 4 2 0 0 4
Q 1 2 0 0 5
Q 2 2 0 0 5
Q 3 2 0 0 5
Q 4 2 0 0 5
Q 1 2 0 0 6
Q 2 2 0 0 6
Q 3 2 0 0 6
Q 4 2 0 0 6
Q 1 2 0 0 7
Q 2 2 0 0 7
Q 3 2 0 0 7
Q 4 2 0 0 7
Q 1 2 0 0 8
Q 2 2 0 0 8
Q 3 2 0 0 8
Q 4 2 0 0 8
Q 1 2 0 0 9
Q 2 2 0 0 9
Release of An
Inconvenient Truth
Environmental
Organizations
Each data point is the median change in revenue for the 12 months ending
in that quarter from the 12 months ending in Q2 2004.
Start of
Current
Recession
Entire Index

8/14/2019 Index of National Fundraising Performance
http://slidepdf.com/reader/full/index-of-national-fundraising-performance 18/22
Q2 2009 Index of National Fundraising Performance
Copyright 2009 Target Analytics | www.blackbaud.com/targetanalytics 17
Arts & Culture6 organizations
Arts and Culture organizations are generally experiencing declines in key measures similar to those of the indexas a whole. Their declines in revenue, donors, and acquisition were close to overall index medians. Over thelong term, the sector has underperformed the index in revenue growth but outperformed it in donor growth.
Arts and culture sector revenue declined a median 7.0% from Q2 2008 YTD to Q2 2009 YTD (see Fig. 29),similar to the overall index median decline of 7.7%. Only one of the six organizations in the sector had positiverevenue growth in the first half of 2009.
Sector donors declined a median 3.3% from Q2 2008 YTD to Q2 2009 YTD, similar to the overall index mediandecline of 3.5%. One of the six organizations in the sector had positive donor growth in the first half of 2009.
The area where this sector is perhaps struggling the most is in new donor acquisition. Arts and cultureorganizations had a median decline in new donors of 7.9% from Q2 2008 YTD to Q2 2009 YTD, similar to theoverall index median decline of 7.6%. Again, only one of the six organizations in the sector had positive newdonor growth in the first half of 2009.
Sector revenue per donor declined by a median 1.8% from Q2 2008 YTD to Q2 2009 YTD, a much smallerdecline than the overall index median decline of 2.6%.
Twelve-month rolling trends can provide longer-term context for recent arts and culture sector results. Theyshow that the sector has generally underperformed the index for the past five years, but had an anomalousspike in both revenue and donors in the second quarter of 2007. This spike appears not to be attributable to anysingle external event; it appears instead to be a coincidental convergence of events affecting the individualorganizations in the sector – changes in strategy, capital campaigns, and current events.
Cumulatively, over the past five years, revenue growth for the sector has lagged the overall index, but donorgrowth has been similar to that of the overall index. From the twelve months ending Q2 2004 to the twelvemonths ending Q2 2009, the arts and culture sector has had cumulative revenue growth of 1.2%, compared tooverall index growth of 11.1% (see Fig. 30). Over the same five-year period, the sector had cumulative mediandonor declines of 2.8%, compared to an overall index decline of 5.8% (see Fig. 31).
Fig. 29: Arts & Culture Sector Me dians
Year-to-Date Change in Key Measures
-3.5%
-3.6%
-17.1%
0.0%
-0.9%
-2.9%
0.6%
-10.7%
-7.0%
-3.3%
-7.9%
-1.8%
-0.4%
-2.2%
-1.1%
1.9%
Revenue
Donors
New Donors
Rev / Donor
Overall
Retention
1st-Year
Retention
Multi-Year
Retention
Reactivation
Q2 2007 YTD to Q2 2008 YTD
Q2 2008 YTD to Q2 2009 YTD
Fig. 30: Five-Year Arts & Culture Revenue Tre nds
12-Month Quarter-End Median Change from Q2 2004
1.2%
11.1%
-10%
-5%
0%
5%
10%
15%
20%
25%
Q 2 2 0 0 4
Q 3 2 0 0 4
Q 4 2 0 0 4
Q 1 2 0 0 5
Q 2 2 0 0 5
Q 3 2 0 0 5
Q 4 2 0 0 5
Q 1 2 0 0 6
Q 2 2 0 0 6
Q 3 2 0 0 6
Q 4 2 0 0 6
Q 1 2 0 0 7
Q 2 2 0 0 7
Q 3 2 0 0 7
Q 4 2 0 0 7
Q 1 2 0 0 8
Q 2 2 0 0 8
Q 3 2 0 0 8
Q 4 2 0 0 8
Q 1 2 0 0 9
Q 2 2 0 0 9
Arts & Culture Organizations
Each data point is the median change in revenue for the 12 months ending
in that quarter from the 12 months ending in Q2 2004.
Start of Current
Recession
Entire
Index
Fig. 31: Five-Year Arts & Culture Donor Trends
12-Month Quarter-End Median Change fr om Q2 2004
-2.8%
-5.8%-10%
-5%
0%
5%
10%
15%
20%
25%
Q 2 2 0 0 4
Q 3 2 0 0 4
Q 4 2 0 0 4
Q 1 2 0 0 5
Q 2 2 0 0 5
Q 3 2 0 0 5
Q 4 2 0 0 5
Q 1 2 0 0 6
Q 2 2 0 0 6
Q 3 2 0 0 6
Q 4 2 0 0 6
Q 1 2 0 0 7
Q 2 2 0 0 7
Q 3 2 0 0 7
Q 4 2 0 0 7
Q 1 2 0 0 8
Q 2 2 0 0 8
Q 3 2 0 0 8
Q 4 2 0 0 8
Q 1 2 0 0 9
Q 2 2 0 0 9
Arts & Culture Organizations
Each data point is the median change in revenue for the 12 months ending
in that quarter from the 12 months ending in Q2 2004.
Entire Index
Start of
Current
Recession

8/14/2019 Index of National Fundraising Performance
http://slidepdf.com/reader/full/index-of-national-fundraising-performance 19/22
Q2 2009 Index of National Fundraising Performance
Copyright 2009 Target Analytics | www.blackbaud.com/targetanalytics 18
Animal Welfare 4 organizations
The animal welfare sector has been one of the strongest sectors in the index over the past several years. Theeffects of the struggling economy appear to have caught up with it a bit in the first half of 2009, as evidenced bydeclines in revenue, donors, and new donor acquisition. However, these declines are among the smallest in the
index and come after a very successful 2008. This is also one of only two sectors in the index to experienceincreases in revenue per donor this period. When evaluating results for this sector, it is important to be awarethat it includes only four organizations.
Animal welfare revenue declined a median 1.7% from Q2 2008 YTD to Q2 2009 YTD (see Fig. 32). Only onesector in the index, human services, had revenue increases; all other sectors had larger declines. Two of thefour organizations in this sector had revenue increases in the first half of 2009.
The sector had relatively small donor declines as well. Donors to animal welfare organizations declined amedian 2.4% from Q2 2008 YTD to Q2 2009 YTD, compared to an overall index median decline of 3.5%. Oneof the four organizations in this sector had donor increases in the first half of 2009.
Sector new donor acquisition fell 4.9% from Q2 2008 YTD to Q2 2009 YTD. Some drop-off might be expected,however, after a 26.7% increase in new donors in the same period the previous year. This is also the second-best acquisition performance in the index; only one sector, religion, had positive new donor growth over the
period, while all other sectors had larger declines than those of the animal welfare sector.
Rolling twelve-month trends give us a long-term picture of animal welfare sector performance. The sector hashad two substantial event-related spikes in revenue and donors over the last five years; one in 2005 followingthe U.S. Gulf Coast hurricanes and one in 2007 following the arrest and conviction of professional footballplayer Michael Vick on dog fighting charges.
Cumulatively, over the past five years, the animal welfare sector has outperformed index revenue and donormedians significantly. From the twelve months ending Q2 2004 to the twelve months ending Q2 2009, revenuegrowth for the animal welfare sector grew by a cumulative median 25.6%, while the index as a whole grew just11.1% (see Fig. 33). Over the same five-year period, sector donors grew by a median 9.9% while the overallindex saw a median donor decline of 5.8% (see Fig. 34).
Fig. 32: Animal Welfare Sector Medians
Year-to-Date Change in Key Measures
11.0%
8.9%
26.7%
3.7%
-0.5%
-0.7%
0.4%
-4.4%
-1.7%
-2.4%
-4.9%
0.8%
-2.7%
-6.6%
-1.3%
-0.5%
Revenue
Donors
New Donors
Rev / Donor
Overall
Retention
1st-Year
Retention
Multi-Year
Retention
Reactivation
Q2 2007 YTD to Q2 2008 YTD
Q2 2008 YTD to Q2 2009 YTD
Fig. 33: Five-Year Animal Welfare Revenue Trends
12-Month Quarter-End Median Change from Q2 2004
25.6%
11.1%
-15%
-5%
5%
15%
25%
35%
Q 2
2 0 0 4
Q 3
2 0 0 4
Q 4
2 0 0 4
Q 1
2 0 0 5
Q 2
2 0 0 5
Q 3
2 0 0 5
Q 4
2 0 0 5
Q 1
2 0 0 6
Q 2
2 0 0 6
Q 3
2 0 0 6
Q 4
2 0 0 6
Q 1
2 0 0 7
Q 2
2 0 0 7
Q 3
2 0 0 7
Q 4
2 0 0 7
Q 1
2 0 0 8
Q 2
2 0 0 8
Q 3
2 0 0 8
Q 4
2 0 0 8
Q 1
2 0 0 9
Q 2
2 0 0 9
Hurricane
Katrina
Animal Welfare
Organizations
Each data point is the median change in revenue for the 12 months ending
in that quarter from the 12 months ending in Q2 2004.
Michael Vick
Indictment
Entire Index
Fig. 34: Five-Year Animal Welfare Donor Trends
12-Month Quarter-End Median Change fr om Q2 2004
9.9%
-5.8%-15%
-5%
5%
15%
25%
35%
Q 2 2 0 0 4
Q 3 2 0 0 4
Q 4 2 0 0 4
Q 1 2 0 0 5
Q 2 2 0 0 5
Q 3 2 0 0 5
Q 4 2 0 0 5
Q 1 2 0 0 6
Q 2 2 0 0 6
Q 3 2 0 0 6
Q 4 2 0 0 6
Q 1 2 0 0 7
Q 2 2 0 0 7
Q 3 2 0 0 7
Q 4 2 0 0 7
Q 1 2 0 0 8
Q 2 2 0 0 8
Q 3 2 0 0 8
Q 4 2 0 0 8
Q 1 2 0 0 9
Q 2 2 0 0 9
Hurricane
Katrina
Animal Welfare
Organizations
Each data point is the median change in revenue for the 12 months ending
in that quarter from the 12 months ending in Q2 2004.
Michael Vick
Indictment
Entire Index

8/14/2019 Index of National Fundraising Performance
http://slidepdf.com/reader/full/index-of-national-fundraising-performance 20/22
Q2 2009 Index of National Fundraising Performance
Copyright 2009 Target Analytics | www.blackbaud.com/targetanalytics 19
References
1. Bureau of Labor Statistics, U.S. Department of Labor. Seasonally adjusted month-end Consumer PriceIndex, U.S. city average, all items. http://www.bls.gov/. Retrieved September 10, 2009.
2. Giving USA Estimates, Giving USA 2006 , pp. 22, 29.
3. National Bureau of Economic Research, December 11, 2008. http://www.nber.org/cycles/dec2008.html.Retrieved March 31, 2009.
4. Bureau of Economic Analysis, U.S. Department of Commerce. Seasonally adjusted quarter-end GrossDomestic Product, indexed to 2000 dollars. http://www.bea.gov/national/index.htm#gdp. RetrievedSeptember 14, 2009.
5. Bureau of Labor Statistics, U.S. Department of Labor. Seasonally adjusted month-end unemployment rate.http://www.bls.gov/. Retrieved September 14, 2009.
6. Standard & Poor’s, Inc. S & P 500 Index month-end close. http://www.standardandpoors.com/indices.Retrieved September 14, 2009.

8/14/2019 Index of National Fundraising Performance
http://slidepdf.com/reader/full/index-of-national-fundraising-performance 21/22
Q2 2009 Index of National Fundraising Performance
Copyright 2009 Target Analytics | www.blackbaud.com/targetanalytics 20
Industry Sectors Used in the Index
Animal Welfare Organizations
Organizations that focus on the care, protection, or understanding of pets or specialty animals, other than
livestock. Includes humane societies, veterinary services, aquariums, and zoos.
Arts & Culture Organizations
Organizations that promote enjoyment or understanding of the visual, performing, folk, or media arts or thehumanities; communications organizations; and organizations that promote the appreciation or understanding ofhistorical events, including historical societies and genealogical or heredity-based organizations.
Environmental Organizations
Programs that focus on the preservation and protection of the environment, including pollution control andabatement programs; conservation and development of natural resources (land, plant, water, energy); control orelimination of hazardous and toxic substances (including pesticides); solid waste management programs;botanical gardens and societies; urban beautification and open spaces programs; and environmental education.Also includes programs that focus primarily on the protection and preservation of wildlife or fisheries.
Health Organizations
Programs which help people achieve and maintain physical well-being through prevention, screening,evaluation and treatment; programs that promote mental health and treatment of mental illness; voluntary healthorganizations that are organized on a national, state or local basis and supported primarily by voluntarycontributions from the public at large, which are engaged in a program of service, education and some researchthat is related to a particular disease, condition or disability, or group of diseases, conditions or disabilities;research institutes and other organizations whose primary purpose is to promote the advancement ofknowledge about specific diseases, disorders, or medical disciplines.
Human Services Organizations
Organizations that promote or provide a broad range of social or human services to individuals or families;organizations that focus on protecting the public from antisocial elements; organizations that help individuals tofind and sustain gainful employment; organizations that focus on the development and improvement of foodresources; organizations that focus on promoting adequate housing for individuals, families and communities;organizations which aim to prevent, predict or control the effects of domestic disasters (e.g., floods,earthquakes, fires, tornadoes); organizations that work to build character and develop leadership and socialskills among children and youth.
International Relief Organizations
Organizations that provide development and relief services to foreign countries and/or organizations that raiseand distribute funds for the benefit of overseas institutions.
Religious Organizations
Programs operated for the purpose of worship, religious training or study, governance or administration of
organized religions, or the promotion of religious activities.
Societal Benefit Organizations
Programs that focus on protecting and promoting the broad civil rights and civil liberties of individuals, improvingrelations between racial, ethnic, and cultural groups, and promoting voter education and registration; advocacyand citizen action groups that work to change public policy and opinion in a variety of areas; organizations thatwork to strengthen, unify, and build community spirit and increase the capacity of various communityorganizations to improve the quality of life for all.
Most sector definitions based on a modification of the Foundation Center’s National Taxonomy of Exempt Entities.http://fdncenter.org/ntee/index.html
8/14/2019 Index of National Fundraising Performance
http://slidepdf.com/reader/full/index-of-national-fundraising-performance 22/22
Q2 2009 Index of National Fundraising Performance
Looking Ahead
The next installment of the index, to be released in January 2010, will examine activity for the thirdquarter of 2009. Findings can be found at http://www.blackbaud.com/targetanalytics.
Index MethodologyTarget Analytics applied the following rules to standardize data from each of the organizationsparticipating in the Index of National Fundraising Performance:
Individual payments greater than $5,000, soft credits, and matching gift payments areexcluded. Direct mail is the dominant or only revenue source for most organizations;however, web, telemarketing, event, and other sources are included. Indicators arecalculated on a cash payment basis, as opposed to a pledge basis. Gifts or donors aredefined as new, retained, or reactivated according to relative gift dates rather thanorganization-specific business rules or source codes. Retention rates for quarterly analysisare calculated by dividing the number of donors giving in the current year-to-date quarter(s)who also gave during the previous calendar year by the total number of donors who gave inthe previous calendar year. Revenue per donor refers to the cumulative giving per donor percurrent period.
About Medians
Unless otherwise noted, index trends are measured by using the median percent change among a groupof organizations. The median is the middle value in a ranked order of numbers. Using this statistic todescribe historical trending minimizes distortion caused by the wide range of organizations’ file sizes orextreme changes at a few organizations.
Participation
Participation in the index is limited to organizations that meet size and geographic requirements as wellas other terms and conditions. For information about index eligibility contact Sue Rock Tully [email protected]. Please direct questions or requests to reproduce these findings to
Online Resources
Participating organizations are granted access to an online, interactive graphical system where they canchart their own performance results against overall and sector-specific medians. Please contact youraccount representative for your password and for more information.
About Target Analytics
Target Analytics, a Blackbaud company, delivers data-driven, collaborative solutions designed to helpnon-profit organizations maximize their fundraising potential. Founded in 1989, Target Analytics was thefirst company to bring forward-thinking non-profit organizations together to establish industry-standardbenchmarking and openly discuss successful strategies and practices.