independent review of the effectiveness of the … · independent review of the effectiveness of...
TRANSCRIPT

e c o n s e a r c h
Commercial-in-Confidence
IInnddeeppeennddeenntt RReevviieeww ooff tthhee EEffffeeccttiivveenneessss ooff tthhee
AAddddiittiioonnaall $$11..5500 BBeeeeff MMaarrkkeettiinngg LLeevvyy
Prepared for:
The Beef Marketing Funding Committee and
Meat and Livestock Australia Limited
Prepared by:
and
15 April 2009
&Associates
WyWARWICK YATES AND ASSOCIATES PTY LTDABNPO Box 10348 Adelaide Street, BRISBANE QLD 4000Telephone : 61-7-3831-8850Fax :- 61-7-3839-8105Email:- warwick.yates@ attglobal.net
:37 107 975 879
Review of the $1.50 Levy Increase for the FTF Program ii
Warwick Yates and Associates Pty Ltd, 2009
TTaabbllee ooff CCoonntteennttss
Executive Summary .................................................................................................................1 1. 1ntroduction ....................................................................................................................6
1.1. Background .......................................................................................................6 1.2. Project Brief.......................................................................................................8 1.3. Report Structure................................................................................................8
2. Funding for the Future Targets, Assumptions and Actual Industry Income ....................9 2.1. Cattle Numbers and Beef Supply Assumptions versus Actuals........................9 2.2. Levy Revenue .................................................................................................12 2.3. Conclusion ......................................................................................................17
3. Demand for Australian Beef and other Market Issues ..................................................18 3.1. Introduction .....................................................................................................18 3.2. Domestic Market .............................................................................................24 3.3. Japan ..............................................................................................................35 3.4. Korea...............................................................................................................51 3.5. United States...................................................................................................67 3.6. Europe and Russia..........................................................................................74 3.7. Middle East .....................................................................................................79 3.8. South East Asia...............................................................................................84 3.9. Live Exports ....................................................................................................91 3.10. Community Concerns Program.......................................................................98
4. Commercial Stakeholders Perceptions of the Effectiveness of the FTF Program ......105 5. Impact on Cattle Prices...............................................................................................114
5.1. Key Drivers of Australian Cattle Prices .........................................................114 5.2. Impact of the $1.50 Levy Increase on Cattle Prices......................................116
6. Conclusions ................................................................................................................122 References ...........................................................................................................................125 Attachment – Consultation List.............................................................................................126

Review of the $1.50 Levy Increase for the FTF Program iii
Warwick Yates and Associates Pty Ltd, 2009
TTaabbllee ooff TTaabblleess
Table 1 Australian cattle and calf slaughtering, 2004-05 to 2007-08 ...........................10 Table 2 Grainfed sector supply profile a .......................................................................10 Table 3 Production of beef and veal, 2003-04 to 2007-08 ...........................................11 Table 4 Volume and value of Australian live cattle exports, 2004-05 to 2007-08 ........12 Table 5 The cattle livestock transaction levy structure prior to the $1.50 increase......12 Table 6 The cattle livestock transaction levy structure, 30 June 2008.........................12 Table 7 The proposed application of marketing funds raised from $1.50 levy
increase...........................................................................................................14 Table 8 Summary levy income, 2004-05 to 2007-08 ...................................................14 Table 9 Detailed levy income, 2004-05 to 2007-08 ($’000) .........................................15 Table 10 MLA beef marketing levy expenditure: actual 2004-05 to 2007-08 and
AOP forecast...................................................................................................16 Table 11 Total expenditure and allocation of marketing levy funds (excluding
external and processor contributions) across all programs.............................17 Table 12 Proposed marketing strategy for the domestic market....................................25 Table 13 Total domestic beef usage and expenditure, Australia ...................................25 Table 14 Per capita consumption of meat, Australia (kg/capita, carcase weight)a.........26 Table 15 Consumer attitudes to beef a...........................................................................29 Table 16 Changing consumer attitudes to red meat in Australia ...................................31 Table 17 Selected KPIs for “Bring out the Beef” and “Kids Love Beef” campaigns .......33 Table 18 Butcher responses to Nov. 2008 test market campaign in Adelaide a ............34 Table 19 Proposed Funding for the Future programs in the Japanese market..............35 Table 20 Australian beef exports to Japan, 2003-04 to 2007-08 ...................................42 Table 21 Changes in consumer perceptions to Aussie Beef, 2002-03 and 2007-08 .....43 Table 22 Additional KPI / Outcomes for 2003 and 2007/08 ...........................................45 Table 23 Improvement in the quality and image of Australian beef in Japan.................47 Table 24 Effectiveness of MLA trade marketing support in Japan.................................47 Table 25 FTF program performance in Japan: summary against original objectives ....50 Table 26 Australian SWOT analysis for the South Korean market ................................56 Table 27 Variations to the original FTF Korean program ...............................................57 Table 28 Korean marketing program performance ........................................................59 Table 29 Beef exports to Europe and Russia (tonnes, shipped weight) ........................75 Table 30 Budget comparison for Europe and Russia, 2005-06 to 2008-09 ($’000).......76 Table 31 Australian SWOT analysis for the Middle East market ...................................80 Table 32 Beef exports to the Middle East and Africa (tonnes, shipped weight).............82 Table 33 Red meat eaters in SE Asia and the Chinas...................................................85
Review of the $1.50 Levy Increase for the FTF Program iv
Warwick Yates and Associates Pty Ltd, 2009
Table 34 Sizing the target market in SE Asia and the Chinas .......................................85 Table 35 Current beef sales volumes in SE Asia and the Chinas..................................86 Table 36 Real target beef consumption in SE Asia and the Chinas ..............................86 Table 37 Target market prioritisation in SE Asia and the Chinas...................................87 Table 38 Beef exports to South East Asia and the Chinas (tonnes, sw)........................87 Table 39 Trade support Asia budget..............................................................................92 Table 40 Volume and value of Australian live cattle exports over the FTF target
years ...............................................................................................................94 Table 41 Live exports to Indonesia, Malaysia and Philippines between 2005 and
2008 ................................................................................................................97 Table 42 Community concern program budget..............................................................99 Table 43 Volume and value of Australian domestic and export beef and live cattle
exports a ........................................................................................................116 Table 44 Estimated annual impact of $1.50 levy increase on demand for beef...........120 Table 45 Estimated impact of $1.50 levy increase on saleyard cattle prices a.............120 Table 46 Estimated impact of $1.50 levy increase on gross farm gate returns ($M) ...121
TTaabbllee ooff FFiigguurreess
Figure 1 Beef production, domestic consumption and exports, Australia, 1994 to 2009a.................................................................................................................9
Figure 2 Live cattle exports, Australia, 1989-90 to 2009-10a.........................................11 Figure 3 Application of additional levy funds raised ......................................................13 Figure 4 MLA’s domestic marketing strategy ................................................................19 Figure 5 MLA’s international marketing strategy ...........................................................20 Figure 6 MLA’s strategic marketing focus .....................................................................21 Figure 7 Australian beef exports by volume and value, 2007-08 ..................................23 Figure 8 Consumption volumes in Japan by protein source .........................................36 Figure 9 Japanese beef consumption: imports and domestic supply............................37 Figure 10 Source of Japanese imports, 1999-00 to 2007-08 ..........................................37 Figure 11 Beef consumption in Japan by market of supply, 2002-03 and 2007-08 ........38 Figure 12 Beef distribution channels in Japan ................................................................38 Figure 13 Japanese beef consumption, forecasts to 2017..............................................39 Figure 14 Australian beef retail shelf space in Japan (%), POS data .............................42 Figure 15 Number of media circulations..........................................................................43 Figure 16 Number of consumer seminar events .............................................................44 Figure 17 Number of Business to Customer E-Magazine registered people (July) ........45 Figure 18 Emergence of different cuts in the South Korean market ...............................52

Review of the $1.50 Levy Increase for the FTF Program v
Warwick Yates and Associates Pty Ltd, 2009
Figure 19 Australian beef exports: manufacturing beef share in selected markets, 2007-08 ...........................................................................................................52
Figure 20 Australian beef exports to South Korea ..........................................................53 Figure 21 Market share of South Korean beef imports ...................................................54 Figure 22 Per capita consumption of beef in Korea, 2003 to 2018 .................................54 Figure 23 Growth in Australian beef exports to Korea, 2002 to 2007 .............................58 Figure 24 Growth of retail outlets for Australian beef 2002 to 2007 ................................60 Figure 25 Increase in the Number of In store Sampling days 2005 and 2007 ...............61 Figure 26 Increase in the Number of HCW packaging stickers 2005 and 2007..............61 Figure 27 Retail market segmentation ............................................................................63 Figure 28 Allocation of Australia marketing dollars in the Korean market.......................64 Figure 29 Comparative retail channel volumes for Australian and competitor beef
in the Korean market.......................................................................................64 Figure 30 Base budget and extra levy income for North America...................................70 Figure 31 Australian beef exports to the United States...................................................71 Figure 32 Australian cattle exports to Indonesia 2002-2008 ...........................................93 Figure 33 Knowledge of the Australian livestock export trade ......................................100 Figure 34 In favour / against of Australian livestock export trade..................................100 Figure 35 Trustworthiness of cattle producers ..............................................................101 Figure 36 Impact on Australian cattle prices of key drivers, 2008.................................116
AAbbbbrreevviiaattiioonnss ABS Australian Bureau of Statistics
ALFA Australian Lot Feeders’ Association
ALIC Agriculture and Livestock Industry Corporation
AMIC Australian Meat Industry Council
AOP Annual Operating Plan
AQIS Australian Quarantine Inspection Service
AUD Australian dollar
AUSKOR FTA Australia-Korea Free Trade Agreement
BIFSC Beef Industry Funding Steering Committee
BOTB Bring out the Beef
BSE Bovine Spongiform Encephalopathy
CIE Centre for International Economics
CIS Commonwealth of Independent States
CPI Consumer Price Index
CSIRO Commonwealth Scientific and Industrial Research Organisation

Review of the $1.50 Levy Increase for the FTF Program vi
Warwick Yates and Associates Pty Ltd, 2009
cw carcass weight
DAFF Department of Agriculture, Fisheries and Forestry
EQA Eating Quality Assured
EU European Union
EUCAS European Union Cattle Accreditation Scheme
FAPRI Food and Agriculture Policy Research Institute
FMD Foot and Mouth Disease
FSIS Food Safety and Inspection Service
FTF Funding for the Future
GDP Gross Domestic Product
GMI Global Meat Industry (model)
HQB High Quality Beef
ICA International Collaborative Agreement
kg kilograms
KLB Kids Love Beef
KORUS FTA Korea-United States Free Trade Agreement
KPI key performance indicator
kt kilotonne
M Million
MAF Ministry of Agriculture and Forestry (South Korea)
MLA Meat and Livestock Australia
MSA Meat Standards Australia
MT metric tonnes
NAFTA North American Free Trade Agreement
NLIS National Livestock Identification System
POS Point of Sale
R&D Research and Development
SE South East
sw shipped weight
t tonnes
UAE United Arab Emirates
UK United Kingdom
US United States
USD United States dollar
USDA United States Department of Agriculture
WCRF World Cancer Research Fund

Review of the $1.50 Levy Increase for the FTF Program
Warwick Yates and Associates Pty Ltd, 2009
1
EExxeeccuuttiivvee SSuummmmaarryy In 2003 the Australian beef industry through the Red Meat Industry Strategy Forum (October 2003) discussed the changing global beef industry dynamic and concluded that the need for the Australian industry to invest in additional market programs should be thoroughly investigated. This conclusion was made against a background of:
• increasing beef production in Australia; • the consumption decline in Japan arising from their Bovine Spongiform
Encephalopathy (BSE) incidents; • the emergence of Brazil as a dominant supplier to world export markets; • increased consumer demand for beef in the Australian domestic market; and • exhausted beef marketing reserves.
Following this investigation the Funding for the Future (FTF) program was designed with the aim of implementing the following programs and investment opportunities:
• Establish a bigger and stronger presence for beef in the domestic market, with expanded nutrition promotion, new beef meal promotion and increased new product activity to boost annual beef consumption by 113,000 tonnes by 2009.
• Maintain a dominant position in the Japanese and Korean markets to counter the return of United States (US) product by consolidating current trade partnerships and fostering new brands and business. Promotion to focus on the natural and delicious image of Aussie Beef. Significant opportunity also exists to continue demand growth in Korea by expanding current programs, developing new and existing brands and promoting a broader range of cuts.
• Recover volumes and improve growth prospects for Australian beef in South-East Asia, and position Australian beef in the emerging China market.
• Further develop live cattle exports into Indonesia and consolidate live trade into the Philippines and Malaysia.
• Support live exports to compete against low priced beef from South America and India, particularly in South-East Asia, and to position Australia as a reputable supplier as the quality grows in the South-East Asian region.
• Further grow demand in the US for both manufacturing and chilled beef by 78,000 tonnes, by undertaking new retail initiatives and partnerships and by containing non-tariff trade barriers, supporting exporters to find and develop sustainable niches.
• Build community understanding to counter misinformation about the cattle industry, particularly regarding environment and animal welfare issues.
This report reviews the FTF program. The terms of reference for the review asked the following questions:-
• What happened to income for the industry and Meat and Livestock Australia (MLA) since the introduction of the $1.50?
• Have the programs referred to in the ‘Funding for the Future’ report been implemented and were there variations and why?
• How have the market assumptions varied from the actuals and what are the implications?
• Has the additional beef marketing levy generated benefits to the industry?
Review of the $1.50 Levy Increase for the FTF Program
Warwick Yates and Associates Pty Ltd, 2009
2
In undertaking the review the Review team completed the following activities: • a comprehensive desktop review of program materials supplied by MLA; • consultation with key regional market managers of MLA particularly in the Australian
domestic market, Japan, South Korea, South East Asia/the Chinas, United States, EU/Russia and the Middle East/Africa;
• in-market investigation in the Japanese and Korean markets; and • consultation with key Australian meat processors, exporters and retailers.
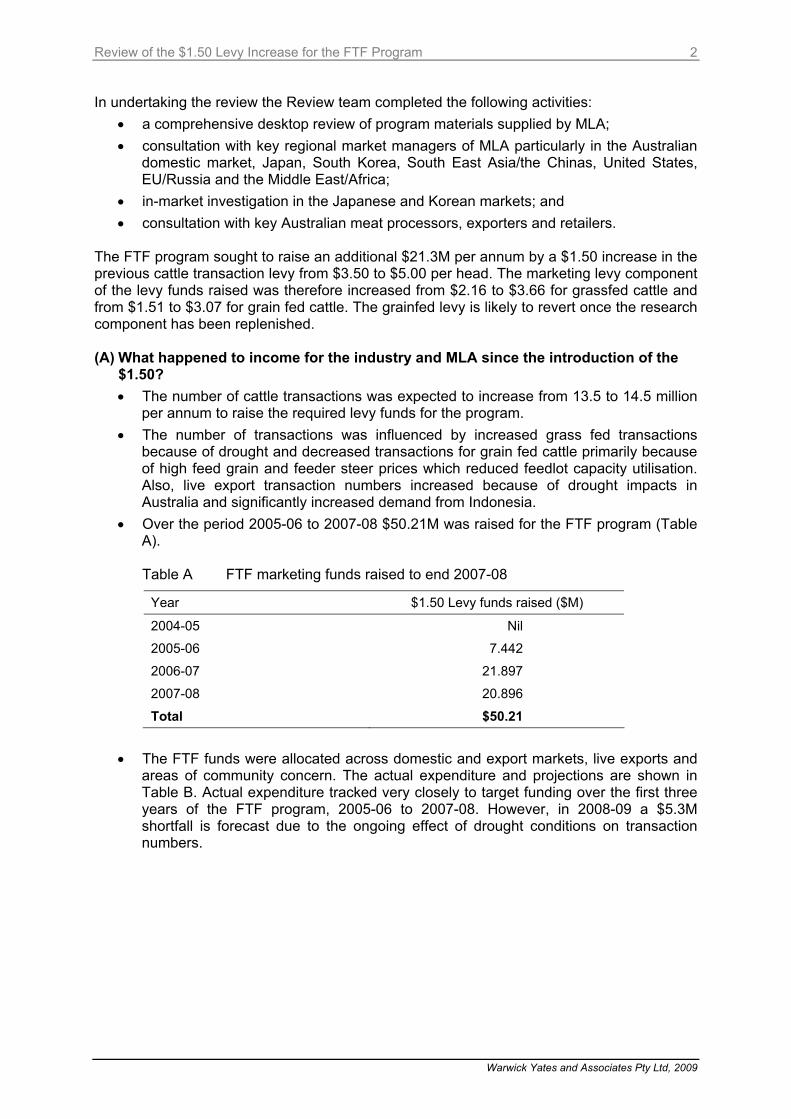
The FTF program sought to raise an additional $21.3M per annum by a $1.50 increase in the previous cattle transaction levy from $3.50 to $5.00 per head. The marketing levy component of the levy funds raised was therefore increased from $2.16 to $3.66 for grassfed cattle and from $1.51 to $3.07 for grain fed cattle. The grainfed levy is likely to revert once the research component has been replenished. (A) What happened to income for the industry and MLA since the introduction of the
$1.50? • The number of cattle transactions was expected to increase from 13.5 to 14.5 million
per annum to raise the required levy funds for the program. • The number of transactions was influenced by increased grass fed transactions
because of drought and decreased transactions for grain fed cattle primarily because of high feed grain and feeder steer prices which reduced feedlot capacity utilisation. Also, live export transaction numbers increased because of drought impacts in Australia and significantly increased demand from Indonesia.
• Over the period 2005-06 to 2007-08 $50.21M was raised for the FTF program (Table A). Table A FTF marketing funds raised to end 2007-08
Year $1.50 Levy funds raised ($M)
2004-05 Nil
2005-06 7.442
2006-07 21.897
2007-08 20.896
Total $50.21
• The FTF funds were allocated across domestic and export markets, live exports and areas of community concern. The actual expenditure and projections are shown in Table B. Actual expenditure tracked very closely to target funding over the first three years of the FTF program, 2005-06 to 2007-08. However, in 2008-09 a $5.3M shortfall is forecast due to the ongoing effect of drought conditions on transaction numbers.

Review of the $1.50 Levy Increase for the FTF Program
Warwick Yates and Associates Pty Ltd, 2009
3
Table B MLA beef marketing levy expenditure allocation: actual 2004-05 to 2007-08 and forecast 2008-09
2004-05 $M
2005-06 $M
2006-07 $M
2007-08 $M
2008-09a $M
Domestic Marketing 8.30 11.60 18.50 17.20 15.10
Export Marketing 15.10 17.20 22.90 22.90 19.70
Live Export (levy only) 0.80 0.90 2.20 2.00 1.90
Community Concerns 0.80 0.90 1.00 0.80
Total FTF 24.20 30.50 44.50 43.10 37.50 Total FTF Target 22.90 30.30 44.80 43.80 42.80
a AOP forecast.
• In all cases the expenditure of FTF funds was submitted to industry advisory committees for approval before expenditure occurred to ensure the appropriate level of governance and transparency of industry levy payer funds.
(B) Have the programs referred to in the ‘Funding for the Future’ report been
implemented and were there variations and why? • The majority of programs referred to in the Funding for the Future Report were
implemented. There were annual programs reviews and adjustment made to operating plans and budgets in light of prevailing market conditions, program performance and the desire to achieve the best possible market return for the FTF funds.
• Another significant variation was the need to accommodate previous R&D Program funded projects i.e., Meat Standards Australia (MSA) and National Livestock Identification System (NLIS) that were incorporated in the marketing budget because they were no longer eligible for Federal Government matching R&D funds.
• The International Collaborative Agreement (ICA) program as originally envisaged was incorporated into each of the target geographic markets. This program has been redesigned on a global basis.
• The report examines each geographic market in detail and arrives at conclusions as to the efficacy of the FTF program in those markets.
(C) How have the market assumptions varied from the actuals and what are the implications?
• On the beef supply side: The base assumption of increased domestic beef production of 335,000 tonnes undershot by 213,800 tonnes due primarily to drought and decreased feedlot capacity utilisation.
• On the market side: Market assumptions varied on a market-by-market basis because of:
o the ongoing knock on effect of consumer fears about BSE, especially in North Asian markets;
o the significant emergence of the Russian market, market access issues and political shut down of that market in 2008;
o the continued growth of the Chinas market;

Review of the $1.50 Levy Increase for the FTF Program
Warwick Yates and Associates Pty Ltd, 2009
4
o the impact of a surging Australian dollar in 2007 and 2008;
o high grain and feeder steer prices impacting on the supply of grain fed beef to domestic and export markets in 2007 and 2008; and
o the need to modify programs with the re-entry of the US, particularly in the Japanese and Korea markets.
The implications of changes in those market assumptions were that annual operating plans had to be reviewed and amended with budgets reallocated to those areas where MLA and its industry advisory committees deemed that the funds would be spent most wisely. (D) Has the additional beef marketing levy generated benefits to the industry? From the investigations and analysis undertaken for this review the following observations and conclusions can be made.
• Despite the over-estimation of future beef production, the implementation of the FTF program has enabled the Australian beef industry to accommodate an increased level of volatility in world beef markets and to stimulate demand, especially from importers in key Japanese, Korean and Indonesian markets.
• One would not normally expect that all targets would be achieved given the normal volatility of export and domestic markets. Indeed that was the case but overall the program has been a success in achieving most of its targets and in many cases exceeding expectations. Australia has effectively capitalised on the absence of North American exporters in Pacific Rim markets and secured a preferred supplier status that augurs well for the future as the US returns to these markets.
• The FTF funding has enhanced the evolution of the Australian beef industry from the status of commodity beef marketer under a $2.16 per head marketing levy regime to that of an effective niche marketer in the global market with a $3.66 marketing levy.
• The additional marketing levy funds by way of the FTF program has been a wise and prudent investment and is returning significant financial benefits to the Australian beef industry as evidenced by the increased aggregate and per capita expenditure on beef in domestic market. This was also the consensus view of key Australian exporters consulted during this review.
• As long as the additional marketing funds are well targeted and their application is cost effective, $3.66 per head is a relatively cheap marketing cost. That level of funding enables Australia to position itself for a significant share of beef consumption increases in North Asian and South East (SE) Asian markets as economic recovery occurs. To reduce the beef marketing levy to pre FTF levels would simply “gift” market share and subsequent export market volumes to North American and South American competitors in Pacific Rim markets. It is possible a similar impact would be felt over time in the domestic market with loss of market share to competitor proteins.
• The global beef industry is undergoing significant change with increased consolidation and rationalisation across the production, processing and retail sectors. This trend presents significant challenges for MLA as the major global businesses have well developed marketing divisions and market intelligence. MLA has addressed the issue by use of the ICA program but needs to strategically work through how its operations can effectively complement the marketing activities of major exporters to mutual benefit.

Review of the $1.50 Levy Increase for the FTF Program
Warwick Yates and Associates Pty Ltd, 2009
5
• The Community Benefits and Industry Integrity program is helping position Australian beef producers as credible in the eyes of domestic consumers and the live export industry for continuing to counter the claims of animal rights activist with facts about the live export industry. As community focus intensifies on the management of natural resources and concerns grow for animal welfare, it will be increasingly important not only to address these issues but also to inform the public of the broader story of integrity behind the beef industry.
• Having created a competitive position, particularly in markets such as South Korea, it makes little sense to reduce marketing expenditure in these markets given the current and expected ongoing volatility in a highly competitive global meat marketing environment. Providing advice on increasing, maintaining or reducing the transaction levy funds in the future is not within the terms of reference of this report. However, the following observations can be made:
o marketing levy funds are not CPI adjusted;
o real marketing expenditure is therefore declining over time;
o projects requiring significant ongoing funding such as NLIS have lost their R&D funding status and now draw on marketing funds; and
o the volatility and unpredictability of the AUD/USD exchange rate is likely to continue in the short term at least.
• Overall, the Funding for the Future Program has been a success in terms of reaching most of its targets in domestic and export markets. Allocation of levy funds to accelerate marketing programs in established and new, emerging markets has placed Australia in a strong competitive position to weather the return of the US to key Pacific Rim markets and to fight potential competitive threats from other beef exporting countries.
• Modelling the estimated changes in consumer demand resulting from the increased marketing activity showed that in 2008, under a medium impact scenario, saleyard prices for grass fed cattle increased by 1.8%, while prices for grain fed and live export cattle were 1.5% higher than they would have otherwise been without the $1.50 increase in the marketing levy. Similar price impacts were estimated for 2006 and 2007.
• These positive price effects, attributable to the increased marketing activity in all major markets, realised an industry level return of approximately $112M (low to high range of $67M to $170M) in 2008. This impact was comprised of an estimated $80M increase in gross income to the grass fed sector, $25M to the grain fed sector and $7M to producers of live export cattle.
• The beef industry investment of $50.2 million in additional marketing activities across the Funding for the Future Program life to date has returned an estimated total of $275M to the industry (medium estimate, farm gate value).

Review of the $1.50 Levy Increase for the FTF Program
Warwick Yates and Associates Pty Ltd, 2009
6
11.. 11nnttrroodduuccttiioonn 11..11.. BBaacckkggrroouunndd In 2003 the Australian beef industry through the Red Meat Industry Strategy Forum (October 2003) discussed the changing global beef industry dynamic and concluded that the need for the Australian industry to invest in additional market programs should be thoroughly investigated. This conclusion was made against a background of:
• increasing beef production in Australia;
• the consumption decline in Japan arising from their BSE incidents;
• the increasing emergence of Brazil as a dominant supplier to world export markets;
• increased consumer demand for beef in the Australian domestic market; and
• exhausted beef marketing reserves. The other concern at the time was the erosion in real levy value, stated as follows (BIFSC 2005a): “Further, the value of the current levy arrangement has diminished by 31% since the rate was set in 1994, and will continue to decline into the future. Beef levies for marketing, including processing sector contributions, currently represent 0.35% of livestock value – the lowest level since beef industry marketing campaigns commenced in 1985. At 0.35%, this is very modest in comparison with other commodities, and even more modest in comparison to processed food marketers with whom we compete for the food dollar. Typical brand advertising allocations for major Australian food companies are around 5% of value.” A Beef Industry Funding Steering Committee (BIFSC) of industry leaders was formed to further investigate these concerns. The culmination of their deliberations was the Funding for the Future document produced in April 2005 (BIFSC 2005a). It is worthwhile reconsidering the circumstances at the time that led to the Funding for the Future (FTF) program as reflected in the remarks of the Chairman of the BIFSC: “Australia’s cattle industry is at a pivotal point in its history, facing challenges and opportunities we have not seen before. After many years of hard work in improving efficiency, coping with drought and changing market requirements, we’re enjoying a period of unprecedented industry investment, good prices and strong demand for our product. However, unless we act now to secure existing markets for our beef and cattle and develop new market opportunities, our research shows that an imbalance in supply and demand by the year 2009 could impact on cattle prices. I am the Chairman of the Beef Industry Funding Steering Committee, formed to address concerns of the Cattle Council of Australia and the industry generally about the future for Australian cattle producers. Our 10- man committee of producers, feedlotters and processors has considered global production and demand forecasts, and confirmed some worrying trends as well as some exciting opportunities. This document forms a summary of our report, Funding for the Future. Our research found:
• The US is rebuilding its herd and is preparing to re-enter global beef markets with a well financed marketing campaign.

Review of the $1.50 Levy Increase for the FTF Program
Warwick Yates and Associates Pty Ltd, 2009
7
• Beef production in Brazil, with a current herd of 165 million head, continues to rapidly increase, with a growing focus on securing new export customers, posing a direct threat to Australia’s traditional beef markets.
• Domestic production is forecast to increase by an additional 335,000 tonnes by 2009, meaning that if growth in demand does not match this extra production, cattle prices are forecast to fall by 15% per head (based on historic average figures).
The industry has enjoyed significant success with its promotional investment over recent years. On the domestic market, the downward trend has been reversed, with both retail prices and consumption increasing. Export programs in Japan and Korea have established Australian beef strongly in these markets, allowing us to capitalise on the absence of the US in these markets over the last 15 months. However, being 10 years since the last change in cattle levies, industry marketing reserves have been run down. Without additional investment the industry will not be able to maintain its current level of promotion, putting our markets and future beef prices at risk. The committee believes the time is right to increase the industry’s investment in the future. They found that a further $21.3m per year is required for market development and promotion. This would be achieved by raising the cattle transaction levies by $1.50 per head. The committee found this level sufficient to fund the promotional programs needed to safeguard the industry’s future” (BIFSC 2005b). The FTF program was designed with aim of implementing the following programs and investment opportunities:
• Establish a bigger and stronger presence for beef in the domestic market, with expanded nutrition promotion, new beef meal promotion and increased new product activity to boost annual beef consumption by 113,000 tonnes by 2009.
• Maintain a dominant position in the Japanese and Korean markets to counter the return of US product by consolidating current trade partnerships and fostering new brands and business. The industry will further promote the natural and delicious image of Aussie Beef. Significant opportunity also exists to continue demand growth in Korea by expanding current programs, developing new and existing brands and promoting a broader range of cuts.
• Recover volumes and improve growth prospects for Australian beef in South-East Asia, and position Australian beef in the emerging China market to expand consumption volumes by 112,000 tonnes by 2009.
• Further develop live cattle exports into Indonesia and consolidate live trade into the Philippines and Malaysia.
• Support live exports to compete against low priced beef from South America and India, particularly in South-East Asia, and to position Australia as a reputable supplier as the quality grows in the South-East Asian region.
• Further grow demand in the US for both manufacturing and chilled beef by 78,000 tonnes, by undertaking new retail initiatives and partnerships and by containing non-tariff trade barriers, supporting exporters to find and develop sustainable niches.
• Build community understanding to counter misinformation about the cattle industry, particularly regarding environment and animal welfare issues (BIFSC 2005b).
Review of the $1.50 Levy Increase for the FTF Program
Warwick Yates and Associates Pty Ltd, 2009
8
11..22.. PPrroojjeecctt BBrriieeff This report aims to provide an overall review of the use of MLA beef marketing levy since 1 January 2006, with particular reference to the additional $1.50 received from this date. The review examines the following questions set out in the project brief:
• What happened to income for the industry and MLA since the introduction of the $1.50?
• Have the programs referred to in the ‘Funding for The Future’ report been implemented and were there variations and why?
• How have the market assumptions varied from the actuals and what are the implications?
• Has the additional beef marketing levy generated benefits to the industry? In undertaking the review the Review team completed the following activities:
• a comprehensive desktop review of program materials supplied by Meat and Livestock Australia;
• consultation with key regional market managers of MLA particularly in the Australian domestic market, Japan, South Korea, South East Asia/the Chinas, United States, European Union (EU)/Russia and the Middle East/Africa;
• in-market investigation in the Japanese and Korean markets; and
• consultation with key Australian meat processors, exporters and retailers. 11..33.. RReeppoorrtt SSttrruuccttuurree The remainder of the report is set out in the following five sections:
Section 2 Funding for the Future Targets: outlines the breakdown of the transaction levy before and after the $1.50 increase, funding projections and the underlying production assumptions.
Section 3 Demand for Australian beef and other market issues: includes market-by-market analysis, programs and performances.
Section 4 Commercial stakeholders perceptions of the effectiveness of the FTF program: summarises the comments of processors, exporters and retailers on the successes and highlights of the programs, what could have been done better, and impacts of the $1.50 increase in the levy.
Section 5 Impact on cattle prices: discusses drivers of cattle prices over the FTF program period drawing on a recent Centre for International Economics (CIE) report commissioned by MLA.
Section 6 Conclusions: makes conclusions about the effectiveness of the FTF program.

Review of the $1.50 Levy Increase for the FTF Program
Warwick Yates and Associates Pty Ltd, 2009
9
22.. FFuunnddiinngg ffoorr tthhee FFuuttuurree TTaarrggeettss,, AAssssuummppttiioonnss aanndd AAccttuuaall IInndduussttrryy IInnccoommee
22..11.. CCaattttllee NNuummbbeerrss aanndd BBeeeeff SSuuppppllyy AAssssuummppttiioonnss vveerrssuuss AAccttuuaallss In this section the main factors affecting supply and, therefore, the number of transactions are overviewed for grass fed, grain fed and live export cattle. The FTF program assumption was that domestic beef production would increase by 335,000 tonnes by 2009. Cattle Numbers Australia’s cattle herd was estimated to be 27.8 million as at June 2005. Forecast growth in numbers was revised down slightly in 2007 and 2008 due to continuing dry weather and the profitability of alternative enterprises in the southern areas of Australia. Numbers at the start of 2008 were revised down from 29.2 million to 28.1 million and at the end of 2008 from 29.9 million to 28.3 million. Numbers at the end of June 2009 are now forecast to be 28.6 million, a rise of 780,000 over the year due to better pastoral conditions in northern Australia (McRae et al 2009). Beef Production Figure 1 shows Australian beef production, consumption and exports between 1994 and 2009. A key feature is the steady increase in production up until the drought impacts from 2006 onwards. Exports similarly have increased but have been relatively steady since 2006 because of drought induced reduced supply, lower feedlot utilisation rates because of increased grain prices and the impact of the increasing Australian dollar relative to the US dollar. Exports are forecast to rise slightly in 2009. Figure 1 Beef production, domestic consumption and exports, Australia, 1994 to 2009a
400
600
800
1,000
1,200
1,400
1,600
1,800
2,000
2,200
2,400
1993-94
1994-95
1995-96
1996-97
1997-98
1998-99
1999-00
2000-01
2001-02
2002-03
2003-04
2004-05
2005-06
2006-07
2007-08
e
2008-09
f
Year (ending Decem ber)
Thou
sand
tonn
es (c
w)
ProductionExports Dom estic
a 2008 estimates, 2009 forecasts Source: MLA

Review of the $1.50 Levy Increase for the FTF Program
Warwick Yates and Associates Pty Ltd, 2009
10
After growing almost constantly since 1996, Australia’s beef production fell for the second year in a row in 2008 although it is forecast to recover slightly (by 2%) in 2009. Both the number of cattle slaughtered and slightly lighter slaughter weights contributed to this fall. As a result beef exports also declined in 2007 but recovered to increase by 1.7% (24kt cw) in 2008 and are forecast to increase again in 2009 by 48kt to 1,462kt. After increasing steadily over the period 2004 to 2007, domestic consumption is forecast to be lower in both 2008 and 2009. Longer term forecasts indicate moderate growth out to 2013. Although production was close to a record in 2007, its fall in 2008 possibly signifies a potential plateau in production until the grain feeding dilemma is resolved. Grain feeding beef may be restricted by higher grain prices generally. If world markets remain buoyant then prices will need to remain firm to make grain feeding profitable. With consumption relatively stable the drop in production has restricted the expected increase in exports. This is not from a lack of demand but from a shortage of supply as markets still appear to exist for further exports if the beef was available. As a result of these trends and providing consumption holds to forecast levels in 2009, the prospects for good prices for beef are promising. The only caveat on this is the unknown impact, both depth and length, of the world recession. Tables 1 and 2 show the quantitative impact of drought on Australian cattle slaughterings over the FTF program period with feedlot slaughtering declining significantly while grass fed slaughtering increased. Table 1 Australian cattle and calf slaughtering, 2004-05 to 2007-08
Year Cattle & calf slaughtering (‘000 head)
Grain fed cattle (‘000 head)
Grass fed cattle (‘000 head)
2004-05 8,853 2,462 6,391
2005-06 8,401 2,588 5,813
2006-07 9,081 2,669 6,412
2007-08 8,799 2,066 6,733 Source: Australian Bureau of Statistics (ABS), Australian Lot Feeders’ Association (ALFA) and MLA Table 2 Grainfed sector supply profile a
Domestic (%) Export (%) Export Domestic Unknown
2005 35.5 64.5 445,116 245,088 20,968 711,172
2006 34.9 65.1 576,905 308,634 54,558 940,097
2007 31.3 68.7 588,623 267,664 13,738 870,025
2008 25.9 74.9 500,993 175,146 9,617 685,756
% of cattle for:b Number of cattle intended for:Year Total
a Based on June quarter returns. b Excludes unknown category. Source: MLA (2008)
Review of the $1.50 Levy Increase for the FTF Program
Warwick Yates and Associates Pty Ltd, 2009
11
Beef and veal production increased due to productivity gains and increased carcase weights. Table 3 Production of beef and veal, 2003-04 to 2007-08
Year Beef and veal (‘000 tonnes)2003-04 2,032.92004-05 2,162.02005-06 2,077.12006-07 2,226.32007-08 2,154.1
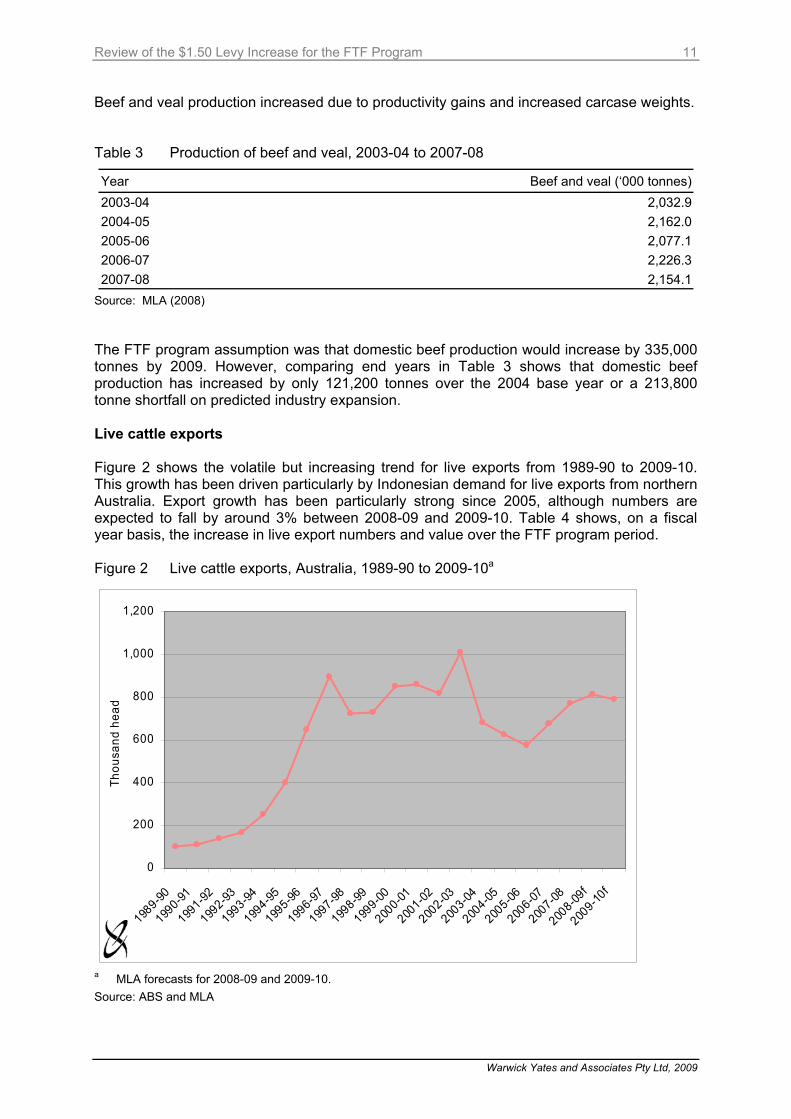
Source: MLA (2008) The FTF program assumption was that domestic beef production would increase by 335,000 tonnes by 2009. However, comparing end years in Table 3 shows that domestic beef production has increased by only 121,200 tonnes over the 2004 base year or a 213,800 tonne shortfall on predicted industry expansion. Live cattle exports Figure 2 shows the volatile but increasing trend for live exports from 1989-90 to 2009-10. This growth has been driven particularly by Indonesian demand for live exports from northern Australia. Export growth has been particularly strong since 2005, although numbers are expected to fall by around 3% between 2008-09 and 2009-10. Table 4 shows, on a fiscal year basis, the increase in live export numbers and value over the FTF program period. Figure 2 Live cattle exports, Australia, 1989-90 to 2009-10a
0
200
400
600
800
1,000
1,200
1989-90
1990-91
1991-92
1992-93
1993-94
1994-95
1995-96
1996-97
1997-98
1998-99
1999-00
2000-01
2001-02
2002-03
2003-04
2004-05
2005-06
2006-07
2007-08
2008-09
f
2009-10
f
Thou
sand
hea
d
a MLA forecasts for 2008-09 and 2009-10. Source: ABS and MLA
Review of the $1.50 Levy Increase for the FTF Program
Warwick Yates and Associates Pty Ltd, 2009
12
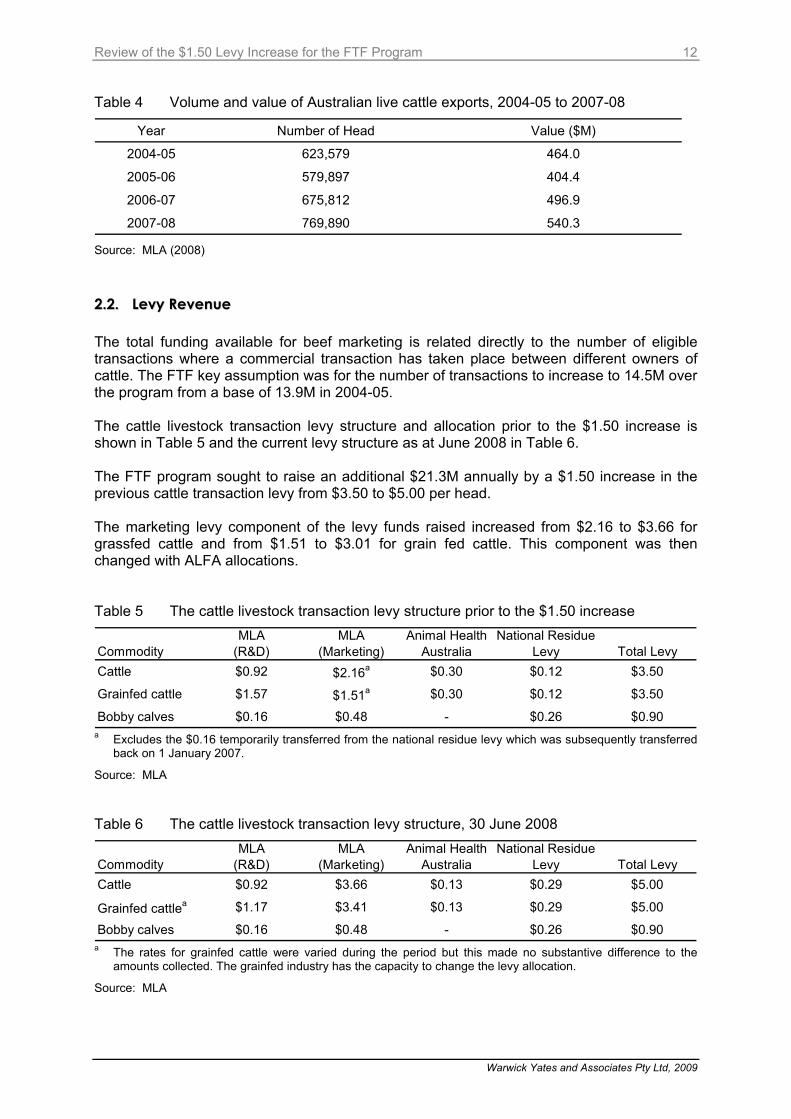
Table 4 Volume and value of Australian live cattle exports, 2004-05 to 2007-08
Year Number of Head Value ($M)
2004-05 623,579 464.0
2005-06 579,897 404.4
2006-07 675,812 496.9
2007-08 769,890 540.3 Source: MLA (2008) 22..22.. LLeevvyy RReevveennuuee The total funding available for beef marketing is related directly to the number of eligible transactions where a commercial transaction has taken place between different owners of cattle. The FTF key assumption was for the number of transactions to increase to 14.5M over the program from a base of 13.9M in 2004-05. The cattle livestock transaction levy structure and allocation prior to the $1.50 increase is shown in Table 5 and the current levy structure as at June 2008 in Table 6. The FTF program sought to raise an additional $21.3M annually by a $1.50 increase in the previous cattle transaction levy from $3.50 to $5.00 per head. The marketing levy component of the levy funds raised increased from $2.16 to $3.66 for grassfed cattle and from $1.51 to $3.01 for grain fed cattle. This component was then changed with ALFA allocations. Table 5 The cattle livestock transaction levy structure prior to the $1.50 increase
CommodityMLA
(R&D) MLA
(Marketing)Animal Health
AustraliaNational Residue
Levy Total LevyCattle $0.92 $2.16a $0.30 $0.12 $3.50
Grainfed cattle $1.57 $1.51a $0.30 $0.12 $3.50
Bobby calves $0.16 $0.48 - $0.26 $0.90 a Excludes the $0.16 temporarily transferred from the national residue levy which was subsequently transferred
back on 1 January 2007.
Source: MLA Table 6 The cattle livestock transaction levy structure, 30 June 2008
CommodityMLA
(R&D) MLA
(Marketing)Animal Health
AustraliaNational Residue
Levy Total LevyCattle $0.92 $3.66 $0.13 $0.29 $5.00
Grainfed cattlea $1.17 $3.41 $0.13 $0.29 $5.00
Bobby calves $0.16 $0.48 - $0.26 $0.90 a The rates for grainfed cattle were varied during the period but this made no substantive difference to the
amounts collected. The grainfed industry has the capacity to change the levy allocation.
Source: MLA

Review of the $1.50 Levy Increase for the FTF Program
Warwick Yates and Associates Pty Ltd, 2009
13
2004-05 Base Case
13.5 M Cattle sale transactions
$3.50 transaction levy unchanged since 1994 with $2.16 grass fed & $1.51 grain fed to MLA
$22.9M To marketing
Domestic Market $8.3M
Export Market$14.6M
Incl Live Export
Market Value $10.224B
Market Tonnage
Production trends ,Exchange rate, Drought, Market access quotas, Competitor foods, Competitor countries , Consumer trends Supply and Demand shifters impact on sales volumes and prices
Additional $1.50/head on transaction levy dedicated to marketing 0ver 5 years to 2009
14 M Cattle sale transactions
$5.00 transaction levy raises additional $21.3M
$44,2M to marketing
Additional Domestic and export market targets plus community relations
Additional Market Value
Additional Market tonnage (335,000t)
Levy balance to Animal health, R&D & national residue survey
Processing sector ($2.0M)
The context of the application of the additional marketing levy funds raised is shown in Figure 3. Figure 3 Application of additional levy funds raised
It should be noted that industry levy funds are not adjusted to changes in consumer price index or inflation. The FTF committee noted in its deliberations that, if the levies were indexed to inflation in 1994, they would currently be $4.73 per head, and $5.32 by 2009 assuming a 3% inflation rate (BIFSC 2005a, p. 68). In effect without indexation real expenditure on marketing activities decreases in line with inflation. This expenditure is also impacted by movements in currency relativities in the respective markets where MLA has marketing development programs. This matter needs to be seriously considered in future funding deliberations by MLA and industry levy payers wanting to engage in strategic marketing activities. Table 7 shows the proposed application of levy funds received by key market areas based on FTF assumptions.
Review of the $1.50 Levy Increase for the FTF Program
Warwick Yates and Associates Pty Ltd, 2009
14
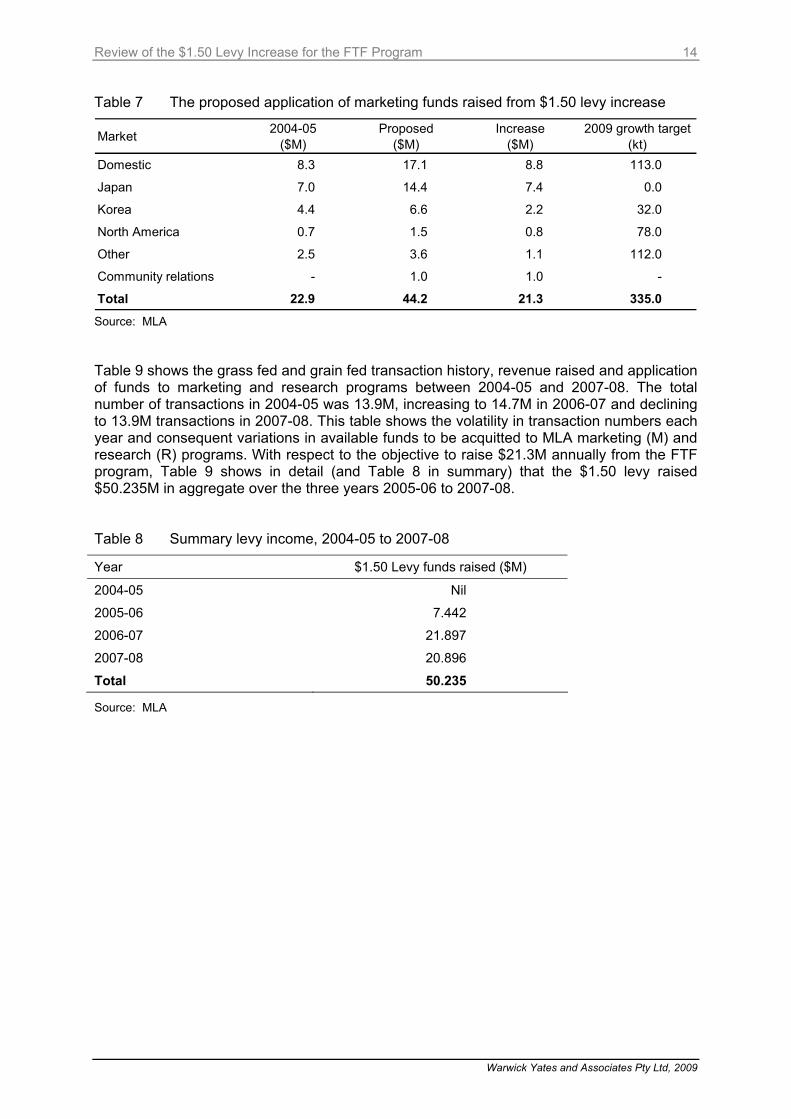
Table 7 The proposed application of marketing funds raised from $1.50 levy increase
Market 2004-05 ($M)
Proposed ($M)
Increase ($M)
2009 growth target (kt)
Domestic 8.3 17.1 8.8 113.0
Japan 7.0 14.4 7.4 0.0
Korea 4.4 6.6 2.2 32.0
North America 0.7 1.5 0.8 78.0
Other 2.5 3.6 1.1 112.0
Community relations - 1.0 1.0 -
Total 22.9 44.2 21.3 335.0 Source: MLA Table 9 shows the grass fed and grain fed transaction history, revenue raised and application of funds to marketing and research programs between 2004-05 and 2007-08. The total number of transactions in 2004-05 was 13.9M, increasing to 14.7M in 2006-07 and declining to 13.9M transactions in 2007-08. This table shows the volatility in transaction numbers each year and consequent variations in available funds to be acquitted to MLA marketing (M) and research (R) programs. With respect to the objective to raise $21.3M annually from the FTF program, Table 9 shows in detail (and Table 8 in summary) that the $1.50 levy raised $50.235M in aggregate over the three years 2005-06 to 2007-08. Table 8 Summary levy income, 2004-05 to 2007-08
Year $1.50 Levy funds raised ($M)
2004-05 Nil
2005-06 7.442
2006-07 21.897
2007-08 20.896
Total 50.235
Source: MLA

Review of the $1.50 Levy Increase for the FTF Program
Warwick Yates and Associates Pty Ltd, 2009
15
Table 9 Detailed levy income, 2004-05 to 2007-08 ($’000)
Year Grassfed Grainfed Total
Trans No. (‘000) M R Total Trans No.
(‘000) M R Total Trans No. (‘000) M R Total
04-05 Levy 11,834.8 2,6717 10,888 37,605 2,083.5 3,964 3,271 7,235 13,918.3 30,681 14,159 44,840 Other 365 122 487 31 17 48 334 105 439 Total 11,834.8 27,082 11,010 38,092 2,083.5 3,933 3,254 7,187 13,918.3 31,015 14,264 45,279 05-06 Levy (old) 7,729.4 17,932 7,111 25,043 1,698.9 2,837 1,506 4,343 9,428.3 20,769 8,617 29,386 Levy (new base) 4,317.7 10,017 3,972 13,989 643.3 1,634 450 2,084 4,961.0 11,651 4,422 16,073 Levy ($1.50) 6,477 6,477 965 965 7,442 7,442 Other 377 118 495 5 4 9 382 122 504 Total 12,047.1 34,803 11,201 46,004 2,342.2 5,441 1,960 7,401 14,389.3 40,244 13,161 53,405 06-07 Levy (old) 61.9 144 57 201 61.9 144 57 201 Levy (new base) 12,464.1 28,225 11,467 39,692 2,134.4 5,465 1,257 6,722 14,598.5 33,690 12,724 46,414 Levy ($1.50) 18,696 18,696 3,201 3,201 21,897 21,897 Other 348 114 462 3 1 4 351 115 466 Total 12,526.0 47,413 11,638 59,051 2,134.4 8,669 1,258 9,927 14,660.4 56,082 12,896 68,978 07-08 Levy (old) 1.2 3 1 4 1.2 3 1 4 Levy (new base) 12,225.7 26,408 11,247 37,655 1,704.6 4,398 853 5,251 13,903.3 30,806 12,100 42,906 Levy ($1.50) 18,339 18,339 2,557 2,557 20,896 20,896 Other 361 119 480 4 1 5 365 120 485 Total 12,226.9 45,111 11,367 56,478 1,704.6 6,959 854 7,813 13,931.5 52,070 12,221 64,291
Source: MLA

Review of the $1.50 Levy Increase for the FTF Program
Warwick Yates and Associates Pty Ltd, 2009
16
Actual expenditure for the period 2005-06 to 2007-08 has largely been in line with that outlined in the FTF document. However, as a result of a forecast drop in cattle transactions expected at the time the Annual Operating Plan (AOP) for 2008-09 was prepared and the continuing increase in the demand for and cost of other programs, the AOP shows an aggregate drop of $5.3m in planned expenditure across those programs targeted in the FTF document (Table 10). Table 10 MLA beef marketing levy expenditure: actual 2004-05 to 2007-08 and AOP
forecast
Actual Expenditure AOP Forecast
2004-05 $M
2005-06 $M
2006-07 $M
2007-08 $M
2008-09 $M
Domestic Marketing a 8.30 11.60 18.50 17.20 15.10
Export Marketing 15.10 17.20 22.90 22.90 19.70
Live Export (levy only) 0.80 0.90 2.20 2.00 1.90
Community Concerns 0.80 0.90 1.00 0.80
Total FTF 24.20 30.50 44.50 43.10 37.50 Total FTF Target 22.90 30.30 44.80 43.80 42.80 a Including processor contributions to domestic marketing.
Source: MLA Table 11 sets out the total expenditure of all the marketing levy funds (excluding external and processor contributions) across all programs. Expenditure on a number of key programs and support costs that are funded by marketing levies increased by $6.6M during the period with the major increases occurring in the Meat Safety/Issues Management (+$1.8M) and Eating Quality/MSA (+$1.8M) programs. These increases are primarily the result of the programs no longer being classified as R&D and therefore requiring funding through marketing levies.

Review of the $1.50 Levy Increase for the FTF Program
Warwick Yates and Associates Pty Ltd, 2009
17
Table 11 Total expenditure and allocation of marketing levy funds (excluding external and processor contributions) across all programs
Marketing Levy Funds Actual Expenditure AOP
2003-04$M
2004-05$M
2005-06$M
2006-07 $M
2007-08 $M
2008-09$M
Domestic Marketing 6.7 6.3 9.0 16.8 15.4 13.3Export Marketing 12.4 14.6 17.2 22.2 21.0 19.7Live Exports 0.8 0.8 0.9 2.2 2.0 1.9Community Concerns 0.8 0.9 1.0 0.8Total FTF expenditure 19.9 21.7 27.9 42.1 39.4 35.7 Market Access 1.0 0.8 0.9 1.0 0.9 1.0Meat Safety/Issues Management 1.5 1.4 2.2 1.3 1.9 3.2Eating Quality/MSA 1.6 1.4 1.8Market Information 1.1 1.0 1.1 1.3 1.1 1.1Ausmeat 0.5 0.5 0.5 0.5 0.5 0.5Industry and Corporate Communication 0.9 0.9 1.3 1.3 1.9 1.7
Corporate Services and Levy Collection costs 1.9 2.1 2.9 4.2 4.0 4.2
Sub Total- Other Programs 6.9 6.7 8.9 11.2 11.7 13.5 Foreign Exchange gain -0.8 -0.9 -0.9 -1.0 Total Beef Marketing Expenditure-Levy Funds 26.8 27.6 35.9 52.4 50.1 49.2 Total Beef Marketing Income-Levy Funds 29.6 31.1 40.2 56.0 52.1 48.0 Movement in Reserves 2.8 3.5 4.3 3.6 2.0 -1.2
Source: MLA The increase in Corporate Services (+$2.3M) and Communication (+$0.8M) is largely as a result of the increase in levy revenue as these costs are allocated across species based on levy income. In addition, in 2006 MLA made a major investment in an organisation wide IT system replacing the legacy systems which were outdated. In all cases allocations to marketing program areas were approved by industry advisory committees before the funds were committed by MLA. It is also worth noting that reserves have been replenished during this period in accordance with the recommendations of the BIFSC (2005a). 22..33.. CCoonncclluussiioonn On the evidence presented to us by MLA we believe the source and application of FTF funds has been appropriate and transparent. While some might argue about the weighting of funds applied to the various domestic and export market program areas, the funding process has been consultative and appropriate measures have been in place to quarantine the $1.50 levy income stream and allocate it on a weighted basis across domestic and export markets.

Review of the $1.50 Levy Increase for the FTF Program
Warwick Yates and Associates Pty Ltd, 2009
18
33.. DDeemmaanndd ffoorr AAuussttrraalliiaann BBeeeeff aanndd ootthheerr MMaarrkkeett IIssssuueess 33..11.. IInnttrroodduuccttiioonn 3.1.1. Background To provide a backdrop for the assessment of the effectiveness of the increased levy fund expenditure, the conditions prevailing in each of the key markets for Australian beef are considered in this section. By way of background it is worth recounting which issues the Beef Industry Funding Steering Committee viewed as critical in their assessment of the outlook and future prospects of the beef industry. These are summarised below.
• Stronger fundamentals in the domestic market provide a good base for further demand growth, but this will be challenged by increasing competition for the food dollar.
• With disease incidents restricting the major exporters, Australia is well placed to capitalise and secure market share in our key export markets.
• Supply, constrained until now by drought, is likely to increase by 335kt by 2009.
• Security of grain will become an important issue in production growth.
• Without a corresponding growth in demand, increased supply will negatively impact cattle prices by up to 15% per head.
• Competition from other meats will become more intense.
• Uncertainty will continue as to the return of US into key markets.
• Nonetheless, there remains an underlying strength in demand for Australian product.
• Competition from Brazil, India and China will become more intense, particularly in the lower-end price sensitive markets.
• Strong demand for protein over the long-term, particularly in Asia.
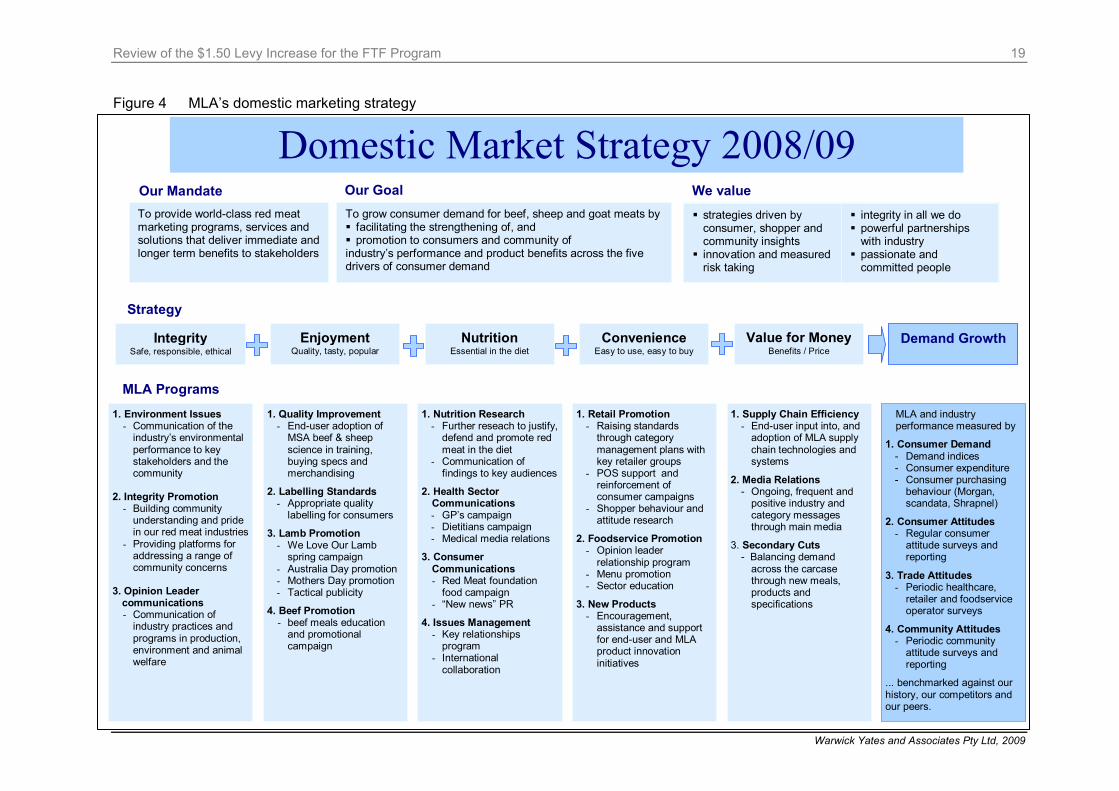
• The key is to ensure red meat increases its share of that growth in demand. 3.1.2. MLA’s domestic and export beef marketing strategies MLA’s domestic beef marketing strategy is illustrated in Figure 4 and, similarly, Figure 5 shows the export marketing strategy. MLA has a continuum approach to trade and market development comprising the stages described below. Figure 6 shows the apportionment of the various markets and the strategic marketing focus in these markets with respect to MLA marketing programs.
Review of the $1.50 Levy Increase for the FTF Program
Warwick Yates and Associates Pty Ltd, 2009
19
Figure 4 MLA’s domestic marketing strategy
MLA Programs
1. Environment Issues - Communication of the
industry’s environmental performance to key stakeholders and the community
2. Integrity Promotion
- Building community understanding and pride in our red meat industries
- Providing platforms for addressing a range of community concerns
3. Opinion Leader
communications - Communication of
industry practices and programs in production, environment and animal welfare
1. Quality Improvement- End-user adoption of
MSA beef & sheep science in training, buying specs and merchandising
2. Labelling Standards - Appropriate quality
labelling for consumers
3. Lamb Promotion - We Love Our Lamb
spring campaign - Australia Day promotion - Mothers Day promotion - Tactical publicity
4. Beef Promotion - beef meals education
and promotional campaign
1. Nutrition Research- Further reseach to justify,
defend and promote red meat in the diet
- Communication of findings to key audiences
2. Health Sector Communications - GP’s campaign - Dietitians campaign - Medical media relations
3. Consumer Communications - Red Meat foundation
food campaign - “New news” PR
4. Issues Management - Key relationships
program - International
collaboration
1. Retail Promotion- Raising standards
through category management plans with key retailer groups
- POS support and reinforcement of consumer campaigns
- Shopper behaviour and attitude research
2. Foodservice Promotion - Opinion leader
relationship program - Menu promotion - Sector education
3. New Products - Encouragement,
assistance and support for end-user and MLA product innovation initiatives
1. Supply Chain Efficiency- End-user input into, and
adoption of MLA supply chain technologies and systems
2. Media Relations - Ongoing, frequent and
positive industry and category messages through main media
3. Secondary Cuts - Balancing demand
across the carcase through new meals, products and specifications
MLA and industry performance measured by
1. Consumer Demand - Demand indices - Consumer expenditure - Consumer purchasing
behaviour (Morgan, scandata, Shrapnel)
2. Consumer Attitudes - Regular consumer
attitude surveys and reporting
3. Trade Attitudes - Periodic healthcare,
retailer and foodservice operator surveys
4. Community Attitudes - Periodic community
attitude surveys and reporting
... benchmarked against our history, our competitors and our peers.
Strategy
IntegritySafe, responsible, ethical
EnjoymentQuality, tasty, popular
ConvenienceEasy to use, easy to buy
Value for MoneyBenefits / Price
Demand Growth NutritionEssential in the diet
To provide world-class red meat marketing programs, services and solutions that deliver immediate and longer term benefits to stakeholders
To grow consumer demand for beef, sheep and goat meats by facilitating the strengthening of, and promotion to consumers and community of
industry’s performance and product benefits across the five drivers of consumer demand
strategies driven by consumer, shopper and community insights
innovation and measured risk taking
integrity in all we do powerful partnerships with industry
passionate and committed people
Our GoalOur Mandate We value
Domestic Market Strategy 2008/09

Review of the $1.50 Levy Increase for the FTF Program
Warwick Yates and Associates Pty Ltd, 2009
20
Figure 5 MLA’s international marketing strategy
International Marketing Strategy - Beef ObjectiveIn conjunction with commercial industry partners, maximisesustainable returns for the Australian beef industry derived from International markets .
Key Issues• The emergence of high volume low cost competitors with the long term
likelihood of entering Australia’s major markets• The growing influence of global and regional retailers• The ageing of the world’s population• The increasing consumer expectation for detailed product information• Concentration of income and population growth in Asia• Globalising of commercial beef supply chains• On going competition from pork and poultry
Strategic Imperatives• Build and maintain trade and consumer loyalty• Build consumer preference for beef• Position Australian beef as safe, consistent,
versatile and nutritious• Develop industry capability in export marketing
planning / brand positioning• Funding allocation to reflect long term
opportunities
StrategyMarket
knowledgeProduct differentiation
- individual brandsProduct integrity“Brand Australia”
Product distribution- Network building
Export market growth & sustainability
Network development• In-market networks
- Importers/wholesalers- End-users
• Australian networks- Exporters- Processors- Producers- Integrated supply chains
Business Development• Lead identifying activities• Lead generating activities
- Trade shows- Selective advertising
• Trade education - Training and promotion
• Product innovation- usage of cuts
• Product trials
Emerging markets developmentMarket profileMarket participant identificationMarket development monitoringMarket opportunity promotion
ProgramsProduct safety positioning• Media
- Editorial- Advertising
• Trade education• Government liaison• Country of origin safety mark (e.g.
HCW)• Branded POS material• Integrated supply chains
Product specification & systemspositioning• AUSMEAT system
- Publications- Training
• EQA program• Traceability systems
Special requirements• Religious – Halal• Natural / organic
Nutrition and health
• Education• Publications• Media
Capacity development• Consumer segmentation studies• Market assessment• Supply chain interaction
Supply chain innovationCategory ManagementSupply chain efficiencyProduct innovation
Brand supportCo-operative brand activities (ICA) – MLA/supply chain strategic partnershipsConsumer demand development (e.g. EQA)
ConsumersEducationQuality and safetyEmotional connections
Consumer trends• Global & local-Retail- Foodservice- Consumer research- Issues to Monitor: Organic food, food miles, carbon credits, nutritional issues
Product Analysis- Cut by market- Product performance
Channel trends &requirements• Retail• Foodservice• Manufacturing• Trade
Competitor positioning• Identify and analyse market
situation• Assess competitor position
- beef• Other proteins
• Identification of market requirements and trends
• Trade and consumer awareness of Australian beef product attributes
• Trade and consumer loyalty to Australian beef
• Efficient distribution and retailing of Australian beef
• Optimal diversification of international markets for Australian beef
Our Key Measures• Stakeholder, trade & consumer surveys • Quantity benefits accruing through individual ICA programs • Retail & food service penetration & market share
trends • Changes in product flows in response to specific initiatives

Review of the $1.50 Levy Increase for the FTF Program
Warwick Yates and Associates Pty Ltd, 2009
21
Figure 6 MLA’s strategic marketing focus
Stage 1 Trade Facilitation This stage involves identifying markets and setting up the operating environment in terms of market access arrangements and import protocols for Australian meat industry companies to access these new markets and trade. Current examples of this activity are the programs for the EU & Russia. Stage 2 Trade Development The second stage involves creating exposure opportunities for Australian Red meats in target countries by way of trade shows, establishing market contacts and building industry networks. Current examples of these programs are those for China and the Middle East. Stage 3 Market Development The third stage involves market development using International Collaborative Agreement (ICA) programs to enable commercial players to take increasing involvement further developing their own brands in these markets. Current programs are those in SE Asia and the Chinas and chilled beef into North America.

Review of the $1.50 Levy Increase for the FTF Program
Warwick Yates and Associates Pty Ltd, 2009
22
Stage 4 Demand Growth This is the final stage in the market development cycle and is the most expensive as it is closer to the final consumer. Programs at this stage, in addition to those of earlier stages, include consumer advertising, promotion and public relations activities. Current marketing programs in this area are pursued in Japan, Korea and Australian domestic market. MLA’s role is not to be involved in commercial transactions but rather to provide the necessary market development environment that enables commercial operators to undertake successful business with importers and wholesalers in respective export markets. The Funding for the Future program in export markets had the following three key marketing objectives: 1. Maintenance of current marketing programs, which had proven successful up to the
time of the FTF program and were seen as essential in consolidating and defending the current market position. Enhancement of current programs was proposed, specifically in the areas of:
o continued support for current brands, e.g. Aussie Beef and Hoju Chungjung Woo;
o developing emerging markets (China, Vietnam, Mexico) to capitalise on population and economic growth and reduce the industry’s reliance on three main markets; and
o increased defence of Australia’s manufacturing business through continued quality differentiation, key account management and world leading customer service, as well as utilising R&D (on-farm and off-farm) to increase quality.
An additional $4.2M was recommended for these activities.
2. Increase support for industry brands, including current and future initiatives. An
additional $2.0M was recommended for this activity. 3. Increase support for trade customers and invest in growing demand for a wider
range of cuts. An additional $5.0M was recommended for these activities. Figure 7 shows the volume and value of the key export markets estimated at 930,000 tonnes shipped weight (sw) and having a value of $4.4 billion (FOB) in 2007-08. It highlights the importance to Australia of the Japanese, Korean and US markets.

Review of the $1.50 Levy Increase for the FTF Program
Warwick Yates and Associates Pty Ltd, 2009
23
Figure 7 Australian beef exports by volume and value, 2007-08
Source: ABS, DAFF The Australian domestic market remains Australia’s largest beef market and was estimated in 2007-08 to a have usage of 754,000 tonnes carcase weight, 430,000 tonnes retail weight and an estimated retail value of $6.7 billion. Live exports provide an important third leg in the market for Australian livestock, accounting for over 700,000 head worth around $540M in 2007-08. 3.1.3. Overview of market analysis The following sections examine the key domestic, beef export and live export markets. For each market the analysis covers market dynamics, the key assumptions used in formulating the FTF program, changes to those assumptions in 2008 and the qualitative and quantitative outcomes of Australia’s marketing efforts with particular reference to the FTF program activities. In the context of the FTF program it is important to understand how MLA has differentiated its operations in all markets with respect to market dynamics, previous activity and the maturity of the respective markets. In the analysis that follows the discussion about each market is structured in the following way:
• General strategy and market conditions prior to the FTF program
• Market dynamics since the instigation of the FTF program
• Overview of the FTF program activities
• Outcomes of the FTF program activities
• Case studies relevant to the FTF activities
• Conclusions
Volume (930kt sw)
US26%
Canada1%
Korea16%
Taiw an3%
Japan39%
Other2%
Sth Asia/ China6%Europe
6%
Canada1%
Value (A$4.4 billion)
US22%
Canada1%
Korea17%
Taiw an2%
Japan43%
Other3%
Sth Asia/ China5%Europe
6%Canada
1%

Review of the $1.50 Levy Increase for the FTF Program
Warwick Yates and Associates Pty Ltd, 2009
24
33..22.. DDoommeessttiicc MMaarrkkeett 3.2.1. Introduction The proposed strategy for the domestic market outlined in the Funding for the Future document (BIFSC 2005a) was to “achieve growth in beef meal frequency” to take up the anticipated 113kt (cw) increase in supply. Analysis for 2004 had shown household penetration to be 80.7%/week, consumption frequency of 2.1 times /week and an average serving size of 187g. The objective was to increase consumer expenditure by 5% per annum and the BIFSC accepted that, assuming retail prices remained stable, it was unlikely to achieve this by increasing household penetration or serving sizes. Consequently, the primary means to achieve the objective would be by increasing consumption frequency, from 2.1 to 2.5 times a week over a three year period. To achieve this growth rate the need for a major increase in marketing effort was identified; one which could address the barriers to a red meat meal choice and build on the key drivers of red meat consumption. The specific barriers and drivers identified in the Funding for the Future document are set out below. Key Barriers:
• Nutrition attitudes – 24% of Mums still limit red meat consumption to avoid possible health problems.
• Red meat is seen as heavy and filling at a time when most are seeking lighter meals.
• Boredom due to limited and declining range of red meat meals in consumers’ everyday repertoires.
• Most Mums think children prefer chicken to beef.
• Red meat not top-of-mind as a quick and easy meal to prepare, particularly with older children.
• Most beef and lamb cuts are expensive in comparison to chicken.
• Competition from other proteins, particularly pork (due to high retail margins and media promotion) and fish (due to very positive nutritional reputation and strong supermarket push to grow share of seafood).
Key Drivers:
• People love beef – it is one of life’s great sensory experiences.
• Increasing pride in Australian beef – belief that we do produce the best beef in the world.
• High levels of product satisfaction arising from improving quality, presentation and cut/cooking instructions.
• Variety – you can make many different and appealing meals with beef; although consumers need help and stimuli in expanding their beef repertoire.
• Beef meals can be quick and easy to prepare – consumers need to be reminded of that.
• Red meat can play a significant role in health and wellbeing, including weight loss – a healthy target of 3–4 times per week is endorsed in the National Dietary Guidelines.

Review of the $1.50 Levy Increase for the FTF Program
Warwick Yates and Associates Pty Ltd, 2009
25
• Recovery of retailer margins in red meat will improve promotional enthusiasm. The two specific marketing objectives were to reduce barriers to consumption and to aggressively promote the drivers of consumption. The associated marketing strategies are detailed in Table 12. Table 12 Proposed marketing strategy for the domestic market
Marketing Objective Marketing Strategy
Further reduce barriers to consumption
1. Continue and evolve the “Red Meat. Feel Good” campaign, with additional messages, more weeks on air and include regional markets
Aggressively promote the drivers of consumption
2. Develop and launch a high impact “Beef Tonight” meal promotional campaign, specifically targeting mid-week meal occasions, with the goal of winning one additional meal per fortnight
3. Develop and launch new beef meal products and concepts that simplify meal preparation, and use low value, limited appeal cuts.
Source: BIFSC 2005a, p.27. 3.2.2. Market Dynamics The domestic market is the largest market for Australian beef, in 2004-05 accounting for around 730kt carcase weight, valued at the retail level at $6.0 billion. Domestic consumption of beef increased significantly between 2005-06 and 2006-07 (up 3.5%) but levelled off in 2007-08 (Table 13). The average retail price showed a significant increase in 2005-06 but has been relatively steady since. The 2005-06 price lift and the rise in consumption in 2006-07 yielded an increase in retail value between 2004-05 and 2006-07 of around $600M. The trend continued into 2007-08 but at a subdued rate, increasing by an estimated $44M in comparison to the previous period. Table 13 Total domestic beef usage and expenditure, Australia
Beef and veal 2004-05 2005-06 2006-07 2007-08a
Usage carcase weight ('000 tonnes) 726.5 731.8 757.5 754.2
Usage retail weight ('000 tonnes) 414.1 417.1 431.8 429.9
Average retail price ($/kg) $14.49 $15.40 $15.38 $15.55
Value ($M) 6,001 6,424 6,641 6,685
Increase in value on previous year ($M) 260 423 217 44
Per capita consumption (kg) 35.9 35.8 36.3 35.6
Per capita expenditure ($) $296.92 $314.08 $318.47 $315.63 a Subject to revision. Source: MLA (2008), ABARE

Review of the $1.50 Levy Increase for the FTF Program
Warwick Yates and Associates Pty Ltd, 2009
26
On a per capita basis the beef consumption data appear relatively flat, with average per capita consumption estimated at 35.9kg in 2004-05 compared with 35.6kg in 2007-08. This represents a fall of 0.8% in absolute terms (Table 13). In relative terms (per capita and market share), the decline is greater. Per capita consumption of pig meat increased by 18.6% over the same period, lamb consumption was up by 10.7% and poultry meat up 4.0%. In terms of market share, pig meat and lamb have made gains at the expense of beef, mutton and poultry meat (Table 14). Table 14 Per capita consumption of meat, Australia (kg/capita, carcase weight)a
Class of meat
Weight (kg) Share Weight (kg) Share Weight (kg) Share Weight (kg) Share
Beef and veal 35.9 33% 35.8 33% 36.3 31% 35.6 31%
Mutton 3.0 3% 2.8 3% 3.2 3% 2.7 2%
Lamb 10.3 9% 10.2 9% 11.2 10% 11.4 10%
Pig meat 22.1 20% 22.8 21% 25.6 22% 26.2 23%
Poultry meat 37.7 35% 38.5 35% 39.5 34% 39.2 34%
Total Meat 109.0 100% 110.1 100% 115.8 100% 115.1 100%
2004-05 2005-06 2006-07 2007-08a
a Subject to revision. Source: MLA (2008) However, these short-term trends need to be considered in the context of broader market influences:
• First of all, domestic consumption can be strongly influenced by short run supply conditions which can be impacted by, among other things, seasonal conditions, export opportunities and competition from imports.
• Strong demand for Australian beef from Japan and Korea with their continuing restrictions on US imports has limited the volumes available for local consumption. At the same time, seasonal conditions have exacerbated supply to the domestic market and this has added upward pressure on retail beef prices. Demand for beef has been further inhibited by pressure on household budgets from high fuel prices and high interest rates.
• For lamb, strong momentum has continued from a decade long ‘We Love Our Lamb’ campaign. As well, tightening economic conditions in the major export market, US, has constrained export opportunities for lamb.
• For pig meat, the availability of low priced imports in recent years has led to a glut in supply, reduced domestic retail prices and severe profit downgrades for Australian producers while they adjust to significant change in their trading environment.
• For chicken, increased market penetration has been achieved in recent years, particularly in the fast food sector as a low cost bulk protein.

Review of the $1.50 Levy Increase for the FTF Program
Warwick Yates and Associates Pty Ltd, 2009
27
3.2.3. MLA FTF Activities What were the key assumptions at the start of the FTF program in 2004-05? Consumption expenditure on beef had been growing as a result of growth in both volumes and prices, but beef faced strong competition from all other meats, particularly chicken for which there were more positive consumer attitudes and a significant price advantage. For beef the broad market perceptions of the BIFSC at the start of the FTF program in 2004-05 could be summarised as follows:
• Prices expected to plateau or ease due to anticipated increases in supply.
• Significant barriers and issues limiting full acceptance of red meat’s important role in a healthy diet as critics continued to promote arguments against red meat consumption.
• This negative sentiment prevailed despite considerable success in addressing community attitudes towards red meat.
• The industry identified a need to continue the fight for red meat’s proper place in a balanced diet.
• An aggressive “Beef tonight“ strategy, accompanying the nutrition campaign would influence consumer meal decisions and achieve frequency targets.
What are the realities in 2007-08?
• Consumer expenditure in 2007-08 was well above 2004-05 levels and demand for beef is expected to remain firm over the next 3 to 5 years.
• The inflation experienced in the first half of 2008 and the slowdown in economic growth evident in the second half of 2008 is expected to maintain pressure on demand for beef, at least in the short term.
• Price competitiveness of beef improved in 2007-08, with retail prices in May up by only 1.7% over 12 months earlier compared to chicken (up by 11%), pig meat (6.7%) and lamb (4.2%).
• Beef usage in the foodservice sector in 2008 compared with 2007 was lower in most types of commercial outlets (including restaurants, hotels/motels and fast food independents) with the exception of fast food chains.
What were the aspirations in the Domestic market? The 2006-07 financial year was the first year to receive the full impact of the $1.50 levy increase. Increased FTF funding allowed the implementation of the key domestic market recommendations of the Beef Industry Funding Steering Committee, namely:
• expand the Red Meat Feel Good campaign to include key regional markets and to provide greater continuity to our nutrition messages throughout the year;
• develop a “Beef Tonight” meal focused campaign to raise beef’s presence and convert more positive attitudes into meal behaviour;
• support the development and launch of new product initiatives that could be expected to generate a significant impact on consumer demand for beef; and
• undertake a communications program to promote the integrity of Australia’s cattle production practices.

Review of the $1.50 Levy Increase for the FTF Program
Warwick Yates and Associates Pty Ltd, 2009
28
As noted earlier, the objective of the FTF program for the domestic market was to increase consumer expenditure by 5% per annum, or an additional $966M over the first three years of funding, with continuing benefits beyond that period. The primary means to achieve the objective would be by increasing consumption frequency, from 2.2 to 2.5 times a week over the 2005-2007 period. This implied annual growth in volumes of around 100kt carcase weight. Variations to the original FTF Domestic program? The FTF proposal was to increase expenditure on domestic marketing programs from $8.3M to $15.2M, rising to $17.1M over three years based on media inflation of around 4%. As detailed in Table 10, funds available for domestic marketing were significantly below the target in 2005-06 ($11.5M) since the additional levy flow did not reach MLA until the last quarter. However, funds were at or above the target in 2006-07 ($18.5M) and 2007-08 ($17.2M), Due to the drought and high grain prices impacting on the number of transactions, as well as growing funding needs in other MLA programs, the beef marketing budget is down to $15.8M for 2008-09. The main consequences have been a reduction in seasonal meal promotions during the year from three to two and a reduction in advertising support for the ‘Red Meat We were meant to eat it’ campaign. What have been the Qualitative and Quantitative Outcome of Australia’s Domestic Marketing Efforts? In quantitative terms, in the three years since 2004-05:
• consumer expenditure on beef has increased by approximately $700M (from $6.0 billion to $6.7 billion) which is equivalent to a per annum increase of 3.7%;
• two-thirds of the increase in consumer expenditure can attributed to a higher price and one-third to an increase in volume; and
• the average annual growth in volumes has been around 9kt carcase weight. For 2007-08 an important key performance indicator (KPI) was to increase beef meal frequency from 2.2 to 2.3, however it remained stable. MLA research showed that meal frequency did increase from 2.0 to highs of 2.23 and 2.29 within the March and July bursts of the Kids Love Beef campaign, however these levels have not been sustained during off-air periods. Another KPI relates to perceptions of beef as a children’s favourite with the aim of increasing the measure from 27% to 32%. Overall perceptions have increased by 4 percentage points in 2007-08 from 22% before the Kids Love Beef campaign started to 26% after the campaign. The starting point of 27%, taken from within the first advertising burst in March 2007, turned out to be ambitious. KPIs around positive health attitudes to red meat have been achieved. There was further growth in the ‘Appreciator’ segment (from average 43% to 45%) and decline in the ‘Resistor’ segment (from average 16% to 15%). Key attitudinal statements have also improved (Table 15).

Review of the $1.50 Levy Increase for the FTF Program
Warwick Yates and Associates Pty Ltd, 2009
29
Table 15 Consumer attitudes to beef a
2006-07 2007-08
Red meat essential part of a healthy diet a 46% 47%
We are meant to eat Red Meat 3-4 times per week a 34% 35%
Essential for a healthy mind a 33% 36%
The richest source of nutrients a 25% 26% A diet including Red Meat is more important for my healththan I previously thought a 24% 25% a % strongly agree. Source: Millward Brown There were other visible successes, such as Sizzle Steak, which has generated strong interest from industry for new products. This collaborative partnership approach needs to be maintained and further developed in the future. Generally the retail and foodservice stakeholders interviewed as part of this review believed that MLA have been doing an excellent job in the domestic market, especially in troublesome times (e.g. when poultry and pork have been competitively priced). Several respondents indicated that MLA promotional activity has had a substantial positive impact on their business profitability. In the current economic climate MLA needs to be aggressive to maintain market position for beef. The point of sale promotions have been highly effectively and the Entice magazine was repeatedly identified as one of the best promotions MLA has undertaken. Some exporters and processors were less supportive of the domestic promotional efforts funded by the increased levy. While the nutritional campaigns were identified as being effective in breaking down some of the negative connotations surrounding red meat, the extent of the increase in promotional expenditure was generally thought to be difficult to justify. A common comment was that the KPIs for promotional effort in this market were not reported widely or transparently and this is reason enough to be sceptical of the effectiveness of the promotional activities. 3.2.4. Outcomes of FTF activities Promotion Beef promotion is one way MLA is attempting to impact domestic demand. Changing lifestyles and ever-increasing competition continues to put pressure on beef as the centre of the meal. In the face of adverse market conditions, per capita consumption has held steady (Table 16) and this can be attributed at least in part to the “Red meat. Feel good” and subsequent campaigns. Campaigns funded under the increased levy funding include:
• “Red Meat. We were meant to eat it” campaign targeting consumers, supported by the “Rx 3-4 times a week” campaign targeting Doctors and Health Professionals. In partnership with the lamb industry, this television and print campaign, featuring actor Sam Neill, tells the story of the vital role red meat has played in human evolution.
• “Beef Tonight” meal campaigns, specifically targeting mid week meal occasions, with the goal of winning back one chicken meal per fortnight, included the following promotions.
Review of the $1.50 Levy Increase for the FTF Program
Warwick Yates and Associates Pty Ltd, 2009
30
o “Bring out the Beef” in summer 2006 included a television commercial, point of sale activity and a supplementary media campaign. As well as driving consumer demand the campaign aimed to reinforce the beef brand and stimulate simple and desirable summer beef meal ideas.
o “Kids Love Beef” promotions aimed at changing the perception that kids love chicken best. Commenced in March 2007 with bursts in June 2007 and March 2008, these promotions included television and magazine advertising and point of sale activity.
o “Beef. Get into it” – an educational campaign commencing in June 2008 focusing on building meal preparer confidence in preparing a wider range of beef meals. This campaign includes television and magazine advertising, Entice magazine and point-of-sale activity.
Nutrition The Nutrition Research Program was launched in 1999 and has delivered a strong base of scientific evidence that supports the role of Australian red meat in healthy eating and in a range of public health issues, particularly obesity and cardiovascular disease. The research continues to be used in health professional and consumer marketing programs, for instance, MLA-funded Commonwealth Scientific and Industrial Research Organisation (CSIRO) research on high protein (high red meat) diets and weight loss in women. As a result of this work and in partnership with CSIRO, MLA launched the Total Wellbeing Diet in Australian Women’s Weekly. This then led to the book The CSIRO Total Wellbeing Diet which has been a highly successful for both public health and the red meat industries. Red meat critics continue to generate negative media on a range of health, environmental and welfare issues and within this current environment, many consumers remain ambivalent to the role of red meat in their diets and continue to restrain frequency of consumption. A key initiative flowing from the increased levy was the launch of the ‘Red Meat. We were meant to eat it’ campaign featuring actor Sam Neill. This campaign, which included television, print, publicity and point-of-sale, tells the story of the role red meat has played in the evolution of mankind and how it continues to be just as important today. This campaign appears to have had a significant impact on how these ambivalent consumers regard red meat. Consumer surveys by Millward Brown (Table 16) show that there has been a significant shift in the consumer segments as well as in agreement to key attitudinal statements.

Review of the $1.50 Levy Increase for the FTF Program
Warwick Yates and Associates Pty Ltd, 2009
31
Table 16 Changing consumer attitudes to red meat in Australia
Average 2002-2003
Average 2006-2008
Consumer segments:
Rejecters 7% 5%
Resistors 22% 15%
Acceptors 37% 36%
Appreciators 34% 44%
Total 100% 100%
Red meat is an essential part of a healthy diet a 65% 76%
Red meat is essential for vitality and wellbeing a 54% 71% a % agree Source: The Leading Edge, Millward Brown The major threat for 2007-08 was the release of the World Cancer Research Fund (WCRF) report on diet and cancer prevention, in November 2007. This report has the potential to undermine academic, policy, health professional and consumer confidence in red meat. MLA has undertaken an extensive consultation and media management program to ensure that the WCRF report does not unfairly impact on red meat demand in Australia. Product Development The aim has also been to develop and launch new beef meal products and concepts that simplify meal preparation and use low value, limited appeal cuts. Working with opinion leading butchers in each state, MLA has conducted a series of product development workshops under the banner of ‘Counter Attack’ to improve value adding and merchandising by retailers. The results of these workshops have been captured in three volumes of ‘Beefing Up Your Profits’ and circulated widely through the retail sector. Participants have advised MLA of increased sales and profits, coming particularly from low demand secondary cuts. Product development initiatives in partnership with supermarkets and their suppliers have also produced some encouraging results. Sizzle Steak, a thin sliced steak from a low value muscle developed and launched in partnership with Woolworths, has been particularly successful in generating additional sales. Eating Quality MSA technology provides an outstanding opportunity for the industry to improve its product quality and enhance consumer satisfaction. Adoption of the science by industry enterprises at all levels of the supply chain requires training, coordination, support and promotion. Adoption will only increase if participants recognise commercial gain from the program. MSA must meet their commercial objectives of increasing sales and revenues by increasing customer satisfaction and loyalty, and differentiating participating retailers’ offers from their competitors.

Review of the $1.50 Levy Increase for the FTF Program
Warwick Yates and Associates Pty Ltd, 2009
32
The main issues restricting adoption are consistency in availability and competitiveness of supply, low consumer awareness, and entrenched retail and foodservice practices. Retail Presence The retail environment is the most important area of consumer meal decision making. MLA aim to work with all retail sectors to raise retailing standards and enhance consumer appeal of their red meat offer. This program encourages and facilitates participation in MLA promotional campaigns and relevant R&D programs that can have a positive impact on growing demand across the retail sector. MLA works with key retailers in a range of initiatives to sustainably strengthen consumer demand for red meat. Initiatives are balanced across the entire retail sector, within a specific channel and within key individual enterprises where they represent significant volume alone or where they can constructively influence other retailers. Areas of activity include:
• enhanced support of MLA promotional campaigns;
• shopper behaviour analysis;
• category performance analysis;
• development, trial and assessment of new merchandising techniques;
• development, trial and assessment of new promotional techniques;
• development, trial and assessment of new retail and supply systems;
• promotion of the meat category within supermarket priorities; and
• communication and promotion of results through the wider meat retailing community. MLA offers these services through National Account Managers and Business Development Managers and Program Coordinators in each state. Each account or group is allocated a relatively modest facilitation budget based on share of market, scope of work and contributory funding which is then developed into a tailored Annual Work Plan to meet the mutual goals of the retailer and MLA. Foodservice Promotion Foodservice represents around 30% of red meat consumption in the domestic market. Foodservice is a constantly changing sector, driven not only by lifestyle and economic trends, but also by fashion. Menu offers need to be constantly refreshed, providing both opportunities and threats for red meat’s share of those offers. Further, the boom in the “casual dining” and growth in the “institutional catering” sectors and its dependence on low skilled labour poses continuing risks in the quality and safety of meat meals. MLA’s strategy has been to work with opinion leaders and key decision makers at each level of the foodservice industry, paying special attention to the pub club sector and to help them influence others in their sector. Opinion leader activities include:
• Chef’s Tables of top-end and media chefs;
• paddock to plate tours;
• engagement and promotions with Major Accounts, Groups and Associations; and
• participation in TAFE college programs.

Review of the $1.50 Levy Increase for the FTF Program
Warwick Yates and Associates Pty Ltd, 2009
33
Extension activities include:
• participation in trade shows, fairs and events;
• Chef’s Special quarterly magazine;
• advertising and features in trade publications;
• competition and guest sponsorships; and
• seasonal promotional programs in the club pub sector to grow red meats menu share and cut range.
3.2.5. Case Studies “Bring out the Beef” promotion Not all promotions perform to expectations and the “Bring out the Beef” campaign falls into that category. The promotion, with approved expenditure of $2.86M, delivered mixed results with poor advertising impact but with good point of sale impact and sales results. A key learning from this activity is that promotion of the ‘Beef’ brand is unlikely to be successful on its own. Consumers do not and will not go out to buy ‘beef’; rather they seek to buy steak, mince, sausages, etc. This will not change easily and therefore future promotions should focus more on specific beef based meals. “Kids Love Beef” campaign This campaign arose from the failure of the “Bring out the Beef” promotion to meet expectations. The campaign tackled a weakness in beef’s image that Mums think their kids love chicken best. The promotion focused strongly on point of sale activity with support from new television advertisements, magazine advertising, press and radio activity. Table 17 provides selected KPIs for the Bring out the Beef (BOTB) and Kids Love Beef (KLB) campaigns. Table 17 Selected KPIs for “Bring out the Beef” and “Kids Love Beef” campaigns
Measure Target Results
BOTB KLB
Consumer awareness of beef communication 55% 39% 47%
Consumer recognition of TV advertising At least 50% 37% 63%
Consumer enjoyment of TVC At least 58% 44% 58%
Consumer involvement At least 6.1/10 5.5 4.97
Consumers strongly agree “Beef is loved by Australians” At least 65% 85% -
Consumers strongly agree “Beef is perfect for summer meals” At least 65% 67% -
Consumers strongly agree “Beef is perfect for kids meals” At least 65% - 80%
Retailer participation 80% 80% v high
Retailers rating the overall sales impact of the beef campaign 65% rate good+ 74% high
Household purchasing (market share) 35% 33% 34.5%
Household meal frequency (meals per week) 2.2 2.1 2.2
Source: Millward Brown

Review of the $1.50 Levy Increase for the FTF Program
Warwick Yates and Associates Pty Ltd, 2009
34
“Beef – Get into it” campaign The major barrier to greater consumption frequency identified by MLA was the lack of confidence meal preparers have in expanding their beef repertoire. They were comfortable in preparing, say, rump steak, spaghetti bolognaise or grilled sausages. But for a change, they were far more likely to switch to another species than they were to try another beef dish. This is where Entice now plays a valuable role. MLA developed this magazine, distributed free through butcher shops, to educate and encourage meal preparers to have a go at making more beef dishes. Consumer and retailer response has been so strong, particularly to the Casserole promotion in June 2008, that MLA plans to expand the campaign and support Entice further with television promotion (featuring well known motivator Laurie Lawrence) and expanded distribution into supermarkets. In a test market of the full campaign in Adelaide in November 2008, butchers rated it among the most successful promotions MLA has run, a response consistent with views from butchers interviewed as part of this review (Table 18). MLA now plans to launch the campaign nationally in February 2009. Table 18 Butcher responses to Nov. 2008 test market campaign in Adelaide a
Butcher response Average ratings Overall rating of sales impact 3.39 Usefulness for my business - Entice 4.22 Usefulness for my business - TV advertising 3.83 Usefulness for my business - posters 3.69 a Survey of n=67 butchers in Adelaide who participated in the promotion. Ratings are on a five point scale:
1=poor, 2=fair, 3=good, 4=very good, 5=excellent. Source: Millward Brown 3.2.6. Conclusions MLA efforts in the domestic market have covered a wide range of activities in promotion, nutrition, eating quality, retail presence and foodservice promotion. These activities have been undertaken as the means to achieve the stated objective of increasing consumption frequency from 2.1 to 2.5 times a week over a three year period (which would deliver annual growth in volumes of 100kt cw) or adding $322M per annum in consumer expenditure. In 2005-06 and 2006-07 the consumer expenditure target was broadly met (more through price than volume effects), although the additional spending from the levy increase would have had little impact in 2005-06. Expenditure increased again in 2007-08 but at a level significantly less than the target. The meat sector is a highly competitive segment of the food industry and one where considerable marketing effort is required just to maintain market position and market share. The setting of quantitative growth targets implies that volumes and market share would be maintained without the marketing effort. However, in a mature market with fierce competition and low growth potential, as the domestic meat market could be characterised, it is likely that little or poor promotion would result in loss of both sales volume and market share. Some processors and exporters see opportunities in overseas markets and feel diversion of marketing dollars into these potentially high growth markets is warranted. However, despite some promotions falling short of expectations, most of MLA’s domestic marketing efforts appear to have been effective and have received strong support from the retail and foodservice sectors. Market share has been maintained, aggregate consumer expenditure has increased, albeit at a rate lower than hoped for, and the beef industry has therefore benefited significantly from the enhanced marketing effort.
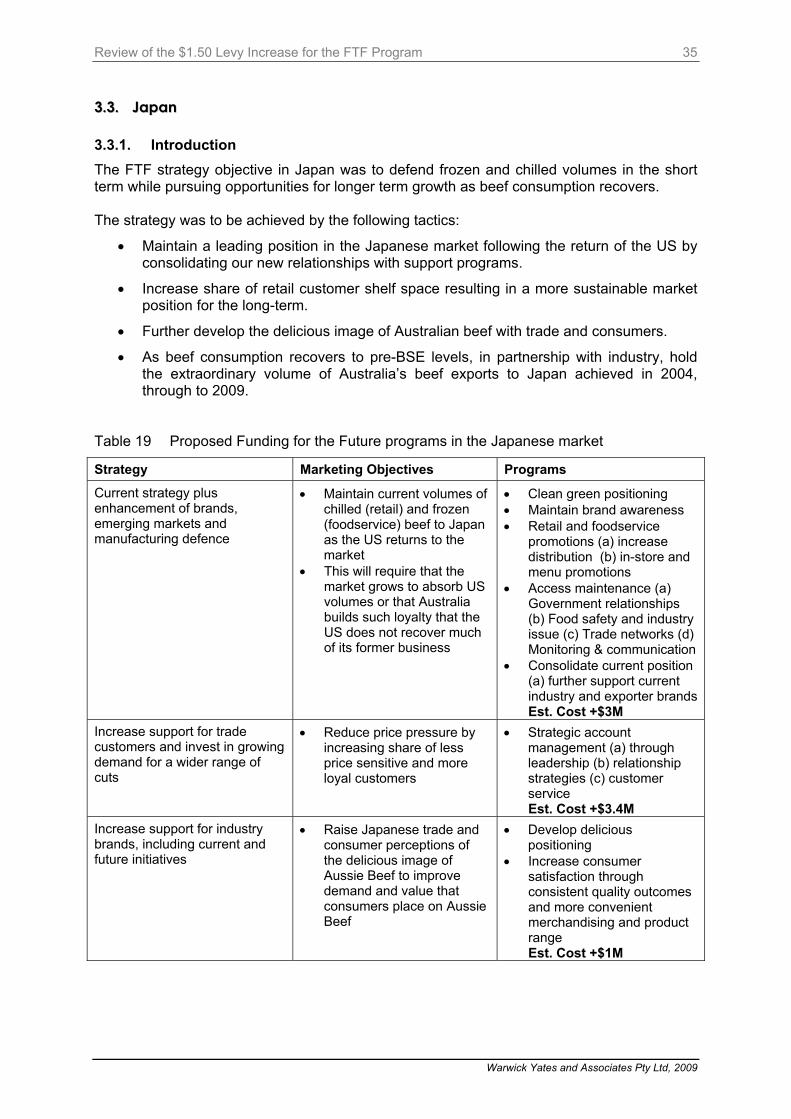
Review of the $1.50 Levy Increase for the FTF Program
Warwick Yates and Associates Pty Ltd, 2009
35
33..33.. JJaappaann 3.3.1. Introduction The FTF strategy objective in Japan was to defend frozen and chilled volumes in the short term while pursuing opportunities for longer term growth as beef consumption recovers. The strategy was to be achieved by the following tactics:
• Maintain a leading position in the Japanese market following the return of the US by consolidating our new relationships with support programs.
• Increase share of retail customer shelf space resulting in a more sustainable market position for the long-term.
• Further develop the delicious image of Australian beef with trade and consumers.
• As beef consumption recovers to pre-BSE levels, in partnership with industry, hold the extraordinary volume of Australia’s beef exports to Japan achieved in 2004, through to 2009.
Table 19 Proposed Funding for the Future programs in the Japanese market
Strategy Marketing Objectives Programs
Current strategy plus enhancement of brands, emerging markets and manufacturing defence
• Maintain current volumes of chilled (retail) and frozen (foodservice) beef to Japan as the US returns to the market
• This will require that the market grows to absorb US volumes or that Australia builds such loyalty that the US does not recover much of its former business
• Clean green positioning • Maintain brand awareness • Retail and foodservice
promotions (a) increase distribution (b) in-store and menu promotions
• Access maintenance (a) Government relationships (b) Food safety and industry issue (c) Trade networks (d) Monitoring & communication
• Consolidate current position (a) further support current industry and exporter brands Est. Cost +$3M
Increase support for trade customers and invest in growing demand for a wider range of cuts
• Reduce price pressure by increasing share of less price sensitive and more loyal customers
• Strategic account management (a) through leadership (b) relationship strategies (c) customer service Est. Cost +$3.4M
Increase support for industry brands, including current and future initiatives
• Raise Japanese trade and consumer perceptions of the delicious image of Aussie Beef to improve demand and value that consumers place on Aussie Beef
• Develop delicious positioning
• Increase consumer satisfaction through consistent quality outcomes and more convenient merchandising and product range Est. Cost +$1M

Review of the $1.50 Levy Increase for the FTF Program
Warwick Yates and Associates Pty Ltd, 2009
36
The conundrum for Australia is that Japan is perceived to be a high value market with Australia firmly entrenched in supplying the middle market at the expense of the US and other countries, yet this market is not growing. Australia is maintaining beef market share as was the FTF goal. Japanese importers like Australian product because it is safe and it has good traceability background which prevents brand erosion. Yet, Japan is a mature market. Market growth has occurred in the foodservice sector but not in the retail sector. Beef plays a lesser role in preferred protein consumption compared to that of pork and chicken (Figure 8). Figure 8 Consumption volumes in Japan by protein source
200
400
600
800
1,000
1,200
1,400
1,600
1,800
2,000
1999-00
2000-01
2001-02
2002-03
2003-04
2004-05
2005-06
2006-07
2007-08
Thou
sand
tonn
es (b
w)
a
Beef Pork Chicken
a Thousand tonnes boneless cuts equivalent. Source: ALIC Domestic beef production in Japan is stable while beef imports have declined since the BSE scares and domestic consumption has struggled to return to the consumption levels prior 2000-01 and earlier (Figure 9). Beef consumption is down 24% on year 2000 (year prior to Japan BSE). The overall Japanese meat market has shrunk from 836kt tonnes in 2003 to 821kt tonnes in 2007 (Figure10). The objective to maintain market share in a contracting market is, therefore, a difficult one to achieve. Yet this objective has been achieved. Figure 11 shows that in the absence of the US from the Japanese market, Australian beef market share has grown from 30% in 2003 to 45% in 2007 (Figure 11).

Review of the $1.50 Levy Increase for the FTF Program
Warwick Yates and Associates Pty Ltd, 2009
37
Figure 9 Japanese beef consumption: imports and domestic supply
0
200
400
600
800
1,000
1,200
1988
1989
1990
1991
1992
1993
1994
1995
1996
1997
1998
1999
2000
2001
2002
2003
2004
2005
2006
2007
Thou
sand
tonn
es (s
w)
Im portedDom estic
Source: FAPRI Figure 10 Source of Japanese imports, 1999-00 to 2007-08
100
200
300
400
500
600
700
800
1999-00
2000-01
2001-02
2002-03
2003-04
2004-05
2005-06
2006-07
2007-08
Thou
sand
tonn
es (s
w)
Australia US Other
Source: Ministry of Finance and MLA Japan market beef overview

Review of the $1.50 Levy Increase for the FTF Program
Warwick Yates and Associates Pty Ltd, 2009
38
Figure 11 Beef consumption in Japan by market of supply, 2002-03 and 2007-08
Source: ALIC and Japanese Ministry of Finance Australia supplies the majority of both the retail and foodservice sectors in Japan, supplying a wide range of beef types from high quality chilled to frozen manufacturing beef. The foodservice sector in Japan has continued to expand (Figure 12). The foodservice sector now accounts for around 62% of all beef consumed in Japan. Figure 12 Beef distribution channels in Japan
0%
10%
20%
30%
40%
50%
60%
70%
80%
90%
100%
1975
1980
1985
1990
1995
2000
2001
2002
2003
2004
2005
2006
2007
Foodservice In-hom e (retail) Process ing
Source: ALIC
2002-03(947kt)
Japan39%
US28%
Other 3%
Australia30%
2007-08(825kt)
Japan44%
US5%
Australia45%
Other 6%

Review of the $1.50 Levy Increase for the FTF Program
Warwick Yates and Associates Pty Ltd, 2009
39
3.3.2. Market Dynamics The Japanese market is still a significant market for Australia representing 39% of export volume and 43% of export value in 2007-08 (Figure 7). The Japanese market is mature with an increasing consumer age profile. The BSE events have seen Japan beef consumption struggle to recover to pre–BSE consumption levels. Beef lags behind pork and chicken in the Japanese market and with a self sufficiency ratio of 39% Japan needs to import beef to satisfy consumer demand. Figure 10 shows the source of Japanese beef imports from 1999-00 to 2007-08 and Figure 11 shows imports and domestic supply for 2002-03 and 2007-08. The future for the Japanese market is promising to some extent. The Food and Agriculture Policy Research Institute (FAPRI) has forecast that beef consumption in 2017 is set to expand by approximately 200,000 tonnes but this level of consumption is still 10% below year 2000, prior to Japan and US BSE occurrences (Figure 13). Figure 13 Japanese beef consumption, forecasts to 2017
0
200
400
600
800
1,000
1,200
1,400
1,600
1,800
1997
1999
2001
2003
2005
2007
2009
f20
11f
2013
f20
15f
2017
f
Thou
sand
tonn
es (c
w)
Source: FAPRI 3.3.3. MLA FTF Activities What were the key assumptions at the start of the FTF Program in 2004
• Consumer confidence in beef has been impacted by BSE in Japan and North America. Total beef consumption down 13% on 2003, down 24% on 2000 peak levels. It will take several years for beef consumption to recover to pre-BSE levels.
• US beef was banned from the market, and Australia was the dominant supplier to the market. The extent to which Australia can maintain will depend on timing and nature of US re-entry, as well as the trust and loyalty Australia can generate whilst US is out of market.
Review of the $1.50 Levy Increase for the FTF Program
Warwick Yates and Associates Pty Ltd, 2009
40
• Demand for Australian beef could begin to ease over the medium term if US beef gradually re-enters market.
• Aussie Beef brand well established with 97% awareness, but consumer and trade perceptions towards Australian beef need improvement.
What are the Realities in 2007?
• Most assumptions with regards to the Japan market environment eventuated as per the ‘Funding for the Future’ report.
• US beef gained re-entry to the market in Dec 2005, but a second ban was imposed in January 2006, to finally be lifted again in June 2006. Age limitations and verification process limited supplies of US beef.
• Total beef consumption in Japan remained weak, with little recovery in beef consumption levels. Higher prices for beef relative to alternative proteins, tight supply of Australian beef, stable Japanese production and strong consumer resistance to US beef, were the key factors that restrained the recovery.
• Awareness and preference (loyalty) to Aussie Beef remained strong. What were the FTF Aspirations in the Japan Market?
• Defend chilled and frozen volumes in the short-term, while pursuing opportunities for longer-term growth as beef consumption recovers.
• Encourage retailer and foodservice loyalty towards Aussie Beef by implementing targeted and customised marketing activities to ensure continued use of Australian beef following the re-entry of US beef to the market.
• Keep Aussie Beef top of mind for trade and consumers with innovative events linked to media tie-ups and PR activities.
• Maintain the preference for Aussie Beef over US beef by building on the awareness and image of Aussie Beef’s key attributes - safe, healthy and delicious – amongst trade, end-users and consumers.
• Maintain leading position in Japanese market following return of US beef by consolidating new relationships.
• Increased share of retail shelf space.
• Further grow image amongst trade and consumers.
• Maintain volume of Australian beef exports to Japan. Variations to the Original FTF Japan Program
• Budget proposal for Japan was $14.4M per year:
o $7.0M from the existing levy; and
o $7.4M of new levy funds. The marketing budget was reduced for Japan. Demand in Japan remained relatively weak, with on-going food safety scares, beef price increases linked to a strong Australian dollar, supply limitations due to drought in Australia and opportunities in other markets. Despite the lower than planned budget and a tough market environment, most KPIs for Japan were reached. Market share expansion in a stagnant market has been achieved and Australia is a

Review of the $1.50 Levy Increase for the FTF Program
Warwick Yates and Associates Pty Ltd, 2009
41
preferred supplier to both the retail and foodservice sectors, making Australia the number one supply source of beef in Japan. Where have the Additional Levy Funds Gone?
Additional levy funds were applied across 5 key program areas:-
1. New seasonal retail / consumer promotions utilising opinion leader
2. Trade & consumer communications (media, PR & events)
3. Expanded trade and end-user seminars & events
4. Shokuiku school visits to educate kids on Aussie Beef attributes
5. Category management / Exporter brand programs What have been the Quantitative & Qualitative Outcomes of Australia’s Marketing Efforts in Japan? Strategy Marketing Objectives Programs Outputs/Outcomes
Defend chilled and frozen beef volumes in the short term, while pursuing opportunities for longer-term growth as beef consumption recovers.
Defend Australia’s shelf space and sales volume in supermarkets around Japan by generating strong consumer preference for Aussie Beef.
Seasonal retail and consumer promotions utilising opinion leader.
Generated retailer and consumer loyalty towards Aussie Beef. Australian beef average share of retail sales increased from 42% in 2003 to 68% in 2008.
Strengthen the positioning, awareness and image of the Aussie Beef brand in Japan amongst trade and consumers.
Raise trade and consumer perceptions and image of Aussie Beef to improve the demand and value of Aussie Beef.
Trade and consumer communications – media, PR and events Shokuiku school visits to educate kids
Strong trade and consumer preference for Australian beef over US beef. 72% of trade believe Aussie Beef brand image has improved.
Build loyalty amongst trade and end-user customers in Japan by strengthening supply chains and reduce reliance on single US cuts (expand cuts usage).
Maintain majority market share and penetration through retail and foodservice sector.
Trade and end-user seminars and events Category management and exporter branded programs.
Majority market share, and penetration maintained amongst retail and foodservice, despite US return to market. Cuts exported diversified as supply chain strengthens.
Australian beef exports to Japan have increased on a year on year basis from 2003-04 to 2006-07 with further declines the following year (Table 20).

Review of the $1.50 Levy Increase for the FTF Program
Warwick Yates and Associates Pty Ltd, 2009
42
Table 20 Australian beef exports to Japan, 2003-04 to 2007-08
Export Volumes
(tonnes sw)
% of 2003-04 Export Volume
Export Value
(AU$M)
% of 2003-04 Export
Value
Japan Aust Beef Imports (tonnes sw)
% of Japan Total Beef
Market 2003-04 330,542 100 1,756 100 327,313 39 2004-05 418,939 127 2,452 140 415,440 50 2005-06 387,998 117 2,195 125 411,945 51 2006-07 403,172 122 2,139 122 406,075 49 2007-08 365,312 111 1,859 106 370,777 45
Source: MLA 3.3.4. Outcomes of FTF activities FTF activities have had the following outcomes. 1. New Seasonal Retail/Consumer Promotions Utilising Opinion Leader
• Domination of retail shelf space (Figure 14) and obtaining consumer attention during specific higher beef consumption periods, including:
o Christmas; o Spring; and o Father’s Day.
• Assisted in gaining and maintaining expanded market share of retail sales.
• Generated retailer and consumer loyalty towards Aussie Beef. Figure 14 Australian beef retail shelf space in Japan (%), POS data
0
10
20
30
40
50
60
70
80
90
100
July
03/
04
Oct
03/
04
Jan
03/0
4
Apr
03/
04
July
04/
05
Oct
04/
05
Jan
04/0
5
Apr
04/
05
July
05/
06
Oct
05/
06
Jan
05/0
6
Apr
05/
06
July
06/
07
Oct
06/
07
Jan
06/0
7
Apr
06/
07
July
07/
08
Oct
07/
08
Jan
07/0
8
Apr
07/
08
Jun
07/0
8
Mar
ket s
ales
(%)
Source: ALIC and MLA Japan market beef overview 2008.
Calendar year & market situation Retail Share
Oct 01 - Dec 03: BSE in Japan, Aust & Us in market 42%
Jan 04 - Dec 05: US out of market 65%
Jan 06 - Jun 08: US back in market 68%

Review of the $1.50 Levy Increase for the FTF Program
Warwick Yates and Associates Pty Ltd, 2009
43
2. Consumers are more aware of Aussie Beef with an increased preparedness to purchase Japanese market consumer surveys of people considering purchasing beef in 2002-03 and 2007-08 show that there was an increase in the number of consumers considering Aussie Beef purchases and a slight increase in awareness of Aussie Beef (Table 21). Table 21 Changes in consumer perceptions to Aussie Beef, 2002-03 and 2007-08
Consumer Consideration 2002-03 2007-08
Consider Aussie Beef 66% 84%
Awareness of Aussie Beef 97% 99% 3. Communications (Media, PR & Events)
• To keep Aussie Beef top of mind and generate loyalty amongst trade, end users and consumers, a range of events, media tie-ups and web communication activities were implemented.
• MLA has assisted in generating support amongst the trade and end users, and has encouraged a stronger preference for Aussie Beef over US beef amongst consumers. MLA has worked with 55,000 foodservice operators.
Figure 15 Number of media circulations
0
50
100
150
200
250
2003-04
2004-05
2005-06
2006-07
2007-08
No.
of m
edia
circ
ulat
ions
(mill
ions
)
Consumer Media Trade Media
Source: MLA Tokyo

Review of the $1.50 Levy Increase for the FTF Program
Warwick Yates and Associates Pty Ltd, 2009
44
Figure 16 shows the number of consumer seminar events while Figure 17 highlights the number of email registered people demonstrating the significant trend to expanded internet activity in this market. Figure 16 Number of consumer seminar events
0
10
20
30
40
50
60
70
2003-04
2004-05
2005-06
2006-07
2007-08
No.
of e
vent
s
Cooking schools Hotel events School vis it
Nutrition Opinion leaders Other
Source: MLA Tokyo Australia now sits in a privileged position in that Japanese end users and consumers believe Australian beef is a safer, cleaner product than US beef. The interesting trend is that major Japanese end users are taking an aggressive stance against US beef alleviating the need for Australia to become involved in country to country competitive battles and allowing both parties to concentrate on promoting beef over other protein choices. Combined with a competitive Australian dollar, Australian beef has, and will continue to maintain market share in this important market for Australia.
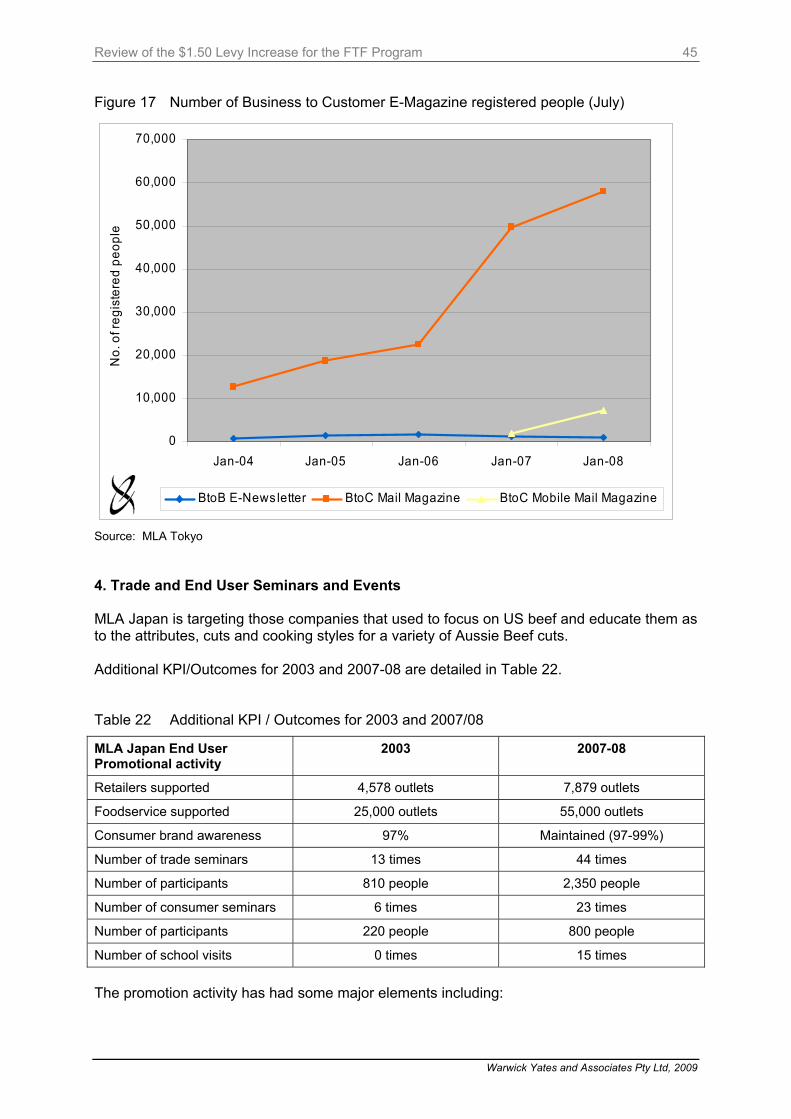
Review of the $1.50 Levy Increase for the FTF Program
Warwick Yates and Associates Pty Ltd, 2009
45
Figure 17 Number of Business to Customer E-Magazine registered people (July)
0
10,000
20,000
30,000
40,000
50,000
60,000
70,000
Jan-04 Jan-05 Jan-06 Jan-07 Jan-08
No.
of r
egis
tere
d pe
ople
BtoB E-News letter BtoC Mail Magazine BtoC Mobile Mail Magazine
Source: MLA Tokyo 4. Trade and End User Seminars and Events MLA Japan is targeting those companies that used to focus on US beef and educate them as to the attributes, cuts and cooking styles for a variety of Aussie Beef cuts. Additional KPI/Outcomes for 2003 and 2007-08 are detailed in Table 22. Table 22 Additional KPI / Outcomes for 2003 and 2007/08
MLA Japan End User Promotional activity
2003 2007-08
Retailers supported 4,578 outlets 7,879 outlets
Foodservice supported 25,000 outlets 55,000 outlets
Consumer brand awareness 97% Maintained (97-99%)
Number of trade seminars 13 times 44 times
Number of participants 810 people 2,350 people
Number of consumer seminars 6 times 23 times
Number of participants 220 people 800 people
Number of school visits 0 times 15 times The promotion activity has had some major elements including:

Review of the $1.50 Levy Increase for the FTF Program
Warwick Yates and Associates Pty Ltd, 2009
46
• Developing an appreciation of Aussie Beef amongst the hotel chef and fine dining segment, Chefs Tables and food media tie-ups; and
• Aussie Forum has helped raise trade and end-users safe image of, and loyalty towards Aussie Beef. Despite US return in 2005, Australia maintained majority market share.
This promotion activity has led to the trade believing that the quality and image of Australian beef has improved and 92% of the trade and end users in the Japanese market believe MLA activities in Japan are effective (Tables 23 and 24). The Review team met with key Japanese importers, wholesale and retail groups and attended the Aussie Forum in Tokyo. Those meetings substantiated the improved status of Australian beef in the Japanese market. 5. Category Management and Exporter Branded Programs One of the key success factors in the Japanese market in difficult trading conditions has been the effective implementation of the ICA program and Australian exporter branded programs. Key elements of this program were as follows:
• The ICA program for Japan was developed in 2002-2003 with 29 exporters participating, which expanded to 40 exporters by 2007-2008.
• A category management program was developed as a pilot project in 2005-06, where MLA and a consultant worked with a couple of Australian exporters and their trade and retail customers in Japan to develop joint category management projects.
• In particular, two exporters worked closely with their customers to analyse their beef business from production through to supply chain sales volumes and values for each cut produced/sold. Both exporter and customer developed a closer relationship and understanding of each other’s business.
• From 2007-08, the category management project was supported by exporter ICA programs.
The improvement in the trade’s perception of Australian beef is reflected in a recent (July 2008) survey which showed that 60% of those surveyed believe the quality of Australian beef has improved in recent years and 72% believe the brand image has improved (Table 23). The same survey showed that 92% of respondents thought MLA’s activities aimed at improving the image of Australian beef had been effective (Table 24).
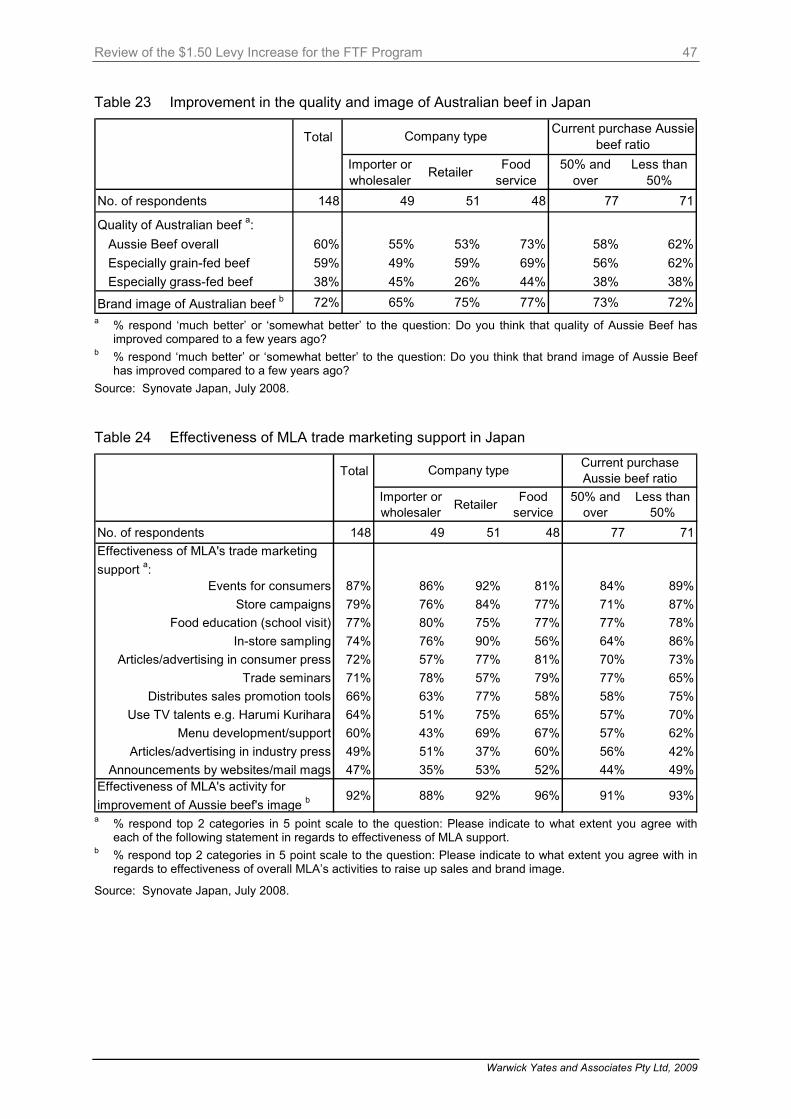
Review of the $1.50 Levy Increase for the FTF Program
Warwick Yates and Associates Pty Ltd, 2009
47
Table 23 Improvement in the quality and image of Australian beef in Japan
Total
Importer or wholesaler Retailer Food
service50% and
overLess than
50%No. of respondents 148 49 51 48 77 71
Quality of Australian beef a: Aussie Beef overall 60% 55% 53% 73% 58% 62% Especially grain-fed beef 59% 49% 59% 69% 56% 62% Especially grass-fed beef 38% 45% 26% 44% 38% 38%
Brand image of Australian beef b 72% 65% 75% 77% 73% 72%
Company type Current purchase Aussie beef ratio
a % respond ‘much better’ or ‘somewhat better’ to the question: Do you think that quality of Aussie Beef has
improved compared to a few years ago? b % respond ‘much better’ or ‘somewhat better’ to the question: Do you think that brand image of Aussie Beef
has improved compared to a few years ago? Source: Synovate Japan, July 2008. Table 24 Effectiveness of MLA trade marketing support in Japan
Total
Importer or wholesaler Retailer Food
service50% and
overLess than
50%No. of respondents 148 49 51 48 77 71Effectiveness of MLA's trade marketing support a:
Events for consumers 87% 86% 92% 81% 84% 89%Store campaigns 79% 76% 84% 77% 71% 87%
Food education (school visit) 77% 80% 75% 77% 77% 78%In-store sampling 74% 76% 90% 56% 64% 86%
Articles/advertising in consumer press 72% 57% 77% 81% 70% 73%Trade seminars 71% 78% 57% 79% 77% 65%
Distributes sales promotion tools 66% 63% 77% 58% 58% 75%Use TV talents e.g. Harumi Kurihara 64% 51% 75% 65% 57% 70%
Menu development/support 60% 43% 69% 67% 57% 62%Articles/advertising in industry press 49% 51% 37% 60% 56% 42%
Announcements by websites/mail mags 47% 35% 53% 52% 44% 49%Effectiveness of MLA's activity for improvement of Aussie beef's image b
92% 88% 92% 96% 91% 93%
Company type Current purchase Aussie beef ratio
a % respond top 2 categories in 5 point scale to the question: Please indicate to what extent you agree with
each of the following statement in regards to effectiveness of MLA support. b % respond top 2 categories in 5 point scale to the question: Please indicate to what extent you agree with in
regards to effectiveness of overall MLA’s activities to raise up sales and brand image.
Source: Synovate Japan, July 2008.
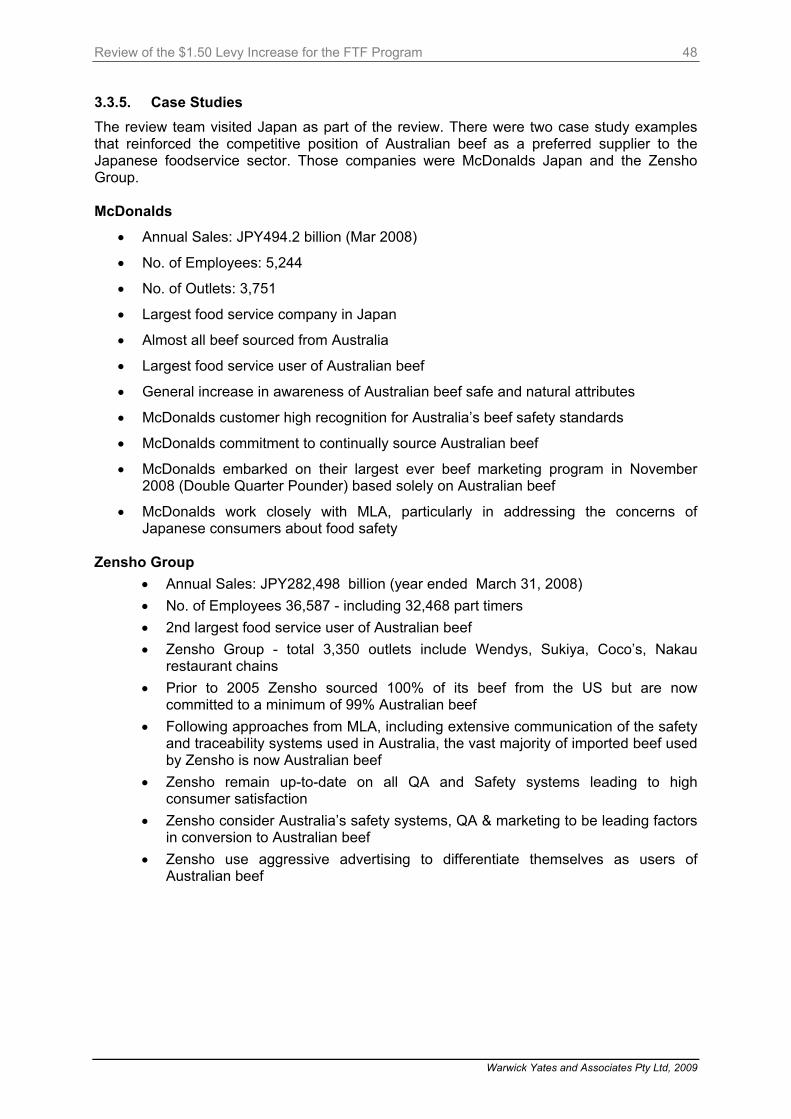
Review of the $1.50 Levy Increase for the FTF Program
Warwick Yates and Associates Pty Ltd, 2009
48
3.3.5. Case Studies The review team visited Japan as part of the review. There were two case study examples that reinforced the competitive position of Australian beef as a preferred supplier to the Japanese foodservice sector. Those companies were McDonalds Japan and the Zensho Group. McDonalds
• Annual Sales: JPY494.2 billion (Mar 2008)
• No. of Employees: 5,244
• No. of Outlets: 3,751
• Largest food service company in Japan
• Almost all beef sourced from Australia
• Largest food service user of Australian beef
• General increase in awareness of Australian beef safe and natural attributes
• McDonalds customer high recognition for Australia’s beef safety standards
• McDonalds commitment to continually source Australian beef
• McDonalds embarked on their largest ever beef marketing program in November 2008 (Double Quarter Pounder) based solely on Australian beef
• McDonalds work closely with MLA, particularly in addressing the concerns of Japanese consumers about food safety
Zensho Group
• Annual Sales: JPY282,498 billion (year ended March 31, 2008) • No. of Employees 36,587 - including 32,468 part timers • 2nd largest food service user of Australian beef • Zensho Group - total 3,350 outlets include Wendys, Sukiya, Coco’s, Nakau
restaurant chains • Prior to 2005 Zensho sourced 100% of its beef from the US but are now
committed to a minimum of 99% Australian beef • Following approaches from MLA, including extensive communication of the safety
and traceability systems used in Australia, the vast majority of imported beef used by Zensho is now Australian beef
• Zensho remain up-to-date on all QA and Safety systems leading to high consumer satisfaction
• Zensho consider Australia’s safety systems, QA & marketing to be leading factors in conversion to Australian beef
• Zensho use aggressive advertising to differentiate themselves as users of Australian beef

Review of the $1.50 Levy Increase for the FTF Program
Warwick Yates and Associates Pty Ltd, 2009
49
3.3.6. Conclusions The Japanese market has been a prime export market for Australia. Despite the recent absence of the US from this market and Australia supplying the majority of the shortfall in US tonnage, the market has not expanded, with consumption remaining stable. Some would argue that the market is mature and marketing funds should be diverted to emerging markets. However, Australia has a preferred supplier image to the Japan market and this is a position that should not be easily surrendered having gained the majority market share of the trade from US beef suppliers. The additional market share alone is worth over $500M to the Australian beef industry. The US is aggressively trying to regain their lost share back from Australia. Over the last two years Australia has made ground in the retail and foodservice sectors with Aussie Beef a preferred choice among trade, retail and foodservice consumers. This effort has to some extent been thwarted by the high AUD (up until last quarter of 2008). Despite a price impediment, key supermarket chains and foodservice operators have developed a loyalty for Australian product which augurs well for maintenance of the current position for the next 2-3 years. The ICA program has brought Australian exporters into close contact with Japanese importers and enabled effective development of exporter branded product into Japan supply chains and marketing channels. The FTF increased expenditure to hold market share with approximately 394,000 tonnes has achieved that objective. The FTF activities have positioned Australia well to compete with the re-entry of the US into the Japanese market and to take a reasonable share of the forecast 200,000 tonne (cw) market growth in coming years.

Review of the $1.50 Levy Increase for the FTF Program
Warwick Yates and Associates Pty Ltd, 2009
50
Table 25 FTF program performance in Japan: summary against original objectives
Performance Criteria Program Commencement 2008
Marketing Budget ($M) 14.4 10.6
Tonnage Imported 283,698 365,312
Market Growth (tonnes) Nil market growth to 2010 86,614
Market share of imports 39% 45% Average Retail Market Share Status
42% 68%
Support Industry and Other Brands
• 72% of trade believe Aussie Beef brand image has improved
• 60% of trade believe beef quality has improved
• Aussie Beef Forum held every two years attracting approximately 1,000 key trade, end users and media
• School Lunch Program Export Market Trade Support
• Achieved through ICA program support for exporter brands
• Japanese meat trade missions to Australia
• Technical seminars – approximately 55 conducted each year
Program Effectiveness • 92% of Japanese trade and end users believe MLA activities effective
• Strong consumer preference and loyalty towards Aussie Beef has been generated amongst consumers and the trade.
• Consumer consideration to purchase Aussie Beef has increased from 66% to 84% in the past five years.
• Despite the return of US beef to the market in 2006, Australia has maintained a larger market share than expected.
• The Australian beef industry is now well positioned to defend market share in the face of increasing competition.

Review of the $1.50 Levy Increase for the FTF Program
Warwick Yates and Associates Pty Ltd, 2009
51
33..44.. KKoorreeaa 3.4.1. Introduction The key element of the Korea FTF strategy was to defend frozen and chilled volumes in the short term while investing to position Australia for success as the chilled market develops. The key objectives to realise this strategy were as follows:
• In partnership with industry, maintain and improve the new-found leading position and market share in the Korean market following the return of the US by consolidating new relationships with support programs and by ongoing promotion of alternative cuts to expand cut utilisation.
• Capture 32,000 tonnes of additional export sales over the next five years on top of the extraordinary levels achieved in 2004.
• Establish the Hoju Chungjung Woo brand, with over 90% consumer awareness, market leading brand attribute ratings, broad point-of-sale use and steadily increasing in home penetration and menu space.
The marketing focus for MLA has been to work directly with trade, retail and foodservice rather than utilising limited funds for mass media advertising. In a developing market this has provided a strong foundation onto which an effective communication platform could be launched via the mass media, establishing a strong consumer franchise for Hoju Chungjung Woo brand, with benefits including:
• Further growth of the delicious and nutritious image of Australian beef with trade and consumers.
• Maintaining penetration of the growing modern retail sector at 100% of the current 300 outlets to 80% of 500 outlets after the return of the US.
3.4.2. Market Dynamics Korea is an emerging market that is growing consistent with Korea’s efforts to modernise the country. The absence of the US from this market has presented an opportunity for Australia to build on previous marketing effort and secure the middle market ground with Hoju Chungjung Woo safety and quality mark ("Australian Clean & Safe Beef"). Australia’s market share has grown from 26% in 2002 to 74% in 2007, albeit that overall consumption has dropped as a consequence of the BSE scares. The other key factor has been a better understanding of Australian beef and a move away from the previous reliance on two US cuts. At the current time significant currency movements and a reduction in their credit limits from the equivalent of 180 days to 60 days has made trading conditions difficult in the short term. Despite these impediments Korean exporters continue to seek Australian beef in preference to US beef. Even significant discounting of US beef by supermarkets previously held in cold stores has not undermined Australia’s preferred supplier status in this market. The Korean market has developed beyond the previous US two cut dependence to forequarter and other cuts (Figure 18).
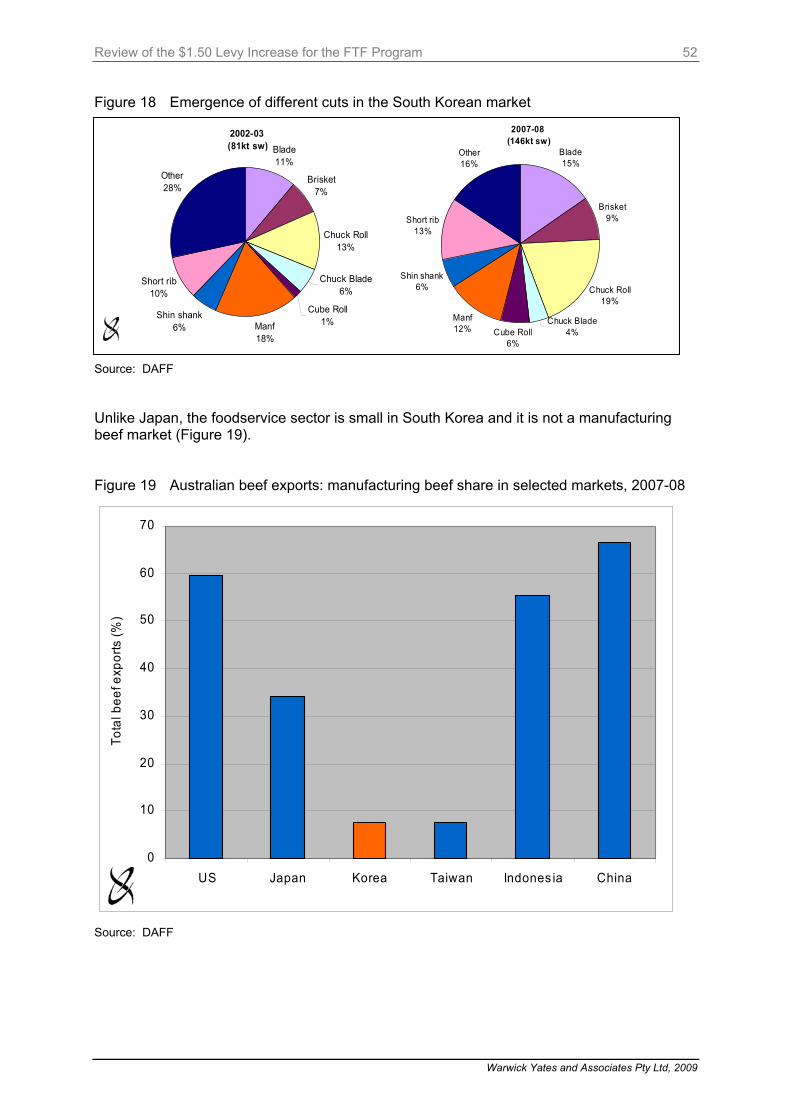
Review of the $1.50 Levy Increase for the FTF Program
Warwick Yates and Associates Pty Ltd, 2009
52
Figure 18 Emergence of different cuts in the South Korean market
Source: DAFF Unlike Japan, the foodservice sector is small in South Korea and it is not a manufacturing beef market (Figure 19). Figure 19 Australian beef exports: manufacturing beef share in selected markets, 2007-08
0
10
20
30
40
50
60
70
US Japan Korea Taiwan Indones ia China
Tota
l bee
f exp
orts
(%)
Source: DAFF
2002-03 (81kt sw) Blade
11%
Brisket7%
Chuck Roll13%
Chuck Blade6%
Cube Roll1%Manf
18%
Shin shank6%
Short rib10%
Other28%
2007-08 (146kt sw)
Blade15%
Brisket9%
Chuck Roll19%
Chuck Blade4%Cube Roll
6%
Manf12%
Shin shank6%
Short rib13%
Other16%

Review of the $1.50 Levy Increase for the FTF Program
Warwick Yates and Associates Pty Ltd, 2009
53
While consumption has been flat primarily because of BSE issues, a high AUD and a 30,000 tonne overhang of US beef in cold store, projections are for the Korean market to grow in the coming years. There is an inability to further expand Korean Hanwoo beef production meaning that market growth can only be serviced by imports. Those imports are most likely to come from the US and Australia meaning that although Australia will lose current market share, it will participate in a growing beef consumption “pie” in Korea. The Korean beef market continues to grow although recent currency and US beef overhangs have slowed market growth (Figure 20). Australia has significantly grown market share over the FTF period (Figure 21). Figure 20 Australian beef exports to South Korea
20,000
40,000
60,000
80,000
100,000
120,000
140,000
1996-97
1997-98
1998-99
1999-00
2000-01
2001-02
2002-03
2003-04
2004-05
2005-06
2006-07
2007-08
Tonn
es (s
w)
100,000
200,000
300,000
400,000
500,000
600,000
700,000
800,000
900,000
1,000,000
Val
ue (A
$m)
ChilledFrozenValue
Source: DAFF and ABS
While consumption has been flat in recent years the market is projected to grow significantly over the next decade and this growing demand will be met solely by imports (Figure 22).

Review of the $1.50 Levy Increase for the FTF Program
Warwick Yates and Associates Pty Ltd, 2009
54
Figure 21 Market share of South Korean beef imports
0%
20%
40%
60%
80%
100%
1996-97
1997-98
1998-99
1999-00
2000-01
2001-02
2002-03
2003-04
2004-05
2005-06
2006-07
2007-08
Mar
ket s
hare
Aus tralia US NZ Canada Other
Source: Ministry of Agriculture and Forestry (MAF) Figure 22 Per capita consumption of beef in Korea, 2003 to 2018
8.1
6.8 6.7 6.87.5
8.75
10.6
12.65
0
2
4
6
8
10
12
14
2003
2004
2005
2006
2007
2008f
2013f
2018f
kg/c
apita
Source: Korean Rural Economic Institute (KREI) projections, January 2008

Review of the $1.50 Levy Increase for the FTF Program
Warwick Yates and Associates Pty Ltd, 2009
55
3.4.3. MLA FTF Activities
What were the key assumptions at the start of the FTF program in 2004? Australia had an unprecedented opportunity to grow markets and awareness while the US were locked out and there was:
• limited consumer awareness and acceptance of Australian beef;
• to the extent there was awareness, there was poor consumer perceptions as to the quality of Australian beef;
• general consumer concern as to the safety of imported beef;
• limited demand to a narrow range of meat cuts; and
• limited trade knowledge of the capabilities of the Australian meat industry and the range and attributes of Australian beef.
What are the realities in 2007? The US were fully locked out of the market until September 2006 where there was a partial reintroduction and June 2008 where there was a full reintroduction of US produced beef albeit with age limitations (under 30 months). Benefits from the US lock out included:
• Volumes of imported Australian beef rose to a peak of 206,000 tonnes in 2007 from 130,000 tonnes in 2004.
• The forecasts for 2008, 2009, 2010 are 187,000, 166,000 & 166,000 tonnes, respectively.
• The forecast for the US in the corresponding period is 70,000, 125,000 & 166,000 tonnes respectively.
• Total imported volumes in 2003 were 451,000 tonnes and are projected to be 373,000 in 2010.
Table 26 outlines Australia’s relative strengths, weaknesses, opportunities and threats. The content has been prepared by MLA Korea and is a realistic assessment of how Australia has performed, what needs to be done in the future to maintain its market position and take a slice of future consumption estimates as the US progressively re-enters this market. The Korean market represents a significant growth opportunity for the Australian beef industry but Australian exporters must get to know this market better and perform accordingly.

Review of the $1.50 Levy Increase for the FTF Program
Warwick Yates and Associates Pty Ltd, 2009
56
Table 26 Australian SWOT analysis for the South Korean market Australia’s Strengths Australia’s Weaknesses • Food safety –clean, safe image • MLA marketing activities compared to US
Meat Export Federation, New Zealand/Canada
• New awareness levels- HCW , Australian beef
• Industry relationships • Ability to develop new cuts • The personnel/skills to develop new cuts • Range of products- cuts & type of feed • Better packaging technology • Many exporters can still be developed out of
Australia
• Miscommunication between exporters and importers
• Apparent need for Australian exporters to sell full sets
• Lack of understanding of Australian supply chain by importers
• Inability to supply straight containers of single cuts
• Exporter response time • Perception of our product • US sale orientated Australian production
focus • Our grading system deemed not comparable
to the US grading system • Koreas understand of Eating Quality Assured
(EQA) and the attributes Australia’s Opportunities Australia’s Threats • Gain back and grow beef consumption levels • Total supply chain education training for retail
and suppliers • Capitalise on the” well being” trends • Time left to develop new cuts • Close relationships between Retailers and
Family Restaurants • Market intelligence- what the exporter wants
to sell Korea • US beef importers that have returned to US
beef still purchase Australian beef • ICA activities both exporter based and
importer based
• Loss of market share • Everything returns back the same as pre BSE • AUSKOR FTA delayed and KORUS FTA is
ratified by both countries • Huge budgets for the US to buy their way
back in • Koreans have shifted to other protein sources • US to use chilled beef to get orders of Short
rib & Chuck roll • US back in the market- continue to jog the
BSE memory with consumption slow to increase
• Importers dumping US beef because of high stock levels
• Negative media reaction to all beef The following near and longer term priorities in this market suggest that Korea is a growth market that Australia cannot afford not to participate and therefore should not decrease its marketing effort. Near term
• Uncertain effect regarding major stock holding of US beef and resultant probable flooding of the market of cheap US beef.
• Uncertainty over the KORUS, FTA ratification and the impact on the AUSKOR, FTA negotiations.
• Concerted effort by the US to recapture market share.
• Korean media persistence to highlight the safety concerns for beef products igniting consumer concerns.
• High prices of beef over the past few years have seen it taken off the menu and replaced by pork and seafood.
• Preference for two cuts still exists but at a much reduced level.
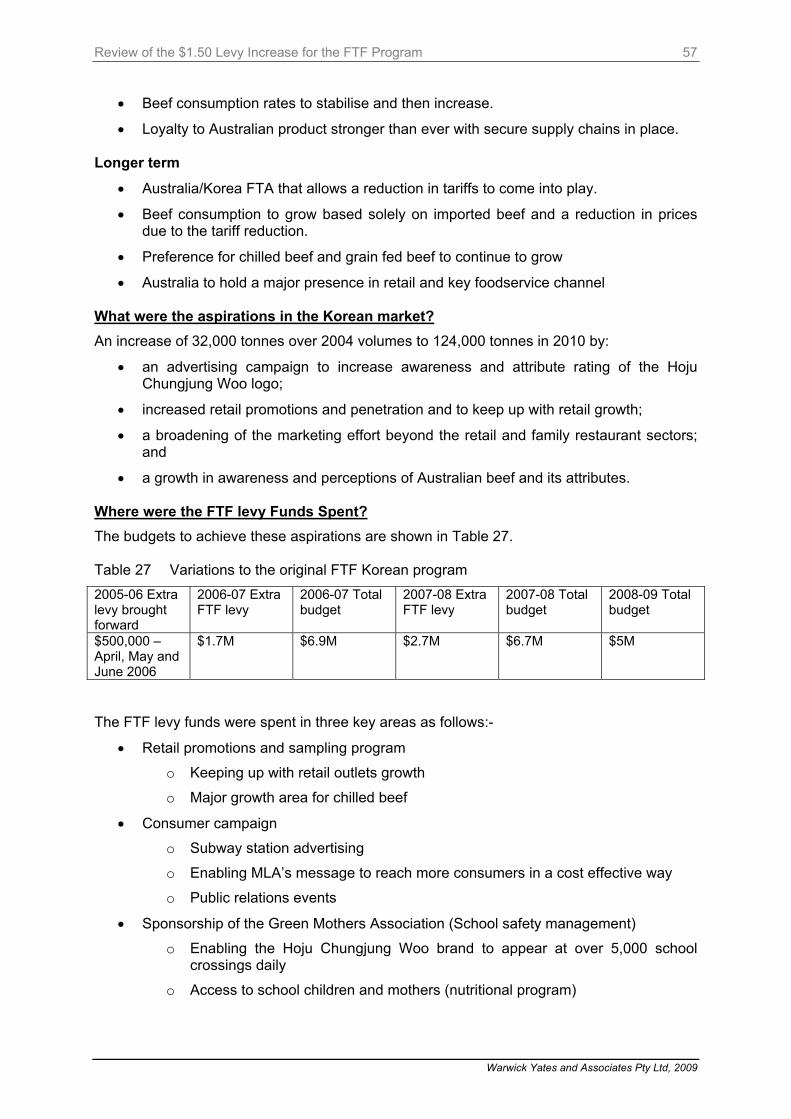
Review of the $1.50 Levy Increase for the FTF Program
Warwick Yates and Associates Pty Ltd, 2009
57
• Beef consumption rates to stabilise and then increase.
• Loyalty to Australian product stronger than ever with secure supply chains in place.
Longer term
• Australia/Korea FTA that allows a reduction in tariffs to come into play.
• Beef consumption to grow based solely on imported beef and a reduction in prices due to the tariff reduction.
• Preference for chilled beef and grain fed beef to continue to grow
• Australia to hold a major presence in retail and key foodservice channel What were the aspirations in the Korean market? An increase of 32,000 tonnes over 2004 volumes to 124,000 tonnes in 2010 by:
• an advertising campaign to increase awareness and attribute rating of the Hoju Chungjung Woo logo;
• increased retail promotions and penetration and to keep up with retail growth;
• a broadening of the marketing effort beyond the retail and family restaurant sectors; and
• a growth in awareness and perceptions of Australian beef and its attributes.
Where were the FTF levy Funds Spent? The budgets to achieve these aspirations are shown in Table 27. Table 27 Variations to the original FTF Korean program 2005-06 Extra levy brought forward
2006-07 Extra FTF levy
2006-07 Total budget
2007-08 Extra FTF levy
2007-08 Total budget
2008-09 Total budget
$500,000 – April, May and June 2006
$1.7M $6.9M $2.7M $6.7M $5M
The FTF levy funds were spent in three key areas as follows:-
• Retail promotions and sampling program
o Keeping up with retail outlets growth
o Major growth area for chilled beef
• Consumer campaign
o Subway station advertising
o Enabling MLA’s message to reach more consumers in a cost effective way
o Public relations events
• Sponsorship of the Green Mothers Association (School safety management)
o Enabling the Hoju Chungjung Woo brand to appear at over 5,000 school crossings daily
o Access to school children and mothers (nutritional program)

Review of the $1.50 Levy Increase for the FTF Program
Warwick Yates and Associates Pty Ltd, 2009
58
What have been the Qualitative and Quantitative Outcomes of Australia’s Marketing Efforts in Korea? The objectives and outcomes of MLA’s marketing effort in Korea are outlined in Table 28. The Korean market FTF program resulted in total beef imports growing from 91,096 tonnes in 2004-05 to 146,093 tonnes in 2007-08 and chilled beef imports growing from 15,407 tonnes in 2004-05 to 31,826 tonnes in 2007-08 (Figure 23). Figure 23 Growth in Australian beef exports to Korea, 2002 to 2007
0
20,000
40,000
60,000
80,000
100,000
120,000
140,000
160,000
180,000
2002
2003
2004
2005
2006
2007
Tonn
es (s
w)
Chilled BeefFrozen Beef
Total Beef
Source: KOTIS

Review of the $1.50 Levy Increase for the FTF Program
Warwick Yates and Associates Pty Ltd, 2009
59
Table 28 Korean marketing program performance
Strategy Marketing Objectives Programs Outputs/Outcomes
• Current strategy plus enhancements of brands, emerging markets and manufacturing defence
• Maintain current volumes of chilled (retail) and frozen (foodservice) beef to Korea as the US returns to the market - this will require that the market grows to absorb volumes from the US, or that we increase customer loyalty
• Clean green positioning • Maintain brand awareness • Retail and foodservice promotions
a) Increase distribution b) In-store promotions
• Access maintenance c) Government relationships d) Food safety and industry
issues e) Trade networks f) Monitoring and
communication • Consolidate current position
a) Further support current MLA and exporter brands
• Brand awareness has continued to grow – see accompanying consumer surveys
• MLA has kept up with the grow in retail outlets in terms of support, product trials, promotions education and POS material
• Government and trade relationships have an approval rating of over 80% - see biannual survey
• Industry Collaboration Agreement activities which support individual exporter brands have increased in participation and value
• Increase support for trade customers and invest in growing demand for a wider range of cuts
• Reduce price pressure by increasing share of less price sensitive and more loyal customers
• Strategic account management a) Thought leadership b) Relationship strategies c) Customer service
• There has been a continual increase in trade satisfaction, awareness and support
• See annual trade surveys 2003 to 2008
• Increase support for industry brands, including current and future initiatives
• Raise trade and consumer perceptions of the delicious image of Hoju Chungjung woo
• Develop delicious positioning • Increase customer satisfaction
through consistent quality outcomes and more convenient merchandising and product range
• Product trial has increased from over 14,000 per year to 21,000
• Trade and consumer perception have increased – see consumer trade and surveys
• Merchandising activities and POS materials have increased in line with sampling days

Review of the $1.50 Levy Increase for the FTF Program
Warwick Yates and Associates Pty Ltd, 2009
60
3.4.4. Outcomes of FTF activities The outcomes of the Korea market FTF program can be summarised as follows.
Retail promotion and sampling program • Outlets with beef promotion increasing from 1,025 to 1,593 • Sampling days increasing from 14,211 to 21,308 • Point of sale materials (HCW stickers) increasing from 5.6M to 7.4M • Chilled beef growth increasing from 21.3kt to 44.1kt
Major consumer campaign • Subway station advertising in 10 stations with any 4 at one time • Reaching over 22M commuters each month • Awareness of Australian beef and the Clean & Safe logo increasing from 50.8% to
88.8%
Sponsorship of the Green Mothers Association (school safety management) • The clean & Safe logo at over 5,000 school crossings daily • Access to the school children and mothers (nutrition program)
Projections to 2010 of 166kt will see an increase 42kt with full US recovery. Figure 24 shows the outcomes of the Korea market FTF program between 2005 and 2007. The additional marketing funds have enabled Australia to aggressively ramp up the marketing program while the US has been absent from this market, secure market share, retail exposure and allow Australia to effectively position itself to take advantage of forecast market growth in the future. This activity has been supplemented by a significant increase in the number of in store sampling days (Figure 25) and subsequent use of the HCW sticker on Australian beef in these stores (Figure 26). Figure 24 Growth of retail outlets for Australian beef 2002 to 2007
615959595957
317255
187185139120
335
309283244
220199
713
623
376418
488529
0
100
200
300
400
500
600
700
800
2002 2003 2004 2005 2006 2007
Dep't store S uperma rket
Hypermar ket T otal Retail Outlets
Keeping up with the growth of Retail Outlets
Hypermarkets
Supermarkets
Dep’t stores
• Growth of Total Retail OutletsIn 2005 : 529 outlets ? 2007 : 713 outlets
• Growth of HypermarketsIn 2005 : 283 outlets ? 2007 : 335 outlets
Total outlets

Review of the $1.50 Levy Increase for the FTF Program
Warwick Yates and Associates Pty Ltd, 2009
61
Figure 25 Increase in the Number of In store Sampling days 2005 and 2007
Increase in the number of Sampling Days
1 ,5391 ,4461 ,0251 ,1381 ,0 418 23
21 ,308
19 ,031
14 ,21115 ,0 82
9 ,187
7 ,528
0
5 ,000
10 ,000
15 ,000
20 ,000
25 ,000
20 0 2 20 0 3 2 0 04 2 0 05 2 00 6 2 00 7
P r o m o tio n O u tle t N u m b e r S a m p l in g O u tle t N u m b e r
• Increase in the number of outlets where Australian beef is promoted In 2005 : 1,025 stores ? 2007 : 1,593 stores
• Increase in Sampling Days
In 2005 : 14,211 days ? 2007 : 21,308 days
Figure 26 Increase in the Number of HCW packaging stickers 2005 and 2007
5,650,0005,800,000
7,400,000
5,500,000
1,950,000
1,500,00034,693
45,102
127,210130,680
134,149
171,156
0
1,0 00,000
2,0 00,000
3,0 00,000
4,0 00,000
5,0 00,000
6,0 00,000
7,0 00,000
8,0 00,000
2002 2003 2004 2005 2006 2007-
20,000
40,000
60,000
80,000
100 ,00 0
120 ,00 0
140 ,00 0
160 ,00 0
180 ,00 0Au stra lian beef s tickersAu stra lian beef s tickers Am o u nt
Increase in use of country of origin stickers
(Unit: ea, Amount: A$)
• Increase of Australian beef, clean & safe stickers (point of sale materials)
In 2005 : 5,650,000 stickers ? 2007 : 7,400,000stickers

Review of the $1.50 Levy Increase for the FTF Program
Warwick Yates and Associates Pty Ltd, 2009
62
Extra levy spend in retail was focused on the following activities:
• Retail focus on promotions, loyalty, training and product trial
• Most ICA activity is via retail to help offset levy expenditure and shows commitment by exporters and importers
• All programs are measured covering shelf space, volumes, consumer and trade feedback and part of the Korea KPI’s
• Excellent way for consumers to trial and compare Australian, domestic and their memory of US beef
• Confident of retaining shelf space
• Hypermarkets are still expanding Subway advertising – was a huge success with the following quantitative results in changing attitudes to Australian beef
• 22.6M commuters in each month
• Proximity to major retail outlets
• Cost effective = A$8,000 pm per station
• The right message was delivered at the right time
• 2006 – 49.3% not aware, 50.7% awareness
• 2008 – 11.2% not aware, 88.8% awareness
• Evaluation is underway for another medium Recognition at 5,000 school crossings daily
• Volunteer organisations of Mums of school children
• 70,000 member Mums
• Australian beef logo is on all flags and uniforms
• Fitted perfectly with the platform of “clean and safe”
• Facilitates all school safety issues from food to school crossings
• First lady of Korea is the patron
• Regional manager MLA is on the board of directors 3.4.5. Case Studies Australia is concentrating its marketing efforts in the Hyper and Supermarket sectors which have the following key drivers:
• Uncertainty over when the major retailers will start to sell US beef.
• Concerted effort by the US to recapture market share at retail by adopting the same methods as used by Australia.
• Country of origin laws having an adverse effect on beef sales.
• High prices of beef and adverse press over the past few years has seen cabinet space reduced for beef and opened up for pork.

Review of the $1.50 Levy Increase for the FTF Program
Warwick Yates and Associates Pty Ltd, 2009
63
• Retailers are moving away from service counters to retail ready packaging thus allowing a quicker transition away from a two cut mentality (sell by meals rather than by cut name).
• Beef sales rates are set to stabilise and then increase.
• Loyalty to Australian product is stronger than ever with secure supply chains and exporter brands in place.
While the butcher shop sector has been a more traditional supply channel for Korean consumers the market preference is moving to department stores and Hyper markets (Figures 27 and 28). Figure 27 Retail market segmentation
Market segmentation - Retail
Cost
No of SKU’s
Variety
Store Size
Low High
Low
Low
Low
High
High
High
Butcher’s Shops
Department stores
TV Home shopping
Hypermarkets
Supermarkets & convenience stores
Retail segment marketing potential
Internet Home shopping
Major growth potential
Medium growth potential
Minor growth potential
In decline – no growth potential
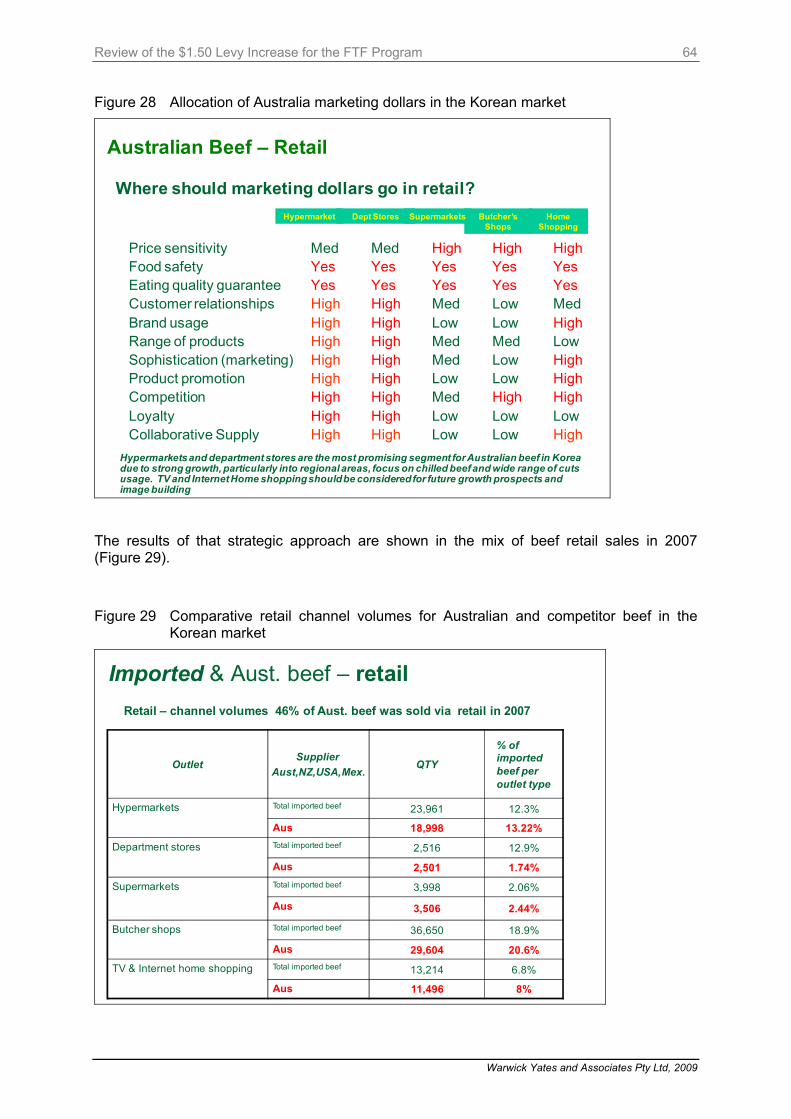
Review of the $1.50 Levy Increase for the FTF Program
Warwick Yates and Associates Pty Ltd, 2009
64
Figure 28 Allocation of Australia marketing dollars in the Korean market
Australian Beef – Retail
Where should marketing dollars go in retail?
Price sensitivity Med Med High High HighFood safety Yes Yes Yes Yes YesEating quality guarantee Yes Yes Yes Yes YesCustomer relationships High High Med Low MedBrand usage High High Low Low HighRange of products High High Med Med LowSophistication (marketing) High High Med Low HighProduct promotion High High Low Low HighCompetition High High Med High HighLoyalty High High Low Low LowCollaborative Supply High High Low Low High
Hypermarket Dept Stores Butcher’s Shops
Home Shopping
Supermarkets
Hypermarkets and department stores are the most promising segment for Australian beef in Korea due to strong growth, particularly into regional areas, focus on chilled beef and wide range of cuts usage. TV and Internet Home shopping should be considered for future growth prospects and image building
The results of that strategic approach are shown in the mix of beef retail sales in 2007 (Figure 29).
Figure 29 Comparative retail channel volumes for Australian and competitor beef in the
Korean market
Imported & Aust. beef – retail Retail – channel volumes 46% of Aust. beef was sold via retail in 2007
OutletSupplier
Aust,NZ,USA,Mex.QTY
% of imported beef per outlet type
Hypermarkets Total imported beef 23,961 12.3%
Aus 18,998 13.22%
Department stores Total imported beef 2,516 12.9%
Aus 2,501 1.74%
Supermarkets Total imported beef 3,998 2.06%
Aus 3,506 2.44%
Butcher shops Total imported beef 36,650 18.9%
Aus 29,604 20.6%TV & Internet home shopping Total imported beef 13,214 6.8%
Aus 11,496 8%

Review of the $1.50 Levy Increase for the FTF Program
Warwick Yates and Associates Pty Ltd, 2009
65
In the future the Korean market strategic focus elements will be achieved as follows:
• By maintaining the relationships that have been built in absence of the US.
• By ensuring Australian beef remains on the menus and shelves of Korean foodservice and retail sectors.
• By reinforcing the clean and safe image Australia has built and build the taste, enjoyment and nutritious attributes of Australian beef in all marketing activities.
With the re-entry of the U.S.A. maintain market share growth In order to hold as much market share as possible Australia must continue to educate and gain loyalty of both trade and consumers on:
• benefits of using a wider range of cuts;
• safety, quality, taste and nutritional benefits; and
• supply chain initiatives with retailers and exporters. Maintain the clean and safe image we have built and continue to promote the delicious and nutritious attributes of Australian beef in all marketing Underpinned by:
• a strong retail focus;
• a foodservice maintenance and image building program;
• a trade educational program;
• an event management program; and
• a strategic media program. 3.4.6. Conclusions The FTF program has been effective in capturing and maintaining growth of imported beef market share in the Korean market in the absence of US beef in this market. Tonnage and market share have both increased. The FTF additional funds have enabled MLA and the industry players through ICA agreements to build improved relationships in this market to the point where Australia is the preferred supplier. The dollar spend in this market has not been large but very targeted and effective in placing Australian beef in the Hypermarkets and Department stores. The Hojo Chungjung Woo quality mark has been effective in differentiating Australian beef allied with in store sampling. Trade visits to Australia and mass media marketing has gained consumer support for Australian beef among adult and young consumers. While Australia will lose market share as the US returns to the market this should not be seen as a negative in that the negative impacts of US beef exclusion from this market has been dampened demand overall. The US re-entry will enable the market to continue to grow and Australia will have a reduced share of growing Korean market pie in the future.

Review of the $1.50 Levy Increase for the FTF Program
Warwick Yates and Associates Pty Ltd, 2009
66
Performance Criteria
Program Commencement 2008
Marketing Budget( $M)
4.9M $6.7M ( FTF Component $2.7M)
Tonnage Imported
130Kt 206Kt
Market Growth(tonnes)
Grow by 32Kt to 124Kt by 2010 206Kt ( 2007)
Chilled and Frozen beef imports
• Chilled Beef : 15,407Tonnes • Total Beef: 91,096 tonnes
• Chilled Beef : 31,826 Tonnes • Total Beef: 146,093 tonnes
Average Market Share Status
26% 74%
Growth in Retail Outlets
• Total:529 • Hypermarkets:283 • Supermarkets:187 • Outlets where Australian beef is
promoted:1025
• Total:713 • Hypermarkets:335 • Supermarkets:317 • Outlets where Australian beef is
promoted:1593 Support Industry and Other Brands
• Achieved through ICA program support for exporter brands and use of the Hoju Chungjung Woo quality logo
• Retail promotions, product sampling , subway advertising , schools program
Export Market Trade Support
• Korean meat trade missions to Australia • 88% awareness that Australian beef is
clean and safe Program Effectiveness
Need to fill market space left by US exclusion from the Korean market
• The FTF program has effectively positioned Australian beef in the Korean market despite the impending return of US beef and is positioned well to take an effective share of future market growth
Review of the $1.50 Levy Increase for the FTF Program
Warwick Yates and Associates Pty Ltd, 2009
67
33..55.. UUnniitteedd SSttaatteess 3.5.1. Introduction As outlined in the Funding for the Future document, the efforts of MLA under the existing funding arrangements had resulted in:
• a contribution to a market worth $1.4 billion per annum to the Australian beef industry;
• a contribution to a free trade agreement that was expected to steadily improve access, and at advantageous terms, relative to competing sources;
• an acceptance and usage of Australian beef within all major fast food restaurant chains; and
• strong industry, trade and government relationships, providing a platform for Australian exporters.
The BIFSC recommended that the principal North American strategy should be to maintain frozen volumes while selectively investing to assist Australian exporters to secure sustainable chilled volumes. The strategy was for this to be done in conjunction with commercial industry partners, by:
• building and maintaining awareness and loyalty for Australian beef amongst the trade and consumers;
• positioning Australian beef’s consistency, value, integrity and range;
• developing industry capability in export marketing, planning and brand positioning; and
• allocating funds to reflect long term opportunities. The outcomes expected from the implementation of the strategy were:
• further growth in demand for Australian manufacturing beef;
• further growth in demand for Australian chilled beef, particularly for niche grassfed product; and
• ongoing containment of non-tariff trade barriers on Australian beef. 3.5.2. Market Dynamics The US is Australia’s third largest beef market, behind only the Australian domestic market and Japan. Frozen product dominates Australia’s beef trade with the US, representing 209kt (shipped weight) out of a total of 670kt exported in 2007-08. Exports of chilled product to the US was 31kt in the same year representing 12% of Australia’s total chilled beef exports (260kt) and 13% of Australia’s total beef exports(chilled plus frozen) to the US (240kt). The US market was worth approximately $950M to the Australian beef industry in 2007-08, down from $1.2 billion the previous year. The US is the world’s largest beef market, comprised of a growing population of committed beef eaters. Consumer demand is strong, although the financial crisis is having an impact on demand for loin cuts recently. Australia holds a quota for supply to the US of 403.3kt (shipped weight), the largest of any of the supplying countries. As a result of the free trade agreement, this quota has and will
Review of the $1.50 Levy Increase for the FTF Program
Warwick Yates and Associates Pty Ltd, 2009
68
continue to increase steadily, and the out-of-quota tariff will reduce steadily, until both are eliminated in 2022. The overwhelming majority of US production is marbled grainfed beef, leading to a scarcity of lean trim for blending into ground beef. Given the popularity of ground beef in the US, this has created a significant opportunity for Australian product. Australian exporters are also investing in and developing niche chilled beef business, to the extent that the US is now our second largest chilled export market (equal with Korea in 2007-08). The US cattle cycle has flattened in 2008 with supplies nearly identical with 2007. This has been brought about by drought conditions, increasing land values (+70% over past 5 years), higher grain prices due to increasing ethanol production, other alternative land uses (for example hunting and wilderness areas), government policy (more difficult to graze federal lands) and the increasing age of the producer. US beef exports to Japan continue to face trade restrictions. US beef exported to Japan is required to be sourced from animals younger than 21 months. Korea lifted most of their restrictions on US beef in September 2008, triggering huge public protests. In response the US industry made a commitment to limit exports to beef derived from cattle under 30 months. All other protocols that were in place prior to the BSE outbreak in the USA have been accepted by the Korean Government. Korea imported 98kt of beef from Australia and 26kt from the US during the period January-November 2008. The Australian manufacturing beef trade to the United States was threatened when the Food Safety and Inspection Service (FSIS) announced on 23 October 2007 the introduction of point of entry testing for E. coli 0157:H7. FSIS acted in response to increasing ground beef recalls, especially the Topps recall in which a Canadian establishment was implicated. Australia has now established a new E. coli 0157 testing protocol. FSIS has determined the Australian testing protocol as equivalent to the US system and has reduced the number of tests required at point of entry due to the lower prevalence of E. coli 0157 in Australia. There is growing interest in food safety issues, for example, inspection processes and testing for other strains of E. coli 0157 that may be associated with human illness. US beef regaining full access to North Asia will be key to maintaining US beef demand in 2008. In the food sector beef, especially, steak cuts, are a luxury item. During economic hard times US consumers normally ‘trade down’ when purchasing beef. This can lead to an increase in fast food and retail ground beef sales as consumers choose to purchase a hamburger at a quick service restaurant rather than a casual dining restaurant, or consumers choose to cook a hamburger at home rather than eating out. Mid-range family restaurants are expected to be worst affected by an economic downturn. This scenario bodes well for Australian manufacturing exports to the United States. Three demand factors will impact the volume of Australian beef exported to the United States, US beef exports, the strength of the Australian dollar and extent of the US economic slowdown (i.e. domestic US demand). Since 2003, when the United States and Canada were restricted from the North Asian markets, Australia has responded to price signals and diverted beef exports to North Asia. Despite this diversion, Australian chilled beef exports to the United States grew from 22.6kt in 2004 to 37.5kt (shipped weight) in 2007, although exports slipped back to 30.3kt in 2008. While the long term trend is one of growing Australian chilled beef exports to the United States, the fall in 2008 was due to tight Australian supplies of chilled cuts, especially loin cuts and grain fed product, exacerbated by the strong Australian dollar. Growth in chilled Australian beef exports to the United States depends on the relative beef price between the United States and North Asia narrows which is largely dependent on US beef’s access to the North Asian markets.

Review of the $1.50 Levy Increase for the FTF Program
Warwick Yates and Associates Pty Ltd, 2009
69
On 17 November 2007 Canadian cattle born after 31 March 1999 were permitted to cross the US border provided their age can be verified. Australian beef exports to Canada have retracted significantly since Canada’s first BSE case in May 2003. The border opening has increased the exports of Canadian beef and cattle to the United States, increasing demand for imported beef. Australian beef exports to Canada grew from 10.1 kt in 2006-07 to 11.0 kt in 2007-08 (shipped weight). However, Canadian exports to the United States were dampened again when mandatory country of origin labelling was introduced in September 2008. Prior to the implementation of the North America Free Trade Agreement (NAFTA), Australian agricultural exports to Mexico were much greater than they are today. For example, in 1993 Australia exported 15.7 kt of beef to Mexico – more than 15% of Mexico’s total beef import needs. However, this market share disappeared in 1994 with the ratification of NAFTA. Australian beef exports face a 20-25% tariff (20% for chilled beef and 25% for frozen beef); in contrast US and Canadian beef enters the Mexican market duty free. Australian beef exports to Mexico were 1.7 kt in 2006-07 and 1.1 kt in 2007-08 (shipped weight). 3.5.3. MLA FTF Activities What were the key assumptions at the start of the FTF program in 2004? In 2004 the US market was expected to offer high prices for the next few years for both quality and manufacturing grade beef in response to the firm consumer demand and tight local supplies. US consumer demand for beef was anticipated to peak in 2005, as the shift to high protein diets runs its course and the cyclical US economic upturn ends. Also, the then low point in the US production cycle was expected to last only a couple of years more, with herd rebuilding expected to lead to increasing supplies and pressuring prices from 2007. Continued attractive US manufacturing beef prices, together with the maintenance of the quota management scheme were expected to keep exports to the US for the next few years similar to the 2004 level. However, high Australian beef prices, a higher Australian dollar and continued competition for Australian supply from Japan and Korea were likely to prevent a major lift in beef exports to the US market in 2005, keeping exports short of the quota. What are the realities in 2007? Under the Australia/US free trade agreement, the quota increased by 20kt in 2007, to 398.2kt tonnes and will increase to 448.2kt by 2022. Although shipments to the US are likely to increase in 2008-09 with the weaker Australian dollar, exports are very unlikely to reach the quota over the next 2 to 3 years. The US, through its grading system and ability to channel high volumes of individual cuts, has held a leading position in Asian beef markets. However, its now damaged supplier image has provided Australia with a sustained marketing advantage, which will continue until the US recovers customer and consumer confidence. As noted above, exports to the US in 2007-08 totalled around 240kt (shipped weight) worth approximately $950M to the Australian beef industry. This was down from 303kt in 2006-07, trade valued at $1.2 billion. What were the aspirations in the US market? The main objectives with the increased levy funding were:
• further growth in demand for Australian manufacturing beef;

Review of the $1.50 Levy Increase for the FTF Program
Warwick Yates and Associates Pty Ltd, 2009
70
• further growth in demand for Australian chilled beef product; and • ongoing containment of non-tariff barriers on Australian beef.
The objectives were to be met with the following proposed actions:
• introduce a ‘premium’ Australian beef brand for the trade and selected retailers to facilitate the penetration of this niche/segment;
• new retail business development initiatives in cooperation with commercial partnerships; and
• MLA support requirements through ICA type arrangements will also be required to grow.
Variations to the original FTF US program With respect to the three proposed actions listed above, the following comments can be made.
• The beef ICAs have been developed and supported as proposed. • New retail business development initiatives have been pursued, although retail has
not been the sole focus. The business development strategy has also focussed on distributors, value-adders and foodservice companies.
• There was no support from the North America beef taskforce for a premium brand. Instead the focus has been on developing individual company brands. The taskforce supported voluntary use of the Eating Quality Assured (EQA) system to underpin individual company brands.
An additional $0.8M (above base budget) was proposed to fund the planned new activity in the North American market (Figure 30). Utilisation of the $1.50 levy has been significantly reduced for 2008-09 and replaced with ICA funding. Figure 30 Base budget and extra levy income for North America
200,000
400,000
600,000
800,000
1,000,000
1,200,000
1,400,000
1,600,000
1,800,000
2,000,000
$
Base Budget Extra Levy Global ICA
Global ICA 979,133
Extra Levy 833,000 651,718 114,000
Base Budget 760,000 703,000 760,000 760,000
2005-06 2006-07 2007-08 2008-09
Source: MLA
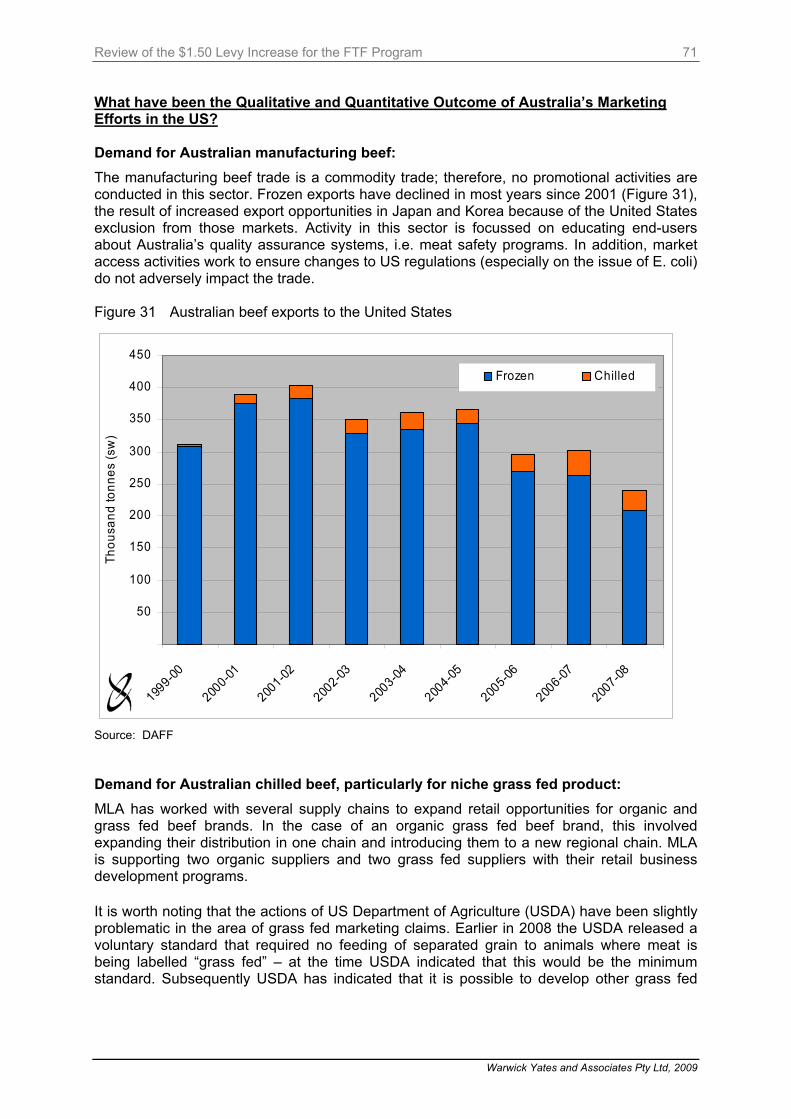
Review of the $1.50 Levy Increase for the FTF Program
Warwick Yates and Associates Pty Ltd, 2009
71
What have been the Qualitative and Quantitative Outcome of Australia’s Marketing Efforts in the US? Demand for Australian manufacturing beef: The manufacturing beef trade is a commodity trade; therefore, no promotional activities are conducted in this sector. Frozen exports have declined in most years since 2001 (Figure 31), the result of increased export opportunities in Japan and Korea because of the United States exclusion from those markets. Activity in this sector is focussed on educating end-users about Australia’s quality assurance systems, i.e. meat safety programs. In addition, market access activities work to ensure changes to US regulations (especially on the issue of E. coli) do not adversely impact the trade. Figure 31 Australian beef exports to the United States
50
100
150
200
250
300
350
400
450
1999-00
2000-01
2001-02
2002-03
2003-04
2004-05
2005-06
2006-07
2007-08
Thou
sand
tonn
es (s
w)
Frozen Chilled
Source: DAFF Demand for Australian chilled beef, particularly for niche grass fed product: MLA has worked with several supply chains to expand retail opportunities for organic and grass fed beef brands. In the case of an organic grass fed beef brand, this involved expanding their distribution in one chain and introducing them to a new regional chain. MLA is supporting two organic suppliers and two grass fed suppliers with their retail business development programs. It is worth noting that the actions of US Department of Agriculture (USDA) have been slightly problematic in the area of grass fed marketing claims. Earlier in 2008 the USDA released a voluntary standard that required no feeding of separated grain to animals where meat is being labelled “grass fed” – at the time USDA indicated that this would be the minimum standard. Subsequently USDA has indicated that it is possible to develop other grass fed

Review of the $1.50 Levy Increase for the FTF Program
Warwick Yates and Associates Pty Ltd, 2009
72
standards. This uncertainty has hampered efforts to expand the presence of Australian “grass fed” beef at the retail level. Ongoing containment of non-tariff barriers on Australian beef: The main focus has been on minimizing the impact of E. coli 0157:H7 requirements in the United States. MLA has worked closely with (AMIC) and Australian Quarantine Inspection Service (AQIS) to develop new Australian testing protocols to respond to the US’s decision to implement import testing of E. coli 0157:H7. MLA has funded 3 delegations to the US in order to inform US importers and end-users about the new Australian testing protocol. In addition, intense Australian government representations to the Food Safety and Inspection Service yielded a favourable equivalence decision on our testing protocol and a significant reduction in the number of point of entry tests for Australian product. MLA continues to work closely with AMIC and AQIS and planning is underway for another delegation in the first half of 2009. 3.5.4. Outcomes of FTF activities Promoting individual company brands (as opposed to generic promotion) is the focus of the North America program; therefore, ICAs are central to promotional activities. The take up of beef ICAs in North America has continued to grow, in line with growing chilled exports to the US (2008 being the exception). The outcome of the ICA activity over the past three years is described below. 2006-07
• 11 ICAs
• 10% chilled trade covered by ICAs
• 372% growth
• Budget: A$282,000 (Estimated MLA contribution) 2007-08
• 12 ICAs (8 new)
• Budget: A$330,000 (MLA contribution) 2008-09
• 21 Exporters
• Budget: A$979,133 (MLA contribution) 3.5.5. Case Studies Case Study 1: EQA Program While a ‘premium’ generic brand was not supported by the North America beef taskforce, work has progressed on launching the Eating Quality Assured (EQA) program in North America. Several Australian beef brands are underpinning their individual company brands with the EQA program. This is a voluntary program. To date 7 workshops have been held in partnership with 5 companies, with over 50 attendees in total. It appears the workshops were well received by participating companies and the survey feedback was reported to be very positive (“The EQA presentation certainly got our attention, we will be working on this more in the future” ).

Review of the $1.50 Levy Increase for the FTF Program
Warwick Yates and Associates Pty Ltd, 2009
73
Case study 2: Market Profiling Project In 2008 a market profiling project was completed with 250 contacts being generated, 50 contacts were followed up with detailed telephone interviews and 60% of interviewees indicated an interest in Australian beef or lamb. The result was:
• 23 US leads
• 13 Canadian leads All 36 leads have been contacted for telephone follow-up and meetings continue to occur. There have been 4 face-to-face meetings to date. In addition to the profiling work leads have also been generated through trade advertising and trade shows. 3.5.6. Conclusions Although Australian beef exports to the US have declined since 2004-05, Australia’s market share of the US import market has risen slightly, increasing from 27.3% in 2004-05 to 28.4% in 2007-08. During 2007-08 the greatest hurdle to building existing programs or developing new programs was the availability of product. Although 2006-07 was a high for chilled beef exports, the limited supply of product last year was a source of frustration for customers. The MLA business development program is focussed on increasing the volume and/or value of beef entering the North America market. With the support of MLA, several Australian beef companies have worked hard to grow their business in the United States by expanding existing branded beef programs or have worked to establish new branded programs. These actions led to the record year for Australian chilled beef exports to the United States in 2006-07. The strategy of the North American program has been to identify and develop regionally based customers that Australian suppliers can supply on a consistent basis and to identify points of differentiation to strengthen the brand and enable customers to grow their Australian beef business. A wide range of activities have supported this strategy including the ICAs, EQA (research, launch, materials and seminars), beef recipe development, beef logo development, profiling research, American Chef Federation sponsorship, etc. The FTF program has also been effective in minimising the impact of E. coli 0157:H7 requirements in the United States. MLA has worked closely with AMIC and AQIS to develop new Australian testing protocols to respond to the US’s decision to implement import testing. While Australia has lost volume in the US market for reasons unrelated to marketing effort, the focus in the FTF program on developing ICAs should help the Australian beef industry capitalise on increasing future volumes, particularly if US beef exports increase and the Australian dollar does not return to the highs of 2007-08.

Review of the $1.50 Levy Increase for the FTF Program
Warwick Yates and Associates Pty Ltd, 2009
74
33..66.. EEuurrooppee aanndd RRuussssiiaa 3.6.1. Introduction As outlined in the Funding for the Future document, the efforts of MLA under the existing funding arrangements had resulted in:
• creation of an access consortium of exporters, retailers and foodservice, pushing for an easing in EU trade and production subsidy policies;
• support for Australian exporters through trade shows, introductions and visits; and
• support for current importers of Australian product. The BIFSC recommended that the principal European strategies should be to build a coalition of support to break down EU access and support barriers as well continue to monitor to identify and facilitate opportunities for high value chilled beef exports. The strategy was one of continuation of its current activities, namely:
• monitoring, networking and relationship building within EU government, industry and trade to influence a more pro free trade agenda; and
• assisting the positioning of the Australian industry as a world leading producer that should be granted greater access as restrictions ease.
The outcomes expected from the implementation of the strategy were:
• easing in trade restrictions; and
• new market opportunities identified for current and future access. The Funding for the Future document did not make reference to the Russian market. 3.6.2. Market Dynamics The European Union remains virtually closed as a significant opportunity for sales of Australian beef, given the annual High Quality Beef (HQB) quota of only 7kt. While this is unlikely to change in the short to medium-term, the EU represents an important influence on global trade and trade policy. Exports of Australian beef to Europe have been around 7kt since 2004-05, although increased to around 10kt in 2007-08 with 3-4kt (shipped weight) shipped outside the HQB quota (Table 29). Exports in 2007-08 were valued at $100M (FOB). Beef consumption continues modest growth across the EU, and particularly in the United Kingdom (UK) where consumption levels are now higher than pre BSE and Foot and Mouth Disease (FMD) times. Forecasts of increased beef consumption over the next eight to ten years together with falls in domestic production suggest that the EU’s self-sufficiency level will decline from the current 95-96% and the gap filled with imports. Despite the trend in declining beef production in Europe over the next few years (structural reduction in dairy herds, decoupling of payments to beef producers and incentives for alternative land use), there are limited growth opportunities for importers of Australian beef due to the small High Quality Beef (HQB) quota allowance.
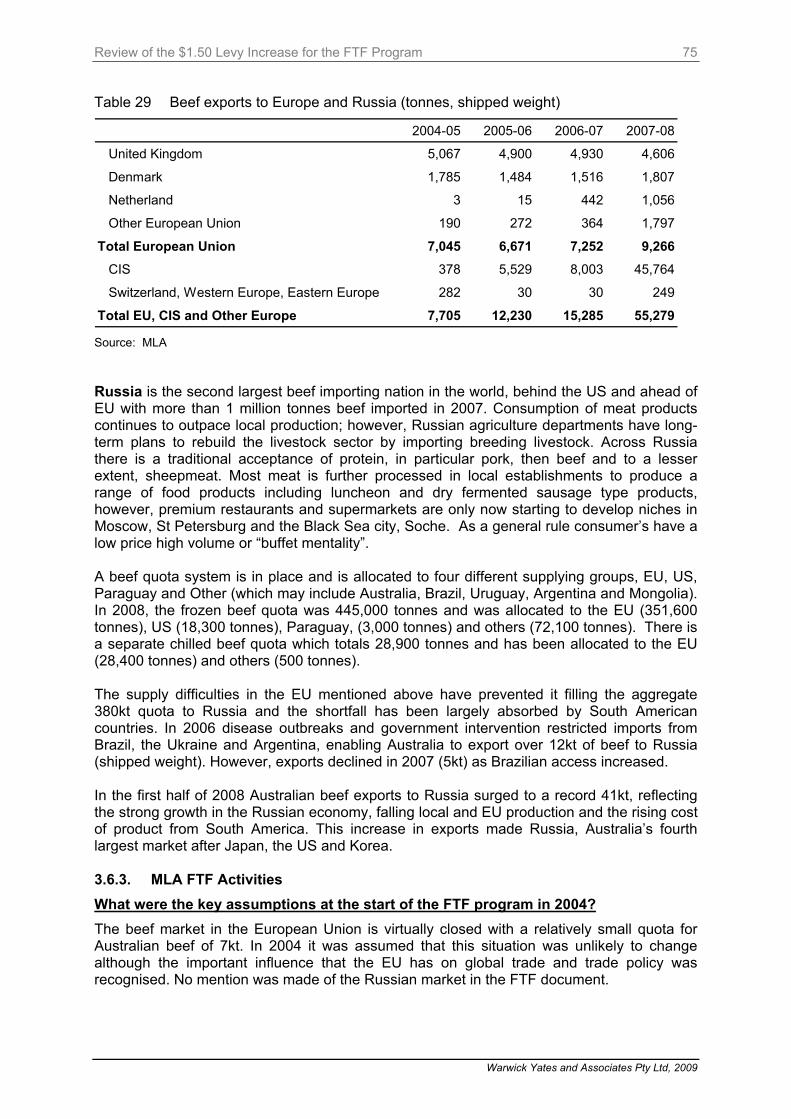
Review of the $1.50 Levy Increase for the FTF Program
Warwick Yates and Associates Pty Ltd, 2009
75
Table 29 Beef exports to Europe and Russia (tonnes, shipped weight)
2004-05 2005-06 2006-07 2007-08
United Kingdom 5,067 4,900 4,930 4,606
Denmark 1,785 1,484 1,516 1,807
Netherland 3 15 442 1,056
Other European Union 190 272 364 1,797
Total European Union 7,045 6,671 7,252 9,266
CIS 378 5,529 8,003 45,764
Switzerland, Western Europe, Eastern Europe 282 30 30 249
Total EU, CIS and Other Europe 7,705 12,230 15,285 55,279 Source: MLA Russia is the second largest beef importing nation in the world, behind the US and ahead of EU with more than 1 million tonnes beef imported in 2007. Consumption of meat products continues to outpace local production; however, Russian agriculture departments have long-term plans to rebuild the livestock sector by importing breeding livestock. Across Russia there is a traditional acceptance of protein, in particular pork, then beef and to a lesser extent, sheepmeat. Most meat is further processed in local establishments to produce a range of food products including luncheon and dry fermented sausage type products, however, premium restaurants and supermarkets are only now starting to develop niches in Moscow, St Petersburg and the Black Sea city, Soche. As a general rule consumer’s have a low price high volume or “buffet mentality”. A beef quota system is in place and is allocated to four different supplying groups, EU, US, Paraguay and Other (which may include Australia, Brazil, Uruguay, Argentina and Mongolia). In 2008, the frozen beef quota was 445,000 tonnes and was allocated to the EU (351,600 tonnes), US (18,300 tonnes), Paraguay, (3,000 tonnes) and others (72,100 tonnes). There is a separate chilled beef quota which totals 28,900 tonnes and has been allocated to the EU (28,400 tonnes) and others (500 tonnes). The supply difficulties in the EU mentioned above have prevented it filling the aggregate 380kt quota to Russia and the shortfall has been largely absorbed by South American countries. In 2006 disease outbreaks and government intervention restricted imports from Brazil, the Ukraine and Argentina, enabling Australia to export over 12kt of beef to Russia (shipped weight). However, exports declined in 2007 (5kt) as Brazilian access increased. In the first half of 2008 Australian beef exports to Russia surged to a record 41kt, reflecting the strong growth in the Russian economy, falling local and EU production and the rising cost of product from South America. This increase in exports made Russia, Australia’s fourth largest market after Japan, the US and Korea. 3.6.3. MLA FTF Activities What were the key assumptions at the start of the FTF program in 2004? The beef market in the European Union is virtually closed with a relatively small quota for Australian beef of 7kt. In 2004 it was assumed that this situation was unlikely to change although the important influence that the EU has on global trade and trade policy was recognised. No mention was made of the Russian market in the FTF document.

Review of the $1.50 Levy Increase for the FTF Program
Warwick Yates and Associates Pty Ltd, 2009
76
What are the realities in 2007? In the EU imports continue to be restricted by the current highly regulated import regime with increases restricted to product entering at full duty, something not viable for most Australian product. Forecasting developments in the Russian market is difficult because of the influence the Russian government has over quota and supplier accreditations. Nevertheless, Russia is offering opportunities in the foodservice sector at both catering and growing high end sector restaurants in Moscow, St Petersburg and the developing Sochi region on the Black Sea where tourism investment is taking place. Wealthy Russians with quality tastes are eating out regularly and seeking new menus. Australian beef, be it marbled, short fed or selected grass-fed, offers a range of menu options. The challenge is to train and educate users and chefs about Australian specifications and tools used to define meat quality. What were the aspirations in the Europe and Russian markets? In Europe the outcomes expected from the implementation of the FTF strategy were:
• easing in trade restrictions; and
• new market opportunities identified for current and future access. As noted previously, the Russian market was not considered in the FTF document. Variations to the original FTF program The FTF document proposed beef marketing expenditure in Europe of $70,000, unchanged from previous years. As shown in Table 30, this was the budget for 2006-07 but it has increased significantly since. In 2008-09 the beef marketing budget of $376,000 was allocated as follows:
• Trade Activities Europe: $120,000
• Foodservice Europe: $40,000
• Trade Development Russia: $136,000
• Foodservice Russia: $80,000 Table 30 Budget comparison for Europe and Russia, 2005-06 to 2008-09 ($’000)
Program 2005-06 2006-07 2007-08 2008-09
Market Access - Beef 230 230 230 230
Beef Marketing 70 242 342 376
Total Budget a 300 472 572 606 a Excludes expenditure on meat safety and issues management. Source: MLA
Review of the $1.50 Levy Increase for the FTF Program
Warwick Yates and Associates Pty Ltd, 2009
77
What have been the Qualitative and Quantitative Outcome of Australia’s Marketing Efforts in Europe and Russia? MLA’s role has primarily been one of monitoring, networking and relationship building within EU government, industry and trade to influence a more pro free trade agenda. Trade activities cover networking, activities that raise awareness of Australian beef, participation in trade shows which showcase Australian products and retail marketing opportunities. In the foodservice sector MLA has worked to:
• position Australian beef as a premium product in the minds of foodservice operators; • increase awareness of Australian beef product attributes re shelf life; • reliable and consistent specification, eating quality and its food safety message; and • locate new outlets / chains for highly marbled beef as more herds become European
Union Cattle Accreditation Scheme (EUCAS) approved. Additionally, MLA assists the positioning of the Australian industry as a world leading producer that should be granted greater access as restrictions ease. What have the levies achieved to date?
• Creation of an access consortium of exporters, retailers and foodservice, pushing for an easing in EU trade and production subsidy policies.
• Support for Australian exporters through trade shows, introductions and visits.
• Support for current Australian exporters. 3.6.4. Outcomes of FTF activities To capture the current gains in the Russian market and seek opportunities in other CIS states industry supported the proposal that MLA place a representative in Russia. In August 2007, MLA recruited a Moscow based representative to assist with trade development in Russia and Commonwealth of Independent States (CIS) countries, her role is to raise the awareness of Australian red meat and educating customers about our meat quality attributes.
In Russia programs consist of building awareness of Australia’s meat industry capability and undertaking Business Development programs. Activities will be implemented to convey messages of Australia’s reputation on reliability and safety systems which will be disseminated via education and training of local end-users. A retail training program will also need to be developed. Currently the small amount of Australian meat distributed to the retail sector is not handled correctly resulting in a poor image and reduced shelf life. This program is essential to capitalise on the current gains in the foodservice sector. Participation by exporters at various targeted trade exhibitions in 2008-09 and education of the foodservice sector by qualified Australian chefs will assist raise an awareness. Planned training programs for beef and lamb with importers and their customers, will assist to develop loyalty in a short window of opportunity before US beef is back fully in the market.
Despite the low growth in exports to Europe, MLA’s office in Europe continues to play an important role in opening communication channels for the Australian industry and in building coalitions to press for policy change. 3.6.5. Case Studies At the recent Moscow Prodexpo food show in February 2008, seven Australian exporters participated (12 expressed an interest but due to space limitations only seven were accommodated on the booth). Many exporters made new contacts which show the growing
Review of the $1.50 Levy Increase for the FTF Program
Warwick Yates and Associates Pty Ltd, 2009
78
interest in Australian meat. Competitors attending the show included Brazil, Argentina, USA and Belgium. The red meat industry took this opportunity to officially open the Moscow office at a function held at the Australian ambassador’s residence attended by 100 guests, including exporters and Russian Veterinary officials. 3.6.6. Conclusions With the stalling of the Doha Round of World Trade Organisation negotiations, there is little chance of quota reform in Europe in the short term. Nevertheless, the opportunities for above quota exports did arise in 2008 with the suspension of accreditation on all but a few Brazilian farms and limits on Argentine and Uruguay imports. The on-going presence of the MLA in Europe and the continuation of trade show participation to showcase Australian beef, using selected Australian events to highlight Australian beef quality attributes provides a launching pad for exporters. Additionally, positioning Australian beef as premium product in retail and increasing awareness of product attributes (shelf life, reliable and consistent specification, eating quality and food safety record) have all assisted in making the most of existing quota and any above quota opportunities that may arise.
Forecasting developments in the Russian market is particularly difficult, being subject to Russian government decisions on quota and accreditations, changes in supply from South America and competition for supply from other markets, notably the US and Korea.
Russia is a vast country and there is a lack of knowledge by customers on the range of beef products available and how to order meat from Australia. MLA and industry’s knowledge of the growing market needs boosting, whilst education and training of local end users is essential if current gains in the market are to be held and expanded. Despite the future uncertainty of market conditions, the diversion of resources into the Russian market seems to have been well-founded with potentially high payoffs in the future.

Review of the $1.50 Levy Increase for the FTF Program
Warwick Yates and Associates Pty Ltd, 2009
79
33..77.. MMiiddddllee EEaasstt 3.7.1. Introduction The Middle East region has traditionally been a sheep meat customer for Australia and the low volume of beef exports reflect this. In 2004-05 MLA beef marketing activity in the Middle East was limited with an annual budget of just $20,000. The funding supported a very limited range of trade activities at targeted stores, importers and foodservice involving food sampling and POS material. The Funding for the Future document proposed a funding increase of $70,000 to give a total beef marketing spend of $90,000 per annum. Subsequently, however, there was a significant change in some components of the strategy in response to findings of the TNS market research – primarily a more direct focus on Arab consumers and the key purchase drivers which motivate them. The modified strategy was allocated a budget of $309,000 for 2006-07 and included the following elements:
• Consumer Retail Marketing Program
• Retail /Trade Training Programs
• Foodservice Programs
• Trade Development Programs 3.7.2. Market Dynamics Australian red meat exports to the Middle East soared in 2006, with new records set for lamb and significant growth in mutton and beef volumes. Surging economies and a changing retail scene have resulted in plentiful demand for proteins in the region, and Australian exporters have been well placed to satisfy demand with the increased supplies available. The retail channel offers some opportunities for future growth of Australian beef exports. The rapid growth of hypermarkets and a move away from traditional butcheries and smaller retail cold stores have altered the market dynamics and consumer purchasing habits. Some retailers continue to strive to differentiate themselves from their competitors by improving the quality and consistency of their meat case. Training programs have been introduced to help overcome these issues. There have been significant opportunities for growth in foodservice in the United Arab Emirates (UAE) due to increased investment in tourism with high growth in the number of hotels and higher level catering institutions over the past five years. Since US beef was banned in 2004, high quality Australian beef has captured the major market share in the high-end foodservice channel. With population and economic growth, global retailers such as the Casino group (Geant) and Carrefour have invested significantly in the region. This investment has been matched and defensive strategies have been developed by existing retail groups, particularly Savola Group’s Panda stores in the Kingdom of Saudi Arabia and EMKE group’s Lulu stores throughout UAE, Oman and Qatar. The development of hypermarts, an increased number of supermarkets and changing social and cultural attitudes (women working, driving, etc) is likely to bring substantial changes to retail habits and a reduction in traditional outlets. This is likely to result in increased demand for chilled products.
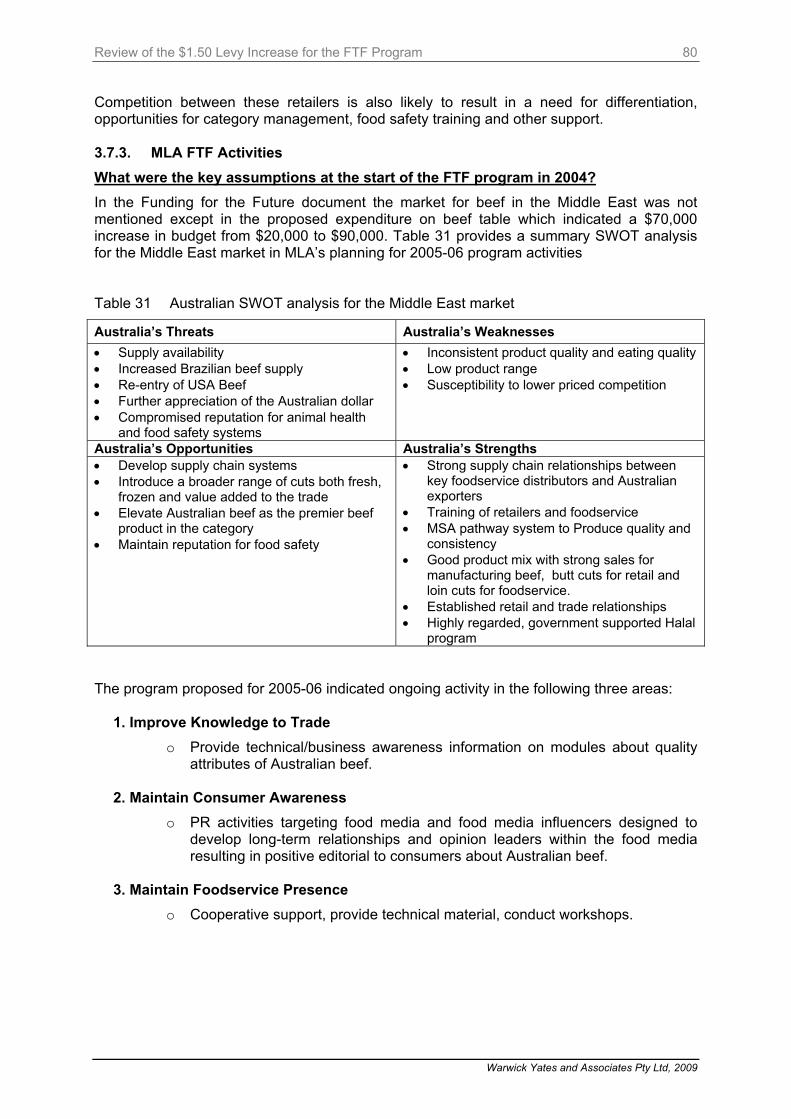
Review of the $1.50 Levy Increase for the FTF Program
Warwick Yates and Associates Pty Ltd, 2009
80
Competition between these retailers is also likely to result in a need for differentiation, opportunities for category management, food safety training and other support. 3.7.3. MLA FTF Activities What were the key assumptions at the start of the FTF program in 2004? In the Funding for the Future document the market for beef in the Middle East was not mentioned except in the proposed expenditure on beef table which indicated a $70,000 increase in budget from $20,000 to $90,000. Table 31 provides a summary SWOT analysis for the Middle East market in MLA’s planning for 2005-06 program activities Table 31 Australian SWOT analysis for the Middle East market
Australia’s Threats Australia’s Weaknesses • Supply availability • Increased Brazilian beef supply • Re-entry of USA Beef • Further appreciation of the Australian dollar • Compromised reputation for animal health
and food safety systems
• Inconsistent product quality and eating quality • Low product range • Susceptibility to lower priced competition
Australia’s Opportunities Australia’s Strengths • Develop supply chain systems • Introduce a broader range of cuts both fresh,
frozen and value added to the trade • Elevate Australian beef as the premier beef
product in the category • Maintain reputation for food safety
• Strong supply chain relationships between key foodservice distributors and Australian exporters
• Training of retailers and foodservice • MSA pathway system to Produce quality and
consistency • Good product mix with strong sales for
manufacturing beef, butt cuts for retail and loin cuts for foodservice.
• Established retail and trade relationships • Highly regarded, government supported Halal
program The program proposed for 2005-06 indicated ongoing activity in the following three areas:
1. Improve Knowledge to Trade o Provide technical/business awareness information on modules about quality
attributes of Australian beef.
2. Maintain Consumer Awareness o PR activities targeting food media and food media influencers designed to
develop long-term relationships and opinion leaders within the food media resulting in positive editorial to consumers about Australian beef.
3. Maintain Foodservice Presence
o Cooperative support, provide technical material, conduct workshops.

Review of the $1.50 Levy Increase for the FTF Program
Warwick Yates and Associates Pty Ltd, 2009
81
What are the realities in 2007? Beef and veal volumes are a making a strong recovery; closing out at 22% up over the previous year, having increased by 901 tonnes from 4,082 tonnes (2006) to 4,983 (2007). Significant growth was seen in Kuwait (+205%), UAE (+50%), Jordan (+117%) and ‘other’ (mostly Egypt) 158%. Most of this growth was at the expense of Brazilian sales which fell due to the strengthening Brazilian Real. For Australian exporters the main issues in the market are:
• the ability to maintain adequate supply, particularly of grain fed ‘sweet’ cuts, to high end foodservice markets;
• the extent to which Brazilian beef remains in short supply and at higher price; and
• the maintenance of reputation for animal health and food safety. These strategies are designed to:
• Maintain share in growth in Gulf through continued product reliability:
o perception of Australian food safety and Halal status in the Gulf remains very high.
• Defend existing markets from increasing and emerging competition and develop difficult but high potential markets:
o highly active and meaningful market access program;
o consumer communications program;
o industry training;
o maintain strong and effective retail, foodservice and trade campaigns; and
o market support unsurpassed by competitors.
• Stimulate the development of potential high volume markets in highly populated North Africa countries:
o dissemination of technical and commercial knowledge to consumers, retailers, importers and regulators in traditionally difficult markets.
• Embrace a greatly changing retail environment through the provision of product and market support and development and implementation of greater tactical capability – category management, branding, etc.
What were the aspirations in the Middle East market? As noted earlier the aspirations were modest in the Middle East market with a proposed increase in the budget of $70,000 to place more resources in the ongoing programs to improve knowledge to trade, maintain consumer awareness and maintain foodservice presence. Variations to the original FTF Middle East program As noted above, funding for beef promotion was intended to increase from $20,000 in 2004-05 to $90,000 in subsequent years. The budget was $20,000 in 2005-06 but subsequently increased to $309,000 in 2006-07 and came back slightly to $278,000 in 2007-08.

Review of the $1.50 Levy Increase for the FTF Program
Warwick Yates and Associates Pty Ltd, 2009
82
What have been the Qualitative and Quantitative Outcome of Australia’s Marketing Efforts in the Middle East? There has been strong growth in Australian beef exports to the Middle East market over the four years 2004-05 to 2007-08 (Table 32). Although the growth in trade has corresponded to the reduction in Brazilian exports, the MLA has initiated a significant increase in activity in the region over that period. These activities include promotional and marketing activity in retail foodservice, ICA and trade development. Table 32 Beef exports to the Middle East and Africa (tonnes, shipped weight)
2004-05 2005-06 2006-07 2007-08
Kuwait 207 114 269 1,045
Saudi Arabia 361 766 694 2,028
Dubai 1,317 1,326 1,424 2,934
Other Middle East 610 779 969 1,711
Total Middle East 2,495 2,985 3,356 7,718
South Africa 74 928 2,669 1,523
Other Africa 0 157 77 384
Total Africa 74 1,085 2,746 1,907 Source: MLA 3.7.4. Outcomes of FTF activities Retail Promotions There has been a continuation of the program of cooperative retail promotion with targeted supermarket chains, co-operatives and selected butcheries. In UAE, foodservice activities have been linked with European expatriate retailing promotions with a tactical campaign aimed specifically at six stores where European expatriates shop. There has been targeted print media advertising as well to support the program. The program has maintained a range of POS tools and materials, including ‘Arabised’ material, to leverage targeted consumers. This range includes posters, mini-stands, showcase stickers, price tickets and recipes. Consumer leaflets have been developed with a focus on the key consumer drivers for beef. Where applicable, POS activity has been customised for specific chains. There have been PR activities to generate positive editorial to reinforce consumer attitudes about the safety and affordability of Australian beef. As well there has been technical support provided to the retail sector to increase knowledge and technical awareness of Australian beef and conduct retail seminars and workshops - new cuts, display and sales techniques, customer service with hands on training and utilising new, customised Middle East training manuals.

Review of the $1.50 Levy Increase for the FTF Program
Warwick Yates and Associates Pty Ltd, 2009
83
Foodservice In the 5 star hotel sector various promotions have been run with key hotels and restaurants so that tactical marketing may be linked with selected retail outlets. Promotions have also been run with family restaurant chains featuring POS and promotional material to highlight the compatibility of Australian beef with family expectations for safe, tasty, nutritious and prestigious food. Training workshops and seminars for hotel and restaurant staff have been conducted on new cuts, profitable utilisation of alternative cuts, food safety and hygiene, cold chain management and customer service and product knowledge for waiters. Effort has also been put into maintaining and further developing strong professional collaborations with regional chefs’ societies and guilds. ICAs Through the ICA program, MLA has worked directly with individual exporters on customised marketing programs to expand sales in the Middle East. MLA has elicited strong interest from several exporters for participation in the Middle East ICA program. Trade Development As the market grows MLA has identified the importance of encouraging the loyalty of importers and engendering a thorough understanding of the quality characteristics of Australian beef. This is being done principally through trade networking, regional business forums, trade missions, publication and distribution of regional MLA industry briefs and participation in regional trade shows. 3.7.5. Case Studies Not relevant here. 3.7.6. Conclusions The Middle East market has shown strong growth in recent years and it will be important to maintain existing market share and to continue to grow that share in established markets. As competitive pressure is exerted on Asian beef markets (e.g. from US re-entry) and elsewhere, it will be essential to seek and identify new opportunities in emerging markets such as the Middle East region. The response by MLA by way of significantly increased activity and associated budget reflects the nature of the opportunity that has presenting itself and MLA’s willingness to adjust to changing circumstances. Expenditure of increased levy funds in this region has been much greater than originally proposed in the FTF document but it appears to be a well-founded and potentially high return investment.

Review of the $1.50 Levy Increase for the FTF Program
Warwick Yates and Associates Pty Ltd, 2009
84
33..88.. SSoouutthh EEaasstt AAssiiaa 3.8.1. Introduction FTF activities in SE Asia and the Chinas was an attempt to build a market away from a dependence on the big four traditional markets for Australian beef – Domestic, Japan, Korea and the USA. The program had the following elements:
• continuation of current retail and foodservice programs;
• promotion of the nutritional attributes of Australian beef, especially linking beef consumption to children’s capacity to develop (to be rolled-out over several years to Taiwan, Singapore, Malaysia, Hong Kong, and potentially Indonesia and the Philippines longer-term); and
• sales promotion to follow-up the generic nutrition campaign ensuring Australia gains a better than fair share of the benefits of the increase in beef consumption.
• The China Strategy was to monitor the demand and supply within China to identify potential volume opportunities and enable access for Australian beef.
The Beef Industry Funding Steering Committee proposed the following increase in expenditure to these SE Asian and Chinas markets: Currently, MLA spends $1.6M on the South-East Asia export program. The committee proposes that this amount be increased by another $0.5M, to $2.2M (BIFSC 2005a, p. 47). 3.8.2. Market Dynamics There was an early appreciation of the vast differences in the SE Asian and Chinas markets with respect to cultural / social perceptions to beef consumption increases and the relative ease of market access and the need to develop a prioritisation of those markets for market development funding. The following sequence of tables (Tables 33 to 37) emanating from the FTF program enabled MLA to prioritise the Chinas market and the Indonesian market to be serviced through the live export program and the supply of boxed beef to that market. Table 38 shows the volume of Australian beef exports to SE Asia and the Chinas almost doubled over the period 2004-05 to 2007-08.

Review of the $1.50 Levy Increase for the FTF Program
Warwick Yates and Associates Pty Ltd, 2009
85
Table 33 Red meat eaters in SE Asia and the Chinas
Population Religious barriers Vegetarian Red meat
eatingTotal red meat
eaters
(millions) (%) (%) (%) (millions)
China 1,221.1 99% 2.5% 96.8% 1,182.0
Hong Kong 6.9 100% 2.5% 97.5% 6.7
Indonesia 222.2 98% 2.5% 95.5% 212.2
Malaysia 27.2 92% 2.5% 89.3% 24.3
Phillipines 73.5 100% 2.5% 97.5% 71.7
Singapore 4.7 92% 2.5% 89.3% 4.2
Taiwan 23.0 95% 2.5% 92.8% 21.4
Thailand 65.4 91% 2.5% 88.0% 57.6
Vietnam 85.3 99% 2.5% 96.6% 82.4 Source: MLA Table 34 Sizing the target market in SE Asia and the Chinas
Total red meat eaters
Urban population
Urban refridgeration
Target meat eaters
Total target size
(millions) (%) (%) (%) (millions)
China 1,182.0 46% 92% 42% 499.5
Hong Kong 6.7 100% 98% 98% 6.6
Indonesia 212.2 50% 72% 36% 75.7
Malaysia 24.3 66% 98% 64% 15.6
Phillipines 71.7 48% 43% 21% 14.9
Singapore 4.2 100% 98% 98% 4.1
Taiwan 21.4 87% 95% 82% 17.5
Thailand 57.6 34% 80% 27% 15.8
Vietnam 82.4 27% 50% 14% 11.2
Source: MLA

Review of the $1.50 Levy Increase for the FTF Program
Warwick Yates and Associates Pty Ltd, 2009
86
Table 35 Current beef sales volumes in SE Asia and the Chinas
Total red meat eaters Per capita beef Total volume Sales beef
volume
(millions) (kg) ('000 tonnes) ('000 tonnes)
China 1,182.0 7.57 8,944.9 7,395.0 0.83
Hong Kong 6.7 15.12 101.6 94.3 0.93
Indonesia 212.2 2.48 527.1 425.4 0.81
Malaysia 24.3 5.22 126.6 189.2 1.49
Phillipines 71.7 4.76 341.6 308.4 0.90
Singapore 4.2 3.82 16.0 25.9 1.62
Taiwan 21.4 4.78 102.1 109.8 1.08
Thailand 57.6 2.37 136.6 179.3 1.31
Vietnam 82.4 2.68 221.0 203.2 0.92
Correction ratio a
a Correction ratio used to adjust volume estimates to ensure consistency with sales figures. Source: MLA Table 36 Real target beef consumption in SE Asia and the Chinas
Per capita beef Total volume Target
populationExpenditure
shareTarget per
capitaActual target
per capita
(kg) ('000 tonnes) (%) (%) (kg) (kg)
China 7.57 8,944.9 42% 55% 9.78 0.83 8.09
Hong Kong 15.12 101.6 98% 98% 15.12 0.93 14.02
Indonesia 2.48 527.1 36% 48% 3.37 0.81 2.72
Malaysia 5.22 126.6 64% 88% 7.09 1.49 10.60
Phillipines 4.76 341.6 21% 49% 11.26 1.03 10.19
Singapore 3.82 16.0 98% 98% 3.81 1.62 6.17
Taiwan 4.78 102.1 82% 91% 5.30 1.08 5.70
Thailand 2.37 136.6 27% 59% 5.11 1.31 6.71
Vietnam 2.68 221.0 14% 22% 4.33 0.92 3.98
Correction ratio a
a Correction ratio used to adjust volume estimates to ensure consistency with sales figures. Source: MLA

Review of the $1.50 Levy Increase for the FTF Program
Warwick Yates and Associates Pty Ltd, 2009
87
Table 37 Target market prioritisation in SE Asia and the Chinas
2007 target GrowthAustralian
share foreign supply
Per capita consumption
(%) (kg)
China 499.5 n.a. 89% 8.09 Mid Hard
Hong Kong 6.6 n.a. 6% 14.02 Easy Easy
Indonesia 75.7 n.a. 43% 2.72 Mid Hard
Malaysia 15.6 n.a. 3% 10.60 Mid Hard
Phillipines 14.9 n.a. 8% 8.17 Hard Mid
Singapore 4.1 n.a. 15% 6.17 Easy Easy
Taiwan 17.5 n.a. 41% 5.70 Mid Easy
Thailand 15.8 n.a. 64% 6.71 Mid Hard
Vietnam 11.2 n.a. 3% 3.98 Hard Mid
Distribution ease
Market access
Source: MLA Table 38 Beef exports to South East Asia and the Chinas (tonnes, sw)
2004-05 2005-06 2006-07 2007-08
Indonesia 6,272 9,516 19,370 31,743
Taiwan 25,542 30,655 30,512 26,281
Singapore 1,826 2,063 4,117 8,027
Philippines 1,877 2,705 2,726 7,746
Malaysia 3,717 1,420 2,824 4,361
Hong Kong 2,328 1,742 1,814 2,918
China 1,048 967 1,339 2,220
Thailand 990 1,199 1,381 1,533
Other Asia 264 461 556 854
Total Asia 43,864 50,728 64,639 85,683 Source: MLA
Review of the $1.50 Levy Increase for the FTF Program
Warwick Yates and Associates Pty Ltd, 2009
88
3.8.3. MLA FTF Activities What were the key assumptions at the start of the FTF program in 2004? The key strategy objective was to selectively invest chilled beef demand and position Australia to capitalise on that growth while defending current frozen beef volumes. This objective was to be achieved by:
• more effective differentiation of Australian beef on quality, integrity, and supply consistency points;
• stronger customer loyalty and increased propensity to accept Australian export beef prices;
• stronger presence in quality foodservice; and
• in the long-term, an increase in per capita consumption of ethnic Chinese in South-East Asia and the Chinas, to approach the levels of Japan and Korea.
What are the realities in 2007? The realities of this region are that it represents a very small part of Australia’s overall marketing mix at 10% of total exports at 96.9kt shipped weight in calendar year 2008.
What were the aspirations in the SE Asian Market? The FTF aspirations were described in the FTF document as follows: “Solid economic growth in South-East Asia and the Chinas, falling local supplies … and changing diets should provide growth in demand for protein foods across most of Australia’s smaller beef export markets over the next five years. However, the prospects for trade to these markets are not likely to improve significantly until the strong demand for Australian beef from Japan and Korea recedes, i.e. until significant quantities of US beef begin to re-enter these markets. Continued intense competition from Brazilian beef and Indian buffalo meat, and potentially Chinese beef, is likely to restrain future growth potential in the region, particularly for lower-priced frozen beef. Frozen beef exports are forecast to decline further in 2005 and remain low in 2006, under the assumption that little US product flows to Japan or Korea. Countries that allow Indian and Brazilian meat imports, particularly the Philippines, Malaysia and Hong Kong, are likely to see further significant falls in frozen shipments. Also, some of these countries have lifted, or are likely to lift, bans on US product, which will also harm Australia’s trade prospects in the chilled and high quality frozen market segments. These countries include Hong Kong, Malaysia, Singapore, the Philippines and Indonesia. Taiwan is also likely to lift its ban on imports of US beef, causing a further decline in Australian exports to this market. However, as New Zealand captured most of the US share to this market in 2004, the fall in shipments to this market is not expected to be large” (BISFC 2005a, p. 14).
Review of the $1.50 Levy Increase for the FTF Program
Warwick Yates and Associates Pty Ltd, 2009
89
Variations to the original FTF SE Asian program The program was diverted away from SE Asian countries to the Chinas in response to ongoing competitive pressures coming from Indian and South American commodity beef being imported by SE Asian countries. The China program activities consisted of the following:
• Market information ($120,000 per year) o Develop a comprehensive market information network to identify China’s
market dynamics to establish further government and industry networks, commission formal research and collect and analyse official data.
• Market access ($60,000 per year) o Optimise market access for our beef and cattle products to establish further
government and trade networks, identify policy shifts and utilise FTA negotiations to identify and remove impediments.
• Build demand (growing to $120,000 per year by 2007-08) o Develop a positive position for the Australian beef industry to identify and
educate trade customers, establish positive trade perceptions, pursue opportunities in foodservice and retail sectors with ICA type projects, assist Chinese authorities to identify opportunities to grow beef demand and support initiatives in co-product positioning.
3.8.4. Outcomes of FTF activities The following is an MLA synopsis of the results of Australia’s marketing efforts into the SE Asia and Chinas markets.
• Australian beef exports to Singapore increased from 1,893 metric tonnes (MT) in 2005 to 8,061MT in 2008. Frozen manufacturing product made its way into the market and accounts for the bulk of the increase of total volume.
• Australian beef exports to Indonesia rose from 8,762MT in 2005 to 33,017MT in 2008. Almost two-thirds of this product was destined for the manufacturing sector. Shipments of manufacturing product showed a nearly four-fold rise. This signifies a total market increase as New Zealand imports were also up considerably.
• Australian beef exports to Philippines reached 14,143MT in 2008, up from 3,951MT in 2005. This largely is as a result of increased prices out of Brazil making Australian beef more competitive.
• Australian beef exports to China increased to 3,682MT in 2008, mainly due to increased demand for manufacturing beef and brisket.
• Australian beef exports to Hong Kong were up 80% in 2008 on 2005 at 231MT, spurred by increases in topside, striploin, cube roll and tenderloin.
• Exports to Taiwan down 11% on 2005 at 27,099MT. The return of the US to the Taiwan market has continued to impact on Australian exports, especially prior to the re-entry of the US into Japan and Korea.

Review of the $1.50 Levy Increase for the FTF Program
Warwick Yates and Associates Pty Ltd, 2009
90
3.8.5. Case Study A comprehensive business development program has been implemented in mainland China focusing on the retail sector in the city of Shanghai. Prior to the program Australian beef had very limited exposure in the retail sector, i.e. only in expatriate speciality stores. In 2008 there were three major chains carrying Australian beef in a number of stores. The beef product in one upmarket chain is being profiled under an individual exporter’s brand whilst the others are covered by an Australian “clean and safe” identity mark. This development positions Australia well for the future growth opportunities in this market. 3.8.6. Conclusions
• Australia continues to make progress in these complex markets which may well be the way of the future as economic conditions improve and beef consumption increases in response to increases in GDP.
• However, these markets are extremely price sensitive and subject to competitor pressures from other protein sources and competitor exporters such as India and South America.
• There is concern in the more traditional markets of Japan and Korea that Australia’s efforts to broaden the export market base to SE Asian and the Chinas markets may pose a threat to Australia as a reliable supplier to Japan and Korea.
• The FTF program operated with a focus on ICA type programs has been effective in building demand to these markets. The flexibility shown in the FTF operating plan program approach has to be commended in seeking the best return for the marketing dollar spend in these markets.
• The reality is that these markets will continue to be volatile but Australia’s targeted focus on Indonesia and the Chinas will continue to provide markets for Australian export beef.
Review of the $1.50 Levy Increase for the FTF Program
Warwick Yates and Associates Pty Ltd, 2009
91
33..99.. LLiivvee EExxppoorrttss 3.9.1. Introduction The FTF live export strategy was to support live exports to compete against low priced beef from South America and India, in particular in South-East Asia, and to position Australia as a reputable supplier as the quality sector grows in the South-East Asian region. This section needs to be considered in context with Section 3.10 in this program review. Section 3.10 considers the Community Concerns program and includes work undertaken to address community attitudes in light of animal activist opposition to the live export trade. The support pillar for live exports was the creation of demand for beef from Australian cattle imported live to the key SE Asian markets, such as Indonesia. Pre-levy Increase Prior to the levy increase no major effort had been made to promote Australian beef from Australian cattle imported live into Indonesia, largely because most of this beef is sold through wet markets. At the time of the levy increase, this was changing as modern retail outlets were expanding and the quality and commercial marketing of beef for imported cattle was improving. A budget increase of $300,000 was allocated in 2006-07 to develop and implement a promotional program to build demand for beef from Australian cattle. This funding was continued in 2007-08 and 2008-09. The additional funding was initially used to implement retail promotional activities for local brands of beef from cattle imported from Australia. This activity then developed into a more strategic coordinated approach to promotion, conducted by the live export and MLA South East Asia meat teams. LiveCorp Levy increase Following the increase in the MLA cattle levy in early 2006, LiveCorp increased their levy on exporters from $2.30 to $3.00 per head. What were the aspirations in the Live Export Market? The Live Export Program had two key aspirations as follows:
• Greater stability in the Indonesian live trade
• Further sustainable growth in live exports These aspirations were built around the strategy to support live exports to compete against low priced beef from South America and India, particularly in South-East Asia, and to position Australia as a reputable supplier as the quality sector grows in the South-East Asian region. What were the key assumptions at the start of the FTF program? Indonesia Indonesia, accounting for over half the total volume of Australia’s live cattle exports, and worth around $200M annually, is critical to the viability of the cattle industry in northern Australia. Indonesia is also the most important beef market in South-East Asia, with Australian beef exports to Indonesia in 2004 totalling 7,127 tonnes and worth over $25M.
Review of the $1.50 Levy Increase for the FTF Program
Warwick Yates and Associates Pty Ltd, 2009
92
Indonesia does not permit beef imports from FMD endemic countries, and competition from pork is limited as most consumers are Muslim. It is a developing country with good potential for significant economic growth. Beef consumption will increase with increasing per capita incomes, and this increase will have to be supplied by imports. Philippines and Malaysia Although beef and cattle sales to the Philippines and Malaysia have recently been subdued because of high Australian cattle prices (cattle exports are about 50,000 head to both countries, and beef exports in 2004 were 4,795 tonnes and 2,071 tonnes to Malaysia and Philippines, respectively), both countries have undoubted long-term potential. The Philippines was Australia’s largest live cattle market in the 1990s, taking over 200,000 cattle annually. Competition from Indian and Brazilian beef is fierce in both the Philippines and Malaysia, and pork is the major competitor in the Philippines. Australia’s foothold in these markets must be maintained for the longer-term. Their economies have very significant upside potential, and cattle prices and exchange rates will re-align at some time in the future. Middle East Although the Middle East currently accounts for only 10% of total live exports (70–80,000 head per annum), there are potential new markets to develop (e.g. a re-opened Saudi market, Libya, Syria and Israel) and Egypt has, in the recent past, imported over 200,000 head. Beef exports face overwhelming competition from South America, but the strong preference for fresh killed meat provides an opportunity for live cattle exports. Pressure from animal rights activists has led to improvements in the handling and processing of Australian livestock after arriving in the Middle East (essential to the survival of live trade to this region). The Australian Government has positioned a veterinarian in the region and allocated $1m per year for four years for this purpose. 3.9.2. Market Dynamics Australia is, and continues to be, the dominant source of live cattle for the Indonesian market. These cattle are sourced from Northern Australia. Australian cattle exports to Indonesia grew strongly from 296,000 head in 2001 to 386,000 head in 2006 and are likely to reach 600,000 in 2008. The strong growth has been in spite of rising cattle and CIF prices. However, this program sought to go beyond the live export of Australian cattle and attempted to build loyalty to beef sourced from Australian cattle finished in Indonesian feedlots and marketed in either the wet market or supermarket trade as the Trade Support Asia program. 3.9.3. MLA FTF Activities Table 39 shows the budget for trade support and market access issues in Indonesia. This budget was used to fund the following range of activities. Table 39 Trade support Asia budget.
Financial Year Trade Support Indonesia Market Access Indonesia
2004-05 $0 $67,000
2005-06 $275,000 $60,000
2006-07 $805,000 $60,000
2007-08 $671,000 $75,000
2008-09 $707,000 $85,000
Source: MLA
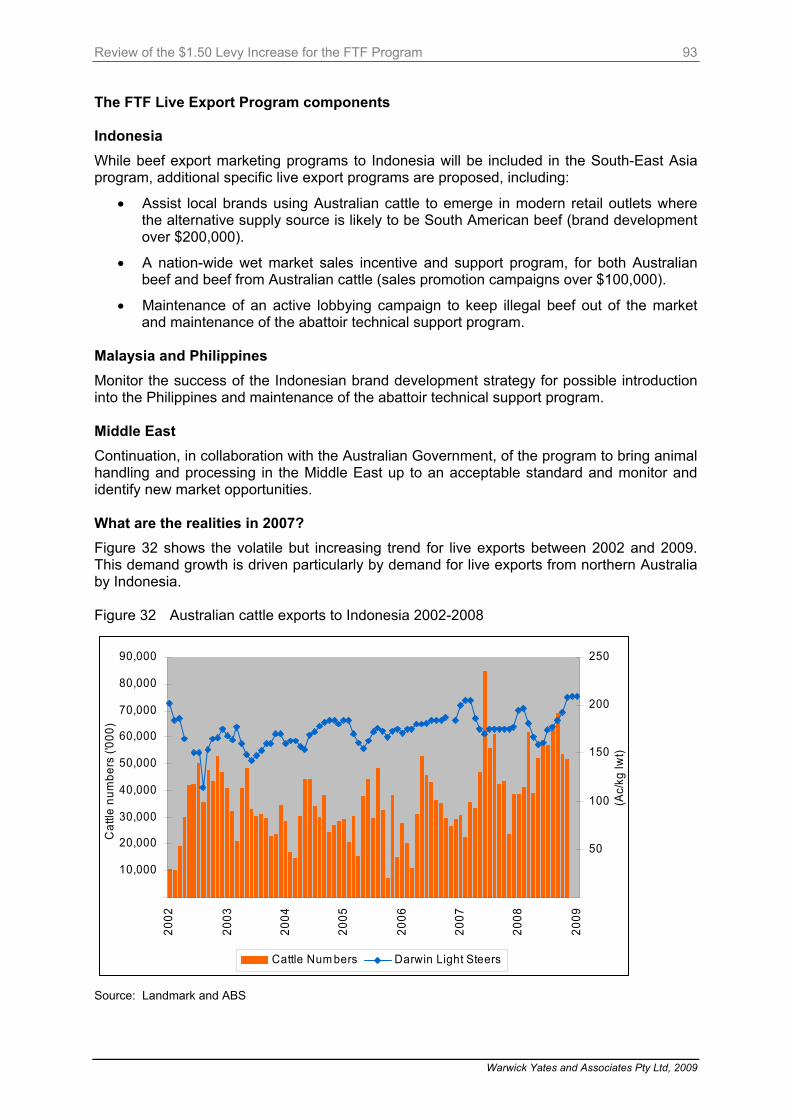
Review of the $1.50 Levy Increase for the FTF Program
Warwick Yates and Associates Pty Ltd, 2009
93
The FTF Live Export Program components Indonesia While beef export marketing programs to Indonesia will be included in the South-East Asia program, additional specific live export programs are proposed, including:
• Assist local brands using Australian cattle to emerge in modern retail outlets where the alternative supply source is likely to be South American beef (brand development over $200,000).
• A nation-wide wet market sales incentive and support program, for both Australian beef and beef from Australian cattle (sales promotion campaigns over $100,000).
• Maintenance of an active lobbying campaign to keep illegal beef out of the market and maintenance of the abattoir technical support program.
Malaysia and Philippines Monitor the success of the Indonesian brand development strategy for possible introduction into the Philippines and maintenance of the abattoir technical support program. Middle East Continuation, in collaboration with the Australian Government, of the program to bring animal handling and processing in the Middle East up to an acceptable standard and monitor and identify new market opportunities. What are the realities in 2007? Figure 32 shows the volatile but increasing trend for live exports between 2002 and 2009. This demand growth is driven particularly by demand for live exports from northern Australia by Indonesia. Figure 32 Australian cattle exports to Indonesia 2002-2008
10,000
20,000
30,000
40,000
50,000
60,000
70,000
80,000
90,000
2002
2003
2004
2005
2006
2007
2008
2009
Cat
tle n
umbe
rs ('
000)
50
100
150
200
250
(Ac/
kg lw
t)
Cattle Num bers Darwin Light Steers
Source: Landmark and ABS
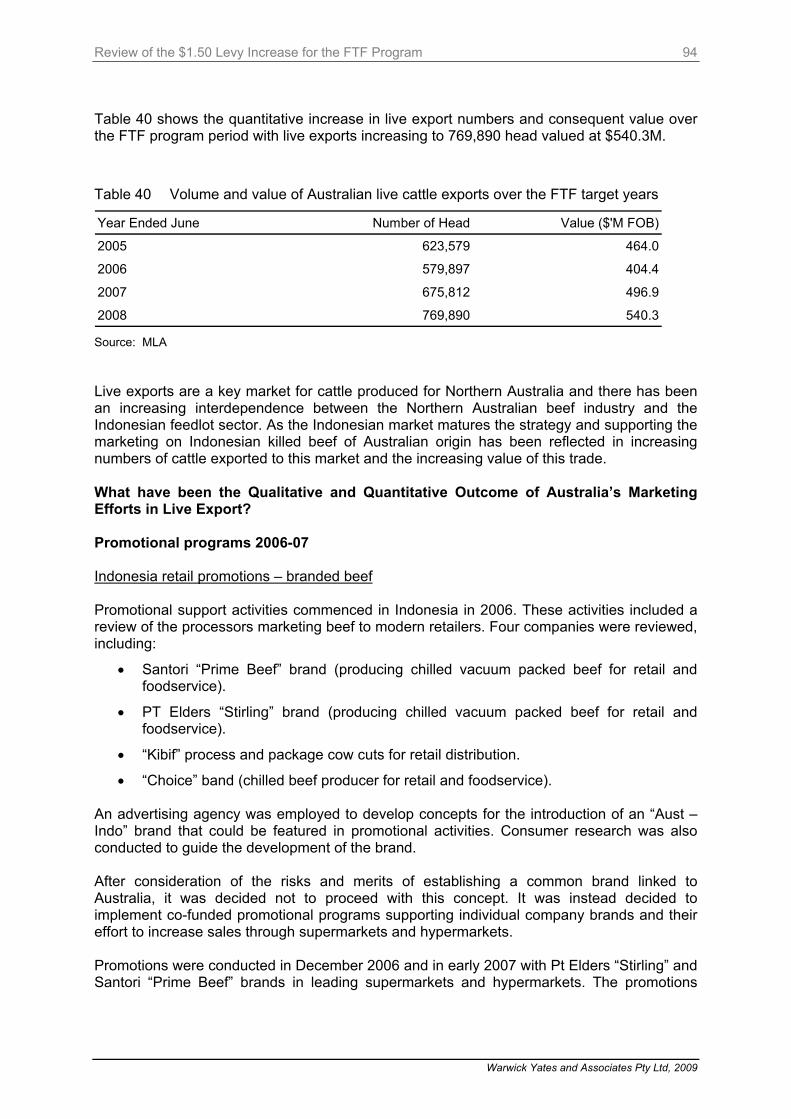
Review of the $1.50 Levy Increase for the FTF Program
Warwick Yates and Associates Pty Ltd, 2009
94
Table 40 shows the quantitative increase in live export numbers and consequent value over the FTF program period with live exports increasing to 769,890 head valued at $540.3M.
Table 40 Volume and value of Australian live cattle exports over the FTF target years
Year Ended June Number of Head Value ($'M FOB)
2005 623,579 464.0
2006 579,897 404.4
2007 675,812 496.9
2008 769,890 540.3 Source: MLA Live exports are a key market for cattle produced for Northern Australia and there has been an increasing interdependence between the Northern Australian beef industry and the Indonesian feedlot sector. As the Indonesian market matures the strategy and supporting the marketing on Indonesian killed beef of Australian origin has been reflected in increasing numbers of cattle exported to this market and the increasing value of this trade. What have been the Qualitative and Quantitative Outcome of Australia’s Marketing Efforts in Live Export? Promotional programs 2006-07 Indonesia retail promotions – branded beef Promotional support activities commenced in Indonesia in 2006. These activities included a review of the processors marketing beef to modern retailers. Four companies were reviewed, including:
• Santori “Prime Beef” brand (producing chilled vacuum packed beef for retail and foodservice).
• PT Elders “Stirling” brand (producing chilled vacuum packed beef for retail and foodservice).
• “Kibif” process and package cow cuts for retail distribution.
• “Choice” band (chilled beef producer for retail and foodservice). An advertising agency was employed to develop concepts for the introduction of an “Aust – Indo” brand that could be featured in promotional activities. Consumer research was also conducted to guide the development of the brand. After consideration of the risks and merits of establishing a common brand linked to Australia, it was decided not to proceed with this concept. It was instead decided to implement co-funded promotional programs supporting individual company brands and their effort to increase sales through supermarkets and hypermarkets. Promotions were conducted in December 2006 and in early 2007 with Pt Elders “Stirling” and Santori “Prime Beef” brands in leading supermarkets and hypermarkets. The promotions
Review of the $1.50 Levy Increase for the FTF Program
Warwick Yates and Associates Pty Ltd, 2009
95
included the use of POS and cooking demonstrations/tastings and incentive giveaways for purchasing certain quantities of beef. The promotion in December 2006 achieved sales growth of 125% in Superindo stores, 118% in Alfa stores and 109% in Hypermart stores. The promotional activities helped the suppliers to secure their positions in these supermarkets. Sales increases were significant during these events. Promotional programs 2007-08 Coordinated approach to marketing in Indonesia The initial retail promotion activities in 2006-07 lead to realisation of the need for the development of a combined approach for Indonesia by the Live Export team and the MLA South East Asian meat team. Increased funding has enabled the budgeting of increased market promotion and a combined approach to promotions and marketing of beef from Australian cattle and imported beef. The combined approach started in December 2007 when a qualitative consumer research study which was co-funded by both groups. The outcomes of this research as are shown in Section 3.9 The research has provided insights into Indonesian consumer perceptions of Australian beef and beef from Australian cattle. The key findings from the research included, importance of nutrition, interest in children’s development, need for product education, strong preference for fresh beef, positive perception of Australia and lack of understanding that beef in the wet market is from Australian cattle. The research is now being used as key strategies in MLA promotional campaigns. An agreement was reached with the South East Asian meat team for a marketing representative to be appointed to be jointly funded in Jakarta. The position was contracted in May 2008. This has enabled development of a coordinated approach across the meat spectrum (i.e. across the full meat counter) in Indonesia to grow demand for the beef category. Promotional activities have more recently focused on wet market opportunities and the introduction of PR and advertising. In consultation with APFINDO (Indonesian feedlotters association) there was a change in focus to wet market promotion. This was due to the great majority of product going through that channel and a decline in promotional opportunities in the supermarket sector as local cost of production has increased and as retailers move to cheaper imported Australian chilled and frozen beef. In January 2008 a wet market program was developed at Santa modern wet market. This involved butcher training, an upgrade of wet market stands and promotional activities (including butcher uniforms, recipe booklets and letter box drops in the local area). Beef sales went up during the promotion in June and the market remains a model for others to follow.
Review of the $1.50 Levy Increase for the FTF Program
Warwick Yates and Associates Pty Ltd, 2009
96
Promotional programs 2008-09 Wet market promotions Wet market promotions have been stepped up with promotions held in 10 wet markets across Jakarta during August, September and November. The program will expand to other cities in the second half of the year. While it is too early to say if there will be sustained growth in beef demand, the activities have the benefit of motivating butchers, improving meat displays and creating interest in beef stalls in busy wet markets. Co-operative retail promotions
Co-operative promotions have been held in Hypermart and Foodmart in November. PR and advertising
PR and above the line advertising activities are being developed for implementation in the New Year. Other regional activities Philippines / Malaysia It is important to maintain a foothold in these two markets. It was proposed to possibly introduce retail promotions in these markets and to maintain abattoir technical support programs if there was an increase in the levy. While both the Philippines and Malaysian markets have declined in volume since 2006-07 MLA has maintained their technical support activities and delivered promotional activities in Peninsular Malaysia. Malaysia Promotional programs 2006-07 and 2007-08 Co-operative promotions with RM Livestock were conducted in 2006-07 and 2007-08 to support their branded beef marketing in Malaysian supermarkets. The promotions included product tastings and POS support. Promotional programs 2008-09 So far this year promotional activities have stopped as RM Livestock has reduced its production of beef from Australian cattle. They are now using smaller quantities of local or Thai cattle and imported beef. 3.9.4. Outcomes of FTF activities Despite a higher value AUD, increasing Indonesian feedlot costs and a move by supermarkets to lower cost Australian chilled and frozen beef, the program has worked in Indonesia and, to a lesser extent, provided an additional foothold in the Malaysian and Philippines markets for live cattle exports as shown in Table 41. For live export sales over the 2005 to 2008 period, an AU$1,225M for an outlay of AU$2.8M to help realise this sales value is an excellent return on the program budget.

Review of the $1.50 Levy Increase for the FTF Program
Warwick Yates and Associates Pty Ltd, 2009
97
Table 41 Live exports to Indonesia, Malaysia and Philippines between 2005 and 2008 Year
ended June
Indonesia Malaysia Philippines Total Value (‘000A$FOB)
Trade Support & Mkt Access
Program Budget (‘000A$)
2005 358,593 38,189 36,012 2006 360,364 44,813 17,139
Volume (Number of head) 2007 452,197 52,247 14,016 2008 547,189 26,868 15,615
2005 214,920 20,955 23,426 259,301 335 Value(‘000 A$FOB) 2006 220,683 23,913 10,379 254,975 865 2007 302,840 29,554 9,815 342,209 746 2008 341,641 16,853 10,323 368,817 793 Total 1,225,302 2,806 Source: ABS and MLA, 2008 3.9.5. Case Studies Not applicable 3.9.6. Conclusions
• By any measure the live export program has been highly effective in achieving the strategic objective of securing Australia’s competitive position in the Indonesian live export cattle trade, the Indonesian feedlot sector and the Indonesian wet market and supermarket trade from competition from alternative suppliers.
• Marketing expenditure of approximately $2.8M has contributed to the increasing value of live cattle exports which summed to $1.2 billion over the 4 years 2005 to 2008.
Performance Criteria Program Commencement 2008 Marketing Budget( $M) • $0.3M • $0.475M Market Growth Live Exports (Head) Indonesia Malaysia Philippines Middle East SubTotal
• 358,893 • 38,189 • 36,012 • 81,748 • 514,842
• 547,189 • 26,868 • 15,615 • 101,623 • 691,895
Market Growth Beef (tonnes): Indonesia Malaysia Philippines Middle East SubTotal
• 7127 • 2071 • 4795 • 1,329 • 15,322
• 31,743 • 4,361 • 7,746 • 7,718 • 51,568
Program Effectiveness • Highly effective for live export and beef exports particularly to Indonesia

Review of the $1.50 Levy Increase for the FTF Program
Warwick Yates and Associates Pty Ltd, 2009
98
33..1100.. CCoommmmuunniittyy CCoonncceerrnnss PPrrooggrraamm 3.10.1. Introduction Pre levy increase
Prior to the introduction of the marketing levy the Livestock Export Program communications activities were limited to internal industry stakeholders. The program was delivering market and trade information to producers and exporters via weekly and monthly newsletters such as the LiveLink market update, Weekly News Digest and Live Export News. These communication tools where directly targeted to stakeholders within the trade to provide market information and intelligence. Limited resources were dedicated to this role. At the same time there were no communication activities addressing potential and emerging community concerns over issues such as the environmental impact of beef production and animal welfare. Public perception
Following a number of high profile incidents including the Cormo which received worldwide attention, the industry came under significant media scrutiny with several negative stories broadcast nationally on Channel Nine’s 60 Minutes program. At the same time animal activist organisations including PETA and Animals Australia launched well organised campaigns against the industry with the goal of forcing its closure through public pressure upon the Government. This negative publicity led to mounting community concerns about the livestock export trade. In 2004 NewsPoll surveys were initiated and are conducted every six months to determine the public’s knowledge and opinions of the trade. While the live trade received increased scrutiny, consumer research showed that generally the community believed Australia’s beef producers were ‘ethical and trustworthy’. Although trust levels were high, they were not based on any strong foundation. Community profiling showed 24% of Australians are born overseas; 73% of urban Australians said they know little or nothing about farming and 64% of under 35s have never been on a farm. With such a low and diminishing knowledge of food production, the community’s trust was at risk of being eroded by attacks from activists. Introduction of the $1.50 levy increase
From 2005-06 funding towards live export communications activities increased with a significant budget increase of $500,000 in 2006-07 to $840,000 in total. Funding for the broader industry integrity communications program was $913,000 in 2006-07 and again in 2007-08 and $1,004,000 in 2008-09. 3.10.2. Market Dynamics See Live Export Review in Section 3.9.2
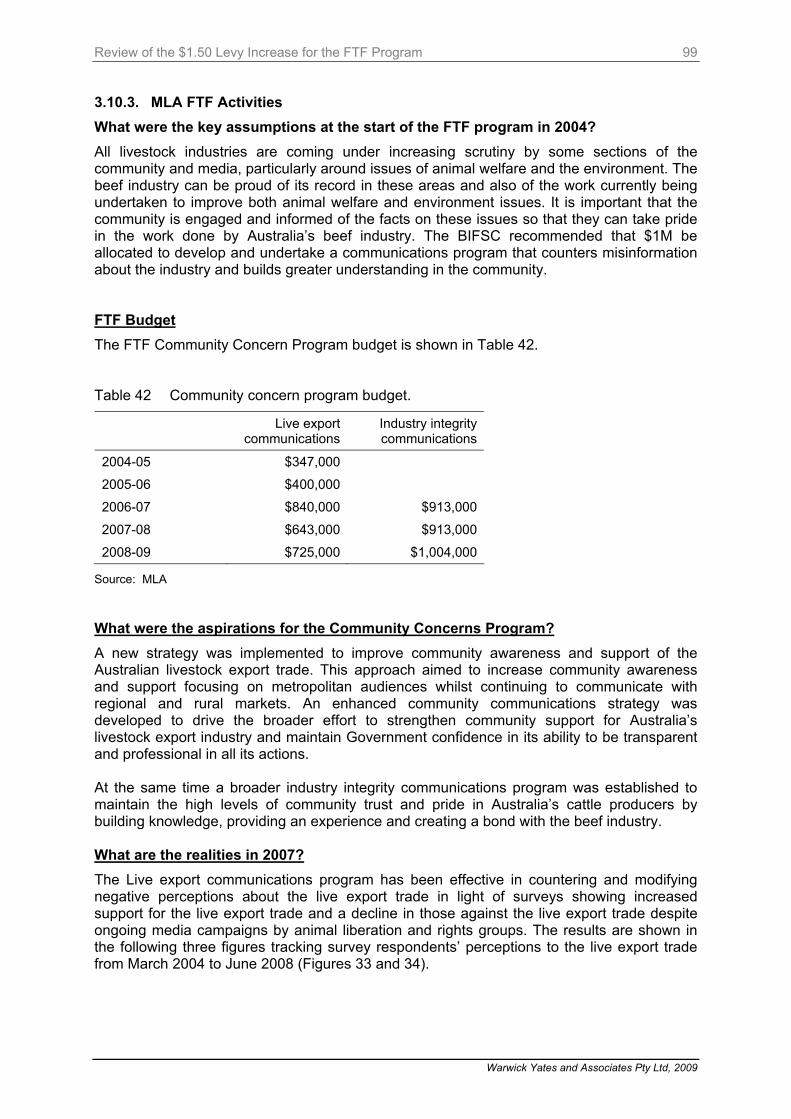
Review of the $1.50 Levy Increase for the FTF Program
Warwick Yates and Associates Pty Ltd, 2009
99
3.10.3. MLA FTF Activities What were the key assumptions at the start of the FTF program in 2004? All livestock industries are coming under increasing scrutiny by some sections of the community and media, particularly around issues of animal welfare and the environment. The beef industry can be proud of its record in these areas and also of the work currently being undertaken to improve both animal welfare and environment issues. It is important that the community is engaged and informed of the facts on these issues so that they can take pride in the work done by Australia’s beef industry. The BIFSC recommended that $1M be allocated to develop and undertake a communications program that counters misinformation about the industry and builds greater understanding in the community. FTF Budget The FTF Community Concern Program budget is shown in Table 42. Table 42 Community concern program budget.
Live export communications
Industry integrity communications
2004-05 $347,000
2005-06 $400,000
2006-07 $840,000 $913,000
2007-08 $643,000 $913,000
2008-09 $725,000 $1,004,000
Source: MLA What were the aspirations for the Community Concerns Program? A new strategy was implemented to improve community awareness and support of the Australian livestock export trade. This approach aimed to increase community awareness and support focusing on metropolitan audiences whilst continuing to communicate with regional and rural markets. An enhanced community communications strategy was developed to drive the broader effort to strengthen community support for Australia’s livestock export industry and maintain Government confidence in its ability to be transparent and professional in all its actions. At the same time a broader industry integrity communications program was established to maintain the high levels of community trust and pride in Australia’s cattle producers by building knowledge, providing an experience and creating a bond with the beef industry. What are the realities in 2007? The Live export communications program has been effective in countering and modifying negative perceptions about the live export trade in light of surveys showing increased support for the live export trade and a decline in those against the live export trade despite ongoing media campaigns by animal liberation and rights groups. The results are shown in the following three figures tracking survey respondents’ perceptions to the live export trade from March 2004 to June 2008 (Figures 33 and 34).

Review of the $1.50 Levy Increase for the FTF Program
Warwick Yates and Associates Pty Ltd, 2009
100
Figure 33 Knowledge of the Australian livestock export trade
0
10
20
30
40
50
60
70
80
Mar-04
Jun-0
4
Sep-04
Dec-04
Mar-05
Jun-0
5
Sep-05
Dec-05
Mar-06
Jun-0
6
Sep-06
Dec-06
Mar-07
Jun-0
7
Sep-07
Dec-07
Mar-08
Jun-0
8
Res
pons
es (%
)
A lot A little Nothing
Source: MLA Figure 34 In favour / against of Australian livestock export trade
0
10
20
30
40
50
60
Mar-04
Jun-0
4
Sep-04
Dec-04
Mar-05
Jun-0
5
Sep-05
Dec-05
Mar-06
Jun-0
6
Sep-06
Dec-06
Mar-07
Jun-0
7
Sep-07
Dec-07
Mar-08
Jun-0
8
Res
pons
es (%
)
Total in favour Total agains t
Source: MLA
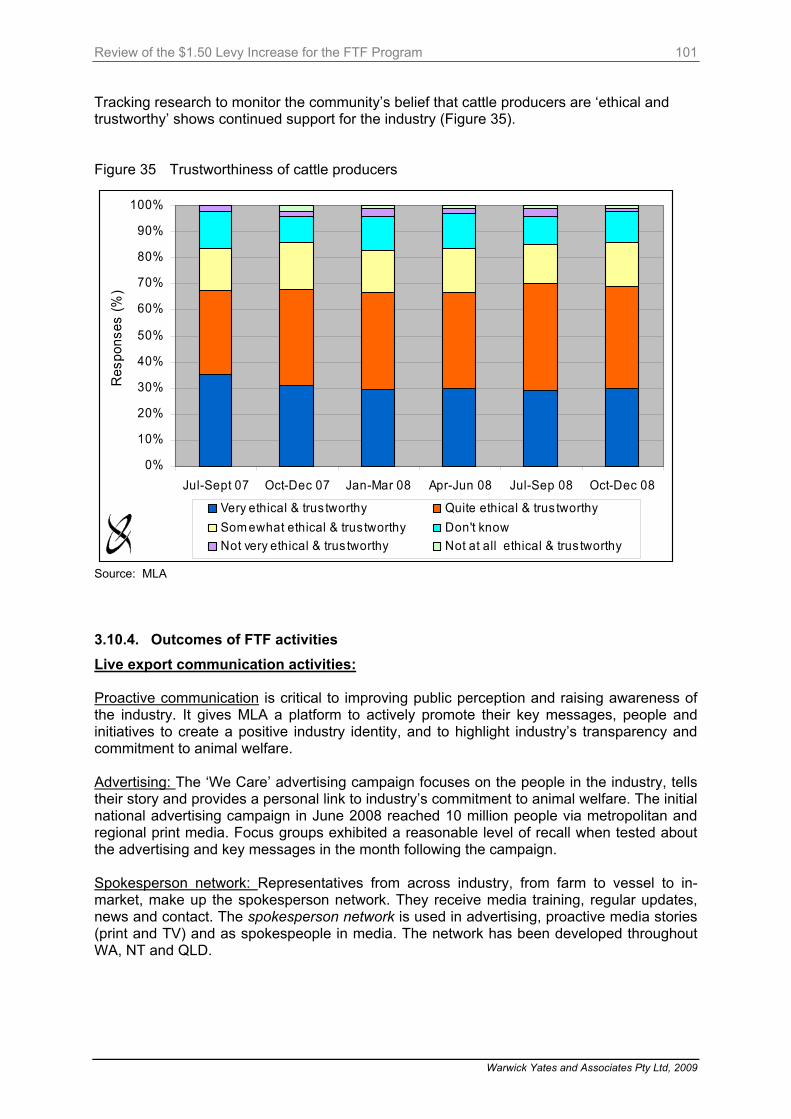
Review of the $1.50 Levy Increase for the FTF Program
Warwick Yates and Associates Pty Ltd, 2009
101
Tracking research to monitor the community’s belief that cattle producers are ‘ethical and trustworthy’ shows continued support for the industry (Figure 35). Figure 35 Trustworthiness of cattle producers
0%
10%
20%
30%
40%
50%
60%
70%
80%
90%
100%
Jul-Sept 07 Oct-Dec 07 Jan-Mar 08 Apr-Jun 08 Jul-Sep 08 Oct-Dec 08
Res
pons
es (%
)
Very ethical & trus tworthy Quite ethical & trus tworthySom ewhat ethical & trus tworthy Don't knowNot very ethical & trus tworthy Not at all ethical & trus tworthy
Source: MLA 3.10.4. Outcomes of FTF activities Live export communication activities: Proactive communication is critical to improving public perception and raising awareness of the industry. It gives MLA a platform to actively promote their key messages, people and initiatives to create a positive industry identity, and to highlight industry’s transparency and commitment to animal welfare. Advertising: The ‘We Care’ advertising campaign focuses on the people in the industry, tells their story and provides a personal link to industry’s commitment to animal welfare. The initial national advertising campaign in June 2008 reached 10 million people via metropolitan and regional print media. Focus groups exhibited a reasonable level of recall when tested about the advertising and key messages in the month following the campaign. Spokesperson network: Representatives from across industry, from farm to vessel to in-market, make up the spokesperson network. They receive media training, regular updates, news and contact. The spokesperson network is used in advertising, proactive media stories (print and TV) and as spokespeople in media. The network has been developed throughout WA, NT and QLD.

Review of the $1.50 Levy Increase for the FTF Program
Warwick Yates and Associates Pty Ltd, 2009
102
Proactive media: Positive industry stories using the spokesperson network as have been successfully pitched into metropolitan media and consumer press, including Notebook, Vive, Australian Country Style, The Sydney Morning Herald, Qantas Business Radio, The Good Weekend (Sydney & Melbourne), The West Australian and A Current Affair. Proactive press releases on good news industry stories have received strong coverage online and in metropolitan and regional press including, No truck, no sheep, Nov. 2008; reopening of the Egyptian trade May 2008; and Sharon Dundon’s move to Bahrain in November 2007. MLA continues to strive for greater metropolitan media interest and coverage. Industry promotional material: A suite of material to promote the industry and enable MLA to share information with the community includes a professional display system, ‘banner bugs’, postcards, fact sheets and information kits. The liveexportcare.com website has been modified to provide increased news and information content on the homepage and is being further developed to house pictures and video. Photographs and video footage of the chain from farm to in-market feedlot has been gathered and placed on industry websites and used in promotional material. All video material is being audited to include on share websites such as Youtube. Royal Shows: For the first time, in 2008, the livestock export industry had a presence at a Royal Show, with a display, a to-scale vessel sheep pen and promotional material at the Perth Royal Show. The display was manned by industry representatives who spent time sharing information with local community members. Stakeholder communications: Industry stakeholders regularly receive LiveLink, the Weekly News Digest and the Livestock Export News providing news and information about the trade. Industry representatives receive the industry media update via email each month or as required (e.g. during issue or high media period). Issue management: Industry has increased its responsiveness and engagement with media, and strives to be transparent and available. Advertising campaign: The open letter to farmers advertisement was developed in response to a campaign by Animals Australia targeting Australian farmers who export livestock. It was published in regional media in October 2008, and the We Care advertisements were placed in key metro papers to run concurrently. Media educational: MLA and LiveCorp representatives regularly meet with key metropolitan and regional media at media briefing sessions. These provide the opportunity to raise media awareness of the trade and develop relationships with key journalists. Industry integrity communications: Building knowledge: Working with National Farmers Federation, educators and DAFF a Primary Industries Education Foundation has been established to act as an independent tripartite body to promote agriculture on the Australian school curriculum. The Foundation will provide a conduit to schools for industry information that meets teachers’ needs.

Review of the $1.50 Levy Increase for the FTF Program
Warwick Yates and Associates Pty Ltd, 2009
103
For the last three years a beef industry case study has been included in the Australian Financial Review Business Case Studies distributed to 3,500 secondary school Business Studies teachers. Case studies also appear on the AFR Business Case Studies website. To complement schools activities a major presences for the beef industry has been developed at the Brisbane Ekka (The Meating Centre), the Sydney Royal Easter Show (The Food Farm), the Melbourne Show (The Beef Experience) and to a lesser extent at the Adelaide show (Our Stake in the Ground). These shows combined have approximately 2.5 million visitors each year. Providing an experience: To celebrate Landcare Week in 2006, MLA took 100 Sydneysiders to a cattle property for a day. Visitors took part in activities that showed how producers care for their animals and their land media coverage was generated from the event. From 2007, MLA has supported Farm Day to make it a national annual event. Extensive media, featuring beef producers, is generated from the event each year as well as participants creating strong bonds with their farmer hosts. Creating a human bond: a successful media partnership with The Australian Women’s Weekly has generated extensive exposure for cattle producers through telling their stories and featuring evocative images. Two features have run and a third is underway. Each has delivered extended value such as a book, Women of the Outback, an increase profile for cattle producers featured, and interest generated in further promotions. In addition a range of media activities has resulted in beef producers and the industry being featured in a range of major metropolitan, regional and local media outlets. Results: In addition to the 10% increase in community support for the live trade quarterly media coverage analysis conducted by CARMA show a favourability rating of 56.5% for the third quarter of 2008 (50% is seen as highly desirable).
Industry integrity communications activities have tracked well. Research conducted at the Brisbane Ekka and Royal Easter Show indicated visitors picked up key messages and left with an improved view of the beef industry. The beef industry case study was received 157,014 hits and 2,379 downloads

Review of the $1.50 Levy Increase for the FTF Program
Warwick Yates and Associates Pty Ltd, 2009
104
The Landcare event succeeded in generating media with a reach of 5.57 million and valued at $825,000. Media activities around Farm Day have achieved a reach of over 11 million for two years running and participant surveys indicate strong key message cut through. All media activities for 2007-08 year generated 770 articles reinforcing program key messages. These included:
• 46 TV
• 495 radio
• 220 print
• 9 website 3.10.5. Case Studies Not applicable to this section 3.10.6. Conclusions The Community Concern Program has been successful as a proactive tool to counter and moderate public opinion previously shaped by those opposed to the live export industry, and to underpin the community’s trust in the beef industry. This program is an essential adjunct to the Live Export Program and should continue to counter animal rights activist rhetoric with facts about the live export industry. As focus intensifies on the management of natural resources and concerns for animal welfare grow, it will be increasingly important to not only address these issues but also to continue to tell the broader story of integrity behind the beef industry.
Review of the $1.50 Levy Increase for the FTF Program
Warwick Yates and Associates Pty Ltd, 2009
105
44.. CCoommmmeerrcciiaall SSttaakkeehhoollddeerrss PPeerrcceeppttiioonnss ooff tthhee EEffffeeccttiivveenneessss ooff tthhee FFTTFF PPrrooggrraamm
This review consulted with key beef exporters as to their perception of the effectiveness of the FTF program on a market by market basis. The exporters were also asked what could have been done better in the FTF program. The following are the verbatim responses received from those participating in the consultation process. The comments are self explanatory and are consistent with the review teams findings in that the key exporters were generally supportive of the FTF program in the export beef markets but questioned the effectiveness of the marketing spend in the domestic market without supporting KPI’s to justify that market spend or measure spend effectiveness. At the Australian retail level beef retailers and foodservice operators consulted were supportive of the FTF program. Effectiveness of the FTF Program Domestic Market - Processors
• Program very effective in domestic market. Has increased demand through nutritional campaigns.
• Created 2 new MSA brands. Based along the ‘Natural Beef’ line of marketing. I have been able to use the money to develop more awareness of the benefits of Grass fed beef and in turn get consumers to understand more about how cattle are farmed and the benefits of our claims. Very successful marketing going from sales of $50-70,000 per week up to now $400,000 per week in one year.
• I don’t believe there has been any significant improvement in per capita beef consumption since 2005 and therefore question the 100% increase in domestic funding.
• The Australia domestic market has been strong over the past 4 to 5 years with the growing level of disposable income in this country. The nutritional campaigns have been helpful in breaking down some of the negative connotations surrounding red meat. However, the extent of the increase in promotional expenditure in this market is difficult to justify. We never see any sales figures for the domestic market to really gauge if we are gaining market share against pork & chicken.
• There have been more monies allocated to the domestic beef marketing campaign which has had some impact, the extent of which has not been measured at this time. Given that the domestic market is the best market in terms of volume and return it would be my view that more could be spent provided that performance related KPI’S could be established beyond the current rather subjective measures.
• In my opinion, approximately 70% of our beef production is exported and demand is generally driven by access, price, exchange rates and supply issues. Whilst I support in general,increased marketing of Australian beef around the world, it is difficult to accurately monitor the return on this investment. So generally speaking, the improved position for Australian beef has been a consequence of market forces – not increased marketing.

Review of the $1.50 Levy Increase for the FTF Program
Warwick Yates and Associates Pty Ltd, 2009
106
Domestic Market Retailer and Foodservice Operators Comments
• MLA was touting a $25,000 increase over a year each year from the levy increase. Improved his business by $120,000/year - increase in bottom line by 6 %.
• Red meat network club – greatest vehicle for the butchers in Australia. Fantastic about product and branding.
• Entice – brilliant and has not seen anything move off the shelf as quickly as Entice magazine. Fantastic to have finally done something about it, i.e. about providing user-friendly information for the shopper.
• Entice is very good.
• Awareness of nutritional issues has increased.
• TV ads have been really good.
• Nutrition message that ‘it’s good for you, always has been and still is’, is a good message.
• Retail sales have gone up.
• More people are having more meals at home.
• Marketing has stopped the decline in red meat consumption and helped the recovery.
• Advocated increase in the levy and fully support its maintenance. Majority of processors tend to forget that the domestic market is our largest market and should be looked after.
• Entice magazine is one of the best things they’ve ever done. Believes there have been 5 issues – not enough copies available but very good initiative.
• Broadly MLA have been doing an excellent job in the domestic market especially in troublesome times (e.g. when poultry and pork have been competitively priced).
• In current economic climate MLA needs to be aggressive to maintain market position for beef. Imports of pork and chicken far more expensive today than in 2006. Beef very well priced at the moment and MLA needs to continue to take advantage of this situation.
• Increase in the levy has benefitted their business both as a processor and a retailer. MLA has supported them in their own promotion of red meat.
• Lamb program has gone from strength the strength.
• Results good in SA of most recent TV/in store (Entice) promotion of beef.
• New products – “Sizzle Steak” not a product made for up-market consumers but it’s made with silverside – has been an absolute hit. New product launch of the year with their firm. Technical support and marketing support from MLA has been outstanding.
• Seen an increase in consumption of red meat market over the past 2 to 3 years. Especially followed by lamb, beef is the most popular choice in their banquets.
• Sirloin, steak, fillet are increasingly popular selections in their restaurants.
• There is a trend of increasing popularity of beef – difficult to know how much MLA has contributed to it, but the marketing definitely helps.
• Believes that consumers respond more to negative messages that will bring a sharp change (fall) in demand. To increase demand and market share it requires on-going positive messages, reinforcing current trend.

Review of the $1.50 Levy Increase for the FTF Program
Warwick Yates and Associates Pty Ltd, 2009
107
Japan
• Japan is a very mature market. Diminishing population, aging population. Very supply driven.
• We have used the money to create awareness in this market of our MSA brands and actively in 2009 creating more demand for graded products from Grass fed animals. We have just developed a brochure to explain the benefits of our beef which will simply explain, in Japanese terms, the benefits.
• The Japanese market has been particularly weak during the last 2-3 years due to largely to economic factors. There has been little competition from other beef exporting countries and the main competition has come from chicken, pork and subsidised domestic beef. The 63% increase in promotional expenditure has done very little to arrest the situation and it was probably naive to expect that it could. Japan is a mature market and given the demographics is one that is likely to decline over time. Promotional expenditure is unlikely to grow demand overall but just shift market shares between exporters, Australian and other. Japan is now very much a price market and it is no longer the premium beef market of the world. The increase in expenditure in Japan would have been better spent growing overall demand in a developing market. Sales of Australian beef into Japan peaked in 2006 and have been falling ever since despite the increased expenditure.
• The programs in Japan have been developed over many years and whilst some may say they need to be revitalised I think that they work well and invite industry participation along the supply chain.
• Basically, Australia has had exclusive access to this most important market for Australia with the absence of USA. Exporters have done a great job of improving the image of Australian beef and establishing a strong foothold in this market for the future.
Korea
• MLA doing a good job in Korea. ICA funding has worked well for exporters enabling good relationships to be built in Korean market.
• We have used the money in this market to develop a Home Brand in a major Supermarket Chain in Korea, Lotte Mart. They are using Tasmania, and HGP free claims to be able to differentiate our Aust. Beef from US beef and this is very important at this time that we have this now due to USA spending a lot of money on promoting their products in the market.
• The previous review team “promised” this levy payer that the additional levy would ensure performance KPI’s (including additional kgs at additional values) were put on MLA to show a return on this new investment. To my understanding this has not been produced and maybe are been claimed to have been achieved to maintain the levy status.
• The promotional efforts in Korea have definitely helped to improve demand for Australian beef. The image of Australian beef in terms of quality and safety has lifted dramatically over the past 3-4 years. This has been helped by the controversy over US beef but our marketing campaigns have successfully captured the opportunities presented by the US situation. With US beef now returning to Korea, Australian beef is in a much stronger position that it was before US beef was banned and we should hold a lot of the volume that we gained during the last 5 years. This market has

Review of the $1.50 Levy Increase for the FTF Program
Warwick Yates and Associates Pty Ltd, 2009
108
significant potential for expansion of overall beef consumption and good promotional activities will be needed to ensure that Australia captures it share of this growth.
• The programs in Korea have been developed over many years and whilst some may say they need to be revitalised I think that they work well and invite industry participation along the supply chain.
• Similar to Japan, Australia’s market share has increased substantially in the absence of USA. Australia’s profile as a reliable supplier of quality beef is established and I am confident that our competitiveness will hold our share well into the future.
USA
• ICA funding has worked well in USA in certain areas e.g. retail.
• This is still Australia’s largest beef market and with the projected increase in population and static or reducing domestic beef production this market still has good prospects for growth. There are also a growing number of market access issues developing in this market that need action to defend Australia’s access position.
• Developing market for grain fed but a lot of non trade barriers that restrict this trade. Hard call and think that money can be better spent elsewhere.
SE Asia / Chinas
• Have had little to do with MLA in these markets, but would suggest some more resources could be justified.
• There has been little new or innovative done in these markets over the past 3 years but they do offer significant potential going forward. It is difficult to see the benefit from increased expenditure but the increase is small compared to other markets.
• These markets are the future of the meat & livestock industry and more needs to be done.
• Similar to Japan, Australia’s market share has increased substantially in the absence of USA. Australia’s profile as a reliable supplier of quality beef is established and I am confident that our competitiveness will hold our share well into the future.
EU
• Participation in trade shows effective way of making contacts e.g. SIAL.
• The quotas and other restrictions in supplying the EU market with beef mean that there is little to be gained from promotional expenditure in this market.
• No real market access but the watching brief and market access activities are adequate at this time.
Russia
• Participation in trade shows has been an effective way of making contacts. PRODEXPO.
• This market offer significant potential and some worthwhile extra expenditure has been directed here over the last 2 years.
• Not sure given the duty disadvantages that Australia experienced this year. Need more work on access.

Review of the $1.50 Levy Increase for the FTF Program
Warwick Yates and Associates Pty Ltd, 2009
109
• Significant growth driven by market forces – The future is questionable due to market access issues which are currently being negotiated by the Australia Government.
What Elements of the FTF Program Could Have Been Improved?
Domestic
• Think program funding for beef should be considered outside MSA when looking at ICA type initiatives. Value adding concepts should given more funding opportunities to catch up with other proteins.
• More Flexibility from the beginning. This year is the first year that we were able to use one lump sum across all markets. All prior years it has been allocated per country. The markets change every year and even if you have marketing money for one country, it may not be enough for the other country. This caused problems of over budget and under budget in each country segment.
• Clear definition of investment areas that pertained to the $1.50 such that the outcomes could be measured.
• Perhaps some more grass roots campaigns rather than expensive media advertising.
• More effort put into promoting MSA to consumers to drag the technology through the major retail supermarkets. The overall expenditure could have been reduced to allocate more funds to developing export markets in SE Asia, Korea and Russia.
• More direct marketing activates with the Supermarkets remembering that they are hard customers to handle with a lot of negative history.
• It appears to me that the lamb advertising program and the beef advertising program are run by two different agencies as their design, effect and outcomes are very ,very different. In my opinion (and without seeing the KPIs) the beef campaign is not very successful. I understand that the bulk the promotional dollars are spent in main stream capital cities which will greatly enhance the likes of Coles and Woolworths. Whereas, the largest group of retailers “The butcher shops” are generally found in regional Australia and they don’t seem to be benefiting from the promotional spend.
Domestic Market Retailer and Foodservice Operators Comments
• More domestic support needed.
• Don’t worry about export markets – should focus on domestic markets.
• The marketing campaigns of MLA could’ve been done better for 10 years. The last 3 years have been a big improvement.
• More time and effort on point-of-sale material.
• Every time Entice comes out it only lasts about a week. Need to increase supply of magazines.
• Brochures on nutrition are very popular.
• More on goodness for kids. 85% of customers are women and they’re concerned about their kids.
• More thought into what goes out to retailers and what the customers get.
• Educating the retailers – need to upgrade their knowledge on a continuous basis. This takes money/resources as it’s not just sending them a book on what to do.
Review of the $1.50 Levy Increase for the FTF Program
Warwick Yates and Associates Pty Ltd, 2009
110
• RMNC – has worked ok but has lost its edge; need to relook at it and consider revamping.
• Every store has their own strategies and every area is different.
• They piggy back on the work of MLA.
• Complementary promotions.
• Will work better for some stores than others.
• Concentrate on too few people would be their main complaint.
• Red Meat National Council – only a portion of butchers – supposedly around 50% (may be an exaggeration).
• Some KPI’s haven’t been met.
• Increase in retail sales $25,000/year/shop, hasn’t happened.
• Only been met in one year.
• Haven’t been as effective as they indicated they would be.
• Dropped some data – changed the way the statistics are reported: $300m for first 2 years not recorded.
• MLA hasn’t listened to industry.
• Can never find out how much spent at big supermarkets.
• Retailers have increased market share.
• MLA had a quasi A, B, C categories – some have put their hand up and joined while others have been pursued by MLA. Fair bit of money spent on programs that don’t benefit all the industry. Too much spent on MSA, especially sheep and lamb – don’t support MSA for mutton particularly in foodservice – substitution too tempting.
• MLA not listening.
• Have been putting programs on TV of product in short supply.
• Timing not so good with other programs.
• Not enough consultation with industry before campaigns are implemented (only after).
• New strategy plan being put in place now. MLA hopefully will allow industry to have a bit more of a say in how the money gets spent. AMIC/MLA cross over in some projects. Should be concentrating on specific sectors. Regulations have become expensive and MLA and AMIC should work closer together. For a while too much information on nutrition, more than spent on marketing. Nutrition is important but balance not right.
• Would recommend that for future promotions.
• Generic promotions be continued but also increase efforts with ICA agreements.
• MSA grading system – MLA and butchers using it as a brand and it is not.
• As MLA moves forward they need to work more on branding with particular companies. In domestic market MLA should have a requirement of MSA compliance before entering into an ICA and then promote the brand. Irony is that the big supermarkets are the biggest retailers but neither use MSA. It should be a condition that ICA support only if MSA used. But this is a dilemma for MLA because both big supermarkets don’t use MSA.

Review of the $1.50 Levy Increase for the FTF Program
Warwick Yates and Associates Pty Ltd, 2009
111
• David Thomason is very good at marketing to food consumer – generic promotion, but need to get to more specific branding – ICA is the vehicle. Repeat what’s been happening on the export market.
• Must go through MSA system.
• Ensure eating quality.
• Assurance of food safety.
• Then use branding as the follow up.
• Individual firms can’t do marketing at the big picture level but can when their firm works with MLA.
• MSA graded product; and
• When the product is promoted under a brand.
• No major shortfalls in MLA approach. Only comparison is with APL, and MLA are far superior in terms of retail outcomes.
• Spends a lot of time in Japan and the Middle East and is always amazed how much work is being done in those markets by MLA.
• Very difficult to say what can be done better. MLA is dealing with both ends of the market; industry and consumers, and does a very good job in both areas.
• They come out with things that do make a difference; ideas for chefs, support for industry training, etc. Doing things that are positive for the industry so the impact is hard to notice from the outside.
Japan
• Very mature. Difficult to get positive results in normal supply situation. Not sure that funding effort is providing adequate return on investment.
• More flexibility from the beginning. This year is the first year that we were able to use one lump sum across all markets. All prior years it has been allocated per country. The markets change every year and even if you have marketing money for one country, it may not be enough for the other country. This caused problems of over budget and under budget in each country segment.
• Clear definition of investment areas that pertained to the $1.50 such that the outcomes could be measured.
• Move away from the tired Aussie Beef retail campaigns tied to seasonal events. Stop trying to convince Japanese consumers that all Australia beef is delicious.
• Very well designed programs – have left the mainstream promotional activity with the trade to the exporters under ICA program while focussing more on establishing brand recognition for Australian Beef with the consumers. Very effective and the results prove it.
Korea
• Happy with program.
• More Flexibility from the beginning. This year is the first year that we were able to use one lump sum across all markets. All prior years it has been allocated per country. The markets change every year and even if you have marketing money for one
Review of the $1.50 Levy Increase for the FTF Program
Warwick Yates and Associates Pty Ltd, 2009
112
country, it may not be enough for the other country. This caused problems of over budget and under budget in each country segment.
• Clear definition of investment areas that pertained to the $1.50 such that the outcomes could be measured.
• Korea has done a very good job with limited expenditure.
• Very well designed programs – have left the mainstream promotional activity with the trade to the exporters under ICA program while focussing more on establishing brand recognition for Australian beef with the consumers. Very effective and the results prove it.
USA
• Happy with program.
• More Flexibility from the beginning. This year is the first year that we were able to use one lump sum across all markets. All prior years it has been allocated per country. The markets change every year and even if you have marketing money for one country, it may not be enough for the other country. This caused problems of over budget and under budget in each country segment.
• Clear definition of investment areas that pertained to the $1.50 such that the outcomes could be measured.
• More expenditure on developing opportunities for chilled higher quality Australian beef.
SE Asia / Chinas
• Probably requires more research resources.
• More Flexibility from the beginning. This year is the first year that we were able to use one lump sum across all markets. All prior years it has been allocated per country. The markets change every year and even if you have marketing money for one country, it may not be enough for the other country. This caused problems of over budget and under budget in each country segment.
• Clear definition of investment areas that pertained to the $1.50 such that the outcomes could be measured.
• More expenditure in Indonesia and China to promote the safety of Australia processed beef.
• More money but, begin with an end in mind.
• This area lacks the technical skill-set required to develop the markets. Many of these resources work in their area alone, therefore it is very important they have the technical skills to assist the end users (and exports) grow demand.
EU
• Market could do with some more resources.
• More flexibility from the beginning. This year is the first year that we were able to use one lump sum across all markets. All prior years it has been allocated per country. The markets change every year and even if you have marketing money for one country, it may not be enough for the other country. This caused problems of over budget and under budget in each country segment.

Review of the $1.50 Levy Increase for the FTF Program
Warwick Yates and Associates Pty Ltd, 2009
113
Russia
• Russia opportunist market that will remain predominantly the domain of traders in the short term.
• More Flexibility from the beginning. This year is the first year that we were able to use one lump sum across all markets. All prior years it has been allocated per country. The markets change every year and even if you have marketing money for one country, it may not be enough for the other country. This caused problems of over budget and under budget in each country segment.
• More expenditure on promoting the safety of Australia processed beef and developing opportunities for chilled higher quality beef.
• Setting up an office in this market was a great initiative.

Review of the $1.50 Levy Increase for the FTF Program
Warwick Yates and Associates Pty Ltd, 2009
114
55.. IImmppaacctt oonn CCaattttllee PPrriicceess 55..11.. KKeeyy DDrriivveerrss ooff AAuussttrraalliiaann CCaattttllee PPrriicceess MLA as part of the FTF review process commissioned the Centre for International Economics (CIE) to undertake a review of the key drivers of Australian cattle prices between 2005 and 2008.The key drivers examined were:
• Australian dollar exchange rate;
• US re-entry to key markets;
• South American competition encompassing continued growth in Brazilian beef production, appreciation of the Brazilian Real, increased domestic beef consumption in Brazil;
• increased demand by emerging Asian nations and the Russian Federation;
• Australian grain prices particularly lower grain production of higher grain costs for feedlots; and
• increasing US prices in US dollar terms. CIE used the Global Meat Industries (GMI) Model to evaluate the impact of each of the key drivers on the total price outcome. Australian Dollar Exchange Rate Australian meat prices are set in international markets. Accordingly, changes in the value of the Australia dollar can influence the price of Australian beef. Between 2004 and 2008 the Australia dollar appreciated from around $US0.74 to $US0.87. Strong appreciation of the Australian dollar, particularly compared to the US dollar, Japanese Yen and Korean Won, is expected to place downward pressure on Australian cattle prices. US Re-Entry into Key Markets Following the outbreak of BSE in 2003, US exports of beef and veal were excluded from Japan and Korea. While Australia retained access to these markets, import quantities have decreased over time. US re-entry into Korean and Japanese markets has increased competition and resulted in a decrease in Australian cattle prices. Australia has lost market share in the Japanese and Korean market to US imports particularly in the markets for cheap cuts (e.g. brisket, blade, chuck roll and short rib). South American Competition Increasing cattle production in South America since 2000, particularly in Brazil and to a lesser extent Argentina and Uruguay, has led to an increase in exports. The expected downward pressure on Australian cattle prices as a result of an increase in exports from South America has been offset by appreciation of the Brazilian Real and strong growth in domestic consumption in Brazil. Beef and veal exports from Brazil into the EU are restricted as a result of food safety issues. Import Demand from Emerging Countries Increased import demand by countries such as Russia and emerging Asian countries is expected to increase the price of Australian cattle.

Review of the $1.50 Levy Increase for the FTF Program
Warwick Yates and Associates Pty Ltd, 2009
115
Australian Grain Prices Grain is a significant input to Australian on-farm beef production, particularly in the feedlot sector. Changes in grain prices can directly impact the profitability of beef production. Number of slaughterings and average slaughter weights is maintained during adverse seasonal conditions, such as between 2005 and 2008, through grain finishing and supplementary feeding. Australian grain prices increased steadily between mid-2006 and the last half of 2008. As the price of grain increases and feed costs increase, the price of feeder cattle falls. US Cattle Prices Australian and US cattle prices are directly linked through common export markets and Australian exports of frozen product to the US manufacturing trade. Prices are also indirectly linked through common inputs (e.g. grain) and the price of substitute products. Increasing US cattle prices is expected to result in higher prices for Australian cattle. Outcomes and Conclusions The impact of each of the key drivers on Australian cattle prices are illustrated in Figure 36. These impacts were evaluated by CIE using the GMI model. The appreciation of the Australian dollar compared to currencies of key trading partners over the period 2004 to 2008 had the most significant influence on Australian cattle prices. If the currency appreciation had not occurred, that is if exchange rates remained at 2004 levels, the grass fed cattle price cattle price would have been 16.6 per cent higher and the grain fed price would have been 16.5 per cent higher. Based on the CIE analysis, appreciation of the Australian dollar had a negative influence on Australian cattle prices. Of the key drivers subject to analysis, the US re-entry into Japanese and Korean markets was the second most influential (when considering effects of the price of grain-fed cattle). If market conditions in Japan and Korea remained as they were in 2004 (i.e. no re-entry), the price for grass fed cattle would have been 2 per cent higher and the price for grain fed cattle would have been 7 per cent higher. The US re-entry is estimated to have had a negative influence on Australian cattle prices. Growing import demand from emerging countries and higher US cattle prices have both provided positive pressure on saleyard prices since 2004. In 2008 the combined effect of the six key drivers subject to analysis was to depress prices. Without the combined impact of the six key drivers:
• the price for Australian grain fed cattle would have been 10 per cent higher; and
• the price for Australian grass fed cattle would have been 11 per cent higher (Figure 36).

Review of the $1.50 Levy Increase for the FTF Program
Warwick Yates and Associates Pty Ltd, 2009
116
Figure 36 Impact on Australian cattle prices of key drivers, 2008
-10.0
-5.0
0.0
5.0
10.0
15.0
20.0
Aus tralianexchange
rate
USexclus ion
from Japanand Korea
SouthAm erican
com petition
Dem andsby
em ergingm arkets
Aus traliangrain prices
US cattleprices
Com binedeffect
Impa
ct o
n A
ustra
lian
Cat
tle P
rices
(%)
Grass Fed
Grain Fed
Source: CIE (2009) 55..22.. IImmppaacctt ooff tthhee $$11..5500 LLeevvyy IInnccrreeaassee oonn CCaattttllee PPrriicceess
The impact of the $1.50 levy increase on market demand in each of the major market for Australian beef is considered in Section 5.2.1, followed by an analysis of how these demand shifts have, in turn, impacted cattle prices in Australia (Section 5.2.2). 5.2.1. Impact on Market Demand The estimates of shifts in market demand provided in this section are based on consideration of the changes in real market sales before and after the introduction of the $1.50 levy and the consultations undertaken, observations made and conclusions drawn in preparing this levy impact study. The changes volume and value in each market in each of the main markets for Australian beef are shown in Table 43. Table 43 Volume and value of Australian domestic and export beef and live cattle exports a
Av 03-05 Av 06-08 Change Av 03-05 Av 06-08 ChangeDomestic 720 748 4% 6,475 6,808 5%Japan 355 399 12% 2,116 2,146 1%Korea 95 160 69% 463 801 73%US 367 286 -22% 1,559 1,161 -26%Other export 142 142 0% 670 686 2%Live export ('000 hd) 771 675 -12% 582 497 -15%
Volume (kt) Value ($M)
a Years are FY (July – June); all monetary values in 2008 dollars. Source: MLA and EconSearch analysis

Review of the $1.50 Levy Increase for the FTF Program
Warwick Yates and Associates Pty Ltd, 2009
117
Domestic Market In 2005-06 and 2006-07 the MLA consumer expenditure target was broadly met (more through price than volume effects), although the additional spending from the levy increase would have had little impact in 2005-06. Expenditure increased again in 2007-08 but at a level significantly less than the target. As noted earlier in the report, the meat sector is a highly competitive segment of the food industry and one where considerable marketing effort is required just to maintain market position and market share. The setting of quantitative growth targets implies that volumes and market share would be maintained without the marketing effort. However, in a mature market with fierce competition and low growth potential, as the domestic meat market could be characterised, it is likely that little or poor promotion would result in loss of both sales volume and market share. Some processors and exporters see opportunities in overseas markets and feel diversion of marketing dollars into these potentially high growth markets is warranted. However, despite some promotions falling short of expectations, most of MLA’s domestic marketing efforts appear to have been effective and have received strong support from the retail and foodservice sectors. Market share has been maintained, aggregate consumer expenditure has increased, albeit at a rate lower than hoped for, and the beef industry has therefore benefited significantly from the enhanced marketing effort. Conservative estimate of the impact of MLA increased ($1.50) marketing efforts on aggregate market demand: 0.75%/annum (range 0.5% to 1.0%). Japanese Market The Japanese market has been a prime export market for Australia. Despite the recent absence of the US from this market and Australia supplying the majority of the shortfall in US tonnage, the market has not expanded, with consumption remaining stable. Some would argue that the market is mature and marketing funds should be diverted to emerging markets. However, Australia has a preferred supplier image in the Japanese market, a position that should not be easily surrendered having gained the majority market share of the trade from US beef suppliers. The additional market share alone is worth over $500M to the Australian beef industry. The US is aggressively trying to regain their lost market share. Over the last two years Australia has made ground in the foodservice sector with Aussie Beef a preferred choice among trade and foodservice consumers. This effort has to some extent been thwarted by the high AUD. Despite a price impediment, key supermarket chains and foodservice operators have developed a loyalty for Australian product which augurs well for maintenance of the current position for the next 2-3 years. The ICA program has brought Australian exporters into close contact with Japanese importers and enabled effective development of exporter branded product into Japan supply chains and marketing channels. The FTF expenditure of an additional $7.4M to hold market share with approximately 394,000 tonnes has achieved that objective. The FTF activities have positioned Australia well to compete with the re-entry of the US into the Japanese market and to take a reasonable share of the forecast 200,000 tonne market growth in coming years.
• 92% of Japanese trade and end users believe MLA activities effective.
• Strong consumer preference and loyalty towards Aussie Beef has been generated amongst consumers and the trade.

Review of the $1.50 Levy Increase for the FTF Program
Warwick Yates and Associates Pty Ltd, 2009
118
• Consumer consideration to purchase Aussie Beef has increased from 66% to 84% in the past five years.
• Despite the return of US beef to the market in 2006, Australia has maintained a larger market share than expected.
• The Australian beef industry is now well positioned to defend market share in the face of increasing competition.
Conservative estimate of the impact of MLA increased ($1.50) marketing efforts on aggregate Japanese market demand: 1.5%/ annum (range 1.0% to 2.0%). Korea The FTF program has been effective in capturing and maintaining growth of imported beef market share in the Korean market in the absence of US beef in this market. Tonnage and market share have both increased. The FTF additional funds have enabled MLA and the industry players through ICA agreements to build improved relationships in this market to the point where Australia is the preferred supplier. The dollar spend in this market has not been large but very targeted and effective in placing Australian beef in the Hypermarkets and Department stores. The Hojo Chungjung Woo quality mark has been effective in differentiating Australian beef allied with in store sampling. Trade visits to Australia and mass media marketing has gained consumer support for Australian beef among adult and young consumers. While Australia will lose market share as the US returns to the market this should not be seen as a negative in that the negative impacts of US beef exclusion from this market has been dampened demand overall. The US re-entry will enable the market to continue to grow and Australia will have a reduced share of growing Korean market pie in the future. The FTF program has effectively positioned Australian beef in the Korean market despite the impending return of US beef and is positioned well to take an effective share of future market growth Conservative estimate of the impact of MLA increased ($1.50) marketing efforts on aggregate Korean market demand: 2.5%/ annum (range 1.0% to 5.0%) North American Market During 2007-08 the greatest hurdle to building existing programs or developing new programs was the availability of product. Although 2006-07 was a high for chilled beef exports, the limited supply of product last year was a source of frustration for customers. The MLA business development program is focussed on increasing the volume and/or value of beef entering the North America market. With the support of MLA, several Australian beef companies have worked hard to grow their business in the United States by expanding existing branded beef programs or have worked to establish new branded programs. These actions led to the record year for Australian chilled beef exports to the United States in 2006-07.

Review of the $1.50 Levy Increase for the FTF Program
Warwick Yates and Associates Pty Ltd, 2009
119
Although Australian beef exports to the US have declined since 2004-05, Australia’s market share of the US import market has risen slightly, increasing from 27.3% in 2004-05 to 28.4% in 2007-08. While Australia has lost volume in the US market for reasons unrelated to marketing effort, the focus in the FTF program on developing ICAs should help the Australian beef industry capitalise on increasing future volumes, particularly if US beef exports increase and the Australian dollar does not return to the highs of 2007-08. Conservative estimate of the impact of MLA increased ($1.50) marketing efforts on aggregate market demand: 0.5%/ annum (range 0.25% - 0.75%). Other Markets Europe: The on-going presence of the MLA in Europe and the continuation of trade show participation to showcase Australian beef, using selected Australian events to highlight Australian beef quality attributes provides a launching pad for exporters. Additionally, positioning Australian beef as premium product in retail and increasing awareness of product attributes (shelf life, reliable and consistent specification, eating quality and food safety record) have all assisted in making the most of existing quota and any above quota opportunities that may arise. Russia: It is a vast country and there is a lack of knowledge by customers on the range of beef products available and how to order meat from Australia. MLA and industry’s knowledge of the growing market needs boosting, whilst education and training of local end users is essential if current gains in the market are to be held and expanded. Despite the future uncertainty of market conditions, the diversion of resources into the Russian market seems to have been well-founded with potentially high payoffs in the future. Middle East: The response by MLA by way of significantly increased activity and associated budget reflects the nature of the opportunity that has presenting itself and MLA’s willingness to adjust to changing circumstances. Expenditure of increased levy funds in this region has been much greater than originally proposed in the FTF document but it appears to be a well-founded and potentially high return investment. SE Asia and the Chinas: The FTF program operated with a focus on ICA type programs has been effective in building demand to these markets. The flexibility shown in the FTF operating plan program approach has to be commended in seeking the best return for the marketing dollar spend in these markets. The reality is that these markets will continue to be volatile but Australia’s targeted focus on Indonesia and the Chinas will continue to provide markets for Australian export beef. Conservative estimate of the impact of MLA increased ($1.50) marketing efforts on aggregate “Other” market demand: 1.0%/ annum (range 0.75% to 1.5%). Live Exports By any measure the live export program has been highly effective in achieving the strategic objective of securing Australia’s competitive position in the Indonesian live export cattle trade, the Indonesian feedlot sector and the Indonesian wet market and supermarket trade from competition from alternative suppliers.
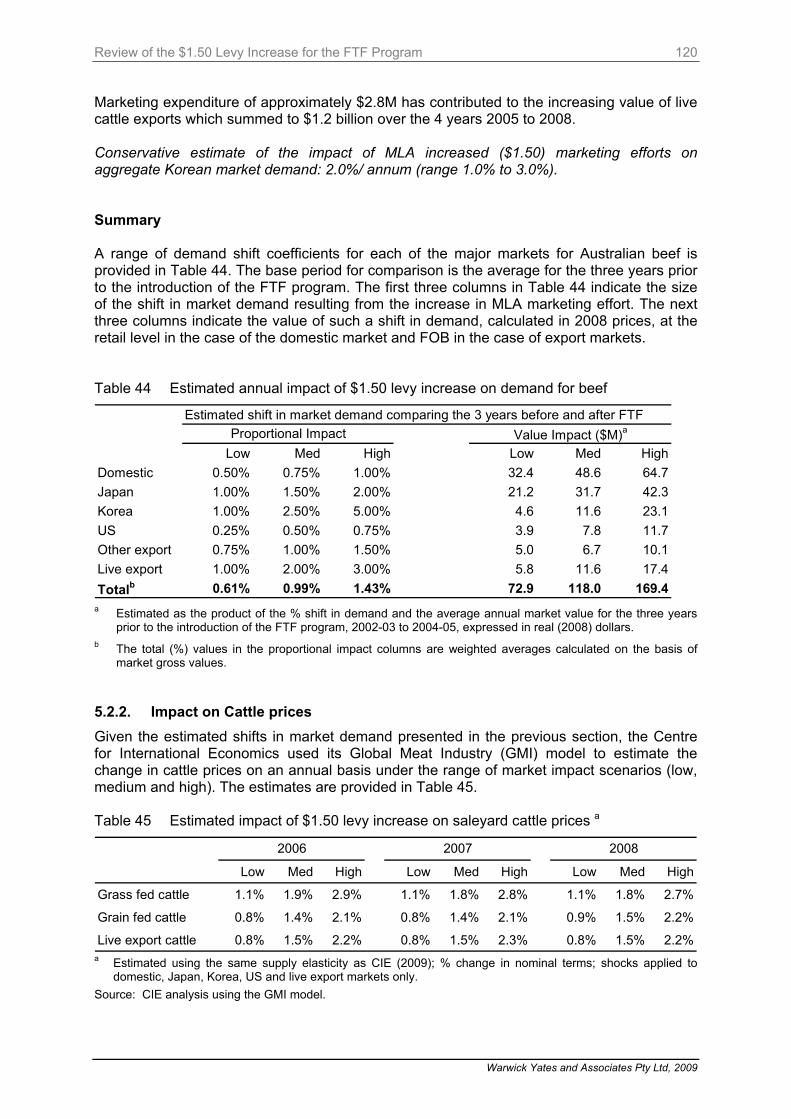
Review of the $1.50 Levy Increase for the FTF Program
Warwick Yates and Associates Pty Ltd, 2009
120
Marketing expenditure of approximately $2.8M has contributed to the increasing value of live cattle exports which summed to $1.2 billion over the 4 years 2005 to 2008. Conservative estimate of the impact of MLA increased ($1.50) marketing efforts on aggregate Korean market demand: 2.0%/ annum (range 1.0% to 3.0%). Summary A range of demand shift coefficients for each of the major markets for Australian beef is provided in Table 44. The base period for comparison is the average for the three years prior to the introduction of the FTF program. The first three columns in Table 44 indicate the size of the shift in market demand resulting from the increase in MLA marketing effort. The next three columns indicate the value of such a shift in demand, calculated in 2008 prices, at the retail level in the case of the domestic market and FOB in the case of export markets. Table 44 Estimated annual impact of $1.50 levy increase on demand for beef
Estimated shift in market demand comparing the 3 years before and after FTF
Low Med High Low Med HighDomestic 0.50% 0.75% 1.00% 32.4 48.6 64.7Japan 1.00% 1.50% 2.00% 21.2 31.7 42.3Korea 1.00% 2.50% 5.00% 4.6 11.6 23.1US 0.25% 0.50% 0.75% 3.9 7.8 11.7Other export 0.75% 1.00% 1.50% 5.0 6.7 10.1Live export 1.00% 2.00% 3.00% 5.8 11.6 17.4Totalb 0.61% 0.99% 1.43% 72.9 118.0 169.4
Value Impact ($M)aProportional Impact
a Estimated as the product of the % shift in demand and the average annual market value for the three years
prior to the introduction of the FTF program, 2002-03 to 2004-05, expressed in real (2008) dollars. b The total (%) values in the proportional impact columns are weighted averages calculated on the basis of
market gross values. 5.2.2. Impact on Cattle prices Given the estimated shifts in market demand presented in the previous section, the Centre for International Economics used its Global Meat Industry (GMI) model to estimate the change in cattle prices on an annual basis under the range of market impact scenarios (low, medium and high). The estimates are provided in Table 45. Table 45 Estimated impact of $1.50 levy increase on saleyard cattle prices a
Low Med High Low Med High Low Med High
Grass fed cattle 1.1% 1.9% 2.9% 1.1% 1.8% 2.8% 1.1% 1.8% 2.7%
Grain fed cattle 0.8% 1.4% 2.1% 0.8% 1.4% 2.1% 0.9% 1.5% 2.2%
Live export cattle 0.8% 1.5% 2.2% 0.8% 1.5% 2.3% 0.8% 1.5% 2.2%
2006 2007 2008
a Estimated using the same supply elasticity as CIE (2009); % change in nominal terms; shocks applied to
domestic, Japan, Korea, US and live export markets only. Source: CIE analysis using the GMI model.

Review of the $1.50 Levy Increase for the FTF Program
Warwick Yates and Associates Pty Ltd, 2009
121
The price change estimates in Table 45 have a straightforward interpretation. For example, in 2008 the medium impact marketing scenario indicates that saleyard prices for grass fed cattle were 1.8% higher than they would have otherwise been without the $1.50 increase in the marketing levy. The set of price changes detailed in Table 45 were applied to estimates of gross industry returns (farm gate value) for the grass fed, grain fed and live export sectors. This enabled the industry level impacts of the price increases to be estimated (Table 46). Using the same example as above, the medium impact marketing scenario indicates that in 2008 the gross value of grass fed cattle was $80M higher than would have otherwise been the case without the $1.50 increase in the marketing levy. For grain fed cattle the corresponding estimate was $25M and for live export cattle, $7M. The total impact was estimated to be $112M in 2008 under the medium impact scenario (range of $67M to $171M). The beef industry investment of $50.2 million in additional marketing activities across the Funding for the Future Program life to date has returned an estimated total of $275M to the industry (medium estimate, farm gate value). Table 46 Estimated impact of $1.50 levy increase on gross farm gate returns ($M)
Low Med High Low Med High Low Med High
Grass fed cattle 23 38 58 45 75 116 48 80 123
Grain fed cattle 9 14 21 17 28 43 15 25 38
Live export cattle 1 2 4 3 6 9 4 7 10
Total 33 54 83 65 109 168 67 112 171
2006a 2007 2008
a The estimated price change would not have taken effect until the second half of 2006 when the increased
marketing activity (funded by the $1.50 levy increase) commenced.

Review of the $1.50 Levy Increase for the FTF Program
Warwick Yates and Associates Pty Ltd, 2009
122
66.. CCoonncclluussiioonnss The FTF program was initiated to counteract an expected increase of 335,000 tonnes in beef production in Australia to 2009, build a competitive position in North Asian and other markets while North America was precluded because of BSE and combat a perceived threat from South American countries such as Brazil and Uruguay. The FTF program was to be funded by a $1.50 increase in the transaction levy from $3.50 to $5.00 which was expected to raise an additional $21.3M annually. These funds were to be spent on an increased marketing effort in the Australian domestic and export markets. The terms of reference for this review asked for a response to the following four questions. (A) What happened to income for the industry and MLA since the introduction of the
$1.50?
• The number of cattle transactions was expected to increase from 13.5 to 14.5 million per annum to raise the required levy funds for the program.
• The number of transactions was influenced by increased grass fed transactions because of drought and decreased transactions for grain fed cattle primarily because of high feed grain and feeder steer prices which reduced feedlot capacity utilisation. Also, live export transaction numbers increased because of drought impacts in Australia and significantly increased demand from Indonesia.
• The FTF program sought to raise an additional $21.3M per annum by a $1.50 increase in the previous cattle transaction levy from $3.50 to $5.00 per head. The marketing component of the levy was increased from $2.16 to $3.66 for grassfed cattle and from $1.51 to $3.07 for grain fed cattle. Over the program period to date (2005-06 to 2007-08) $50.235M has been raised for the FTF program.
• FTF funds were allocated across key domestic and export market areas as set out in the Funding for the Future document and resultant annual operating plans produced by MLA. Actual expenditure tracked very closely to target funding over the first three years of the FTF program, 2005-06 to 2007-08. However in 2008-09 a $5.3M shortfall is forecast due to the ongoing effect of drought conditions on transaction numbers.
• In all cases the expenditure of FTF funds was submitted to industry advisory committees for approval before expenditure occurred to ensure the appropriate level of governance and transparency of industry levy payer funds.
• Having created a competitive position, particularly in markets such as South Korea, it makes little sense to reduce marketing expenditure in these markets given the current and expected ongoing volatility in a highly competitive global meat marketing environment. Providing advice on increasing, maintaining or reducing the transaction levy funds in the future is not within the terms of reference of this report. However the following observations can be made:
o marketing levy funds are not CPI adjusted;
o real marketing expenditure is therefore declining over time;
o projects requiring significant ongoing funding such as NLIS have lost their R&D funding status and now draw on marketing funds; and
o the volatility and unpredictability of the AUD/USD exchange rate is likely to continue in the short term at least.

Review of the $1.50 Levy Increase for the FTF Program
Warwick Yates and Associates Pty Ltd, 2009
123
(B) Have the programs referred to in the ‘Funding for the Future’ report been implemented and were there variations and why?
• Generally the programs referred to in the Funding for the Future Report were implemented. There were annual programs reviews and adjustment made to operating plans and budgets in light of prevailing market conditions, program performance and the desire to achieve the best possible market return for the FTF funds. For instance, the program was downsized in Japan and funds moved to the other markets in light of subdued demand because of the BSE fear knock on effect while latent market growth in the Chinas was realised.
• Another significant variation was the need to accommodate previous R&D Program funded projects, i.e. MSA and NLIS that were incorporated in the marketing budget because they were no longer eligible for Federal Government matching R&D funds.
• The International Collaborative Agreement (ICA) program as originally envisaged was incorporated into each of the target geographic markets. This program has been redesigned on a global basis.
(C) How have the market assumptions varied from the actuals and what are the implications?
• On the beef supply side: The base assumption of increased domestic beef production of 335,000 tonnes undershot by 213,800 tonnes due primarily to drought and decreased feedlot capacity utilisation.
• On the market side: Market assumptions varied on a market-by-market basis because of:
o the ongoing knock on effect of consumer fears about BSE, especially in North Asian markets ;
o the significant emergence of the Russian market, market access issues and political shut down of that market in 2008;
o the continued growth of the Chinas market ;
o the impact of a surging Australian dollar in 2007 and 2008;
o high grain and feeder steer prices impacting on the supply of grain fed beef to domestic and export markets in 2007 and 2008; and
o the need to modify programs with the re-entry of the US, particularly in the Japanese and Korea markets.
(D) Has the additional beef marketing levy generated benefits to the industry?
• Despite the over-estimation of future beef production, the implementation of the FTF program has enabled the Australian beef industry to accommodate an increased level of volatility in world beef markets and to stimulate demand, especially from importers in key Japanese and Korean markets.
• The FTF funding has enhanced the evolution of the Australian beef industry from the status of commodity beef marketer under a $2.16 per head marketing levy regime to that of a more effective niche marketer in the global market with a $3.66 marketing levy.
• As long as the additional marketing funds are well targeted and their application is cost effective, $5 per head is a relatively cheap marketing (and R&D) cost. It enables Australia to position itself for a significant share of beef consumption increases in North Asian and SE Asian markets as economic recovery occurs. To reduce the beef

Review of the $1.50 Levy Increase for the FTF Program
Warwick Yates and Associates Pty Ltd, 2009
124
marketing levy to pre FTF levels would simply “gift” customer loyalty, market share and subsequent export market volumes to North American and South American competitors in Pacific Rim markets. It is possible a similar impact would be felt over time in the domestic market with loss of market share to competitor proteins.
• The global beef industry is undergoing significant change with increased consolidation and rationalisation across the production, processing and retail sectors. This trend presents significant challenges for MLA as the major global businesses have well developed marketing divisions and market intelligence. MLA has addressed the issue by use of the International Collaborative Agreements (ICA) program but needs to strategically determine how its operations can effectively complement the marketing activities of major exporters to mutual benefit.
• The Community Benefits and Industry Integrity program has positioned Australian beef producers as credible in the eyes of domestic consumers and the live export industry for continuing to counter the claims of animal rights activist with facts about the live export industry. As community focus intensifies on the management of natural resources and concerns grow for animal welfare, it will be increasingly important not only to address these issues but also to inform the public of the broader story of integrity behind the beef industry.
• Overall, the Funding for the Future Program has been a success in terms of reaching most of its targets in domestic and export markets. Allocation of levy funds to accelerate marketing programs in established and new, emerging markets has placed Australia in a strong competitive position to weather the return of the US to key Pacific Rim markets and to fight potential competitive threats from other beef exporting countries.
• Modelling the estimated changes in consumer demand resulting from the increased marketing activity showed that in 2008, under a medium impact scenario, saleyard prices for grass fed cattle increased by 1.8%, while prices for grain fed and live export cattle were 1.5% higher than they would have otherwise been without the $1.50 increase in the marketing levy. Similar price impacts were estimated for 2006 and 2007.
• These positive price effects, attributable to the increased marketing activity in all major markets, realised an industry level return of approximately $112M (low to high range of $67M to $170M) in 2008. This impact was comprised of an estimated $80M increase in gross income to the grass fed sector, $25M to the grain fed sector and $7M to producers of live export cattle.
• The beef industry investment of $50.2 million in additional marketing activities across the Funding for the Future Program life to date has returned an estimated total of $275M to the industry (medium estimate, farm gate value).

Review of the $1.50 Levy Increase for the FTF Program
Warwick Yates and Associates Pty Ltd, 2009
125
RReeffeerreenncceess
Beef Industry Funding Steering Committee (BIFSC) 2005a, Funding For the Future, Meat & Livestock Australia Limited, April.
Beef Industry Funding Steering Committee (BIFSC) 2005b, Funding For the Future: Summary Report, Meat & Livestock Australia Limited, April.
Centre for International Economics (CIE) 2009, Drivers of Australian Cattle Prices, draft report prepared for Meat and Livestock Australia, January.
McRae, T., Jones, K., and Weeks P. 2009, Australian Cattle and Sheep Industry Projections, 2009, Meat & Livestock Australia, January.
MLA 2008, Statistical Review July 2007 – June 2008, Meat & Livestock Australia Limited, September.

Review of the $1.50 Levy Increase for the FTF Program
Warwick Yates and Associates Pty Ltd, 2009
126
AAttttaacchhmmeenntt –– CCoonnssuullttaattiioonn LLiisstt
Person Position Organisation Don Heatley Chairman MLA David Palmer Managing Director MLA Susan Mills Manager, Special
Projects MLA
David Thomason General Manager, Marketing
MLA
Scott Hansen General Manager, Corporate Communications and Livestock Export
MLA
Peter Barnard International Markets and Economic Services
MLA
Peter Weeks Manager, Market Information and Analysis
MLA
Tim Kelf Manager, International Market Projects
MLA
Michelle Gorman Regional Manager , Americas
MLA
David Jones Regional Manager Europe/Russia
MLA
Laurie Robinson General Manager , Corporate Services
MLA
Bradley Teys Managing Director Teys Brothers David Foote Chief Executive Australian Country
Choice Lachie Hart Managing Director Stockyard Beef Stephen Kelly Chief Executive Nippon Meat Packers
Australia Mike Jackson Chief Executive Stanbroke Meat Malcolm Foster Chief Executive Rangers Valley Paul Troja Chief Executive Rockdale Beef Andrew McPherson Chief Executive Cargill Australia Graham Sherriff General Manager
Marketing Cargill Australia
Peter Greenham Chief Executive Greenhams Darrell France Chief Executive Tradar Meats Pat Dempsey General Manager AACO Stuart Kenny General Manager AACO Michael Pointer Chief Executive CAAB Tony Munns Chief Executive Kilcoy Pastoral Company Iain Mars Chief Executive JBS Swift Australia Brendan Watts Principal Owner Brendan’s Quality Meats
Pty Ltd David Barnes General Manager Bush’s Meats Frank Russo Managing Director Rainbow The Well Pty Ltd
Rainbow Chadstone Pty Ltd
Kerry Melrose National Retail Chairman AMIC Phil Morley Chief Executive Officer CAAB

Review of the $1.50 Levy Increase for the FTF Program
Warwick Yates and Associates Pty Ltd, 2009
127
Roger Steel Senior Business Manager Meat Department
Woolworths
Walter Wagner Executive General Manager Food & Beverage
Crown Casino
Japan
Person Position Organisation Samantha Jamieson Regional Manager MLA Travers Nicholas Deputy Regional
Manager MLA
Katsuaki Sato Senior Manager Food Service
MLA
Minoru Hayashi Director Meat Division Seiyu Satoshi Maeda Buyer, Meat Division Seiyu Toshifumi Aoki Meat Buyer Seiyu Nobushi Sasaki Manager Imported Beef
Marketing & Planning Prima Ham
Kuniji Uki Manager Meat Purchasing
Prima Meat Packers
Tetsuya Matsui Senior Managing Director Prima Meat Packers Masaki Odagiri General Manager Prima Meat Packers Masaki Kanazawa Grocery Chain Manager Prima Meat Packers Yoshiyuki Okuzaki Manager Imported beef Prima Meat Packers Motoaki Ishikawa Manager , Meat Group Aeon Retail Group Hoshino Maruetsu Hitoshi Takata Meat Group Aeon Retail Group Osamu Nakano Director Aeon Global
Merchandising Akira Miyamura General manager Tasmania Feedlot Pty Ltd Akira Kuroda Chief Merchandiser The Daiei Inc Kenichi Ogawa Divisional Manager The Maruetsu Inc Akira Kenmotsu Livestock Products
Manager Aeon Global Merchandising
Nobu Tanaka President School Dietician Conference of Japan
Andreas Trauttmansdorff General Manager Westin Hotel Frank Bochmann Director Food &
Beverage Westin Hotel
Masaru Iwasaki Director Corp[rate Relations
McDonalds
Akemi Kawaguchi Manager Corporate Relations
McDonalds
Kayo Akazawa Manager, Marketing McDonalds Roger Lienhard General Manager Grand Hyatt Josef Budde Executive Chef Grand Hyatt Shaun Keenan Executive Sous Chef Grand Hyatt William Hall Japan Head Synovate Melanie Brock Managing Director Agenda Hiroki Taniguchi Assistant General
Manager Nippon Meat Packers

Review of the $1.50 Levy Increase for the FTF Program
Warwick Yates and Associates Pty Ltd, 2009
128
Kazushi Ota Executive Officer Nippon Meat Packers M Kato Nippon Meat Packers Yoshiki Funahashi General Manager Naka Nippon Food Hidetaka Oohira President Kanto Nippon Food Kenichi Tamagaki Executive Officer
Overseas Strategy Nippon Meat Packers
Tetsuya Hiratani General Manager Zensho Group Toshiyuki Hara Managing Executive
Director Zensho Group
Akinobu Saito Executive Officer Itoham Foods Inc Hidetaka Norike Manager Itoham Foods Inc Mikiya Ishihara Genera Manager Itoham foods Inc Kouichi Ito Executive Officer Itoham Foods Inc Dr Masahiko Seagusa General manager Itoham Foods Inc
Korea
Name Position Company Glen Feist Regional Manager MLA Ku Lee Manager Food
service& Media MLA
Charlie Ko Manager Trade Development
MLA
Tae-Young An Assistant Manager Retail
MLA
Hee Yeun Kim Assistant Food Service & Media
MLA
Didier Beltoise General Manager Intercontinental Hotel
Paul Schenk Director of Kitchens
Intercontinental Hotel
Eric Pellen Executive Sous Chef
Intercontinental Hotel
Nick Flynn Executive Sous Chef
Intercontinental Hotel