independent amplification of two gene clusters on...
TRANSCRIPT
[CANCER RESEARCH 61, 8263–8273, November 15, 2001]
Independent Amplification of Two Gene Clusters on Chromosome 4 in RatEndometrial Cancer: Identification and Molecular Characterization1
Anna Walentinsson,2 Khalil Helou, Ville Wallenius, Hans J. Hedrich, Claude Szpirer, and Goran LevanDepartment of Cell and Molecular Biology–Genetics, Goteborg University, SE-40530 Gothenburg, Sweden [A. W., K. H., G. L.]; Research Centre for Endocrinology andMetabolism, Department of Internal Medicine, Sahlgrenska University Hospital, Goteborg University, S-413 45 Gothenburg, Sweden [V. W.]; Laboratory of Animal Science,Medizinische Hochschule, DE-30623 Hannover, Germany [H. J. H.]; and IBMM, Universite Libre de Bruxelles, BE-6041 Gosselies, Belgium [C. S.]
ABSTRACT
The BDII rat is genetically predisposed to hormone-dependent endo-metrial adenocarcinoma and was used to model human cancer. Tumorsarising spontaneously in strain crosses involving BDII rats were analyzedby means of comparative genome hybridization. The most common aber-ration was amplification of the proximal region of rat chromosome 4,centered around bands q12-q22. The copy numbers of 15 cancer-relatedgenes from the region were examined in tissue cultures of 11 endometrialcarcinomas (10 endometrial adenocarcinomas and 1 endometrial squa-mous cell carcinoma) and one peritoneal mesothelioma. Amplification inrat chromosome 4 was detected in six tumors (50%), five of which carriedtwo separate amplified regions, situated at 4q12-q13 and 4q21-q22, inter-rupted by a nonamplified segment at 4q13-q21.1. The genes Cdk6 (cyclin-dependent kinase 6) and Met (hepatocyte growth factor receptor) werelocated in the core of each amplified region and were amplified mostrecurrently and at the highest levels among the genes tested. Using fluo-rescence in situ hybridization on tumor metaphases, it was observed thatthe amplified Cdk6 and Met sequences were situated on typical homoge-neously staining regions (HSRs). In three tumors, both genes were ampli-fied in the same HSRs, whereas in two tumors, the amplified sequences ofeach gene were situated in separate HSRs. In addition, Cdk6 and Metamplification was consistently associated with a corresponding increase ingene expression, suggesting that the two genes might represent the targetsfor the amplifications. In the sixth tumor, which carried amplified se-quences of Met but not of Cdk6, coexpression of Met and the normallysilent hepatocyte growth factor gene (Hgf; the ligand of Met) was ob-served. This finding suggests that an autocrine signaling circuit might beoperating in this particular tumor. Taken together, our findings suggestthat up-regulation of Cdk6 and/or Met may contribute to the developmentof endometrial cancers in the BDII rat.
INTRODUCTION
Lines of evidence suggest that the development of neoplastic dis-ease requires multiple genetic lesions, ranging from single nucleotidealterations to gross chromosomal changes, occurring sequentially in acell lineage (1). DNA amplification represents one major molecularpathway that is thought to play a pivotal role in tumor development,in view of the fact that it provides a mechanism by which tumor cellscan trigger enhanced expression of genes whose products are involvedin cell proliferation (2). In human cancers, the number of reports ongene amplification, often in relation to progressive tumor growth andpoor prognosis, is continually growing (3–5). In the majority of casesin which the amplified chromosome region has been identified andcharacterized, a proto-oncogene appears to be the target on whichselection acts (4). In some tumors, the architecture of the amplified
sequences has been found to be quite simple and consisting of con-tinuous repeats of not much more than the target gene (6, 7). However,a more common situation is that the amplified sequences are struc-turally rather complex and sometimes also internally rearranged,encompassing two or more coamplified genes, including the targetgene (8, 9). Hence, the prevalence of gene amplification in diversetumor types, as well as its biological and clinical significance inneoplastic development, makes amplified chromosomal regions inter-esting targets for detailed genetic analysis. Identification and charac-terization of the amplified genes can provide valuable insights into thepathogenesis of cancer and may also yield molecular markers for theevaluation of prognosis and therapy.
Carcinoma of the uterine corpus, also known as endometrial carci-noma, is the most frequently diagnosed malignancy of the femalereproductive tract and the fourth most common cancer among women(10).3 Still, the molecular genetic features of this tumor have yet to bedescribed in significant detail. The inbred BDII rat strain is geneticallyprone to spontaneous hormone-dependent EAC4 (11) and may serveas a genetic model system of this tumor type. In a series of uterinetumors (mostly EACs) developed in F1, F2, and backcross progenyfrom crosses between BDII rats and rats of either of two nonsuscep-tible strains (BN and SPRD), a previous cytogenetic investigationdisclosed repeatedly occurring manifestations of gene amplification inthe form of HSRs. By using CGH, we could conclude that mostcommonly, the amplified sequences originated from a region in prox-imal RNO4, centered around bands q12-q22 (12). Similar amplifica-tion in the proximal part of RNO4 has been detected previously in asubset of 7, 12-dimethylbenz[a]anthracene-induced rat sarcomas (13–15), suggesting that involvement of this chromosome region repre-sents a major pathway in a variety of tumor types. In the presentinvestigation, we have undertaken a detailed qualitative and quanti-tative characterization of the amplification of RNO4-derived se-quences. Our findings suggest that at least two subregions are in-volved in independent amplifications in these tumors. Each of theregions contains cancer-related genes, which may interact in thedevelopment of endometrial cancers.
MATERIALS AND METHODS
Tumor Material. Females of the inbred rat strain BDII/Han are predis-posed to cancer in the endometrium of the uterus (EAC; Refs. 11 and 16).Virgin females (�90%) will develop this neoplasm, usually before 24 monthsof age. When BDII/Han rats were interbred with rats from the two nonsus-ceptible strains BN/Han and SPRD-Cu3/Han, a large fraction of the F1, F2,and backcross animals spontaneously developed tumors. Most of these tumorswere pathologically characterized as EAC, but in addition, some other types ofuterine and nonuterine tumors were present (see Ref. 12). The main materialfor the present investigation was 12 tissue cultures derived from 11 endome-
Received 6/22/01; accepted 9/19/01.The costs of publication of this article were defrayed in part by the payment of page
charges. This article must therefore be hereby marked advertisement in accordance with18 U.S.C. Section 1734 solely to indicate this fact.
1 Supported by grants from the European Commission (contract ERBBio4CT960562),the Swedish Cancer Society, the Nilsson-Ehle Foundation, and the IngaBritt and ArneLundberg Research Foundation.
2 To whom requests for reprints should be addressed, at Department of Cell andMolecular Biology–Genetics, Goteborg Univeristy, Box 462, S-405 30 Gothenburg,Sweden. Phone: 46-31-7733298; Fax: 46-31-7732599; E-mail: [email protected].
3 Internet address: http://www.cancer.org.4 The abbreviations used are: EAC, endometrial adenocarcinoma; HSR, homoge-
neously staining region; CGH, comparative genome hybridization; RNO4, rat chromo-some 4; ESCC, endometrial squamous cell carcinoma; FISH, fluorescence in situ hybrid-ization; PAC, P1 artificial chromosome; RT-PCR, reverse transcription-PCR; HGF,hepatocyte growth factor; MET, HGF receptor; HSA7, human chromosome 7; DCSE,diploid chromosome set equivalent; CDK, cyclin-dependent kinase; SF, scatter factor.
8263
on June 20, 2018. © 2001 American Association for Cancer Research.cancerres.aacrjournals.org Downloaded from
trial tumors (10 classified as EACs and 1 classified as ESCC) and from 1 tumorclassified as peritoneal mesothelioma. DNA was extracted according to stand-ard procedures using phenol/chloroform extraction.
Chromosome Preparations and Cytogenetic Analysis. Chromosomepreparations were made from cultured normal rat embryo fibroblasts, 2n � 42(for single- and dual-color FISH mapping), as well as from the 12 tumor tissuecultures (for DNA sequence amplification and cytogenetic analyses). Spreadswith elongated chromosomes (mainly prometaphases) were prepared from therat embryo fibroblasts by treatment of cells with ICRF-145 [(4,4�-(1,2-ethanediyl)bis(2,6-piperazinedione), 25 �M; Funakoshi, Tokyo, Japan] duringthe final 60 min and Colcemid (0.05 �g/ml; Life Technologies, Inc., GrandIsland, NY) during the final 20 min before harvest (17). Tumor tissue cultureswere treated with Colcemid but not with ICRF-145. The cells were harvestedby mitotic shake-off, pelleted by centrifugation, and resuspended in 0.075 M
KCl at room temperature for 30 min. Methanol-acetic acid fixation was carriedout as described previously (18). The tumor tissue metaphases were subjectedto cytogenetic analysis after G-banding (18), and 10–20 cells from each tumorwere karyotyped. CGH was performed as described previously (12).
Physical Localization of PAC Clones and DNA Sequence AmplificationAnalysis by FISH. To obtain probes suitable for FISH, genomic DNA cloneswere isolated by screening of a rat PAC library, RPCI-31 (BAC-PAC re-sources; Roswell Park Cancer Institute, Buffalo, NY), using as probes purifiedPCR-generated 200-1200-bp fragments corresponding to genes of interest orfull-length cDNAs (for Hgf and Met). The isolation and verification of thePACs have been described in detail elsewhere (19). The PACs were used asprobes in single- and dual-color FISH, which was performed essentiallyaccording to published procedures (19, 20).
Southern Blot. Genomic DNA (15 �g) from the tumor tissue cultures, aswell as from normal rat BDII liver (included as a control), was digested withEcoRI. Purified 200-1200-bp PCR products corresponding to the genes, aswell as the Hgf and Met cDNAs, were radioactively labeled with [�-32P]dCTPby the random priming method (21) and subsequently hybridized one by oneto the filter. After washing at high stringency, the filter was exposed to X-rayfilm (Hyperfilm-MP; Amersham, Buckinghamshire, United Kingdom). Thefilm was developed, and the approximate level of amplification for each genewas calculated by comparison of the hybridization signal intensities (on theX-ray films) between tumor and normal control BDII DNA, using the dedi-cated software Quantity One, ver 4.2.2 (Bio-Rad Laboratories, Hercules, CA).5
To compensate for minor variations in sample loading, signals from a 146-bp�-actin control probe (PCR amplified using the primers 5�-cacggcattgtaac-caactg-3� and 5�-ctgggtcatcttttcacggt-3�) were used for normalization.
RT-PCR. Cytoplasmic RNA was extracted from the tumor tissue culturesand from cultured rat embryonic cells using the RNeasy Mini kit (Qiagen,Valencia, CA), and cDNA was prepared according to standard proceduresusing the Superscript preamplification system (Life Technologies, Inc.). Withthe primer pairs listed in Table 1, each of the 15 genes was coamplified with�-actin (primers 5�-cacggcattgtaaccaactg-3� and 5�-ctgggtcatcttttcacggt-3�,generating a 146-bp fragment) using the tumor cDNAs (100 ng of each) as
template. PCR was performed according to standard procedures; however,[F]-dUTP R110 (0.4 �M; PE Applied Biosystems, Foster City, CA) was addedto each 10-�l reaction mixture. Thermal cycling was performed by initialdenaturation at 94°C for 3 min, followed by 28 cycles consisting of 94°C for1 min, 55°C-60°C for 1 min, and 72°C for 2 min and ending by an extensionstep of 72°C for 7 min. After PCR, a 2-�l aliquot was collected and subjectedto electrophoresis on Tris/acetate/EDTA (TAE)-buffered agarose gels. For asemiquantitative analysis, the remaining 8-�l aliquot was ethanol precipitatedand subsequently separated by PAGE in a 377 automated fluorescent DNAsequencer (PE Applied Biosystems). The data were collected and analyzedwith the Genescan Analysis Software (PE Applied Biosystems).
Western Blot of the Rat Met Protein. The Western blot experiments wereperformed under reducing conditions, mainly as described previously (13). Inbrief, proteins were prepared from the cultured tumor cells by sonication. Atotal amount of 20 �g of protein/sample was run on NuPage 4–12% Bis-Trisgels, using a Novex Xcell II system (Novex, San Diego, CA), and thentransferred to PVDF membranes (Novex) by electroblotting. The membraneswere blocked overnight by incubation in 10% dry milk in a Tris-buffered salinebuffer (50 mM Tris-HCl, 137 mM NaCl, and 0.1% Tween 20). The blots werethen probed with a rabbit polyclonal antimouse Met antibody (SP260; SantaCruz Biotechnology, Santa Cruz, CA) and then with an antirabbit horseradishperoxidase-linked F(ab�)2 fragment (Amersham). The membranes werewashed and exposed to the enhanced chemiluminescence detection system(Amersham).
DNA Sequencing of Exons 17–19 of the Rat Met Gene. To evaluate theoccurrence of mutations in Met exons 17, 18, and 19 encoding the tyrosinekinase domain of the Met, a total of 100 ng of cDNA from each of the tumortissue cultures was subjected to PCR amplification, using the primers 5�-ccaccccaatgttctctcac-3� and 5�-ggtggtgaacttttgcgtct-3�. The resulting 382-bpfragment was purified by gel band purification using GFX spin columns(Amersham Pharmacia Biotech, Piscataway, NJ), and DNA sequencing wasperformed using the Prism BigDye Terminator chemistry (PE Applied Bio-systems). The sequencing products were ethanol precipitated and then sepa-rated by PAGE in a 377 automated fluorescent DNA sequencer (PE AppliedBiosystems). DNA sequence analysis was carried out with the SequencingAnalysis software, ver 3.3 (PE Applied Biosystems). The fragment was se-quenced in both directions, using one or the other of the two PCR primers.cDNA from cultured rat embryonic cells was used as control.
RESULTS
Cytogenetic and CGH Findings in Rat Uterine Tumors. Tissuecultures were established from 11 malignant rat uterine tumors (10EACs and 1 ESCC) derived from F1, F2, and backcross animals in thetwo crosses. The tissue cultures were subjected to cytogenetic analy-sis, which revealed that most of the EAC tumors displayed chromo-some numbers in the triploid/hypotetraploid region (2n � 53–69), butRUT2 and RUT7 were near diploid, and NUT51 and NUT82 werenear tetraploid. The chromosome number of the ESCC culture, RUT5,5 Internet address: http://www.bio-rad.com.
Table 1 Oligonucleotide sequences of primer pairs used in RT-PCR and size in bps of corresponding amplified fragmentsa
Gene symbol Gene description Forward primer Reverse primerPCR fragment
size (bp)
Cdk5 Cyclin-dependent kinase 5 ggaaggtaatggaaccacga gcagggagaatctgccataa 419Hgf Hepatocyte growth factor (scatter factor) cccaaatgtgacgtgtcaag tgttttgttttggcacagga 335Dmtf1 Cyclin D binding myb-like transcription factor 1 aggatacctgcaacacaggg gcaatttgccttttgatggt 373Abcb1 ATP-binding cassette, subfamily B (MDR/TAP/PGY), member 1 catcgacagcttctcaacca actcagaggcaccagtgtca 836Cyp51 Cytochrome P450, 51 (lanosterol 14-�-demethylase) ccttcacgcttagccttgtc gtatgcaactcccttcccaa 332Cdk6 Cyclin-dependent kinase 6 gcctatgggaaggtgttcaa tgaagaaagtccagacctcg 344Tac1 Tachykinin, precursor 1 (substance K, substance P) gtttgcagaggaaatcggtg gcgcttctttcataagccac 312Asns Asparagine synthetase ctttccgtgcagtgtctgag tccaggcctcctgataaaag 746Cav1 Caveolin 1 agattgatctggtcaaccgc atctcttcctgcgtgctgat 392Met Hepatocyte growth factor receptor (MET proto-oncogene) aaagccaatgtgtcaggagg tcgggagggtaggaagagtt 317Wnt2 Wingless-type MMTV integration site family member 2 tccttccagctctgttgttg gcctttgtttacgccatctc 262Cftr Cystic fibrosis transmembrane conductance regulator tgagggcagcagctattttt ttgttccaggtggtagaggc 180Smoh Smoothened (Drosophila) homolog cacttaccagcctctctcgg ctgaaggtgatgagcacgaa 360Braf V-raf murine sarcoma viral oncogene homolog B1 gaaagtggcatggtgatgtg aggtatcctcgtcccaccat 601Arhgef5 Rho guanine nucleotide exchange factor 5 (TIM proto-oncogene) atgctcccttctcctccatt ttggcagtcttgactcgatg 442
a Each gene was coamplified with �-actin.
8264
GENE AMPLIFICATION IN RAT ENDOMETRIAL CANCER
on June 20, 2018. © 2001 American Association for Cancer Research.cancerres.aacrjournals.org Downloaded from
was also in the near-tetraploid region. For comparison, a tissue culturefrom a peritoneal mesothelioma was included in the analysis (desig-nated RUT29) and was found to be hyperdiploid (2n � 44). Cytoge-netic manifestations of gene amplification, represented by HSRs ofvarious sizes, were present in 11 of the 12 tumor cultures (Fig. 1). Bymeans of CGH analysis, the approximate position of the regions, fromwhich the amplified sequences were derived, could be determined foreach of the cultured tumors (Table 2; criterion used was a green:redfluorescence ratio �2.5). As shown, chromosome regions involved inamplification were tentatively identified in all tumor cultures display-ing HSRs, and the data set suggests that at least eight differentchromosome regions were involved in amplification in this material,some of them more than one time. The region most commonlyexhibiting amplification was RNO4q12-q22 (Fig. 2). This was inaccord with the CGH findings in the primary tumors, from which thetissue cultures were derived. In fact, moderate- to high-level gain ofsequences from RNO4 was the most common alteration, affecting 11(58%) of 19 primary malignant EACs or totally 12 (55%) of 22tumors, including three additional tumors classified as uterine sar-coma, uterine carcinoma, and peritoneal mesothelioma, respectively(12). Furthermore, in 10 (45%) of the 22 primary tumors, the fluo-rescence ratio curves were indicative of high-level copy numberincreases confined to RNO4q12-q22, which was suggestive of geneamplification (defined as �5-fold increase in copy number; Ref. 2;Fig. 2).
Construction of a Physical Framework Map of the RNO4 Prox-imal Region. To be able to define and delimit the amplified RNO4segment, and to pinpoint putative tumor-associated loci, a detailedmolecular cytogenetic characterization of the region was required.Exploiting comparative mapping data from HSA7q21 and 7q31–36and mouse chromosomes 5 (0–12 cM) and 6 (0–15 cM), we were ableto identify gene candidates for mapping and amplification analysis.Using dual-color FISH on rat metaphase and prometaphase chromo-
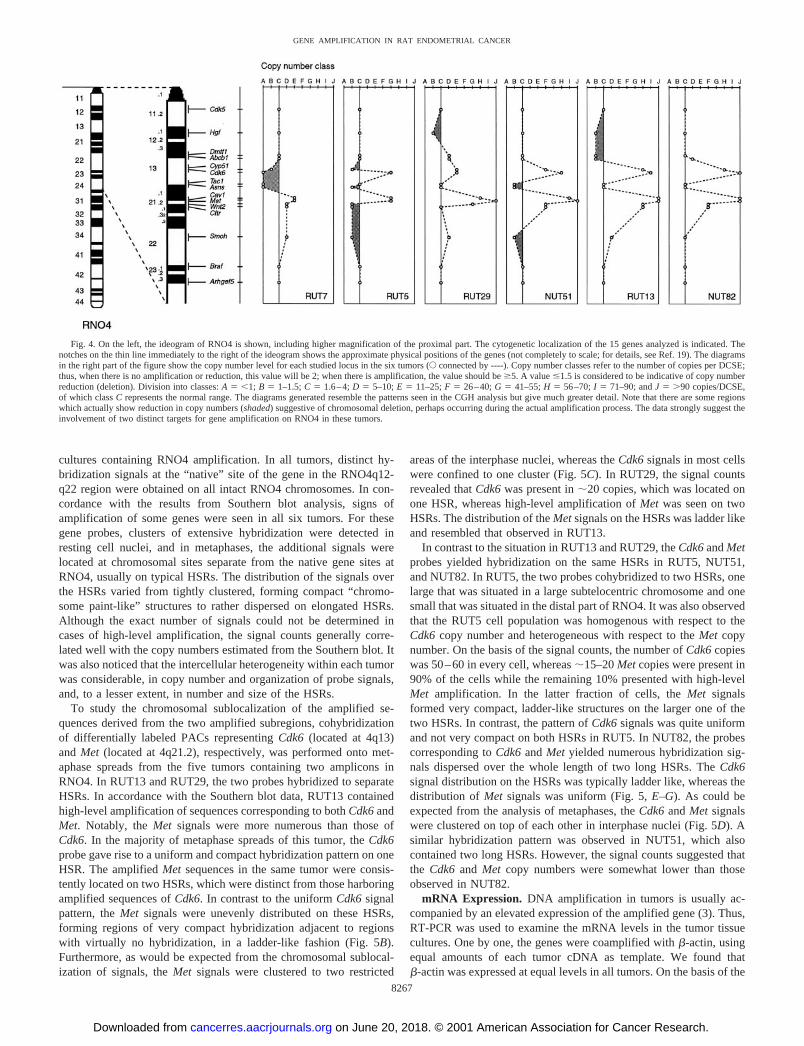
somes, as well as on interphase chromatin in resting cell nuclei, thechromosomal sublocalization and relative order of 15 loci were de-termined, as well as the distances between them, as described in detailelsewhere (19). We found that all of the selected genes mapped onRNO4 as predicted, and the following map could be constructed(cytogenetic band position is given in parenthesis): (4cen)–Cdk5(q11.2)–8–10 Mb–Hgf (q12.1)–7–9 Mb–Dmtf1 (q12-q13)–300–500kb–Abcb1 (q12-q13)–4–6 Mb–Cyp51 (q13)–300–500 kb–Cdk6(q13)–4–7 Mb–Tac1 (q13-q21)–50–200 kb–Asns (q13-q21)–4–6Mb–Cav1 (q21.1-q21.2)–100–300 kb–Met (q21.2)–500–1000 kb–Wnt2 (q21.2-q21.31)–200–500 kb–Cftr (q21.2-q21.31)–10�15 Mb–Smoh (q22)–10�15 Mb–Braf (q22-q23)–3–5 Mb–Arhgef5 (q23.3)–(4qter; see also Fig. 4). If certain evolutionary events are taken intoaccount, both gene order and distances between loci conform excep-tionally well with the corresponding homologous human genes onHSA7q (19).
Gene Copy Number Changes in the RNO4 Proximal Region.To map the amplified region on RNO4 in detail and to be able todefine the minimal region/regions of common amplification, the copynumber for each of the 15 genes distributed across bands q11-q23 ofRNO4 was monitored in the 12 tumor tissue cultures by conventionalSouthern blot analysis. The PCR-generated probes were hybridizedone by one to filters containing equal quantities of digested DNA fromeach of the tumor samples, along with the normal control sample(liver DNA from a BDII animal). Examples of the results are shownin Fig. 3. After hybridization, the observed bands were densitometri-cally scanned, and the approximate level of amplification was deter-mined for each probe by calculating the ratio between the signalintensity obtained from the individual tumor sample with that ob-tained from the normal control sample. To distinguish gene amplifi-cation from low-level RNO4 copy number increase (e.g., trisomy), aswell as from hyper-diploidy, only gene copy number increases �2.5-fold were scored as significant, corresponding to �5 copies/DCSE.
Significantly elevated copy numbers (amplification) for some of the15 genes studied were detected in 6 of the 12 tumor cultures (RUT5,7, 13, 29, NUT51, and 82; Fig. 4). For five of these tumors (RUT7, 13,29, NUT51, and 82), the Southern blot data coincided with the CGHfindings, which displayed fluorescence ratios �2.5 in the RNO4q12-q22 region (Table 2). The CGH analysis of the sixth tumor, RUT5, didnot disclose any significant DNA copy number change affectingRNO4. However, the resolution of CGH is limited, and gain of DNAcopy number affecting a small region (�2–4 Mb) may be undetect-
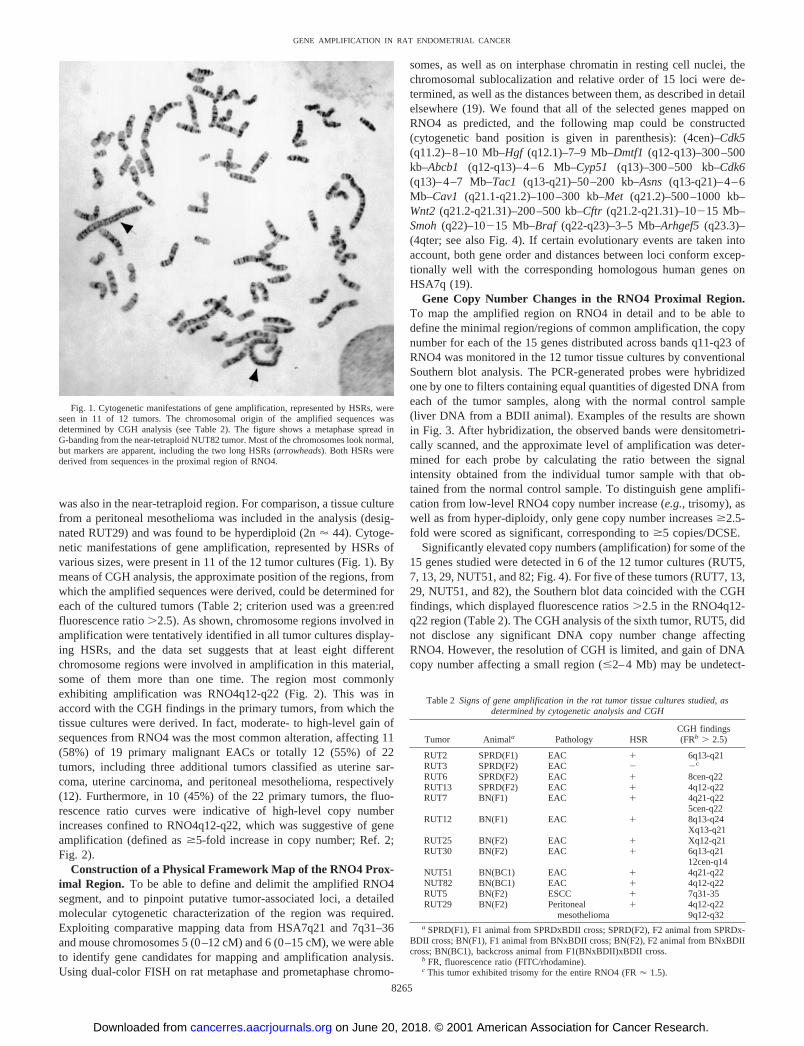
Fig. 1. Cytogenetic manifestations of gene amplification, represented by HSRs, wereseen in 11 of 12 tumors. The chromosomal origin of the amplified sequences wasdetermined by CGH analysis (see Table 2). The figure shows a metaphase spread inG-banding from the near-tetraploid NUT82 tumor. Most of the chromosomes look normal,but markers are apparent, including the two long HSRs (arrowheads). Both HSRs werederived from sequences in the proximal region of RNO4.
Table 2 Signs of gene amplification in the rat tumor tissue cultures studied, asdetermined by cytogenetic analysis and CGH
Tumor Animala Pathology HSRCGH findings(FRb � 2.5)
RUT2 SPRD(F1) EAC � 6q13-q21RUT3 SPRD(F2) EAC � �c
RUT6 SPRD(F2) EAC � 8cen-q22RUT13 SPRD(F2) EAC � 4q12-q22RUT7 BN(F1) EAC � 4q21-q22
5cen-q22RUT12 BN(F1) EAC � 8q13-q24
Xq13-q21RUT25 BN(F2) EAC � Xq12-q21RUT30 BN(F2) EAC � 6q13-q21
12cen-q14NUT51 BN(BC1) EAC � 4q21-q22NUT82 BN(BC1) EAC � 4q12-q22RUT5 BN(F2) ESCC � 7q31-35RUT29 BN(F2) Peritoneal � 4q12-q22
mesothelioma 9q12-q32a SPRD(F1), F1 animal from SPRDxBDII cross; SPRD(F2), F2 animal from SPRDx-
BDII cross; BN(F1), F1 animal from BNxBDII cross; BN(F2), F2 animal from BNxBDIIcross; BN(BC1), backcross animal from F1(BNxBDII)xBDII cross.
b FR, fluorescence ratio (FITC/rhodamine).c This tumor exhibited trisomy for the entire RNO4 (FR � 1.5).
8265
GENE AMPLIFICATION IN RAT ENDOMETRIAL CANCER
on June 20, 2018. © 2001 American Association for Cancer Research.cancerres.aacrjournals.org Downloaded from
able (22). Moreover, in the CGH analysis of RUT13, it was observedthat the average fluorescence ratio gave double peaks in theRNO4q12–22 region. Accordingly, individual metaphases in the com-posite (FITC/rhodamine) CGH pictures of RUT13 sometimes showedtwo distinct regions of elevated green:red signal ratio in the proximalpart of RNO4 (Fig. 5A). A similar hybridization pattern was occa-sionally seen in individual metaphases of another three of the ana-lyzed tumors: RUT29, NUT51, and 82. Thus, these observationssuggested that two adjacent or possibly overlapping amplicons mightbe present in these four tumors. The copy numbers detected bySouthern blot analysis corroborate the interpretation that there weretwo distinct amplified regions, which had been derived from bands4q12-q13 and 4q21-q22, respectively. As is shown in Fig. 4, the moredistal region (4q21-q22) was amplified in all six tumors, whereas themore proximal region (4q12-q13) was amplified in five of them (allexcept RUT7). The two amplified regions were disconnected by asegment containing the genes Asns and Tac1, both located at the4q13-q21 transition. Thus, the copy numbers of Asns (Fig. 3) andTac1 were in the normal range (�2 copies/DCSE) in RUT29 butslightly elevated in RUT13 (�3 copies/DCSE) and NUT82 (3–4copies/DCSE). In RUT5 and NUT51, the analysis showed that therewas a decrease in copy number (�1 copy/DCSE) of these two genes.
For both amplified regions, it was obvious that the amplicons were
not uniform; instead, they varied in extension and in amplificationlevel among different tumors. Among the gene probes exhibitingsignificantly elevated copy numbers in the RNO4q12-q13 region,Cdk6 displayed the highest level of amplification, ranging from 10-fold in RUT29 to �50-fold in NUT82 (Fig. 3). In four (RUT13, 29,NUT51, and 82) of the five tumors containing amplified Cdk6 se-quences, Cyp51 was coamplified; however, the amplification levelwas considerably lower than that of Cdk6, ranging from 5-fold inRUT29 to �30-fold in RUT13 and NUT82. Slightly elevated copynumbers were also seen for Abcb1 in NUT82 (�5 copies/DCSE) andfor both Abcb1 and Dmtf1 in RUT29 (�6 copies/DCSE).
The genes Cav1 and Met (Fig. 3) were consistently coamplified inall six tumors containing amplicons corresponding to the distal region.The levels of amplification of the two genes were closely correlated toeach other and ranged from 6–7-fold in RUT7 to �75-fold in RUT13.Although the exact copy numbers were more difficult to assess whenthere was high-level amplification, the data suggested that the Cav1copy number was slightly lower than that of Met in most tumors. Thedifference in Cav1 and Met copy number was most pronounced inRUT29, in which the degree of Cav1 amplification was �33-fold, ascompared with the �50-fold amplification of Met. In addition to Cav1and Met amplification, five tumors (RUT7, 13, 29, NUT51, and 82)also contained amplified sequences of the Wnt2 gene. The estimatedcopy numbers of Wnt2 ranged from �4-fold in RUT7 to �30-fold inRUT13. Furthermore, amplification of Cftr was detected in fourtumors (RUT7, 13, NUT51, and 82), and the estimated copy numberswere almost identical to those observed for Wnt2. Of the four tumorsharboring amplified Cftr sequences, elevated levels of Smoh wereseen in RUT7 (�6 copies/DCSE) and in RUT13 (�5 copies/DCSE).Interestingly, low-level amplification (�6 copies/DCSE) of Smoh wasalso observed in RUT29, a tumor presenting with a normal Cftr copynumber (2 copies/DCSE). Although not conclusive, these resultssuggest that this particular tumor might contain three distinct ampli-cons.
Reduction in copy number from the normal 2 copies/DCSE wasdetected for some gene probes in the present tumor material (Fig. 4).A common observation was that copy numbers �1.5 copies/DCSEwere scored for gene probes flanking amplified regions, e.g., Hgf,Dmtf1, and Abcb1 were all present at a lower copy number thannormal in RUT13, and the same was true for Wnt2, Cftr, and Smoh inRUT5. Likewise, decreased copy numbers of Tac1, Asns, and Smohwere seen in NUT51. The lowest copy numbers of all were recordedin RUT7 for the genes Cdk6, Tac1, and Asns (�0.5 copies/DCSE). Asmentioned previously, this tumor contained only one amplicon, withlow-level amplification, corresponding to the distal region. Thus, thedata strongly suggest that in RUT7, there is an interstitial deletion ofbands 4q13-q21 adjacent to the amplification encompassing bands4q21-q22.
Chromosomal Sublocalization of Amplified Sequences. To ob-tain additional information on the chromosomal sublocalization of theamplified loci, as well as on the intercellular heterogeneity withineach tumor, the isolated PAC clones were used one by one as probesin FISH on chromosome slides prepared from the six tumor tissue
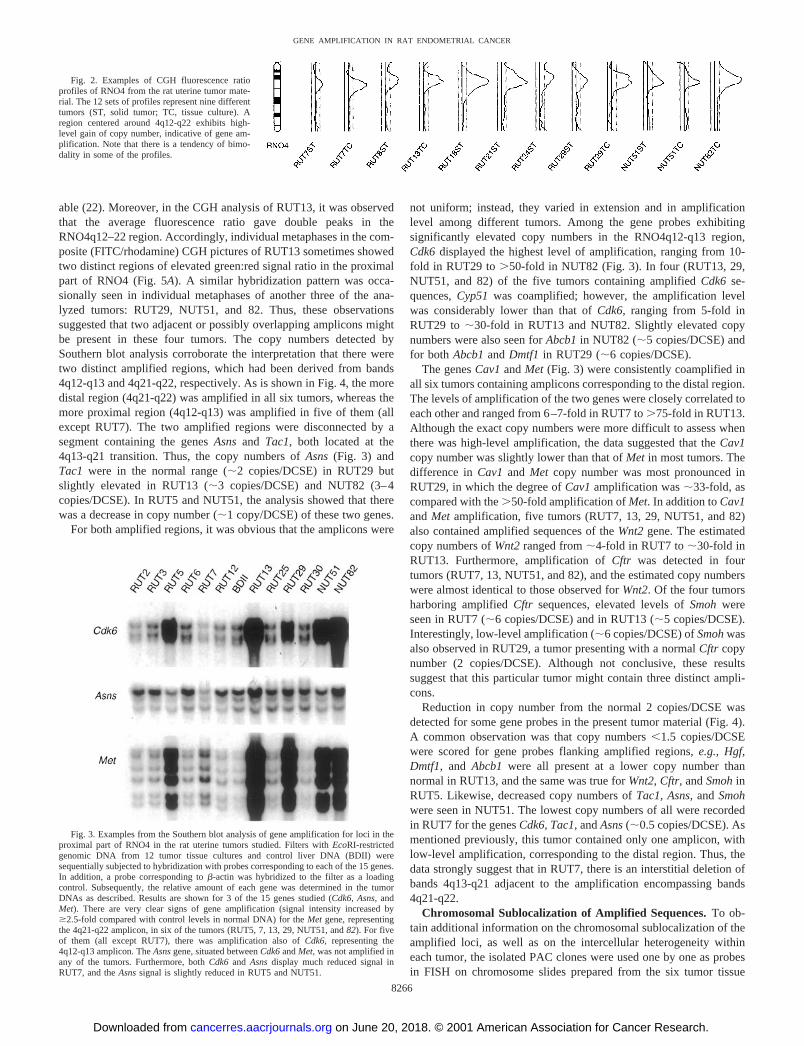
Fig. 2. Examples of CGH fluorescence ratioprofiles of RNO4 from the rat uterine tumor mate-rial. The 12 sets of profiles represent nine differenttumors (ST, solid tumor; TC, tissue culture). Aregion centered around 4q12-q22 exhibits high-level gain of copy number, indicative of gene am-plification. Note that there is a tendency of bimo-dality in some of the profiles.
Fig. 3. Examples from the Southern blot analysis of gene amplification for loci in theproximal part of RNO4 in the rat uterine tumors studied. Filters with EcoRI-restrictedgenomic DNA from 12 tumor tissue cultures and control liver DNA (BDII) weresequentially subjected to hybridization with probes corresponding to each of the 15 genes.In addition, a probe corresponding to �-actin was hybridized to the filter as a loadingcontrol. Subsequently, the relative amount of each gene was determined in the tumorDNAs as described. Results are shown for 3 of the 15 genes studied (Cdk6, Asns, andMet). There are very clear signs of gene amplification (signal intensity increased by�2.5-fold compared with control levels in normal DNA) for the Met gene, representingthe 4q21-q22 amplicon, in six of the tumors (RUT5, 7, 13, 29, NUT51, and 82). For fiveof them (all except RUT7), there was amplification also of Cdk6, representing the4q12-q13 amplicon. The Asns gene, situated between Cdk6 and Met, was not amplified inany of the tumors. Furthermore, both Cdk6 and Asns display much reduced signal inRUT7, and the Asns signal is slightly reduced in RUT5 and NUT51.
8266
GENE AMPLIFICATION IN RAT ENDOMETRIAL CANCER
on June 20, 2018. © 2001 American Association for Cancer Research.cancerres.aacrjournals.org Downloaded from
cultures containing RNO4 amplification. In all tumors, distinct hy-bridization signals at the “native” site of the gene in the RNO4q12-q22 region were obtained on all intact RNO4 chromosomes. In con-cordance with the results from Southern blot analysis, signs ofamplification of some genes were seen in all six tumors. For thesegene probes, clusters of extensive hybridization were detected inresting cell nuclei, and in metaphases, the additional signals werelocated at chromosomal sites separate from the native gene sites atRNO4, usually on typical HSRs. The distribution of the signals overthe HSRs varied from tightly clustered, forming compact “chromo-some paint-like” structures to rather dispersed on elongated HSRs.Although the exact number of signals could not be determined incases of high-level amplification, the signal counts generally corre-lated well with the copy numbers estimated from the Southern blot. Itwas also noticed that the intercellular heterogeneity within each tumorwas considerable, in copy number and organization of probe signals,and, to a lesser extent, in number and size of the HSRs.
To study the chromosomal sublocalization of the amplified se-quences derived from the two amplified subregions, cohybridizationof differentially labeled PACs representing Cdk6 (located at 4q13)and Met (located at 4q21.2), respectively, was performed onto met-aphase spreads from the five tumors containing two amplicons inRNO4. In RUT13 and RUT29, the two probes hybridized to separateHSRs. In accordance with the Southern blot data, RUT13 containedhigh-level amplification of sequences corresponding to both Cdk6 andMet. Notably, the Met signals were more numerous than those ofCdk6. In the majority of metaphase spreads of this tumor, the Cdk6probe gave rise to a uniform and compact hybridization pattern on oneHSR. The amplified Met sequences in the same tumor were consis-tently located on two HSRs, which were distinct from those harboringamplified sequences of Cdk6. In contrast to the uniform Cdk6 signalpattern, the Met signals were unevenly distributed on these HSRs,forming regions of very compact hybridization adjacent to regionswith virtually no hybridization, in a ladder-like fashion (Fig. 5B).Furthermore, as would be expected from the chromosomal sublocal-ization of signals, the Met signals were clustered to two restricted
areas of the interphase nuclei, whereas the Cdk6 signals in most cellswere confined to one cluster (Fig. 5C). In RUT29, the signal countsrevealed that Cdk6 was present in �20 copies, which was located onone HSR, whereas high-level amplification of Met was seen on twoHSRs. The distribution of the Met signals on the HSRs was ladder likeand resembled that observed in RUT13.
In contrast to the situation in RUT13 and RUT29, the Cdk6 and Metprobes yielded hybridization on the same HSRs in RUT5, NUT51,and NUT82. In RUT5, the two probes cohybridized to two HSRs, onelarge that was situated in a large subtelocentric chromosome and onesmall that was situated in the distal part of RNO4. It was also observedthat the RUT5 cell population was homogenous with respect to theCdk6 copy number and heterogeneous with respect to the Met copynumber. On the basis of the signal counts, the number of Cdk6 copieswas 50–60 in every cell, whereas �15–20 Met copies were present in90% of the cells while the remaining 10% presented with high-levelMet amplification. In the latter fraction of cells, the Met signalsformed very compact, ladder-like structures on the larger one of thetwo HSRs. In contrast, the pattern of Cdk6 signals was quite uniformand not very compact on both HSRs in RUT5. In NUT82, the probescorresponding to Cdk6 and Met yielded numerous hybridization sig-nals dispersed over the whole length of two long HSRs. The Cdk6signal distribution on the HSRs was typically ladder like, whereas thedistribution of Met signals was uniform (Fig. 5, E–G). As could beexpected from the analysis of metaphases, the Cdk6 and Met signalswere clustered on top of each other in interphase nuclei (Fig. 5D). Asimilar hybridization pattern was observed in NUT51, which alsocontained two long HSRs. However, the signal counts suggested thatthe Cdk6 and Met copy numbers were somewhat lower than thoseobserved in NUT82.
mRNA Expression. DNA amplification in tumors is usually ac-companied by an elevated expression of the amplified gene (3). Thus,RT-PCR was used to examine the mRNA levels in the tumor tissuecultures. One by one, the genes were coamplified with �-actin, usingequal amounts of each tumor cDNA as template. We found that�-actin was expressed at equal levels in all tumors. On the basis of the
Fig. 4. On the left, the ideogram of RNO4 is shown, including higher magnification of the proximal part. The cytogenetic localization of the 15 genes analyzed is indicated. Thenotches on the thin line immediately to the right of the ideogram shows the approximate physical positions of the genes (not completely to scale; for details, see Ref. 19). The diagramsin the right part of the figure show the copy number level for each studied locus in the six tumors (E connected by ----). Copy number classes refer to the number of copies per DCSE;thus, when there is no amplification or reduction, this value will be 2; when there is amplification, the value should be �5. A value �1.5 is considered to be indicative of copy numberreduction (deletion). Division into classes: A � �1; B � 1–1.5; C � 1.6–4; D � 5–10; E � 11–25; F � 26–40; G � 41–55; H � 56–70; I � 71–90; and J � �90 copies/DCSE,of which class C represents the normal range. The diagrams generated resemble the patterns seen in the CGH analysis but give much greater detail. Note that there are some regionswhich actually show reduction in copy numbers (shaded) suggestive of chromosomal deletion, perhaps occurring during the actual amplification process. The data strongly suggest theinvolvement of two distinct targets for gene amplification on RNO4 in these tumors.
8267
GENE AMPLIFICATION IN RAT ENDOMETRIAL CANCER
on June 20, 2018. © 2001 American Association for Cancer Research.cancerres.aacrjournals.org Downloaded from
relative amounts of the fragments representing the tested gene and�-actin, respectively, the expression in each tumor was classified asvery weak ([�]), weak (�), moderate (��), or strong (���; Table3). When detectable fragments were absent, the outcome was scoredas no expression (�).
Detectable amounts of mRNA were present for all of the 15 genesin at least one of the 12 tumors (Table 3). Three genes (Hgf, Abcb1,and Tac1) were expressed merely in four tumors or less, e.g., Tac1mRNA was present in very low amounts only in RUT25, whereasmoderate and low amounts of Hgf mRNA were detected in RUT7 andin RUT30, respectively (Fig. 6). Another five genes (Cdk5, Dmtf1,Asns, Smoh, and Braf) displayed quite low and rather uniform levelsof expression among the tumors, e.g., Dmtf1 was weakly expressed inall tumors, except in RUT3, in which the level of expression wasslightly reduced. A similar pattern of weak but ubiquitous expressionwas seen for Smoh. Furthermore, the Asns expression was weak inRUT6, RUT12, and NUT82; absent in RUT5, 7, 13, 29, and 30; andvery weak in the rest of the tumors. Arhgef5 was expressed in alltumors, at moderate levels in RUT7, 12, 25, 29, and 30 and at low orvery low levels in the rest of the tumors.
Strong expression was restricted to those genes displaying signifi-cantly elevated copy numbers in the Southern blot analysis. Theamount of Cdk6 mRNA corresponded well with the Cdk6 gene copy
number in that the expression was strongest in the four tumors havingthe highest Cdk6 copy numbers (RUT5, 13, NUT51, and 82; Fig. 6).Furthermore, the expression of Cyp51 was strongest in RUT13, atumor having a �30-fold Cyp51 amplification, and weakest in RUT5and 7. The latter two tumors actually displayed a reduced Cyp51 copynumber (�1.5 copies/DCSE). A close correlation between mRNAlevels and copy numbers was also observed for the Met gene, locatedin the distal amplicon. The Met expression was strongest in fourtumors exhibiting the highest Met copy numbers by Southern blotanalysis (RUT13, 29, NUT51, and 82), as well as in RUT7 showing7-fold Met amplification (Fig. 6). Notably, the Met expression inRUT5, a tumor displaying 23-fold Met amplification, was moderateand resembled that of RUT3, a tumor known to have trisomy forRNO4 (12). The pattern of Cav1 expression among the tumors wasquite similar to that of Met, in that the strongest expression wasdetected in RUT7, 13, 29, and NUT82. However, a very weak Cav1expression was seen in NUT51, a tumor having �40-fold amplifica-tion of Cav1 (Fig. 6).
The Wnt2 expression was strongest in RUT2 and NUT82 andslightly weaker in RUT7, RUT13, and NUT51 (Fig. 6). Notably, theWnt2 expression was very low in RUT29, a tumor shown to have21-fold amplification of Wnt2. In RUT5, the Wnt2 expression wasabsent, which was in accordance with the observed Wnt2 copy number
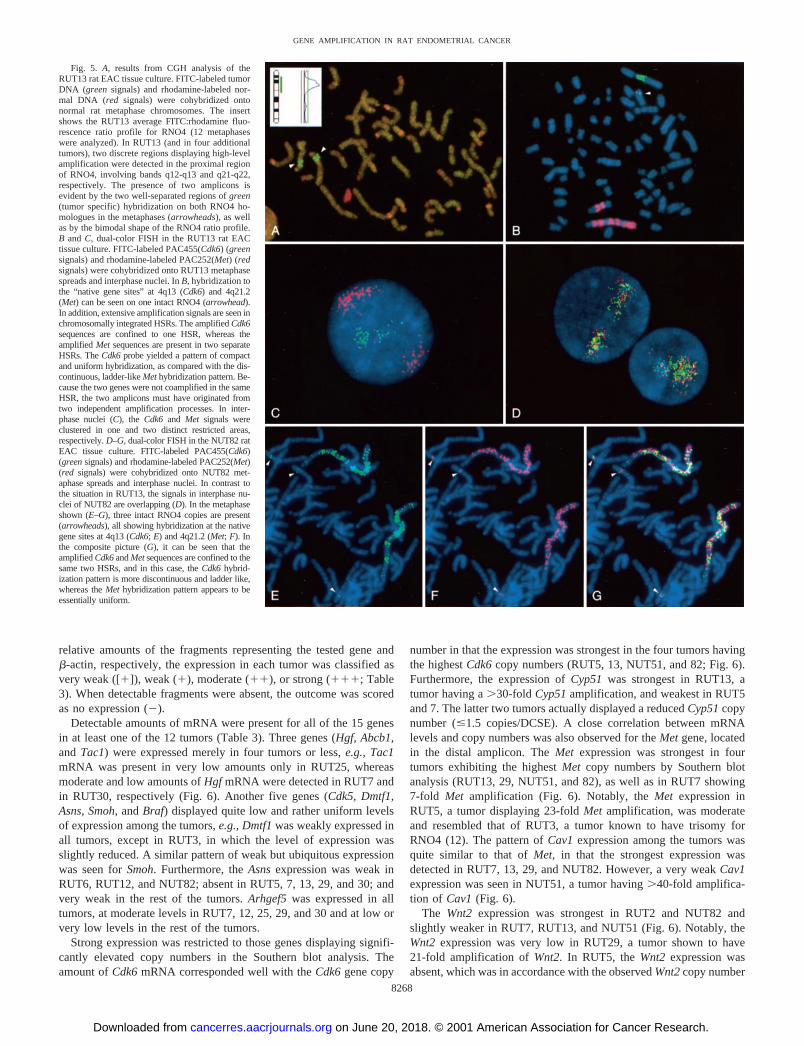
Fig. 5. A, results from CGH analysis of theRUT13 rat EAC tissue culture. FITC-labeled tumorDNA (green signals) and rhodamine-labeled nor-mal DNA (red signals) were cohybridized ontonormal rat metaphase chromosomes. The insertshows the RUT13 average FITC:rhodamine fluo-rescence ratio profile for RNO4 (12 metaphaseswere analyzed). In RUT13 (and in four additionaltumors), two discrete regions displaying high-levelamplification were detected in the proximal regionof RNO4, involving bands q12-q13 and q21-q22,respectively. The presence of two amplicons isevident by the two well-separated regions of green(tumor specific) hybridization on both RNO4 ho-mologues in the metaphases (arrowheads), as wellas by the bimodal shape of the RNO4 ratio profile.B and C, dual-color FISH in the RUT13 rat EACtissue culture. FITC-labeled PAC455(Cdk6) (greensignals) and rhodamine-labeled PAC252(Met) (redsignals) were cohybridized onto RUT13 metaphasespreads and interphase nuclei. In B, hybridization tothe “native gene sites” at 4q13 (Cdk6) and 4q21.2(Met) can be seen on one intact RNO4 (arrowhead).In addition, extensive amplification signals are seen inchromosomally integrated HSRs. The amplified Cdk6sequences are confined to one HSR, whereas theamplified Met sequences are present in two separateHSRs. The Cdk6 probe yielded a pattern of compactand uniform hybridization, as compared with the dis-continuous, ladder-like Met hybridization pattern. Be-cause the two genes were not coamplified in the sameHSR, the two amplicons must have originated fromtwo independent amplification processes. In inter-phase nuclei (C), the Cdk6 and Met signals wereclustered in one and two distinct restricted areas,respectively. D–G, dual-color FISH in the NUT82 ratEAC tissue culture. FITC-labeled PAC455(Cdk6)(green signals) and rhodamine-labeled PAC252(Met)(red signals) were cohybridized onto NUT82 met-aphase spreads and interphase nuclei. In contrast tothe situation in RUT13, the signals in interphase nu-clei of NUT82 are overlapping (D). In the metaphaseshown (E–G), three intact RNO4 copies are present(arrowheads), all showing hybridization at the nativegene sites at 4q13 (Cdk6; E) and 4q21.2 (Met; F). Inthe composite picture (G), it can be seen that theamplified Cdk6 and Met sequences are confined to thesame two HSRs, and in this case, the Cdk6 hybrid-ization pattern is more discontinuous and ladder like,whereas the Met hybridization pattern appears to beessentially uniform.
8268
GENE AMPLIFICATION IN RAT ENDOMETRIAL CANCER
on June 20, 2018. © 2001 American Association for Cancer Research.cancerres.aacrjournals.org Downloaded from
reduction (�1.5 copies/DCSE). Furthermore, the Cftr expression wasstrong in RUT13, moderate in RUT6, 7, NUT51, and 82, and veryweak in RUT5 and RUT29. Thus, when comparing the correspond-ence between mRNA expression and gene copy number, the correla-tion was higher for Cftr than for Wnt2.
Expression of the Met Protein. In addition to the assessment ofMet mRNA levels in the tumor tissue cultures, the expression status ofMet, the protein encoded by the Met proto-oncogene, was analyzed.Using an antimouse Met antibody, Western blot analysis of the sixtumors harboring Met amplification and the remaining six nonampli-fied tumors was carried out. Undetectable or minimally detectablelevels of Met protein were seen in all nonamplified tumors, except inRUT3, which displayed a low Met protein abundance. This tumor wasknown to contain a considerable fraction of cells having trisomy forRNO4 (12). In the six tumors with Met amplification, the levels ofMet protein corresponded well with the levels of Met mRNA, as wellas the Met gene copy numbers. Large amounts of Met protein weredetected in RUT13, 29, NUT51, and 82, whereas RUT7 and RUT5displayed moderate and low amounts of Met protein, respectively(Fig. 7).
Mutation Analysis of the Rat Met Gene. In human cancers,activation of the MET proto-oncogene by point mutations in thetyrosine kinase domain has been reported previously in hereditary andsporadic forms of papillary renal carcinoma (23) and in lymph nodemetastases of head and neck squamous cell carcinomas (24). Todetermine whether Met was activated by mutation in the present set ofrat tumors, DNA specimens of the 12 cultured tumors were screenedfor DNA sequence alterations in exons 17–19, containing the tyrosinekinase domain. Comparison of the obtained DNA sequences with ratMet sequences in the GenBank DNA sequence database revealed aC3T alteration at the third position of codon 1172 in exon 17(AAT3AAC), which was present in all tumors. However, becausethis mutation did not result in an amino acid change (both AAT andAAC code for aspargine), it was interpreted as a silent polymorphism.In fact, this sequence variant appeared to be typical for all three strainsused in the present investigation. The generated rat Met sequence wassubmitted to GenBank and was given the accession no. AF352173.
DISCUSSION
To study the genetic aspects of the development of EAC, theEAC-prone BDII rat was used to model human cancer. Using cyto-genetics and CGH, the pattern chromosomal changes was analyzed ina set of uterine tumors (mostly EACs), which developed spontane-ously in progeny from crosses between BDII rats and rats from two
nonsusceptible strains (12). Amplification of the proximal region ofRNO4 emerged as the most common aberration, both in primarytumors and in tissue cultures derived from them. To enable positionallocalization of candidate oncogenes, we isolated an array of largeinsert genomic PAC clones using PCR-generated probe fragmentsrepresenting genes predicted to be located across the region (19).Using the FISH and Southern blot techniques, we mapped amplifiedRNO4 regions in detail in a material of tissue cultures of 10 EACs,one ESCC, and one peritoneal mesothelioma. Six of the tumorscarried different RNO4-derived amplification units, and we were ableto identify two independent regions of common amplification encom-passing 4q13 and 4q21.1-q21.2, respectively, suggesting that selectionacts on at least two target genes. A similar situation has been reportedin human breast carcinomas (25, 26), in which coamplification of twosyntenic, yet separate, regions on HSA17q was observed.
The more proximal amplified segment comprised up to four of thegenes tested (Dmtf1, Abcb1, Cyp51, and Cdk6), of which Cdk6,located at 4q13, was amplified most recurrently. The level of Cdk6amplification was also markedly higher than the amplification levelsof the coamplified genes in tumor amplicons containing additionalgenes. Significantly, the elevated Cdk6 copy numbers were associatedwith elevated levels of Cdk6 mRNA, which was in accord with thetypical relationship between gene amplification and overexpression.The human homologue, CDK6, has been localized to chromosome7q21-q22 and has been postulated to be an important player in cellcycle control, providing a link between growth factor stimulation andonset of cell cycle progression (27). In fact, Harbour et al. (28)showed that CDK6 is one of the CDKs causing a sequential phos-phorylation of the RB1 protein that will progressively block activegrowth suppression by RB1 in the G1 stage and thereby facilitate entryinto S phase. Despite the fact that CDK6 has features that are puta-tively oncogenic, reports describing CDK6 alterations in human can-cer are sparse. Some cases of tumor-associated CDK6 overexpression,in the absence of CDK6 amplification, have been described, e.g.,CDK6 overexpression was detected in T-cell lymphoblastic lympho-ma/leukemia (29), as well as in splenic marginal zone lymphomas,carrying a specific translocation between HSA2 and 7, in which theHSA7 breakpoint was found to be situated upstream the CDK6transcription start site (30). In glioblastomas, overexpression of CDK6could only be detected in advanced tumors but not in correspondingtumors of lower grade (31), suggesting that CDK6 up-regulationmight promote progression of these tumors. The only documentationof CDK6 overexpression in association with CDK6 amplificationcomes from human gliomas (32). The authors suggested that the
Table 3 mRNA and Met protein expression in the rat tumor tissue cultures studied
Total RNA and proteins from the 12 rat tumor tissue cultures were used in RT-PCR and Western blot analysis, respectively. In the RT-PCR experiments, each of the 15 genes werecoamplified with �-actin using the primers listed in Table 1, and the relative mRNA levels were determined after electrophoresis on agarose (see also Fig. 6) and polyacrylamide gels.In the Western blot experiment, the proteins were probed with an antimouse Met antibody (see also Fig. 7). RNA and proteins from cultured rat embryo fibroblasts were included ascontrol.
Tumor
mRNA expressiona
Met proteinCdk5 Hgf Dmtf1 Abcb1 Cyp51 Cdk6 Tac1 Asns Cav1 Met Wnt2 Cftr Smoh Braf Arhgef5
RUT2 � � � � � �� � [�] �� �� �� � � � � [�]RUT3 � � [�] � �� �� � [�] � �� [�] � � � � �RUT6 �� � � � �� � � � [�] �� [�] �� � � [�] [�]RUT13 � � � � ��� ��� � � ��� ��� � ��� � � [�] ���RUT7 [�] �� � � [�] � � � ��� ��� � �� � � �� ��RUT12 � � � � �� �� � � � � � � � � �� [�]RUT25 � � � � � [�] [�] [�] � � � � � �� �� �RUT30 � � � � �� � � � � [�] � [�] � � �� �NUT51 � � � � �� ��� � [�] [�] ��� � �� � [�] [�] ���NUT82 � � � � �� ��� � � ��� ��� �� �� � [�] [�] ���RUT5 � � � [�] [�] ��� � � �� �� � [�] � [�] [�] �RUT29 � � � � �� �� � � ��� ��� [�] [�] [�] � �� ���a The following classification was used: �, no expression; [�], very weak expression; �, weak expression; ��, moderate expression; ���, strong expression.
8269
GENE AMPLIFICATION IN RAT ENDOMETRIAL CANCER
on June 20, 2018. © 2001 American Association for Cancer Research.cancerres.aacrjournals.org Downloaded from
amplification was restricted to CDK6, because no evidence could befound of coamplification of additional genes on HSA7, includingEGFR at 7p11-p12, MET at 7q31, as well as expressed sequence tagsmapping near the CDK6 locus.
The amplified sequences in the second region encompassed up tofive of the genes tested (Cav1, Met, Wnt2, Cftr, and Smoh), and thecore of the amplification was centered in the vicinity of Cav1 and Metat 4q21.1–21.2. These two genes were coamplified in all six tumorsharboring RNO4 amplification; however, Met copy numbers wereusually slightly higher than those of Cav1. Furthermore, the correla-tion between gene amplification and gene expression was closer forMet than for Cav1. In fact, the Met mRNA and protein levels weregreatly elevated whenever there was Met amplification. The onlyexception was RUT5, which displayed Met mRNA and protein levelssimilar to those in the RNO4-trisomic RUT3, despite the fact that ithad �20-fold amplification of Met. It should be noted that RUT5 wasclassified as an ESCC, whereas the remaining tumors (except RUT29)were EACs. In humans, CAV1 and MET are colocated at 7q31 andhave both been assigned functions, which make them supposedlycancer related. The CAV1 product, caveolin, acts as a scaffoldingprotein, which organizes and concentrates specific lipids and lipid-modified signaling molecules within specialized membrane invagina-tions, called caveoles (33). Lines of observations suggest that caveolinhas an inhibitory effect on these signaling molecules (reviewed in Ref.34), which is in accord with a role of CAV1 as a putative tumorsuppressor gene (35). The MET proto-oncogene was originally iden-tified as a transforming gene activated by translocation in a chemi-cally transformed human osteosarcoma cell line (36). MET encodes atransmembrane growth factor receptor tyrosine kinase, whose ligand,a soluble cytokine, is HGF/SF (37). Although expressed in many celltypes, the MET receptor tyrosine kinase is found at highest levels in
epithelial cells. In contrast, HGF/SF is predominantly expressedin mesenchymal cells and is thought to act on MET-expressing cellsin a paracrine fashion (38). The signaling mediated by HGF/SF-METinteractions has been postulated to play an important role in prolifer-ation and motility of epithelial cells in a variety of tissues, includingthe endometrial epithelium (39, 40). In fact, in vitro studies haveshown that HGF/SF can stimulate invasion of endometrial carcinomacell lines that express MET (41).
Hence, on the basis of the postulated functions of CAV1 and MET,we speculate that MET represents a more attractive candidate targetfor gene amplification than does CAV1. In fact, numerous reports haveemerged that implicate MET in tumor development. Specifically,up-regulation of MET transcripts has been observed in a variety ofhuman cancers, suggesting a broad role for this receptor. Althoughoverexpression of MET has been detected in various carcinomas,including gastric (5), ovarian (42), breast (43), thyroid (44), colorectal(45), and even in endometrial carcinomas (46), as well as in mu-coskeletal tumors (47). MET amplification has only been reportedfrom human gastric carcinomas (5) and gliomas (48, 49). Thus, thepresent study is unique in that it is the first to demonstrate amplifi-cation of Met, in addition to overexpression, in endometrial carcino-mas. There have also been reports of activating point mutations inhuman MET in certain tumor types (23, 24). We did not find any Metpoint mutations in the present material. Actually, this would probablynot be expected, at least not in tumors showing amplification. It isknown that the DNA sequence of amplified genes is seldom altered;instead, it appears that it is the up-regulation of the unchangedwild-type gene that contributes to tumor development (50).
Carcinomas are derived from epithelial tissues that normally ex-press Met. Thus, it is not unexpected that the expression of MetmRNA was seen in all of the rat carcinomas studied. Somewhatsurprisingly, the gene for the Met ligand, Hgf, was expressed (inabsence Hgf amplification) in two tumors. In one of them (RUT30),the Hgf expression was quite weak, and in this tumor, the receptorgene appeared to be down-regulated (no Met protein was detectable inthe Western blot; Fig. 7), making an autocrine stimulation mechanismless likely in this tumor. In contrast, the other tumor (RUT7) exhibitedquite strong Hgf expression in conjunction with a 7-fold Met ampli-fication and strong expression of both Met mRNA and Met protein.Thus, one might speculate that an autocrine feedback loop is operatingin this particular tumor, as compared with the paracrine HGF/SFstimulation generally suggested for cells of epithelial origin. RUT7was also the only tumor displaying amplification of Met but not ofCdk6. In fact, there was a reduced copy number and weak expressionof Cdk6 in this tumor.
Although gene amplification is frequently observed in cancer, themechanisms underlying the process have yet to be described insignificant detail. Several models have been proposed to account for
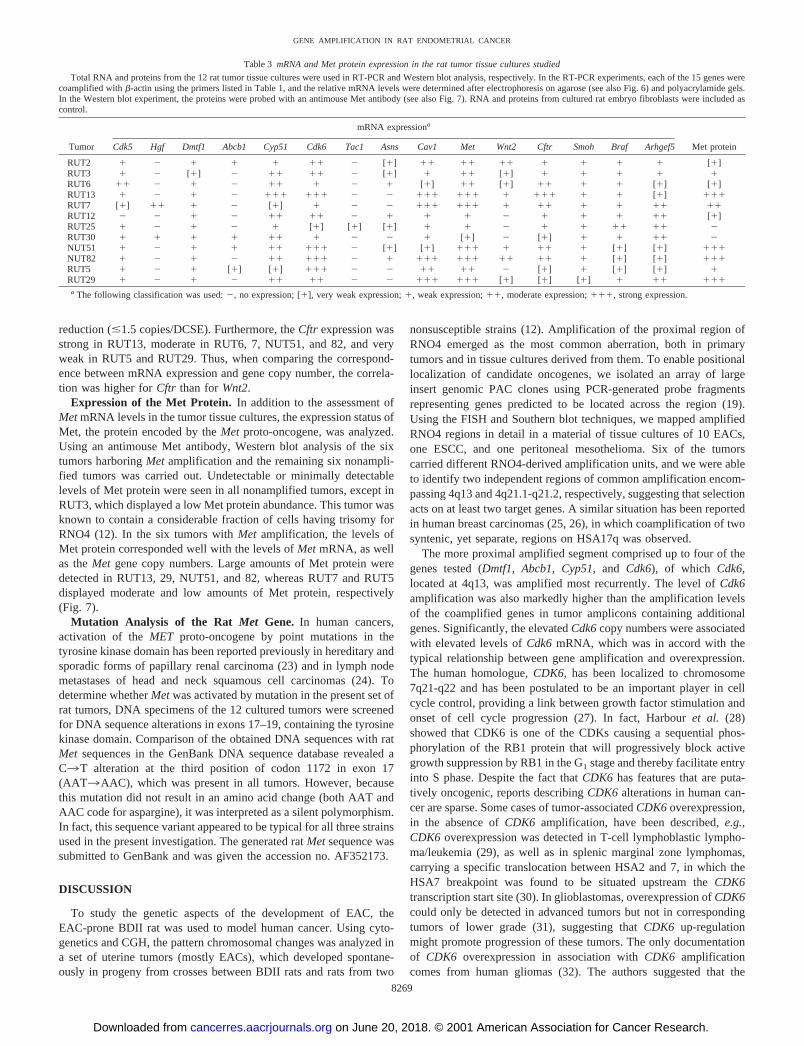
Fig. 6. Analysis of mRNA levels in rat tumor tissue cultures. cDNA from the 12 tumorcultures, as well as from rat embryonic cells (data not shown), was used as template forPCR amplification. A 146-bp �-actin fragment was coamplified with each of the 15analyzed genes, as a relative comparison. The PCR products were analyzed on agarosegels. The panels display the results from RT-PCR of Hgf (335 bp), Cdk6 (344 bp), Tac1(312 bp), Cav1 (392 bp), Met (317 bp), and Wnt2 (262 bp). The relative levels ofexpression were estimated from the gel photographs, but in some cases, more exact valueswere obtained by analysis in the ABI 377 instrument using the Genescan software. Theresults from the analysis are shown in Table 3.
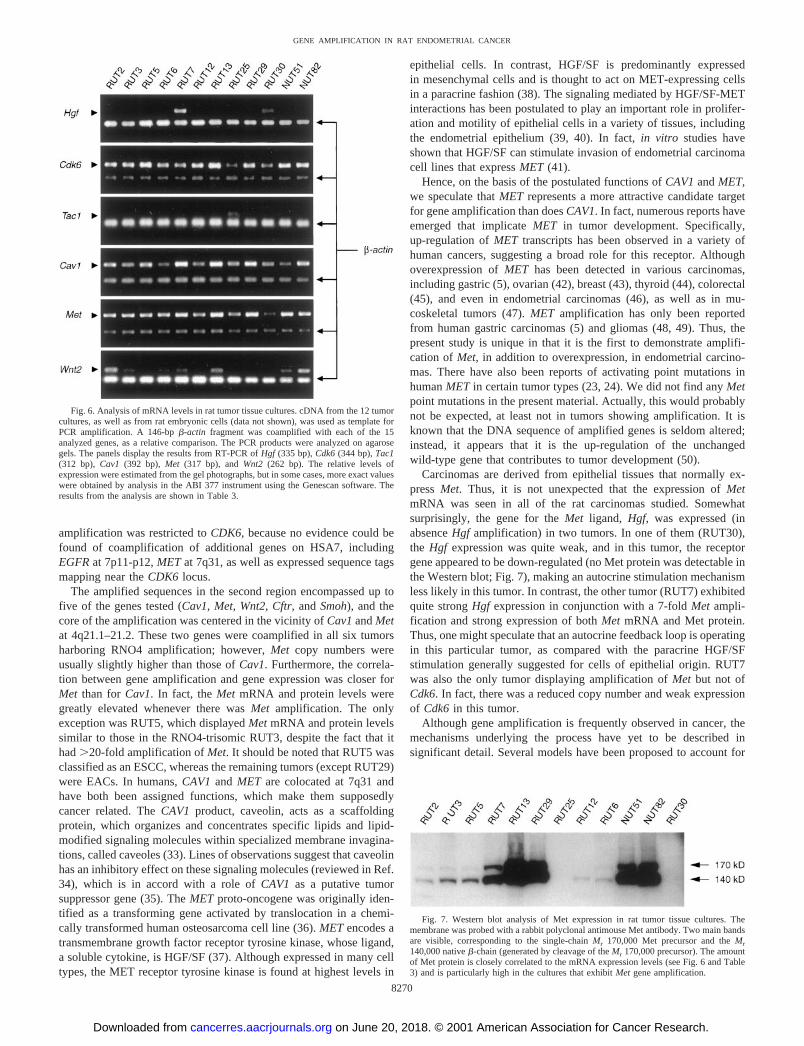
Fig. 7. Western blot analysis of Met expression in rat tumor tissue cultures. Themembrane was probed with a rabbit polyclonal antimouse Met antibody. Two main bandsare visible, corresponding to the single-chain Mr 170,000 Met precursor and the Mr
140,000 native �-chain (generated by cleavage of the Mr 170,000 precursor). The amountof Met protein is closely correlated to the mRNA expression levels (see Fig. 6 and Table3) and is particularly high in the cultures that exhibit Met gene amplification.
8270
GENE AMPLIFICATION IN RAT ENDOMETRIAL CANCER
on June 20, 2018. © 2001 American Association for Cancer Research.cancerres.aacrjournals.org Downloaded from

the formation of intrachromosomal amplification (reviewed in Refs. 2and 51). An attractive model, which may, at least in part, explain theformation of the large and sometimes discontinuously ladder-likechromosomal configuration of the amplified sequences observed inthe present tumor material, is the one proposed by Coquelle et al. (52).According to this model, amplification relies on double-strandedchromosome breakage at a minimum of two sites, possibly fragilesites, which bracket the region to become amplified. The initialbreakage occurs at a site telomeric to the gene destined to becomeamplified and is followed by a sister-chromatid fusion at the break,yielding a dicentric bridge, which undergoes a second breakage duringmitotic segregation, at a site proximal to the gene. The new chromo-some breakage will trigger a new round of fusion and breakage, and,if there is selection pressure favoring multiple copies of the targetgene, these cycles of breakage-fusion-bridge events could eventuallygive rise to arrays of intrachromosomal amplification, containinglarge regular inverted repeats (52). At later stages during the ampli-fication process, when the selective pressure is relieved, the breakage-fusion-bridge cycles may be perpetuated by breakage at random sitesalong the bridge. This could explain a pattern of discontinuous “mixedladder” organization of amplified sequences, such as that observed inNUT82 for the Cdk6 gene (Fig. 5E), in which the initial regularspacing is altered. There are several examples of the occurrence offragile sites flanking amplified regions in tumors. Coamplification ofseveral genes in band 11q13 is a common finding in many humancancers (9, 53). According to Coquelle et al. (52), at least three fragilesites are located in the vicinity of this chromosome region, includingFRA11A at 11q13.3, FRA11F at 11q14.2, and FRA11H at 11q13.Shuster et al. (53) suggested that FRA11A might be involved in theamplification process of 11q13 in oral squamous cell carcinomas. Theamplified RNO4 region studied here shares homology with the longarm of HSA7. Several fragile sites have been suggested to be locatedthere, including FRA7E at 7q21.2, FRA7F at 7q22, FRA7G at 7q31.2,and FRA7H at 7q32.3 (54). CAV1 and MET were found to map nearFRA7G (35, 54), whereas CDK6, at 7q21-q22, could be located in thevicinity of FRA7E and/or FRA7F.
The amplified regions delineated in the present set of tumors were,in a recurrent manner, flanked by regions displaying reductions ingene copy number, compared with the normal 2 copies/DCSE. Notonly was the Asns gene never included in either of the amplicons, theAsns copy number was actually reduced in three of the six tumors withRNO4 amplification, implying that a region including the Asns genemight be deleted in cells from these tumors. Amplifications accom-panied by adjacent deletions have also been observed in HSA11q13 inhuman head and neck carcinomas (55) and in HSA17q12-q21 inbreast cancer (7). Thus, it would be tempting to speculate that loss ofchromosomal material adjacent to amplifications may occur as a partof the process leading to amplification. However, exactly how thiscould take place and whether or not these amplification-associateddeletions represent pathways for tumor suppressor gene inactivationremains to be elucidated.
The identification of amplified genes in tumors may provide someinsights into the pathogenesis of the neoplasms and may consequentlybe of a certain prognostic value. In many human tumors studied todate, gene amplification is often strongly associated with an aggres-sive behavior and poor outcome, e.g., MYCN amplification in neuro-blastoma patients has been found to be correlated with an advancedstage and a rapid disease progression (56, 57) and serves today as avaluable prognostic marker for this disease. Likewise, MET amplifi-cation and/or overexpression has been correlated with depth of tumorinvasion and lymph node metastasis in gastric carcinomas (5). Inendometrial carcinoma, pathological features have been used forprognostic purposes, such as histological type, grade of differentia-
tion, depth of myometrial invasion, and the occurrence of lymph nodemetastases (58). In addition, other prognostic factors in endometrialcarcinoma are currently being investigated, including estrogen andprogesterone receptor status, c-ERBB-2 status, and tumor ploidy (59,60). Interestingly, Wagatsuma et al. (46) showed that there was acorrelation between MET expression and prognosis in patients withendometrial carcinoma.
The major reason to use an animal system to model a humancomplex disease, such as endometrial cancer, is that the heterogeneityin genetic and environmental factors, inherent in the human popula-tion, may be greatly reduced in the model. Because the susceptibilityto spontaneously arising EAC tumors is clearly inherited from theBDII strain, and because the gene pool size and environmental vari-ation is kept at a minimum, one might expect that the variation ingenetic changes within the tumors would also be quite limited. How-ever, gross chromosomal changes, detectable by cytogenetics and/orCGH, were still found to be quite variable among these tumors (12).In the present study, 15 cases of gene amplification were detected in11 tumor cultures, involving eight different chromosomes (Table 2).This gives a clear indication that in cancer development, there must bemany possible pathways of genetic changes that may lead to the sameend, even in a system of reduced variability, such as the one studiedhere. The challenge is to identify and characterize each of thesepathways. In our material, one change stood out: amplification in theproximal part of RNO4, which was detected by CGH in five tumors,but another one (RUT5) was added after the higher resolution analysiswith individual gene probes had been performed. Thus, it seems clearthat amplifications involving this particular chromosome region arepart of a major pathway toward malignancy in this model.
The six tumors exhibiting amplification in proximal RNO4 be-longed to three different tumor types, according to the pathologicalanalysis. Four of them (RUT7, 13, NUT51, and 82), however, repre-sented the EAC tumor type that is typical for the BDII strain. Of these,RUT7 exhibited amplification only in the more distal region, and, asmentioned above, the finding of Hgf expression in this tumor providesa possible growth-stimulating mechanism involving an autocrine loop,which might contribute to the malignant phenotype. For the remainingtumors (three EACs, an ESCC, and a peritoneal mesothelioma), thecombination of amplification and overexpression of Cdk6 and Metprovides suggestive evidence for their interaction in a pathway lead-ing to the malignant transformation, although at this stage, the detailsof this putative interaction is not clear. Obviously, it cannot be ruledout that other cancer-related genes might be situated inside the am-plicons and affect the development of these tumors. However, theknown functions of Cdk6 and Met in cell cycle progression andproliferation/motility, respectively, make them attractive candidates toplay important roles in the genesis or progression of the rat tumorsstudied. It would be of interest to determine whether the correspond-ing pathways are involved in the development of human endometrialcancer and other human malignant tumors.
ACKNOWLEDGMENTS
We thank Elisabet Magnusson and Brita Bjonness at the Department of Celland Molecular Biology–Genetics, Goteborg University, for excellent technicalassistance. We also thank Anna Danielsson for help with densitometricalanalysis of Southern blot data and Gyorgy Horvath, both at the Department ofOncology, Sahlgrenska University Hospital, Goteborg University, for com-ments on the manuscript.
REFERENCES
1. Vogelstein, B., and Kinzler, K. W. The multistep nature of cancer. Trends Genet., 9:138–141, 1993.
8271
GENE AMPLIFICATION IN RAT ENDOMETRIAL CANCER
on June 20, 2018. © 2001 American Association for Cancer Research.cancerres.aacrjournals.org Downloaded from
2. Schwab, M. Oncogene amplification in solid tumors. Semin. Cancer Biol., 9: 319–325, 1999.
3. Schwab, M., and Amler, L. C. Amplification of cellular oncogenes: a predictor ofclinical outcome in human cancer. Genes Chromosomes Cancer, 1: 181–193, 1990.
4. Brodeur, G. M., and Hogarty, M. D. Gene amplification in human cancers: biologicaland clinical significance. In: B. Vogelstien and K. W. Kinzler (eds.), The GeneticBasis of Human Cancer, pp. 161–172. New York: McGraw-Hill, Inc., 1998.
5. Nakajima, M., Sawada, H., Yamada, Y., Watanabe, A., Tatsumi, M., Yamashita, J.,Matsuda, M., Sakaguchi, T., Hirao, T., and Nakano, H. The prognostic significanceof amplification and overexpression of c-met and c-erb B-2 in human gastric carci-nomas. Cancer, 85: 1894–1902, 1999.
6. Amler, L. C., and Schwab, M. Amplified N-myc in human neuroblastoma cells isoften arranged as clustered tandem repeats of differently recombined DNA. Mol. Cell.Biol., 9: 4903–4913, 1989.
7. Jarvinen, T. A., Tanner, M., Barlund, M., Borg, A., and Isola, J. Characterization oftopoisomerase II � gene amplification and deletion in breast cancer. Genes Chromo-somes Cancer, 26: 142–150, 1999.
8. Collins, V. P. Gene amplification in human gliomas. Glia, 15: 289–296, 1995.9. Schuuring, E. The involvement of the chromosome 11q13 region in human malig-
nancies: Cyclin D1 and EMS1 are two new candidate oncogenes–a review. Gene,159: 83–96, 1995.
10. Press, M. F. Gynecologic cancers. Cancer Suppl., 83: 1751–1756, 1998.11. Deerberg, F., and Kaspareit, J. Endometrial carcinoma in BDII/Han rats: model of a
spontaneous hormone-dependent tumor. J. Natl. Cancer Inst. (Bethesda), 78: 1245–1251, 1987.
12. Helou, K., Walentinsson, A., Beckmann, B., Johansson, Å., Hedrich, H. J., Szpirer,C., Klinga-Levan, K., and Levan, G. Analysis of genetic changes in rat endometrialcarcinomas by means of comparative genome hybridization. Cancer Genet. Cyto-genet., 127: 118–127, 2001.
13. Helou, K., Wallenius, V., Qiu, Y., Ohman, F., Ståhl, F., Klinga-Levan, K., Kindblom,L-G., Jansson, J-O., and Levan, G. Amplification and overexpression of the hepato-cyte growth factor receptor (HGFR/MET) in rat DMBA sarcomas. Oncogene, 18:3226–3234, 1999.
14. Walentinsson, A., Sjoling, Å., Helou, K., Klinga-Levan, K., and Levan, G. Genome-wide assessment of genetic alterations in DMBA-induced rat sarcomas: cytogenetic,CGH and allelotype analyses reveal recurrent DNA copy number changes in ratchromosome 1, 2, 4, and 7. Genes Chromosomes Cancer, 28: 184–195, 2000.
15. Helou, K., Walentinsson, A., Kost-Alimova, M., and Levan, G. Hgfr/Met oncogeneacts as target for gene amplification in DMBA-induced rat sarcomas: free chromatinFISH analysis of amplicon arrays in homogeneously staining regions. Genes Chro-mosomes Cancer, 30: 416–420, 2001.
16. Kaspareit-Rittinghausen, J., Deerberg, F., and Rapp, K. Mortality and incidence ofspontaneous neoplasms in BDII/Han rats. Z. Verstierkd., 30: 209–216, 1987.
17. Helou, K., Walther, L., Gunther, E., and Levan, G. Cytogenetic orientation of the ratmajor histocompatibility complex (MHC) on chromosome 20. Immunogenetics, 47:166–169, 1998.
18. Islam, M. Q., and Levan, G. A new fixation procedure for improved quality G-bandsin routine cytogenetic work. Hereditas, 107: 127–130, 1987.
19. Walentinsson, A., Helou, K., and Levan, G. A dual-color FISH gene map of theproximal region of rat chromosome 4 and comparative analysis in human and mouse.Mamm. Genome, in press, 2001.
20. Pinkel, D., Landegent, J., Collins, C., Fuscose, J., Segraves, R., Lucas, J., and Gray,J. Fluorescence in situ hybridization with human chromosome-specific libraries:detection of trisomy 21 and translocations of chromosome 4. Proc. Natl. Acad. Sci.USA, 85: 9138–9142, 1988.
21. Feinberg, A. P., and Vogelstein, B. A technique for radiolabeling DNA restrictionendonuclease fragments to high specific activity. Anal. Biochem., 132: 6–13, 1983.
22. Piper, J., Rutovitz, D., Sudar, D., Kallioniemi, A., Kallioniemi, O. P., Waldman,F. M., Gray, J. W., and Pinkel, D. Computer image analysis of comparative genomichybridization. Cytometry, 19: 10–26, 1995.
23. Schmidt, L., Duh, F-M., Chen, F., Kishida, T., Glenn, G., Choyke, P., Scherer, S. W.,Zhuang, Z., Lubensky, I., Dean, M., Allikmets, R., Chidambaram, A., Bergerheim,U. R., Feltis, J. T., Casadevall, C., Zamarron, A., Bernues, M., Richard, S., Lips,C. J. M., Walther, M. M., Tsui, L-C., Geil, L., Orcutt, M. L., Stackhouse, T., Lipan,J., Slife, L., Brauch, H., Decker, J., Niehans, G., Hughson, M. D., Moch, H., Storkel,S., Lerman, M. I., Linehan, W. M., and Zbar, B. Germline and somatic mutations inthe tyrosine kinase domain of the MET proto-oncogene in papillary renal carcinomas.Nat. Genet., 16: 68–73, 1997.
24. Di Renzo, M. F., Olivero, M., Martone, T., Maffe, A., Maggiora, P., Stefani, A. D.,Valente, G., Giordano, S., Cortesina, G., and Comogli, O. P. M. Somatic mutationsof the MET oncogene are selected during metastatic spread of human HNSC carci-nomas. Oncogene, 19: 1547–1555, 2000.
25. Barlund, M., Tirkkonen, M., Forozan, F., Tanner, M. M., Kallioniemi, O., andKallioniemi, A. Increased copy number at 17q22–q24 by CGH in breast cancer is dueto high-level amplification of two separate regions. Genes Chromosomes Cancer, 20:372–376, 1997.
26. Latham, C., Zhang, A., Nalbanti, A., Måner, S., Zickert, P., Blegen, H., andZetterberg, A. Frequent co-amplification of two different regions on 17q in aneuploidbreast carcinomas. Cancer Genet. Cytogenet., 127: 16–23, 2001.
27. Meyerson, M., and Harlow, E. Identification of G1 kinase activity for cdk6, a novelcyclin D partner. Mol. Cell. Biol., 14: 2077–2086, 1994.
28. Harbour, J. W., Luo, R. X., Dei Santi, A., Postigo, A. A., and Dean, D. C. Cdkphosphorylation triggers sequential intramolecular interactions that progressivelyblock Rb functions as cells move through G1. Cell, 98: 859–869, 1999.
29. Chilosi, M., Doglioni, C., Yan, Z., Lestani, M., Menestrina, F., Sorio, C., Benedetti,A., Vinante, F., Pizzolo, G., and Inghirami, G. Differential expression of cyclin-dependent kinase 6 in cortical thymocytes and T-cell lymphoblastic lymphoma/leukemia. Am. J. Pathol., 152: 209–217, 1998.
30. Corcoran, M. M., Mould, S. J., Orchard, J. A., Ibbotson, R. E., Chapman, R. M.,Boright, A. P., Platt, C., Tsui, L. C., Scherer, S. W., and Oscier, D. G. Dysregulationof cyclin dependent kinase 6 expression in splenic marginal zone lymphoma throughchromosome 7q translocations. Oncogene, 18: 6271–6277, 1999.
31. Lam, P. Y., Di Tomaso, E., Ng, H. K., Pang, J. C., Roussel, M. F., and Hjelm, N. M.Expression of p19INK4d, CDK4, CDK6 in glioblastoma multiforme. Br. J. Neuro-surg., 14: 28–32, 2000.
32. Costello, J. F., Plass, C., Arap, W., Chapman, V. M., Held, W. A., Berger, M. S., SuHuang, H. J., and Cavenee, W. K. Cyclin-dependent kinase 6 (CDK6) amplificationin human gliomas identified using two-dimensional separation of genomic DNA.Cancer Res., 57: 1250–1254, 1997.
33. Engelman, J. A., Zhang, X., Galbiati, F., Volonte, D., Sotgia, F., Pestell, R. G.,Minetti, C., Scherer, P. E., Okamoto, T., and Lisanti, M. P. Molecular genetics of thecaveolin gene family: implications for human cancers, diabetes, Alzheimer disease,and muscular dystrophy. Am. J. Hum. Genet., 63: 1578–1587, 1998.
34. Okamoto, T., Schlegel, A., Scherer, P. E., and Lisanti, M. P. Caveolins, a family ofscaffolding proteins for organizing “preassembled signaling complexes” at the plasmamembrane. J. Biol. Chem., 273: 5419–5422, 1998.
35. Engelman, J. A., Zhang, X. L., and Lisanti, M. P. Genes encoding human caveolin-1and -2 are co-localized to the D7S522 locus (7q31.1), a known fragile site (FRA7G)that is frequently deleted in human cancers. FEBS Lett., 436: 403–410, 1998.
36. Cooper, C. S., Park, M., Blair, D. G., Tainsky, M. A., Huebner, K., Croce, C. M., andVande Woude, G. F. Molecular cloning of a new transforming gene from a chemi-cally transformed human cell line. Nature (Lond.), 311: 29–33, 1984.
37. Maggiora, P., Gambarotta, G., Olivero, M., Giodano, S., Di Renzo, M. F., andComoglio, P. M. Control of invasive growth by the HGF receptor family. J. CellPhysiol., 173: 183–186, 1997.
38. Gherardi, E., and Stoker, M. Hepatocyte growth factor–scatter factor: mitogen,motogen, and met. Cancer Cells, 3: 227–232, 1991.
39. Weidner, K. M., Sachs, M., and Birchmeier, W. The Met receptor tyrosine kinasetransduces motility, proliferation, and morphogenic signals of scatter factor/hepato-cyte growth factor in epithelial cells. J. Cell Biol., 121: 145–154, 1993.
40. Sugawara, J., Fukaya, T., Murakami, T., Yoshida, H., and Yajima, A. Hepatocytegrowth factor stimulated proliferation, migration, and lumen formation of humanendometrial epithelial cells in vitro. Biol. Reprod., 57: 936–942, 1997.
41. Bae-Jump, V., Segreti, E. M., and Vandermolen, D. Hepatocyte growth factor (HGF)induces invasion of endometrial carcinoma cell lines in vitro. Gynecol. Oncol., 73:265–272, 1999.
42. Di Renzo, M. F., Olivero, M., Katsaros, D., Crepaldi, T., Gaglia, P., Zola, P.,Sismondi, P., and Comoglio, P. M. Overexpression of the Met/HGF receptor inovarian cancer. Int. J. Cancer, 58: 658–662, 1994.
43. Beviglia, L., Matsumoto, K., Lin, C. S., Ziober, B. L., and Kramer, R. H. Expressionof the c-Met/HGF receptor in human breast carcinoma: correlation with tumorprogression. Int. J. Cancer, 74: 301–309, 1997.
44. Di Renzo, M. F., Olivero, M., Ferro, S., Prat, M., Bongarzone, I., Pilotti, S., Belfiore,A., Costantino, A., Vigneri, R., and Pierotti, M. A. Overexpression of the c-MET/HGF receptor gene in human thyroid carcinomas. Oncogene, 7: 2549–2553, 1992.
45. Di Renzo, M. F., Olivero, M., Giacomini, A., Porte, H., Chastre, E., Mirossay, L.,Nordlinger, B., Bretti, S., Bottardi, S., and Giordano, S. Overexpression and ampli-fication of the met/HGF receptor gene during the progression of colorectal cancer.Clin. Cancer Res., 1: 147–154, 1995.
46. Wagatsuma, S., Konno, R., Sato, S., and Yajima, A. Tumor angiogenesis, hepatocytegrowth factor, and c-Met expression in endometrial carcinoma. Cancer (Phila.), 82:520–530, 1998.
47. Wallenius, V., Hisaoka, M., Helou, K., Levan, G., Mandahl, N., Meis-Kindblom,J. M., Kindblom, L-G., and Jansson, J-O. Overexpression of the hepatocyte growthfactor (HGF) receptor (Met) and presence of a truncated and activated intracellularHGF receptor fragment in locally aggressive/malignant human musculoskeletal tu-mors. Am. J. Pathol., 156: 821–829, 2000.
48. Wullich, B., Muller, H. W., Fischer, U., Zang, K. D., and Meese, E. Amplified metgene linked to double minutes in human glioblastoma. Eur. J. Cancer, 29A: 1991–1995, 1993.
49. Fischer, U., Muller, H-W., Sattler, H-P., Feiden, K., Zang, K. D., and Meese, E.Amplification of the MET gene in glioma. Genes Chromosomes Cancer, 12: 63–65,1995.
50. Schwab, M. Amplification of oncogenes in human cancer cells. Bioessays, 20:473–479, 1998.
51. Stark, G. R., Debatisse, M., Giulotto, E., and Wahl, G. M. Recent progress inunderstanding mechanisms of mammalian DNA amplification. Cell, 57: 901–908,1989.
52. Coquelle, A., Pipiras, E., Toledo, F., Buttin, G., and Debatisse, M. Expression offragile sites triggers intrachromosomal mammalian gene amplification and setsboundaries to early amplicons. Cell, 89: 215–225, 1997.
53. Shuster, M. I., Han, L., Le Beau, M. M., Davis, E., Sawicki, M., Lese, C. M., Park,N. H., Colicelli, J., and Gollin, S. M. A consistent pattern of RIN1 rearrangements inoral squamous cell carcinoma cell lines supports a breakage-fusion-bridge cyclemodel for 11q13 amplification. Genes Chromosomes Cancer, 28: 153–163, 2000.
54. Huang, H., Qian, C., Jenkins, R. B., and Smith, D. I. Fish mapping of YAC clones at
8272
GENE AMPLIFICATION IN RAT ENDOMETRIAL CANCER
on June 20, 2018. © 2001 American Association for Cancer Research.cancerres.aacrjournals.org Downloaded from

human chromosomal band 7q31.2: identification of YACS spanning FRA7G withinthe common region of LOH in breast and prostate cancer. Genes ChromosomesCancer, 21: 152–159, 1998.
55. Jin, Y., Hoglund, M., Jin, C., Martins, C., Wennerberg, J., Akervall, J., Mandahl, N.,Mitelman, F., and Mertens, F. FISH characterization of head and neck carcinomasreveals that amplification of band 11q13 is associated with deletion of distal 11q.Genes Chromosomes Cancer, 22: 312–320, 1998.
56. Brodeur, G. M., Seeger, R. C., Schwab, M., Varmus, H. E., and Bishop, J. M.Amplification of N-myc in untreated human neuroblastomas correlates with advanceddisease stage. Science (Wash. DC), 224: 1121–1124, 1984.
57. Seeger, R. C., Brodeur, G. M., Sather, H., Dalton, A., Siegel, S. E., Wong, K. Y., and
Hammond, D. Association of multiple copies of the N-myc oncogene with rapidprogression of neuroblastomas. N. Engl. J. Med., 313: 1111–1116, 1985.
58. Boronow, R. C., Morrow, C. P., Creasman, W. T., Disaia, P. J., Silverberg, S. G.,Miller, A., and Blessing, J. A. Surgical staging in endometrial cancer: clinical-pathologic findings of a prospective study. Obstet. Gynecol., 63: 825–832, 1984.
59. Chew, S. H. Prognostic factors in endometrial carcinoma. Ann. Acad. Med. Singap.,28: 266–271, 1999.
60. Susini, T., Rapi, S., Massi, D., Savino, L., Amunni, G., Taddei, G. L., and Massi, G.Preoperative evaluation of tumor ploidy in endometrial carcinoma: an accurate tool toidentify patients at risk for extrauterine disease and recurrence. Cancer (Phila.), 86:1005–1012, 1999.
8273
GENE AMPLIFICATION IN RAT ENDOMETRIAL CANCER
on June 20, 2018. © 2001 American Association for Cancer Research.cancerres.aacrjournals.org Downloaded from

2001;61:8263-8273. Cancer Res Anna Walentinsson, Khalil Helou, Ville Wallenius, et al. Molecular CharacterizationChromosome 4 in Rat Endometrial Cancer: Identification and Independent Amplification of Two Gene Clusters on
Updated version
http://cancerres.aacrjournals.org/content/61/22/8263
Access the most recent version of this article at:
Cited articles
http://cancerres.aacrjournals.org/content/61/22/8263.full#ref-list-1
This article cites 57 articles, 9 of which you can access for free at:
E-mail alerts related to this article or journal.Sign up to receive free email-alerts
Subscriptions
Reprints and
To order reprints of this article or to subscribe to the journal, contact the AACR Publications
Permissions
Rightslink site. Click on "Request Permissions" which will take you to the Copyright Clearance Center's (CCC)
.http://cancerres.aacrjournals.org/content/61/22/8263To request permission to re-use all or part of this article, use this link
on June 20, 2018. © 2001 American Association for Cancer Research.cancerres.aacrjournals.org Downloaded from