independence group nl - igo
TRANSCRIPT
INDEPENDENCE GROUP NL
2 May 2019
ASX:IGO | ADR:IIDDY
Macquarie Australia Conference
Peter Bradford – Managing Director & CEO
Cautionary Statements & Disclaimer
2
• This presentation has been prepared by Independence Group NL (“IGO”) (ABN 46 092 786 304). It should not be considered as an offer or invitation to subscribe for or purchase any
securities in IGO or as an inducement to make an offer or invitation with respect to those securities in any jurisdiction.
• This presentation contains general summary information about IGO. The information, opinions or conclusions expressed in the course of this presentation should be read in conjunction with
IGO’s other periodic and continuous disclosure announcements lodged with the ASX, which are available on the IGO website. No representation or warranty, express or implied, is made in
relation to the fairness, accuracy or completeness of the information, opinions and conclusions expressed in this presentation.
• This presentation includes forward looking information regarding future events, conditions, circumstances and the future financial performance of IGO. Often, but not always, forward looking
statements can be identified by the use of forward looking words such as "may", "will", "expect", "intend", "plan", "estimate", "anticipate", "continue" and "guidance", or other similar words and
may include statements regarding plans, strategies and objectives of management, anticipated production or construction commencement dates and expected costs or production outputs.
Such forecasts, projections and information are not a guarantee of future performance and involve unknown risks and uncertainties, many of which are beyond IGO’s control, which may cause
actual results and developments to differ materially from those expressed or implied. Further details of these risks are set out below. All references to future production and production
guidance made in relation to IGO are subject to the completion of all necessary feasibility studies, permit applications and approvals, construction, financing arrangements and access to the
necessary infrastructure. Where such a reference is made, it should be read subject to this paragraph and in conjunction with further information about the Mineral Resources and Ore
Reserves, as well as any Competent Persons' Statements included in periodic and continuous disclosure announcements lodged with the ASX. Forward looking statements in this
presentation only apply at the date of issue. Subject to any continuing obligations under applicable law or any relevant stock exchange listing rules, in providing this information IGO does not
undertake any obligation to publicly update or revise any of the forward looking statements or to advise of any change in events, conditions or circumstances on which any such statement is
based.
• There are a number of risks specific to IGO and of a general nature which may affect the future operating and financial performance of IGO and the value of an investment in IGO including
and not limited to economic conditions, stock market fluctuations, commodity demand and price movements, access to infrastructure, timing of environmental approvals, regulatory risks,
operational risks, reliance on key personnel, reserve and resource estimations, native title and title risks, foreign currency fluctuations and mining development, construction and
commissioning risk. The production guidance in this presentation is subject to risks specific to IGO and of a general nature which may affect the future operating and financial performance of
IGO.
• All currency amounts in Australian Dollars unless otherwise noted.
• Quarterly Financial Results are unaudited
• Net Debt is outstanding debt less cash balances and Net Cash is cash balance less outstanding debt.
• Cash Costs are reported inclusive of Royalties and after by-product credits on per unit of payable metal basis, unless otherwise stated.
• IGO reports All-in Sustaining Costs (AISC) per ounce of gold for its 30% interest in the Tropicana Gold Mine using the World Gold Council guidelines for AISC. The World Gold Council
guidelines publication was released via press release on 27 June 2013 and is available from the World Gold Council’s website.
• Underlying EBITDA is a non-IFRS measure and comprises net profit or loss after tax, adjusted to exclude tax expense, finance costs, interest income, asset impairments, gain/loss on sale of
subsidiary, redundancy and restructuring costs, depreciation and amortisation, and once-off transaction costs.
• Free Cash Flow comprises Net Cash Flow from Operating Activities and Net Cash Flow from Investing Activities. Underlying adjustments exclude acquisition costs, proceeds from investment
sales and payments for investments.
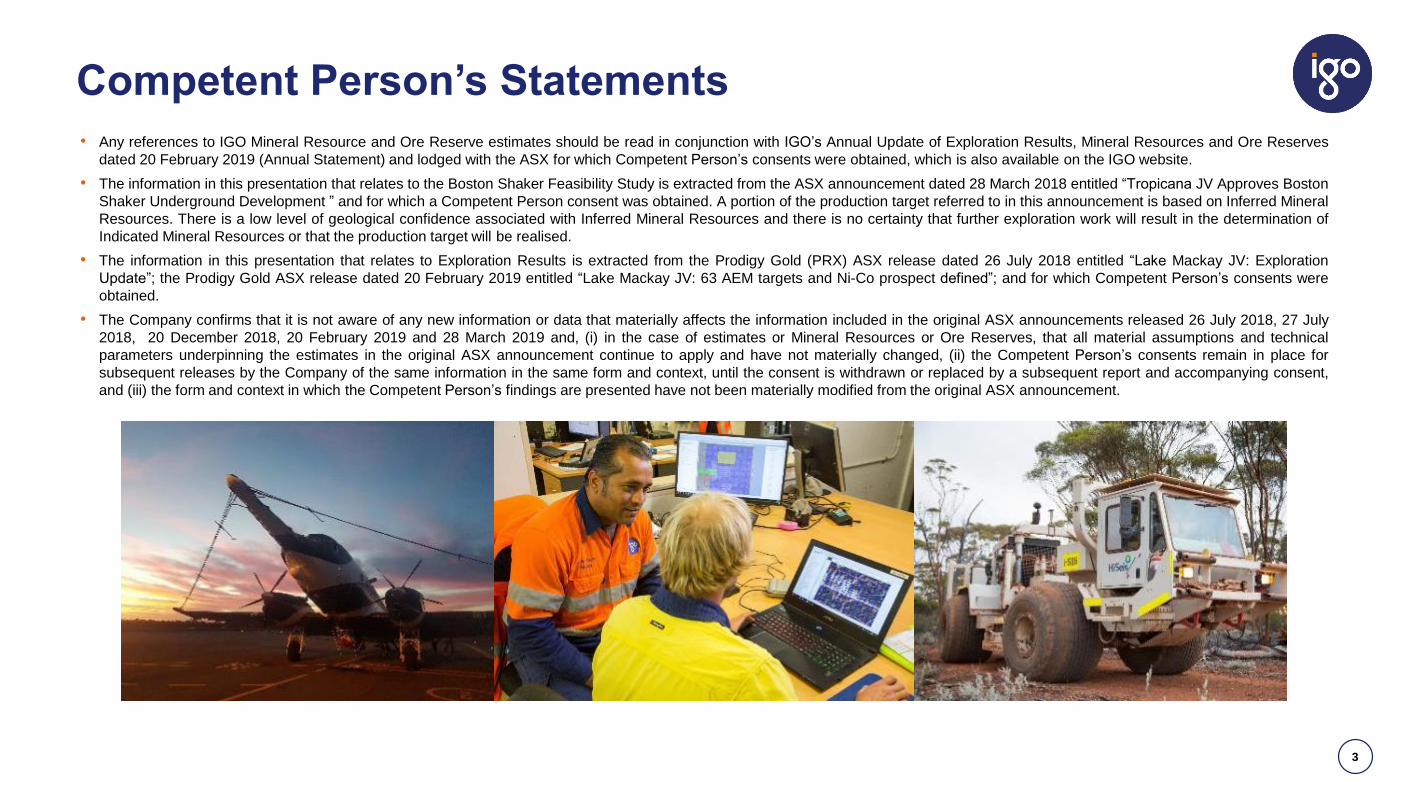
Competent Person’s Statements
3
• Any references to IGO Mineral Resource and Ore Reserve estimates should be read in conjunction with IGO’s Annual Update of Exploration Results, Mineral Resources and Ore Reserves
dated 20 February 2019 (Annual Statement) and lodged with the ASX for which Competent Person’s consents were obtained, which is also available on the IGO website.
• The information in this presentation that relates to the Boston Shaker Feasibility Study is extracted from the ASX announcement dated 28 March 2018 entitled “Tropicana JV Approves Boston
Shaker Underground Development ” and for which a Competent Person consent was obtained. A portion of the production target referred to in this announcement is based on Inferred Mineral
Resources. There is a low level of geological confidence associated with Inferred Mineral Resources and there is no certainty that further exploration work will result in the determination of
Indicated Mineral Resources or that the production target will be realised.
• The information in this presentation that relates to Exploration Results is extracted from the Prodigy Gold (PRX) ASX release dated 26 July 2018 entitled “Lake Mackay JV: Exploration
Update”; the Prodigy Gold ASX release dated 20 February 2019 entitled “Lake Mackay JV: 63 AEM targets and Ni-Co prospect defined”; and for which Competent Person’s consents were
obtained.
• The Company confirms that it is not aware of any new information or data that materially affects the information included in the original ASX announcements released 26 July 2018, 27 July
2018, 20 December 2018, 20 February 2019 and 28 March 2019 and, (i) in the case of estimates or Mineral Resources or Ore Reserves, that all material assumptions and technical
parameters underpinning the estimates in the original ASX announcement continue to apply and have not materially changed, (ii) the Competent Person’s consents remain in place for
subsequent releases by the Company of the same information in the same form and context, until the consent is withdrawn or replaced by a subsequent report and accompanying consent,
and (iii) the form and context in which the Competent Person’s findings are presented have not been materially modified from the original ASX announcement.
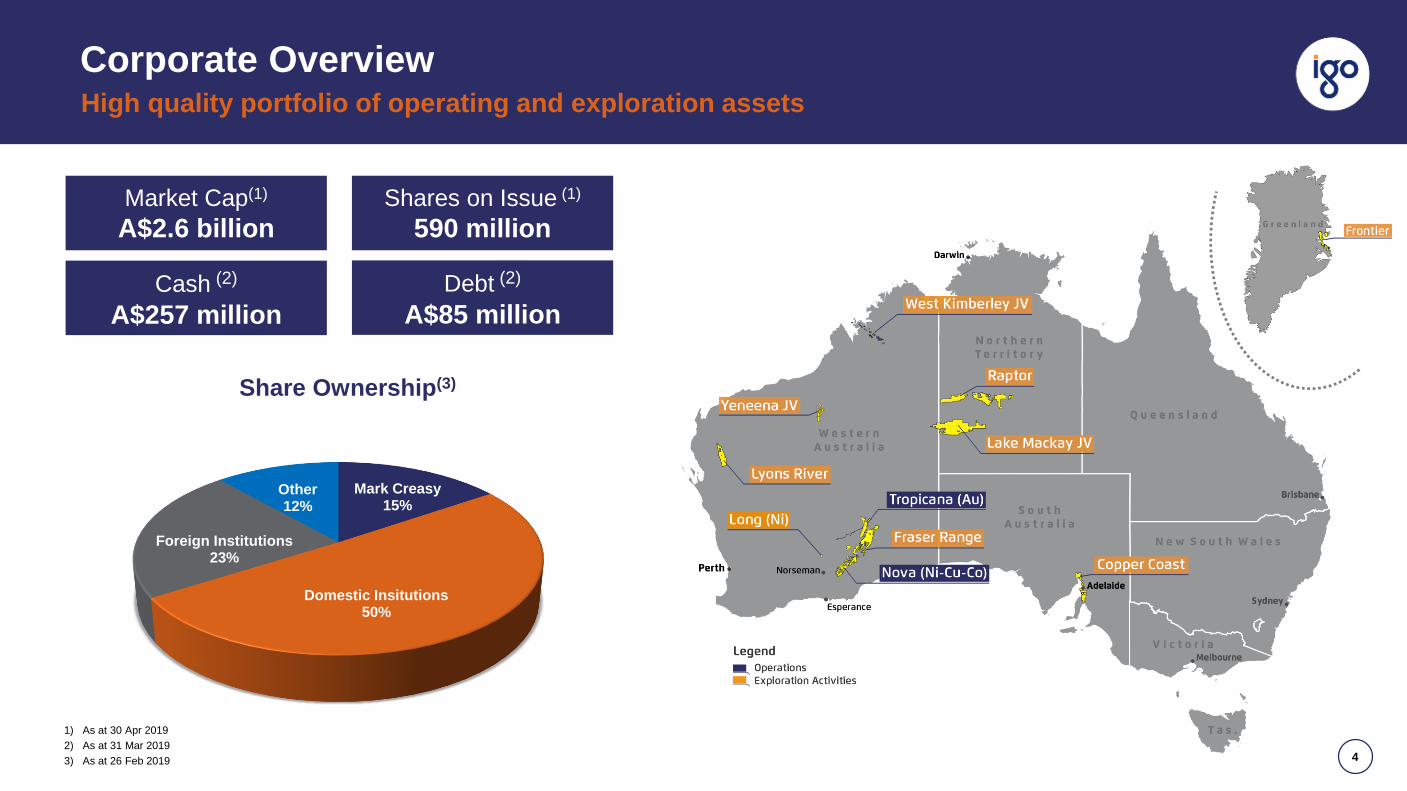
Corporate OverviewHigh quality portfolio of operating and exploration assets
1) As at 30 Apr 2019
2) As at 31 Mar 2019
3) As at 26 Feb 2019
Market Cap(1)
A$2.6 billion
Cash (2)
A$257 million
Shares on Issue (1)
590 million
Debt (2)
A$85 million
Mark Creasy15%
Domestic Insitutions50%
Foreign Institutions23%
Other12%
Share Ownership(3)
4
5
Our Purpose
6
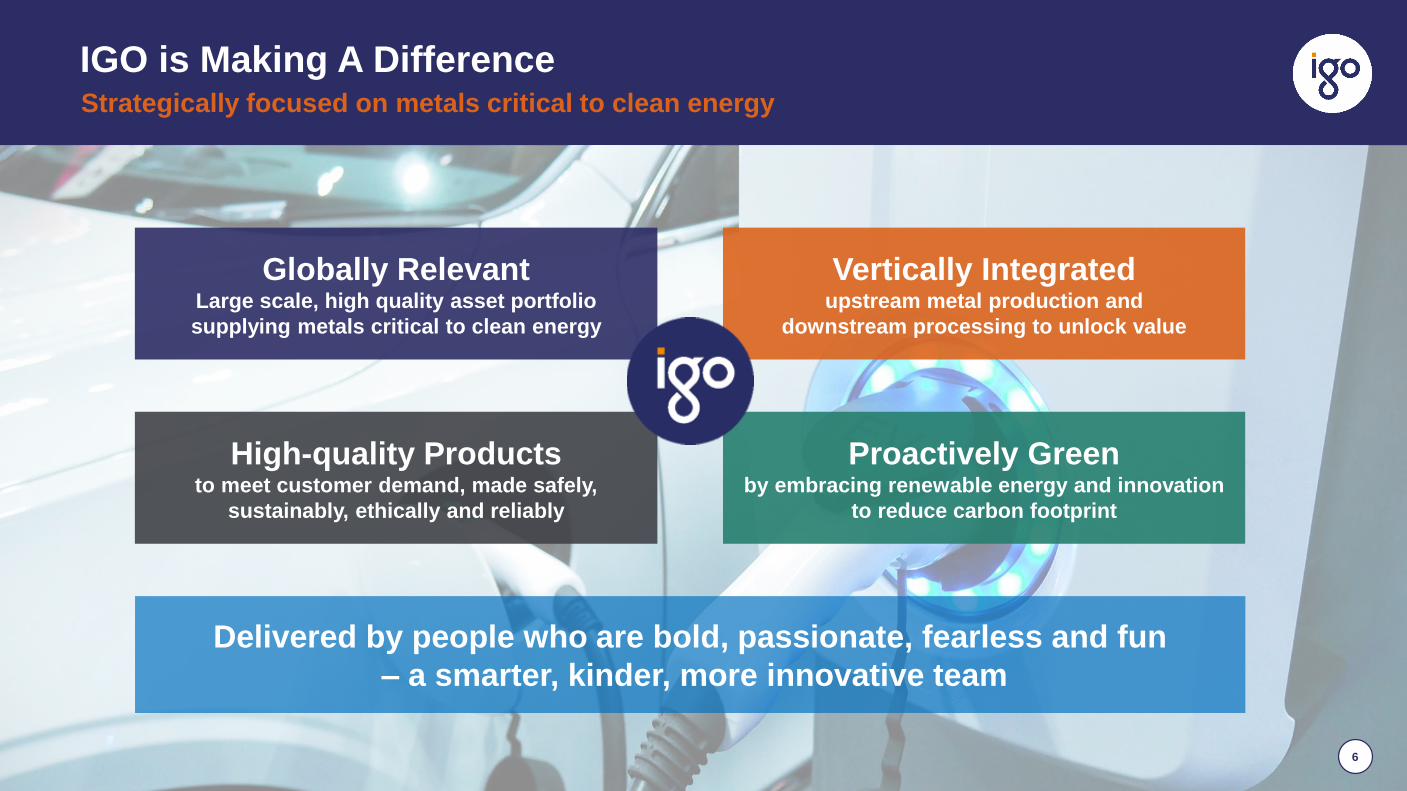
Delivered by people who are bold, passionate, fearless and fun
– a smarter, kinder, more innovative team
IGO is Making A DifferenceStrategically focused on metals critical to clean energy
Globally RelevantLarge scale, high quality asset portfolio
supplying metals critical to clean energy
Vertically Integratedupstream metal production and
downstream processing to unlock value
High-quality Productsto meet customer demand, made safely,
sustainably, ethically and reliably
Proactively Greenby embracing renewable energy and innovation
to reduce carbon footprint
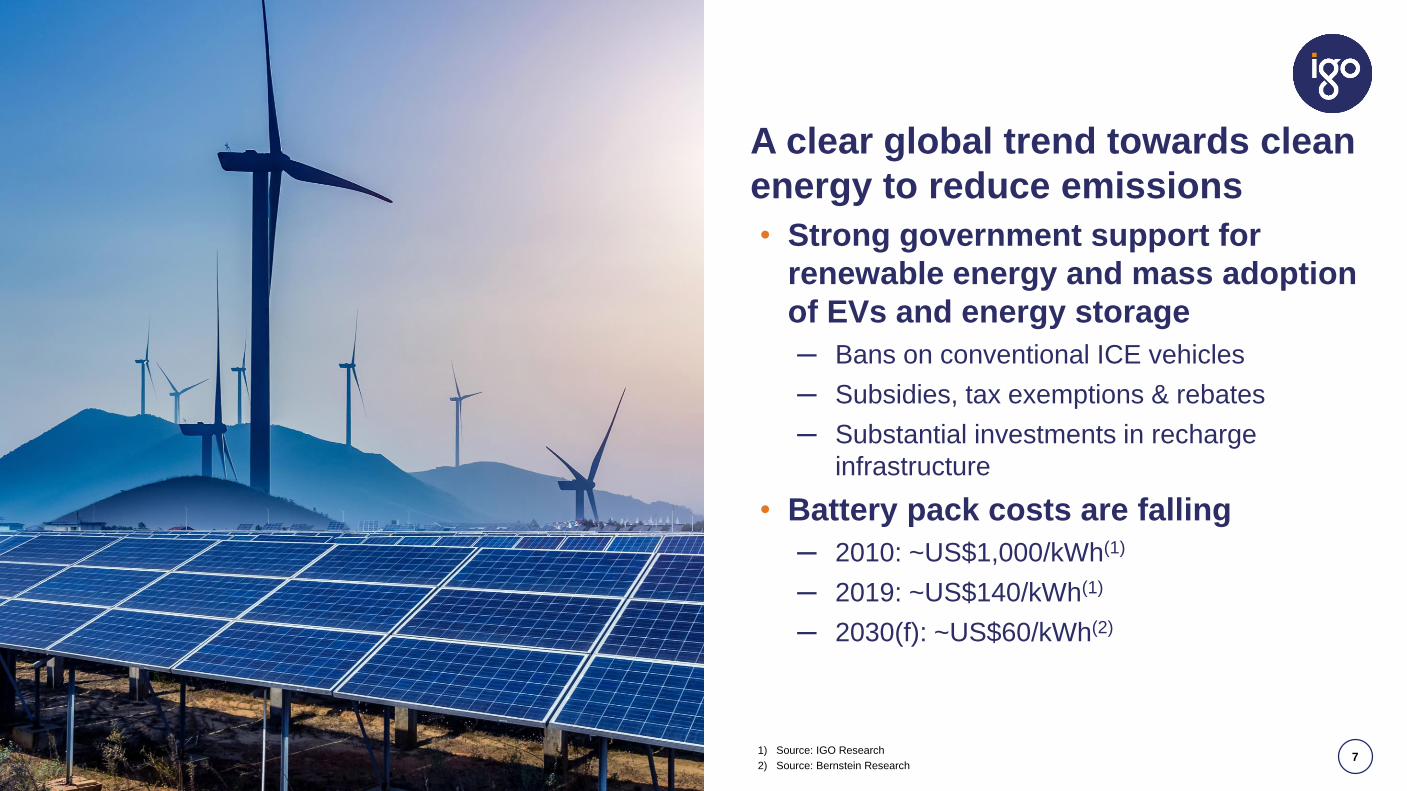
A clear global trend towards clean
energy to reduce emissions
• Strong government support for
renewable energy and mass adoption
of EVs and energy storage
─ Bans on conventional ICE vehicles
─ Subsidies, tax exemptions & rebates
─ Substantial investments in recharge
infrastructure
• Battery pack costs are falling
─ 2010: ~US$1,000/kWh(1)
─ 2019: ~US$140/kWh(1)
─ 2030(f): ~US$60/kWh(2)
71) Source: IGO Research
2) Source: Bernstein Research
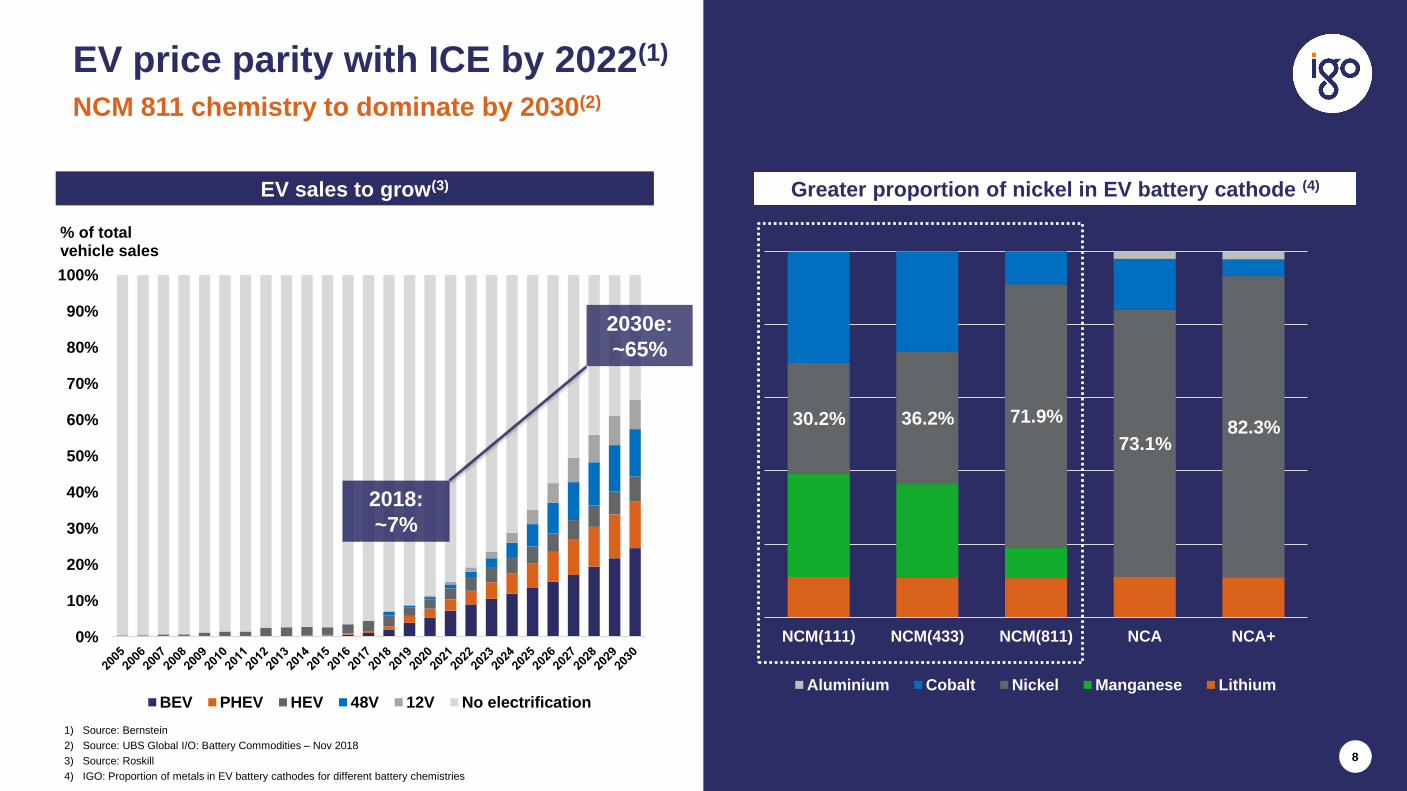
EV price parity with ICE by 2022(1)
8
NCM 811 chemistry to dominate by 2030(2)
1) Source: Bernstein
2) Source: UBS Global I/O: Battery Commodities – Nov 2018
3) Source: Roskill
4) IGO: Proportion of metals in EV battery cathodes for different battery chemistries
EV sales to grow(3)
0%
10%
20%
30%
40%
50%
60%
70%
80%
90%
100%
% of total vehicle sales
BEV PHEV HEV 48V 12V No electrification
2030e:
~65%
2018:
~7%
Greater proportion of nickel in EV battery cathode (4)
30.2% 36.2% 71.9%
73.1% 82.3%
NCM(111) NCM(433) NCM(811) NCA NCA+
Aluminium Cobalt Nickel Manganese Lithium
9
0
500
1,000
1,500
2,000
2,500
3,000
3,500
4,000
Batteries Non-ferrous alloys
Other alloy steels Plating and other
Stainless steel, Class I (critical) Stainless steel, Class I (substitutable)
Stainless steel, Class II
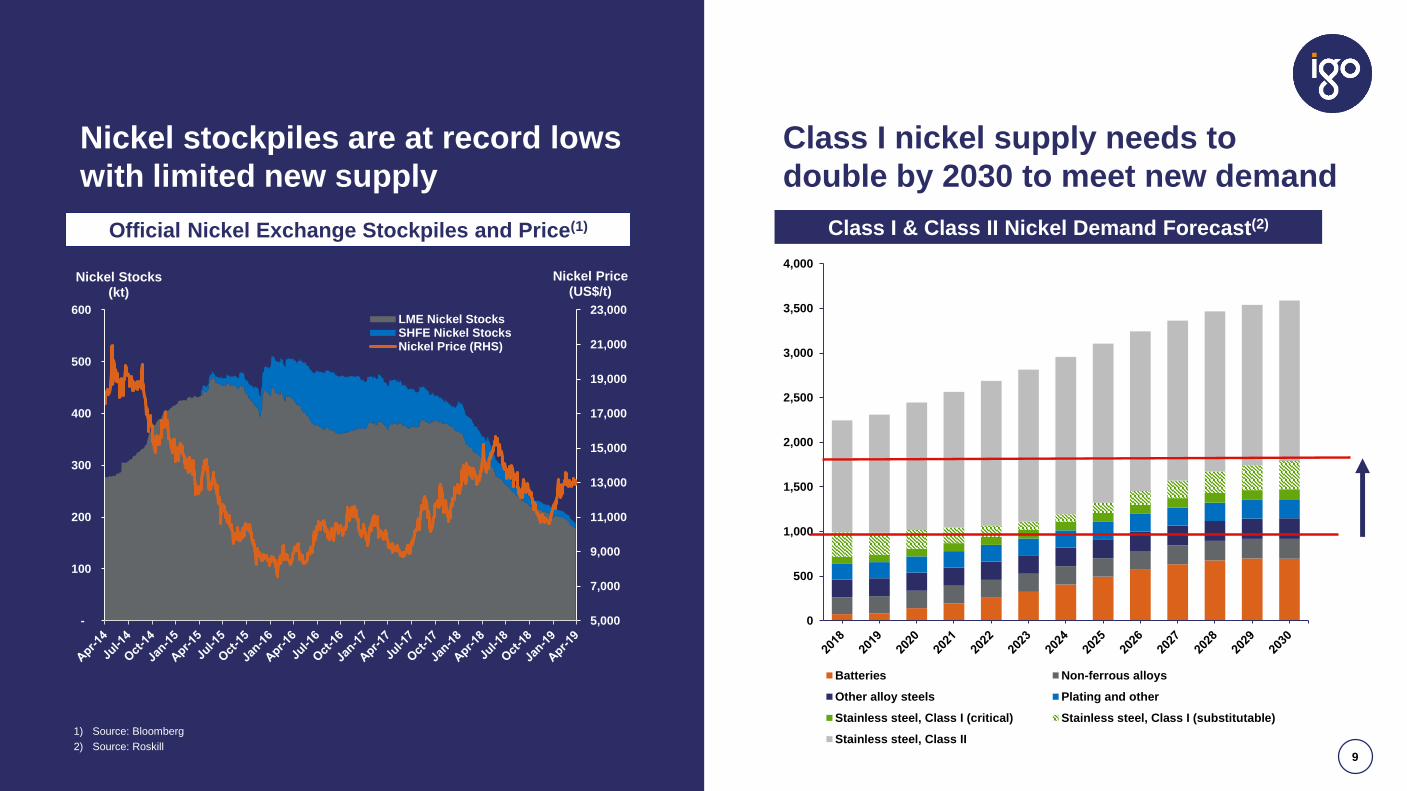
Class I & Class II Nickel Demand Forecast(2)Official Nickel Exchange Stockpiles and Price(1)
1) Source: Bloomberg
2) Source: Roskill
5,000
7,000
9,000
11,000
13,000
15,000
17,000
19,000
21,000
23,000
-
100
200
300
400
500
600
Nickel Price(US$/t)
Nickel Stocks(kt)
Th
ou
san
ds LME Nickel Stocks
SHFE Nickel StocksNickel Price (RHS)
Nickel stockpiles are at record lows
with limited new supply
Class I nickel supply needs to
double by 2030 to meet new demand
10
Financial Performance
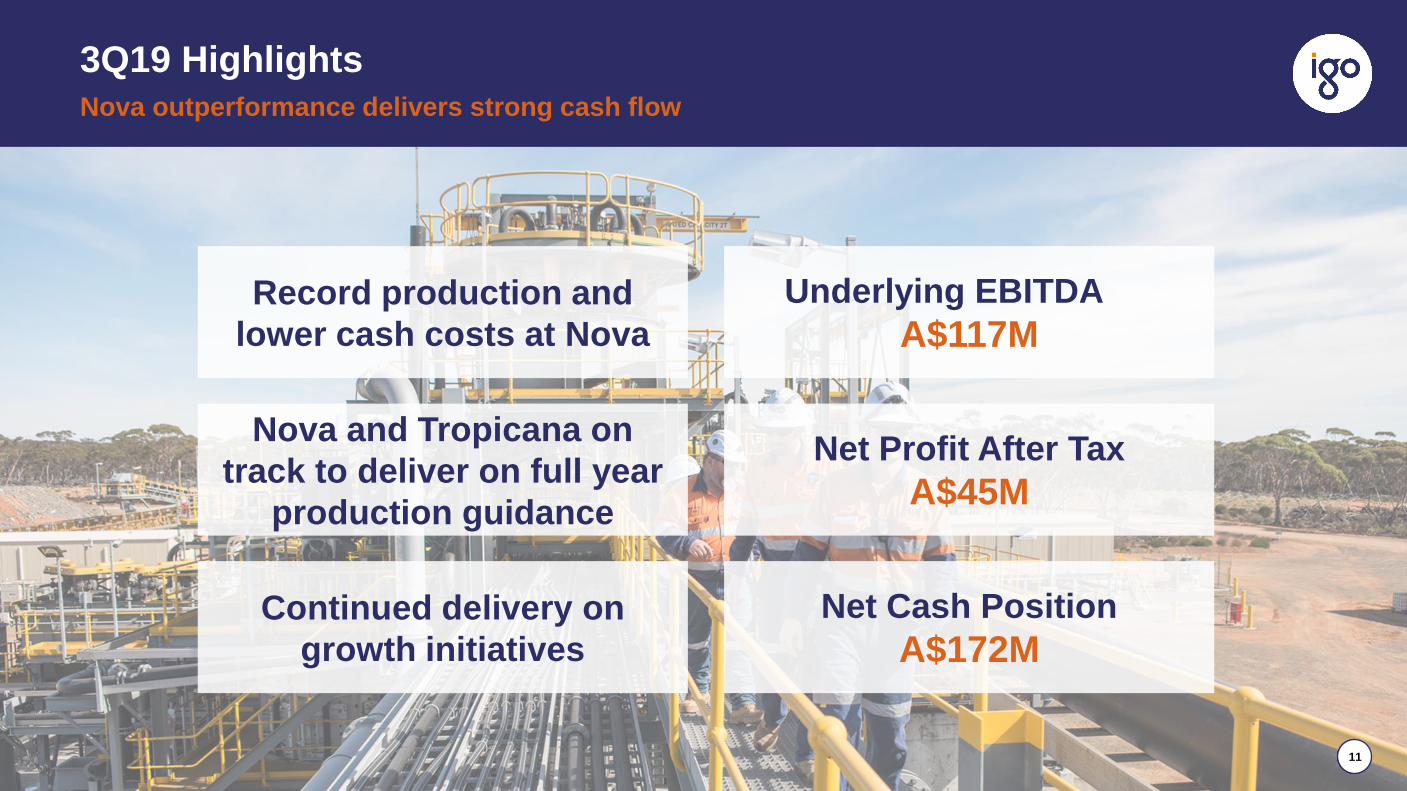
3Q19 Highlights
11
Nova outperformance delivers strong cash flow
1111
Underlying EBITDA
A$117M
Net Profit After Tax
A$45M
Net Cash Position
A$172M
Nova and Tropicana on
track to deliver on full year
production guidance
Continued delivery on
growth initiatives
Record production and
lower cash costs at Nova
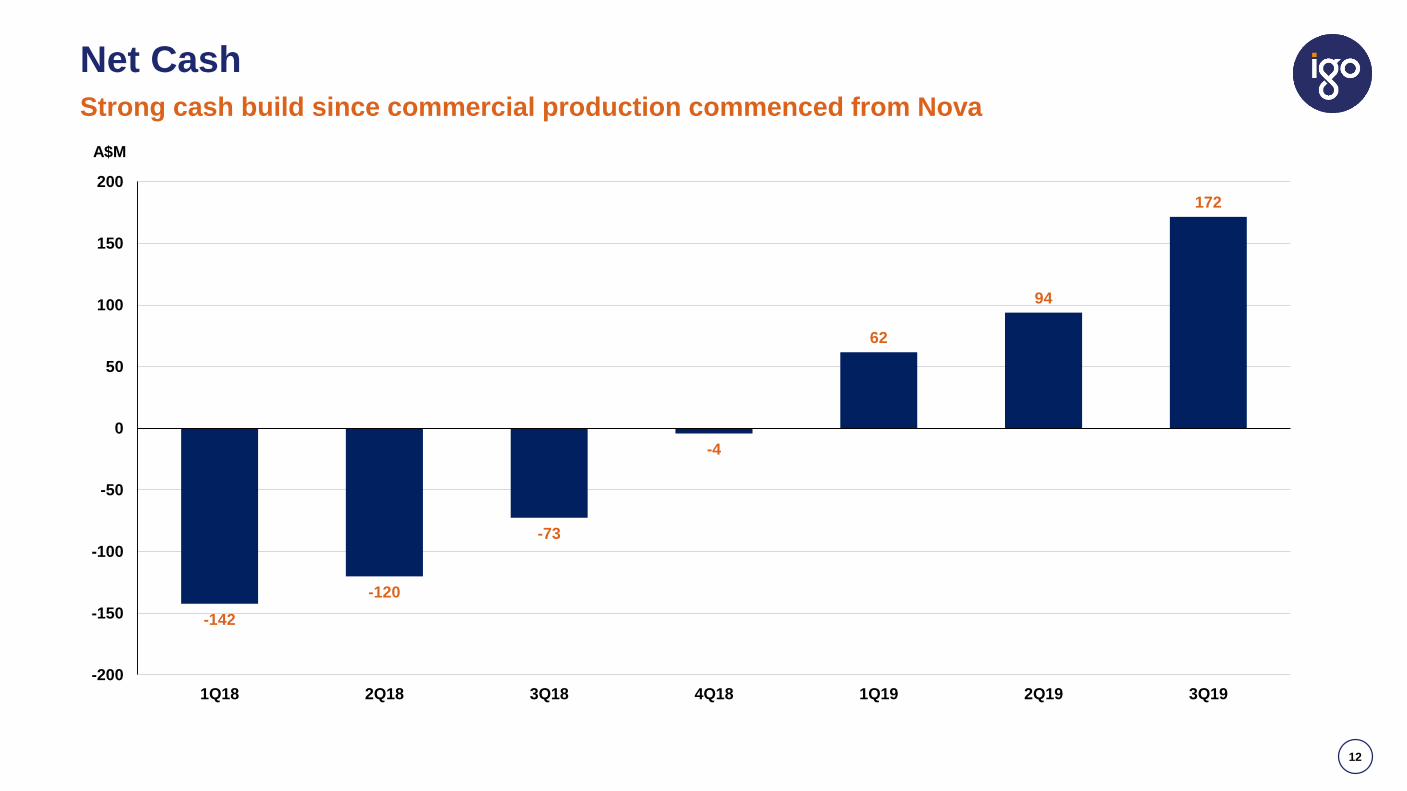
Net Cash
12
Strong cash build since commercial production commenced from Nova
-142
-120
-73
-4
62
94
172
-200
-150
-100
-50
0
50
100
150
200
1Q18 2Q18 3Q18 4Q18 1Q19 2Q19 3Q19
A$M
Tropicana Gold Mine
13
IGO: 30%, AngloGold Ashanti: 70% and managers
14
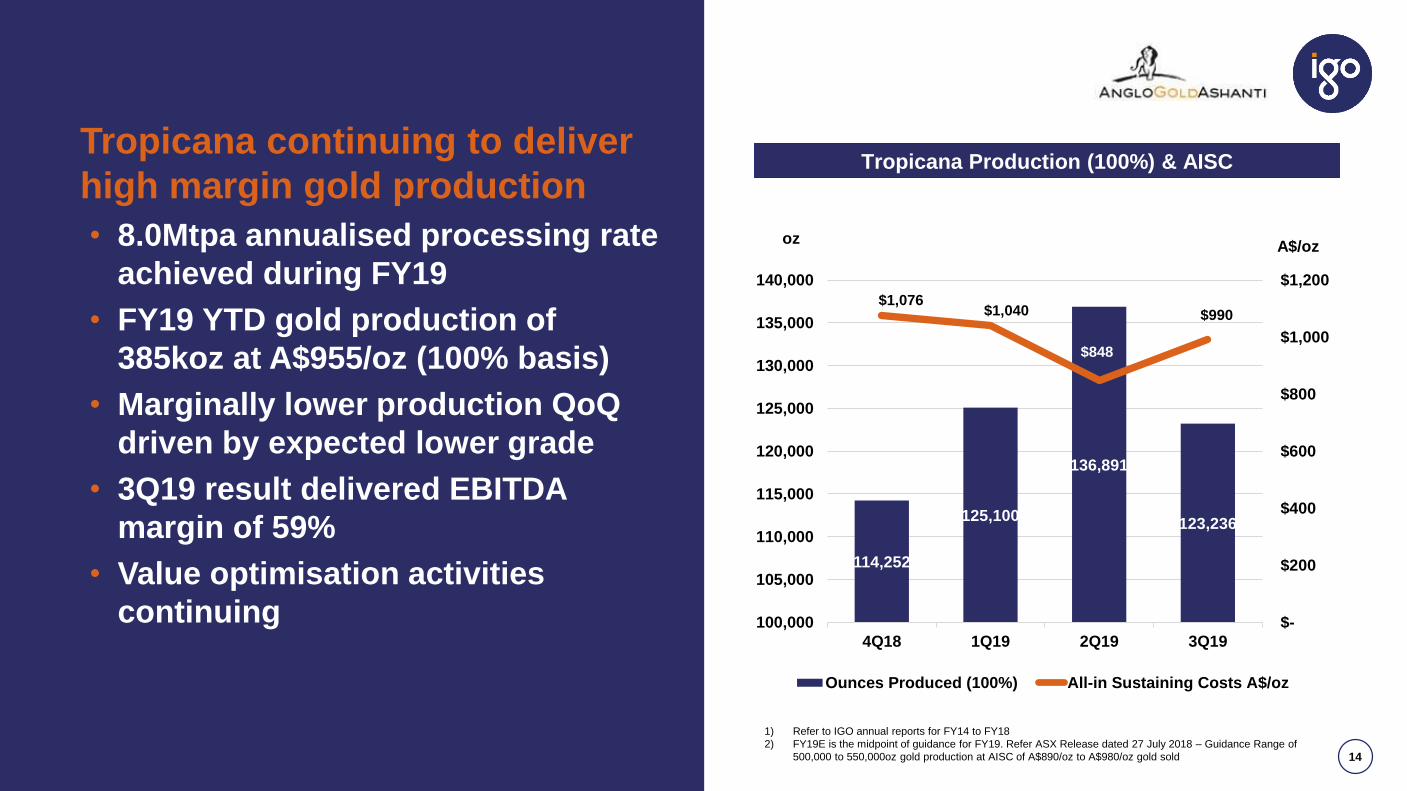
Tropicana Production (100%) & AISC
1) Refer to IGO annual reports for FY14 to FY18
2) FY19E is the midpoint of guidance for FY19. Refer ASX Release dated 27 July 2018 – Guidance Range of
500,000 to 550,000oz gold production at AISC of A$890/oz to A$980/oz gold sold
Tropicana continuing to deliver
high margin gold production
• 8.0Mtpa annualised processing rate
achieved during FY19
• FY19 YTD gold production of
385koz at A$955/oz (100% basis)
• Marginally lower production QoQ
driven by expected lower grade
• 3Q19 result delivered EBITDA
margin of 59%
• Value optimisation activities
continuing
114,252
125,100
136,891
123,236
$1,076 $1,040
$848
$990
$-
$200
$400
$600
$800
$1,000
$1,200
100,000
105,000
110,000
115,000
120,000
125,000
130,000
135,000
140,000
4Q18 1Q19 2Q19 3Q19
A$/ozoz
Ounces Produced (100%) All-in Sustaining Costs A$/oz

15
Boston Shaker Underground Development Layout(3)Boston Shaker Underground
• Development to commence in May
2019 following positive feasibility
─ Capital cost estimated at A$105M(1)
─ Operating costs estimated at A$95/tonne(2)
─ Average gold production of ~100koz/year
over seven years
• First gold production in 1Q21
─ Delivers improved grade and production
profile from FY21 with Tropicana gold
production expected to average 450 to
500koz/year to FY23
• Further underground opportunities
at Havana and Havana South
1) 100% basis. IGO share of capital cost estimated at A$32M
2) All-in-sustaining underground production costs
3) Refer to ASX release dated 28 March 2019: Tropicana Joint Venture Approves Boston Shaker Underground Development
Probable Ore
Reserve Design
Inferred
Resource
Design
Model blocks
>3.17g/t Au
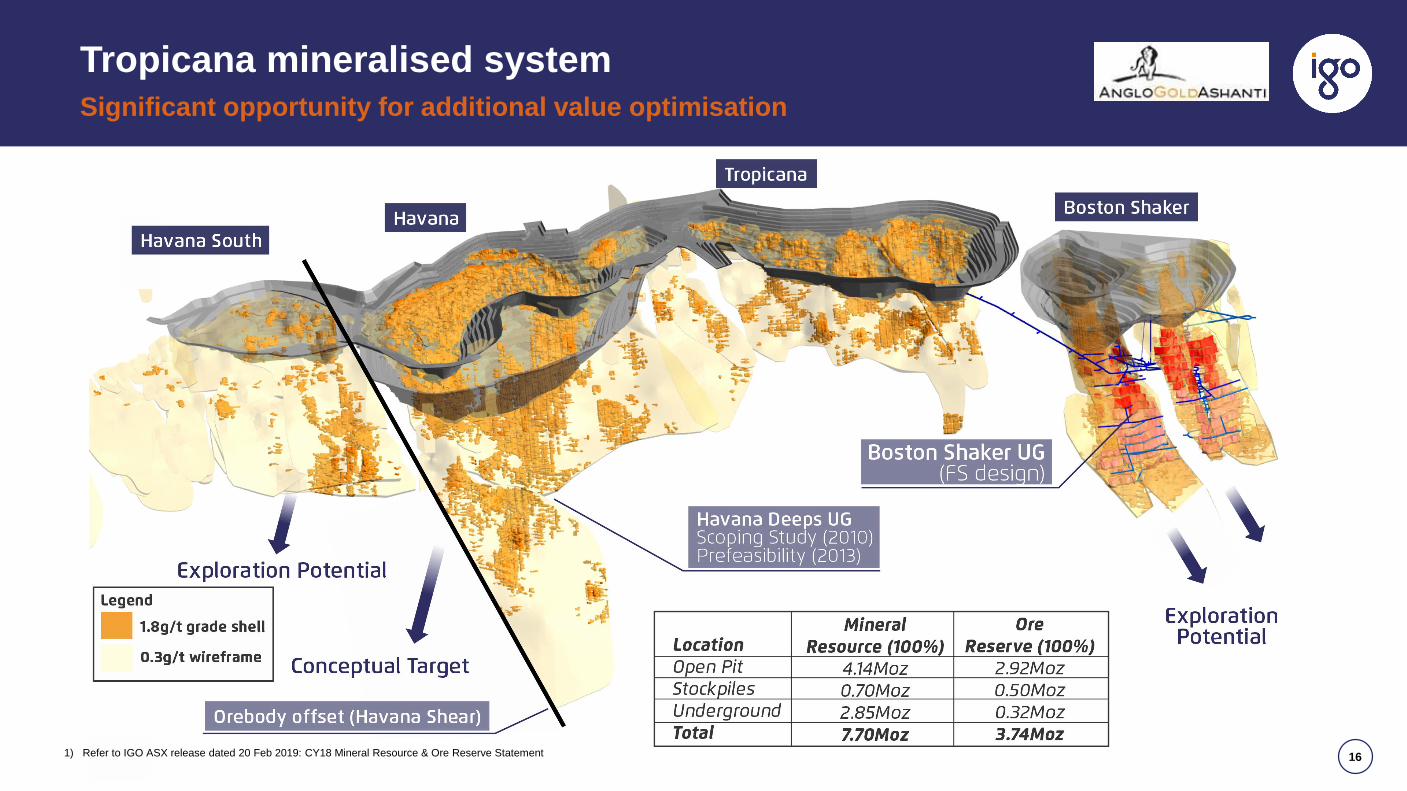
Tropicana mineralised system
16
Significant opportunity for additional value optimisation
1) Refer to IGO ASX release dated 20 Feb 2019: CY18 Mineral Resource & Ore Reserve Statement
17
Nova
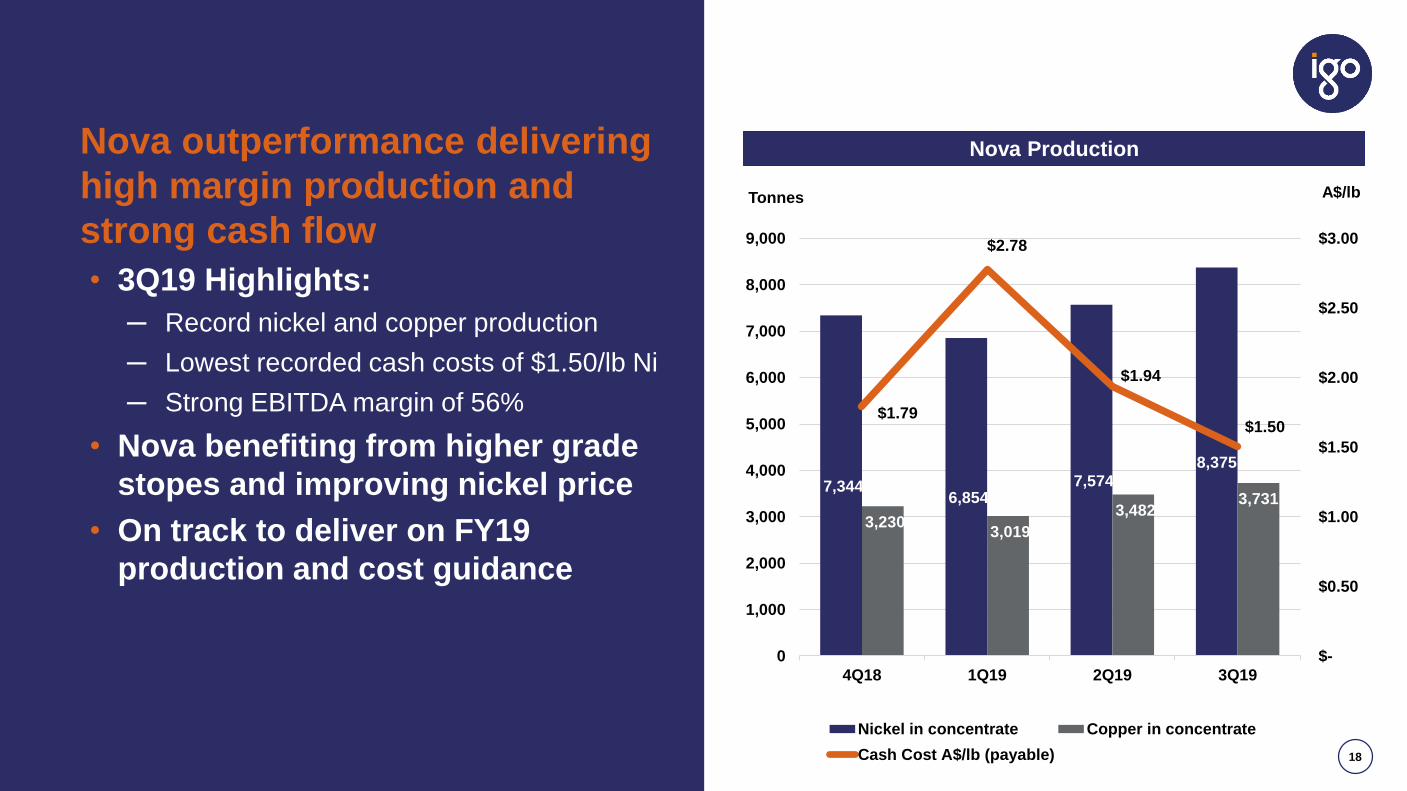
7,344 6,854
7,574 8,375
3,230 3,019
3,482 3,731
$1.79
$2.78
$1.94
$1.50
$-
$0.50
$1.00
$1.50
$2.00
$2.50
$3.00
0
1,000
2,000
3,000
4,000
5,000
6,000
7,000
8,000
9,000
4Q18 1Q19 2Q19 3Q19
A$/lbTonnes
Nickel in concentrate Copper in concentrate
Cash Cost A$/lb (payable)
Nova outperformance delivering
high margin production and
strong cash flow
• 3Q19 Highlights:
─ Record nickel and copper production
─ Lowest recorded cash costs of $1.50/lb Ni
─ Strong EBITDA margin of 56%
• Nova benefiting from higher grade
stopes and improving nickel price
• On track to deliver on FY19
production and cost guidance
Nova Production
18
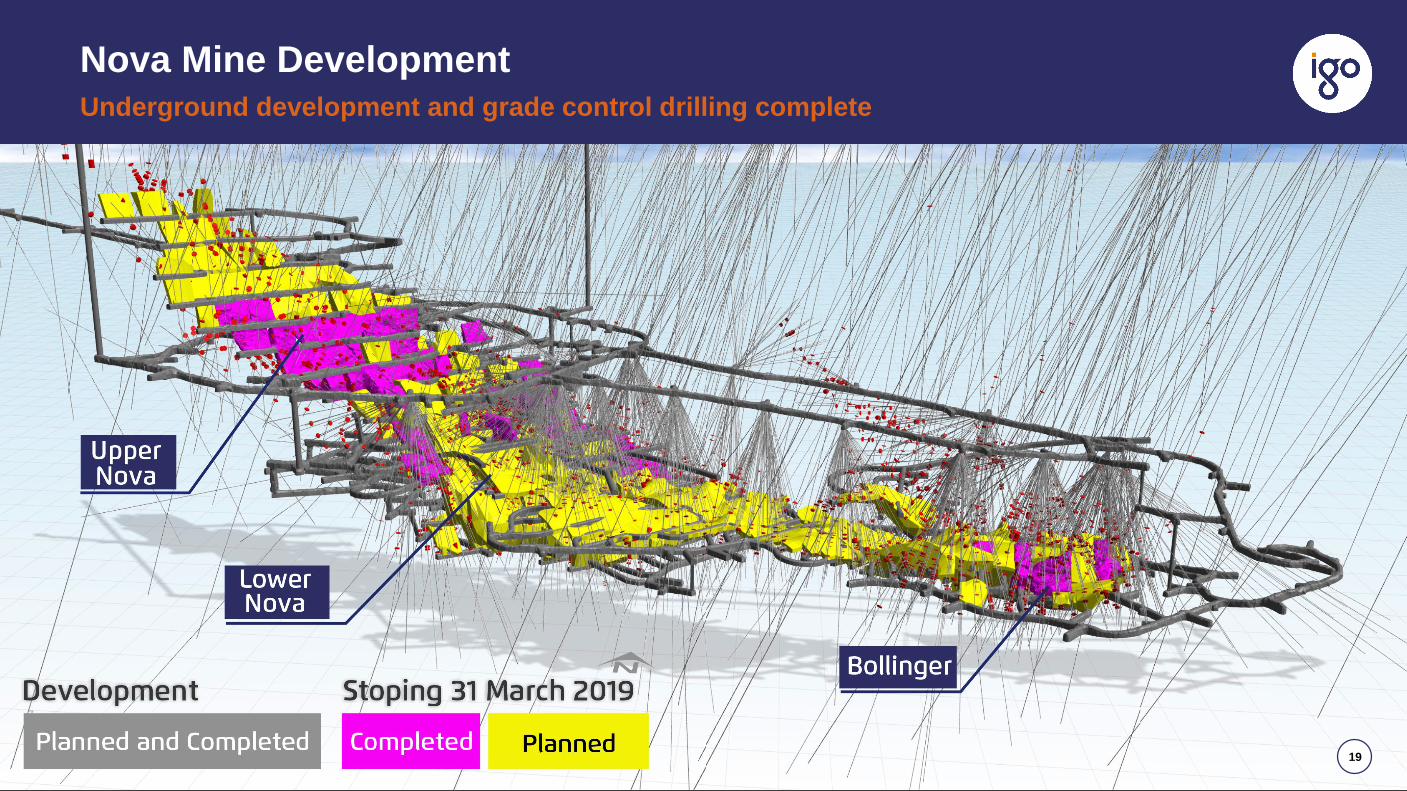
Nova Mine Development
19
Underground development and grade control drilling complete
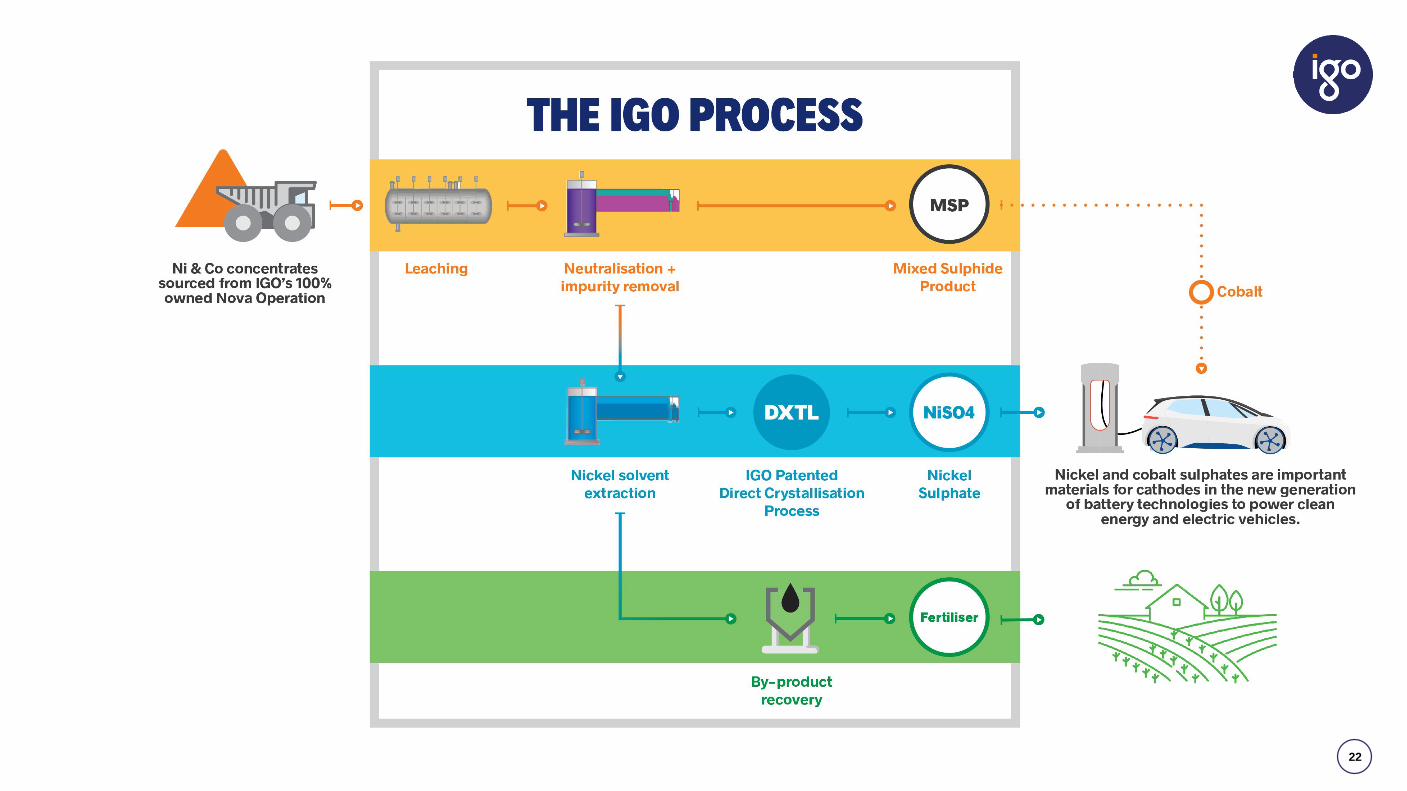
Growth: Downstream 20
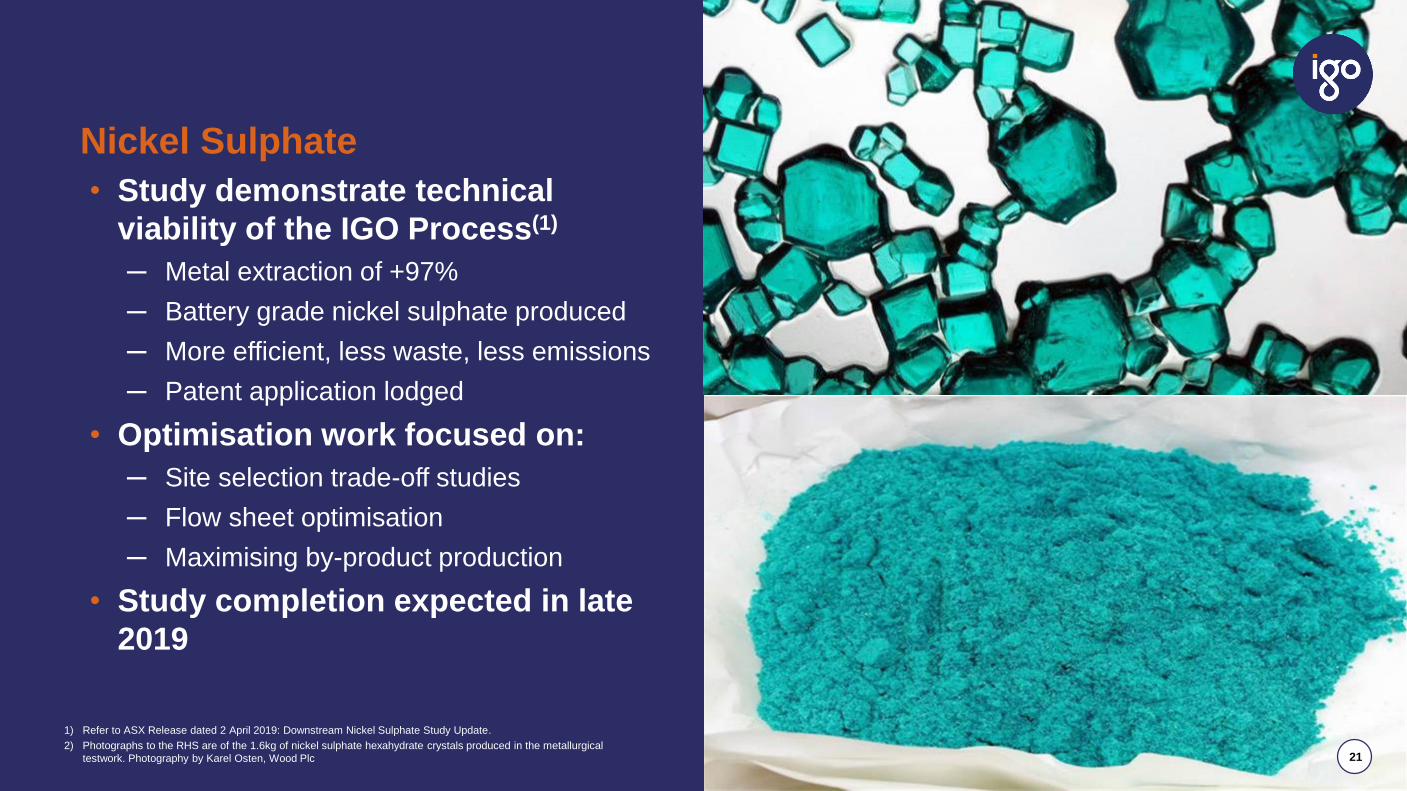
Nickel Sulphate
• Study demonstrate technical
viability of the IGO Process(1)
─ Metal extraction of +97%
─ Battery grade nickel sulphate produced
─ More efficient, less waste, less emissions
─ Patent application lodged
• Optimisation work focused on:
─ Site selection trade-off studies
─ Flow sheet optimisation
─ Maximising by-product production
• Study completion expected in late
2019
1) Refer to ASX Release dated 2 April 2019: Downstream Nickel Sulphate Study Update.
2) Photographs to the RHS are of the 1.6kg of nickel sulphate hexahydrate crystals produced in the metallurgical
testwork. Photography by Karel Osten, Wood Plc 21
22
Growth: Exploration 23
24
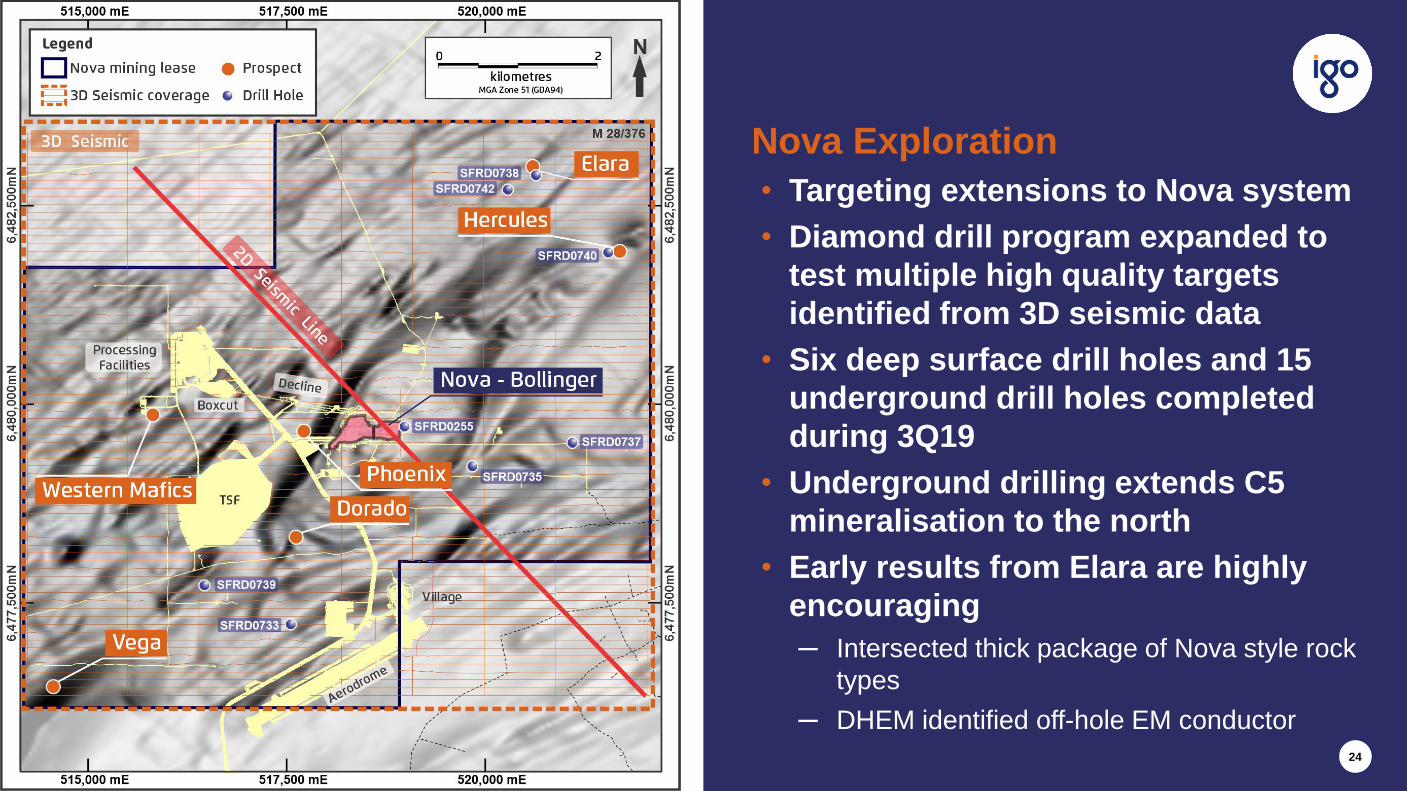
Nova Exploration
• Targeting extensions to Nova system
• Diamond drill program expanded to
test multiple high quality targets
identified from 3D seismic data
• Six deep surface drill holes and 15
underground drill holes completed
during 3Q19
• Underground drilling extends C5
mineralisation to the north
• Early results from Elara are highly
encouraging
─ Intersected thick package of Nova style rock
types
─ DHEM identified off-hole EM conductor
February 2018
25
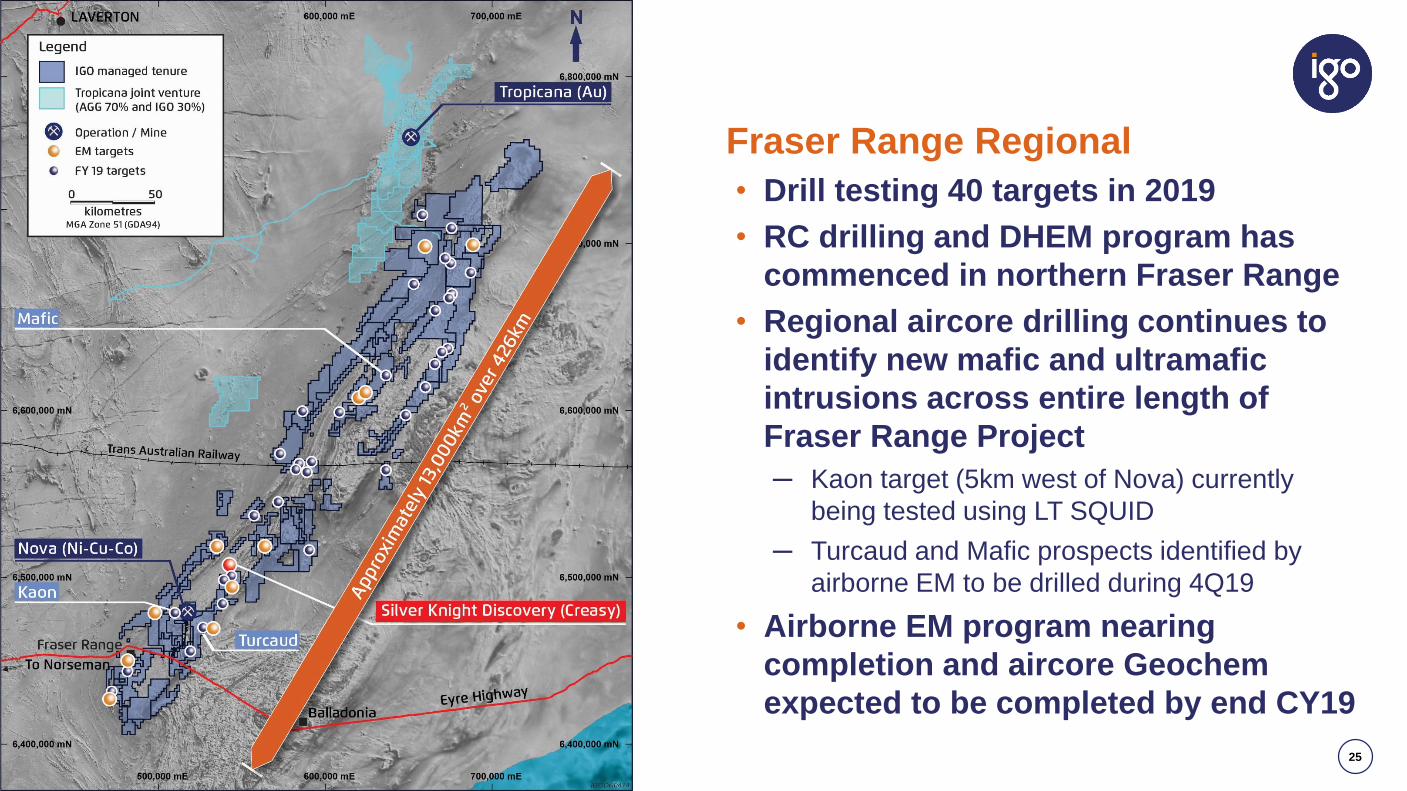
Fraser Range Regional
• Drill testing 40 targets in 2019
• RC drilling and DHEM program has
commenced in northern Fraser Range
• Regional aircore drilling continues to
identify new mafic and ultramafic
intrusions across entire length of
Fraser Range Project
─ Kaon target (5km west of Nova) currently
being tested using LT SQUID
─ Turcaud and Mafic prospects identified by
airborne EM to be drilled during 4Q19
• Airborne EM program nearing
completion and aircore Geochem
expected to be completed by end CY19
26
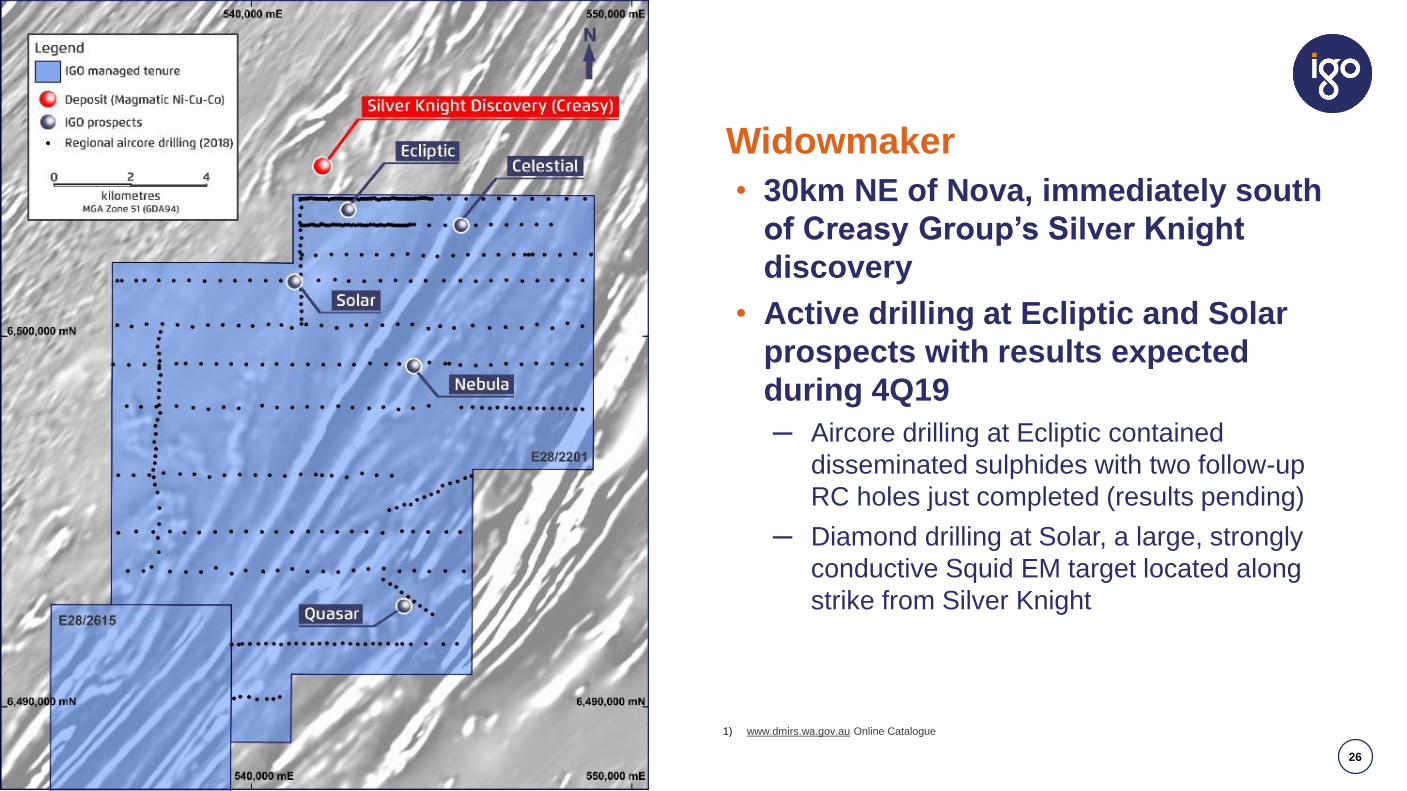
Widowmaker
• 30km NE of Nova, immediately south
of Creasy Group’s Silver Knight
discovery
• Active drilling at Ecliptic and Solar
prospects with results expected
during 4Q19
─ Aircore drilling at Ecliptic contained
disseminated sulphides with two follow-up
RC holes just completed (results pending)
─ Diamond drilling at Solar, a large, strongly
conductive Squid EM target located along
strike from Silver Knight
1) www.dmirs.wa.gov.au Online Catalogue
27
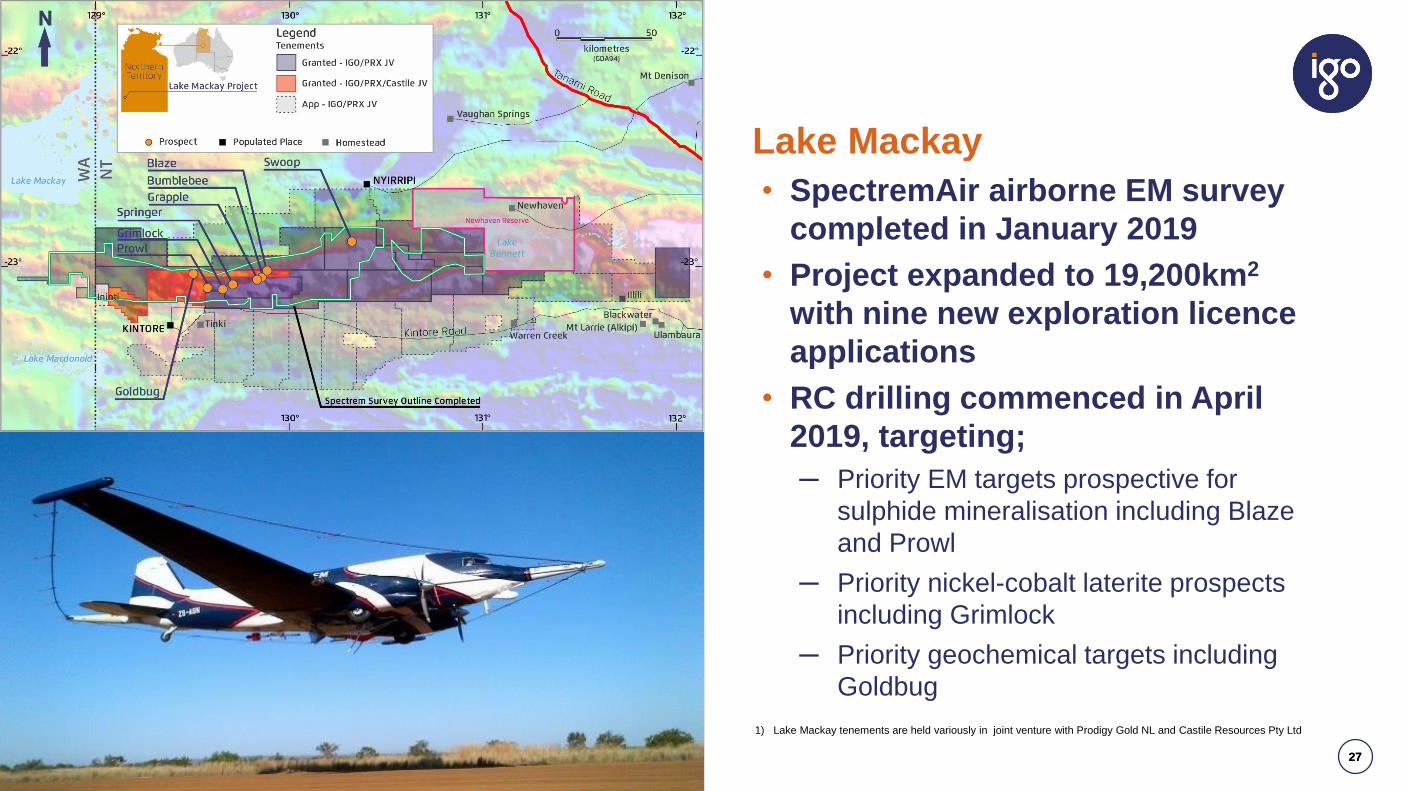
Lake Mackay
• SpectremAir airborne EM survey
completed in January 2019
• Project expanded to 19,200km2
with nine new exploration licence
applications
• RC drilling commenced in April
2019, targeting;
─ Priority EM targets prospective for
sulphide mineralisation including Blaze
and Prowl
─ Priority nickel-cobalt laterite prospects
including Grimlock
─ Priority geochemical targets including
Goldbug
1) Lake Mackay tenements are held variously in joint venture with Prodigy Gold NL and Castile Resources Pty Ltd
27
28ESG
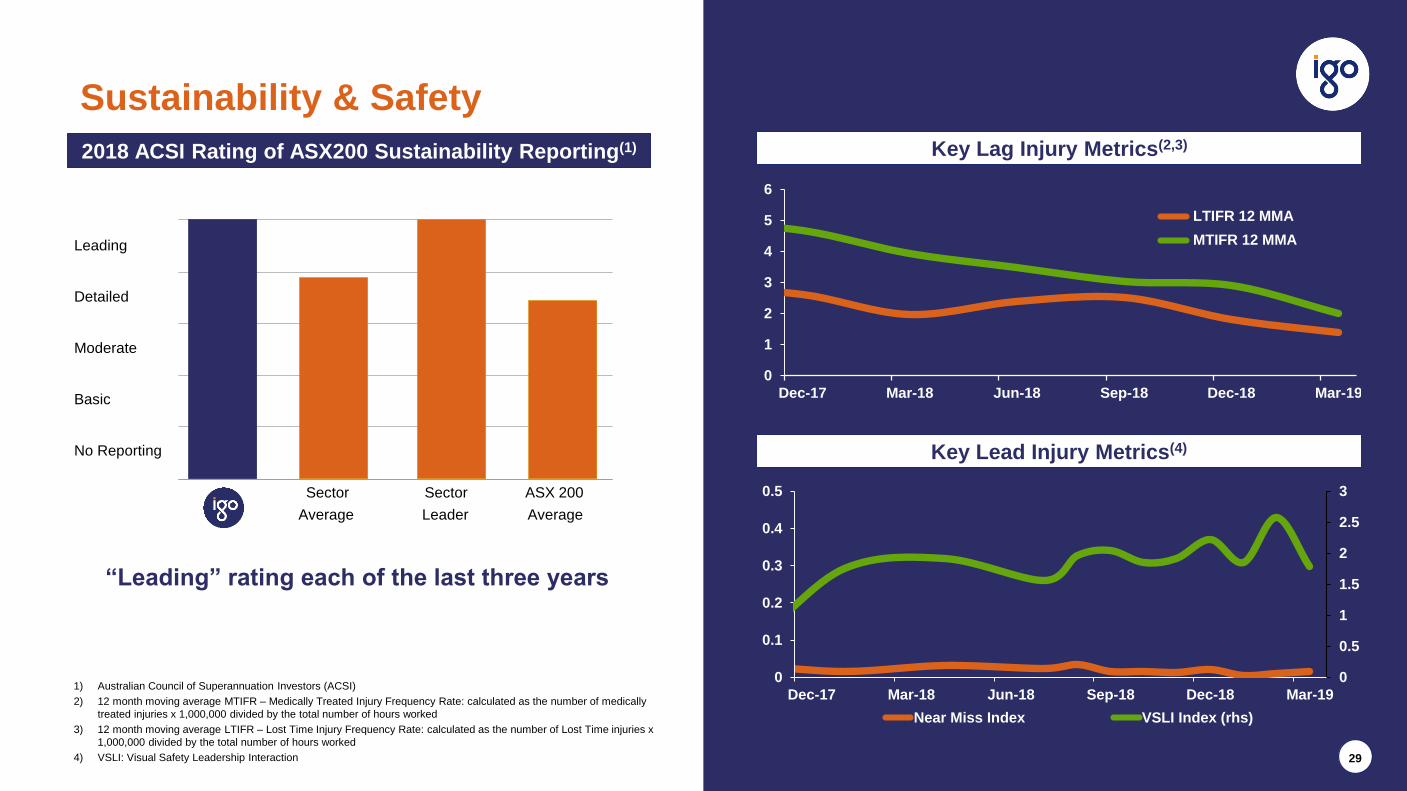
Sustainability & Safety
29
1) Australian Council of Superannuation Investors (ACSI)
2) 12 month moving average MTIFR – Medically Treated Injury Frequency Rate: calculated as the number of medically
treated injuries x 1,000,000 divided by the total number of hours worked
3) 12 month moving average LTIFR – Lost Time Injury Frequency Rate: calculated as the number of Lost Time injuries x
1,000,000 divided by the total number of hours worked
4) VSLI: Visual Safety Leadership Interaction
2018 ACSI Rating of ASX200 Sustainability Reporting(1)
Leading
Detailed
Moderate
Basic
No Reporting
Sector
Average
Sector
Leader
ASX 200
Average
“Leading” rating each of the last three years
0
1
2
3
4
5
6
Dec-17 Mar-18 Jun-18 Sep-18 Dec-18 Mar-19
LTIFR 12 MMA
MTIFR 12 MMA
Key Lag Injury Metrics(2,3)
0
0.5
1
1.5
2
2.5
3
0
0.1
0.2
0.3
0.4
0.5
Dec-17 Mar-18 Jun-18 Sep-18 Dec-18 Mar-19
Near Miss Index VSLI Index (rhs)
Key Lead Injury Metrics(4)
30
People & Culture
• Strong sense of purpose
• Empowered people who are
owners of the business
• Focus on doing what is right –
because we care
• Collectively we are making a
difference
• Fostering the next generation of
industry leaders
• Achieving above benchmark levels
of staff engagement and reduced
turnover
30
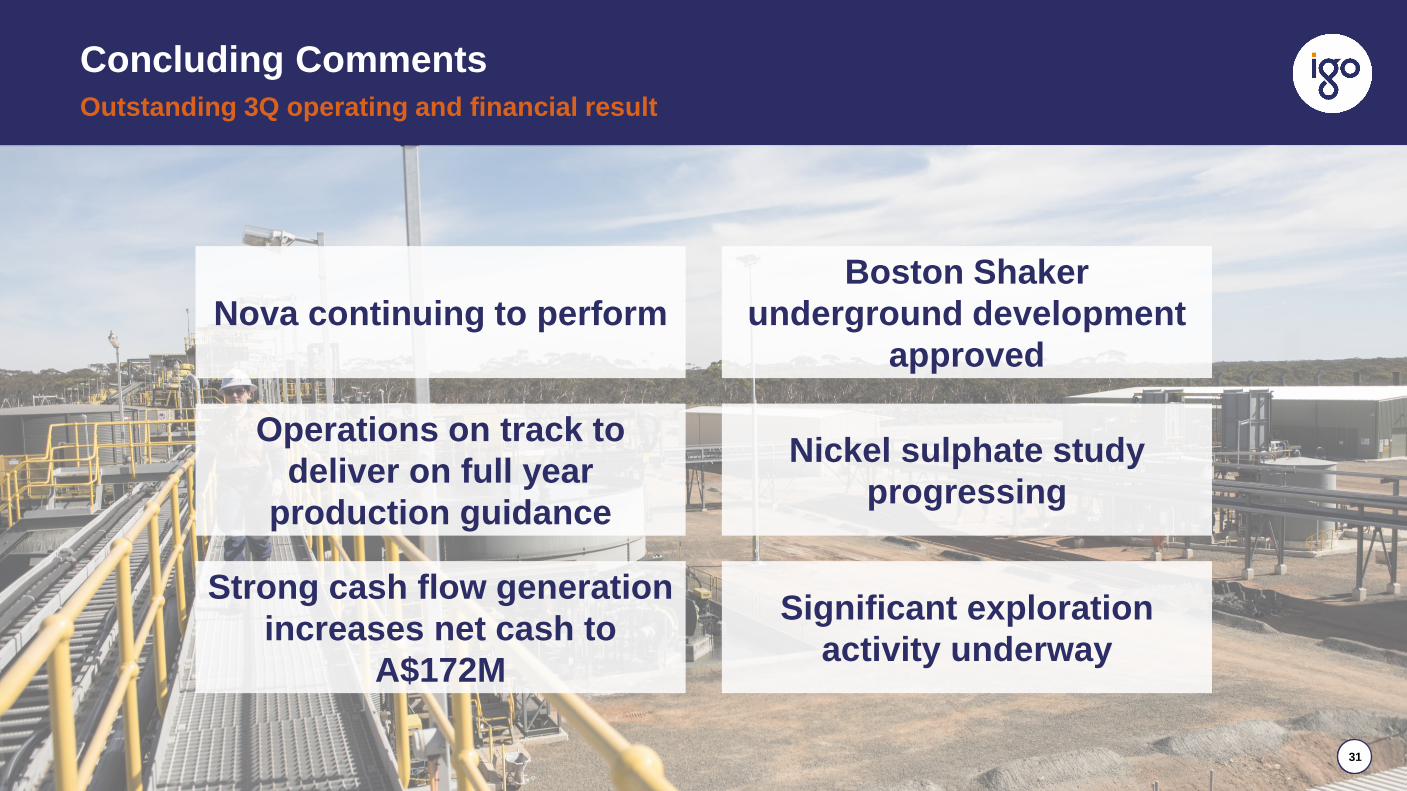
Concluding Comments
31
Outstanding 3Q operating and financial result
3131
Boston Shaker
underground development
approved
Nickel sulphate study
progressing
Significant exploration
activity underway
Operations on track to
deliver on full year
production guidance
Strong cash flow generation
increases net cash to
A$172M
Nova continuing to perform
32