incremental pattern recognition by maximum conditional ...€¦ · incremental pattern recognition...
TRANSCRIPT

INCREMENTAL PATTERN RECOGNITIONBY MAXIMUM CONDITIONAL INFORMATIVITY
Jirı GrimDepartment of Pattern Recognition
Institute of Information Theory and AutomationAcademy of Sciences of the Czech Republic
P.O.BOX 18, CZ-18208 Prague 8, Czech Republicemail: [email protected]
ABSTRACTSequential pattern recognition assumes the features to bemeasured successively, one at a time, and therefore the keyproblem is to choose the next feature optimally. However,the choice of the features may be strongly influenced bythe previous feature measurements and therefore the on-line ordering of features is difficult. There are numerousmethods to estimate class-conditional probability distribu-tions but it is usually computationally intractable to derivethe corresponding conditional marginals. In literature thereis no exact method of on-line feature ordering except forthe strongly simplifying naive Bayes models. We showthat the problem of sequential recognition has an explicitanalytical solution which is based on approximation of theclass-conditional distributions by mixtures of product com-ponents. As the marginal distributions of product mixturesare directly available by omitting superfluous terms in theproducts, we have a unique non-trivial possibility to evalu-ate at any decision level the conditional informativity of un-observed features for a general problem of statistical recog-nition. In this way the most informative feature guarantees,for any given set of preceding measurements, the maximumdecrease of decision uncertainty.
KEY WORDSMultivariate statistics, Statistical pattern recognition, Se-quential decision making, Product mixtures, EM algorithm,Shannon information
1 Introduction
Sequential decision-making is an important area of statis-tical pattern recognition. Unlike the standard scheme con-sidering all features of the classified object at once, the se-quential recognition includes the features successively, oneat a time. Usually, the goal is to reduce the number of fea-tures which are necessary for the final decision. Thus, theclassification based on the currently available feature mea-surements is either terminal or the sequential recognition iscontinued by choosing the next feature. For this reason the
0Early version of the paper ”Sequential pattern recognition by maxi-mum conditional informativity”, Pattern Recognition Letters, 45 (2014)39–45
sequential decision scheme should include a stopping ruleand a suitable ordering procedure to optimally choose thenext feature.
The traditional motivation for sequential recognitionassumes that, for a certain reason, the feature measure-ments are expensive and therefore, if a reliable classifica-tion is achievable with a small subset of features, the op-timal feature ordering and stopping rule may reduce thetotal recognition cost. However, in most pattern recogni-tion applications all features are measured simultaneouslyand with negligible costs. Obviously, there is no need ofsequential decision-making when the features can be usedsimultaneously.
On the other hand, there are problems which are se-quential by their nature but the statistical properties of fea-tures may differ at different stages of classification. Thusthe weak classifiers of [26] can use different feature sets,the recognized patterns in orthotic engineering may de-velop [31] or the state of the classified object is influencedby control actions [22, 4]. In this sense, instead of sequen-tial recognition, we have to solve a sequence of formallydifferent recognition problems.
Practical problems of sequential recognition usuallyhave different specific aspects which may require highlyspecific solutions. For example, most of the present ap-proaches can be traced back to the theoretical results of [30]which are closely related to the quality control of goods.Wald proposed the sequential probability ratio test to verifythe quality of a commodity in a shipment by efficient sam-pling – with the aim to minimize the costs of the controlprocedure as a whole. Given a large shipment containing asingle type of goods, the test guarantees the optimal trade-off between the number of tested items and the probabilityof incorrect quality evaluation.
The repetition of identical tests of goods in the Wald’sproblem naturally implies a sequence of independent, iden-tically distributed measurements, and thus any ordering ofmeasurements is pointless in this case. The generalizedsequential probability ratio test provides optimal solutionsonly for two-class problems and class-conditionally inde-pendent features. It can be further extended and modified[8] but, even if we admit different statistical properties offeatures in different classes, the independence assumption
remains prohibitive because the typical problems of patternrecognition usually involve strongly interrelated features.
In the case of generally dependent features, the keyproblem of sequential recognition is the optimal on-lineordering of feature measurements. We recall that the off-line (a priori) feature ordering (closely related to the well-known feature selection algorithms [24]), is less efficientbecause it cannot reflect the values of the previously ob-served features. As it will be shown later, the optimalchoice of the most informative feature at a given stagemay be strongly influenced by the values of the preced-ing feature measurements and, for this reason, the knowl-edge of the underlying conditional distributions is of basicimportance. There are numerous methods to estimate theunknown probability distributions in classes but it is usu-ally computationally intractable to derive on-line the con-ditional marginals of unobserved features for a given subsetof preceding feature measurements.
In this paper we show that, approximating the class-conditional distributions by mixtures of product compo-nents, we have a unique possibility to solve exactly theon-line feature ordering problem for a general multi-classproblem of statistical recognition. Marginal distributions ofproduct mixtures are directly available by omitting super-fluous terms in the products and therefore we can evaluate,for any given set of preceding measurements, the condi-tional Shannon informativity of the unobserved features.The most informative feature guarantees the maximum de-crease of decision uncertainty - with respect to the esti-mated conditional distributions.
In the following sections we first discuss the re-lated work (Sec.2) and briefly describe the product mixturemodel (Sec.3) in application to Bayesian decision-making(Sec.4). The information controlled sequential recognitionis described in Sec.5 and the properties of the method areillustrated by a numerical example in Sec.6.
2 Related Work
According to our best knowledge, the exact solution of theon-line feature ordering problem is available in the litera-ture only for so-called naive Bayes classifiers based on thestrongly simplifying assumption that the features are sta-tistically independent in each class [1, 2, 21, 7]. A moregeneral setup has been considered by [8], who proposed adynamic programming approach to the on-line ordering offeatures. However, in order to reduce the arising compu-tational complexity, the features are assumed to be statis-tically independent or Markov dependent and continuousvariables have to be discretized.
[26, 27] have recently proposed to circumvent thecomputational difficulties by combining so-called weakclassifiers from a large set in the framework of the Ad-aBoost algorithm. The arising sequence of strong classi-fiers plays a role of sequential measurements which are notindependent. The joint conditional density of all measure-ments, whose estimation is intractable, is approximated by
the class-conditional response of the sequence of strongclassifiers. The method called WaldBoost applies the Ad-aBoost algorithm to selecting and ordering the measure-ments and to approximation of the sequential probabilityratio in the Wald’s decision scheme. The WaldBoost algo-rithm is justified by the asymptotic properties of AdaBoostand yields a nearly optimal trade-off between time and er-ror rate for the underlying two-class recognition problems.
One of the most natural application fields of sequen-tial recognition is that of medical diagnostics [1, 2, 7].In the case of computer-aided medical decision-makingwe assume the final decision to be made by a physician,and therefore the main purpose of the sequential procedureshould be to accumulate maximum diagnostically relevantinformation along with the preliminary evaluation. Thenumber of both possible diagnoses and potentially avail-able features may be very large, and therefore the main ad-vantage of the sequential procedure is the optimal choiceof diagnostically relevant questions. There is no need for astopping rule, the process may continue as long as the useris willing and able to answer the questions. The output ofthe classifier is given by the Bayes formula in the form ofa posteriori probabilities of possible diagnoses which maybe useful for the physician – in addition to the patient’s an-swers and recommended medical tests.
3 Mixtures of Product Components
Let x be an N -dimensional vector of discrete features
x = (x1, x2, . . . , xN ) ∈ X , xn ∈ Xn, N = 1, · · · , N
and N be the related index set of the variables xn. Ap-proximating unknown discrete probability distributions byproduct mixtures, we assume the following conditional in-dependence model:
P (x) =∑
m∈MwmF (x|m), x ∈ X , M = 1, · · · ,M,
(1)with the component weights
w = (w1, w2, . . . , wM ), wm ≥ 0,∑
m∈Mwm = 1,
and the product distributions
F (x|m) =∏
n∈Nfn(xn|m), xn ∈ Xn, m ∈M. (2)
Here fn(xn|m) are univariate discrete probability distribu-tions andM is the component index set.
Since the late 1960s the standard way to computemaximum-likelihood estimates of mixture parameters is touse the EM algorithm ([28], [6], [9]). Formally, given afinite set S of independent observations of the underlyingN -dimensional random vector
S = x(1),x(2), · · ·, x = (x1, x2, · · · , xN ) ∈ X , (3)
we maximize the corresponding log-likelihood function
L =1|S|
∑x∈S
log
[ ∑m∈M
wmF (x|m)
](4)
by means of the following EM iteration equations:
q(m|x) =wmF (x|m)∑j∈M wjF (x|j)
, w′
m =1|S|
∑x∈S
q(m|x),
(5)
f′
n(ξ|m) =∑x∈S
δ(ξ, xn)q(m|x)∑x∈S q(m|x)
, ξ ∈ Xn, n ∈ N , (6)
where δ(ξ, xn) is the δ-function notation (δ(ξ, xn) = 1 forξ = xn and zero otherwise) and the apostrophe denotesthe new parameter values in each iteration. In the case ofhigh dimensionality (N ≈ 102) the EM algorithm has to becarefully implemented to avoid underflow problems [13].
Let us recall that the number of components in themixture is a parameter to be specified in advance. Onecan easily imagine that there are many different possibil-ities to fit a mixture of many components to a large numberof multidimensional feature vectors whereby each possi-bility may correspond to a local maximum of the relatedlog-likelihood function. For this reason the log-likelihoodcriterion nearly always has local maxima and therefore theiterative computation depends on the starting-point.
Nevertheless, in the case of large data sets (|S| ≈103) and large number of components (M ≈ 102), possi-ble local maxima usually do not differ very much from eachother. With identical number of components the EM algo-rithm expectedly achieves similar local maxima, the similarvalues of the log-likelihood criterion imply comparable ap-proximation quality and therefore, according to our experi-ence, large approximating mixtures can be initialized ran-domly without any relevant risk of unhappy consequences.
4 Decision Making Using Product Mixtures
Considering the framework of statistical pattern recogni-tion we assume that the vector x is to be classified withrespect to a finite set of classes Ω = ω1, . . . , ωK. Weapproximate the class-conditional distributions P (x|ω) byproduct mixtures:
P (x|ω) =∑
m∈Mω
wmF (x|m),⋃
ω∈Ω
Mω =M, (7)
where wm are probabilistic weights, F (x|m) are the prod-uct components and Mω, ω ∈ Ω are disjoint index sets.Note that, in this way, the component index m simultane-ously identifies the value of the class variable ω ∈ Ω.
Having estimated the class-conditional distributionsP (x|ω) and a priori probabilities p(ω), ω ∈ Ω we canwrite, for any given x ∈ X , the Bayes formula
p(ω|x) =P (x|ω)p(ω)
P (x), P (x) =
∑ω∈Ω
P (x|ω)p(ω).
(8)
The posterior distribution p(ω|x) can be used to define aunique decision by means of Bayes decision function
d : X → Ω, d(x) = arg maxω∈Ωp(ω|x), x ∈ X , (9)
which is known to minimize the probability of classifica-tion error.
We recall that the unique classification (9) is accom-panied by information loss because of the suppressed aposteriori probabilities of classes. Typically, in medicaldecision-making the probabilities of possible diagnoses arepreferable to a unique deterministic decision. For the sakeof sequential recognition we consider simultaneously theBayes formula (8) as the classifier output since the a pos-teriori probabilities provide more subtle description of theresulting classification. By using the Shannon entropy
Hx(Ω) =∑ω∈Ω
−p(ω|x) log p(ω|x) (10)
we have a reliable quantitative measure of the decision un-certainty implied by the Bayes formula (8).
The approximation power of product mixtures has of-ten been underestimated – probably because of their for-mal similarity with so-called “naive Bayes” model (cf.[1, 2, 3, 23]). We recall that, in the case of product mix-tures, the term “naive Bayes” is incorrectly used becausethe independence assumption applies to mixture compo-nents and not to the approximated class-conditional distri-butions. Actually, the product mixtures (1), (2) are suitablefor describing complex statistical properties of strongly in-terrelated features. In the case of discrete variables theproduct mixture is a universal approximator [12] in thesense that any discrete distribution can be expressed in theform (1). In the case of continuous variables the approx-imation potential of product mixtures approaches the uni-versality of nonparametric kernel estimates [25] with theincreasing number of components.
In recent years we have applied product mixtures suc-cessfully to multidimensional pattern recognition [15, 16],mammographic screening [19], texture modeling [14], im-age forgery detection [20], classification of documents [18]and others (cf. also [23]).
5 Sequential Recognition
The sequential recognition assumes a successive evaluationof features. Each time, either terminal classification is tobe performed or the next feature has to be optimally cho-sen. The goal of the sequential classification is to assign theobserved subset of features to a class ω ∈ Ω or, more ex-actly, to reduce the uncertaintyHx(Ω) (cf. Eq. (10)) of therelated a posteriori probability distribution (8). Note thatthe entropy Hx(Ω) approaches zero when the a posterioriprobabilities concentrate at a single value ω ∈ Ω. If we usethe Shannon entropy Hx(Ω) as a measure of decision un-certainty [29] then a natural way to choose the next featuremeasurement is to maximize the corresponding conditional
Shannon information about the class variable ω containedin the considered feature. We show that, in this sense, themost informative feature provides the maximum expecteddecrease of uncertainty of the a posteriori distribution.
Motivated by an earlier idea [11] we use the fact that,in the case of product mixtures, there is a simple possibilityto derive any marginal distributions by deleting superfluousterms in the products. In this way, we have at any decisionlevel a unique possibility to evaluate the exact conditionalinformativity of the remaining features.
In particular, let xi1 , xi2 , . . . , xikbe a given subset of
known feature measurements. Then for the sub-vector xC
xC = (xi1 , xi2 , . . . , xik) ∈ XC , C = i1, . . . , ik ⊂ N ,
(11)and a variable xn, (n ∈ N \ C), we can directly write theformulae both for the related marginals
FC(xC |m) =∏i∈C
fi(xi|m), m ∈Mω, ω ∈ Ω,
PC|ω(xC |ω) =∑
m∈Mω
wmFC(xC |m),
PC(xC) =∑ω∈Ω
p(ω)∑
m∈Mω
wmFC(xC |m),
Pn,C(xn,xC |ω) =∑
m∈Mω
wmfn(xn|m)FC(xC |m),
Pn,C(xn,xC) =∑ω∈Ω
p(ω)∑
m∈Mω
wmfn(xn|m)FC(xC |m),
and for the conditional distributions of xn ∈ Xn
Pn|Cω(xn|xC , ω) =Pn,C|ω(xn,xC |ω)PC|ω(xC |ω)
= (12)
=∑
m∈Mω
Wωm(xC)fn(xn|m), (PC|ω(xC |ω) > 0),
Pn|C(xn|xC) =∑ω∈Ω
∑m∈Mω
Wωm(xC)fn(xn|m). (13)
Here Wωm(xC) and Wω
m(xC), (ω ∈ Ω) are the componentweights corresponding to the observed feature vector xC ∈XC :
Wωm(xC) =
wmFC(xC |m)∑j∈Mω
wjFC(xC |j), m ∈Mω, ω ∈ Ω,
Wωm(xC) =
p(ω)wmFC(xC |m)∑ϑ∈Ω p(ϑ)
∑j∈Mϑ
wjFC(xC |j).
In view of the above equations, the conditional Shannon in-formativity of the remaining variables xn can be computedfor arbitrary sub-vector xC ∈ XC .
In particular, if xn, (n ∈ N \ C) is an unobservedfeature, then the conditional information about Ω containedin the related random variable Xn, given a sub-vector xC ,can be expressed by means of the Shannon formula
IxC(Xn,Ω) = HxC
(Ω)−HxC(Ω|Xn). (14)
Equivalently, we can write
IxC(Xn,Ω) = HxC
(Xn)−HxC(Xn|Ω), (15)
where HxC(Xn), HxC
(Xn|Ω) are the respective en-tropies:
HxC(Xn) =
∑xn∈X n
−Pn|C(xn|xC) logPn|C(xn|xC),
(16)HxC
(Xn|Ω) =∑ω∈Ω
PΩ|C(ω|xC)× (17)
×∑
xn∈X n
−Pn|Cω(xn|xC , ω) logPn|Cω(xn|xC , ω),
PΩ|C(ω|xC) =PC|ω(xC |ω)p(ω)
PC(xC). (18)
Finally, we can use the statistical information IxC(Xn,Ω)
to define the next most informative feature xn0 , given xC :
n0 = arg maxn∈N\C
IxC
(Xn,Ω). (19)
Let us note that, in view of Eq. (14), the most informa-tive feature xn0 actually minimizes the conditional entropyHxC
(Ω|Xn)
HxC(Ω|Xn) =
∑xn∈X n
Pn|C(xn|xC)Hxn,xC(Ω) =
=∑
xn∈X n
Pn|C(xn|xC) (20)
∑ω∈Ω
−PΩ|nC(ω|xn,xC) logPΩ|nC(ω|xn,xC)
which can be viewed as the expected value of the deci-sion uncertainty with respect to the random variable Xn.In other words the most informative feature xn0 guaranteesthe maximum decrease of the expected decision uncertaintyHxC
(Ω|Xn) .As mentioned earlier in Sec. 4, the entropy HxC
(Ω)of the posterior distribution (18) is a natural measure of de-cision uncertainty given the sub-vector of observed featuremeasurements xC . For this reason it is well applicable as astopping rule. In particular, if we define
HxC(Ω) =
∑ω∈Ω
−PΩ|C(ω|xC) logPΩ|C(ω|xC) (21)
H(Ω) =∑ω∈Ω
−p(ω) log p(ω), (22)
then a reasonable condition to stop sequential recognitionand to make final decision is the inequality
HxC(Ω)
H(Ω)< τ, (0 < τ < 1). (23)
Intuitively it would be quite plausible to apply themaximum a posteriori probability PΩ|C(ω0|xC) in thestopping condition in a similar way:
PΩ|C(ω0|xC) > τ, 0 < τ < 1. (24)
However, the resulting stopping rule (24) would be lesssensitive than (23), because it cannot distinguish betweendifferent accompanying less probable ”noisy” alternatives.
We recall also that the relation (19) “looks” only onestep ahead. This widely used strategy has been proposedby [5] to reduce the computational complexity of the on-line feature ordering. In our case we could easily choosethe most informative pair of features, in analogy with theformulae above. Obviously, evaluation of the most infor-mative pair of variables is a qualitatively superior strategy;but if only one feature measurement is accepted in eachstep, the more complex computation would be devaluatedin the next step because the knowledge of the new featuremeasurement xn0 may essentially change the underlyingconditional probabilities (cf. Fig.1).
The proposed method of sequential recognition, asdescribed in this section, assumes that the class-conditionaldistributions P (x|ω), ω ∈ Ω are estimated in the form ofproduct mixtures. The whole procedure can be summarizedin three steps:
1. Evaluation of the conditional informativ-ity IxC
(Xn,Ω) for all unobserved featuresxn, n ∈ N \ C, given the subvector xC of pre-ceding feature measurements.
2. Choice of the most informative feature xn0 by Eq.(19) and inclusion of the new feature measurementxn0 into the subvector xC .
3. Evaluation of the stopping rule (23). A valid condi-tion implies making the final Bayesian classificationaccording to the a posteriori distribution (18), other-wise the algorithm continues by point 1.
6 Illustrating Example
The proposed sequential recognition controlled by maxi-mum conditional informativity guarantees the best possiblestrategy in the sense that, for any sub-vector of previouslyobserved features xC = (xi1 , . . . , xik
), the next chosenfeature measurement minimizes the expected decision un-certainty HxC
(Ω|Xn). The result is of theoretical nature.In other words, any other method of sequential recogni-tion based on the same probabilistic description of classesP (x|ω)p(ω), ω ∈ Ω can only approach or achieve the sameexpected decrease of decision uncertainty. In this respectthe only application dependent aspect is the quality of theestimated product mixtures.
Obviously, the practical justification of product mix-tures by numerical examples is beyond the scope of thepresent paper, here we refer mainly to our papers published
in the last years (cf. Sec. 4) and to the paper of [23]. Thefollowing example of recognition of numerals in the binaryraster representation rather illustrates different propertiesof the proposed method, especially the great variability ofdecisions in the initial stages of sequential recognition andalso the well known trade-off between the error rate and therelated number of observed variables. Simultaneously, wemake use of the possibility to visualize the changing ”ex-pectations” of the classifier with the increasing number ofuncovered raster fields.
In recent years we have repeatedly applied multivari-ate Bernoulli mixtures to recognition of handwritten nu-merals from the NIST benchmark database, with the goalof verifying different decision-making aspects [15, 16].The considered NIST Special Database 19 (SD19) containsabout 400 000 handwritten numerals in binary raster repre-sentation (about 40 000 for each numeral). We normalizedall digit patterns to a 32×32 binary raster to obtain 1024-dimensional binary data vectors x ∈ 0, 11024. In order toguarantee the same statistical properties of the training- andtest-data set, we have used the odd samples of each class fortraining and the even samples for testing. Also, to increasethe variability of the binary patterns, we extended the train-ing data sets four times by making three differently rotatedvariants of each pattern (by -2, -1 and +1 degrees) with theresulting 80 000 training data vectors for each class.
We approximated the class-conditional distributionsof the 1024-dimensional binary patterns by multivariateBernoulli mixtures
P (x|ω) =∑
m∈Mω
wm
∏n∈N
fn(xn|m), xn ∈ 0, 1,
(25)fn(xn|m) = θxn
mn(1− θmn)1−xn , 0 ≤ θmn ≤ 1, ω ∈ Ω.
In order to estimate the class-conditional distributions (25),we have used the structural modification of the EM algo-rithm [15, 16] with the goal of suppressing the noisy pa-rameters of the model. Nevertheless, the resulting compo-nents are formally identical with (25), i.e., we have
F (x|m) =∏
n∈Nθxn
mn(1− θmn)1−xn , (26)
with the only difference being that some of the parame-ters θmn are fixed and replaced by their common mean val-ues. The resulting number of components was M=2007with the number of parameters θmn totalling to 1,797,878.The quality of the estimated class-conditional mixtures hasbeen verified by classifying the numerals from the inde-pendent test sets (20 000 for each class) with the resultingglobal error rate of 2.696%. The corresponding classifica-tion error matrix is shown in Table 1 in detail.
According to the sequential scheme we assume thatthe recognized numeral on the raster is not visible and theraster fields become uncovered successively. For this pur-pose, given a sub-vector of visible raster fields xC , wehave to evaluate at each stage the conditional informativ-ity IxC
(Xn,Ω) for all the remaining raster fields xn, (n ∈
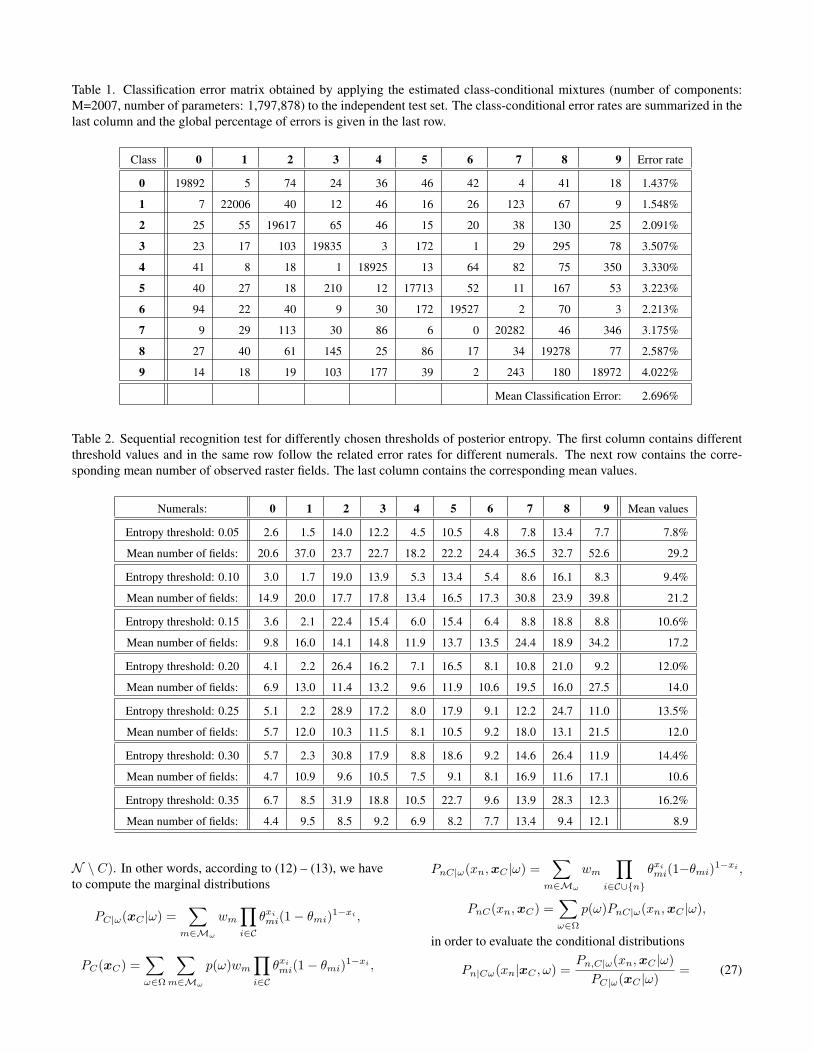
Table 1. Classification error matrix obtained by applying the estimated class-conditional mixtures (number of components:M=2007, number of parameters: 1,797,878) to the independent test set. The class-conditional error rates are summarized in thelast column and the global percentage of errors is given in the last row.
Class 0 1 2 3 4 5 6 7 8 9 Error rate
0 19892 5 74 24 36 46 42 4 41 18 1.437%
1 7 22006 40 12 46 16 26 123 67 9 1.548%
2 25 55 19617 65 46 15 20 38 130 25 2.091%
3 23 17 103 19835 3 172 1 29 295 78 3.507%
4 41 8 18 1 18925 13 64 82 75 350 3.330%
5 40 27 18 210 12 17713 52 11 167 53 3.223%
6 94 22 40 9 30 172 19527 2 70 3 2.213%
7 9 29 113 30 86 6 0 20282 46 346 3.175%
8 27 40 61 145 25 86 17 34 19278 77 2.587%
9 14 18 19 103 177 39 2 243 180 18972 4.022%
Mean Classification Error: 2.696%
Table 2. Sequential recognition test for differently chosen thresholds of posterior entropy. The first column contains differentthreshold values and in the same row follow the related error rates for different numerals. The next row contains the corre-sponding mean number of observed raster fields. The last column contains the corresponding mean values.
Numerals: 0 1 2 3 4 5 6 7 8 9 Mean values
Entropy threshold: 0.05 2.6 1.5 14.0 12.2 4.5 10.5 4.8 7.8 13.4 7.7 7.8%
Mean number of fields: 20.6 37.0 23.7 22.7 18.2 22.2 24.4 36.5 32.7 52.6 29.2
Entropy threshold: 0.10 3.0 1.7 19.0 13.9 5.3 13.4 5.4 8.6 16.1 8.3 9.4%
Mean number of fields: 14.9 20.0 17.7 17.8 13.4 16.5 17.3 30.8 23.9 39.8 21.2
Entropy threshold: 0.15 3.6 2.1 22.4 15.4 6.0 15.4 6.4 8.8 18.8 8.8 10.6%
Mean number of fields: 9.8 16.0 14.1 14.8 11.9 13.7 13.5 24.4 18.9 34.2 17.2
Entropy threshold: 0.20 4.1 2.2 26.4 16.2 7.1 16.5 8.1 10.8 21.0 9.2 12.0%
Mean number of fields: 6.9 13.0 11.4 13.2 9.6 11.9 10.6 19.5 16.0 27.5 14.0
Entropy threshold: 0.25 5.1 2.2 28.9 17.2 8.0 17.9 9.1 12.2 24.7 11.0 13.5%
Mean number of fields: 5.7 12.0 10.3 11.5 8.1 10.5 9.2 18.0 13.1 21.5 12.0
Entropy threshold: 0.30 5.7 2.3 30.8 17.9 8.8 18.6 9.2 14.6 26.4 11.9 14.4%
Mean number of fields: 4.7 10.9 9.6 10.5 7.5 9.1 8.1 16.9 11.6 17.1 10.6
Entropy threshold: 0.35 6.7 8.5 31.9 18.8 10.5 22.7 9.6 13.9 28.3 12.3 16.2%
Mean number of fields: 4.4 9.5 8.5 9.2 6.9 8.2 7.7 13.4 9.4 12.1 8.9
N \ C). In other words, according to (12) – (13), we haveto compute the marginal distributions
PC|ω(xC |ω) =∑
m∈Mω
wm
∏i∈C
θximi(1− θmi)1−xi ,
PC(xC) =∑ω∈Ω
∑m∈Mω
p(ω)wm
∏i∈C
θximi(1− θmi)1−xi ,
PnC|ω(xn,xC |ω) =∑
m∈Mω
wm
∏i∈C∪n
θximi(1−θmi)1−xi ,
PnC(xn,xC) =∑ω∈Ω
p(ω)PnC|ω(xn,xC |ω),
in order to evaluate the conditional distributions
Pn|Cω(xn|xC , ω) =Pn,C|ω(xn,xC |ω)PC|ω(xC |ω)
= (27)
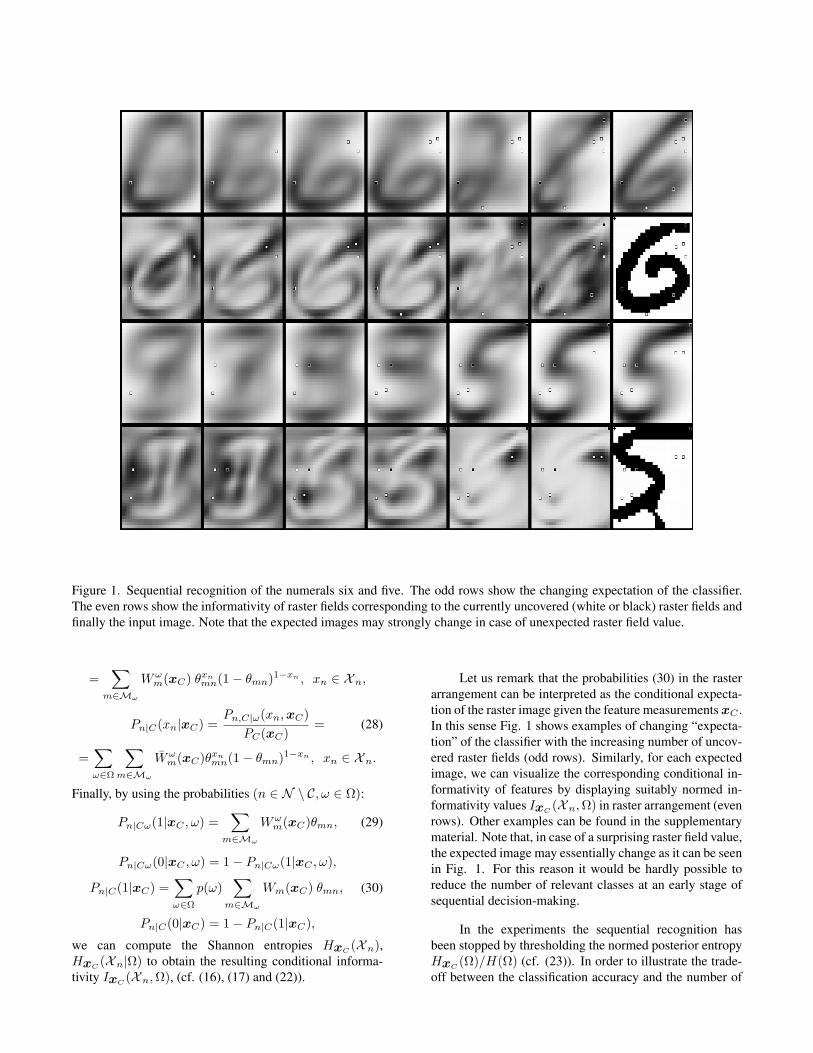
Figure 1. Sequential recognition of the numerals six and five. The odd rows show the changing expectation of the classifier.The even rows show the informativity of raster fields corresponding to the currently uncovered (white or black) raster fields andfinally the input image. Note that the expected images may strongly change in case of unexpected raster field value.
=∑
m∈Mω
Wωm(xC) θxn
mn(1− θmn)1−xn , xn ∈ Xn,
Pn|C(xn|xC) =Pn,C|ω(xn,xC)
PC(xC)= (28)
=∑ω∈Ω
∑m∈Mω
Wωm(xC)θxn
mn(1− θmn)1−xn , xn ∈ Xn.
Finally, by using the probabilities (n ∈ N \ C, ω ∈ Ω):
Pn|Cω(1|xC , ω) =∑
m∈Mω
Wωm(xC)θmn, (29)
Pn|Cω(0|xC , ω) = 1− Pn|Cω(1|xC , ω),
Pn|C(1|xC) =∑ω∈Ω
p(ω)∑
m∈Mω
Wm(xC) θmn, (30)
Pn|C(0|xC) = 1− Pn|C(1|xC),
we can compute the Shannon entropies HxC(Xn),
HxC(Xn|Ω) to obtain the resulting conditional informa-
tivity IxC(Xn,Ω), (cf. (16), (17) and (22)).
Let us remark that the probabilities (30) in the rasterarrangement can be interpreted as the conditional expecta-tion of the raster image given the feature measurements xC .In this sense Fig. 1 shows examples of changing “expecta-tion” of the classifier with the increasing number of uncov-ered raster fields (odd rows). Similarly, for each expectedimage, we can visualize the corresponding conditional in-formativity of features by displaying suitably normed in-formativity values IxC
(Xn,Ω) in raster arrangement (evenrows). Other examples can be found in the supplementarymaterial. Note that, in case of a surprising raster field value,the expected image may essentially change as it can be seenin Fig. 1. For this reason it would be hardly possible toreduce the number of relevant classes at an early stage ofsequential decision-making.
In the experiments the sequential recognition hasbeen stopped by thresholding the normed posterior entropyHxC
(Ω)/H(Ω) (cf. (23)). In order to illustrate the trade-off between the classification accuracy and the number of
uncovered raster fields, we have tested several thresholds inthe stopping rule (23) on the independent test set. Table 2describes the sequential classification results in detail. Thefirst column contains in even rows the different thresholdvalues τ and in the same row follow the corresponding er-ror rates for different numerals. The next row contains therelated mean numbers of uncovered raster fields. The lastcolumn contains the global mean values for the underly-ing stopping rule. It can be seen that, for the thresholdτ = 0.05, about 30 raster fields are sufficient in the meanto achieve the classification error of 7.8%. Recall that withall 1024 uncovered raster fields our sequential recognitionscheme achieves the same global error 2.696% as the non-sequential classifier from Tab. 1.
7 Concluding Remarks
The sequential problem of statistical pattern recognitioncan be solved in full generality by approximating the class-conditional distributions using mixtures of product compo-nents. In particular, at each stage, given a set of observedmeasurements, we can compute the conditional informa-tivity of all remaining features and choose the next mostinformative feature. The most informative feature min-imizes the expected decision uncertainty with respect tothe estimated product mixtures. We recall that the prod-uct mixtures are suitable to approximate unknown multi-dimensional and multimodal probability distributions (cf.Sec.4). Moreover, we have shown earlier that the mixturesof product components can be used as a knowledge baseof the Probabilistic Expert System PES [12]. This systemhas recently been applied to reproduce the statistical prop-erties of the confidential questionnaire data from the CzechCensus 2001 [17]. We recall that by using the final interac-tive software product [32] the user can derive, with a highdegree of accuracy, the marginal distribution of any queryvariable, possibly conditioned on the values of a set of anyevidence variables. In this way the statistical properties ofarbitrary subpopulations can be studied in detail.
In case of medical decision-making the sequentialclassification can be used to design interactive statisticaldatabases - in the sense of the above mentioned census ap-plication. The initial database can be designed by medicalexperts and further developed by means of interactive ques-tioning software. The expert knowledge can be introducedin the database by manually editing the component param-eters and, on the other hand, an open access medical expertsystem can accumulate user-supplied anonymous “ques-tionnaires.” We recall that the statistical knowledge base inthe form of a product mixture can be estimated from incom-plete data [17] and repeatedly upgraded by the increasingdata sets. Simultaneously it is possible to identify and re-move unreliable questionnaires as data records having lowprobability. In the case of advanced database the relevanceof new manually designed components and features maybe automatically verified by means of the EM algorithm interms of component weights estimated from data.
Acknowledgment
Supported by the Grant of the Czech Science FoundationNo. 14-02652S and 14-10911S.
References
[1] Ben-Bassat, M., 1978. Myopic policies in sequen-tial classification, IEEE Trans. Computers, C-27, 170-174.
[2] Ben-Bassat, M., 1980. Pattern-Based Interactive Di-agnosis of Multiple Disorders: The MEDAS System,IEEE Trans. Pattern Analysis and Machine Intelli-gence, PAMI-2, 148-160.
[3] Ben-Bassat, M., Teeni, D., 1984. Human-oriented in-formation acquisition in sequential pattern classifica-tion: Part I—Single membership classification., IEEETrans. Systems, Man and Cybernetics, 14 (1), 131-138.
[4] Bimbo, A.D., Pernici, F., 2006. Towards on-line sac-cade planning for high-resolution image sensing. Pat-tern Recognition Letters, 27(15), 1826-1834.
[5] Cardillo, G.P., Fu, K.S, 1968. On suboptimal sequen-tial pattern recognition, IEEE Trans. Computers, C-17(8) 789-792.
[6] Dempster, A.P., Laird, N.M., Rubin, D.B., 1977.Maximum likelihood from incomplete data via theEM algorithm. J. Roy. Statist. Soc, B, 39 l-38.
[7] Flehinger, B.J., Engle, R.L., 1975. HEME: ASelf-Improving Computer Program for Diagnosis-Oriented Analysis of Hematologic Diseases, IBMJournal of Research and Development, 19 (6) 557-564.
[8] Fu, K.S., 1968. Sequential Methods in Pattern Recog-nition and Machine Learning, New York: Academic.
[9] Grim, J., 1982. On numerical evaluation of maximum- likelihood estimates for finite mixtures of distribu-tions, Kybernetika, l8 (3) 173-190.http://dml.cz/dmlcz/124132
[10] Grim, J., 1986. Multivariate statistical pattern recog-nition with non-reduced dimensionality, Kybernetika,22 (2) 142-157.http://dml.cz/dmlcz/125022
[11] Grim, J., 1986b. Sequential decision-making in pat-tern recognition based on the method of independentsubspaces. Proc. DIANA II Conference on Discrimi-nant Analysis, (Ed. F. Zitek), Mathematical Instituteof the AS CR, Prague, 139-149.
[12] Grim, J., 1994. Knowledge representation and uncer-tainty processing in the probabilistic expert systemPES, International Journal of General Systems, 22 (2)103 - 111.
[13] Grim, J., 2011. Preprocessing of Screening Mammo-grams Based on Local Statistical Models, Proc. 4thInt. Symposium on Applied Sciences in Biomedicaland Communication Technologies (ISABEL 2011),Barcelona, ACM, 1-5.
[14] Grim, J., Haindl, M., Somol, P., Pudil, P., 2006.A subspace approach to texture modeling by usingGaussian mixtures, Proceedings of the 18th IAPR In-ternational Conference on Pattern Recognition ICPR2006, B. Haralick, T. K. Ho Eds.), Los Alamitos,IEEE Computer Society, 235-238.
[15] Grim, J., Hora, J., 2008. Iterative principles of recog-nition in probabilistic neural networks, Neural Net-works, 21 (6) 838-846.
[16] Grim, J., Hora, J., 2010. Computational Propertiesof Probabilistic Neural Networks, Proc. Int. Conf.Artificial Neural Networks – ICANN 2010 Part II,Springer: Berlin, LNCS 5164, 52-61.
[17] Grim, J., Hora, J., Bocek, P., Somol, P., Pudil, P.,2010b. Statistical Model of the 2001 Czech Censusfor Interactive Presentation, Journal of Official Statis-tics, 26 (4) 673–694.
[18] Grim, J., Novovicova J., Somol, P., 2006b. Struc-tural Poisson mixtures for classification of docu-ments, Proc. 18th IAPR International Conference onPattern Recognition ICPR 2006, 1 – 4,http://dx.doi.org/10.1109/ICPR.2008.4761669
[19] Grim, J., Somol, P., Haindl, M., Danes, J., 2009.Computer-Aided Evaluation of Screening Mammo-grams Based on Local Texture Models, IEEE Trans.Image Processing, 18 (4) 765-773.
[20] Grim, J., Somol, P., Pudil, P., 2010. Digital ImageForgery Detection by Local Statistical Models, Proc.2010 Sixth International Conference on IntelligentInformation Hiding and Multimedia Signal Process-ing, Los Alamitos, California, IEEE computer soci-ety, (Eds. Echizen, I. et al.), 579-582.
[21] Hussain, A.B.S., Donaldson, R.W., 1974. Suboptimalsequential decision schemes with on-line feature or-dering, IEEE Trans. Computers, C-23, 582-590.
[22] Kurzynski, M., Zolnierek, A., 2005. Sequential pat-tern recognition: naive Bayes versus fuzzy relationmethod, Proc. Int. Conf. on Computational Intelli-gence for Modelling, Control and Automation, IEEE,1, 1165-1170.
[23] Lowd, D., Domingos, P., 2005. Naive Bayes modelsfor probability estimation, Proc. 22nd Int. Conf. onMachine Learning, ACM, 529-536.
[24] Novovicova, J., Pudil, P., Kittler, J., 2005. Divergencebased feature selection for multimodal class densi-ties, IEEE Trans. Pattern Analysis and Machine In-telligence, 18 (2) 218–223.
[25] Parzen, E., 1962. On estimation of a probability den-sity function and its mode, Annals of MathematicalStatistics, 33, 1065-1076.
[26] Sochman, J., Matas, J., 2005. WaldBoost - learningfor time constrained sequential detection, ComputerVision and Pattern Recognition, (CVPR 2005), IEEEComputer Society Conference on CVPR, 2, 20-25.
[27] Sochman, J., Matas, J., 2009. Learning Fast Emula-tors of Binary Decision Processes, International Jour-nal of Computer Vision, 83 (2) 149-163.
[28] Schlesinger, M.I., 1968. Relation between learningand self learning in pattern recognition, (in Russian),Kibernetika, (Kiev), (2) 81-88.
[29] Vajda, I., 1989. Theory of statistical inference and in-formation, Kluwer Academic Publishers (Dordrechtand Boston).
[30] Wald, A., 1947. Sequential Analysis, New York: JohnWiley & Sons, 1947.
[31] Willink, R., 2008. A sequential algorithm for recog-nition of a developing pattern with application in or-thotic engineering, Pattern Recognition, 41 (2) 627-636.
[32] http://ro.utia.cas.cz/dem.html