incredible shrinking planet, sma, dc, apr 2016
TRANSCRIPT

The Incredible Shrinking Planet:Use Protection to Avoid S.T.D.s
(Steel Trade Deluges)Presentation at the:
Annual Members Conference Washington, DC
by: Becky E. Hites, PresidentApril 27, 2016
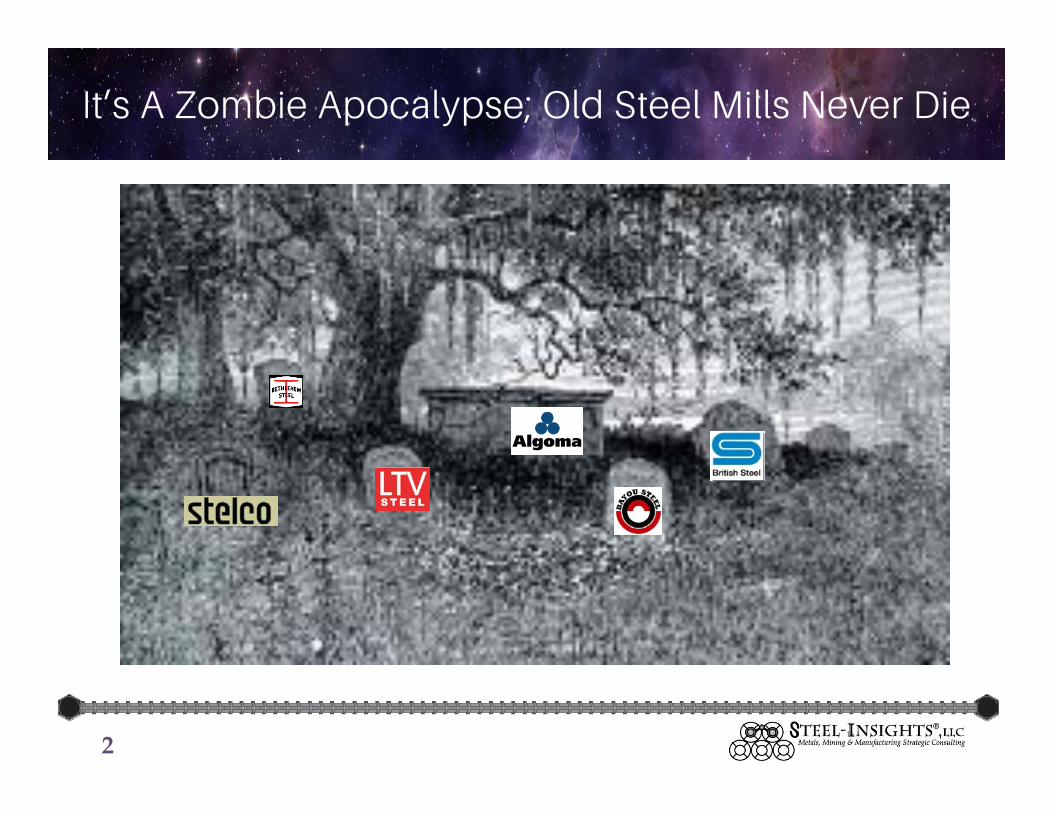
It’s A Zombie Apocalypse; Old Steel Mills Never Die
2
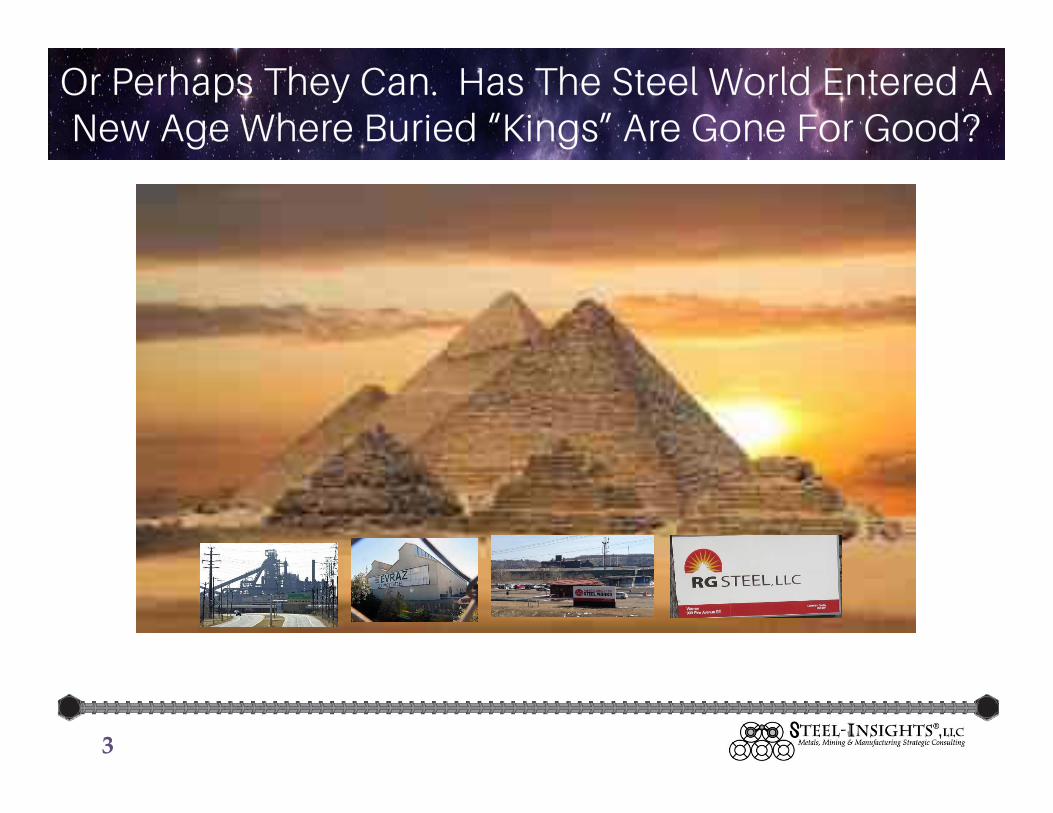
Or Perhaps They Can. Has The Steel World Entered A New Age Where Buried “Kings” Are Gone For Good?
3

Or What We All Really Want To Know Is “How Fast Can China Fill Up Its Steel Mill Burial Grounds?”
4

Our New Challenging World
• Less homogeneous economic growth.• Commodity oversupply for the next half decade
will impact pricing.• China’s attempt to shift back to a consumer
based economy has stalled growth in many trade partner countries.
• Currency instability has disrupted global trade.• Managing through tumultuous times requires
tenacity.
5
Steel Market Highlights
• Steel is oversupplied both globally and in the North American market (perhaps not currently with over 10.4 million tons of blast furnace capacity idle at the moment).
• Pricing globally has been driven by falling raw material costs and “cheap” foreign offerings.
• Demand is “ok” but not superb.• Commodity cycle will likely have a protracted
price bottom, which will keep downward pressure on steel prices for longer than “usual”.
6
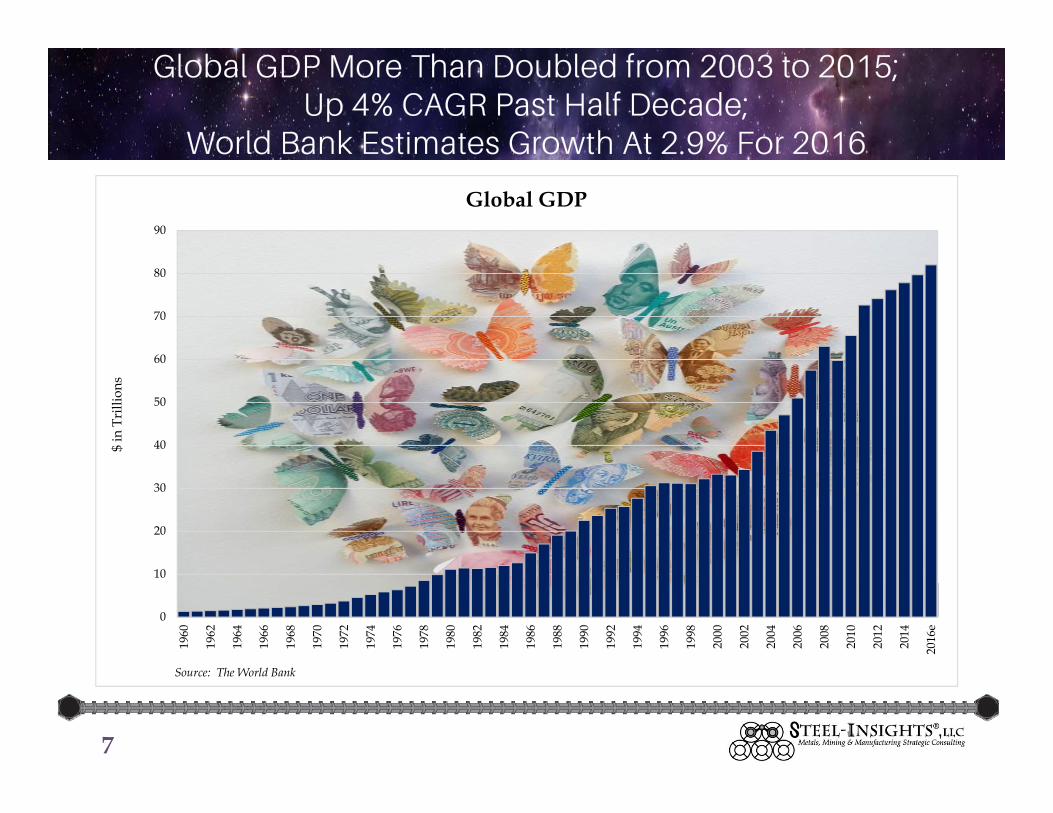
Global GDP More Than Doubled from 2003 to 2015;Up 4% CAGR Past Half Decade;
World Bank Estimates Growth At 2.9% For 2016
7
0
10
20
30
40
50
60
70
80
90
1960
1962
1964
1966
1968
1970
1972
1974
1976
1978
1980
1982
1984
1986
1988
1990
1992
1994
1996
1998
2000
2002
2004
2006
2008
2010
2012
2014
2016
e
$ in
Tri
llion
s
Global GDP
Source: The World Bank
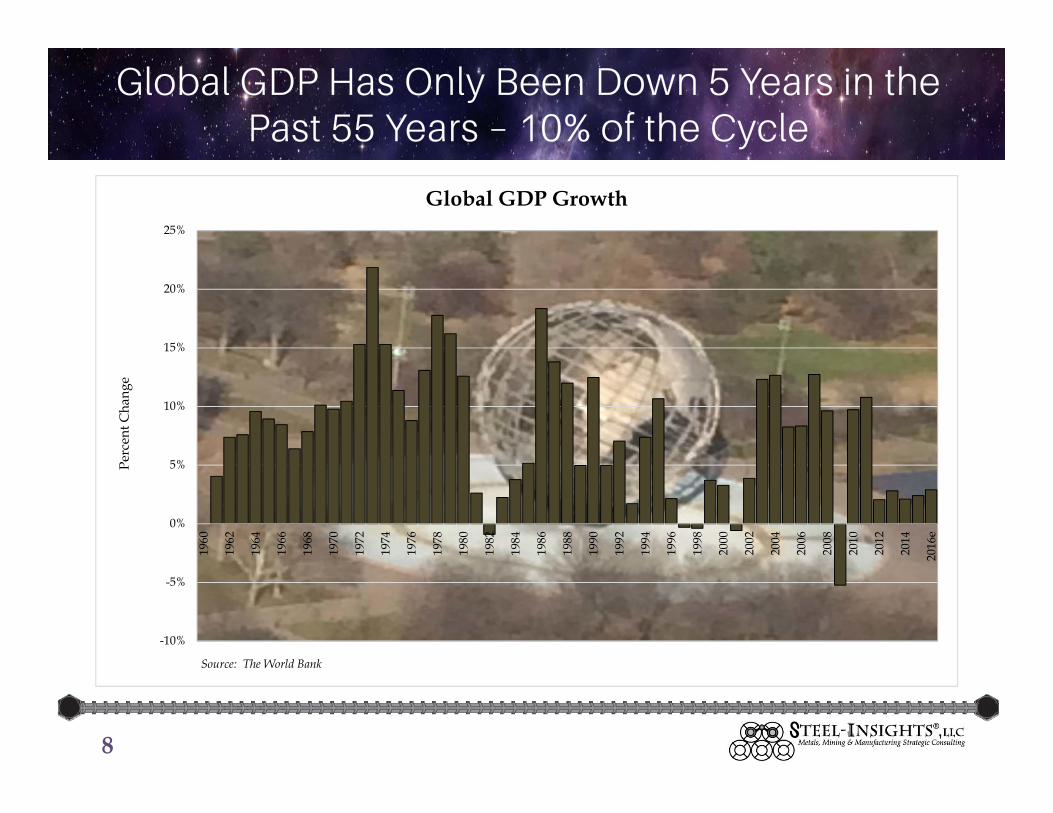
Global GDP Has Only Been Down 5 Years in the Past 55 Years – 10% of the Cycle
8
-10%
-5%
0%
5%
10%
15%
20%
25%
1960
1962
1964
1966
1968
1970
1972
1974
1976
1978
1980
1982
1984
1986
1988
1990
1992
1994
1996
1998
2000
2002
2004
2006
2008
2010
2012
2014
2016
e
Perc
ent C
hang
e
Global GDP Growth
Source: The World Bank

Europe and North America Account forAlmost Half of the Global Economy
9
North America25%
European Union24%
East Asia & Pacific (all income levels) less
China14%
China13%
Latin America & Caribbean (all income levels)
8%
Europe & Central Asia (all income levels)
6%
MENA5%
South Asia3%
Other2%
Global GDP by Region, 2014
Source: The World Bank
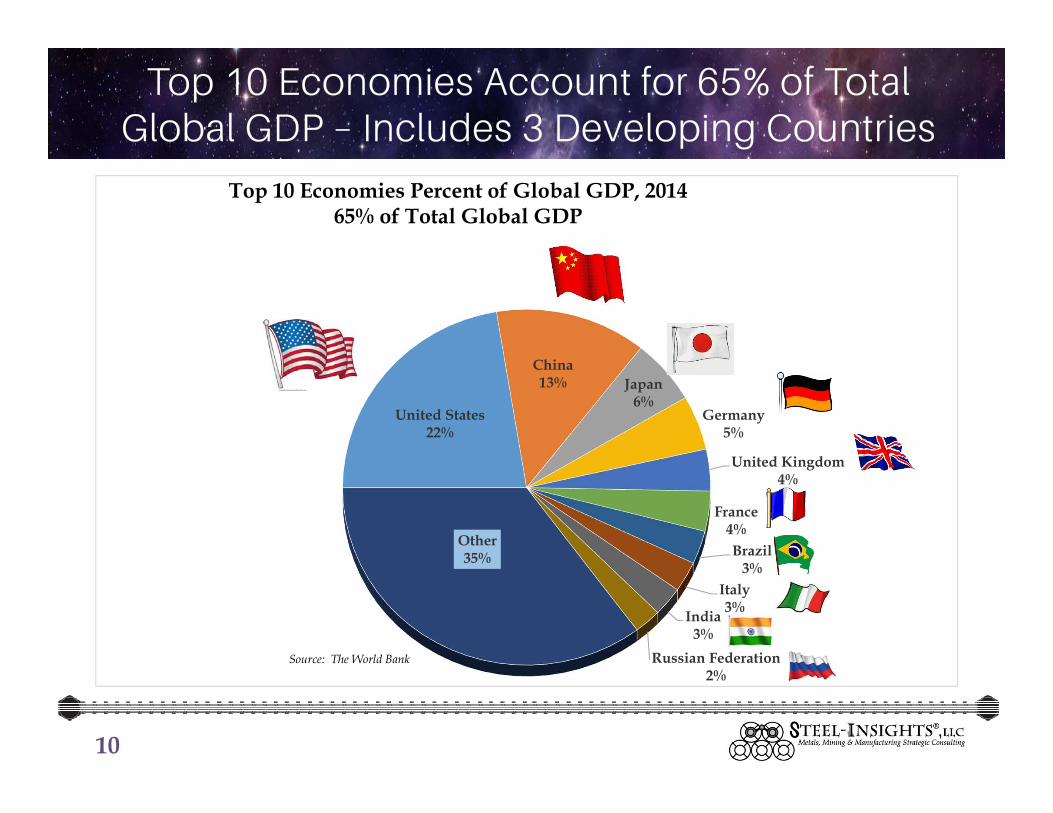
Top 10 Economies Account for 65% of Total Global GDP – Includes 3 Developing Countries
10
United States22%
China13% Japan
6%Germany
5%
United Kingdom4%
France4%Brazil
3%Italy3%India
3%Russian Federation
2%
Other35%
Top 10 Economies Percent of Global GDP, 201465% of Total Global GDP
Source: The World Bank

Global GDP in Sync in 2003/2004 and 2011
11
2003 2004 2005 2006 2007 2008 2009 2010 2011 2012 2013 2014 2015e 2016eWorld 38.6 43.5 47.1 51.0 57.5 63.1 59.8 65.6 72.7 74.2 76.2 77.8 79.7 82.0North America 12.4 13.3 14.3 15.2 15.9 16.3 15.8 16.6 17.3 18.0 18.6 19.2 21.0 European Union 11.9 13.7 14.3 15.3 17.7 19.0 17.0 16.9 18.3 17.2 18.0 18.5 East Asia & Pacific (all income levels) less China 6.8 7.5 7.8 8.0 8.5 9.3 9.2 10.6 11.8 12.2 11.4 11.1 China 1.6 1.9 2.3 2.7 3.5 4.6 5.1 6.0 7.5 8.5 9.5 10.4 11.1 11.8 Latin America & Caribbean (all income levels) 2.0 2.4 2.9 3.4 4.0 4.6 4.3 5.4 6.1 6.1 6.3 6.2 Europe & Central Asia (all income levels) 1.5 1.9 2.3 2.7 3.4 4.1 3.3 3.9 4.6 4.8 5.0 4.7 MENA 1.1 1.3 1.5 1.8 2.1 2.6 2.4 2.7 3.3 3.5 3.6 3.5 South Asia 0.8 0.9 1.1 1.2 1.5 1.6 1.7 2.1 2.3 2.3 2.4 2.6 Other 0.5 0.6 0.7 0.8 0.9 1.0 1.0 1.3 1.5 1.5 1.6 1.7 Arab World 0.8 1.0 1.2 1.4 1.6 2.1 1.8 2.1 2.5 2.8 2.8 2.8
Growth RatesWorld 12.3% 12.7% 8.3% 8.3% 12.7% 9.6% -5.2% 9.7% 10.8% 2.1% 2.8% 2.1% 2.4% 2.9%North America 5.7% 7.2% 7.3% 6.4% 5.1% 2.0% -2.9% 5.0% 4.4% 4.0% 3.4% 3.2%European Union 21.9% 15.5% 4.6% 6.7% 15.6% 7.6% -10.6% -0.4% 8.1% -5.9% 4.3% 2.9%East Asia & Pacific (all income levels) less China 9.3% 10.8% 3.8% 2.1% 6.3% 9.5% -1.0% 15.2% 11.1% 3.4% -6.8% -2.3%China 12.9% 17.7% 16.8% 20.3% 29.1% 29.4% 11.0% 19.4% 24.1% 12.9% 12.2% 9.1% 6.9% 6.5%Latin America & Caribbean (all income levels) 3.0% 16.2% 21.1% 17.4% 18.1% 16.2% -6.0% 23.8% 13.3% 0.5% 2.4% -1.4%Europe & Central Asia (all income levels) 22.2% 25.0% 20.2% 18.0% 24.1% 21.3% -18.7% 17.5% 18.8% 3.2% 4.3% -5.9%MENA 12.6% 16.3% 20.5% 17.1% 18.8% 24.9% -10.8% 16.4% 19.9% 7.8% 0.7% -1.8%South Asia 16.7% 16.0% 14.6% 14.3% 26.7% 1.7% 9.9% 22.7% 9.1% 0.8% 2.6% 9.6%Arab World 12.9% 17.3% 23.0% 18.6% 17.2% 26.8% -13.6% 17.0% 18.7% 10.5% 2.7% 0.6%
Source: The World Bank
GDP by Region($ in Trillions)

Two of the Top 10 Economies – Brazil and Russia - Were Down in 2015; USA & Mexico Was Up 2.4%, Canada Was Up 1.2%
12
2003 2004 2005 2006 2007 2008 2009 2010 2011 2012 2013 2014 2015eUnited States 11.5 12.3 13.1 13.9 14.5 14.7 14.4 15.0 15.5 16.2 16.8 17.4 17.8 China 1.6 1.9 2.3 2.7 3.5 4.6 5.1 6.0 7.5 8.5 9.5 10.4 11.1 Japan 4.3 4.7 4.6 4.4 4.4 4.8 5.0 5.5 5.9 6.0 4.9 4.6 4.6 Germany 2.5 2.8 2.9 3.0 3.4 3.8 3.4 3.4 3.8 3.5 3.7 3.9 3.9 United Kingdom 1.9 2.3 2.4 2.6 3.0 2.8 2.3 2.4 2.6 2.6 2.7 2.9 3.0 France 1.8 2.1 2.2 2.3 2.7 2.9 2.7 2.6 2.9 2.7 2.8 2.8 2.9 Brazil 0.6 0.7 0.9 1.1 1.4 1.7 1.7 2.2 2.6 2.4 2.4 2.3 2.3 Italy 1.6 1.8 1.9 1.9 2.2 2.4 2.2 2.1 2.3 2.1 2.1 2.1 2.2 India 0.6 0.7 0.8 0.9 1.2 1.2 1.4 1.7 1.8 1.8 1.9 2.1 2.2 Russian Federation 0.4 0.6 0.8 1.0 1.3 1.7 1.2 1.5 1.9 2.0 2.1 1.9 1.8 Other 11.7 13.6 15.3 17.2 20.0 22.5 20.4 23.0 25.9 26.4 27.4 27.4
Top 10 26.9 29.9 31.8 33.8 37.6 40.6 39.4 42.5 46.8 47.8 48.9 50.4 Percent of Total 70% 69% 67% 66% 65% 64% 66% 65% 64% 64% 64% 65%
Canada 0.9 1.0 1.2 1.3 1.5 1.5 1.4 1.6 1.8 1.8 1.8 1.8 1.8 Mexico 0.7 0.8 0.9 1.0 1.0 1.1 0.9 1.0 1.2 1.2 1.3 1.3 1.3
Top 10 Economies Growth RatesUnited States 4.9% 6.6% 6.7% 5.8% 4.5% 1.7% -2.0% 3.8% 3.7% 4.2% 3.7% 3.9% 2.4%China 12.9% 17.7% 16.8% 20.3% 29.1% 29.4% 11.0% 19.4% 24.1% 12.9% 12.2% 9.1% 6.9%Japan 8.1% 8.2% -1.8% -4.7% 0.0% 11.3% 3.8% 9.1% 7.5% 0.8% -17.4% -6.5% 0.6%Germany 20.5% 12.5% 1.5% 4.9% 14.6% 9.1% -8.9% 0.0% 10.0% -5.8% 5.8% 3.3% 1.5%United Kingdom 16.1% 18.2% 5.0% 7.1% 14.7% -5.8% -17.3% 4.3% 7.6% 0.9% 2.4% 9.8% 2.2%France 23.2% 14.9% 3.7% 5.5% 14.5% 9.8% -7.9% -1.7% 8.1% -6.3% 4.8% 0.7% 1.1%Brazil 9.9% 19.8% 33.2% 24.2% 26.0% 21.4% -1.8% 32.7% 18.4% -7.7% -0.9% -1.9% -3.7%Italy 23.9% 14.6% 3.0% 4.9% 13.4% 8.5% -8.6% -2.7% 7.1% -8.9% 2.8% 0.4% 0.7%India 18.0% 16.7% 15.6% 13.8% 30.5% -1.2% 11.5% 25.1% 7.5% -0.2% 1.6% 11.0% 7.2%Russian Federation 24.7% 37.3% 29.3% 29.6% 31.3% 27.8% -26.4% 24.7% 24.9% 5.8% 3.1% -10.5% -3.8%Other 16.1% 16.6% 12.7% 12.0% 16.2% 12.7% -9.3% 13.0% 12.4% 2.0% 3.6% 0.2%
Top 10 10.8% 11.0% 6.2% 6.6% 11.0% 8.0% -2.9% 8.0% 9.9% 2.1% 2.4% 3.2%
Canada 18.0% 14.7% 14.3% 12.6% 11.2% 5.8% -11.1% 17.7% 10.8% 2.5% 0.3% -2.8% 1.2%Mexico -3.8% 8.0% 12.5% 11.4% 8.1% 5.6% -18.9% 17.5% 11.4% 1.3% 6.3% 2.9% 2.4%
Source: The World Bank
Top 10 GDP Economies($ in Trillions)

Not Only Are the Global Economies “Out of Phase”; The Long Cycle of Growth Has Likely Peaked
13
• As early as the 1920s-1930s, theories emerged about a long cycle in the global economies. The Kondratieff Wave (or K-Wave) postulated that economies modulate between high and low growth over a 50-55 year cycle as measured by prices and the inflation rates.
• Over the years, theories about the length of the cycle have proliferated, generally ranging from 20-40 years, and have been tied to some new evolutionary change that refueled the growth engine.

The Information Revolution & China Drove the Last AccelerationWhat Will Drive the Next One?
14

China Embracing Some Aspects of Capitalism Filled The Global Economic Sails in the First Half of the Decade
• During this author’s professional life, I personally have witnessed 3 periods when the world’s economies aligned, resulting in higher global growth and driving commodity prices to new highs as all of the geographic markets competed for limited supply.
• Led by the strong growth in China’s economy starting in 2003, we experienced such a period from 2003-2004, and continued strong growth (Japan’s economy was in recession) until 2008 when the Lehman Crisis triggered a dramatic economic disruption in most countries.
15

Commodities Have a Non-Linear Supply Curve
• Classic economic theory quite accurately predicts that as prices rise with increased demand, supply will be developed to meet that demand.
• Regarding many, if not all, of the raw materials supplying the steel industry and basic industry in general, additional new supply is not linear, but rather choppy in that it takes a period of years to identify the new resource to be developed, obtain the required environmental licenses, establish funding and then develop the mine.
16

Demand Goes Undersupplied, And Prices Rise
• Thus, the demand goes undersupplied for an extended period until supply catches up.
• And often then supply exceeds demand, pushing the cycle into the over-supply phase.
• Where marginal projects that should not have been completed, but were caught up in the exuberance of the shortage, now get terminated.
17
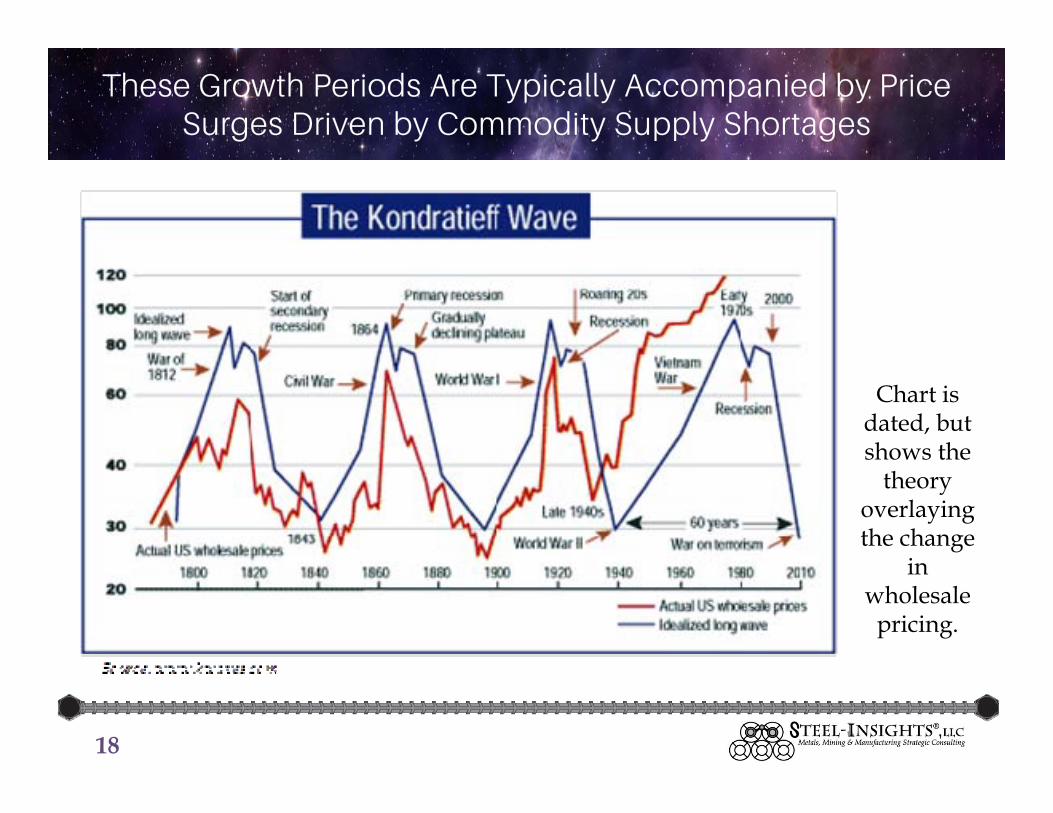
These Growth Periods Are Typically Accompanied by Price Surges Driven by Commodity Supply Shortages
18
Chart is dated, but shows the
theory overlaying the change
in wholesale
pricing.

Global Economic Growth of 2%-3% Feels “Lousy” When You’re Used to 4%-5%
• Most economies had recovered by 2010 and the world was in positive sync again in 2011.
• In 2012, half of the top 10 economies contracted and the economies have been out of sync since.
• Global GDP growth for the past 3 years ranged from 2.0-2.8%.
• The world is still vulnerable to a slowdown which would approach a flat performance.
• Banking system has been shored up since the 2008 meltdown, but is still not resilient. There are concerns over “opening” the European banks.
19

Macro Economic Events Creating Constant Disruption USA Fed, Greece, Brexit, Migrant Crisis, USA Trade Bank Defunded,
Panama Papers, Oil Cartel In Disarray, Saudi Saber Rattling • The USA Federal Reserve Bank raised rates December 2015 despite
multiple global objections. There are now fears of a USA recession.
• Greece’s debt issues have been seemingly resolved in the near term, but the region isn’t stable. The risk from the West’s perspective is that if Russia or China or Iran step up to provide a financial bridge, that would be a significant shift in the power balance of the region.
• EU remains in turmoil with Brexit replacing Grexit as the latest crisis (June decision), provoked in part by the migrant crisis
• EXIM Bank in the USA was defunded mid-2015, but was refunded with the new Highway Bill in December 2015.
• More than one voice prophesying a global economic recession. For sure, no one is predicting a strong global economy.
• Oil. The Saudi’s dropped the price to stem funding of new projects. The USA is now energy self sufficient, and there’s a tug-of-war for market share between OPEC, Russia, and now Iran.
20
Higher Cost Energy – Could be Lower Cost, But Opting for a Cleaner Environment
• Oil has now been in global oversupply for 6 quarters starting Q3 2014 – the longest period in my adult lifetime. Bloomberg, June 16, 2015
• Pope Francis has entered the clean environment fray with an “encyclical” calling for more action to halt climate change.
• Renewable energy generation could overtake coal in 15 year. Financial Times, June 14, 2015
• Between now and 2040, expecting $3.7 trillion in solar energy capital investments. Bloomberg Business, June 23, 2015
21

Global Dislocation & Other “Scandals” Disrupting Economics
• Russia Ukrainian border – Has seriously impacted steel production from Ukraine, which was low cost production, and has somewhat impacted raw material costs into Russia. Russia has rattled its saber about restricting scrap outflows due to shortages in the country.
• Asylum seekers are creating an immigration crisis in Europe. Will the fragile economies be able to absorb the impact, or will it cause them to falter?
• Migrant Crisis has disrupted Europe on multiple levels: humanitarian, diplomatic, financial, security, religion, business
• ISIS – Disrupting Turkey and Russia, Paris and London, and the USA and Mexico. The USA has spent $6 billion on the anti-ISIS campaign.
• VW diesel emissions scandal could further derail Germany’s economic performance. Feb 2016 Germany Q4 growth 0.3%.
• FIFA corruption could impact the next two World Cups. Soccer is big business globally.
22
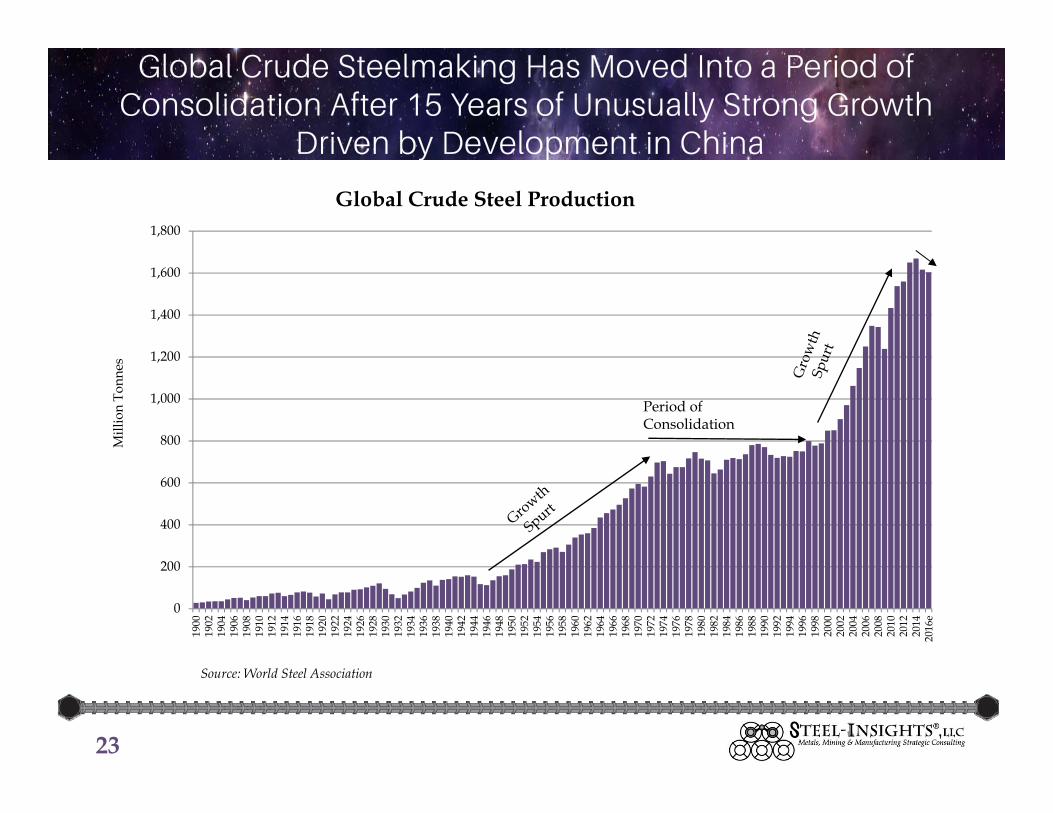
Global Crude Steelmaking Has Moved Into a Period of Consolidation After 15 Years of Unusually Strong Growth
Driven by Development in China
23
0
200
400
600
800
1,000
1,200
1,400
1,600
1,800
1900
1902
1904
1906
1908
1910
1912
1914
1916
1918
1920
1922
1924
1926
1928
1930
1932
1934
1936
1938
1940
1942
1944
1946
1948
1950
1952
1954
1956
1958
1960
1962
1964
1966
1968
1970
1972
1974
1976
1978
1980
1982
1984
1986
1988
1990
1992
1994
1996
1998
2000
2002
2004
2006
2008
2010
2012
2014
2016
e
Mill
ion
Tonn
es
Global Crude Steel Production
Source: World Steel Association
Period ofConsolidation

The Steel Industry is Highly Cyclical and Closely Correlated to the Commodity Cycle – The Current Correction is Moderate
Compared to Past Cycles – BUT BIG CHANGES IN STRUCTURE
24
-40%
-30%
-20%
-10%
0%
10%
20%
30%
40%
50%
60%
1900
1905
1910
1915
1920
1925
1930
1935
1940
1945
1950
1955
1960
1965
1970
1975
1980
1985
1990
1995
2000
2005
2010
2015
Perc
enta
ge C
hang
e
Global Crude Steel Production Year-Over-Year Change
Source: World Steel Association

China Added 900 Million Tonnes of Crude Steelmaking Capacity Over the Past 15 Years
And Now Accounts for 50% of Global Capacity
25
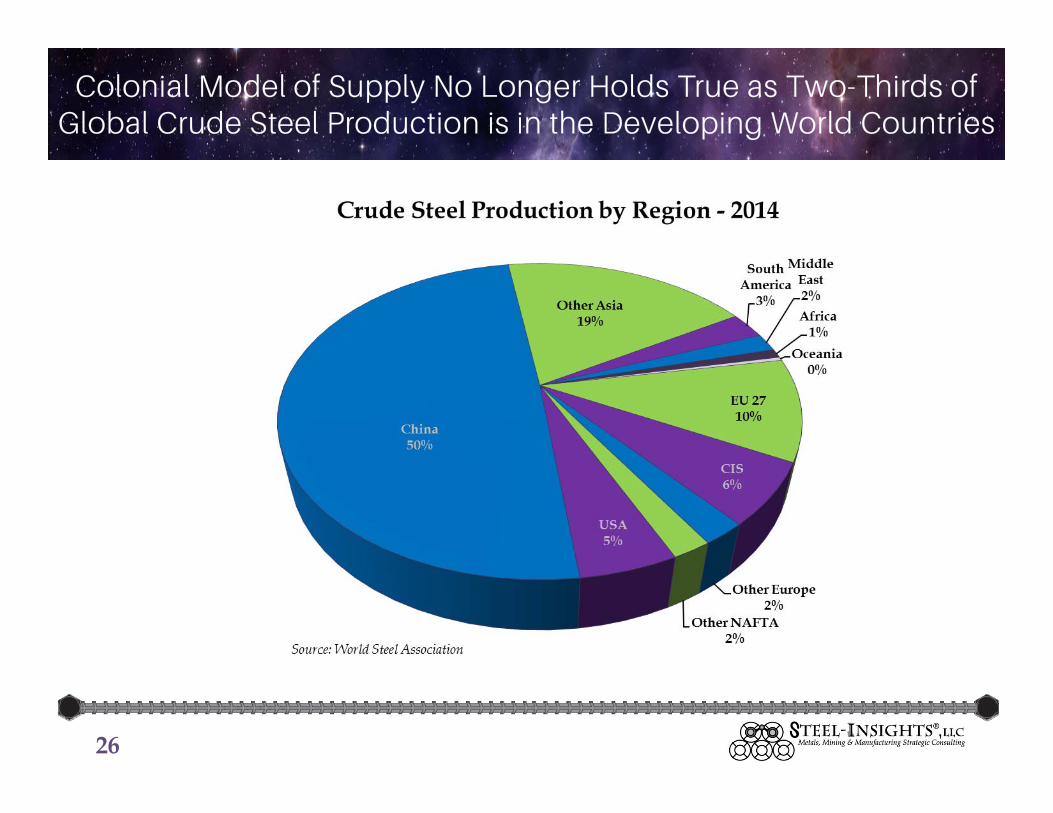
Colonial Model of Supply No Longer Holds True as Two-Thirds of Global Crude Steel Production is in the Developing World Countries
26
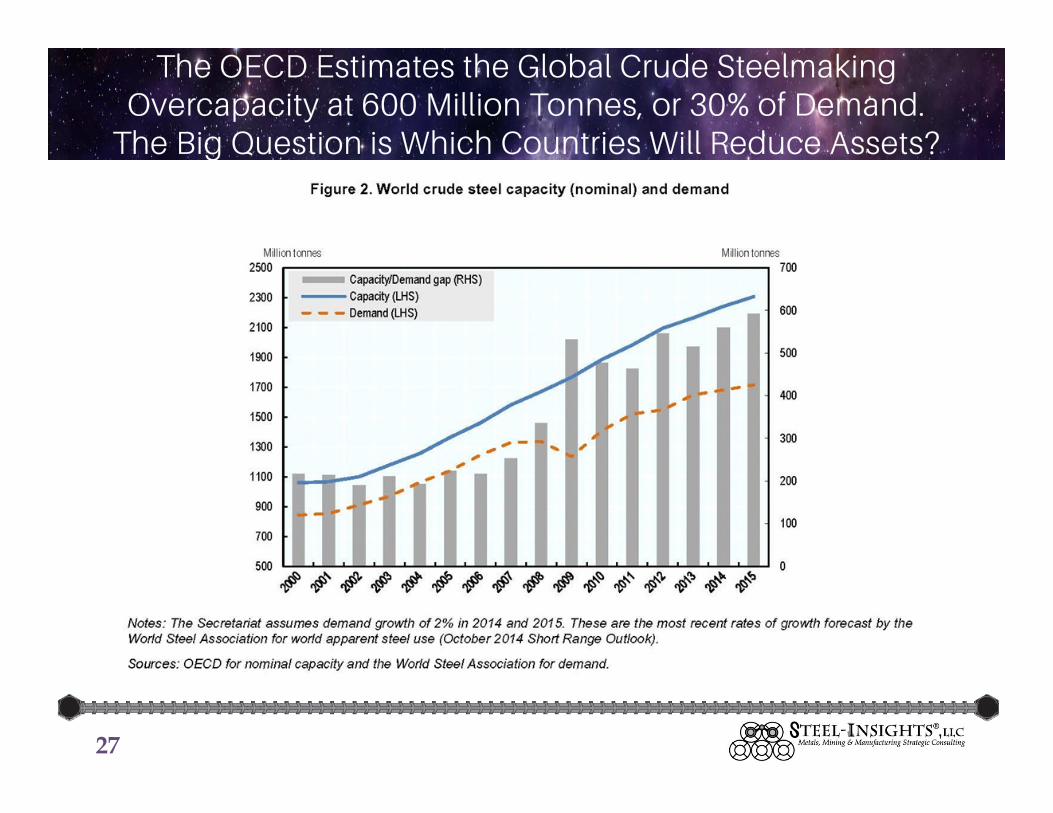
The OECD Estimates the Global Crude Steelmaking Overcapacity at 600 Million Tonnes, or 30% of Demand.
The Big Question is Which Countries Will Reduce Assets?
27
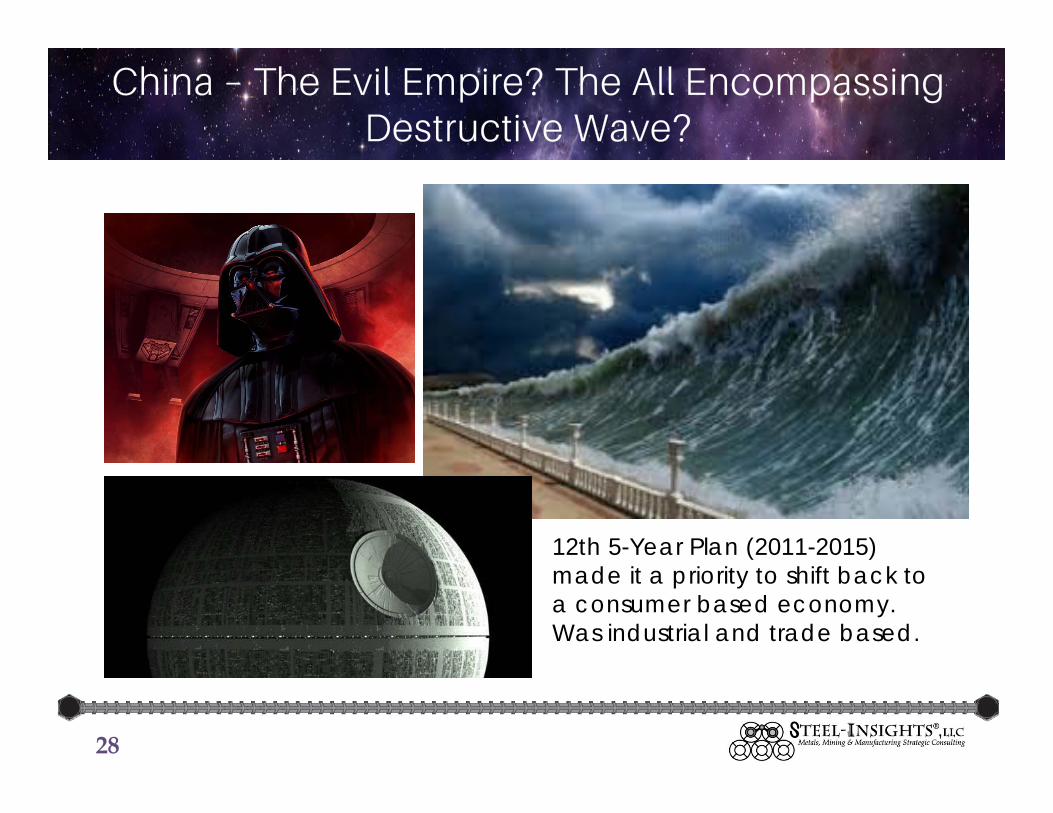
China – The Evil Empire? The All Encompassing Destructive Wave?
28
12th 5-Year Plan (2011-2015) made it a priority to shift back to a consumer based economy. Was industrial and trade based.

Private Consumption Was 50% of GDP in 1980 –New Plan is Seeking to “Catch Up” That Segment
29

Process Won’t Be Without Challenges –Instability Is Disrupting Global Business
• China was the latest, largest incremental demand of most resources.
• The recent attempt to bring their currency back to “parity” continues to caused a disruption in the financial markets and people are taping money under their clothes to smuggle it out of the country.
• Business gets transacted in stable environments. We’re in a period with a lot of instability with parties trying to figure out how to adjust their business practices to “not get hurt”.
30

“China Needs to Keep Employment High” is the Ubiquitous Comment When the Topic of the China’s Steel Production Overcapacity is Raised
• 1.4 billion people in China compared to the world at 7.3 billion – about 19% of the total.
• In the 1970s, capitalist reforms put in place by Deng Xiaoping started a migration to cities.
• In 2012, for the first time more people lived in cities than in rural areas – 691 million. As a point of reference, the total United States population is about 320 million.
• Young people in China are leaving government jobs and heavy industry in favor of finance.
31
RMB Is On Track To Become A Reserve Currency -One Criteria Has Been Met, Working on the Second
• Currency must be a significant participant in global trade – China accounted for 12.4% of global exports last year according to JP Morgan.
• Currency must be “stable” and freely used. Recent devaluation and bond offering seem to be steps to fulfil this requirement.
• If a currency meets these two criteria, then just needs a 70% vote to be included. The USA doesn’t have enough votes to block it.
• The UK seems to be supporting the Chinese efforts.• IMF has said it’s more a matter of “when” rather than
“if”.• IMF voted in November 2015 to include the RMB in the
global trade bundle. Will be effective October 2016.
32

China – Capitalistic, Except When It Isn’t; The Country Will Enact Policies to Eliminate Steelmaking Overcapacity
33
13th 5-Year Plan (2016-2020) makes it a priority to improve the environment and have the RMB included as a reserve currency.
The Steel Industry and improving the environment are conflicting priorities.
“Your turn to give back.”
“Steel production capacity will be cut by 100 million to 150 million tons, China’s State Council announced Sunday without specifying a time frame. That will translate into as many as 400,000 lost jobs, said Li Xinchuang, head of the China Metallurgical Industry Planning and Research Institute, according to a report by the official Xinhua News Agency Monday. China will raise funds to help dismissed workers, Xinhua said.
China’s leaders have vowed to reduce excess industrial capacity and labor in state enterprises even as they battle the slowest growth in a quarter of a century. They are grappling with a delicate balancing act as they strive to restructure the economy away from investment-led growth without tipping it into a deeper slump.” Bloomberg Business, January 25, 2016
QUESTION
How much steelmaking capacity in China has actually been
removed?
34

China Steelmaking Capacity Reductions
• Maybe 60-70 million tonnes, BUT they’re still building new “replacement” sheet mills, the bar mills are mostly independent companies and there have been recent reports that some of that capacity has come back on-line.
• Until the IMF deal is done, China needs to keep its trade figure high.
• China is capitalistic….except when it isn’t. China is a command economy.
• Policy enforcement get more aggressive in the second half and last year of the 5-Year Plan. Before the Olympics in 2008, they just shut the power plants down to improve air quality.
• There’s international pressure and China wants acceptance at the WTO.
• Donald Trump, who was down the hall earlier today delivering a foreign policy speech, said last night at his press conference, “We’ve done business with China. They have to respect you.” The USA needs to reassert its position of power, which is tricky for a number of reasons, including our high debt. I’m a proponent of carrying a big stick…
35

World Crude Production Reported Down 3.2% for 2015 at 1.62 Billion Tonnes; S-I Estimates 2016 Production Down 0.8%
(WSA SRO Forecast Last Week Matched S-I Outlook)
36
1995 2000 2005 2010 2011 2012 2013 2014 2015 2016e 2013-14 2014-15 2015-16
China 95.4 128.5 355.8 638.7 702.0 731.0 822.0 822.8 803.8 799.0 0.1% -2.3% -0.6%Japan 101.6 106.4 112.5 109.6 107.6 107.2 110.6 110.7 105.2 101.5 0.1% -5.0% -3.5%India 22.0 26.9 45.8 69.0 73.5 77.3 81.3 87.3 89.6 92.7 7.4% 2.6% 3.5%South Korea 36.8 43.1 47.8 58.9 68.5 69.1 66.1 71.0 69.7 68.4 7.5% -1.9% -1.8%Other Asia 23.8 26.9 37.3 42.2 43.9 42.2 43.7 47.4 41.3 39.4 8.5% -12.9% -4.6%EU-28 189.7 192.3 195.7 172.9 177.8 168.6 166.4 169.3 166.2 165.4 1.8% -1.8% -0.5%Russia 51.6 59.1 66.1 66.9 68.9 70.2 69.0 71.5 71.1 70.4 3.6% -0.5% -1.0%Ukraine 22.3 31.8 38.6 33.4 35.3 33.0 32.8 27.2 22.9 21.8 -17.1% -15.6% -5.0%Other CIS 0.0 7.6 8.5 7.8 8.5 7.6 6.6 7.4 7.4 7.5 12.4% -0.2% 0.3%Turkey 13.2 14.3 21.0 29.1 34.1 35.9 34.7 34.0 31.5 32.3 -1.8% -7.4% 2.5%Other Europe 94.5 110.3 129.7 134.0 143.2 143.0 140.3 136.7 129.7 128.3 -2.5% -5.1% -1.0%NAFTA 122.7 135.4 127.6 111.6 118.7 121.6 119.0 121.2 110.7 111.3 1.8% -8.6% 0.5%USA 101.8 94.9 80.5 86.4 88.7 86.9 88.2 78.9 80.7 1.5% -10.5% 2.2%South America 34.6 39.1 45.5 43.9 48.2 46.4 45.8 45.0 43.7 42.6 -1.7% -2.9% -2.5%Middle East 8.1 10.8 15.3 20.0 23.2 25.0 27.0 30.0 29.0 28.5 11.2% -3.2% -1.9%Africa 13.7 13.8 18.0 16.6 15.7 15.3 16.0 15.0 14.6 13.9 -5.9% -2.7% -4.8%Oceania 9.3 7.8 8.6 8.1 7.2 5.8 5.6 5.5 5.7 5.8 -2.2% 4.6% 2.0%
Total Global 752 849 1,148 1,433 1,538 1,560 1,650 1,669 1,617 1,604 1.2% -3.2% -0.8%Developed World 509 544 565 528 547 540 536 538 512 506 0.3% -4.9% -1.0%Developing World 244 305 583 905 991 1,020 1,114 1,131 1,105 1,098 1.6% -2.3% -0.6%
Developed % of Total 68% 64% 49% 37% 36% 35% 32% 32% 32% 32%Developing % of Total 32% 36% 51% 63% 64% 65% 68% 68% 68% 68%
Source: World Steel Association, China Iron and Steel Association & Steel-Insights, LLC estimates
Crude Steel Production by Region(Million Metric Tonnes)

Global & USA Steel Production Heat Map Rebounded In January 2016 – Much Stronger Now
37
Jan Feb Mar Apr May Jun Jul Aug Sep Oct Nov Dec Jan Feb Mar Apr May Jun Jul Aug Sep Oct Nov Dec Jan Feb MarWorld Monthly Crude Steel ProductionChina Monthly Crude Steel ProductionWorld ex China Monthly Crude Steel ProductionEU (28) Monthly Crude Steel ProductionUSA Monthly Crude Steel ProductionWorld Annualized Monthly Crude Steel ProductionChina Annualized Monthly Crude Steel ProductionWorld ex China Annualized Monthly Crude Steel Production\EU (28) Annualized Monthly Crude Steel ProductionUSA Annualized Monthly Crude Steel ProductionWorld TTMMA Monthly Crude Steel ProductionChina TTMMA Monthly Crude Steel ProductionWorld ex China TTMMA Monthly Crude Steel ProductionEU (28) TTMMA Monthly Crude Steel ProductionUSA TTMMA Monthly Crude Steel ProductionUSA Weekly Crude Steel Production-Month-to-MonthUSA TTMMA Monthly Annualized Weekly Crude Steel ProductionUSA Month-to Month Steel Production Utilization RateUSA TTMMA Monthly Steel Production Utilization RateUSA Monthly Steel ShipmentsUSA Year-to-Year Change Monthly Steel ShipmentsUSA Monthly ImportsUSA Monthly ExportsUSA Imports as a Percent of Apparent Steel Consumption (down is green)
Positive 21 12 22 7 19 13 11 12 12 9 11 14 11 4 10 7 13 8 3 6 5 11 1 5 12Neutral 0 4 0 2 0 1 2 3 3 3 1 1 2 2 2 1 2 1 1 1 2 0 0 1 2Negative 3 8 2 15 5 10 11 9 9 12 12 9 11 18 12 16 9 15 20 17 17 13 23 18 10
% Positive 88% 50% 92% 29% 79% 54% 46% 50% 50% 38% 46% 58% 46% 17% 42% 29% 54% 33% 13% 25% 21% 46% 4% 21% 50%
Code: red=down; green=up; grey=sideways; white=no new data yetSource: Industry Sources & Steel-Insights, LLC analysis
2014
Steel Production Heat Map-Month to Month Change
2015 2016
QUESTION
You are forecasting global crude steel production down 0.8% for 2016, but
the USA up 2.2% at 80.7 million tonnes. Through the first quarter, the USA production reported by the WSA
was 78.4 million tonnes annualized. Where are you expecting the
improvement?
38
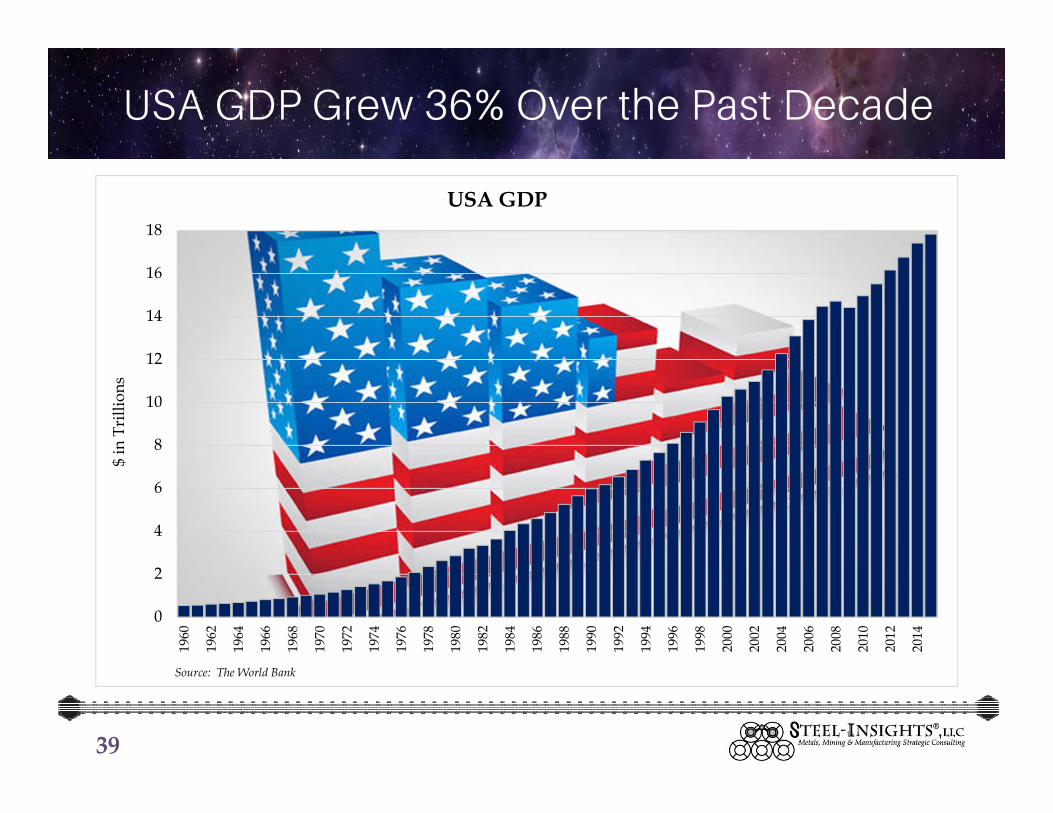
USA GDP Grew 36% Over the Past Decade
39
0
2
4
6
8
10
12
14
16
18
1960
1962
1964
1966
1968
1970
1972
1974
1976
1978
1980
1982
1984
1986
1988
1990
1992
1994
1996
1998
2000
2002
2004
2006
2008
2010
2012
2014
$ in
Tri
llion
s
USA GDP
Source: The World Bank

USA GDP Growth Around 4% Per Annum For the Past Half Decade
40
-4%
-2%
0%
2%
4%
6%
8%
10%
12%
14%
1960
1962
1964
1966
1968
1970
1972
1974
1976
1978
1980
1982
1984
1986
1988
1990
1992
1994
1996
1998
2000
2002
2004
2006
2008
2010
2012
2014
Perc
ent C
hang
e
USA GDP Growth
Source: The World Bank

Mill Lead Times Have ExtendedThe Import Inventory Overhang Is Receding
41
Used with permission
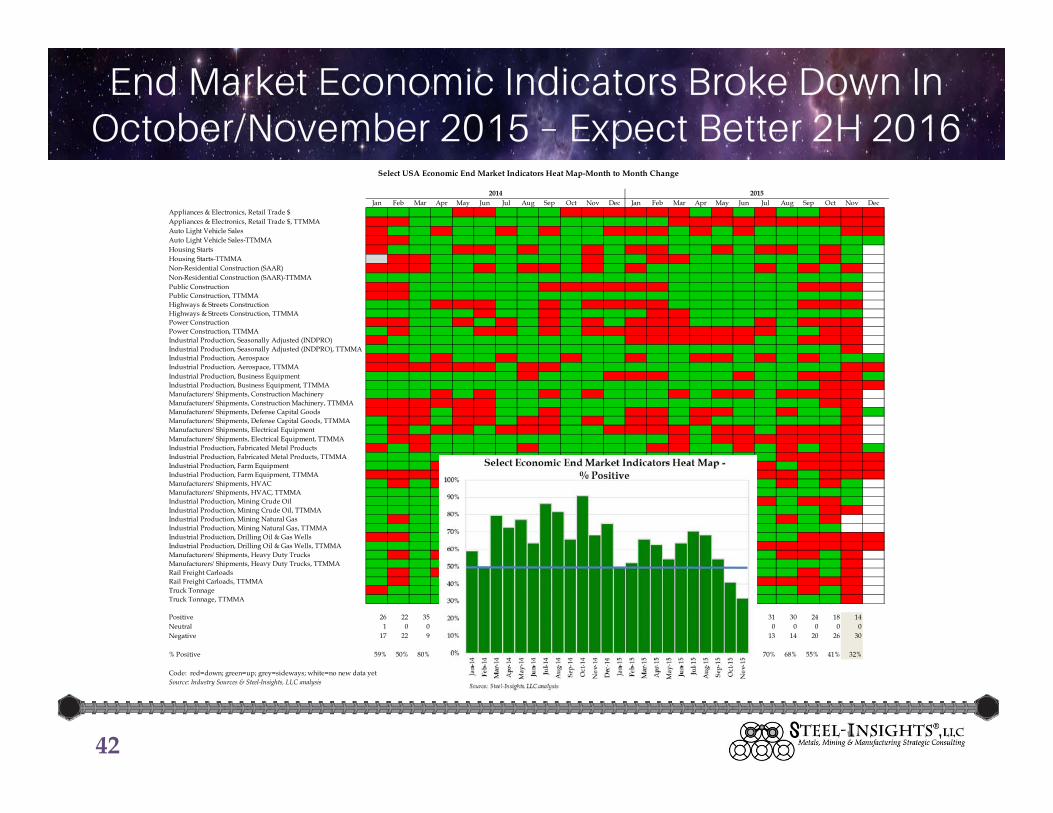
End Market Economic Indicators Broke Down In October/November 2015 – Expect Better 2H 2016
Jan Feb Mar Apr May Jun Jul Aug Sep Oct Nov Dec Jan Feb Mar Apr May Jun Jul Aug Sep Oct Nov DecAppliances & Electronics, Retail Trade $Appliances & Electronics, Retail Trade $, TTMMAAuto Light Vehicle SalesAuto Light Vehicle Sales-TTMMAHousing StartsHousing Starts-TTMMANon-Residential Construction (SAAR)Non-Residential Construction (SAAR)-TTMMAPublic ConstructionPublic Construction, TTMMAHighways & Streets ConstructionHighways & Streets Construction, TTMMAPower ConstructionPower Construction, TTMMAIndustrial Production, Seasonally Adjusted (INDPRO)Industrial Production, Seasonally Adjusted (INDPRO), TTMMAIndustrial Production, AerospaceIndustrial Production, Aerospace, TTMMAIndustrial Production, Business EquipmentIndustrial Production, Business Equipment, TTMMAManufacturers' Shipments, Construction MachineryManufacturers' Shipments, Construction Machinery, TTMMAManufacturers' Shipments, Defense Capital GoodsManufacturers' Shipments, Defense Capital Goods, TTMMAManufacturers' Shipments, Electrical EquipmentManufacturers' Shipments, Electrical Equipment, TTMMAIndustrial Production, Fabricated Metal ProductsIndustrial Production, Fabricated Metal Products, TTMMAIndustrial Production, Farm EquipmentIndustrial Production, Farm Equipment, TTMMAManufacturers' Shipments, HVACManufacturers' Shipments, HVAC, TTMMAIndustrial Production, Mining Crude OilIndustrial Production, Mining Crude Oil, TTMMAIndustrial Production, Mining Natural GasIndustrial Production, Mining Natural Gas, TTMMAIndustrial Production, Drilling Oil & Gas WellsIndustrial Production, Drilling Oil & Gas Wells, TTMMAManufacturers' Shipments, Heavy Duty TrucksManufacturers' Shipments, Heavy Duty Trucks, TTMMARail Freight CarloadsRail Freight Carloads, TTMMATruck TonnageTruck Tonnage, TTMMA
Positive 26 22 35 32 34 28 38 36 29 40 30 33 22 23 29 27 24 28 31 30 24 18 14Neutral 1 0 0 0 0 0 0 0 0 0 0 0 0 0 0 0 0 0 0 0 0 0 0Negative 17 22 9 12 10 16 6 8 15 4 14 11 22 21 15 16 20 16 13 14 20 26 30
% Positive 59% 50% 80% 73% 77% 64% 86% 82% 66% 91% 68% 75% 50% 52% 66% 63% 55% 64% 70% 68% 55% 41% 32%
Code: red=down; green=up; grey=sideways; white=no new data yetSource: Industry Sources & Steel-Insights, LLC analysis
Select USA Economic End Market Indicators Heat Map-Month to Month Change
2014 2015
42

USA Select Macro Indicator Heat Map Back to 50% Positive But Still In Vulnerable Territory
43
Jan Feb Mar Apr May Jun Jul Aug Sep Oct Nov Dec Jan Feb Mar Apr May Jun Jul Aug Sep Oct Nov Dec JanGDPCivilian Unemployment Rate (green is down)Civilian Unemployment Rate, TTMMA (green is down)Unemployment Rate With Discouraged Workers (green is down)Unemployment Rate With Discouraged Workers, TTMMAUnemployment Insurance Claims Filed (green is down)Unemployment Insurance Claims Filed, 52 Week Moving AverageUnemployed (green is down)Unemployed, TTMMA (green is down)Total Non-Farm Payroll EmploymentTotal Non-Farm Payroll Employment, Month-to-Month ChangeWagesCPICPI, Trailing 3 Month Moving AveragePPIPPI, Trailing 3 Month Moving AveragePersonal Disposable Income Per CapitaPersonal Disposable Income Per Capita, TTMMARevolving Consumer Credit OutstandingRevolving Consumer Credit Outstanding, TTMMAMortgage DebtRetail SalesRetail Sales, TTMMAExisting Home SalesExisting Home Sales, TTMMAExisting Home Inventories (green is down)Existing Home Inventories, TTMMA (green is down)Existing Home Months Supply (green is down)New Home SalesNew Home Sales, TTMMANew Home Inventories (green is down)New Home Inventories, TTMMA (green is down)New Home Months Supply (green is down)
Positive 20 17 21 21 20 21 17 19 20 25 17 22 15 21 20 23 22 22 29 21 20 20 14 16 10Neutral 1 2 3 3 2 3 0 3 3 0 3 2 2 2 3 0 4 3 2 2 3 3 6 7 2Negative 12 14 9 9 11 9 16 11 10 8 13 9 16 10 10 9 7 8 2 10 10 10 13 10 8
% Positive 61% 52% 64% 64% 61% 64% 52% 58% 61% 76% 52% 67% 45% 64% 61% 72% 67% 67% 88% 64% 61% 61% 42% 48% 50%Partial Results
Code: red=down; green=up; grey=sideways; white=no new data yetSource: Steel-Insights, LLC analysis
Select USA Macro Economic Indicators Heat Map-Month to Month Change
2014 2015 2016
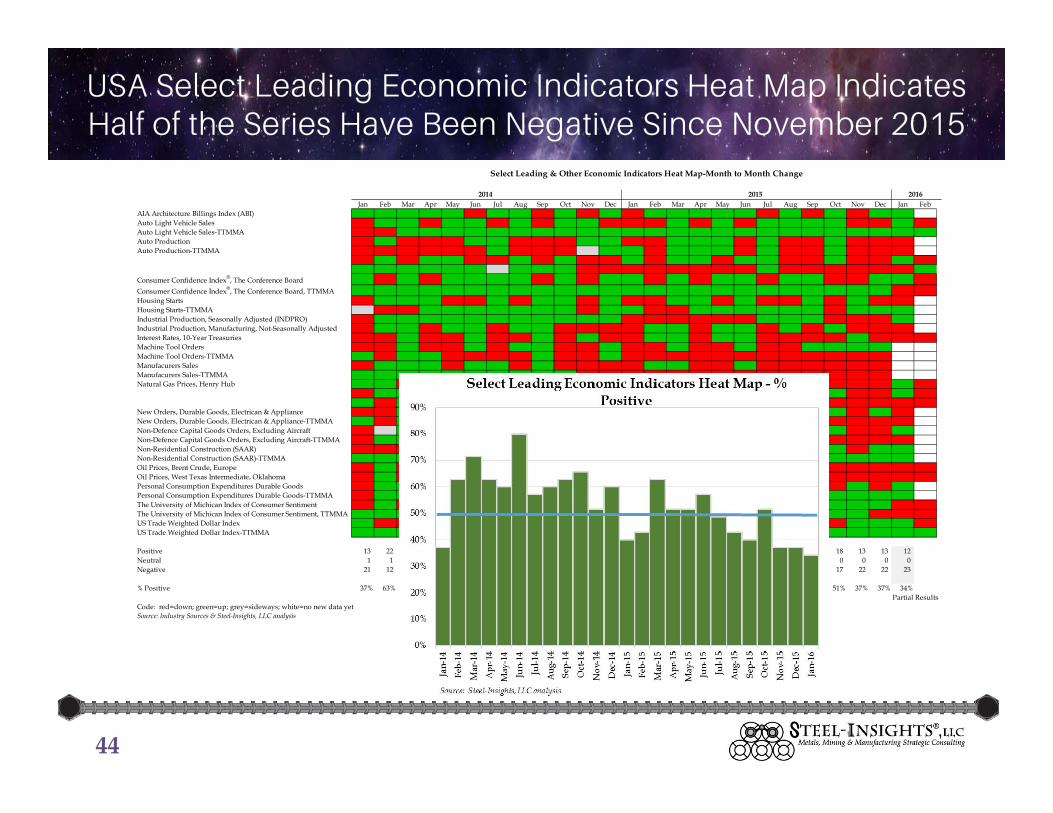
USA Select Leading Economic Indicators Heat Map Indicates Half of the Series Have Been Negative Since November 2015
44
Jan Feb Mar Apr May Jun Jul Aug Sep Oct Nov Dec Jan Feb Mar Apr May Jun Jul Aug Sep Oct Nov Dec Jan FebAIA Architecture Billings Index (ABI)Auto Light Vehicle SalesAuto Light Vehicle Sales-TTMMAAuto ProductionAuto Production-TTMMA
Consumer Confidence Index®, The Conference BoardConsumer Confidence Index®, The Conference Board, TTMMAHousing StartsHousing Starts-TTMMAIndustrial Production, Seasonally Adjusted (INDPRO)Industrial Production, Manufacturing, Not-Seasonally AdjustedInterest Rates, 10-Year TreasuriesMachine Tool OrdersMachine Tool Orders-TTMMAManufacurers SalesManufacurers Sales-TTMMANatural Gas Prices, Henry Hub
New Orders, Durable Goods, Electrican & ApplianceNew Orders, Durable Goods, Electrican & Appliance-TTMMANon-Defence Capital Goods Orders, Excluding AircraftNon-Defence Capital Goods Orders, Excluding Aircraft-TTMMANon-Residential Construction (SAAR)Non-Residential Construction (SAAR)-TTMMAOil Prices, Brent Crude, EuropeOil Prices, West Texas Intermediate, OklahomaPersonal Consumption Expenditures Durable GoodsPersonal Consumption Expenditures Durable Goods-TTMMAThe University of Michican Index of Consumer SentimentThe University of Michican Index of Consumer Sentiment, TTMMAUS Trade Weighted Dollar IndexUS Trade Weighted Dollar Index-TTMMA
Positive 13 22 25 22 21 28 20 21 22 23 18 21 14 15 22 18 18 20 17 15 14 18 13 13 12Neutral 1 1 0 2 0 0 1 1 0 0 1 0 2 0 0 0 0 0 0 0 0 0 0 0 0Negative 21 12 10 11 14 7 14 13 13 12 16 14 19 20 13 17 17 15 18 20 21 17 22 22 23
% Positive 37% 63% 71% 63% 60% 80% 57% 60% 63% 66% 51% 60% 40% 43% 63% 51% 51% 57% 49% 43% 40% 51% 37% 37% 34%Partial Results
Code: red=down; green=up; grey=sideways; white=no new data yetSource: Industry Sources & Steel-Insights, LLC analysis
2014
Select Leading & Other Economic Indicators Heat Map-Month to Month Change
2015 2016

2015 Apparent Steel Consumption of 108.1 Million Tons –Tied For Third Best Year in the Past Eight – But Down 9.9% from
2014 – 2016 Vulnerable And Could Be Down 8%
45
LessPlus Imported Less Apparent
Q1 Q2 Q3 Q4 Total % Chg Imports Semis Exports Consumption % Chg
1983 15.1 17.0 16.7 18.4 67.2 17.2 0.0 1.2 83.21984 19.4 20.1 17.2 16.3 72.9 26.2 1.3 1.0 96.8 16.4%2005 26.7 25.2 25.3 26.0 103.2 -7.0% 31.8 6.9 9.4 118.8 -9.7%2006 27.7 28.8 27.8 24.3 108.6 5.2% 45.3 9.3 9.7 134.9 13.5%2007 26.3 26.9 26.5 26.4 106.1 -2.3% 33.2 6.6 11.1 121.7 -9.8%2008 27.6 27.5 26.0 16.9 98.0 -7.7% 31.9 5.9 13.5 110.5 -9.2%2009 13.0 13.1 16.6 17.6 60.3 -38.4% 15.8 2.0 9.3 64.8 -41.3%2010 20.5 21.7 20.8 20.3 83.4 38.2% 23.9 5.0 11.9 90.4 39.4%2011 22.5 22.3 23.7 23.4 91.9 10.2% 28.5 6.6 13.5 100.3 11.0%2012 25.4 24.7 23.5 22.3 95.9 4.4% 33.5 7.6 13.7 108.1 7.7%2013 23.6 23.8 24.5 23.5 95.4 -0.5% 32.2 7.3 12.7 107.6 -0.4%2014 23.9 24.9 25.3 24.1 98.2 3.0% 44.3 10.5 12.0 120.0 11.5%2015 22.0 22.0 22.2 20.4 86.5 -11.9% 38.8 7.3 10.0 108.1 -9.9%2016e 21.2 22.2 22.9 22.5 88.8 2.6% 27.8 8.0 9.4 99.2 -8.3%
Source: AISI & Steel-Insights, LLC estimates
USA Steel Consumption / Shipment Outlook(Million Net Tons)
Shipments

QUESTION
Given that the USA leading economic indicators are signaling vulnerability and steel consumption could be down in 2016,
why are you forecasting an increase in shipments from the USA mills?
46

USA Domestic Shipments Will Increase in 2016
• Trade actions have finally begun to dissuade at least some imports, reducing the inventory overhang.
• USA mills were hit with an 11.9% decline in shipments in 2015 due to the flood of imports, down 11 million tons. A 2 million ton rebound is pretty conservative.
• Finishing mills are running pretty full.• Some end market “weakness” is due to bank lending
reticence as concerns over potential non-performing energy loans have closed funding spigots, which is a temporary impediment.
• Increased buyer nervousness about obtaining adequate supply. Integrated steelmakers have less volume available for the spot markets. EAF steelmakers can ramp-up faster.
47
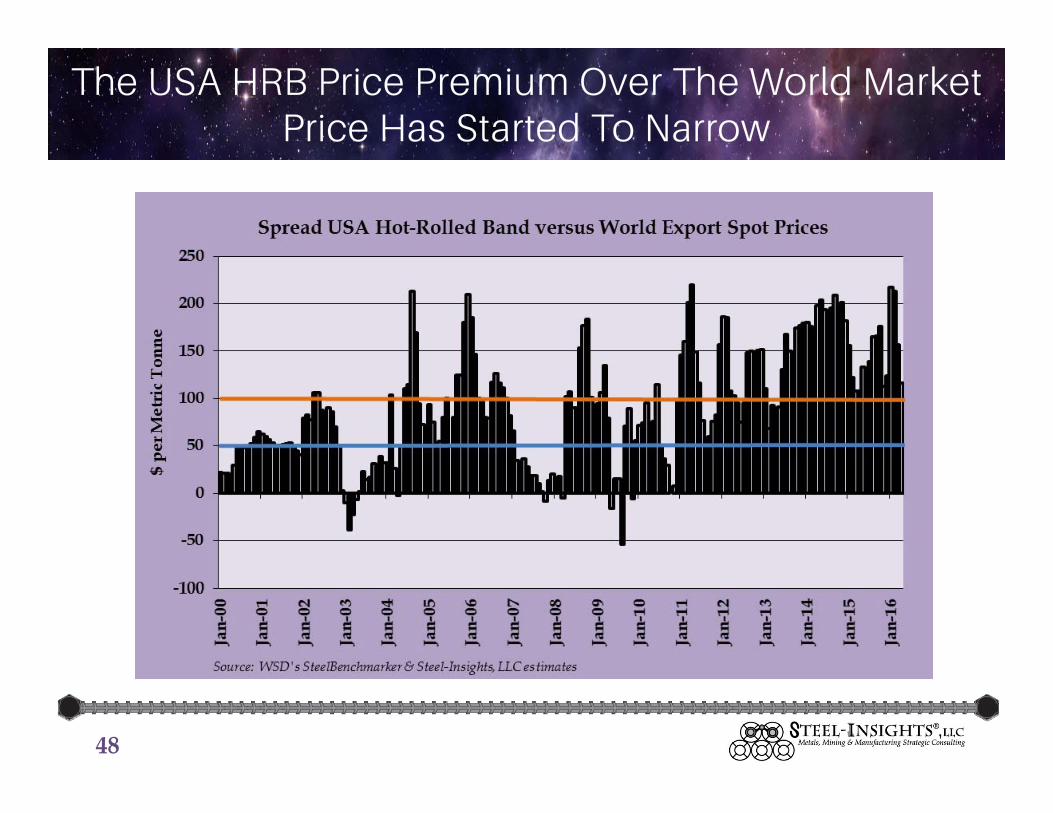
The USA HRB Price Premium Over The World Market Price Has Started To Narrow
48
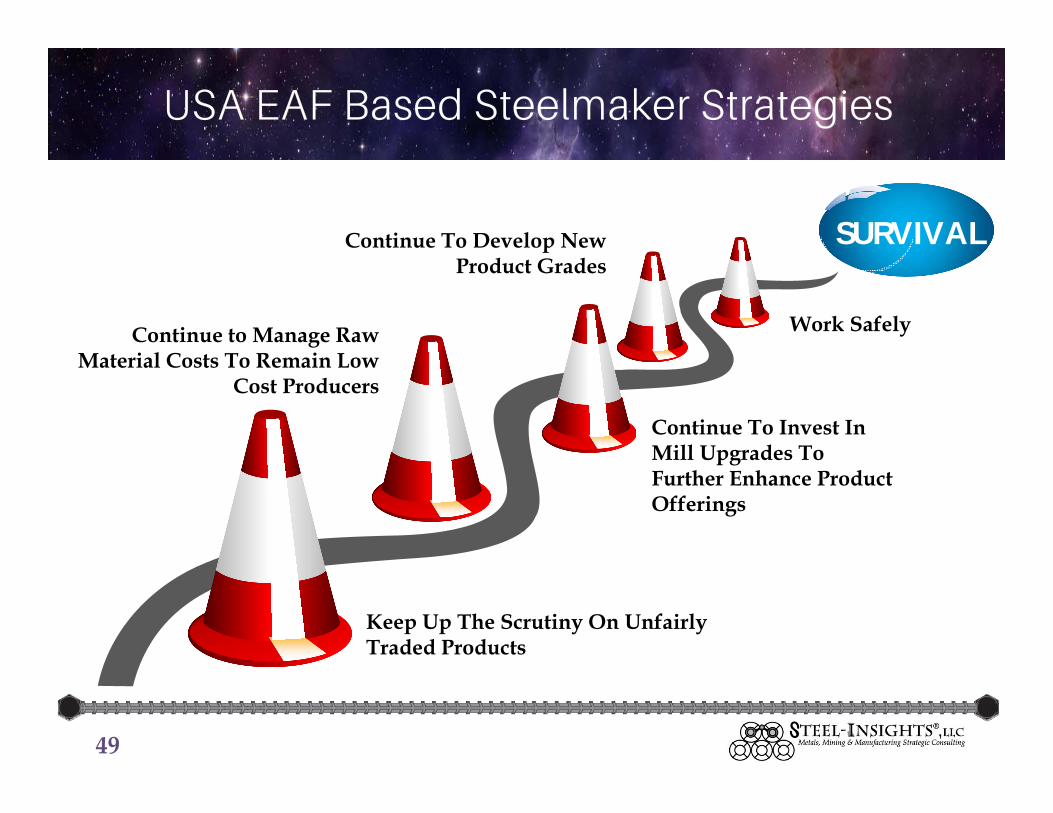
USA EAF Based Steelmaker Strategies
49
SURVIVAL
Keep Up The Scrutiny On Unfairly Traded Products
Continue to Manage Raw Material Costs To Remain Low
Cost Producers
Continue To Develop New Product Grades
Continue To Invest In Mill Upgrades To Further Enhance Product Offerings
Work Safely

The World Changes; The Only Way to “Win” Is To Anticipate and Adapt – Critical Resources of the Past Can
Become Irrelevant to the Future
50
Ingot CastingContinuous Casting
Bessemer Furnace
Blast Furnace& EAF
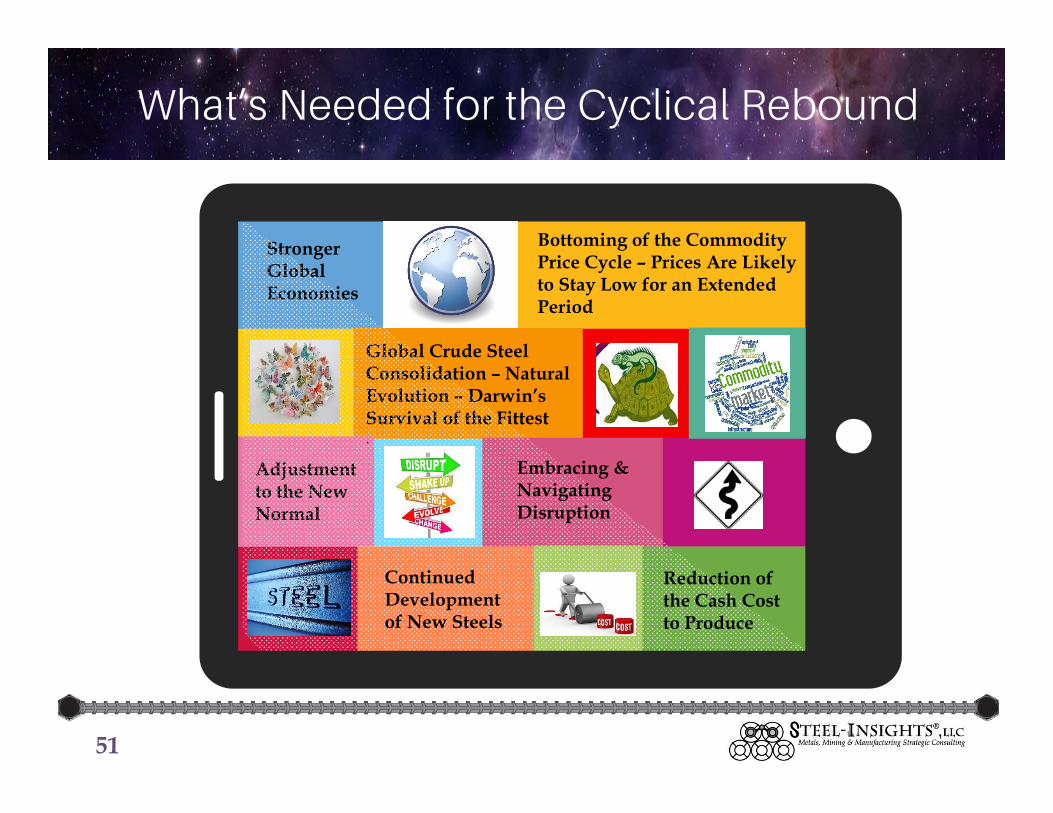
What’s Needed for the Cyclical Rebound
51
Adjustment to the New Normal
Stronger Global Economies
Global Crude Steel Consolidation – Natural Evolution – Darwin’s Survival of the Fittest.
Bottoming of the Commodity Price Cycle – Prices Are Likely to Stay Low for an Extended Period
Embracing & Navigating Disruption
Reduction of the Cash Cost to Produce
Continued Development of New Steels
Steel-Insights, LLC – “Seeing” What Others Don’t
52
In WWII, American submarine commanders endured despite being outclassed by superior equipment and outgunned (fully functioning torpedoes weren’t available to them for the first 21 months of the Pacific War). In the fog of war, as often is the case in business, decisions with long impacting outcomes have to be made without the luxury of complete or definitive information.
Steel-Insights was formed to assist executive management teams navigate the “noise of battle” by more effectively managing the abundant resources available today and
harnessing those resources to explore thought provoking and penetrating issues in order to magnify the pivotal decisions required for the long-term success of their companies in arguably tough industries that must survive challenging cycles, i.e. training and empowering submarine commanders.

This document and all content hereof are intended for informational purposes only and none of the information contained herein or opinions expressed herein should be viewed as an offer or solicitation to buy, sell or otherwise trade futures, options-on-futures, commodities, options, securities or any other investments mentioned herein. All opinions and information contained herein constitute the judgments of Steel-Insights, LLC or its affiliates (collectively “Steel-Insights”) as of the date of this document and are subject to change without notice. Steel-Insights and its directors, members, officers and employees may, directly or indirectly, effect or have effected a transaction for Steel-Insights’ own account in any investment referred to herein, either before or after the material is published, or may give advice to customers which may differ from or be inconsistent with the information and opinions contained herein or may from time to time hold long or short positions in, buy or sell (on a principal basis or otherwise), or act as market maker in, securities, derivatives, futures or other financial instruments or products related to matters discussed herein and may make trading decisions that are different from or contrary to any of those which may be discussed.. The information contained herein is based on data obtained from recognized statistical services and other sources believed to be reliable. However, such information has not necessarily been verified by Steel-Insights, and Steel-Insights does not make any representations as to its accuracy, currency, reliability, effectiveness or completeness. Steel-Insights may from time to time issue futures reports based on fundamentals, such as expected trends in supply and demand, as well as reports based on technical factors, such as price and volume movements. Since such reports rely upon different criteria, there may be instances when Steel-Insights’ conclusions in individual reports are not in concert. Additional information on futures and options-on-futures is available upon request. Trading in futures and options on futures is not appropriate for all persons, as the risk of loss is substantial. Therefore only risk capital should be used in futures trading. Information contained herein was prepared without regard to the specific investment objectives, financial situation or needs of any particular participant. Speak to your Financial Advisor to assess whether such trading is appropriate for you. Steel-Insights is not an adviser as to legal, taxation, accounting or regulatory matters in any jurisdiction, and is not providing any advice as to any such matter to the recipient. This material does not constitute a personal recommendation or take into account the particular investment objectives, financial situations, or needs of individual clients. The recipient of this material should take their own independent advice with respect to such matters. You should be aware of the risks of trading equities, fixed income, foreign exchange or derivative instruments or in non-liquid or emerging market investments. Derivatives generally involve leverage and are therefore more volatile than their underlying cash investments. Your capital may be at risk. Products and services mentioned herein may not have regard to your specific investment objectives, financial situation or particular needs. PAST PERFORMANCE IS NOT NECESSARILY INDICATIVE OF FUTURE RESULTS. THE RISK OF LOSS ASSOCIATED WITH FUTURES ANDOPTIONS TRADING CAN BE SUBSTANTIAL. All information contained herein is intended solely for your own personal, informational use, and you are not permitted to reproduce, retransmit, disseminate, sell, license, distribute, republish, broadcast, post, circulate or commercially exploit the information in any manner or media without the express written consent of Steel-Insights, or to use the information for any unlawful purpose. This document and all information herein is comprised of information, data and other material owned by either Steel-Insights or its data providers, which is protected under copyright, trademark and other intellectual property laws. Steel-Insights and its data providers, as applicable, own all rights, title and interest, including without limitation, all copyrights, in and to all content of this document. All trademarks, service marks, and logos used in the document are the trademarks, service marks, or logos of Steel-Insights or its data providers, as applicable. You may not use such names or logos without the prior written consent of the relevant owner thereof. Other than the right to access the document and view the information contained therein under the terms and conditions set forth herein, you acquire no ownership, title, right or interest of any kind in or to any of the content of this document. THIS PUBLICATION AND ALL CONTENT HEREOF ARE PROVIDED SOLELY ON AN AS IS BASIS, WITHOUT ANY REPRESENTATION OR WARRANTY OF ANY KIND, EXPRESS OR IMPLIED, AND STEEL-INSIGHTS HEREBY DISCLAIMS ALL SUCH REPRESENTATIONS AND WARRANTIES, INCLUDING WITHOUT LIMITATION THE IMPLIED WARRANTIES OF FITNESS FOR A PARTICULAR PURPOSE AND NON-INFRINGEMENT. ANY USE OF OR RELIANCE UPON THIS PUBLICATION, IN WHOLE OR IN PART, IS SOLELY AT THE USER’S OWN RISK. © Steel-Insights, LLC.
Disclaimer & Copyright