increasing the competitiveness of small and medium-sized enterprises through · pdf...
TRANSCRIPT

ECONOMIC AND SOCIAL COMMISSION FOR WESTERN ASIA (ESCWA)
INCREASING THE COMPETITIVENESS OF SMALL AND MEDIUM-SIZED ENTERPRISES THROUGH THE USE OF
ENVIRONMENTALLY SOUND TECHNOLOGIES:
ASSESSING THE POTENTIAL FOR THE DEVELOPMENT OF SECOND-GENERATION BIOFUELS IN THE ESCWA REGION
United Nations

Distr. GENERAL E/ESCWA/SDPD/2009/5 12 November 2009 ORIGINAL: ENGLISH
ECONOMIC AND SOCIAL COMMISSION FOR WESTERN ASIA (ESCWA)
INCREASING THE COMPETITIVENESS OF SMALL AND MEDIUM-SIZED ENTERPRISES THROUGH THE USE OF
ENVIRONMENTALLY SOUND TECHNOLOGIES:
ASSESSING THE POTENTIAL FOR THE DEVELOPMENT OF SECOND-GENERATION BIOFUELS IN THE ESCWA REGION
United Nations New York, 2009
09-0483

iii
Acknowledgements ESCWA would like to recognize the contributions of Mr. Ahmad Houri in helping to prepare this study, particularly the case studies on olive residues and the dairy industry; Ms. Shadia Tewfik on the case study related to the sugar industry; and Mr. Jean-Paul Sfeir on the review of environmental technologies that can be used for biofuel production.

iv

v
Preface
This study examines the opportunities and constraints associated with the development of second-generation biofuels in the ESCWA region, based on a review of existing environmentally sound technologies that can be accessed by small and medium enterprises. Agricultural waste generated by three sectors of importance to the ESCWA region is targeted for analysis, namely, the olive oil, sugar (from sugarcane and sugar beet) and dairy industries. Country case studies are offered to elaborate the analysis-based financial and environmental assessments; and a series of recommendations are provided aimed at assisting decision makers and entrepreneurs to pursue developments in the second-generation biofuel sector using environmentally sound technologies.

vi

vii
CONTENTS
Page Acknowledgments ................................................................................................................................ iii Preface .................................................................................................................................................. v Abbreviations and explanatory notes ................................................................................................... ix Executive summary .............................................................................................................................. x Introduction .......................................................................................................................................... 1 Chapter I. ENVIRONMENTAL TECHNOLOGIES FOR BIOFUEL PRODUCTION ..................... 4 A. Existing uses of agricultural waste ..................................................................................... 4 B. Deriving energy from agricultural waste ............................................................................ 5 II. BIOFUELS DERIVED FROM OLIVE RESIDUES ............................................................ 15 A. Overview ............................................................................................................................ 15 B. Olive oil industry status ...................................................................................................... 16 C. Pomace as a source of energy ............................................................................................. 19 D. Recommendations .............................................................................................................. 26 III. BIOFUELS DERIVED FROM SUGAR INDUSTRY WASTE ........................................... 27 A. Overview ............................................................................................................................ 27 B. Environmental and economic challenges ........................................................................... 27 C. Sugar crop production ........................................................................................................ 31 D. Energy from wastes ............................................................................................................ 37 E. Investment and operating costs........................................................................................... 39 F. Public and private sector initiatives .................................................................................... 43 G. Use of biofuels .................................................................................................................... 44 H. Recommendations .............................................................................................................. 45 IV. BIOGAS GENERATION FROM THE LIVESTOCK AND DAIRY INDUSTRIES ........ 47 A. Overview ............................................................................................................................ 47 B. Livestock and milk production in ESCWA member countries .......................................... 47 C. Dairy farm manure as a source of energy ........................................................................... 49 D. Recommendations .............................................................................................................. 58 V. CHALLENGES AND OPPORTNITIES FOR SECOND-GENERATION BIOFUEL PRODUCTION IN THE ESCWA REGION ...................................................... 59 A. The feasibility of converting agricultural waste into biofuel .............................................. 59 B. Opportunities for SMEs ...................................................................................................... 60 VI. CONCLUSIONS AND RECOMMENDATIONS ................................................................. 61 A. Recommendations to SMEs ............................................................................................... 61 B. Recommendations to governments ..................................................................................... 61

viii
CONTENTS (continued)
Page
LIST OF TABLES 1. Equipment required for the production of briquettes ................................................................. 8 2. Main equipment required for producing thermal energy through bagasse gasification ............. 11 3. Main equipment required for producing electricity and steam through gasification ................. 12 4. Operating conditions for anaerobic digestion processes ............................................................ 13 5. Equipment needed for bioethanol production ............................................................................ 14 6. Trees planted, areas and productivity of olives in selected ESCWA member countries. .......... 16 7. Typical production of by-products per ton of olives. ................................................................. 16 8. Annual production of various olive products ............................................................................. 17 9. Analysis of olive oil pressing products ...................................................................................... 19 10. Production, calorific value and electricity potential from Italy and Spain ................................. 21 11. Market volume estimation for pomace ....................................................................................... 22 12. Olive residues production cost ................................................................................................... 23 13. Energy cost savings .................................................................................................................... 23 14. Annual operational costs of biochar production ......................................................................... 24 15. Egyptian beet pulp specifications ............................................................................................... 31 16. Sugar crop production levels in selected Arab countries, 2007 ................................................. 32 17. Sugar factories in selected Arab countries ................................................................................. 33 18. Waste generation from sugar processing in selected Arab countries, 2007 ............................... 36 19. Moisture content in each sugar crop by-product ........................................................................ 36 20. Biofuel energy generation from bagasse and beet pulp through viable technologies ................ 38 21. Biofuel energy generation potential ........................................................................................... 38 22. Briquetting of biomass: typical capital costs .............................................................................. 39 23. Briquetting of biomass: typical annual O&M costs ................................................................... 40 24. Gasification with steam generation: typical capital costs .......................................................... 40 25. Gasification with steam generation: typical annual O&M costs ................................................ 41 26. Gasification with electricity generation (3MW): typical capital costs ....................................... 41 27. Gasification with electricity generation (3MW): typical annual O&M costs ............................ 42 28. Ethanol production from biomass: typical capital cost .............................................................. 42 29. Ethanol production from biomass: typical annual O&M costs .................................................. 43 30. Capital and production costs for the proposed biofuel technologies .......................................... 43 31. Number of livestock in the ESCWA region ............................................................................... 47 32. Dairy farm energy productivity from 100 cows ......................................................................... 51 33. Potential gas production of dairy, poultry and beef manure ...................................................... 51 34. Biogas equivalence ..................................................................................................................... 52 35. Energy inputs per ton of processed milk .................................................................................... 52 36. Potential of animal waste in offsetting common farm needs ..................................................... 52 37. Biogas production from dairy farms case studies in the United States ...................................... 53 38. Biogas plant potential in the ESCWA region ............................................................................. 53 39. Electricity potential in offsetting national needs ........................................................................ 54 40. Milk production at selected dairy farms in the ESCWA region ................................................. 54 41. Estimated simplified dairy plant energy needs and energy potential from biogas plants .......... 55 42. Investment costs for Kirk Carrell Dairy anaerobic digester ....................................................... 56 43. Expected annual costs/benefits for Kirk Carrell Dairy anaerobic digester ................................ 56 44. Costs for anaerobic digestion manure handling system ............................................................. 57

ix
CONTENTS (continued)
Page
LIST OF FIGURES 1. Agricultural waste streams ......................................................................................................... 4 2. Agricultural waste conversion process for biofuels ................................................................... 5 3. Small burning boiler ................................................................................................................... 6 4. The retort principle of carbonization .......................................................................................... 10 5. Process block diagram of ethanol production from biomass ..................................................... 13 6. Schematic of olive processing and potential fate of by-products ............................................... 15 7. Production of waste from various olive oil production methods ............................................... 18 8. Retort kiln for biochar production .............................................................................................. 24 9. Bagasse collection and processing by SURAC in Morocco ...................................................... 30 10. Sugar crop production trends in selected Arab countries, 1998-2007 ........................................ 32 11. Typical distribution of sugarcane products, by-products and wastes ......................................... 34 12. Typical distribution of sugar beet products, by-products and wastes ........................................ 35 13. Trends related to sugarcane products and wastes in selected Arab countries, 1998-2007 ......... 35 14. Products and wastes from sugar beet, 1998-2007 ...................................................................... 36 15. Number of dairy cows in ESCWA member countries ............................................................... 48 16. Gap between milk and cheese production and consumption ..................................................... 49 17. Basic flowchart for the management of dairy farm waste .......................................................... 50 18. Percentage coverage of energy needs based on number of cows ............................................... 55
LIST OF BOXES 1. Success stories of heat/electricity generation through direct burning of agricultural waste ...... 7 2. Biochar to combat climate change ............................................................................................. 10 Bibliography ......................................................................................................................................... 63

x
ABBREVIATIONS AND EXPLANATORY NOTES CDM clean development mechanism CHP combined heat and power ESIIC Egyptian Sugar and Integrated Industries Company GWh gigawatt-hour HDF high density fibre IPP independent power producers kWh kilowatt-hour kWhe kilowatt-hour electric kWht kilowatt-hour thermal L litre MDF medium density fibre MJ megajoule MTBE methyl-tertiary-butyl-ether MWh megawatt hour NGO non-governmental organization O&M operation and maintenance PCDD polychlorinated dibenzo-p-dioxins PCDF polychlorinated dibenzofurans ppm parts per million R & D research and development RDF REDD
refuse derived fuels reducing emissions from deforestation and degradation in developing countries
SME small and medium-sized enterprise SURAC Sucrerie Raffinerie de Cannes du Gharb TDS total dissolved solids TOE ton of oil equivalent TWh terawatt-hour UNCCD United Nations Convention to Combat Desertification UNFCCC United Nations Framework Convention on Climate Change VS volatile solids W watt wk week yr year
References to dollars ($) are to United States dollars, unless otherwise stated; while references to the euro symbol (€) indicate euros.

xi
Executive summary
Developments in the biofuel sector have fostered global debate regarding the potential trade-offs of pursuing energy security at the expense of food security. The recent food crisis and financial crisis exhibited the sensitivity of global food prices to changes in the international supply and demand of primary food commodities, including sugar and corn which are being increasingly cultivated to produce ethanol. The use of scarce water and land resources to cultivate crops destined for energy production is tied to challenges associated with managing drought, land degradation and desertification in the region. The clearing of land to produce crops destined for biofuel production is causing deforestation, which has implications for climate change. As an alternative, countries in the ESCWA region are investigating the use of new, non-food crop varieties that may be exploited for the production of primary biofuels in marginal lands. While international debate continues regarding the development of primary biofuels, second-generation biofuels derived from agricultural waste products have emerged as an environmentally sound alternative for policymakers and entrepreneurs interested in biofuel development. Global conferences and regional forums involving ESCWA member countries have thus identified second-generation biofuels as a possible means for developing a new alternative energy source. Advocates indicate that developments in this sector can also help to respond to the region’s environmental problems, as well as create new income and employment opportunities through the introduction of environmentally sound technologies. The development of the second-generation biofuel sector therefore presents interesting opportunities for small and medium-sized enterprises (SMEs), including farmers in rural, agrarian-based communities. While agricultural waste is currently disposed of through market and non-market channels, these traditional approaches often result in adverse environmental impacts (such as increased air pollution caused by the burning of sugarcane stalks) or low economic returns (such as selling manure as fertilizer). Access to environmentally sound technologies for converting agricultural waste into second-generation biofuels can thus assist small and medium producers to benefit from opportunities presented by this emerging sector. However, technology choices at the national and local levels are dependent upon the availability and accessibility of agricultural waste flows. Additionally, technology transfer and access to information and financial resources for pursuing investment in this sector must be matched by an enabling environment that encourages the development of renewable energy sources in the region. While subsidies for biofuel development may exist in industrialized countries, financial incentives for research and investment are generally not available in developing countries, including ESCWA member countries. This influences the financial feasibility of pursuing investments in second-generation biofuels. Consequently, this study examines the opportunities and constraints associated with the development of second-generation biofuels in the ESCWA region, based on a review of existing environmentally sound technologies that can be accessed by SMEs. Agricultural waste generated by three sectors of importance to the ESCWA region are targeted for analysis, namely, the olive oil, sugar and dairy industries. By-products generated from sugar derived from both sugarcane and sugar beet production is discussed given the importance of these sub-sectors for Arab countries. Country case studies are offered to elaborate the analysis-based financial and environmental assessments; and a series of recommendations are provided aimed at assisting decision makers and entrepreneurs to pursue developments in the second-generation biofuel sector using environmentally sound technologies.

Introduction
The availability of non-renewable energy resources varies widely across the ESCWA region. However, the need to use these energy resources sparingly and efficiently is relevant to all countries of the region, both oil- and non-oil producing countries, whether to minimize fuel imports or to maximize amounts available for export. On the other hand, environmental problems are ever increasing in the region owing to growing populations and poor waste management practices. As such, the need to use renewable energy resources has become more critical. When considering renewable energy resources in the ESCWA region, attention has mostly focused on solar energy, wind and hydropower. However, biomass as a fuel source also presents an interesting alternative for the region. Globally, the food crisis, which was characterized by soaring food prices and increasing levels of poverty and hunger, has spurred debate regarding the production of biofuels. Some have argued that international market demand for biofuels contributed at least partially to the surge in food prices by prompting farmers to cultivate commercial biofuel crops rather than crops destined for food production.1 This argument has particular relevance when considering the cultivation of primary biofuels derived from food-based crops, such as sugar or corn to produce ethanol. This stems from the fact that land allocated for these commercial crops destined for use as biofuels compete with land and water resources that could otherwise be allocated for food production. This challenge resounds closely with Arab countries that have traditionally placed food security as a central component of their agricultural development and trade policies. In addition, primary biofuel production is argued to have a net negative impact on the environment and climate change by increasing greenhouse gas emissions through the release of carbon that would otherwise be captured in the soil. For example, while biofuels currently account for only a small percentage of energy demands on a global scale, and while related plantations of primary biofuel commercial crops still account for a very small fraction of all agricultural land under cultivation, its production is leading to significant land transformations, both directly and indirectly, including land degradation and the loss of critical tracts of tropical forests in certain parts of the world. This is among the key concerns being raised through the initiative for Reducing Emissions from Deforestation and Degradation (REDD), which seeks to provide developing countries that are willing and able with a monetary incentive for reducing emissions by preventing deforestation in view of protecting forests as a means to combat climate change. Nevertheless, new research and development in primary biofuel production does hold potential in areas that already face drought and desertification, including marginal lands in the ESCWA region. For example, Egypt and the Sudan are jointly seeking to introduce new non-food plant varieties that could be used for biofuel production.2 Regional efforts in this area also include investments in jatropha, which is drought resistant, and jojoba, which can be grown in saline soils. In both cases, oil extracted from these plants can be used as primary fuels or as supplements to other biofuels. Research and development in this area is being pursued in Egypt as well as parts of the Gulf subregion for biofuel development, oil extraction as well as a means to increase green cover in areas suffering from water scarcity and land degradation. Another option for ESCWA member countries is the production of secondary (second-generation) biofuels, or biofuels derived from agricultural waste. This alternative has been identified in several international and regional political forums as a means to pursue biofuel development in a sustainable manner through the use of environmentally sound technologies. Advocates highlight the opportunities that second-generation biofuels present for creating employment opportunities and supplemental income streams for SMEs in rural, agrarian-based economies. The introduction of these environmental technologies for creating value out of agricultural waste products is also a particularly interesting option to consider in the water
1 Food and Agriculture Organization (FAO), The State of Food Insecurity in the World (2008).
2 W. Sawahel, “Sudan sets its sights on biofuels” (Science and Development Network, 25 June 2009).

2
scarce countries of the region, which face energy constraints and challenges associated with rural electrification. Discussion about the trade-offs and opportunities presented by the biofuel sector have been articulated in many forums. At the global level and in view of the biofuel boom witnessed during the past few years, a careful approach towards biofuels was recommended. For example, the Declaration of the High-Level Conference on World Food Security called for more “in-depth studies… to ensure that production and use of biofuels is sustainable in accordance with the three pillars of sustainable development and takes into account the need to achieve and maintain global food security”.3 The United Nations Commission for Sustainable Development (CSD) at its seventeenth session concurred with this position and noted the importance “to address the challenges and opportunities posed by biofuels, in view of the world’s food security, energy and sustainable development needs”.4 There has also been concern among various international organizations regarding the adoption of support policies for primary biofuel development by various governments, and the implications they can have for climate change, world food prices, environmental sustainability and international trade.5 At the regional level, the Arab Ministerial Declaration on Climate Change warned Arab countries of the “consequences of the encouragement of developed countries to developing countries to cultivate agricultural crops that produce bio-fuel instead of food; while encouraging its production from bio-waste”.6 On a similar note, the Strategy for Sustainable Arab Agricultural Development for the Upcoming Two Decades (2005-2025) recognizes the added-value for farmers of using agricultural residues for biofuel production and the positive impact this will have on the environment and on securing fuel for various uses. 7 In ESCWA forums, experts have also called for detailed cost-benefit analysis on a country by country basis in order to determine the appropriateness of producing primary and secondary biofuels and the potential that secondary biofuels present for the region.8 This study responds to requests for additional research in this area. From an environmental vantage point, the development of a second-generation biofuel industry provides promise for mitigating environmental waste management problems associated with various agricultural activities. Agricultural waste management is a challenge for many Arab countries and was identified as a key area for further study by Arab governments.9 Apart from creating offensive odours and significant land and water pollution, agricultural solid waste disposal is also often disposed of through on-site burning, which adversely impacts air quality and frequently results in forest fires, as has been the case in Lebanon. In Egypt, the burning of hay and sugarcane results in black smog hovering over Cairo for extended 3 The Declaration of the High-Level Conference on World Food Security: The Challenges of Climate Change and Bioenergy (Rome, 3-5 June 2008), p. 3 under medium and long-term measures.
4 Commission on Sustainable Development, “Policy options and practical measures to expedite implementation in agriculture, rural development, land, drought, desertification and Africa,” (Advanced unedited text, 19 May 2009), p. 12.
5 OPEC Fund for International Development (OFID), “Biofuels and food security” (2009); and Organisation for Economic Co-operation and Development (OECD), “Biofuel support policies: An economic assessment” (2008).
6 Council of Arab Ministers Responsible for the Environment (CAMRE), “The Arab Ministerial Declaration on Climate Change” (2007). The Declaration, which was adopted by CAMRE at its nineteenth session (5- 6 December 2007), reflects the Arab position in dealing with climate change issues.
7 Arab Organization for Agricultural Development (AOAD), “Strategy for sustainable Arab agricultural development for the upcoming two decades 2005-2025” (in Arabic), 2007, p. 30 under the sub-programme for developing appropriate techniques for utilization of agricultural by-products.
8 For example, the Expert Group Meeting on Sustainable Land Management as a Best Practice to Enhance Rural Development in the ESCWA Region (Beirut, 25-27 March 2009).
9 League of Arab States, “Proposed executive programme to follow up on mandates of the Arab Economic, Developmental and Social Summit in the area of the environment” (in Arabic), which was submitted to CAMRE at their ad-hoc session (24-25 May 2009).

3
periods, especially during autumn. River disposal of olive oil residues increases biological oxygen demand (BOD) levels and frequently results in eutrification and cases of dead river fish due to oxygen depletion. Seawater pollution also results from the uncontrolled disposal of certain organic wastes. The disposal of liquid wastes also results in significant pollution of surface and groundwater resources. This increases pressures on already scarce freshwater resources in ESCWA member countries. Furthermore, while most agricultural waste is biodegradable, the introduction of heavy pollution loads during limited harvest periods results in overburdening the environment and the carrying capacity of local ecosystems. From an economic viewpoint, biofuels constitute a viable environmental technology for use by SMEs. Successful examples across the world have shown that biofuels can provide reliable and sustainable energy supplies for SMEs, reduce energy costs and waste management costs for agricultural SMEs, while also providing complementary employment and income generation opportunities through the use of waste streams to produce alternative energy. As such, SMEs can be considered as both producers and consumers of these biofuels, particularly in rural areas of the ESCWA region. Creating new economic opportunities in agrarian communities also presents social benefits to rural development The current study falls within the context of ESCWA activities aimed at increasing the use by member countries of environmentally sound technologies for enhancing the competitiveness of SMEs and improving sustainable rural development. Specifically, the potential for the development and use by SMEs of secondary biofuels generated from selected agricultural wastes is explored. Chapter I reviews existing uses of agricultural waste and introduces the various environmental technologies and processes for converting agricultural waste into energy. Chapters II to IV explore the feasibility of using the by-products of three agro-industries for secondary biofuel production in the ESCWA region, namely, waste generated from the olive oil, sugar and dairy industries. For each agro-industry, case studies from member countries are elaborated based on local production levels and the state of biofuel development in the specific sectors. Chapter V reviews challenges and opportunities for second-generation biofuel production in the ESCWA region. The study closes with conclusions and recommendations for biofuel development using environmentally sound technologies relevant to the SME sector.

4
I. ENVIRONMENTAL TECHNOLOGIES FOR BIOFUEL PRODUCTION A variety of environmental technologies currently exist aimed at converting agricultural waste into energy. This chapter reviews existing uses of agricultural waste and presents a variety of processes for converting agricultural waste into energy. It concludes with an analysis of the technologies that are most relevant for SMEs in the ESCWA region.
A. EXISTING USES OF AGRICULTURAL WASTE Agricultural waste streams can be used in a variety of ways depending on the nature and setting in which it is produced, as illustrated in figure 1. Many forms of agricultural waste are disposed of improperly. This usually creates significant environmental problems, such as the case of olive press wastewater or the direct disposal of wastewater from dairy farms and food processing plants into neighbouring water bodies. This often occurs in countries with minimal regulations and weak enforcement regimes for environmental protection. In countries where strict regulations exist, significant financial costs may be incurred by producers to stabilize or treat waste before disposal. Agricultural waste can also be disposed of by farmers by selling it to secondary markets where waste by-products are used for other purposes. For instance, harvested palm dates that are of poor quality or size are sold as animal feed; and straw after clearing fields is sold as building material. Most agricultural wastes can also be composted and used as fertilizers and soil supplements. This is a common practice, particularly in rural areas of the Arab region. Markets have thus emerged based on the use of agricultural waste products. These by-product streams should therefore be considered as part of the analysis when examining the feasibility of promoting the application of environmentally sound technologies to derive new products from agricultural waste.
Figure 1. Agricultural waste streams
Agricultural waste is also being used for energy generation. Simply burning biomass for heat generation is a common disposal method in the ESCWA region, despite its adverse effects for health and air pollution. In a large number of agrarian-based countries in the world, animal manure constitutes a major source of energy for cooking and indoor heating. However, other options also exist for deriving energy from agricultural waste.10
10 See, for example, the following: (a) A.M. Omer, “Organic waste treatment for power production and energy supply”, Journal of Cell and Animal Biology, vol. 1, No. 2 (October 2007), pp. 034-047; (b) Department of Economic and Social Affairs (DESA), “Small-scale production and use of liquid biofuels in sub-Saharan Africa: Perspectives for sustainable development” (2007), which is available at: www.un.org/esa/sustdev/csd/csd15/documents/csd15_bp2.pdf; (c) Wetlands International, “Biofuels in Africa: An assessment of risks and benefits for African wetlands” (May 2008), which is available at: http://www.aidenvironment.org/Upload/Files/xhtvkw/Biofuels%20in%20Africa_study%20WI.pdf; (d) European Commission, Directorate-General for Research, Information and Communication Unit, “Energy scientific and technological indicators and references” (2005), which is available at: http://europa.eu.int/comm/research/rtdinfo/index_en.html; and (e) The Royal Society, “Sustainable biofuels: prospects and challenges” (14 January 2008), which is available at: http://royalsociety.org/ displaypagedoc.asp?id=28914.

5
B. DERIVING ENERGY FROM AGRICULTURAL WASTE For the purposes of simplification and categorization, the conversion process can take one of four forms, which are illustrated in figure 2 below. These include the following: (a) simple direct burning, which can occur without any processing and is commonly used for heating purposes around the world; (b) transformation of agricultural waste into solid biofuels; (c) transformation of agricultural waste into liquid biofuels; and (d) transformation of agricultural waste into gaseous biofuels.
Figure 2. Agricultural waste conversion process for biofuels
The transformation of agricultural waste into solid biofuels requires minimal processing. Pressing waste into briquettes or logs is common, with the final product used in fireplaces. Pelletization is a different form of compaction that leads to a product that can be used industrially. The third form of solid biofuels that is commonly made is biochar (charcoal) in which the moisture content of agricultural waste is minimized, thereby providing a lighter, cleaner burning biofuel. Transformation of waste into liquid biofuel is more energy and labour intensive. It requires major investment in plants and an available market for the resulting products, whether methanol or ethanol, resulting from the fermentation of various carbohydrate-containing products, or biodiesel generated from the processing (transesterification) of waste vegetable oils. Similarly, conversion of agricultural waste into gaseous biofuels requires a certain level of processing. The generation of biogas (mainly methane) from anaerobic decomposition or syngas (a mixture of methane, hydrogen and carbon monoxide) from pyrolysis results in biofuels that can be used for heating or electricity generation. A number of technological applications exist to extract energy from biomass. There are state-of-the-art technologies and processes that remain at the research and development (R & D) stage and which are not necessarily economical in their initial stages. However, affordable and appropriate environmentally sound technologies are available in the market for use by SMEs. The commonly used fuel sources for these technologies are solid wood, wood logs, chips, pellets, sawdust, bark, shavings, agricultural residues, nut

6
shells, animal manure and even sewer sludge. The fuel source and its moisture content determine the appropriateness of the technology application. The technology used varies from direct combustion to gasification, pyrolysis and anaerobic digestion. A variety of conversion technologies also exist, namely: furnace, grate boilers, fluidized beds, kilns, co-firing and pyrolysis units. The vast majority of applications are for electricity generation with some heat production. Energy is generated from steam turbines, gas turbines, heat exchangers and even internal combustion engines. The technologies to be reviewed in this chapter are as follows: (a) direct burning; (b) briquetting; (c) pelletization; (d) biochar making; (e) pyrolysis/gasification; (f) anaerobic decomposition; and (g) bioethanol formation.
1. Direct burning Equipment that can convert agricultural residues into energy can be used for domestic, municipal or industrial purposes. Four technological options are often used, as set forth below. (a) Small burning boiler (less than 500 kWt) This type of boiler uses the underfeed stokers burner technology as depicted in figure 3. It gives off its heat to radiators in the same way as an oil-fire burner. These boilers are mainly automatic, given that they are equipped with a silo containing the agricultural solid waste. A screw feeder feeds the fuel simultaneously with the demand of the dwelling. Advantages of these kinds of boilers include high thermal efficiency, low operation cost and the infrequent need for cleaning. Despite an often simple construction, most of the automatically fired boilers can achieve an efficiency of 90 per cent. An important condition for achieving these strong results is that the boiler load capacity during day-to-day operation should be close to full load. For automatic boilers, it is also of great importance that the boiler’s nominal output (at full load) does not exceed the maximum output demand in winter. However, they release 100 parts per million (ppm) of carbon monoxide and must be subject to strict emission control measures.
Figure 3. Small burning boiler
(b) Large-scale boiler (above 500 kWt) In terms of large-scale plants that use agricultural residues, fluidized bed combustors have proven to be a reliable option. The fuel is fed into a solid bed, which has been fluidized, in other words lifted off a distribution plate by blowing air or gas through the plate. The amount of bed material is significant in comparison to that of the fuel. Fluidized bed combustors have a variety of advantages, including simplicity

7
of construction, flexibility in accepting solid, liquid or gaseous fuels (in combination and with variable characteristics), and high combustion efficiency at a remarkably low temperature. Large-scale boiler applications include the following: (a) heat production for large buildings with high heating needs; (b) steam production for small power plants (up to 10 MWe); and (c) combined heat and power application for hospitals and industries. (c) Hot air furnaces Direct heating of air from combustion gases or through heat exchangers can be used for such special applications as chicken farms and heating in greenhouses. (d) Co-firing The possibility of co-firing of agricultural residues with coal exists. It requires minimal modification to existing systems and low capital investment by the power generation industry. Agricultural waste co-firing needs to be considered particularly in areas where the construction of coal power plants is planned. Co-firing of agricultural residues with heavy fuel is also conducted in cement factories when heavy fuel prices are high.
Box 1. Success stories of heat/electricity generation through direct burning of agricultural waste Success story 1. Sweden, burning for heat: A Swedish farmer, cultivating 400 hectares of wheat invested a loan of €760,000 into a 3 MWt straw-fired heating plant. After sending the heat to the district heating company, the plant earned him an annual turnover of €330,000. The process currently consumes an otherwise troublesome rye. The farmer is currently buying straw from other farmers at €0.03/kg. His initiative added a profitable environmental revenue stream to his farm income without State support. Success story 2. China, burning for electricity: In China, $31 million was invested in a power plant to burn 200,000 tons of straw and generate 130 GWhe of electricity annually from a product that used to be burnt in open areas. Success story 3. Australia, burning for electricity: Two million dollars were invested in the world’s first power station fuelled by waste macadamia-nut shells. It consumes 5,000 tons of waste material per year and produces 1.5 MWe of electricity. The annual production is 9.5 GWhe, which is enough to power some 1,200 homes. Success story 4. United Kingdom, burning for electricity: A power station running on hay produces enough electricity for 80,000 houses at a cost of $84 million.
2. Briquetting
Briquetting (logs) to produce compacted biofuels, which can be used for combustion or gasification, is an old technology that enables compaction and consequently economic and easy transfer to the end user (logs of 1-2 kg weight). Clients demand briquettes for use as a fuel for domestic boilers, feedstock for combustion systems and/or minor domestic or small industrial systems.11 Emissions from the combustion of briquettes can vary substantially; burning is usually undertaken in a relatively uncontrolled environment and can be harmful for the environment. However, considering that deforestation is a main problem in the ESCWA region, briquettes offer a substantially better alternative to wood logs or charcoal. 11 Free Patents Online, “Method and device for pelletizing unprocessed sugar-cane bagasse” (4 April 2007), which is available at: www.freepatentsonline.com/EP1770152.html.

8
(a) Use of briquettes First-generation equipment needed to use briquettes include open type fireplaces and traditional radiant stoves that have an average conversion efficiency (primary combustible heating value converted to useful heating value) of 20 per cent. Second-generation equipment include forced convection type stoves and wood log boilers that enjoy an average conversion efficiency of 80 per cent. While first-generation equipment constitutes a low-cost investment, it is not energy efficient. The introduction of second-generation equipment could advantageously replace fuel oil solutions in rural areas and with higher comfort than first-generation equipment. (b) Production of briquettes The production of briquettes comprises five principal stages, including raw material stocking and preparation, drying to below 18-19 per cent moisture, fabrication, cooling, and packing and stockpiling of briquettes. The briquettes have a heating value of 16-18 MJ/kg and a density of about 650-700 kg/m3. The production of five tons of briquettes per hour with a moisture content of 5-10 per cent from an input of 10 tons per hour (with a moisture content of 50 per cent) requires the equipment listed in table 1. This equipment is normally imported (I) or can be available on the local market or locally produced (L).
TABLE 1. EQUIPMENT REQUIRED FOR THE PRODUCTION OF BRIQUETTES
Equipment Specification Local (L) /Imported (I) Loader 1.5 m3, 90 HP I Feed Hopper CS-10 m3 L Apron Conveyor 10 t/hr – 4 HP L Belt Conveyor 10 t/hr – 3 HP L Electromagnetic Separator 4 kW I Destoner 10 t/hr I Screw Conveyor 10 t/hr , 4 HP L Dryer 10 t/hr, provided with air for and auxiliary
burner- solid fuel operated 120 HP L
Exhaust Gases Solid Load L Cyclone or Fan 5 t/hr , 7.5 HP L Pelletizer system (2) Capacity 6 t/hr I Belt Conveyor 6 t/hr, 3 HP L Vibrating Screen 4 t/hr, 2 HP L Cooling (2) 3 t/hr, 3 HP L Belt for Rejects 2 t/hr , 2 HP L Packaging System 5 t/hr, 7.5 HP L
3. Pelletization
Pelletization serves to reduce the volume of waste wood, thereby rendering it more manageable and usable. Compaction of up to 70 per cent is possible.12 For example, the production of 1 ton of pellets with a moisture content of 7-10 per cent requires 7 m³ of sawdust with a moisture content of 50-55 per cent, or 10 m³ of cutter shavings with a moisture content of 10 to 15 per cent. (a) Production of pellets Drying is necessary if moist raw materials are used and is generally achieved with the help of a hot gas generator. The grain material during the milling process is grounded into a grain size equivalent to the 12 Based on an interview conducted with J.P. Sfeir on 4 February 2009.

9
diameter of the pellet. These two processes may be combined. The pellets are then compressed and the adhesion is caused by the lignin that softens when compressed by the heat generated (up to 90 °C). Cooling allows the lignin to cool and hold the pellet together so that the shape remains unchanged. Screening ensures that a homogeneous product is formed and is equivalent to the standards to avoid problems with combusting equipment. (b) Characteristics of wood pellets While the properties of pellets vary with the production method used, their diameter is generally 6-10 mm with a length of 10-30 mm. Their moisture content is 7-12 per cent and they generally have a bulk density of 650-700 kg/m3. The energy content of pellets varies between 3000-3300 kWht/loose m3, which is equivalent to 300-330 litres of light fuel oil. The storage space required for wood pellets is a mere 1.5 m3/t, which is a great improvement over the space needed to store loose wood residues.
4. Biochar (charcoal) Biochar is preferred to coal in many applications involving in-house heating and cooking. The thorough drying involved in the process of making biochar insures higher calorific value per unit of weight, namely, 33 MJ/kg compared to 17 MJ/kg for wood.13 In addition, burning biochar avoids the production of excessive fumes and particulates generally associated with wood burning. Biochar can be found in a variety of forms, including lump biochar, briquette biochar and extruded biochar. Biochar is generally obtained from heating wood in the absence of oxygen, which can be achieved by one of the following two methods: (a) The direct method, which uses heat from the incomplete combustion of organic matter used that is supposed to become the biochar. In terms of use, this approach results in the release of particulates that contribute to air pollution; (b) The indirect method, which burns the organic matter in a retort, closed and vented airless chamber, which is then used for heating or the generation of steam, as illustrated in figure 4. This method uses external heat to cook the matter and yields higher quality biochar. This method is finding increasing application across the world. A variety of primary and secondary agricultural materials have been used to make biochar, such as wood, bamboo, wood residues, coconut shells,14 sugarcane waste,15 rice husk, hardwood and softwood, sawdust, wood shavings, fruit stones, nut shells, nuts, bark, corn cubs and cotton seeds.16 The major by-products are carbon monoxide, carbon dioxide, methane, ethane, acetic acid, methanol, tars, water and heavy oil. Organic matter and carbon monoxide are converted into CO2 and water before leaving the retort.
13 R.C. Pal and V.K. Singh, “Charcoal making technology for livelihood for rural people”, which is available at: www.fuelnetwork.org/index.php?option=com_docman&task=doc_download&gid=207.
14 G. Pari et al., “Charcoal production for carbon sequestration” (2004), which is available at: http://project.jica.go.jp/ indonesia/0065045I0/archives/pdf/output3.pdf.
15 S.H. Hibajene and O.S. Kalumiana, “Manual for charcoal production in earth kilns in Zambia” (2003), which is available at: http://www.bioquest.se/reports/Charcoal%20production%20manual%20ENGLISH.pdf.
16 Food and Agriculture Organization (FAO), “Industrial charcoal production – Development of a sustainable charcoal industry” (June 2008), which is available at: http://www.drveniugljen.hr/assets/files/pdf/FAO_Industrial%20charcoal% 20production.pdf.

10
Particulate matter can be controlled by a fabric filter (99 per cent control) or centrifugal collector (65 per cent control).17
Figure 4. The retort principle of carbonization
The moisture content of biochar varies between 5 per cent and 8 per cent;18 and liquid and tarry residues constitute 5-40 per cent. The content depends on the length of the period of carbonization. The lower the content of volatile matter, the harder it is to ignite the biochar. However, once it does ignite, it burns very cleanly. The ash content is 0.5-5 per cent and contains magnesium oxides, silica and calcium.
Box 2. Biochar to combat climate change The United Nations Convention to Combat Desertification (UNCCD) and the United Nations Framework Convention on Climate Change (UNFCCC) are working with the International Biochar Initiative to raise international awareness about the potential of biochar as an energy source and tool to combat climate change. Biochar has also been identified as a soil amendment that can greatly enhance soil productivity, given that it holds and makes water and nutrients available to plants. It can also capture and store carbon dioxide (CO2) in the soil and as such is attracting considerable interest as a potential tool to slow global warming. _________________________
Source: International Biochar Initiative, “Biochar Policy at the International and Federal Levels” (May 2009), which is available at: www.biochar-international.org.
17 R.C. Pal and V.K. Singh, “Charcoal making technology for livelihood for rural people”, which is available at: www.fuelnetwork.org/index.php?option=com_docman&task=doc_download&gid=207.
18 Food and Agriculture Organization (FAO), “Industrial charcoal production – Development of a sustainable charcoal industry” (June 2008), which is available at: http://www.drveniugljen.hr/assets/files/pdf/FAO_Industrial%20charcoal %20production.pdf.

11
5. Pyrolysis/gasification Pyrolysis and gasification is a comparatively new technology that is currently being introduced across the world and is still at the experimental level. The main drawback from pyrolysis and gasification is the high cost associated with initial set up and operation of these facilities, making such solutions economically unfeasible in the ESCWA region without government support. The technology consists of the following two-stage process:19 (a) Pyrolysis or thermal decomposition, which takes place in the first stage at a temperature between 450°C to 600°C (the temperature depends on the fuel used) in the absence of air, which allows the volatile components of the biomass used to be vaporized by heat. The vapour consists of carbon dioxide, methane, carbon monoxide, hydrogen, water and volatile tars in addition to charcoal as a residue representing about 10-25 per cent of the original biomass; (b) Gasification or char conversion, which is considered to be the second stage in this process and occurs at a temperature ranging between 700°C to 1,200°C and where the charcoal is reacted with oxygen to produce carbon monoxide. Pyrolysis has also been used for production of bio-oil and char (carbon and residues). The latter is combusted to generate the energy for the endothermic pyrolysis process. Bio-oil projects from biomass have been established as demonstration projects in some developed countries. The product is claimed to be equivalent to fuel oil (#2) or may be further processed to produce chemicals.20 (a) Gasification to produce thermal energy Gasification systems may rely on simple packed bed reactors to sophisticated dual fluidized beds with sand recirculation. The main steps involved in agricultural waste conversion to thermal energy for direct use essentially comprise biomass feed handling and processing, gasification, with pre-dryer, gas combustion and a steam generator. This biofuel production module necessitates the availability of steam produced for immediate use (without storage). As an example, when producing biofuel from sugar processing, the main equipment required for a feed bagasse of 10 t/hour and an output of 10 t/hour of steam at 15-20 bar is presented in table 2.
TABLE 2. MAIN EQUIPMENT REQUIRED FOR PRODUCING THERMAL ENERGY THROUGH BAGASSE GASIFICATION
Equipment SpecificationsLocal (L) /
Imported (I)Loader 1.5 m3, 90 HP I Feeding system including hopper and
conveyors 10 t/hr capacity, 4 HP L
Gasifier system with pre-dryer 6 t/hr dry solids capacity with gas cleaning system 7.5 HP
L
Gas combustor system 500 m3/hr gas with auxiliary burner and air fan, 67.2 MWht thermal
L
Steam boilers 10 ton/hr - Steam at 15-20 bar I/L
19 M. Niaounakis and C.P. Halvadakis, Olive processing waste management: Literature review and patent survey, vol. 5, second edition (2006).
20 DynaMotive Energy Systems Corporation, “Fast pyrolysis of bagasse to produce biooil fuel for power generation”, which was presented at the 2001–Sugar Conference and is available at: www.biooil.ru/docs/2001SugarConferencePaper.pdf.

12
(b) Gasification to produce electricity and steam During the gasification process to produce electricity and steam from agricultural waste, the waste is thermally converted through partial oxidation to what is known as syngas (H2 and CO) after a pre-drying period. The gases are combusted to operate a gas turbine to generate electricity. The hot exhaust gases are directed to a boiler to generate steam for direct use. The main equipment needed to process 6 t/hr of wet bagasse (briquettes could be used excluding the drying phase) to produce 3 MWe
is presented in table 3.21
TABLE 3. MAIN EQUIPMENT REQUIRED FOR PRODUCING ELECTRICITY AND STEAM THROUGH GASIFICATION
Equipment Specifications Local (L) /
Imported (I) Loader 1.5 m3, 90 HP I Feeding system including hopper and
conveyors 8 t/hr capacity 4 HP
L
Gasifier system with pre-dryer 4 t/hr dry solids capacity with gas cleaning system 7.5 HP
L
Gas combustor system 500 m3/hr. Gas with auxiliary burner and air fan, 67.2 MJ/hr thermal
L
Gas turbine Output 3 MW I Steam turbine with boiler and condenser 155 kW L/I
6. Anaerobic decomposition
The anaerobic digestion’s efficiency is 35-50 per cent and composting (aerobic and anaerobic) is usually accompanied by 40-50 per cent reduction in mass.22 Aerobic composting requires energy while anaerobic composting has the potential to produce energy as a result of burning biogas for direct use in rural stoves or furnaces or conversion to automotive power.23 Accordingly, the anaerobic decomposition is the type reviewed below. Anaerobic decomposition or the methane fermentation process is defined as the conversion of the organic material to methane and carbon dioxide without molecular oxygen.24 The digester feed should be adjusted to specific moisture content according to the selected dry (85-90 per cent moisture) or wet methods (60-80 per cent moisture). Several other parameters exist, including ratios of carbon to nitrogen to phosphorous and pH. Biogas is adopted widely in several developing countries at various scales, ranging from 2 m3/day for family size units to 12-150 m3/day for community plants.25 Organic and agricultural wastes from various sources are commonly collected into one anaerobic decomposition facility to undergo
21 International Society of Sugar Cane Technologists, “Design, build-up and evaluation of a sugarcane biomass (bagasse and trash) gasification pilot plant with 3 MWE of power” (June 2007), project proposal for the International Sugarcane Biomass Utilization Consortium (ISBUC), which is available at: http://issct.intnet.mu/ISBUCresprop1.HTM.
22 TDC-Olive, “By-product reusing from olive and olive oil production”, which is available at: http://www.biomatnet.org/ publications/1859bp.pdf.
23 G.L. Shukla and K.A. Prabhu, “Bio-gas production from sugarcane biomass and agro-industrial waste”, which is available at: http://www.cababstractsplus.org/abstracts/Abstract.aspx?AcNo=19960302970.
24 A.A. Atayol, “Anaerobic co-treatability of olive mill wastewaters and domestic wastewater” (Izmir Institute of Technology, Izmir, Turkey, 2003), which is available at: http://library.iyte.edu.tr/tezler/master/cevremuh/T000239.pdf.
25 D. Kannan, “Renewable energy in developing countries with an emphasis on India”, which was presented at the International Student Festival in Trondheim 2009 and is available at: http://folk.ntnu.no/kannan/renewable_energy_ isfit09_presentation.pdf.

13
co-digestion, thereby ensuring maximum organic load from the best output. Animal waste is often used as the sole source of biomass. Biogas is 55-70 per cent of methane by volume, with the rest being carbon dioxide and traces of hydrogen sulfide and ammonia. The biogas generated is usually saturated with water vapour and is treated and burned to generate electricity preferably in a combined heat and power (CHP) plant. The use of this technology is restricted to producers with access to large biomass input volumes and to electricity grid networks capable of accepting the generated power. Table 4 summarizes general operating conditions for an anaerobic digestion plant. It is clear that there is some acceptable variation in the process and plant managers must optimize plant operating procedures based upon local conditions, restrictions and needs. Varying input materials and hence outputs, equipment and net generated energy can be obtained by anaerobic digestion due to the wide variation of capacities, technological level and feed materials, among others.
TABLE 4. OPERATING CONDITIONS FOR ANAEROBIC DIGESTION PROCESSES
Operating parameter Typical value
Temperature Mesophilic 35°C Thermophilic 55°C
pH 7-8 Total dissolved solids (TDS) 2500 mg/L minimum Retention time 10-30 days Loading rate 2.26 – 5.26 kg VS/m3/d Biogas yield 0.18-0.5 m3/kg VS Methane content 60-70 per cent
Source: Engler, C.R., Jordan, E. R., McFarland, M.J. and Lacewell, R.D. Economic and Environmental Impact of Biogas Production as a Manure Management Strategy. Available online from: www.agmrc.org/media/cms/Engler2_F05E9EA9371B6.pdf.
7. Bioethanol The process for bioethanol production is depicted in figure 5. Second-generation ethanol production from cellulosic biomass is still in the early stages of development to be economically viable. However, extensive work is currently being undertaken for the development of all processing phases given that the potential for the future production of ethanol from biomass is relatively high. The aqueous raw ethanol produced can be concentrated, dehydrated and mixed with gasoline for use in transport.26
26 See K.L. Kadam, “Environmental life cycle implications of using bagasse-derived ethanol as a gasoline oxygenate in Mumbai (Bombay)” (November 2000), which is available at: www.nrel.gov/docs/fy01osti/28705.pdf; M.I. Rajoka, “The enzymatic hydrolysis and fermentation of pretreated wheat straw and bagasse to ethanol”, ATDF Journal, vol. 2, No. 2 (2005), which is available at: www.atdforum.org/IMG/pdf/ethanol.pdf; and A. Hinkova and Z. Bubnik, “Sugar beet as a raw material for bioethanol production”, Czech J. Food Science, vol. 19, No. 6 (2001), pp. 224-234, which is available at: www.cazv.cz/attachments/5-Hinkova.pdf.

14
Figure 5. Process block diagram of ethanol production from biomass
The main equipment needed for a 1.7 t/hr input and 0.25 t/hr production of bioethanol is presented below in table 5.
TABLE 5. EQUIPMENT NEEDED FOR BIOETHANOL PRODUCTION
Equipment Specifications Local (L)/
Imported (I) Dryer 2 t/hr output L Bagasse processing Milling to 1-2 mm I Pretreatment system Feed tanks, reactors, filters L Hydrolysis-Fermentation Feed tanks, reactors, digesters, filters I/L Ethanol solution Concentration
Azeotropic distillation, molecular sieves or pervaporation
I
Energy generation from residues Combustor, boiler L Wastewater treatment system L

15
II. BIOFUELS DERIVED FROM OLIVE RESIDUES
A. OVERVIEW The olive oil industry produces all of its line of liquid and solid waste within two to three months after the olive harvest period in concentrated areas near olive presses. The large amount of generated wastewater results in the colourization of surface and spring waters. In addition, villagers often complain of the foul smells emitted by stacking the pomace (locally called jifit) as it ferments and undergoes composting in the open air. Currently, while some initiatives have been launched to reduce wastewater effluents from olive presses in order to limit adverse impacts on groundwater resources, little attention has been directed at managing solid waste streams. Disposal of pomace is a problem even in Italy where presses pay transportation costs to remove pomace off-site. Some secondary industrial activities are based on this by-product. For instance, the removal of olive pits and the extraction of olive oil from pomace (pomace oil) are activities generally pursued in the soap industry. Within the context of olive processing, figure 6 illustrates the most basic processes involved in the production of olive oil and the use of its by-products. The potential energy derivations of olive cake (pomace) can be produced from a variety of pressing methods, namely: traditional, three-phase and two-phase. The main non-energy uses of pomace are for building bricks, animal feed, soap production, composting and reapplication on agricultural lands. Various energy producing applications exist, including transforming the pomace to logs, pellets, biochar or direct burning. Alternatively, advanced technologies, such as anaerobic decomposition to produce biogas or pyrolysis to produce syngas followed by heat or electricity generation, have also been used to treat the residues.
Figure 6. Schematic of olive processing and potential fate of by-products
This chapter aims to analyse the financial and environmental aspects of generating energy in the form of heat or electricity from olive pomace in order to pave the way for SME investment in these technologies.

16
Case studies from Jordan, Lebanon, Palestine and the Syrian Arab Republic are presented given the size of their national olive oil sector as compared to other countries in the ESCWA region. The findings and analysis can also enlighten further assessments regarding the potential for biofuel development in other Arab countries. Environmentally sound approaches for the disposal of wastewater (also called vegetable water) generated from the olive oil industry are not addressed, as this study focuses on by-products that can be used to produce second-generation biofuels.
B. OLIVE OIL INDUSTRY STATUS Mediterranean countries devote a significant portion of their agricultural land to olive production. Table 6 shows the areas dedicated to olive cultivation and their productivity in selected ESCWA member countries. Palestine is excluded from the table given the lack of reliable, up-to-date information on the number of olive trees remaining there.
TABLE 6. TREES PLANTED, AREAS AND PRODUCTIVITY OF OLIVES IN SELECTED ESCWA MEMBER COUNTRIES
Country Trees planted
(millions) Hectares planted
(thousands) Olives produced
(thousand tons/hectare) Lebanon 6 57.6 1.5-3.0 Jordan 10 64 520 .. Syrian Arab Republic 60 500 000 ..
Sources: European Community Contribution Agreement with an International Organization, “Integrated waste management for the olive oil pressing industries in Lebanon, Syria and Jordan” (2003), which is available at: http://www.undp-jordan.org/Portals/0/OO per cent20PD per cent201.pdf; A. Salibi, “Marketing study for olive, olive oil and apple in Lebanon” (June 2007), which is available at: http://www.agriculture.gov.lb/Studies/Bseline%20study%20for%20Apple%20and%20Olive%20June% 202007-GTFS-REM-070-ITA.pdf; and F.M. Santucci, “Organic agriculture and olive oil production in the southern Mediterranean countries” (OLIBIO Research Project, 2007), which is available at: http://orgprints.org/13528/01/Santucci-OA_in_the_Med.pdf.
Note: Two dots (..) indicate that insufficient data is available. A significant variation in data exists for Lebanon. According to the Ministry of Agriculture, Lebanon had some 14 million olive trees in 2005, with a density of 200-250 trees/ha. Lebanon has 544 presses with the typical mill having a 600 kg/hour capacity and usually working at a capacity of 150 kg/hour.27 Complementary industries exist, including soap-making, charcoal production, packaging and composting. Table 7 shows some of the reported values for olive processing into oil for Lebanon and Palestine. The numbers are relatively consistent for both ESCWA members.
TABLE 7. TYPICAL PRODUCTION OF BY-PRODUCTS PER TON OF OLIVES
Country or territory Olives
Oil (kg) Solid residue (ton)
Wastewater (m3)
Energy (input)
Lebanon 1 ton 200 0.4-0.6 0.6-1.2 m³ 40-170 kW Palestine 1 ton 200 > 0.4 0.6-1.2 m3 40-117 kW
Sources: Ministry of Economy and Trade in Lebanon, “Integrated assessment of the Lebanon-EU Association Agreement: A pilot study on the Lebanese olive oil sector” (February 2006), which is available at: www.economy.gov.lb/NR/ rdonlyres/6BD2EE6D-81D5-49E6-894A-1E1A931BCAAC/0/ExecutivesummaryUNEP28February.pdf; and H. Shaheen, “Management of olive mills wastes in the Palestinians territories” (in Arabic), which is available at: http://unpan1.un.org/ intradoc/groups/public/documents/ARADO/UNPAN020869.pdf. Table 8 summarizes the production of olives, oil and other derivatives and their methods of disposal. Olive productivity varies in alternating years and this causes the wide ranges in productivity. While 82 per
27 ESCWA, “Technology transfer to small and medium-sized enterprises and identifying opportunities for domestic and foreign direct investment in selected sectors: The case of SME clusters in the agro-food and apparel industries” (E/ESCWA/SDPD/2005/6), pp. 22-30.

17
cent of pomace generated in Jordan is used for heating,28 it is clear from the row on disposal methods that there is an absence of proper disposal of either the liquid or solid by-products in these ESCWA member countries, and an urgent need to remedy the situation exists. It is important to note that the Syrian Arab Republic produces 7 per cent of the world olive oil production.29 It may be reasonable to estimate that, roughly, 2-3 times as much pomace as oil is generated. This estimate stems from the fact that various processing methods produce varying amounts of pomace. Accordingly, around 60 to 90 thousand tons of pomace are generated annually in Palestine (75 thousand tons is taken as an average), while 140 to 230 thousand tons are generated in the Syrian Arab Republic (200 thousand tons is taken as an average).
TABLE 8. ANNUAL PRODUCTION OF VARIOUS OLIVE PRODUCTS
Product Jordan Lebanon Palestine Syrian Arab
Republic Olives (thousand tons) 52-253 70-189 120-124 785 Olive oil (thousand tons) 13 11.5-25.5 20-35 70-116 Solid press residue (Jifit,
thousand tons/yr) 100 66 75 200
Current Jifit disposal method
- Biochar - Into the surrounding
environment- Heating - Dried and burned to heat
factories and houses .. Current price for solid
waste ($/ton) .. 100 .. .. Waste water produced
(thousand m3/yr) 180-500 119.4 <200 .. Current wastewater
disposal method
- Lagoons - Rivers - Sewage - Streams
- Sewers - Rivers - Irrigation - Sea - Valley - Open
discharge - Cesspool
- Valleys - Watercourses ..
Sources: European Community Contribution Agreement with an International Organization, “Integrated waste management for the olive oil pressing industries in Lebanon, Syria and Jordan” (2003); A. Salibi, “Marketing study for olive, olive oil and apple in Lebanon” (June 2007 Ministry of Economy and Trade in Lebanon, “Integrated assessment of the Lebanon-EU Association Agreement: A pilot study on the Lebanese olive oil sector” (February 2006); S. al-Shdiefat, M.S. el-Habbab and A. al-Sha’er, “Introducing organic farming system in olive production and linking small farmers to markets”; A.M. Aqeel and K.M. Hameed, “Implementation of olive mill by products in agriculture”, World Journal of Agricultural Sciences, vol. 3, No. 3 (2007); H. Shaheen, “Management of olive mills wastes in the Palestinians territories” (in Arabic M. Ghazal and H. Namrouqa, “Jordan: Pilot plant to treat olive vegetable water”, Jordan Times (1 July 2007); The Olive Oil Source, “Disposal of olive processing by-products”; H. Shaheen and R. Abdel Karim, “Management of olive-mills wastewater in Palestine” (2007); F. Aqra et al., “Reducing the environmental impact of olive mill wastewater”, American Journal of Environmental Science, vol. 5, No. 1 (2009); and W. al-Tawil, “Syrian Arab Republic” (CIHEAM-Option Méditerranéennes, 2001). Note: Two dots (..) indicate that data are not available. The Management of Resources and Environment Solutions (MORES) reported that 30 per cent of produced olives in Lebanon were used as table olives while 70 per cent were pressed for oil with a productivity range of 18-25 per cent (20 per cent average).30 Other reports indicate that a mere 10 per cent of olives are generally being sold as table olives with the rest pressed to extract olive oil. 28 M.I. al-Widyan, G. Tashtoush and A.M. Hamasha, “Combustion and emissions of pulverized olive cake in tube furnace”, Science Direct (2006), which is available at: http://linkinghub.elsevier.com/retrieve/pii/S0196890405001998.
29 TDC-Olive, “By-product reusing from olive and olive oil production”, which is available at: http://www.biomatnet.org/publications/1859bp.pdf.
30 See Management of Resources and Environment Solutions (MORES), which is available at: http://www.mores.com.lb/.

18
As shown in figure 7, there are three methods for extracting oil from olives. The traditional method is most commonly used in the countries of interest. For example, the mills present in Lebanon are 87 per cent traditional, 10 per cent three-phase, and 3 per cent two-phase.31 The three-phase process is an intermediate technology that allows continuous processing of olives, thereby improving the overall system efficiency, albeit requiring large amounts of water. The two-phase decanter process is the most modern method and is commonly used in Spain, but is not as common in ESCWA member countries. It maximizes the efficiency of use of freshwater and minimizes wastewater production. On the other hand, the resulting pomace is harder to work with owing to its high moisture content and long drying periods.
Figure 7. Production of waste from various olive oil production methods
Source: TDC-Olive, “By-product reusing from olive and olive oil production”, which is available at: http://www.biomatnet.org/publications/1859bp.pdf. Olive composition varies depending on several factors, including, among others, varieties, land, rainfall and harvesting time. However, the composition of olives is generally 48-51 per cent water, 19-23 per cent oil and the rest is solid material.32 The solid waste (pomace) generally contains 3-4.5 per cent oil, while the wastewater contains 1.3 per cent olive oil. The pomace is commonly reprocessed to extract residual oil from it. Table 9 presents a more detailed analysis of the two-phase and three-phase products, including pomace and vegetable water composition.33
31 Ibid.
32 TDC-Olive, “By-product reusing from olive and olive oil production”, which is available at: http://www.biomatnet.org/publications/1859bp.pdf.
33 K. Tsiftes and P.A. Fokaides, “Utilization of olive husk in energy sector in Cyprus”, Renewable Energy Sources & Energy Efficiency (2007), which is available at: www.tekes.fi/eu/fin/partnerinhaku/energia_tiedostot/Fokaides_cypros.pdf.

19
TABLE 9. ANALYSIS OF OLIVE OIL PRESSING PRODUCTS
Extraction method Two-phase Three-phaseOil extraction capacity (percentage) 86 85
Pomace Quantity (kg/100kg of olives) 72.5 50.7 Moisture (percentage) 57.5 50.7 Oil (percentage) 3.16 3.18 Oil (percentage dry matter) 7.44 6.68 Oil (kg/100kg of olives) 2.28 1.60 Dry pomace (kg/100kg of olives) 30.7 23.9
Vegetable waters Quantity (litres/100kg of olives) 8.3 97.2 Oil (g/litre) 13.4 12.6 Oil (kg/100kg of olives) 0.14 1.2 Dry residual (kg/100kg of olives) 1.2 8.3
Source: K. Tsiftes and P.A. Fokaides, “Utilization of olive husk in energy sector in Cyprus”, Renewable Energy Sources & Energy Efficiency (2007), which is available at: www.tekes.fi/eu/fin/partnerinhaku/energia_tiedostot/Fokaides_cypros.pdf.
C. POMACE AS A SOURCE OF ENERGY
1. Applied technologies
As detailed in chapter I, a variety of technologies exist for extracting biofuel from biomass. This section analyses the technologies relevant to pomace handling. (a) Direct burning A common use of energy from pomace is to use it for the private heating needs of mills or those of nearby installations. Direct incineration of dried olive waste can produce 4,650 kWht per ton. The ashes can then be used as a source of minerals for soils.34 An example using direct burning is a 70 kW district heating plant running on olive pits in Arnasco, Italy, which provides enough heat for a church and an annexed building. In Cyprus, 70 small boilers (<96 kWt) and ten large boilers (>96kWt) exist, the largest of which is in the Monastery of Machairas with a power of 850 kWt.35 With respect to the characteristics of the fuel source, olive residue moisture should not exceed 20 per cent. Pressed olive residues delivered from pomace traditional extraction plants are already shattered and dry and, therefore, represent a suitable fuel for combustors and boilers. However, if the crude olive cake results from a two- or three-phase system, it contains significant amounts of vegetable water and requires pre-drying before combustion can take place. This can take usually four to five months. Olive residues have a density of 550 kg/m3 at a moisture content of 5.5 per cent and have a heating value similar to common coal. Burning olive husk directly produces several products, including as follows:36 (a) The unburned material and the portion that cannot be burned from the olive husk is the bottom ash. It contains significant amounts of metals and few unburned organics. This ash can be used as soil amendment in order to replenish nutrients; 34 TDC-Olive, op. cit.
35 M. Niaounakis and C.P. Halvadakis, Olive processing waste management: Literature review and patent survey, vol. 5, second edition (2006).
36 K. Tsiftes and P.A. Fokaides, “Utilization of olive husk in energy sector in Cyprus”, Renewable Energy Sources & Energy Efficiency (2007), which is available at: www.tekes.fi/eu/fin/partnerinhaku/energia_tiedostot/Fokaides_cypros.pdf.

20
(b) Fly ash, which contains copper and sometimes chlorine, both catalyses the formation of polychlorinated dibenzo-p-dioxins (PCDD) and polychlorinated dibenzofurans (PCDF), albeit in trace amounts. The addition of urea to the husk before burning can reduce fly ash toxicity. The olive kernel fly ash is considered to be ecotoxic and needs specific treatment before land filling; (c) Scrubber products. Cases of direct olive waste burning have been reported. In 2005, the United Kingdom burnt 283,222 tons of olive waste imported from Greece, Italy and Spain. The main use was co-firing for electricity generation as a means to help to achieve climate change targets. However, the transport of the oil residues from the importing countries produced 21.2 kg of CO2 per ton of biomass, thereby offsetting some of the benefits. Burning biomass such as olive residues is CO2 neutral. However, other emission factors, including particulate matter (dust), carbon monoxide, hydrocarbons and nitrogen oxides, are significantly higher with olive residues with the exception of sulphur dioxide. Accordingly and despite the many potential advantages for pomace burning, care should be taken to control air emission released from such a process, as well as transportation-related environmental impacts. (b) Briquetting (logs) Transforming pomace into logs provides a useful method of handling. Pomace logs have a clear advantage over wood in most aspects (heating value and ash content), with the exception of the potential emission of offensive odours. Compaction is an extremely important part of the usage process and up to 90 per cent compaction rate is achieved.37 Olive residues briquetting (logs) is for the time being the simplest way to improve handling of pomace when used in small or domestic applications. For example, one such compactor in Lebanon produced 1.5 tons/h of logs, each log weighing 1.2 kg and measuring 22 cm in length and 10 cm in diameter. Users of these fire logs indicated that they were generally happy with their performance and that the logs burn for around 1.5 hours. The economic viability of this technology has resulted in many oil presses adopting it. For example, all the presses in the municipality union of Hasbaya in Lebanon have their own log-making equipment and the majority of the production is either used in the presses themselves or given to close family members. Logs are currently being sold between $125 and $175 per ton. Due to its low compressive strength, olive residues shatter easily, depending on its moisture content and pressurization. One way to improve the properties of briquettes is to add paper waste, which contains fibrous material, thereby increasing the shatter index substantially. In addition, waste paper has similar combustion characteristics to that of agricultural residues and will have minimal effect on the burning rate. (c) Pelletization Given its tendency to shatter, pomace may present some problems in pelletization and requires further research into discovering the best blend for the purpose of producing pellets. A competitive edge exists in this context for manufacturers who can prepare such blends. (d) Pyrolysis/gasification and anaerobic decomposition Both pyrolysis and anaerobic decomposition are experimental technologies and few test projects have been implemented with no wide application yet. In Rossano Calabro in Italy, a 4 MWe biogas engine coupled 37 Weima, “High performance briquetting system for volume reduction” (2009), which is available at: http://www.bestmachinery.hu/pdf/weima-th-400-e.pdf.

21
with a gasification system is the first commercial example of a gasification/electric power plant to operate on olive waste products.38 The char produced from olive waste releases less sulphur and nitrogen when compared to other waste sources. (e) Fermentation Most recently, scientists in Spain have been able to produce 5.7 kg of bioethanol from 100 kg of olive pits.39 However, while this process is still in the developmental stage, it has a significant advantage over other methods of energy production given that it produces liquid fuel and exhibits a huge potential for growth.
2. Market potential When analysing pomace use as biofuel, it is important to evaluate embedded energy as represented by the average heating value for each form of solid waste produced. In Spain, where the two-phase process is generally used, the average heating value for virgin pomace (55-70 per cent moisture) is 1,800 Kcal/kg, whereas for dry pomace it is 3,800 Kcal/kg. The separated pits or stones have a heating value of 4,100 Kcal/kg.
TABLE 10. PRODUCTION, CALORIFIC VALUE AND ELECTRICITY POTENTIAL FROM ITALY AND SPAIN
Production (ton/year)
Heating value (Kcal/kg)
Energy content (Italy) (kWht/kg)
Energy (MWht/year)
Virgin pomace 2 058 221 1 800 .. 3 183 064 Dry pomace (<10 per cent moisture) 1 770 378 3 800 4.65 4 307 906 Pits/stones 1 050 000 4 100 5.4 5 005 814
Source: Regional Energy Agency for Central Macedonia, “Market of olive residues for energy” (2008), which is available at: http://www.moreintelligentenergy.eu/public/file/publications/More_WP3_D%203.pdf. Note: Two dots (..) indicate that data are not available. Table 11 estimates the total selling costs of pomace. These values give an indication of the yearly market volume for SMEs producing and supplying olive residues. Based on the cost in Lebanon of $100 per ton of pomace, the market volume for pomace in the country is an estimated $36 million per year. In order to simplify the calculation, an approximate annual olive production value is considered based on the following assumptions: (a) A total of 80 per cent of olives is pressed for oil; (b) Pomace production is 40 per cent of the amount of olives pressed; (c) The selling price across the region is $100/ton; (d) Energy cost savings amount to $0.05/kWh. Based on an average energy cost saving index of $0.05/kWh, table 11 estimates that energy cost savings for the whole region is some $84 million per year where olive residues are used instead of traditional fuels (such as diesel fuel or wood logs). This amount can finance a lot of SMEs interested in manufacturing, trading, installing and maintaining combustion equipment fuelled by olive residues. 38 R. Bailey, M. Colombo and W.N. Scott, “A 4 MWe biogas engine fueled by the gasification of the production of olive oil wastes (sansa)”, which is available at: http://www.brdisolutions.com/pdfs/bcota/abstracts/9/25.pdf.
39 “Olive seeds as biomass” (in Arabic), 31 October 2008, which is available at: http://www.srfo.org/newsdetail.asp? ID=29&ln=ar.

22
TABLE 11. MARKET VOLUME ESTIMATION FOR POMACE
Country or territory
Olives produced
(tons)
Olives pressed (tons)
Pomace produced (tons)
Pomace selling Market volume
($)
Yearly country energy cost
saving ($/year)
Total SMEs market volume ($/year)
Lebanon 110 000 88 000 35 200 3 520 000 8 184 000 11 704 000Jordan 120 000 96 000 38 400 3 840 000 8 928 000 12 768 000 Syrian Arab Republic 785 000 628 000 251 200 25 120 000 58 404 000 83 524 000
Palestine 120 000 96 000 38 400 3 840 000 8 928 000 12 768 000 Region 1 135 000 908 000 363 200 36 320 000 84 444 000 120 764 000
Source: ESCWA.
3. Investment costs (a) Pomace costs Table 12 provides estimated production costs in Lebanon from the olive mill to the consumer for 2008. It should be noted that the large energy cost saving potential of olive residue (compared to traditional diesel fuel) may induce an increase in market cost of olive residues. Such “commercial” cost increase was not taken into consideration in the table. It is also important to note that, owing to its high moisture content, pomace produced through two-phase and three-phases system are sold 30 per cent to 40 per cent cheaper than pomace produced by the traditional press method. However, after drying, dry pomace can be sold at around $100 per ton in Lebanon.
TABLE 12. OLIVE RESIDUES PRODUCTION COST
Stages
Bulk delivery in large bags or tucks Briquettes (logs) delivery ($/ton)
Traditional olive press ($/ton)
Two- and Three-phase decanter ($/ton)
Olive mill disposing cost 10 10 10 Briquette production cost (labour, electricity, machinery) .. .. 50 Transportation to storage within
200 km 20 20 20Labour handling cost 20 20 40Dealer(s) margin 50 20 50 Total cost for consumers 100 70 170
Note: Two dots (..) indicate that data are not available. (b) Cost comparison of pomace derived energy with other traditional energy source The feasible energy generation solutions described lead to energy cost savings when using olive residues instead of other traditional energy sources. Table 13 presents some useful values required to calculate energy cost based on the following definitions: (i) Low heating value in kWh/kg is the energy that fuel will release during combustion. Such
values are measured in a laboratory and are considered as public scientific values; (ii) Market cost is the ongoing cost of fuel as sold to consumers in its standard unit (tons, kg, litres).
This market cost is made according to prices in Lebanon in December 2008; (iii) Primary energy cost is the cost of energy that will be released by fuel during combustion;

23
(iv) Equipment efficiency is the ratio of useful energy transferred to the water, steam or air to be used over the primary energy released by the fuel;
(v) Useful energy cost is the cost of energy that has been transferred to water, steam or air that is
actually used. In this chapter, only energy costs are compared; combustion equipment efficiency and corresponding equipment cost and payback period are outside the scope of this analysis. Rather, the cost of energy for the same type of equipment achieving the same service and level of comfort with approximately the same conversion efficiency level is compared. The findings indicate that energy saving values vary from $0.032 kWh to $0.145 kWh, as noted in table 13.
TABLE 13. ENERGY COST SAVINGS
Low heating value (kWh/
kg)
Market cost
($/1000 litres or
ton)
Primary energy
cost ($/kWh)
Useful energy cost ($/kWh)
Combustion boiler for hot
water or steam
Traditional fireplace
Convective stoves
Electricity through
reciprocating engine or
steam turbine
CHP coal plant
Burner efficiency 0.9 0.2 0.8 0.3 0.66Fuel type Diesel oil 11.00 550 0.059 0.065 0.196 Pomace 4.65 100 0.022 0.024 0.072 0.033 Pomace log 4.65 170 0.037 0.183 0.046 Wood log 2.67 175 0.066 0.328 0.082 Coal (average 2008) 4.65 200 0.043 0.065
Energy cost saving ($/KWh) 0.041 0.145 0.036 0.124 0.032 Source: ESCWA. It is very difficult to evaluate which technology will achieve higher market penetration. This evaluation depends on various parameters, including public policy, investment cost, raw material availability, technological capacities, consumer preferences and environmental impact. In order to evaluate the potential energy cost saving for each country in table 11, a conservative energy saving index of 0.05$/kWh has been used. This index was chosen based on the notion that the most “usable” technologies are the combustion boiler with an energy saving value of 0.041 $/kWh, and the traditional wood stove/fireplace with an energy saving value of 0.145 $/kWh. (c) Opportunities for SMEs in biochar production from pomace Biochar is a high-quality product that is highly desirable and can be made relatively easily. The initiation of modern retort kilns that can produce biochar rapidly, cleanly and efficiently can reduce the current stresses on the dwindling forest areas. It can also effectively reduce air pollution resulting from the current traditional methods for biochar making. These kilns can be small enough to handle the pomace generated from one olive press or can alternatively work with a group of presses in a given area.

24
Figure 8. Retort kiln for biochar production
Source: Four Seasons Fuel Ltd, which is available at: http://www.fourseasonsfuel.co.uk/charcoal-retorts.asp. A retort kiln is a commercially available technology that can be purchased with an initial investment of $35,000.40 Such a kiln can produce around 250 kg of biochar per day. The furnace should operate 8-10 hours per day followed by a cooling period overnight. The system can process around 12 tons of pomace per month from pomace by-products resulting from a three-phase press. The fuel consumed in the carbonization process is considered as part of the obtained pomace; accordingly, no external fuel costs exist. Assuming a maintenance cost of 5 per cent, a 10-year life time of the system and six months of operation per year, a rapid financial analysis of the process can calculated (see table 14).
TABLE 14. ANNUAL OPERATIONAL COSTS OF BIOCHAR PRODUCTION
Operation Cost Initial investment (annualized over 10 years) $3 500 Maintenance costs $1 750 Cost of pomace (72 tons) $7 200 Labour ($350 x 6) $2 100 Total $14 550 Biochar produced 6 000 kg Biochar cost (per kg) $2.43
Table 14 indicates the cost of biochar based on the assumptions made above. Several factors could improve the profit margin, including as follows: (a) Local manufacture of the retort kiln which is an existing possibility for many of the countries concerned should lower the initial investment cost; (b) Operational periods longer than six months could improve utilization rate and improve returns; (c) Proper maintenance of the system can ensure longer life times;
40 Four Seasons Fuel Ltd, which is available at: http://www.fourseasonsfuel.co.uk/charcoal-retorts.asp.

25
(d) Collective ownership of a kiln by cooperatives could lower the cost of pomace delivered; (e) The use of pomace from traditional presses can increase biochar yield, however, pomace from the two-phase process could reduce productivity and profitability; (f) In addition, local regulation and control over the traditional manufacture of biochar could raise the prices of biochar and improve the competitiveness of this technology. Recent advances in the low-cost manufacture of kilns have shown that they may be built from locally available material and with local labour for $750.41 The so-called “Adam retort” can produce 350 kg of biochar from 1,200 to 1,800 kg of pomace over a 24-hour period. A final major disadvantage regarding the production of biochar from pomace is that the product obtained will not have the texture desirable by consumers and may even be in the powder form. This inhibits the potential for its sale in the market. Consequently, briquetting the obtained biochar is highly advisable, even if it adds to the cost of production.42 A completely different approach may exist in the manufacture of activated charcoal powder, which has its own non-energy market. Within the context of biochar making, given that the water content of pomace has a direct effect on the amount of energy required to make biochar, it may be wise to consider solar drying options in the region as an energy saving alternative. Abundant solar resources can result in rapid water evaporation, which would reduce the time and energy needed to produce biochar. (d) Electricity market In order to get an idea of biomass potential for electricity generation, the biomass potential in Spain shows that only 3 per cent of that country’s electricity comes from biomass (not only pomace) despite the fact that this form of electricity receives a premium over the normal price. Biomass contribution to electricity in most industrialized countries does not exceed 1 per cent. A special market for the sale of electricity exists in Lebanon owing to frequent power outages. Subscription to local independent electricity producers from diesel power generators is common and the fees levied vary with the rise and fall of diesel prices. Subscription is usually based on a 5-ampere power supply for the outage periods, which can reach 10 hours per day. These generators supply up to 330 kWh per month per household. Fees vary in the range of $57-80 per month, based on the region, hours of needed supply and fuel prices. These prices mean that customers pay between $0.17-0.24/kWh. There could therefore be a market for electricity from biomass in Lebanon. However, it could require a large volume of pomace near the source of potential electricity demand. There is thus greater potential to develop this fuel source in rural areas. Currently, electricity prices in Jordan, Lebanon, Palestine and the Syrian Arab Republic are subsidized, which creates a significant barrier to investment in biomass plants for electricity production. While electricity costs are generally higher in Greece, Italy and Spain, all three of which are also significant olive producers, these countries are able to provide a premium for biomass-generated electricity to make it a viable alternative. However, ESCWA member countries, as is the case in most developing countries, do not have the financial resources available to subsidize biofuel investments.
41 “Low cost retort kiln called ‘adam-retort’ or ICPS (Improved Charcoal Production System” (2009), which is available at: http://www.biocoal.org/3.html.
42 “How products are made: Charcoal briquettes” (2009), which is available at: http://www.madehow.com/Volume-4/Charcoal-Briquette.html.

26
(e) Gasification plant cost The setup cost for a biomass gasification plant is €1 M/MW based on 45 per cent moisture content for biomass. For a power plant generating 10-22 MW of electricity from gasification, the cost ranges from €58-75/MWh. In addition, previous studies undertaken in Liguria in Italy concluded that a gasification plant was not economical (not enough biomass), despite the fact that the region produced 5,500 tons of olive oil per year. These results exclude the use of biomass gasification in the region based on the high cost of electricity and the need for large quantities of biomass.
D. RECOMMENDATIONS
In the countries under consideration and based on current energy market dynamics, it is clear that use of biomass in general and of pomace in particular for electricity generation is not an economic alternative for SMEs. This is mainly due to the subsidized electricity market in the region, lack of privatization in electricity generation, and the absence of a feed-in law for potential independent power producers (IPP). While premium prices given to renewable energy producers have motivated SMEs and even large companies to invest in this sector in Europe, the application of such incentives in cash-strapped countries seem to be farfetched. Accordingly, attention should be focused on the technologically much simpler use of biomass in order to provide heating needs. Heating uses the imbedded energy more efficiently and, as long as heating needs in any given country are not fully satisfied from cheap, domestic and renewable sources, the primary use for pomace and other biomass resources should be directed towards fulfilling these needs. Opportunities for SMEs exist on both the pomace production and consumption sides. The production of quality pomace derived products, such as briquettes, pellets and even well processed and dried pomace in bulk, presents an opportunity to increase revenue or decrease operating expenses for olive mills. The production of the briquettes and bulk dried pomace will most probably be restricted to the olive mills themselves due to the obvious returns and simple technology. On the other hand, a niche market may be created for pellet makers given that this technology requires a significant investment in materials and know-how. Biochar manufacture may also be worth considering. Introduction of solar dryers may speed up the drying process of pomace and increase overall system efficiency. On the consumption side, significant opportunities for SMEs exist in the development and marketing of forced convection stoves and energy efficient boilers although some changes in consumer mentality regarding the effectiveness of such systems will be required. Such stoves will increase overall heating efficiency regardless of the fuel used and should be encouraged on the national and regional scales. More specifically, in a country like Lebanon, where pomace quantities are limited and where natural forests are endangered by log harvesting, it could be wise to introduce second-generation biofuel alternatives by encouraging investments in forced convection stoves in conjunction with olive residues briquetting technologies. In ESCWA members like Jordan and Palestine, where quantities of pomace are limited, but where minimal forest cover exist, applications should focus on very high efficiency equipment, including boilers for public buildings, schools and factories. In the Syrian Arab Republic, where pomace is available in large quantities, all options are open, including co-firing. All of these opportunities will be greatly enhanced by a national or regional strategy regarding the implementation of more efficient stoves and stricter controls over the disposal of olive press waste. Air pollution controls over open, inefficient burning would also serve to promote the use of these environmental technologies.

27
III. BIOFUELS DERIVED FROM SUGAR INDUSTRY WASTE
A. OVERVIEW
There is a diversity of feedstock that can be used for biofuels production in the sugar sector. Sugar derived from sugarcane can be extracted to produce ethanol, which is a primary biofuel. Various by-products resulting from the harvesting and pressing of sugar can be directed towards secondary biofuel production. This chapter aims to identify best practices and methods to improve sustainable rural development and increase opportunities for SMEs through the production and use of secondary biofuels that are derived from agricultural wastes resulting from sugarcane and sugar beet cultivation. Egypt and the Sudan are major sugarcane producers in the ESCWA region. Sugar beet production is significant in Egypt, Lebanon and the Syrian Arab Republic. As such, both subsectors are included in the analysis. Specific considerations relevant to the potential of biofuels production associated with sugarcane processing in other Arab countries is also presented, given the potential for second-generation biofuel development from sugar production in Iraq, Morocco and Somalia.
There are many viable technological options of varying technological sophistication that are available for use in this sector. This reflects the importance of technological screening and evaluation as well as the need to focus on simple, reliable and affordable environmental technologies in the region. Furthermore, in conducting the analysis, it is important to note the following constraints and assumptions:
(a) Limitation of the available data on public and private sector initiatives to develop biofuels from target crops;
(b) Financial assessment and economic analysis of different technological options vary greatly among reports. Focus has thus been placed on the technological viability of these different options;
(c) Financial procedures are not constant between firms, thereby limiting the ability to present a coherent cost analysis of different technological options. While some cases reflect detailed and reliable financial analysis, others only present simplified estimates. This has influenced assumptions regarding the cost of feedstock and potential product prices.
Given that a variety of technological systems can be used to generate energy from waste generated by the sugar sector, cost data from systems using different feedstock can be used to support further analysis. For example, the energy content and pre-treatment requirements of bagasse and beet pulp as typical lingo-cellulosic materials could be considered as well as direct sugar rich juices or molasses.
B. ENVIRONMENTAL AND ECONOMIC CHALLENGES
1. Crop residues
(a) Sugarcane field residues
Cane tops residues are generally divided into two types, namely: green tops, representing 80-90 per cent of the waste; and trash, representing 10-20 per cent of residues. In Egypt, farmers use green tops as animal feed, thereby allowing them to sell this by-product at a price of $5-6/ton. The dry leaves and stems (trash) that are left over are spread over the cane roots to protect them during the winter season.43 It is also customary practice for a significant portion of the dried trash to be used in rural stoves or for household heating in rural communities, while the remainder is burnt in the field. While there is little economic cost to the farmer from the burning of these residues in the field, the impacts of open burning of sugarcane stalks and biomass is an important contributor to black smog and air pollution in Egypt.
43 K.H. el Ashmawy et al., “Socioeconomic and environmental aspects of women labor in the Egyptian agricultural sector: Case study of sugar crops”, American-Eurasian Journal of Agriculture and Environment Science, vol. 2, No. 3 (2007), pp. 255-260, which is available at: www.idosi.org/aejaes/jaes2(3)/8.pdf.

28
In Morocco, once the sugarcane has matured and is ready for harvesting it is traditional practice to lightly burn the crops. It is reported that this ensures cleaner cane for delivery to mills and facilitates manual cutting. However, the burning of sugar tops causes atmospheric pollution as well as adverse effects on subsequent seed growth.44 Despite the claimed positive economic implications of burning cane, adverse health effects have also been found, which increase the actual cost of this practice in local communities. For example, asthma rates and other health problems are reportedly higher during the burning season among agricultural workers and in neighbouring villages,45 as compared to other periods during the year. (b) Sugar beet residues Some farmers remove beet tops with the beet harvest and feed it to sheep or cattle, while other farmers leave beet tops in the field. These tops remaining in the field after harvest are either windrowed or dried and ploughed in the field. Tailings (crown and leaves) are also used for cattle and sheep feed. Thus, no significant environmental impacts are observed at the field level.46 The economic returns of using these tops as a field supplement is limited in areas where alternative feedstock is available.
2. Processing by-products (a) Bagasse Bagasse is the fibrous residue of crushed cane (about 50 per cent moisture) remaining after extraction of the juice. In general, the majority of bagasse (about 85-90 per cent) is used as a primary source of fuel to generate steam and energy required by the sugar factories.47 Burning causes smoke, gases and smog, with resulting adverse effects on people’s health as well as lowering the property value of the area. In Egypt, bagasse is also used for the production of the following: (a) Paper production: a bagasse paper mill has started in 2000 producing 144.000 ton/year of paper and newsprint, with bagasse representing 70-85 per cent of its raw material;48
(b) Cardboard: medium density fibre (MDF) and high density fibre (HDF) boards;49
(c) Building bricks: used by low-income families in rural Egypt by mixing bagasse with mud. According to information provided by the Egyptian Sugar and Integrated Industries Company (ESIIC) and Qena Newsprint Paper Factory, the current selling price of wet bagasse to the public and private sector is about $20-40/ton.50 This relatively high price is estimated based on the calorific value of bagasse as compared to fuel oil (mazot). 44 G-R. Travis, “An overview of sugar culture in Morocco, particularly within a Berber community in Rastabouda” (thesis, December 2007).
45 Ibid.
46 United States Department of Agriculture, “USDA national agriculture statistics services – quick stats”, which is available at: www.nass.usda.gov.
47 S.M. el-Haggar et al., “Environmentally balanced industrial complex for the cane sugar industry in Egypt”, which was presented at Proceedings International Hydrogen Energy Congress and Exhibition IHEC 2005 (Istanbul, Turkey, 13-15 July 2005) and is available at: www.unido-ichet.org/ihec2005/files/manuscripts/EL per cent20Haggar per cent20S.M-Egypt.pdf.
48 B. Haussier, “Quena: Successful start-up of the world’s most modern bagasse paper mill”, which is available at: www.voithpaper.com/media/vp_tw12_quena_en.pdf.
49 Nag Hamady for Wood production and Fabrication Company, which is available at: http://server.egypt.com/egypt/ egydirectory/detail/2620/nag-hamady-for-wood-production-and-fabrication-co.html.
50 Based on interviews with officials at Egyptian Sugar and Integrated Industries Company (ESIIC) and Qena Newsprint Paper Factory.

29
Owing to the negative impacts associated with the use of bagasse for generation of energy required for processing in sugar mills, there is an increasing trend towards partial replacement of bagasse by fuel oil. Moreover, there are plans to replace bagasse burning with natural gas. In addition to the large sugar production plants, bagasse is also burnt to supply fuel to the black honey industry in Egypt where 350 to 400 facilities are scattered both in Minya and Quena. This burning results in observed emissions as highlighted above.51 It is estimated that about 840,000 ton of waste bagasse is available in the Sudan, categorized as follows:52 (a) older bagasse, which has been left to rot over a two- to three-year period and which can be used for the manufacture of compressed briquettes; and (b) bagasse that is carbonized before briquetting or left to rot.53 Out of a total of five sugar mills in the Sudan, only the Kenana Sugar Factory uses almost all its bagasse, while others are using by-products for cogeneration on a limited basis. Production of charcoal from bagasse was established as a secondary product line at the Kenana Sugar Factory in 1998. The factory currently produces 6,500 ton/year of charcoal from bagasse and molasses, which reportedly has reduced the production of charcoal from local trees and, thereby, reducing deforestation.54 There are enormous dumps of bagasse in Eastern the Sudan, some of which have been reported to ignite spontaneously.55 Successful examples of generating second-generation biofuels from bagasse in the Sudan also exist at the small scale. For instance, small carbonization plants have been established where baled bagasse is carbonized, grinded and agglomerated into charcoal briquettes.56 The briquetting of bagasse/molasses fuel blocks is pursued by SMEs given that it is a low-capital, labour-intensive technology that uses molasses as a binder agent. Baggasse is also used to produce building bricks in the Sudan.57 In Morocco, bagasse left over after supplying sufficient energy to sugar mills is stockpiled in open fields, causing problems to the surroundings due to the smoke generated by the breakdown of the biomass. Moreover, the spontaneous or induced incineration of biomass stockpiles results in pollution and black smoke.58 Currently, the Sucrerie Raffinerie de Cannes du Gharb (SURAC) is set to launch a project aimed at reducing the need for approximately 11,000 tons of coal/year by using bagasse from three different refining facilities owned by SURAC to be transported to SUNABEL (Groupe des sucreries de betterave Gharb et Loukkos) where the project will be constructed (see figure 9). Some 28,000 tons of bagasse/year is expected to be transported from the sugarcane factory located 1 km away from the project; about 16,000 tons of bagasse/year will be transported from Kisibia, which is located 30 km away from the project; and about 6,000 tons of bagasse/year will be transported from Laaourna, which is located 100 km from the project. The
51 See Algomhuria, which is available at: www.gom.com.eg/algomhuria/2005/06/06/stock/detail04.shtml.
52 S.A. Alam, “Use of biomass fuels in the brick-making industries of Sudan: Implications for deforestation and greenhouse emission” (Department of Forest Ecology, University of Helsinki, Finland, 2006), which is available at: https://oa.doria.fi/ handle/10024/3159.
53 W. O. Ahmed, “Briquettes in Sudan”, No. 39 (1997), which is available at: http://www.hedon.info/BriquettesInSudan.
54 See “Miracle of sugar in the desert”, which is available at: www.worldreport-ind.com/sudan/sugar.htm.
55 Basin, “Utilization of Bagasse in brickmaking: R & D in Sudan”; Wall Building Technical Brief (Advisory Service and Information Network, 1999).
56 R.V. Siemons, “Carbonization of fresh bagasse” (December 1993), which is available at: www.cleanfuels.nl/ Projects%20&%20publications/Bagasse%20Carbo&agglomeration.pdf.
57 A.M. Omer, “Biomass energy potential and future prospect in Sudan”, Renewable and Sustainable Energy Reviews, vol. 9 (2005), pp. 1-27.
58 United Nations Framework Convention on Climate Change (UNFCCC), “Clean Development Mechanism Project Design” (3 December 2006).

30
controlled combustion of biomass in the plant boiler will supply 100,000 tons of steam during the sugar beet production season (about 100 days) to the SUNABEL beet processing company.
Figure 9. Bagasse collection and processing by SURAC in Morocco
(b) Filter cake Filter cake (cachaza) is currently used as an organic fertilizer. It is also mixed with bagasse and used as fuel for brick manufacturing. The remaining cachaza is disposed of in landfills or in open dumps. In Egypt, research trials were made to come up with appropriate briquetting technology whereby cachaza and bagasse are mixed and compressed under pressure. It has been proposed that one of the sugar mills could adopt briquetting technology in an attached unit. It has also been proposed that ashes resulting from briquettes combustion could be transported to an organic fertilizer plant to be mixed with the excess cachaza.59 (c) Sugar beet pulp Beet pulp is the fibre residue left after most of the sugar has been extracted from the sliced beets. It has a moisture content of about 75-80 per cent.60 The produced pulp can be mixed with other food extracts and ensiled to be used within two years.61 However, when the packages are opened it should be consumed within few days.
59 S.M. el-Haggar et al., “Environmentally balanced industrial complex for the cane sugar industry in Egypt”, which was presented at Proceedings International Hydrogen Energy Congress and Exhibition IHEC 2005 (Istanbul, Turkey, 13-15 July 2005) and is available at: www.unido-ichet.org/ihec2005/files/manuscripts/EL%20Haggar%20S.M-Egypt.pdf.
60 Southern Minnesota Sugar Cooperative, “Facts about sugar beets and beet sugar”, which is available at: http://www.sbreb.org/brochures/SugarCoop/.
61 M. Hadjipanayiotou et al., “Feeding ensiled poultry excreta to ruminant animals in Syria”, Livestock Research for Rural Development, vol. 5, No. 1 (June 1993), which is available at: www.fao.org/ag/agap/frg /Irrd/Irrd5/1/syria1.htm.

31
The pulp can also be dried and shipped in many forms, including plain dried, molasses dried (containing about 25 per cent molasses) and pelletized. In Egypt, beet pulp is dried, pelletized and exported at $135-150/ton.
TABLE 15. EGYPTIAN BEET PULP SPECIFICATIONS
Item Value Pellet diameter 8-10 mm Moisture content 10-12 per cent Sugar 7 per cent max Protein 9-11 per cent Ash 3.7 per cent Molasses free
Source: Compiled by ESCWA, based on a communication with A. Abduo, Executive Manager, Almanar Co. for Import and Export and Trading Agency. The beet pulp is also an excellent feed for dairy farmers as a stimulant to milk flow. It is used for cows, cattle and sheep feed, horse feed and, to a lesser extent, as pet food.
C. SUGAR CROP PRODUCTION This section manifests quantitative and qualitative aspects pertinent to sugar crops, sugar production and related industrial residues.
1. Sugar production Figure 10 depicts the cumulative growth of quantities of sugarcane and sugar beet in selected Arab countries, including Egypt, Iraq, Lebanon, Morocco, Somalia, the Sudan and the Syrian Arab Republic.62 While Egypt produces about 16.2 million tons of sugarcane per year,63 only some 10.3 million tons is directed to the sugar mills.64 The remainder is directed to small juice extraction shops across the country and to 400 small facilities that manufacture black honey.65 The Sudan consumes almost all its crop production in national sugar processing facilities.66 Egypt is the largest producer of sugarcane among Arab countries, at 16.2 tons in 2007, followed by the Sudan, at 7.5 million tons annually (see table 16). The total production of Morocco and Somalia approaches 1.1 million tons annually. Egypt is also the largest producer of sugar beets in the Arab region, with an output of about 5.6 million tons/year. The production of sugar beets in Morocco and the Syrian Arab Republic approaches 3.0 and 1.15 million tons, respectively. The current situation in Lebanon, Iraq and Somalia reflects almost a complete halt of sugar production owing to wars or conflicts that have damaged sugar production facilities.
62 Food and Agriculture Organization (FAO) statistics, which is available at: www.faostat.org.
63 Ibid.
64 H.K. Hassan, “Arab region prospects of sugar crops as sources of food and energy”, which was presented at the International Conference on World Prospects of Sugar Crops as Sources of Food and Energy Suppliers (Luxor, Egypt, 1-4 March 2009).
65 See Algomhuria, which is available at: www.gom.com.eg/algomhuria/2005/06/06/stock/detail04.shtml.
66 See “Miracle of sugar in the desert”, which is available at: www.worldreport-ind.com/sudan/sugar.htm.

32
Figure 10. Sugar crop production trends in selected Arab countries, 1998-2007 (tons)
Source: Food and Agriculture Organization (FAO) statistics, which is available at: www.faostat.org.
TABLE 16. SUGAR CROP PRODUCTION LEVELS IN SELECTED ARAB COUNTRIES, 2007
Country Sugar crop Production (tons) Egypt Sugarcane 16 200 000
Sugar beet 5 600 000 Total sugar crops 21 800 000
The Sudan Sugarcane 7 500 000 Morocco Sugarcane 900 000
Sugar beet 3 000 000 Total sugar crops 3 900 000
Syrian Arab Republic Sugar beet 1 150 000 Lebanon Sugar beet 37 000 Iraq Sugarcane 55 000 Somalia Sugarcane 215 000
Source: Food and Agriculture Organization (FAO) statistics, which is available at: www.faostat.org. Table 17 provides details on various sugar production facilities in the region. Egypt imports some 30 per cent of its sugar needs, partially as brown sugar that is refined locally into white sugar.67 The Sudan is self-sufficient in sugar and exports sugar products.68 While sugar beets are the only local source of raw material for public sector sugar mills in the Syrian Arab Republic, the cost of production is much higher than the cost of importing raw sugar into the country.69 Despite this, the Government continues to plant 34,000 hectares of sugar beets to produce 80,000-110,000 tons of refined sugar, which represents only 10 per cent of local demand.70 Local production of refined sugar from imported brown sugar started in January 2008 at the National Sugar Company in Jandar with an annual capacity of 1 million tons.71
67 H.K. Hassan, “Arab region prospects of sugar crops as sources of food and energy”, which was presented at the International Conference on World Prospects of Sugar Crops as Sources of Food and Energy Suppliers (Luxor, Egypt, 1-4 March 2009).
68 Summit Communications, “Sweet taste of success” (2009), which is available at: www.summitreports.com/ sudan/sugar.htm.
69 M. Westlake, “Economics of main sub-sectors in Syrian agriculture” (2003), which is available at: http://www.fao.org/ docrep/006/Y4890E/y4890e0e.htm.
70 USDA Foreign Agricultural Service, “Syria: Trade Policy Monitoring – Annual 2009” (November 2009), which is available at: http://www.fas.usda.gov/gainfiles/200903/146337511.pdf.
71 Zawya, “Syria industry: National sugar company’s Jandar plant set to start production sugar” (2007), which is available at: http://www.zawya.com/countries/sy/macrowatch.cfm?eiusection=NATIONAL%20SUGAR%20COMPANY'S%20JANDAR%20PLANT%20SET%20TO%20START%20PRODUCTION.
Sugarcane total Sugar beet total

33
TABLE 17. SUGAR FACTORIES IN SELECTED ARAB COUNTRIES
Country Crop Location Crop consumption Refined sugar
(1000 tons/yr) Egypt Sugarcane
Komombo, Aswan 1,800 180 Edfu, Aswan 1 150 115 Naga Hamadi, Qena 1 750 175 Armant, Qena 1 250 125 Kous, Qena 1 650 165Deshna, Qena 1 000 100Gerga, Sohag 900 90 Abu Quqras, Menya 800 60
Total 10 300 1 030 Sugar beet
Delta Sugar Company 323.4 Dakhalia Sugar Company 150+(120 refining
black sugar) Egyptian Sugar Integrated Company 138.8 El Fayoum 120
Total 732.2+120 The Sudan Sugarcane
Asalaya, White Nile 6 500 100 New Halfa 6 500 100 Guneid, Khartoum 4 500 60 SENNAR, Wadi Halfa 6 500 100 Kenana, Khartoum 17 000 400
Total 41 000 760 Syrian Arab Republic
Sugar beet
Homs Sugar Factory 60 9 Deir El Zor Sugar Company 120 18 El Gharb Sugar Company 60 9 Tal Salhab Sugar Company 120 18 Maskanech 120 18 Raqqa 120 18
Total 600 80-110 National Sugar Company (Jandar) Imported brown
sugar 1 000
Morocco Sugarcane
Surac Laaournra 322 45 Mechraa Belkisiri 230 32.5 Kisibia 322 45
Sugar beet
Sunabel Ksar El Kebir 320 45 Sidi Allal Tazi 320 45 Cosumar Sidi Bennour 800 112.5 Zemamra 480 67.5 Sucrafor (2 factories+1 refinery) 10.44 116 Suta Tadla (3 factories) .. ..
Total 2 804.44 508.5
Sources: S.M. el-Haggar et al., “Environmentally balanced industrial complex for the cane sugar industry in Egypt”, which was presented at Proceedings International Hydrogen Energy Congress and Exhibition IHEC 2005 (Istanbul, Turkey, 13-15 July 2005); Zawya, “Syria industry: National sugar company’s Jandar plant set to start production sugar” (2007); Delta Sugar Company, which is available at: www.deltasugar.com; Sugar Engineers, “Sugar factories of North and West Africa”; “Optimization of COSUMAR’s beet sugar factories”, BMA info 2004; “The sugar worker” (July-August 2005); and General Organization for Sugar, which is available at: www.gofs.org/. Note: Two dots (..) indicate that data are not available.

34
2. Waste production The by-products and wastes from sugar crops are generated in the fields and at the sugar processing facilities. Typical production of these products, by-products and wastes generated from both sugarcane and sugar beet are presented in figures 11 and 12, respectively.72 The main residues of sugar crops analysed within the scope of this study include the following: (a) sugarcane bagasse and cane tops, filter mud and field residues; and (b) sugar beet pulp and beet tops. Principally, molasses are valuable by-products that are easily marketed within the region or in the international market. Figure 13 presents the quantities of bagasse and other wastes or by-products derived from sugarcane generated in the targeted Arab countries over the period 1998-2007.73 Figure 14 presents the quantities of beet pulp and other by-products generated from beet sugar harvesting and manufacturing plants during the same period. Additional information of quantities of waste generated by this sector in 2007 is presented in figure 18.
Figure 11. Typical distribution of sugarcane products, by-products and wastes
Evaporated water37.4%
Bagasse (50% moisture)
25.7%
Cane tops (28% DM)
22.5% Sugar 9.0%
Filter mud (80% moisture)
2.7%
Molasses (79.5 brix) 2.7%
72 See A. Alam, “Growing sugar crops for food, feed and fuel”, which was presented at International Conference on World Prospects of Sugar Crops as Sources of Food and Energy Suppliers (Luxor, Egypt, 1-4 March 2009); United States Department of Agriculture, “USDA national agriculture statistics services – quick stats”, which is available at: www.nass.usda.gov; and A. Rouilly, J. Jorda and L. Rigal, “Thermo-mechanical processing of sugar beet pulp. I. Twin screw extrusion process”, Carbohydrate Polymers, vol. 66 (2006), pp. 81-87.
73 See United Nations data, which is available at: www.data.un.org; and NationMaster, which is available at: www.nationmaster.com.

35
Figure 12. Typical distribution of sugar beet products, by-products and wastes
Evaporated water37.0%
Beet pulp (80% moisture)
28.5%
Crown and leaves (90-95% moisture)
15.0%
Sugar 14.0%
Molasses 5.5%
Figure 13. Trends related to sugarcane products and wastes in selected Arab countries, 1998-2007
0
2000
4000
6000
8000
10000
12000
14000
16000
18000
Egypt
Sugar
cane
Egypt
Bagas
se
Egypt
Cane t
ops
Egypt
Filter
mud
Sudan
Sug
ar ca
ne
Sudan
Bag
asse
Sudan
Can
e top
s
Sudan
Filte
r mud
Moroc
co S
ugar
cane
Moroc
co B
agas
se
Moroc
co C
ane t
ops
Moroc
co F
ilter m
ud
Somali
a Sug
ar ca
ne
Somali
a Bag
asse
Somali
a Can
e top
s
Somali
a Filte
r mud
Thou
sand
s
1998199920002001200220032004200520062007
Source: Compiled by ESCWA, based on United Nations data, which is available at: www.data.un.org; and NationMaster, which is available at: www.nationmaster.com.

36
Figure 14. Products and wastes from sugar beet, 1998-2007
0
1000
2000
3000
4000
5000
6000
Egypt S
ugar
beet
Egypt
Sugar
beet
pulp
Egypt
Crown &
leav
es
Morocc
o Sug
ar be
et
Moro
cco S
ugar
beet
pulp
Morocc
o Crow
n & le
aves
Syria S
ugar
beet
Syria S
ugar
beet p
ulp
Syria C
rown &
leav
es
Leba
non S
ugar
beet
Leba
non S
ugar
beet
pulp
Leba
non C
rown &
leav
es
Thou
sand
s
1998199920002001200220032004200520062007
Sources: United States Department of Agriculture, “USDA national agriculture statistics services – quick stats”, which is available at: www.nass.usda.gov; and A. Rouilly, J. Jorda and L. Rigal, “Thermo-mechanical processing of sugar beet pulp. I. Twin screw extrusion process”, Carbohydrate Polymers, vol. 66 (2006), pp. 81-87. The by-products obtained from sugarcane and sugar beet residues are usually rich in moisture, as indicated in table 19. Moisture content influences the time and technologies needed to convert these residues into biofuels.
TABLE 18. WASTE GENERATION FROM SUGAR PROCESSING IN SELECTED ARAB COUNTRIES, 2007
Countries Sugarcane waste (tons) Sugar beet waste (tons)
Bagasse Cane tops Filter mud Sugar beet pulp Crown and leaves Egypt 3 879 000 3 645 000 440 640 1 596 000 840 000 The Sudan 2 501 000 1 687 500 204 000 .. .. Morocco 314 080 202 500 24 480 855 000 450 000 Somalia 50 160 48 375 5 848 .. .. Syrian Arab Republic .. .. .. 327 750 172 500
Note: Two dots (..) indicate that data are not available.
TABLE 19. MOISTURE CONTENT IN EACH SUGAR CROP BY-PRODUCT
By-product Moisture content (percentage) Bagasse 50 Cane tops 72 Filter mud 80 Sugar beet pulp 80 Crown and leaves 90-95

37
D. ENERGY FROM WASTES
1. Identified technology schemes Several technologies have been identified for biofuels production from ligno-cellulosic materials in general and bagasse or residues of sugar beet in particular.74 These technologies can be categorized as follows: (a) Commercial technologies that have been successfully adopted with varying capacities in developed and developing countries. These include the following: (i) Briquetting or pelletizing to produce refuse derived fuels (RDF), which could further be
used for combustion or gasification. Briquetting is an old technology that enables compaction and, consequently, economic and easy transfer to the end user. Clients demand briquettes for utilization as a fuel for domestic boilers, feedstock for combustion systems and/or minor domestic or small industrial systems;75
(ii) Gasification to produce thermal energy or cogeneration to produce steam or electricity,
respectively. Gasification is a common practice used in several sugar factories, although bagasse is usually used in a fluffy form, which causes adverse environmental impacts;76
(iii) Anaerobic digestion to produce biogas for direct use in rural stoves or furnaces or
converted to automotive power;77 (b) Technologies in demonstration or research and development stages. These include the following: 74 See, for example, the following: (a) A.M. Omer, “Organic waste treatment for power production and energy supply”, Journal of Cell and Animal Biology, vol. 1, No. 2 (October 2007), pp. 034-047; (b) Department of Economic and Social Affairs (DESA), “Small-scale production and use of liquid biofuels in sub-Saharan Africa: Perspectives for sustainable development” (2007), which is available at: www.un.org/esa/sustdev/csd/csd15/documents/csd15_bp2.pdf; (c) Wetlands International, “Biofuels in Africa: An assessment of risks and benefits for African wetlands” (May 2008), which is available at: http://www.aidenvironment.org/ Upload/Files/xhtvkw/Biofuels%20in%20Africa_study%20WI.pdf; (d) European Commission, Directorate-General for Research, Information and Communication Unit, “Energy scientific and technological indicators and references” (2005), which is available at: http://europa.eu.int/comm/research/rtdinfo/index_en.html; and (e) The Royal Society, “Sustainable biofuels: prospects and challenges” (14 January 2008), which is available at: http://royalsociety.org/displaypagedoc.asp?id=28914.
75 Free Patents Online, “Method and device for pelletizing unprocessed sugar-cane bagasse” (4 April 2007), which is available at: www.freepatentsonline.com/EP1770152.html.
76 See, for example, the following: (a) S.M. el-Haggar et al., “Environmentally balanced industrial complex for the cane sugar industry in Egypt”, which was presented at Proceedings International Hydrogen Energy Congress and Exhibition IHEC 2005 (Istanbul, Turkey, 13-15 July 2005) and is available at: www.unido-ichet.org/ihec2005/files/manuscripts/EL%20Haggar%20S.M-Egypt.pdf.; (b) Department of Economic and Social Affairs (DESA), “Small-scale production and use of liquid biofuels in sub-Saharan Africa: Perspectives for sustainable development” (2007), which is available at: www.un.org/esa/sustdev/ csd/csd15/documents/csd15_bp2.pdf; (c) Wetlands International, “Biofuels in Africa: An assessment of risks and benefits for African wetlands” (May 2008), which is available at: http://www.aidenvironment.org/Upload/Files/xhtvkw/Biofuels%20in%20 Africa_study%20WI.pdf; (d) European Commission, Directorate-General for Research, Information and Communication Unit, “Energy scientific and technological indicators and references” (2005), which is available at: http://europa.eu.int/ comm/research/rtdinfo/index_en.html; (e) The Royal Society, “Sustainable biofuels: prospects and challenges” (14 January 2008), which is available at: http://royalsociety.org/displaypagedoc.asp?id=28914; (f) Free Patents Online, “Method and device for pelletizing unprocessed sugar-cane bagasse” (4 April 2007), which is available at: www.freepatentsonline.com/EP1770152.html; (g) V. Seebaluck, “Sugarcane bagasse cogeneration as a renewable energy resource for Southern Africa”, which was presented at the Third International Green Energy Conference (Västerås, Sweden, 17-21 June 2007) and is available at: http://www.carensa.net/ PDF/Sugarcane%20Bagasse%20Cogeneration%20as%20a%20Renewable%20Energy%20Resource%20for%20Southern%20Africa_17Jun07.pdf; (h) International Society of Sugar Cane Technologists, “Design, build-up and evaluation of a sugarcane biomass (bagasse and trash) gasification pilot plant with 3 MWE of power” (June 2007), project proposal for the International Sugarcane Biomass Utilization Consortium (ISBUC), which is available at: http://issct.intnet.mu/ISBUCresprop1.HTM; and (i) P.W. Alonso, P. Garzone and G. Cornacchia, “Agro-industry sugarcane residues disposal: The trends of their conversion into energy carriers in Cuba”, Waste Management, vol. 27, No. 7 (2007), pp. 869-885.
77 G.L. Shukla and K.A. Prabhu, “Bio-gas production from sugarcane biomass and agro-industrial waste”, which is available at: http://www.cababstractsplus.org/abstracts/Abstract.aspx?AcNo=19960302970.
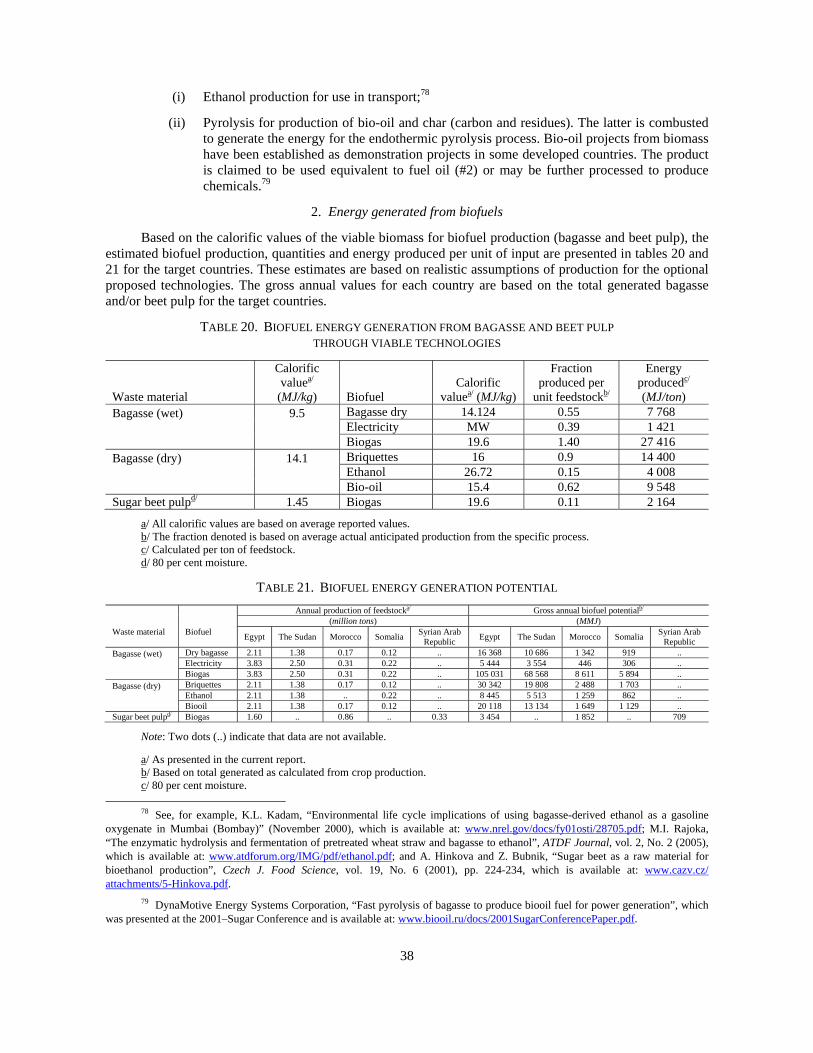
38
(i) Ethanol production for use in transport;78 (ii) Pyrolysis for production of bio-oil and char (carbon and residues). The latter is combusted
to generate the energy for the endothermic pyrolysis process. Bio-oil projects from biomass have been established as demonstration projects in some developed countries. The product is claimed to be used equivalent to fuel oil (#2) or may be further processed to produce chemicals.79
2. Energy generated from biofuels
Based on the calorific values of the viable biomass for biofuel production (bagasse and beet pulp), the estimated biofuel production, quantities and energy produced per unit of input are presented in tables 20 and 21 for the target countries. These estimates are based on realistic assumptions of production for the optional proposed technologies. The gross annual values for each country are based on the total generated bagasse and/or beet pulp for the target countries.
TABLE 20. BIOFUEL ENERGY GENERATION FROM BAGASSE AND BEET PULP THROUGH VIABLE TECHNOLOGIES
Waste material
Calorific valuea/
(MJ/kg) Biofuel Calorific
valuea/ (MJ/kg)
Fraction produced per
unit feedstockb/
Energy producedc/ (MJ/ton)
Bagasse (wet)
9.5
Bagasse dry 14.124 0.55 7 768 Electricity MW 0.39 1 421 Biogas 19.6 1.40 27 416
Bagasse (dry)
14.1
Briquettes 16 0.9 14 400 Ethanol 26.72 0.15 4 008 Bio-oil 15.4 0.62 9 548
Sugar beet pulpd/ 1.45 Biogas 19.6 0.11 2 164
a/ All calorific values are based on average reported values. b/ The fraction denoted is based on average actual anticipated production from the specific process. c/ Calculated per ton of feedstock. d/ 80 per cent moisture.
TABLE 21. BIOFUEL ENERGY GENERATION POTENTIAL
Waste material
Biofuel
Annual production of feedstocka/ Gross annual biofuel potentialb/ (million tons) (MMJ)
Egypt The Sudan Morocco Somalia Syrian Arab Republic Egypt The Sudan Morocco Somalia Syrian Arab
Republic Bagasse (wet)
Dry bagasse 2.11 1.38 0.17 0.12 .. 16 368 10 686 1 342 919 .. Electricity 3.83 2.50 0.31 0.22 .. 5 444 3 554 446 306 .. Biogas 3.83 2.50 0.31 0.22 .. 105 031 68 568 8 611 5 894 ..
Bagasse (dry)
Briquettes 2.11 1.38 0.17 0.12 .. 30 342 19 808 2 488 1 703 .. Ethanol 2.11 1.38 .. 0.22 .. 8 445 5 513 1 259 862 .. Biooil 2.11 1.38 0.17 0.12 .. 20 118 13 134 1 649 1 129 ..
Sugar beet pulpd/ Biogas 1.60 .. 0.86 .. 0.33 3 454 .. 1 852 .. 709
Note: Two dots (..) indicate that data are not available. a/ As presented in the current report. b/ Based on total generated as calculated from crop production. c/ 80 per cent moisture. 78 See, for example, K.L. Kadam, “Environmental life cycle implications of using bagasse-derived ethanol as a gasoline oxygenate in Mumbai (Bombay)” (November 2000), which is available at: www.nrel.gov/docs/fy01osti/28705.pdf; M.I. Rajoka, “The enzymatic hydrolysis and fermentation of pretreated wheat straw and bagasse to ethanol”, ATDF Journal, vol. 2, No. 2 (2005), which is available at: www.atdforum.org/IMG/pdf/ethanol.pdf; and A. Hinkova and Z. Bubnik, “Sugar beet as a raw material for bioethanol production”, Czech J. Food Science, vol. 19, No. 6 (2001), pp. 224-234, which is available at: www.cazv.cz/ attachments/5-Hinkova.pdf.
79 DynaMotive Energy Systems Corporation, “Fast pyrolysis of bagasse to produce biooil fuel for power generation”, which was presented at the 2001–Sugar Conference and is available at: www.biooil.ru/docs/2001SugarConferencePaper.pdf.

39
E. INVESTMENT AND OPERATING COSTS Three cases are offered below to illustrate the estimated investment and operating costs of the different technologies that are being used to produce biofuels in the sugar industry. These examples are proposed according to the following criteria: (a) Maximum reliance on technologies with higher efficiency of conversion to biofuels;
(b) Use of the feedstock as currently and prospectively available until 2020;
(c) Providing energy sources to rural or remote communities and small industrial facilities;
(d) The feedstock addressed in this chapter should be complemented by other agricultural residues in order to maintain substitutability for economic production. The investment and operating costs have been developed for the proposed viable biofuels options based on the outlined technology description. The basis of estimates comprise the following assumptions: (a) Reliance on reported order of magnitude cost data;
(b) Updating reported cost data using appropriate cost indices;
(c) Local manufacture of components that could reduce equipment costs;
(d) Cost factors as typically adopted for biofuels industry;
(e) Prevailing costs of utilities and labour in Egypt;
(f) Depreciation method is a straight line for an average life time of 15 years and negligible scrap value;
(g) Average price for biomass assumed to be $6 and $10/ton respectively. This price is based on the assumption that other biomass at a cheap price is to be utilized. Tables 22 to 29 illustrate the capital, operation and maintenance (O&M) costs, depreciation, total production costs and cost per unit of product, while table 30 summarizes these values and compares them between the various options. For all proposed options, it is presumed that low- to medium-level technologies would be adopted based on purchased equipment (PE). However, engineers and chemists for biochemical processes should be available. Moreover, technicians and labour of average standards could be trained to undertake assigned tasks.
TABLE 22. BRIQUETTING OF BIOMASS: TYPICAL CAPITAL COSTS
Item Cost (millions of $) Purchased equipment 0.40 Installation 0.12 Piping 0.06 Civil 0.04 Electrical and control 0.08 Other 0.04 Engineering and contracting 0.86 Contingencies 0.65 Total 2.25
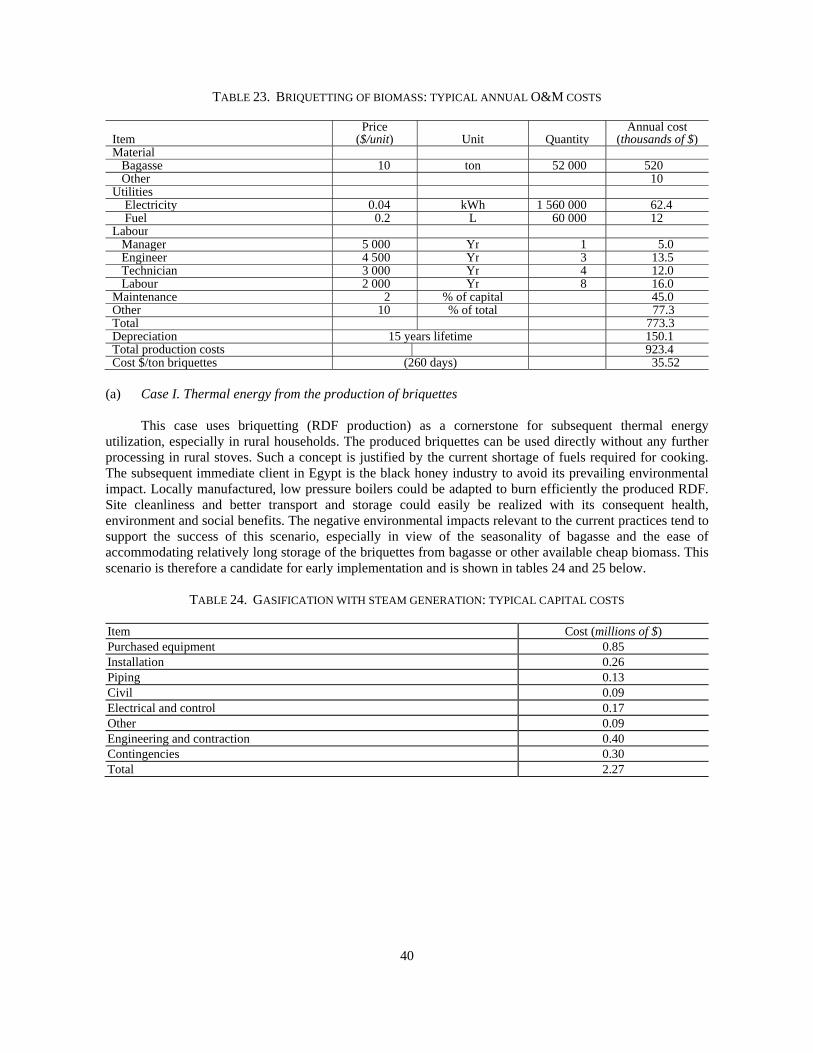
40
TABLE 23. BRIQUETTING OF BIOMASS: TYPICAL ANNUAL O&M COSTS
Item Price
($/unit) Unit Quantity Annual cost
(thousands of $)Material Bagasse 10 ton 52 000 520 Other 10Utilities Electricity 0.04 kWh 1 560 000 62.4 Fuel 0.2 L 60 000 12Labour Manager 5 000 Yr 1 5.0 Engineer 4 500 Yr 3 13.5 Technician 3 000 Yr 4 12.0 Labour 2 000 Yr 8 16.0Maintenance 2 % of capital 45.0Other 10 % of total 77.3Total 773.3Depreciation 15 years lifetime 150.1Total production costs 923.4Cost $/ton briquettes (260 days) 35.52
(a) Case I. Thermal energy from the production of briquettes This case uses briquetting (RDF production) as a cornerstone for subsequent thermal energy utilization, especially in rural households. The produced briquettes can be used directly without any further processing in rural stoves. Such a concept is justified by the current shortage of fuels required for cooking. The subsequent immediate client in Egypt is the black honey industry to avoid its prevailing environmental impact. Locally manufactured, low pressure boilers could be adapted to burn efficiently the produced RDF. Site cleanliness and better transport and storage could easily be realized with its consequent health, environment and social benefits. The negative environmental impacts relevant to the current practices tend to support the success of this scenario, especially in view of the seasonality of bagasse and the ease of accommodating relatively long storage of the briquettes from bagasse or other available cheap biomass. This scenario is therefore a candidate for early implementation and is shown in tables 24 and 25 below.
TABLE 24. GASIFICATION WITH STEAM GENERATION: TYPICAL CAPITAL COSTS
Item Cost (millions of $) Purchased equipment 0.85 Installation 0.26 Piping 0.13 Civil 0.09 Electrical and control 0.17 Other 0.09 Engineering and contraction 0.40 Contingencies 0.30 Total 2.27

41
TABLE 25. GASIFICATION WITH STEAM GENERATION: TYPICAL ANNUAL O&M COSTS
Item Price ($/unit) Unit Quantity Annual cost
(thousands of $)Material (Bagasse) 10 ton 52 000 520Utilities Electricity 0.04 kWh 120 000 4.8 Fuel 0.2 L 50 000 10 Water 0.2 M3 52 000 10.4Labour Manager 5 000 Yr 1 5.0 Engineer 4 500 Yr 3 13.5 Technician 3 000 Yr 3 9.0 Labour 2 000 Yr 6 12.0Maintenance 2 % of capital 45.5Other 10 % of total 70.0Total 700.2Depreciation 15 years lifetime 151.5Total production costs 851.7Cost $/ton steam (260 days) 13.65 (b) Case II. Gasification with cogeneration This scenario involves introducing co-generation of electricity and steam through a modern gasifier and combined gas/steam turbine. The balance of thermal to electricity output is governed by careful demand assessment of nearby community. The feedstock comprises dry bagasse or briquettes. Other biomass feedstock could be used to improve plant availability. This scenario has already been applied in Egypt and the Sudan. In the Sudan, feasibility studies indicate the possibility of doubling existing capacities by improving boiler efficiency and pressure. In Egypt, current industrial trends tend to replace bagasse by natural gas, which opens avenues for establishing off-site cogeneration plants run by the private sector. This also exposes competition between gas and biomass applications for energy. This scenario should also consider other cheap biomass feedstock in the community. The sustainability of this scenario is dependent upon international petroleum and natural gas prices.
TABLE 26. GASIFICATION WITH ELECTRICITY GENERATION (3MW): TYPICAL CAPITAL COSTS
Item Cost (millions of $)Purchased equipment 4.25 Installation 1.28 Piping 0.64 Civil 0.43 Electrical and control 0.85 Other 0.43 Engineering and contraction 1.92 Contingencies 1.44 Total 11.22

42
TABLE 27. GASIFICATION WITH ELECTRCITY GENERATION (3MW): TYPICAL ANNUAL O&M COSTS
Item Price
($/unit) Unit Quantity Annual cost
(thousands of $)Material (Bagasse) 10 ton 47 424 474.2Utilities Electricity 0.04 kWh Fuel 0.2 L 60 000 12 Water 0.2 M3 32 000 6.4Labour Manager 5 000 Yr 1 5.0 Engineer 4 500 Yr 4 18.0 Technician 3 000 Yr 8 24.0 Labour 2 000 Yr 12 24.0Maintenance 2 % of capital 224.5Other 10 % of total 87.6Total 875.7Depreciation 15 years lifetime 748.2Total production costs 1 623.8Cost $/kWh (260 days) 0.09 (c) Case III. Ethanol production This scenario proceeds to the production of ethanol from bagasse and beet pulp for blending with gasoline to reduce gasoline imports, provide an environmental substitute for methyl-tertiary-butyl-ether (MTBE) and supply the small-scale chemical industry. This scenario is further justified by the established national and international experience on the wide use of ethanol from sugar or corn. While the conversion of ligno cellulosic materials to bioethanol is currently in the demonstration phase, it is expected to be commercial within the next few years. Several of the plant equipment could be manufactured locally. The two controlling cost items, namely, enzymes and alcohol concentration, are expected to be reduced taking into consideration the current programmes achieved in the area of enzyme immobilization and membrane separation, respectively. Ethanol production plants could be powered from appropriate size cogeneration plant. This scenario will help overcome the energy storage issues.
TABLE 28. ETHANOL PRODUCTION FROM BIOMASS: TYPICAL CAPITAL COST
Item Cost (millions of $) Purchased equipment 2.10 Installation 0.63 Piping 0.32 Civil 0.21 Electrical and control 0.42 Other 0.21 Engineering and contraction 0.86 Contingencies 0.65 Total 5.40

43
TABLE 29. ETHANOL PRODUCTION FROM BIOMASS: TYPICAL ANNUAL O&M COSTS
Item Price ($/unit) Unit Quantity Annual cost
(thousands of $)Material Bagasse 10 ton 12 240 122.4 Others 320 Utilities Electricity 0.04 kWh 1 200 000 48 Fuel 0.2 L 450 000 90 Water 0.2 M3 12 240 2.4 Labour Manager 5 000 Yr 1 5.0 Engineer 4 500 Yr 4 18.0 Technician 3 000 Yr 8 24.0 Labour 2 000 Yr 12 24.0 Maintenance 2 % of capital 107.9 Other 10 % of total 84.6 Total 846.4 Depreciation 15 years lifetime 359.8 Total production costs 1206.2 Cost $/ton ethanol 300 days 536.10
TABLE 30. CAPITAL AND PRODUCTION COSTS FOR THE PROPOSED BIOFUEL TECHNOLOGIES
Technology Capacity Production
Capital costs
(millions of $)
Annual O&M
(thousands of $)
Depreciation (thousands
of $)
Total production
costs (thousands
of $)
Cost ($/unit of product)
Biomass at $6/ton
Biomass at $10/ton
Briquetting 10 t/hr wet bagasse
5 t/hr briquettes 2.25 542 150 692
27 (briquettes)
36 (briquettes)
Gasification for steam generation
10 t/hr wet bagasse
10 t/ hr steam (15-20 bar) 2.27 470 151 621 10 (steam) 13.7 (steam)
Gasification with electric generation
7.6 t/hr dry bagasse 3 MW 11.2 770 748 1 518 0.08 (kWh) 0.09 (kWh)
Ethanol
1.67 t/hr wet bagasse 0.25 t/hr 5.4 792 357 1 149
510 (ethanol)
536 (ethanol)
Bio-oil 8.3 t/hr dry bagasse 5 t/hr 7.5 1,167 500 1 667 45 (bio-oil) 50 (bio-oil)
F. PUBLIC AND PRIVATE SECTOR INITIATIVES
Scarce information is available regarding public and private sector initiatives for biofuels generated from sugarcane and sugar beat processing. However, some important remarks concerning this issue can be stated. The general trend among sugarcane manufacturing community is to use a significant fraction of bagasse to provide required energy for processing through direct production of steam and/or electricity generation. However, the trend in Egypt is changing towards diversifying bagasse use to include pulp production for the paper industry, panel boards, MDF and animal fodder.

44
In Upper Egypt, hundreds of black honey production plants use bagasse for the production of thermal energy to meet processing requirements. It is claimed that each of some 400 facilities can produce 9-10 tons/day. Leftover dry residues in sugarcane fields are partially used in rural stoves while the remainder is burnt on the fields. In the Sudan, the major trend is to use bagasse in cogeneration of thermal and electricity production. As mentioned above, the Kenana Sugar Factory has been engaged in charcoal production since 1998 as a private sector company. Two additional plants are also under construction. Sudanese investments in biofuels are listed in a ten-year strategy that includes the El-Jazeera project for the production of 2.9 million tons of sugar and 205 million litres of ethanol per year as a primary biofuel source. This is expected to generate additional amounts of biomass for second-generation biofuel production as well. The experience to be gained from blending ethanol produced from sugar with gasoline serves to justify the proposal to produce ethanol from lingo-cellulosics, if economically viable, for a similar purpose. With regard to sugar beet pulp, the current trend is to use it for fodder production mostly directed to exports at a current price of about $135/ton, thereby representing a major source of foreign currency to the production facilities and the companies involved in the export business. The savings generated from using the pulp for biofuel production for firm-level use or sale must then surpass this price and associated transaction costs to be a feasible alternative.
G. USE OF BIOFUELS Currently, bagasse that is produced from sugar factories or black honey production is used for generating the energy needed for the processing plants. However, the efficiency of use is relatively low at about 60 per cent.80 The following three major directions should be adopted to enhance the efficiency of energy production in a way that secures additional energy to be exported to nearby small industries: (a) Improving residue management practices, with an emphasis on enhancing the collection of bagasse principally from small black honey manufactures and other related cane juice shops; (b) Improving combustion efficiency in sugar factories and black honey facilities. For instance, in the Sudan, plants feasibility studies have indicated that at least 40 MW could be added to the current cogeneration production capacity; (c) Applying anaerobic digestion for the treatment of high strength effluents from sugar beet factories, which could add to the production of biogas. In essence, SMEs could therefore benefit from current or potential improved production of biofuels in a number of ways, including, but not limited to, the following: (a) Adoption of the briquetting technology to improve energy efficiency and mitigate adverse environmental impact of burning fluffy bagasse. This would also secure additional job opportunities with consequent positive social impact; (b) Surplus energy that would result from improving cogeneration or composition efficiency could be used for other industrial uses;
80 S.M. el-Haggar et al., “Environmentally balanced industrial complex for the cane sugar industry in Egypt”, which was presented at Proceedings International Hydrogen Energy Congress and Exhibition IHEC 2005 (Istanbul, Turkey, 13-15 July 2005) and is available at: www.unido-ichet.org/ihec2005/files/manuscripts/EL%20Haggar%20S.M-Egypt.pdf.

45
(c) Feasibility of ethanol production from bagasse and beet pulp should be evaluated against other energy and non-energy uses for feedstock; (d) Improving the opportunities for SMEs in the production and use of biofuels should consider the application of gasification technology in providing rural energy based on crop residues collected from the field; (e) The transport business companies dedicated for collection of bagasse from source generators and also for distribution of briquettes could create additional opportunities for SMEs in the biofuel business.
H. CONCLUSIONS AND RECOMMENDATIONS Despite the recent decrease in oil prices from all time highs in 2008, biofuel projects should still be encouraged. A number of conclusions and recommendations can therefore be made regarding the production of biofuel from sugar crops and sugar wastes based on the case study findings. These are set forth below. (a) Technology options and technical considerations (i) Processing and using sugar crops and sugar manufacturing facilities avail ample opportunities
for the production of biofuels, which permits commercial development of different forms of bio-energy. However, the plan for exploring opportunities for production and commercialization of biofuels should accommodate other low-cost available feedstock options in order to guarantee the sustainability of bioenergy production, considering the seasonal nature of sugarcane and sugar beet wastes. Energy sources and stock storage are thus important aspects that need to be considered;
(ii) Significant emphasis needs to be placed on solar drying given that it can serve to improve
biofuel properties and increase the useful thermal energy output; (iii) Biomass energy systems could be implemented using technologies and equipment of varying
levels of sophistication. Development of local technology and engineering capabilities are sufficient at this stage to sustain RDF, carbonization and biogas projects. Endeavours are still required to design, build and demonstrate simple and efficient gasifier systems;
(iv) Electricity production from waste generated by the sugar sector could be more justified in
remote areas that are not connected to gas or electricity grids. (b) Financial feasibility and assessment (i) It is appropriate to identify when to use biomass residues for energy and what are the
economically viable forms that could be generated; (ii) Project profiles for the establishment of biomass utilization facilities should be undertaken by
concerned agencies to be disseminated among industrial communities and entrepreneurs. NGOs and commercialization companies need to focus on areas that are rich with biomass residues in order to identify opportunities;
(iii) The decision-making process for using biomass and availing opportunities for SMEs should be
preceded by some form of feasibility studies aimed at comparing options for the economic use of residues. For instance, bagasse might find results in greater profit from the production of pulp for making paper, MDF or HDF;

46
(iv) Local governments in target communities should review different forms of economic incentives to promote SME involvement in the biofuels business. Reasonable tax exemptions could be offered to create incentives for environmentally sound bioenergy projects. These incentives should be decided based upon economic, social and environmental grounds;
(v) Use of biofuels in rural and remote areas needs to be subject to the maximum participation of
local communities in order to encourage sharing in the planning, financing, implementation and use;
(vi) Financial institutions at the national and multinational levels should encourage investments in
biofuels projects. (c) Research, development and capacity-building (i) Capacity-building is a crucial component of engaging SMEs in biofuels projects. It is required
at all stages of project development, including planning, design and implementation, and should involve governments, entrepreneurs, financing institutions, industrialists and NGOs.
(ii) There is a need to launch demonstration projects in second-generation biofuel production in
order to expose potentials and encourage investment. Additional research is needed to assess or reduce the cost of pre-treatment, hydrolysis and ethanol dehydration need to be optimized.

47
IV. BIOGAS GENERATION FROM THE LIVESTOCK AND DAIRY INDUSTRIES
A. OVERVIEW The concentrated nature of animal manure in farms provides a clear opportunity for its use as a biofuel source both within and outside the dairy and livestock industries. Biogas generation from various organic wastes has advanced significantly in the past few years. This chapter reviews the potential opportunities across the region for SME involvement in this technology.
B. LIVESTOCK AND MILK PRODUCTION IN ESCWA MEMBER COUNTRIES
The assessment of biogas generation potential in ESCWA member countries is directly related to the available livestock and their concentration. Table 31 details the available numbers of chicken, lambs, camels and dairy cows in the ESCWA region. Of all the listed livestock, dairy cows are of special interest given that they are generally concentrated in limited areas in farms so their waste can be readily collected. This is not the case with other livestock. Accordingly, and for the purposes of this study, the focus will be directed mainly to cows.
TABLE 31. NUMBER OF LIVESTOCK IN THE ESCWA REGION
Country or territory Chicken (2006) (tons) Lambs (2007) Camels (various years) Dairy cows (2007)
Bahrain 6 000 41 000 .. 9 000 Egypt 536 000 5 180 000 95 000 (1998) 4 550 000 Iraq 95 000 6 200 000 250 000 (2002) 1 500 000 Jordan 115 000 2 100 000 14 000 (2007) 69 500 Kuwait 45 000 900 000 5 000 (2002) 28 000 Lebanon 120 000 340 000 .. 77 000 Oman 6 000 360 000 117 000 (2005) 310 000 Palestine 21 600 (2003) 785 000 .. 39 000 Qatar 6 000 120 000 32 829 (2001) 8 000 Saudi Arabia 550 000 7 000 000 284 133 (2006) 372 000 The Sudan 26 250 (2005) 49 000 000 3 100 000 (1998) 39 500 000Syrian Arab
Republic 125 000 21 000 000 6 500 (1994) 1 150 000
United Arab Emirates
32 000 615 000 120 000 (2002) 125 000
Yemen [364] 80 000 8 589 000 365 000 1 495 000 Sources: A. Sayegh, “Middle East poultry production sees reasons for optimism”, World Poultry, vol. 32, No. 4 (2007); Food and Agriculture Organization (FAO) statistics, which is available at: www.faostat.org; Central Department of Statistics and Information in Saudi Arabia; A.M. al-Majali et al., “Risk factors associated with camel brucellosis in Jordan”, Tropical Animal Health and Production, vol. 40, No. 3 (April 2008), pp.193-200; A.S. Saber, “The camel in ancient Egypt” (1998); C.R. Engler et al., “Economics and environmental impact of biogas production as a manure management strategy”; T.W. Widodo and A. Hendriadi, “Development of biogas processing for small scale cattle farm in Indonesia” (2005); C.D. Fulhage, D. Sievers and J.R. Fischer, “Generating methane gas from manure”; H.O. Wu et al., “Biogas – is it a sustainable energy source?” (2001); and U. Wernery, “FMD and camelids: International relevance of current research”. Note: Two dots (..) indicate that data are not available. Figure 15 illustrates the number of dairy cows in ESCWA member countries, indicating that substantial numbers are available in the Sudan compared to other countries. This figure also points to the countries that could most optimally benefit from a biogas generation potential.

48
Figure 15. Number of dairy cows in ESCWA member countries (millions and percentage share of total)
The Sudan39.5
(80%)
Egypt4.6
(9%)Iraq1.5
(3%)
Yemen1.5
(3%)
Syrian Arab Republic
1.2(3%)
Others1.0
(2%)
Note: “Others” refers to the combined stocks of the remaining ESCWA members, namely, Bahrain, Jordan, Kuwait, Lebanon, Oman, Palestine, Qatar, Saudi Arabia and United Arab Emirates. In addition to current numbers of dairy cows, it is important to predict the future growth of the dairy industry. The gap between production and consumption levels of milk and cheese in a given country can be an indicator regarding the expansion potential of the dairy industry. Production and consumption levels have been chosen from the most recently available set of data. Figure 16 illustrates these gaps for the countries for which data were available.81 It is clear from this graph that significant boosts in the production of milk is needed for fresh milk in Iraq, Kuwait, United Arab Emirates and Yemen, while a significant boost is needed in cheese production in Jordan, Lebanon, Oman and Palestine. These figures are only indicative of potential market development given the dependence on several other economic factors, including the cost of production, which are not covered in this chapter.
81 See the following: (a) IMES Consulting, “GCC dairy products 2006 Oman”, which is available at: http://www.imesconsulting.com/publications.php?gclid=CNPyqNfevZkCFRKIxwodMm4-dQ; (b) X. Zhang, R.L. Kilmer and A. Muhammad, “A descriptive analysis of Egypt and Saudi Arabia who import United States dairy products” (2003), which is available at: http://ideas.repec.org/b/ags/uflomo/15698.html; (c) United States Agency for International Development (USAID), “The dairy market in Iraq” (9 July 2006), which is available at: www.usaid.gov/iraq/contracts/pdf/TheDiaryMarketinIraq.pdf; (d) Palestinian Central Bureau of Statistics, which is available at: http://www.pcbs.gov.ps/Portals/_pcbs/Agriculture/8bd96c73-6cf5-47b7-af30-66a6624fc018.htm; (e) Hashemite Kingdom of Jordan, Department of Statistics (DOS), which is available at: http://www.dos.gov.jo/agr/agr_a/index.htm; and (f) A.M. al-Majali et al., “Risk factors associated with camel brucellosis in Jordan”, Tropical Animal Health and Production, vol. 40, No. 3 (April 2008), pp.193-200, which is available at: http://www.springerlink.com/content/v57tr0j6010744k8/.

49
Figure 16. Gap between milk and cheese production and consumption
C. DAIRY FARM MANURE AS A SOURCE OF ENERGY
1. Biogas generation technology While chapter I provides a general overview of the technology, this chapter focuses on the specific use of dairy farm manure for biogas generation. Figure 17 shows the process of conversion of animal waste into energy and useful products. The process starts with agricultural fields providing animal fodder. The cows in dairy farms consume the fodder to generate milk and waste. The milk is sent for processing either at a plant near the farm or to a cooperative that collects milk from various small farmers and then processes it. The waste of one or more dairy farms can be collected and decomposed anaerobically to generate three types of products, namely: (a) Liquid waste, which can be treated further and disposed of, or treated for use in irrigation given that it is usually rich in nutrients; (b) Solid waste, which is allowed to stabilize and is sometimes composted further before being used for land application, such as a fertilizer and a soil conditioner; (c) Biogas, which is rich in methane and can be further used for energy production. Due to its high CO2 content, the biogas is treated and then burnt to provide heat and electricity that may be used on site or even provided to the general electricity grid. It is to be noted that in ESCWA countries, feeding electricity to the grid is not an option owing to the lack of appropriate legislation and the relative lack of incentives for electricity providers. In some countries, it is even illegal to generate electricity by independent power producers. Additionally, the cheap electricity prices render investments prohibitively expensive with long payback periods. This chapter focuses on the potential applications and opportunities presented to SMEs by the use of biogas from dairy farms in ESCWA member countries.

50
Figure 17. Basic flowchart for the management of dairy farm waste
Cow Waste Collection
Anaerobic Decomposition
Biogas
Solid Liquid
Treatment and
Burning
Fertilizer
Disposal
Irrigation
Heat Electricity
Dairy Farm
Dairy Plant
Agricultural Land
Dairy farmDairy farm Dairy farm
Electricity Grid
2. Energy content of dairy farm waste The analysis of dairy farm productivity is summarized in table 32, based on a study of anaerobic digestion energy outputs from slurry produced by 100 dairy cows per day, which can generate 138 kWht/day.82 These results assume that one 550 kg dairy cow produces 66 kg of slurry per day composed of 8 per cent dry matter, no excessive dilution.
82 P. Frost, S. Gilkinson and J. Buick, “The potential of on-farm anaerobic digestion for Northern Ireland” (2006), which is available at: www.actionrenewables.org/site/download.asp?CatID=4972&parentid=4879&FILE=anaerobic_digestion.pdf.

51
TABLE 32. DAIRY FARM ENERGY PRODUCTIVITY FROM 100 COWS
Slurry input (ton fresh at 8 per cent dry matter/day) 6.6Quantity of biogas produced (m3/day) 106Gross energy from biogas (MJ/day) 2 332 Gross energy produced by CHP (kWh/day) 551 Gross electrical energy produced by CHP (kWhe/day) 208 Gross CHP continuous electricity generation by CHP (kWhe) 8.6 Gross heat energy produced by CHP (kWht/day) 344Electrical energy to run plant (kWhe/day) 21Net electrical energy available for use produced by CHP (kWhe/day) 186 Heat energy to heat digester (kWht/day) 206 Net heat energy available for use produced by CHP (kWht/day) 138 Net heat energy available for use produced by CHP (litres oil equivalent at 80 per cent oil boiler efficiency/day)
18
Gross heat energy produced by biogas boiler (kWht/day) 551 Net heat energy available for use produced by biogas utilized through a gas boiler (kWht/day) 344 Net heat energy available for use produced by biogas utilized through a gas boiler (litres oil equivalent at 80 per cent oil boiler efficiency/day)
46
Digester size required (m3) 175
Another more general study of biogas productivity produced slightly different results (see table 33). In this case, a dairy cow was estimated to provide 640 L/day of biogas rather than 1,060 L/day as mentioned in table 32. In Haubenschild Farms, Minnesota in the United States, up to 2,600 L/day was obtained.83
TABLE 33. POTENTIAL GAS PRODUCTION OF DAIRY, POULTRY AND BEEF MANURE
Dairy (544 kg)
Poultry (1.8 kg bird)
Beef (454 kg)
Gas yield, L/kg volatile solids destroyed 480 540 940 Volatile solids voided, kg/animal/day 4.3 0.0199 2.27 Per cent reduction of volatile solids 31 56 41 Potential gas production L/day per animal unit 640 6 870 Energy production rate, W per animal 166 1.53 226.9 Available energy, W (after heating digester) 111.3 1.02 152.3 Source: C.D. Fulhage, D. Sievers and J.R. Fischer, “Generating methane gas from manure”, which is available at: http://www.wcasfmra.org/biogas.htm. Note: Based on assumption of 20oC, atmospheric pressure. Several variables control the productivity of a CHP unit, namely, the quality of biogas produced and the specific dairy plant needs of heat and electricity. Biogas composition is generally 40-60 per cent methane, 40-60 per cent carbon dioxide and 0.2 per cent hydrogen sulphide. As the methane content increases, the overall energy content increases. Generally, biogas from manure contains 5.58-7.78 kWh/m3, while pure methane gas contains 10.34 kWh/m3.84 For the purpose of all calculations in this chapter, 1 m3/day of biogas will be assumed to be generated by a cow with an average energy content of 6 kWh/m3. Biogas is compared to other energy sources in table 34. The comparison is based on the unified energy content of each fuel type. 83 C. Nelson and J. Lamb, “Final report: Haubenschild Farms Anaerobic Digestion” (The Minnesota Project, 2002), which is available at: www.mnproject.org/pdf/Haubyrptupdated.pdf.
84 T.W. Widodo and A. Hendriadi, “Development of biogas processing for small scale cattle farm in Indonesia” (2005), which is available at: http://www.wcasfmra.org/biogas.htm.

52
TABLE 34. BIOGAS EQUIVALENCE
Biogas Wood Kerosene Diesel Coal LPG Fuel dung Butane Energy1 m3 3.47 kg 0.62 L 0.61 L 1.5 kg 0.45 kg 13.0 kg 0.5 kg 6 kWh
Source: H.O. Wu et al., “Biogas – is it a sustainable energy source?” (2001), which is available at: http://www.environmentalstudies.au.dk/publica/f2001hx-biogas.pdf. From an environmental perspective when considering climate change implications of biofuel development, 1 m³ of biogas contains 0.537 kg of carbon and produces 1.97 kg of CO2 upon burning. This is less than the amount produced by fuel wood, which ranges between 4.8 and 6.42 kg of CO2 for the same amount of energy produced. Accordingly, for rural applications, biogas is a much cleaner fuel.
3. Energy needs of a dairy farm It is fairly clear that the primary targeted user of energy generated from a biogas facility should be the dairy plant itself. Accordingly, an analysis of the energy needs of a typical dairy plant is warranted, namely, the energy input needs per unit of pasteurized milk, yogurt and cheese as detailed in table 35. The analysis is restricted to small- and medium-sized centres using electricity, low pressure steam boilers, simple filling and sealing machines and pasteurizers (usually batch type).85 It is important to note that one ton of milk can be processed to make around 143 kg of cheese.86
TABLE 35. ENERGY INPUTS PER TON OF PROCESSED MILK
Energy input Pasteurized milk (kWh) Cheese and yogurt (kWh)
Case 1 Case 2 Case 1 Case 2Thermal (kWht) 50 167 50 125Electrical (kWhe) 25 56 25 75
Notes: Case 1: Simple plants with milk packaged in plastic containers. Case 2: Complete plants producing bottled milk. This is the type that is generally used in Europe. A comparison of some typical farm heat requirements and the number of animals needed to meet these requirements is presented in table 36. This table is useful for a better understanding of the productivity of livestock and the energy consumption of various appliances.
TABLE 36. POTENTIAL OF ANIMAL WASTE IN OFFSETTING COMMON FARM NEEDS
Heat requirement(kW)
Dairy(544 kg)
Poultry (1.8 kg bird)
Beef(454 kg)
Kitchen rangea/ 19.0 14 1 547 11Water heaterb/ 13.1 20 2 143 15Refrigeratorc/ 0.87 4 429 3Heat 140 m2 homed/ 10.9 99 10 714 72In-bin grain drying heatere/ 585.7 2 631 285 714 1 92350 HP tractor operating at full loadf/ 186.5 838 91 000 612
Source: C.D. Fulhage, D. Sievers and J.R. Fischer, “Generating methane gas from manure”, which is available at: http://www.wcasfmra.org/biogas.htm. a/ Assumed to operate 2 hours per day, i.e., 24-hr average of 1.58 kW. b/ Assumed to operate 4 hours per day, 24-hr average = 2.2 kW. c/ Assumed to operate 12 hours per day, 24-hr average = 0.43kW. d/ Assumed heat requirement of 79.5 kW/m2. e/ Assumed to operate 12 hour per day during drying season, 24-hr average = 292.8 kW. f/ Assumed to operate 12 hours per day, 24-hr average = 93.3 kW.
85 G. Rive, “Utilization of renewable energy sources and energy-saving technologies by small-case milk plants and collection centres” (1992), which is available at: http://www.fao.org/docrep/004/t0515e/T0515E03.htm.
86 D.B. Fankhauser, “Cheese making illustrated” (July 2000), which is available at: http://biology.clc.uc.edu/ fankhauser/Cheese/Cheese_5_gallons/CHEESE_5gal_00.htm.

53
4. Examples of biogas plants For a better understanding of actual productivity of biogas plants, table 37 shows some case studies from anaerobic decomposition of cow waste in dairy farms. As shown in the table, biogas productivity and its use for electricity or heat generation varies from one farm to another. However, the average numbers provided in table 32 are good for estimated purposes. It is also important to note that despite the economies of scale, biogas plants will feed stock from as little as 100 dairy cows are being designed and implemented across the world. Accordingly, SMEs can take advantage of this technology.
TABLE 37. BIOGAS PRODUCTION FROM DAIRY FARMS CASE STUDIES IN THE UNITED STATES
Factory name County or State in the United States
Number of cows
Type of energy produced
Biogas (m3/y)
Electricity capacity
(kW)
Electricity produced (MWh/y)
Noblehurst Farms, Inc Livingston County 1 450
Biogas, electricity, hot water and heat 744 000 90 788
AA Dairy Tioga County 500Biogas, heat and electricity .. 70 613
Haubenschild Farms Minnesota State 750
Biogas and electricity 723 500 .. 1 080
JJ Farber Dairy Greene County 100Biogas, heat for the digester
24 800(design) .. ..
Sources: P. Wright and J. Ma, “Anaerobic digester at Noblehurst Farms, Inc.: Case Study” (2003); P. Wright and K. Graf, “Anaerobic digester at AA dairy: Case Study” (2003); C. Nelson and J. Lamb, “Final report: Haubenschild Farms Anaerobic Digestion” (The Minnesota Project, 2002); and P. Wright and J. Ma, “Fixed film digester at Farber Dairy Farm: Case Study” (2003). Note: Two dots (..) indicate that data are not available.
5. Production potential in ESCWA member countries The capacities available in ESCWA member countries are determined by the total number of dairy cows available and some sample analysis of existing dairy farms. For CHP productivity calculations, the net heat and electricity available are derived from table 32 above, namely: 138 kWht/day per 100 cows, or 504 kWht/cow/year of heat; and 186 kWhe/day per 100 cows or 679 kWhe/cow/yr of electricity. If only heat is used, then the net energy available is 1,256 kWh/cow/yr. Given that a significant need for thermal energy exists in dairy plants, it is assumed that all electricity plant generation, if any, will be of the CHP type. Table 38 also assumes 100 per cent use of energy produced.
TABLE 38. BIOGAS PLANT POTENTIAL IN THE ESCWA REGION
Country or territory Number of
cows Thermal (GWh/yr)CHP (GWh/year)
Electrical Thermal The Sudan 39 500 000 49 612 26 821 19 908Syrian Arab Republic 1 150 000 1 444 781 580Egypt 4 550 000 5 715 3 089 2 293Yemen 1 495 000 1 878 1 015 753Jordan 69 500 87 47 35Lebanon 77 000 97 52 39Saudi Arabia 372 000 467 253 187Qatar 8 000 10 5 4Kuwait 28 000 35 19 14Bahrain 9 000 11 6 5Palestine 39 000 49 26 20United Arab Emirates 125 000 157 85 63Oman 310 000 389 210 156Iraq 1 500 000 1 884 1 019 756

54
To understand further the significance of the numbers shown in table 38, the electricity potential is correlated to the electricity production in ESCWA countries (see table 39). The most striking results are obtained for the Sudan, which can increase its electricity generation by seven times by making maximum use of this technology. Yemen follows with an outstanding 24 per cent potential increase in production. Egypt, Iraq, Oman and the Syrian Arab Republic can all increase their capacities by 1-5 per cent, while for other countries additional electricity generation potential is below 1 per cent. It is obvious that imbedded energy in animal waste has a significant role to play in the advancement of development indicators in ESCWA member countries.
TABLE 39. ELECTRICITY POTENTIAL IN OFFSETTING NATIONAL NEEDS
Country or territory Electricity production
(TWh)* Electrical potential from biogas (GWh/yr) Coverage
(percentage)The Sudan 3.8 26 821 705.80Syrian Arab Republic 33 781 2.37Egypt 102 3 089 3.03Yemen 4 1 015 24.88Jordan 7.5 47 0.63Lebanon 9 52 0.60Saudi Arabia 166 253 0.15Qatar 14 5 0.04Kuwait 45 19 0.04Bahrain 9 6 0.07United Arab Emirates 50 85 0.17Oman 14 210 1.47Iraq 29 1 019 3.48Palestine .. 26 ..
Sources: L.S. Gold and Associates, “AK-Chin Indian community biomass feasibility study” (20 October 2004); International Atomic Energy Agency (IAEA), Energy and Environmental Data Reference Bank, which is available at: www.iaea.org/inisnkm/nkm/aws/eedrb/data/JO-encc.html; and Central Intelligence Agency (CIA), The World Factbook, which is available at: https://www.cia.gov/library/publications/the-world-factbook/.
Notes: Two dots (..) indicate that data are not available.
* Some of the decimals in electricity production were dropped to simplify the numbers. With regard to SMEs, more attention needs to be paid to the ability of biogas to satisfy their immediate needs for dairy production. Accordingly, table 40 details the capacity of four different dairy farms in various countries. These farms produce a variety of products and have varying energy needs that could be met by biogas generation.
TABLE 40. MILK PRODUCTION AT SELECTED DAIRY FARMS IN THE ESCWA REGION
Factory name Country Number of employees
Number of cows Type of production
Milk produced (tons/yr)
Almarai Saudi Arabia 4 000 55 000 Milk, yoghurt, drinkable laban, cheese, butter, pastries, cakes, bread and juices 650 000
Al-Safi-Danone Saudi Arabia 1 400 32 000 Milk, yoghurt, laban Activia, dairy products, juices 219 000
Al Rawabi Dairy Company
United Arab Emirates .. 5 000
Milk, yoghurt, yoghurt drink, cheese, butter and fruit juice drinks 43 800
Liban Lait Lebanon 50 2 000 Milk 8 030
Sources: H. Thaker, “Almarai Company cash cow: Falcom Equity Research Report” (30 December 2008); Al-Safi-Danone, see “Record breakers”, which is available at: www.euroasiaindustry.com/assets/uploads/117.pdf; Al Rawabi Dairy Company LLC, which is available at: http://www.tradekey.com/profile_view/uid/1223003/Al-Rawabi-Dairy-Company-LLC.htm; and J. Qadir, “Al Rawabi opens new Dh50m plant”, Khaleej Times (23 October 2003).
Note: Two dots (..) indicate that data are not available.

55
In order to unify the analysis across these dairy farms, energy needs have been estimated by considering the pasteurization of milk (see table 41), since the actual energy needed is more when yogurt and cheese are manufactured. The net energy produced is based on the results obtained from table 33 with direct correlation to the number of cows in the farm. The percentage coverage indicates the percentage of heating and electricity needs covered by the biogas plants. This coverage is further illustrated in figure 18. It is clear from this analysis that electricity produced outweighs the plant need for pasteurization, although it does not necessarily satisfy all other electricity needs, while thermal energy does not cover the complete needs. Accordingly, it is absolutely critical to design the electricity/heat ratio in a CHP plant first to meet all the heating needs and then to use the extra energy for electricity generation. This also depends on the heat/electricity costs in the specific region studied. Achieving this balance between heat and electricity production could make or break the biogas plant investment.
TABLE 41. ESTIMATED SIMPLIFIED DAIRY PLANT ENERGY NEEDS AND ENERGY POTENTIAL FROM BIOGAS PLANTS
Case
Number of
cows
Milk produced (tons/yr)
Energy needed (MWh)
Net energy from biogas CHP (MWh)
Coverage (percentage)
Heat Electricity Heat Electricity Heat Electricity 1 55 000 650 000 108 550 36 400 27 720 37 345 26 103 2 32 000 219 000 36 573 12 264 16 128 21 728 44 177 3 5 000 43 800 7 315 2 453 2 520 3 395 34 138 4 2 000 8 030 1 341 450 1 008 1 358 75 302
Source: ESCWA.
Figure 18. Percentage coverage of energy needs based on number of cows
6. Investment costs for a biogas plant The investment costs for a biogas plant and the return on investment will vary widely depending on scale of project and type of energy produced, in other words heat or electricity. A case study of an anaerobic digester facility located at the Kirk Carrell Dairy near Godley, Texas in the United States provides an
0
50
100
150
200
250
300
350
55,000 32,000 5,000 2,000Cows
Perc
enta
ge c
over
age
from
bio
gas
HeatElectricity

56
indication of the financial feasibility of these types of investments. The plant has a capacity of 25 kW to process the waste of 400 cows. Table 42 illustrates the overall costs and table 43 details the annual cost/benefit analysis at this facility. As can be seen, there is a clear financial loss in the installation and operation of this project. These losses are often subsidized by governments in industrialized countries either in the form of tax incentives, premium prices for electricity produced or initial installation support as they can be considered “green box” subsidies that result in environmental benefits. These subsidies are not normally available to producers in developing countries, particularly small-scale producers. It should also be noted that this case study does not take into consideration the avoided costs of having to process the waste before its disposal, nor the environmental costs associated with the improper disposal of the agricultural waste. Another study of the potential savings of a biogas plant has been published for a 55 kW plant designed to process the wastes of 500 cows with plans to increase them to 1,000. While this analysis concludes that an income of $35/cow/yr annual will be achieved for a total of $17,500, it fails to account for the fact that the solids sold ($32,445) should not be accounted for given that, even without the installation of the project, the farm would have sold them anyway (see table 44). The same may be assumed for nutrient value remaining. This puts the project back in the red.
TABLE 42. INVESTMENT COSTS FOR KIRK CARRELL DAIRY ANAEROBIC DIGESTER
Item Life
(years) Investment
($)Annual costa/
($) Repairs and
maintenanceb/ ($) Riskc/
($)Tank 15 40 000 4 215 211 126Cover 15 47 800 5 037 252 151Solid separator 15 22 000 2 318 116 70Engine 5 5 000 1 150 57 34Generator 15 5 600 590 30 18Other equipment 15 18 000 1 897 95 57Materials/supplies 15 5 600 590 30 18Contractor 15 5 700 601 30 18Total 15 149 700 16 398 821 492
Source: C.R. Engler et al., “Economics and environmental impact of biogas production as a manure management strategy”, which is available at: www.agmrc.org/media/cms/Engler2_F05E9EA9371B6.pdf.
a/ Investment amortized at 7.5 per cent for life of investment with no salvage value. b/ Estimated at 5 per cent of annual investment cost. c/ Estimated at 3 per cent of annual investment cost.
TABLE 43. EXPECTED ANNUAL COSTS/BENEFITS FOR KIRK CARRELL DAIRY ANAEROBIC DIGESTER
Item Annually Investment $16 398 Repair and maintenance $821 Risk $492 Variable (laboura/, suppliesb/) $6 200 Total $23 911 Electricity produced 214 MWh Cost of electricity offset 6.7 ¢/kWh Annual electricity savings $14 300 Actual annual losses ($9 600)
Source: C.R. Engler et al., “Economics and environmental impact of biogas production as a manure management strategy”, which is available at: www.agmrc.org/media/cms/Engler2_F05E9EA9371B6.pdf.
a/ Labour estimated at 10 hr/wk at $10/h. b/ Supplies estimated at $1,000.

57
TABLE 44. COSTS FOR ANAEROBIC DIGESTION MANURE HANDLING SYSTEM
Current value ($) Yearly amount ($)First year expense (365 000) .. Ten year expense (22 696) .. Operation and maintenance (151 786) (15 460) Nutrient value remaining 334 406 34 060 Solids sold 318 550 32 445 Electricity sold 235 636 24 000 Net income 349 109 Net income per cow 698 35
Sources: C.D. Fulhage, D. Sievers and J.R. Fischer, “Generating methane gas from manure”, which is available at: http://www.wcasfmra.org/biogas.htm; and P.E. Wright, “Anaerobic digestion and wetland treatment case study: Comparing two manure odour control systems for dairy farms” (1998), which is available at: www.rcminternationalllc.com/RCM_Forms/ RCM_Paper_No_984105.pdf. Note: Two dots (..) indicate that data are not available.
7. Investment potential for SMEs Based on the information above, while a clear opportunity exists for SMEs to invest in biogas plants, access to appropriate technologies and an enabling environment are needed to make such investments profitable. Consequently, the factors set forth below need to be taken into consideration before embarking on such a project: (a) Local availability of equipment and spare parts; (b) Local availability of qualified technicians and engineers; (c) Existence of local governmental regulations promoting the use of biogas; (d) Existence of local governmental regulations restricting waste disposal; (e) Availability of appropriate dairy waste resources and their sustainability; (f) Detailed analysis of heat versus electricity needs; (g) Possibility of accessing clean development mechanism (CDM) credits. Based on the analysis above, an electricity cost of $0.11/kWh seems to be a prerequisite for the success of a biogas project for electricity production. Of course, the absence of a local electricity grid will greatly favour the installation of a biogas plant given that it will offset the need for costly alternatives associated with diesel generator utilization. Moreover, while biogas plants may be erected by farm owners, dairy plant owners, cooperatives or independent entrepreneurs, they all have to ensure a long-term contract for the supply of organic waste and the opportunity to sell the energy produced, whether heat or electricity. Furthermore, the potential does exist for using other biomass resources to augment the nutrient load to the digester. In agricultural areas, an abundance of agricultural wastes can be made available for this purpose.
D. RECOMMENDATIONS ESCWA member countries are rich in potential biogas sources, especially the Sudan. With the fluctuating price of traditional oil and gas energy sources, it is clear that biogas from organic waste in general and dairy farms in particular must be tapped. The technology is mature and well-used across the world. In order to encourage the adoption of this technology, governments need to undertake measures aimed at the following:

58
(a) Providing tax breaks for equipment imported and manufactured for the purposes of biogas plant construction; (b) Providing electricity purchase prices to producers that at least meet the national cost of electricity generation rather than the subsidized cost; (c) Removing energy subsidies that, while having an adverse effect on the poorer population in the short term, will encourage the use of all renewable energies and benefit the community as a whole in the long term; (d) Exempting all of the biogas plant operations from taxes for the start-up or duration of the project; (e) Implementing stricter environmental laws prohibiting open disposal of solid and liquid wastes from dairy farms; (f) Providing tax incentives or preferential treatment for plants installing organic waste digesters. For example, governments may opt to purchase part of the farm production for the national army, thereby giving the farm a stable market and financial edge over its competitors. As for SMEs, while the potential does exist, careful financial analysis and feasibility studies need to be undertaken on a case by case basis. Local labour costs vary widely and the system design balance (heat/electricity) also plays a critical role in the overall return on investment. Dairy plants capable of using all the potential heat generated without resorting to electricity generation could very well be at a financial advantage. Larger projects may qualify for CDM support and, therefore, may be able to offset part of their costs. Farm owners can benefit given that the waste is available to them that could meet their energy needs. Farms of 100 cows or more should consider investing in biogas plants. Farmers owning fewer cows should consider cooperatives as a means of collecting animal waste to generate economies of scale and generate biogas.

59
V. CHALLENGES AND OPPORTNITIES FOR SECOND-GENERATION BIOFUEL PRODUCTION IN THE ESCWA REGION
The types of agricultural waste generated in ESCWA member countries differ widely according to crop types associated with variations in weather, topography and water resources available across the region. The improper disposal of these agricultural wastes is causing environmental stress, including increased carbon emissions and groundwater pollution. Productive and profitable alternatives for the use of organic by-products can be directed towards second-generation biofuel production
A. THE FEASIBILITY OF CONVERTING AGRICULTURAL WASTE INTO BIOFUEL The study has shown that agricultural waste has a variety of uses, both energy and non-energy related. Accordingly, conversion into biofuel is only one among a variety of competing applications and uses of agricultural by-products. While the use of by-products for biofuel and energy production will generate an added value, the operation should be considered in light of other economic opportunities. Prior to embarking into second-generation biofuel production, the first and most basic issue is to determine whether a non-energy use of an agricultural waste cluster is more appropriate and economic than its transformation into an energy source. For example, use of agricultural waste as fodder and fertilizer or its conversion into higher value paper or MDF and HDF must be studied before the waste is diverted to energy production. It is also very important to keep in mind that an application that is feasible for a certain by-product in one country is not necessarily the best option for another country. Accordingly, decision makers should be open-minded to all possible applications (energy and non-energy) in order to choose the best among them. In order to make this judgement, proper feasibility studies should take into account the following conditions: (a) Availability of appropriate agricultural waste resources and their sustainability. Farm owners with processing plants, such as dairy farms, have a great advantage given that waste is available for them and at the same time they have large energy needs to fulfil. Small-scale farmers should consider cooperatives as a means of collecting agricultural wastes to ensure enough quantities are available and achieve economies of scale. The plan for exploring opportunities for production and commercialization of biofuels needs to accommodate other low-cost available feedstock sources or storage facilities to guarantee sustainability of bioenergy production, considering the seasonal nature of agricultural waste availability; (b) Local availability of the technology, including equipment and spare parts, in addition to qualified technicians and engineers. Simple and appropriate technologies should be favoured over advanced technologies that could require international expertise for operation and maintenance; (c) Existence of local governmental regulations restricting waste disposal and promoting the use of biofuel. Awareness of local policies and opportunities for sale of generated energy or energy source can greatly enhance the profitability of a certain project; (d) Detailed analysis of heat versus electricity needs. Given that heat is much cheaper to generate and is produced more efficiently than electricity, waste conversion to heat using clean burning technologies should be considered prior to electricity generation applications. Once heating needs are satisfied, it may be reasonable to consider electricity generation possibilities. Establishments capable of using all the potential heat generated without resorting to electricity generation could very well be at a financial advantage. Generally speaking, the use of biomass for electricity generation is not currently an economic alternative for SMEs in the ESCWA region, although electricity production may be justified in remote areas that are not connected to gas or electric grids given that it can offset costs associated with diesel generators; (e) Availability of financial resources. Opportunities for obtaining CDM funding should be explored, especially for large biofuel projects, to help offset part of the capital costs of investment.

60
B. OPPORTUNITIES FOR SMES
The conversion of agricultural waste into biofuel also offers numerous other market opportunities for SMEs. Indeed, and in addition to being biofuel producers and users, SMEs can be involved in the following: (a) Transporting agricultural waste and biofuel; (b) Manufacturing equipment and machinery needed for the conversion process; (c) Converting agricultural waste into biofuel; (d) Manufacturing stoves or incinerators that work on biofuel; (e) Marketing and promoting biofuel as an energy source; (f) Energy generation from biofuel and distribution in both heat and electricity forms. SMEs in the region are already exploring these opportunities at the level of primary energy production along the value chain. More research, development and product testing, however, are needed to create viable products in these areas based on available environmental technologies and local market conditions. Incentives to enter the biofuel sector should also be considered alongside efforts to promote other renewable energy technologies, given the potential for this energy alternative in terms of creating income and employment opportunities for SMEs in rural and remote areas.

61
VI. CONCLUSIONS AND RECOMMENDATIONS The generation of biofuels from agricultural waste presents a new opportunity for managing the agricultural waste challenge in the region, particularly for SMEs. While more research into this area should be pursued to increase the efficiency, longevity and profitability of such products, the findings in this study indicate the potential for market development of this sustainable energy source using sound environmental technologies. Entrepreneurs, however, must conduct careful feasibility studies in order to strengthen product development and explore potential markets given the current enabling environment. Governments have an important role to play in terms of levelling the playing field and encouraging environmentally sound energy solutions through appropriate policy packages and support for renewable energy sources, particularly given the instability of the current market for energy goods and services.
A. RECOMMENDATIONS TO SMES SMEs need to explore potential opportunities for maximizing revenues and minimizing costs involved in biofuel production projects. In terms of increasing revenues, efforts should be directed towards improving residue collection and management practices. In addition, priority should be given to the production of biofuel forms that can be easily used by the widest possible market. The size and weight-reducing technologies, such as briquetting, pelletizing and biochar production, enable biofuel use by the general population, as well as the storage of energy for year-round use, rather than limited to the harvesting season. In terms of market opportunities associated with the manufacturing of stoves or incinerators that work on biofuel, SMEs should focus on forced convection stoves and energy efficient burners that increase overall heating efficiency. Pilot projects should be initiated first and tested in local markets in order to assess consumer preferences regarding fuel stock, burner presentation, storage and packaging and, subsequently, be adapted for commercial development. Costs may be minimized in a variety of ways and at different levels. At the planning level, participation of local communities, especially in rural and remote areas, should be encouraged to minimize the risk of project failure. In addition, SMEs must strive to make long-term arrangements for the continuous and reliable supply of organic waste from nearby sources, given that transportation costs are an important contributor to the overall cost. At the technical implementation level, reliance on solar energy, which is abundantly available in the ESCWA region, for drying agricultural waste before and after processing can significantly reduce energy requirements for the production of second-generation biofuels.
B. RECOMMENDATIONS TO GOVERNMENTS There are many barriers to the implementation of renewable energy projects by SMEs in general, and secondary biofuel projects in particular. These barriers can be alleviated by appropriate government interventions, including the development of environmentally-oriented energy policies and regulations as well as the implementation of energy sector reforms. Among the more important reforms to consider is the need to re-evaluate energy pricing, especially the price structure of electricity provision in the region. Encouraging citizens to pay the real, rather than the subsidized, cost of electricity opens the door for innovative ideas and investments in non-conventional energy sources, such as biofuels. The difficulty in implementing this recommendation is associated with the anticipated social impacts brought about by reforming energy pricing schemes, which renders them difficult for governments to pursue. However, it should be noted that while the removal of energy subsidies could have adverse effects on the poorer population in the short term, it would also encourage the development of all renewable energies and benefit the community as a whole in the long term. While energy sector reforms is part of the solution, the need for governments to negotiate better technology transfer arrangements with industrialized countries engaged in this sector is also necessary.

62
Currently, industrialized countries can subsidize research, development and investment in primary and secondary biofuels. Developing countries, including ESCWA member countries, do not generally have the financial or human resources necessary to subsidize development in this sector. Accordingly, international arrangements can help level the playing field in this area, while also providing instruments to facilitate the transfer of environmentally sound technologies to those ESCWA member countries that are interested in developing second generation biofuels. Moreover, the privatization of electricity generation serves as a useful tool for encouraging independent power producers (IPP) to enter the market with new, innovative and financially competitive technologies. Again, some countries may consider this option an infringement on their sovereignty and may readily disregard it. However, this approach must be weighed against other options for increasing energy generation capacity, and also takes into consideration reliance on energy import and transport costs. A feed-in law may provide a more acceptable alternative whereby the government pays SMEs for generating the energy (heat or electricity) according to the cost of generation rather than the subsidized tariffs. This could provide a guaranteed outlet for SMEs to sell the produced energy through long-term contracts, thereby ensuring market stability for their production and allowing them to perform sound financial planning. SMEs may even be paid a premium for the energy they generate if the environmental impact and cost to society of current agricultural waste disposal practices are evaluated and included in the equation. Another justification for this premium is the added benefit of promoting local industries and employment opportunities by “nationalizing” energy sources. Implementing stricter environmental laws aimed at prohibiting the disposal of solid and liquid wastes will discourage some of the environmentally damaging practices that currently prevail. Air pollution controls over open, inefficient burning will also serve to promote cleaner technologies. This should be combined with a capacity-building and information dissemination programme that targets local governments, financial institutions, entrepreneurs, industrialists, NGOs and citizens in agricultural areas, thereby raising awareness about biofuels. Finally, governments have a major role to play in terms of providing a suitable financial framework that encourages the creation and increases the sustainability of SMEs dealing with biofuel production. Within that context, some examples include providing investment opportunities and long-term soft loans, and attracting potential donor funds, both locally and internationally. Economic incentives, such as tax exemptions, can be a direct motivation for bioenergy projects, including, for example, by providing tax breaks for equipment that is imported and manufactured for the purpose of constructing biogas plants. Providing preferential treatment for plants converting agricultural waste to biofuel is another option to consider. For example, the government could opt to purchase part of the farm production for its national army, thereby providing the farm a financial and market edge over its competitors. Promoting the development of the biofuel sector by SMEs therefore requires an integrated approach that considers the needs, challenges and constraints posed by local and international energy markets, as well as the opportunities presented by new, environmentally sound technologies. Creating an enabling environment that accounts for these challenges can then assist SMEs to create new economic opportunities and enhance their competitiveness.

63
BIBLIOGRAPHY
Adam + partner. 2009. “Low cost retort kiln called ‘adam-retort’ or ICPS (Improved Charcoal Production System”. Available at: http://www.biocoal.org/3.html.
Ahmed, W.O. 1997. “Briquettes in Sudan”, No. 39. Available at: http://www.hedon.info/Briquettes
InSudan. Al Rawabi Dairy Company LLC. Available at: http://www.tradekey.com/profile_view/uid/1223003/Al-
Rawabi-Dairy-Company-LLC.htm. Al-Tawil, W. 2001. Syrian Arab Republic. CIHEAM-Option Méditerranéennes. Available at:
http://ressources.ciheam.org/om/pdf/b35/02002227.pdf. Alam, A. “Growing sugar crops for food, feed and fuel”, presented at International Conference on World
Prospects of Sugar Crops as Sources of Food and Energy Suppliers (Luxor, Egypt, 1-4 March 2009). GL 2.3/1.
Alam, S.A. 2006. “Use of biomass fuels in the brick-making industries of Sudan: Implications for
deforestation and greenhouse emission” (Department of Forest Ecology, University of Helsinki, Finland. Available at: https://oa.doria.fi/handle/10024/3159.
Algomhuria. Available at: www.gom.com.eg/algomhuria/2005/06/06/stock/detail04.shtml. Alonso P.W., Garzone, P. and Cornacchia, G. 2007. “Agro-industry sugarcane residues disposal: The trends
of their conversion into energy carriers in Cuba”, Waste Management, vol. 27, No. 7, pp. 869-885. Al-Safi-Danone. Record Breakers. Available at: www.euroasiaindustry.com/assets/uploads/117.pdf. Al-Widyan, M.I., Tashtoush, G., Hamasha, A.M. 2006. Combustion and emissions of pulverized olive cake
in tube furnace. Science Direct. Available at: http://linkinghub.elsevier.com/retrieve/pii/ S0196890405001998 (last accessed on 24 February 2009).
Al-Majali, A.M., Al-Qudah, K.M., Al-Tarazi, Y.H. et al. 2008. “Risk factors associated with camel
brucellosis in Jordan”, Tropical Animal Health and Production, vol. 40, No. 3, pp. 193-200. Available at: http://www.springerlink.com/content/v57tr0j6010744k8/.
Aqeel, A.M., Hameed, K.M. 2007. “Implementation of olive mill by products in agriculture”, World
Journal of Agricultural Sciences, vol. 3, No. 3, pp. 380-385. Available at: www.idosi.org/wjas/wjas3 (3)/18.pdf.
Aqra, F., Yaghi, N., Subuh, Y. et al. 2009. “Reducing the environmental impact of olive mill wastewater”,
American Journal of Environmental Science, vol. 5, No. 1. Available at: http://www.scipub.org/ fulltext/ajes/ajes511-6.pdf.
Arab Organization for Agricultural Development. 2007. Strategy for Sustainable Arab Agricultural
Development for the Upcoming Two Decades (2005-2025). Atayol, A.A. 2003. “Anaerobic co-treatability of olive mill wastewaters and domestic wastewater” (Izmir
Institute of Technology, Izmir, Turkey). Available at: http://library.iyte.edu.tr/tezler/master/cevremuh /T000239.pdf.
Babu, S.P. 2006. Perspectives on Biomass Gasification. IEA Bioenergy Agreement. Available at:
http://media.godashboard.com/gti/IEA/IEAWS1Report5-06rev%5B1%5D7-07.pdf.

64
Bailey, Jr. R., Colombo, M. and Scott, W.N. “A 4 MWe biogas engine fueled by the gasification of the production of olive oil wastes (sansa)”. Available at: http://www.brdisolutions.com/pdfs/bcota/ abstracts/9/25.pdf.
Basin. 1999. “Utilization of Bagasse in brickmaking: R & D in Sudan”, Wall Building Technical Brief
(Advisory Service and Information Network). Biomass Energy Resource Center. 2007. Wood Pellet Heating. Available at: www.mass.gov/Eoca/
docs/doer/pub_info/doer_pellet_guidebook.pdf. BMA info 2004. “Optimization of COSUMAR’s beet sugar factories”. Central Department of Statistics and Information of Saudi Arabia. Available at: http://www.cdsi.gov.sa/
showsection.aspx?lid=26&id=318. Central Intelligence Agency (CIA). The World Factbook. Available at: https://www.cia.gov/library/
publications/the-world-factbook/. Central Statistical Organization. Available at: http://www.cso-yemen.org/content.php?lng=english&id=443. Commission on Sustainable Development. 2009. “Policy options and practical measures to expedite
implementation in agriculture, rural development, land, drought, desertification and Africa”, (advanced unedited text, 19 May), p. 12.
Council of Arab Ministers Responsible for the Environment (CAMRE). 2007. “The Arab Ministerial
Declaration on Climate Change”. The Declaration, which was adopted by CAMRE at its nineteenth session (5- 6 December 2007), reflects the Arab position in dealing with climate change issues.
The Declaration of the High-Level Conference on World Food Security: The Challenges of Climate Change
and Bioenergy (Rome, 3-5 June 2008), p. 3 under medium and long-term measures. Delta Sugar Company. Available at: www.deltasugar.com. DynaMotive Energy Systems Corporation. “Fast pyrolysis of bagasse to produce biooil fuel for power
generation”, which was presented at the 2001–Sugar Conference. Available at: www.biooil.ru/docs/ 2001SugarConferencePaper.pdf.
Egyptian Sugar and Integrated Industries Company (ESIIC) and Qena Newsprint Paper Factory. Interviews
with officials. El Ashmawy, K.H. et al. 2007. “Socioeconomic and environmental aspects of women labor in the Egyptian
agricultural sector: Case study of sugar crops”, American-Eurasian Journal of Agriculture and Environment Science, vol. 2, No. 3, pp. 255-260. Available at: www.idosi.org/aejaes/ jaes2(3)/8.pdf.
El Habbab, M.S. “Introducing organic farming system in olive production and linking small farmers to
markets”. Available at: http://www.egfar.org/egfar/lfm/gphi_documents/04_Regional_Case_Studies_ 2008/01_AARINENA/Introducing_Organic_Farming_System_in_Olive_Production-Part-%20B.doc.
El Haggar, S.M. et al. 2005. “Environmentally balanced industrial complex for the cane sugar industry in
Egypt”, which was presented at Proceedings International Hydrogen Energy Congress and Exhibition IHEC 2005 (Istanbul, Turkey, 13-15 July). Available at: www.unido-ichet.org/ihec2005/files/ manuscripts/EL%20Haggar%20S.M-Egypt.pdf.
Energy Crop Digestion Plant Strem. “Sun – Crops – Bio-Energy”. Available at: www.iea-biogas.net/
Dokumente/casestudies/strem.pdf.

65
Engler, C.R., Jordan, E.R., McFarland, M.J. and Lacewell, R.D. Economic and Environmental Impact of Biogas Production as a Manure Management Strategy. Available at: www.agmrc.org/media/ cms/Engler2_F05E9EA9371B6.pdf.
ESCWA. 2005. “Technology transfer to small and medium-sized enterprises and identifying opportunities
for domestic and foreign direct investment in selected sectors: The case of SME clusters in the agro-food and apparel industries” (E/ESCWA/SDPD/2005/6), pp. 22-30.
European Commission, Directorate-General for Research, Information and Communication Unit. 2005
“Energy scientific and technological indicators and references”. Available at: http://europa.eu.int/ comm/research/rtdinfo/index_en.html.
European Community Contribution Agreement with an International Organization. 2003. “Integrated waste
management for the olive oil pressing industries in Lebanon, Syria and Jordan”. Available at: http://www.undp-jordan.org/Portals/0/OO per cent20PD per cent201.pdf.
Food and Agriculture Organization. Industrial charcoal production. 2008. Development of a sustainable
charcoal industry. Available at: http://www.drveniugljen.hr/assets/files/pdf/FAO_Industrial%20 charcoal% 20production.pdf.
FAO. The State of Food Insecurity in the World, 2008. Available at: http://www.fao.org/docrep/011/
i0291e/i0291e00.htm. FAO statistics. Available at: www.faostat.org. Fokaides, P.A., Tsiftes, K. 2007. “Utilisation of Olive Husk in energy sector in Cyprus”. Proceedings of the
Renewable Energy Sources & Energy Efficiency Conference (28-30 September 2007, Nicosia, Cyprus) p. 7.
Four Seasons Fuel Ltd. 2009. “Charcoal retort”. Available at: http://www.fourseasonsfuel.co.uk/charcoal-
retorts.asp. Fankhauser, D.B. 2000. “Cheese making illustrated”. Available at: http://biology.clc.uc.edu/fankhauser/
Cheese/Cheese_5_gallons/CHEESE_5gal_00.htm. Free Patents Online. 2007. “Method and device for pelletizing unprocessed sugar-cane bagasse”. Available
at: www.freepatentsonline.com/EP1770152.html. Frost, P., Gilkinson, S. and Buick, J. 2006. “The potential of on-farm anaerobic digestion for Northern
Ireland”. Available at: www.actionrenewables.org/site/download.asp?CatID=4972&parentid=4879& FILE=anaerobic_digestion.pdf.
Fulhage, C.D., Sievers, D. and Fischer, J.R. “Generating methane gas from manure”. Available at:
http://www.wcasfmra.org/biogas.htm. General Organization for Sugar. Available at: www.gofs.org/. Ghazal, M. and Namrouqa, H. 2007. “Jordan: Pilot plant to treat olive vegetable water”, Jordan Times.
Available at: https://www.zawya.com/printstory.cfm?storyid=ZAWYA20070701032653&l=0326000 70701.
Hadjipanayiotou, M. et al. 1993. “Feeding ensiled poultry excreta to ruminant animals in Syria”, Livestock
Research for Rural Development, vol. 5, No. 1. Available at: www.fao.org/ag/agap/frg/Irrd/Irrd5/1/ syria1.htm.

66
Hassan, H.K. “Arab region prospects of sugar crops as sources of food and energy”, which was presented at the International Conference on World Prospects of Sugar Crops as Sources of Food and Energy Suppliers (Luxor, Egypt, 1-4 March 2009).
Haussier, B. “Quena: Successful start-up of the world’s most modern bagasse paper mill”. Available at:
www.voithpaper.com/media/vp_tw12_quena_en.pdf. Hibajene, S.H., Kalumiana, O.S. 2003. “Manual for charcoal production in earth kilns in Zambia”.
Department of energy, Ministry of Energy and Water development Lusaka, Zambia. Available at: http://www.bioquest.se/reports/Charcoal%20production%20manual%20ENGLISH.pdf.
Hinkova, A. and Bubnik, Z. 2001. “Sugar beet as a raw material for bioethanol production”, Czech J. Food
Science, vol. 19, No. 6, pp. 224-234. Available at: www.cazv.cz/attachments/5-Hinkova.pdf. “How products are made: Charcoal briquettes”. 2009. Available at: http://www.madehow.com/Volume-4/
Charcoal-Briquette.html. International Atomic Energy Agency (IAEA). Energy and Environmental Data Reference Bank. Available
at: www.iaea.org/inisnkm/nkm/aws/eedrb/data/JO-encc.html. International Fund for Agricultural Development (IFAD). Approved projects for Lebanon. Available at:
http://www.ifad.org/operations/projects/regions/PN/LB_all.htm. IMES Consulting. “GCC dairy products 2006 Oman”. Available at: http://www.imesconsulting.com/
publications.php?gclid=CNPyqNfevZkCFRKIxwodMm4-dQ. The Independent. 2007. Somalis Yearn for Islamic Rulers to Return and Tame the Warlords. Available at:
www.independent.co.uk. Index Mundi. Available at: www.indexmundi.com/agriculture/?country. International Society of Sugar Cane Technologists. 2007. “Design, build-up and evaluation of a sugarcane
biomass (bagasse and trash) gasification pilot plant with 3 MWE of power”, project proposal for the International Sugarcane Biomass Utilization Consortium (ISBUC). Available at: http://issct.intnet.mu/ISBUCresprop1.HTM.
Iraq Private Sector Growth and Employment Generation (IZDIHAR). 2006. The Dairy Market in Iraq.
USAID/IRAQ. Available at: www.usaid.gov/iraq/contracts/pdf/TheDiaryMarketinIraq.pdf. Jordan, Department of Statistics. Available at: http://www.dos.gov.jo/agr/agr_a/index.htm. Kadam, K.L. 2000. “Environmental life cycle implications of using bagasse-derived ethanol as a gasoline
oxygenate in Mumbai (Bombay)”. NREL/TP-580-28705. Available at: www.nrel.gov/docs/fy01osti/ 28705.pdf.
Kannan, D. “Renewable energy in developing countries with an emphasis on India”, which was presented
at the International Student Festival in Trondheim 2009. Available at: http://folk.ntnu.no/kannan/ renewable_energy_ isfit09_presentation.pdf.
L.S. Gold and Associates. 2004. “AK-Chin Indian community biomass feasibility study”. Available at:
http://apps1.eere.energy.gov/tribalenergy/pdfs/31_ak_chin_biomass.pdf.

67
League of Arab States. “Proposed executive programme to follow up on mandates of the Arab Economic, Developmental and Social Summit in the area of the environment” (in Arabic), which was submitted to CAMRE at their ad-hoc session (24-25 May 2009).
Liban Lait. Available at: http://www.libanlait.com/Templates/InternalTemplate.aspx?PostingId=204. Lusk, P., Wheeler, P. and Rivard, C. 1996. Deploying anaerobic digesters: Current status and future
possibilities. Available at: http://www.osti.gov/energycitations/product.biblio.jsp?query_id=1&page= 0&osti_id=481517.
Management of Resources and Environment Solutions (MORES). Available at: http://www.mores.com.lb/. Ministry of Economy and Trade in Lebanon. 2006. “Integrated assessment of the Lebanon-EU Association
Agreement: A pilot study on the Lebanese olive oil sector”. Available at: www.economy.gov.lb/NR/ rdonlyres/6BD2EE6D-81D5-49E6-894A-1E1A931BCAAC/0/ExecutivesummaryUNEP28February.pdf.
Nag Hamady for Wood production and Fabrication. Available at: http://server.egypt.com/egypt/
egydirectory/detail/2620/nag-hamady-for-wood-production-and-fabrication-co.html. NationMaster. Available at: www.nationmaster.com. Nelson, C. and Lamb, J. 2002. “Final report: Haubenschild Farms Anaerobic Digestion” (The Minnesota
Project, 2002). Available at: www.mnproject.org/pdf/Haubyrptupdated.pdf. Niaounakis, M. and Halvadakis, C.P. 2006. Olive processing waste management: Literature review and
patent survey, vol. 5, second edition. OPEC Fund for International Development (OFID). 2009. “Biofuels and food security”. The Olive Oil Source. “Disposal of olive processing by-products”. Available at: www.oliveoilsource.com.
“Olive seeds as biomass” (in Arabic). Available at: http://www.srfo.org/newsdetail.asp?ID=29&ln=ar. Omer, A.M. 2005. “Biomass energy potential and future prospect in Sudan”, Renewable and Sustainable
Energy Reviews, vol. 9, pp. 1-27. Omer, A.M. 2007. “Organic waste treatment for power production and energy supply”, Journal of Cell and
Animal Biology, vol. 1, No. 2, pp. 034-047. OPET Sweden. The multipurpose bioenergy in Skellefteå – Electricity, heating and pellets. Available at:
www.aster.it/opet/doc/sweden_bioenergy_plant.pdf. Organisation for Economic Co-operation and Development (OECD). 2008. “Biofuel support policies: An
economic assessment”. Pal, R.C. and Singh, V.K. “Charcoal making technology for livelihood for rural people”, TERI New Delhi.
Available at: www.fuelnetwork.org/index.php?option=com_docman&task=doc_download&gid=207. Palestinian Central Bureau of Statistics. Available at: http://www.pcbs.gov.ps/Portals/_pcbs/Agriculture/
8bd96c73-6cf5-47b7-af30-66a6624fc018.htm. Pari, G. et al. 2004. “Charcoal production for carbon sequestration”. Available at: http://project.jica.go.jp/
indonesia/0065045I0/archives/pdf/output3.pdf. Peters M. et al. 2002. Plant Design and Economics for Chemical Engineers, fifth edition. McGraw-Hill.

68
“Probiogas, Promotion of biogas for electricity and heat Production in EU countires – Economics and environmental benefits of biogas from centralised co-digestion”. 2007. Project coordinator: University of Southern Denmark, Bioenergy Department. Available at: http://web.sdu.dk/bio/ probiogas/down/leaflet.pdf.
Qadir, J. 2003. “Al Rawabi opens new Dh50m plant”, Khaleej Times. Available at:
https://www.zawya.com/ story.cfm?id=ZAWYA20031023072858. Rajoka, M.I. 2005. “The enzymatic hydrolysis and fermentation of pretreated wheat straw and bagasse to
ethanol”, ATDF Journal, vol. 2, No. 2. Available at: www.atdforum.org/IMG/pdf/ethanol.pdf. Rive, G. 1992. “Utilization of renewable energy sources and energy-saving technologies by small-case milk
plants and collection centres”. FAO Corporate Document Repository. Available at: http://www.fao.org/docrep/004/t0515e/T0515E03.htm.
Rouilly, A., Jorda, J., Rigal, L. 2006. “Thermo-mechanical processing of sugar beet pulp. I. Twin screw
extrusion process”, Carbohydrate Polymers, vol. 66, pp. 81-87. The Royal Society. 2008. “Sustainable biofuels: prospects and challenges”. Available at:
http://royalsociety.org/displaypagedoc.asp?id=28914. Saber, A.S. 1998. The Camel in Ancient Egypt. Salibi, A. 2007. “Marketing study for olive, olive oil and apple in Lebanon”. Available at:
http://www.agriculture.gov.lb/Studies/Bseline%20study%20for%20Apple%20and%20Olive%20June%202007-GTFS-REM-070-ITA.pdf. Accessed 20-2-09.
Samani, Z., Hanson, A., Smith, G. et al. 2008. Anaerobic digestion of municipal solid waste and
agricultural waste and the effect of co-digestion with dairy cow manure. ScienceDirect, Bioresource Technology, vol. 99, No. 17, pp. 8288-8293. Available at: http://www.sciencedirect.com/ science?_ob=ArticleURL&_udi=B6V24-4SH7DRD-1&_user=808330&_rdoc=1&_fmt=&_orig=search &_sort=d&view=c&_acct=C000044179&_version=1&_urlVersion=0&_userid=808330&md5=30851d03c1a320383d7ff6d937628af4.
Santucci, F.M. 2007. “Organic agriculture and olive oil production in the southern Mediterranean
countries”. OLIBIO Research Project. Available at: http://orgprints.org/13528/01/Santucci-OA_in_ the_Med.pdf.
Sawahel, W. 2009. “Sudan sets its sights on biofuels”. Science and Development Network. Available at:
http://www.scidev.net/. Sayegh, A. 2007. “Middle East poultry production sees reasons for optimism”, World Poultry, vol. 32, No.
4. Available at: http://www.worldpoultry.net/article-database/middle-east-poultry-production-sees-reasons-for-optimism-id1954.html.
Seebaluck V. “Sugarcane bagasse cogeneration as a renewable energy resource for Southern Africa”,
Presentation to the third International Green Energy Conference, 17-21 June 2007, Västerås Sweden. Available at: http://www.carensa.net/publications.htm.
Sfeir, J.P. President of Solarnet. Interview conducted by ESCWA on 4 February 2009, Beirut, Lebanon. Shaheen, H. “Management of olive mills wastes in the Palestinians territories” (in Arabic). Available at:
http://unpan1.un.org/intradoc/groups/public/documents/ARADO/UNPAN020869.pdf. Shaheen, H., Abdel Karim, R. 2007. “Management of olive-mills wastewater in Palestine”. An-Najah
National University, J. Res. (N. Sc.) vol. 21. Available at: www.najah.edu/researches/313.pdf.

69
Shukla, G.L., Prabhu, K.A. “Bio-gas production from sugarcane biomass and agro-industrial waste”. Available at: http://www.cababstractsplus.org/abstracts/Abstract.aspx?AcNo=19960302970.
Siemons R.V. 1993 “Carbonization of fresh bagasse”. Available at: www.cleanfuels.nl/ Projects%20&%20
publications/Bagasse%20Carbo&agglomeration.pdf. Southern Minnesota Sugar Cooperative. “Facts about sugar beets and beet sugar”. Available at:
http://www.sbreb.org/brochures/SugarCoop/. Sugar Engineers. “Sugar Factories of North and West Africa”. Available at: www.sugartech.co.za/factories/
list.php. Sugar Worker, News from the Sugar Sector, July-August 2005. Available at: www.iuf.org/cgi-
bin/dbman/db.cgi?db=default&uid=default&ID=2277&view_records=1&en=1. Summit Communications. 2009. “Sweet taste of success”. Available at: www.summitreports.com/sudan/
sugar.htm. TDC-Olive. “By-product reusing from olive and olive oil production”. Available at:
http://www.biomatnet.org/publications/1859bp.pdf. Thaker, H. 2008. “Almarai Company cash cow: Falcom Equity Research Report”. Available at:
www.moneyworks.ae/user_files/uploads/Almarai%20Company%20Dec%202008.pdf. Travis G-R. 2007. “An overview of sugar culture in Morocco, particularly within a Berber community in
Rastabouda” (thesis). Available at: www.ir.canterbury.ac.nz/bitstream/10092/1448/1/thesis_ fulltext.pdf.
Tsiftes, K., Fokaides, P.A. 2007. “Utilization of olive husk in energy sector in Cyprus”, Renewable Energy
Sources & Energy Efficiency, which is available at: www.tekes.fi/eu/fin/partnerinhaku/energia_ tiedostot/Fokaides_cypros.pdf.
United Nations Department of Economic and Social Affairs (DESA). 2007. “Small-scale production and
use of liquid biofuels in sub-Saharan Africa: Perspectives for sustainable development”. Available at: www.un.org/esa/sustdev/csd/csd15/documents/csd15_bp2.pdf.
United Nations Framework Convention on Climate Change (UNFCCC). 2006. “Clean Development
Mechanism Project Design”. Available at: www.cdm.unfccc.int/Panels/ssc_wg/SSCWG08_repan15_ Revisions_PDD_form.pdf.
United Nations data. Available at: www.data.un.org. United States Department of Agriculture (USDA). “USDA national agriculture statistics services – quick
stats”. Available at: www.nass.usda.gov. USDA Foreign Agricultural Service. 2009. “Syria: Trade Policy Monitoring – Annual 2009”. Available at:
http://www.fas.usda.gov/gainfiles/200903/146337511.pdf. Weima. 2009. “High performance briquetting system for volume reduction”. Available at:
http://www.bestmachinery.hu/pdf/weima-th-400-e.pdf. Wernery, U. “FMD and camelids: International relevance of current research”. Westlake, M. 2003. “Economics of main sub-sectors in Syrian agriculture”. Available at:
http://www.fao.org/docrep/006/Y4890E/y4890e0e.htm.

70
Wetlands International. 2008. “Biofuels in Africa: An assessment of risks and benefits for African wetlands”. Available at: http://www.aidenvironment.org/Upload/Files/xhtvkw/Biofuels%20in%20 Africa_study%20WI.pdf.
Widodo, T.W. and Hendriadi, A. 2005. “Development of biogas processing for small scale cattle farm in
Indonesia”. International Seminar on Biogas Technology for Poverty reduction and Sustainable Development. Available at: http://www.wcasfmra.org/biogas.htm.
World Report International Ltd. “Miracle of sugar in the desert”. Available at: www.worldreport-ind.com/
sudan/sugar.htm. Wright, L., Boundy, B., Perlack, B. et al. 2006. Biomass Energy Data Book. Edition 1. Available at:
http://www.osti.gov/bridge/purl.cover.jsp;jsessionid=1DC1D4FABA57FC32092F2CD5C189B30E?purl=/930823-9gRAKe/.
Wright, P. and Graf, K. 2003. “Anaerobic digester at AA Dairy: Case Study”. Manure Management
Program, Department of Biological and Environmental Engineering, Cornell University. Available at: http://files.harc.edu/Sites/GulfCoastCHP/CaseStudies/AnaerobicDigesterAADairy.pdf.
Wright, P. and Ma, J. 2003. “Anaerobic digester at Noblehurst Farms, Inc.: Case Study”. Manure
Management Program, Department of Biological and Environmental Engineering, Cornell University. Available at: http://files.harc.edu/Sites/GulfCoastCHP/CaseStudies/AnaerobicDigester Noblehurst.pdf.
Wright, P. and Ma, J. 2003. “Fixed film digester at Farber Dairy Farm: Case Study”. Manure Management
Program, Department of Biological and Environmental Engineering, Cornell University. Available at: www.manuremanagement.cornell.edu/Docs/Farber%20Case%20Study%2011-23-04(NEW).pdf.
Wright, P.E. 1998. “Anaerobic digestion and wetland treatment case study: Comparing two manure odour
control systems for dairy farms”. Available at: www.rcminternationalllc.com/RCM_Forms/RCM_ Paper_No_984105.pdf.
Wu, H.O. et al. 2001. “Biogas – is it a sustainable energy source?” Available at:
http://www.environmentalstudies.au.dk/publica/f2001hx-biogas.pdf. Zawya. 2007. “Syria industry: National sugar company’s Jandar plant set to start production sugar”.
Available at: http://www.zawya.com/countries/sy/macrowatch.cfm?eiusection=NATIONAL%20 SUGAR%20COMPANY’S%20JANDAR%20PLANT%20SET%20TO%20START%20PRODUCTION.
Zhang, X., Kilmer, R.L. and Muhammad, A. 2003. “A descriptive analysis of Egypt and Saudi Arabia who
import United States dairy products”. International Agricultural Trade and Policy Center. Available at: http://ideas.repec.org/b/ags/uflomo/15698.html.