increasing reading comprehension in first · pdf fileappendix d: running record form ... 13...
TRANSCRIPT

INCREASING READING COMPREHENSION IN FIRST AND SECOND GRADERS
THROUGH COOPERATIVE LEARNING
Amanda Hollingsworth, B.A. Jennifer Sherman, B.A. Cynthia Zaugra, B.A.
An Action Research Project Submitted to the Graduate Faculty of the
School of Education in Partial Fulfillment of the
Requirement for the Degree of Master of Arts in Teaching and Leadership
Saint Xavier University & Pearson Achievement Solutions, Inc.
Field-Based Master’s Program
Chicago, Illinois
December, 2007

i
TABLE OF CONTENTS
ABSTRACT ………………………………………………………………………………… iii CHAPTER 1: PROBLEM STATEMENT AND CONTEXT ………………………………..1 General Statement of the Problem …………………………………………………….1 Immediate Context of the Problem ………………………………………………........1 Local Context of the Problem ……………………………………………………........8 National Context of the Problem ……………………………………………………..13 CHAPTER 2: PROBLEM DOCUMENTATION …………………………………………...15 Problem Evidence……. ……………………………………………………………....15 Probable Causes...……………………………………………………………………..38 CHAPTER 3: THE SOLUTION STRATEGY ………………………………………………46 Review of the Literature ………………………………………………………………46 Project Objective and Processing Statements ………………………………………....61 Project Action Plan ………………………………………………………………...….62 Methods of Assessment ……………………………………………………………….66 CHAPTER 4: PROJECT RESULTS ……………………………………………………........68 Historical Description of the Intervention ………………………………………....….68 Presentation and Analysis of Results ……………………………………………...…..76 Conclusions and Recommendations ……………………………………………....…...86 REFERENCES …………………………………………………………………………....…...89 APPENDICES …………………………………………………………………………....……94 Appendix A: Student Survey About Reading and Comprehension…………………...94 Appendix B: Parent Survey About Reading and Comprehension………………...…..95

ii
Appendix C: Teacher Survey About Comprehension………………….….………….97
Appendix D: Running Record Form………………………………………………….99
Appendix E: Comprehension Checklists (Narrative and Expository) …..…………..100 Appendix F: Making Predictions Graphic Organizer……………….…………….....102
Appendix G: Identifying Main Idea and Details Graphic Organizer…………...........103 Appendix H: Identifying Characters Graphic Organizer…………………………….104
Appendix I: Identifying Problems and Solutions Graphic Organizer………………105 Appendix J: Summarizing Graphic Organizer……………………………………...106
Appendix K: Making Connections Graphic Organize…...……………………..……107 Appendix L: Comprehension Strategies Review Graphic Organizer……….……….108
Appendix M: Page from a Reader’s Theater Script………………….……….……....109

iii
ABSTRACT
Reading comprehension was a concern for the three teacher researchers at both research sites. The purpose of this action research project was to increase reading comprehension by using cooperative learning. There were 51 first and second grade students, 28 elementary teachers, and 51 families of the first and second grade students involved for a total of 184 participants. This action research project was implemented during the dates of January 29, 2007 and May 11, 2007. Low test scores, poor decoding skills, and the lack of ability to answer comprehension questions appropriately characterized the contributing factors to the problem of low reading comprehension. Evidence was collected and documented through the use of a student survey, a parent survey, a teacher survey, running records, a comprehension checklist for a narrative text, and a comprehension checklist for an expository text. The purpose of the student survey was to gain insight on the students’ perceptions of the importance of reading and how well they understood what they read. The problem did not seem to be in what the children think about reading. The purpose of the parent survey was to gain insight on the parents’ perceptions of their family’s reading habits at home. The parent survey showed that the parents felt they were appropriately helping their children with reading at home. The purpose of the teacher survey was to gain insight regarding other teachers’ perceptions of reading comprehension, problems they encountered, and solutions they implemented in their classrooms. Most teachers felt that reading comprehension was a problem in their classrooms to some degree. The purpose of the running records was to find each student’s instructional reading level so that comprehension activities could be implemented for every student with a text that could be easily read by them. Over one-fourth of the students were reading and comprehending below grade level. The purpose of the comprehension checklist was to gain a baseline assessment of what comprehension strategies had been mastered and are used regularly by the students. There was a wide range of ability levels when it came to the knowledge of comprehension strategies. The teacher researchers chose three interventions to implement. Cooperative learning, guided reading, and reader’s theater are all ways that students can work together to better comprehend what they are reading. Cooperative learning is a way to have students work together to reach a goal (O’Donnell, & O’Kelly, 1994). Guided reading is a program where there is a coherent plan of skills development, assessment, and rich children’s literature used with groups of students at the same ability level (Galloway-Bell, 2003). Reader’s Theater is the use of drama or re-enacting a piece of literature which then leads to a better understanding of characters, plot, and meaning (Annarella, 1999). Cooperative learning as a method of teaching turned out to be a valuable tool to help students learn comprehension strategies while encouraging positive interactions among peers. The students achieved academic success by increasing their reading levels and knowledge of comprehension skills, and there was also an increase in enthusiasm and motivation towards reading.

1
CHAPTER 1
PROBLEM STATEMENT AND CONTEXT
General Statement of the Problem
Reading comprehension was a concern at both research sites. Low test scores, poor
decoding skills, and the lack of ability to answer comprehension questions appropriately
characterized the contributing factors to this problem. Evidence was collected and documented
through the use of a student survey, a parent survey, a teacher survey, running records, and a
comprehension checklist for both narrative and expository texts.
Immediate Context of the Problem
This action research project was conducted by three teacher researchers that were
represented at Sites A and B in different communities in northern Illinois. Site A was a public
elementary school where the documentation and intervention was being conducted in a first
grade classroom. Site B was a public elementary school where the documentation and
intervention was being conducted in two separate second grade classrooms. The following
information came from the Illinois State Board of Education (n.d.), unless otherwise noted.
Site A
The elementary school in this site had a student body population of 678 students,
representing many different ethnic backgrounds. The school percentages of ethnicity appear to
have reflected the district’s percentages, which is why only the school information is included.
However the ethnic backgrounds varied drastically from the state. See Table 1 below for
percentages. The gender make up of the school was not addressed in the information from the
Illinois State Board of Education.

2
Table 1
Racial/Ethnic Background and Total Enrollment by Percentage
Site A
n
Caucasian
Hispanic
Asian/ Pacific
African American
Multiracial
Native American
School
678
83.0
7.4
3.1
2.8
2.7
1.0
State 2,062,912 56.7 18.3 3.7 20.3 0.7 0.2
Of the school’s total population of 678, 12.5% (n=85) came from low-income families.
According to the Illinois State Board of Education (n.d.), low-income families are defined as,
“Students coming from families receiving public aid; live in institutions for neglected or
delinquent children; are supported in foster homes with public funds; or are eligible to receive
free or reduced-price lunches” (p. 1). The school had a 0% limited-English-proficient rate which
differs from the state rate of 6.6%. It had an 11.7% mobility rate which compared to the state’s
rate of 16.1%. The attendance rate of Site A was 94.7% which was very similar to the 93.9% of
the state. Site A had a 0% chronic truancy rate. The state had a 2.2% chronic truancy rate.
The school district in which Site A was located employed a total of 165 teachers. The
district had four elementary buildings, one of which was grades pre-kindergarten through one,
and the other three were grades two through five. The district also had one middle school
building. Of the 165 teachers; 98.8% (n=163) were Caucasian, and 1.2% (n=2) were African
American. Eighty-three and nine tenths percent of the teachers were female (n=138) and 16.1%
(n=27) were male. The average teacher salary in Site A’s district was $44,113 compared to
$55,558 for the state. Within the district the average years of teaching experience was about 10.
Approximately 39% (n=64) of the teachers in the district had bachelors degrees and
approximately 61% (n=101) had a masters degree and above. For the district the average student
to teacher ratio was about 19:1. The average class size was approximately 21 students. In the

3
2003-2004 academic school year, $4,154 was spent on instructional expenditures and $7,498 on
operating expenditures, per pupil. Instructional expenditures as defined by the Illinois State
Board of Education (n.d.), “…includes the direct cost of teaching pupils or the interaction
between teachers and pupils. Operating expenditures per pupil includes the gross operating cost
of a school district excluding summer school, adult education, bond principal retired, and capital
expenditures” (p. 3). These expenditures per pupil were lower than the state averages of $5,216
and $8,786, respectively.
The elementary building at Site A had a traditional self-contained curriculum with heavy
emphasis on the core subjects: mathematics, reading, science, and social studies. Site A’s
students’ overall performance on all state tests was 89.1% for 2004-2005 which is higher than
that of the district’s percentage of 75.5 and the state’s percentage of 64.9 (Illinois State Board of
Education, n.d.).
Site A had one principal, one assistant principal, one nurse, three secretaries, nine
kindergarten teachers, 13 first grade teachers, two first grade transitional teachers, two multiage
teachers, six early childhood teachers, two physical education teachers, one music teacher, one
strings teacher, four speech pathologists, two enrichment teachers, one occupational therapist,
one psychologist, one kindergarten skills builder teacher and two power reading teachers, three
custodians, four cooks, three recess supervisors, and 16 paraprofessionals. Of all the teachers
(n=63) there were two male teachers, and one male paraprofessional. The strings and music
teachers were also male.
At this school there were some special programs. There was an after school art program,
developmental kindergarten, transitional classes, kindergarten skills builder classes, enrichment
programs, and a power reading program.

4
The elementary building at Site A opened in 2002. It was a one story building that was
organized in villages, or pods. There were 36 classrooms (six classrooms in each of six villages),
two gymnasiums, one computer lab, two music rooms, one library, one conference room, team
rooms in each village, and offices for the speech pathologists, psychologist, and other supporting
staff. In each classroom there were anywhere from one to three computers with internet access
for the students.
After obtaining information about the school, district, and area, the teacher researchers
concluded that there was a growing population within the school, district, and area. This was
causing overcrowding in the buildings. The overcrowding was seen more at the other schools in
the district, but it was starting to affect Site A. The referendum that was on the bill in 2005 did
not pass. Therefore, the school district did not get the tax raise that would have helped build
more schools. The land had already been purchased, but there was no money available to build
the school or pay the staff that would work there. The referendum will be back on the bill in the
spring of 2007.
This school was also a big advocate of having programs in place to help students who
were struggling academically. There was a Power Reading Program that was in place to help the
bottom 20% of first graders. These were the first graders who scored in the lowest 20% on the
reading assessment taken in the fall. There was another program for kindergarten students called
Kindergarten Skill Builders. This program was similar to the Power Reading Program in that the
bottom 20% of students were pulled out of the classroom everyday for 30 minutes to work on
reading skills. Even though the school had these programs, there was more than 20% of the
student population that was reading below grade level. Due to this problem, reading skills and

5
comprehension for all students was not as high as it could have been. Therefore, doing more
work and implementing strategies to increase comprehension skills was essential.
Site B
The elementary school in this site had a student body population of 488, representing
many different ethnic backgrounds. The school percentages of ethnicity appear to have reflected
the district’s percentages, which is why only the school information is included in Table 2.
However, the ethnic backgrounds at this site differed drastically from the state percentages
(Table 2).
Table 2
Racial/Ethnic Backgrounds of Students by Percentage
Site B
n
African American
Hispanic
Caucasian
Multiracial
Asian/ Pacific
Native American
School 488 41.0 35.7 16.6 6.6 0.2 0.0 State 2,062,912 20.3 18.3 56.7 0.7 3.7 0.2
Of the 488 students, 79.9% (n=390) were considered to be low-income, which was significantly
higher than the state percentage of 40%. Low income was defined by the Illinois State Board of
Education (n.d.) as “…students who come from families receiving public aid, live in institutions
for neglected or delinquent children; are supported in foster homes with public funds; or are
eligible to receive free or reduced-price lunches” (p. 1). The population of students with limited-
English proficiency was 11.3%, which was about twice as much as the state percentage of 6.6%.
Limited-English proficient students are defined by the Illinois State Board of Education (n.d.) as,
“those students eligible for transitional bilingual programs” (p. 1). The attendance rate at Site B
was 93.7% with a mobility rate of 49.5% and a chronic truancy rate of 5.8%. The gender make
up of the school was not mentioned by the Illinois State Board of Education.

6
The school district, which included five elementary schools and one middle school,
employed a total of 163 full-time equivalent teachers, 83.4% (n=136) were female and 16.6%
(n=28) were male. Table 3 shows the ethnicity of the teacher population, which was
predominantly Caucasian.
Table 3
Racial/Ethnic Backgrounds of Teachers by Percentage
Site B
n
Caucasian
African American
Hispanic
Asian/ Pacific
Native American
District 163 84.7 10.4 3.7 1.2 0.0
Of the 163 full-time equivalent teachers in the district, 39.9% (n=65) held bachelors degrees and
60.1% (n=98) held masters degrees or above. All classes were taught by highly qualified
teachers. The average years of experience a teacher had in this district was 13.5, while the
average salary for a teacher was $59,712. The average class size was 22 students, with a student
to teacher ratio of 21:1. In the 2003-2004 academic school year, $4,962 was spent on
instructional expenditures, and $7,675 on operating expenditures, per pupil. Instructional
expenditures as defined in the Site B Illinois School Report Card (n.d.), “…includes the direct
cost of teaching pupils or the interaction between teachers and pupils. Operating expenditures per
pupil includes the gross operating cost of a school district excluding summer school, adult
education, bond principal retired, and capital expenditures” (p. 3). These expenditures per pupil
were lower than the state averages of $5,216 and $8,786, respectively.
According to the information provided by the Illinois State Board of Education, the
primary classroom teachers at Site B devoted 140 minutes to English/language arts, 60 minutes
to mathematics, 30 minutes to science, and 30 minutes to social studies per day. The students
received physical education two times a week for 35 minutes, technology class with a laboratory

7
technician two times a week for 35 minutes, and library with a paraprofessional once a week for
35 minutes.
Site B’s students’ overall performance on the Illinois Standards Achievement Test was
68% in the 2004-2005 school year. This percentage was higher than the district percentage of
56.4%, and it was very comparable to the state percentage of 69.2%. Site B’s students’ overall
performance on the Illinois Measure of Annual Growth in English test was 87.5% in the 2004-
2005 school year. This percentage was dramatically higher than the district percentage of 67.8%
and the state percentage of 49.3% (Illinois State Board of Education, n.d.)
Administrators, teachers, and support staff made up where the action research project was
being implemented. In 2005 there was one superintendent, one principal, one assistant principal,
two social workers, two speech pathologists, one occupational therapist, one physical therapist,
and a psychologist. There were 28 teachers, one reading intervention specialist, eight
paraprofessionals, one secretary, one health aide, one custodian, three kitchen staff members, and
three recess aides.
The teacher researchers at Site B were knowledgeable of their school’s participation in
the 21st Century program called Successfully Targeting and Reaching Students. This was an
extended day program that offered tutoring, homework assistance, physical activities, technology
activities, art activities, and field trips. Site B was also highly successful in intramural sports.
Site B was built in 1959. It was a two-story brick building with 25 classrooms. There was
one computer laboratory, one learning center, and one gymnasium/cafeteria. The offices for
school psychology, counseling, and speech pathology were located on the lower level. The
principal, assistant principal, secretary, and health aide had offices at the entrance on the first

8
floor. The school playground was a large blacktop area with two separate areas of playground
equipment.
Technology was available to the staff and students of Site B. Computers and Internet
access were available in each classroom. Site B also had a laboratory that consisted of 35
computers with internet access, and the students visited the laboratory twice a week.
After reviewing the data from the Illinois State Board of Education, we have found that
there is an increasing Hispanic population within Site B’s community, which in turn presents
new challenges for us to teach reading skills and comprehension due to the language barriers and
lack of prior knowledge. Students of all different ethnicities, learning styles, and abilities enter
our classrooms each year presenting the challenge for us to provide instruction appropriate to
meet the needs of all students.
Local Context of the Problem
The two sites where the research was conducted were in two very different areas of Lake
County. The teacher researchers felt it was necessary to describe the two different communities
in detail to give a clear representation of the background and demographics of the participants
involved.
Community A
Site A is located in northwest Illinois in a suburban area. It is halfway between Chicago
and Milwaukee in Lake County. The town in which Site A is located had a population of 8,788
according to the 2000 U.S. Census Bureau. It was also stated that the estimated 2004 population
was 11,223. The community has seen an overwhelming increase in population over the past 14
years. In 1990 the population was 6,105 (U.S. Census Bureau, Population Finder, 2000). Males
make up 48.9% of the population and females 51.1%. The median age of people in this research

9
city was 33.7 years of age. In Site A’s research city, the median household income in 1999 was
$56,481 (U.S. Census Bureau, Census 2000 Demographic Profile Highlights, 2000). The poverty
level of Site A’s community was lower than the country’s level. The individual poverty level was
3.9% in the city of Site A and 9.2% in the country. The family poverty level was 2.3% in the city
of Site A and 12.4% for the country (U.S. Census Bureau, Census 2000 Demographic Profile
Highlights, 2000). The majority of Site A’s community was Caucasian. See Table 4 for the racial
background of this community (U.S. Census Bureau, Census 2000 Demographic Profile
Highlights, 2000).
Table 4
Racial/Ethnic Background of Population by Percentage
n
Caucasian
Hispanic
Asian
African American
Other
8,688 95.2 2.0 1.2 1.1 0.5
In this community, 89.5% had a high school diploma or higher and 26.7% had a bachelors
degree or higher (U.S. Census Bureau, Census 2000 Demographic Profile Highlights, 2000).
In Site A’s community, the average household size was 2.72 people, with the average
family size being slightly higher at 3.20 (U.S. Census Bureau, Census 2000 Demographic Profile
Highlights, 2000). There was 70.1% of the population in the labor force (U.S. Census Bureau,
Census 2000 Demographic Profile Highlights, 2000). Of those industries that provided
employment, 20.8% people worked in manufacturing, 15.8% worked in retail, and 15.6%
worked in education, health, and social services in this community. However, this does not
reflect what the citizens of this community do for employment because only 21.3% actually

10
work in this community (city-data.com, n.d.). The City-data.com crime index in 2003 was 113.3
which was much lower than the national average of 329.7 (city-data.com, n.d.).
The research city is a prospering community. It has seen a large population growth in the
last couple of years. Many new retail establishments and housing developments have been
constructed.
The name of the community was the name of an early city in Christian history. The early
citizens were dedicated Protestants. At its beginning it was a mecca for abolitionism. In the
1850s settlers were mainly from England, Germany, and Ireland. Because this community was at
the end of a main railway system, tourism was big after 1885. People came here to use the lakes
for boating and fishing. It was a big vacation town for people from Chicago. At first, farmers
used to rent out rooms to visitors, and then hotels and summer houses were built (Wikipedia,
2006). The town always had a small town feel, but now it is really growing (Encyclopedia of
Chicago, 2005). There are small shops in the downtown area that people still frequent. This
community is on the Chain ‘O Lakes, so there are lakes to use for recreation. In the summer
people come here to go boating, fishing, and to take part in other recreational water activities. In
the winter, ice fishing, snowmobiling and skiing are popular activities. There is also a good
performing arts scene (Wikipedia, 2006).
Within the district there was four elementary buildings and one middle school. This
community feeds into one local high school. The mission statement of District A is, “The
mission of District A is to educate our children to become life long learners by providing a child
centered curriculum that challenges the potential of all learners,” (Site A District A, n.d.).
Sixty-seven and one-half percent of the revenue comes from local property taxes. According to
the Illinois State Board of Education (n.d.), the 2002 total school tax rate per $100 was $2.58. As

11
stated before, the 2003-2004 instructional expenditure per pupil was $4,154 and the operating
expenditure per pupil was $7,498 (Illinois State Board of Education, n.d.). At Site A there was a
computer laboratory for all students and teachers to access. Each classroom had between two and
four computers in it.
After looking at the demographics of the community the teacher researcher for Site A
saw no direct impact on the problem of students’ reading comprehension.
Community B
Site B is located halfway between Milwaukee and Chicago in Lake County. The
community covers approximately eight square miles (City-Data.com, n.d.).
According to the United States Census Bureau (2000), the population of the community
was 29,811, and there were many diverse ethnicities within the community (Table 5).
Table 5
Racial/Ethnic Backgrounds of Population by Percentage
n
Caucasian
African American
Hispanic
Other
Multiracial
Asian/ Pacific
American Indian
28,811 56.8 22.4 14.0 3.0 2.0 1.5 0.3
The median age of the population was 31.5, with 8.5% under five, 68.1% 18 and over, and 8.7%
over 65 (United States Census Bureau, 2000). In 2000, of the population 25 years and over,
approximately 80.4% had received a high school diploma, and 16% had received a bachelors
degree or higher (United States Census Bureau, 2000). The median household income in 1999
was $48,101, and 8.9% of the families’ incomes were below the poverty level (United States
Census Bureau, 2000). This percentage is in stark contrast to the 79.9% of families below
poverty in Site B, as stated previously from the Illinois State Board of Education (n.d.).

12
In 2000, the average number of people per household was 2.91 (United States Census
Bureau, 2000). There was 67.9% of the population over 16 employed in the labor force (United
States Census Bureau, 2000). Employment opportunities available in this community consisted
of 20.9% in manufacturing positions, 19.8% in education, health, and social services, and 12.1%
in retail trade positions, but only 16% of the community’s population actually worked within the
community (City-Data.com, n.d.). Six percent of the community’s population was unemployed
(City-Data.com, n.d.). The City-Data.com crime index in 2003 was 384.4, which was higher than
the national average of 329.7 (City-Data.com, n.d.). The crime index of 384.4 was also higher
than the year 2002, which was 348.9, and the higher crime rate is represented by an increase in
rapes, robberies, larceny counts, and assaults (City-Data.com, n.d.). The crime index in the city
of Site B is significantly higher than that of Site A (113.3).
Originally home to the Potawatomi Indians, the community was founded in 1901 to
provide a community where residents would commit to living clean lives, have healthy habits,
and work together for the honor and glory of God (Welcome to the City of Site B, Illinois, 2006,
History of Site B). This community was one of the first planned cities made to look like the
British flag, with all of the main roads leading to the center of the city (Welcome to the City of
Site B, Illinois, 2006, History of Site B). Efforts were also made to name streets after biblical
references (Welcome to the City of Site B, Illinois, 2006, History of Site B). Many of the
residents in this community were born and raised here, and can also trace their heritage back
several generations in the community (Welcome to the City of Site B, Illinois, 2006, History of
Site B). There were many new retail establishments, several new housing additions, one business
park, and one industrial park being developed in the community (Welcome to the City of Site B,
Illinois, 2006, City of Site B Headline Developments March 2006). This community was home to

13
Illinois Beach State Park, three golf courses, and a Park District which includes 43 parks over
575 acres (Welcome to the City of Site B, Illinois, 2006, The Place for Family Fun).
This community was made up of five elementary schools and one middle school that fed
into the local high school, along with elementary and middle school students from two other
districts. The district had one superintendent, and one assistant each for curriculum and
instruction, special services, and business. The mission statement of Site B was “Excellence
Without Exception” (Site B Elementary School District B, 2005). Forty-six percent of the
revenue came from local property taxes, and the 2002 total school tax rate per $100 was $3.99
(Illinois State Board of Education, n.d.). As stated previously, $4,962 was used for instructional
expenditure and $7,675 was used for operating expenditure per pupil in the 2003-2004 school
year (Illinois State Board of Education, n.d.). Technology was available to the staff and students
of Site B. Computers and Internet access were available in each classroom. Site B also had a
laboratory that consisted of 35 computers with Internet access.
After obtaining the demographic information about the community, the teacher
researchers saw a vast discrepancy between the documented information and the reality of the
demographics at Site B. This discrepancy is due to school boundaries. The poverty rate and the
percentages of ethnicity were much higher in the population of Site B (Illinois State Report Card,
n.d.). The teacher researchers were curious to see if there was a correlation between the increase
in the Hispanic population, the low socioeconomic status, and the students’ reading skills,
including comprehension.
National Context of the Problem
There are many factors that contribute to students’ lack of reading comprehension skills.
One in three students have difficulty learning to read (Mathes, Fuchs, & Fuchs, 1997). When

14
students are focusing all of their efforts on decoding words, it hinders the comprehension skills
needed to get meaning out of the text (Eldridge, 1990). Students who have difficulty
comprehending a text do not have the basic reading comprehension strategies to use as tools to
help them. Unfortunately, there have not been very many efforts to put together useful reading
strategies to help improve reading comprehension (Gauthier, 2001). In order to be a successful
reader, students need good vocabulary skills and a background of experiences that they can
access, which many students do not have (Albers & Foil, 2003). All of these factors, plus many
more, contribute to poor reading comprehension. This is a marked problem which causes both
educators and students to have negative experiences and poor results.
15
CHAPTER 2
PROBLEM DOCUMENTATION
Evidence of the Problem
The purpose of this action research project was to increase reading comprehension by
using cooperative learning. There were 51 students, 28 elementary teachers, and 51 families of
the first and second grade students involved for a total of 184 participants. Evidence was
collected and documented through the use of a student survey (Appendix A), a parent survey
(Appendix B), a teacher survey (Appendix C), running records (Appendix D), a comprehension
checklist for a narrative text (Appendix E), and a comprehension checklist for an expository text
(Appendix F). This action research project was implemented during the dates of January 29,
2007 and May 11, 2007.
Student Survey
The purpose of the survey was to gain insight on the students’ perceptions of the
importance of reading and how well they understood what they read. The survey was
administered once during the week of January 29, 2007. Twenty students from one first grade
classroom at Site A and 47 students from two second grade classrooms at Site B were surveyed
for a total of 66 students. The teacher researchers only used the data from students who returned
the parent consent form, which totaled 51 students, or 77%. There were 19 students from one
first grade classroom at Site A and 32 students from two second grade classrooms at Site B. The
student survey consisted of five questions that could be answered with yes, no, or sometimes.
The survey was distributed to each student to complete. The students had privacy folders framing
the parameter of their desk to ensure that no other students would see what they were writing.
The teacher researchers read each question aloud and gave the students an appropriate amount of
16
time to answer. When the students were finished, they turned in the surveys to a basket in the
back of the room. They did not put their names on the surveys to ensure anonymity. A copy of
the student survey about reading comprehension can be found in Appendix A.
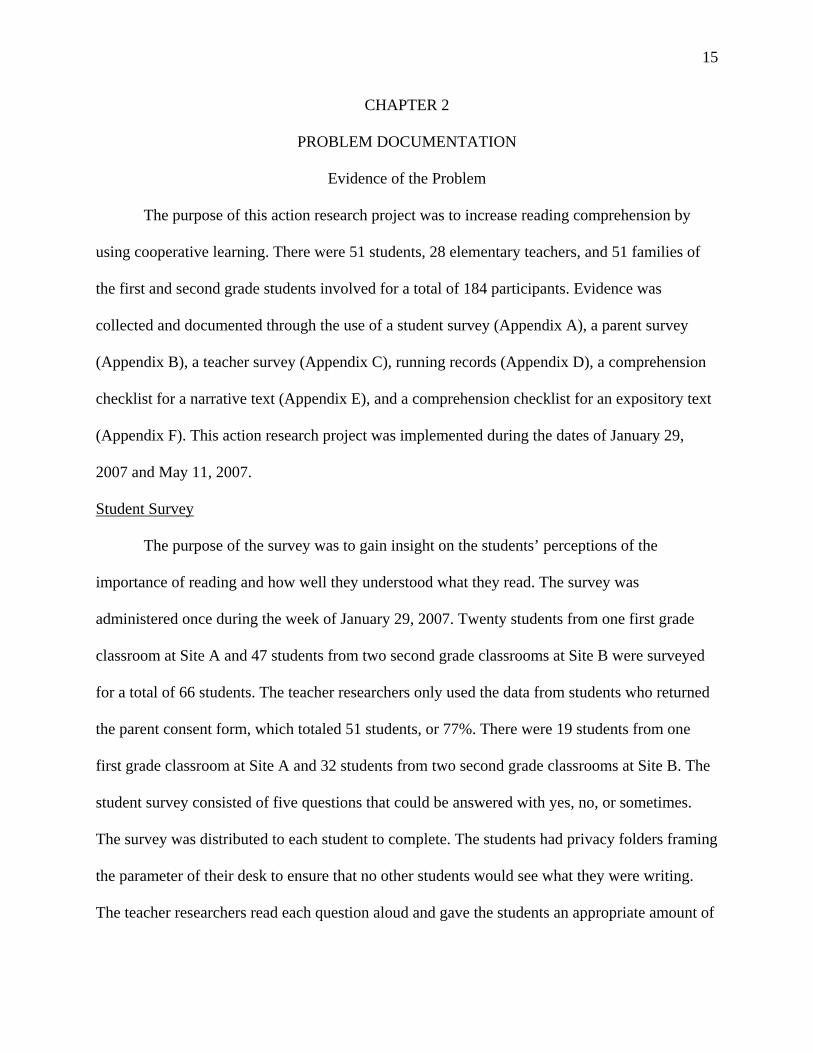
Students were asked if they liked to read (n=51). Figure 1 shows that 65% (n=33) of the
students liked to read always or often. While 35% (n=18) of the students like to read sometimes
or never like to read.
Always40%
Often25%
Sometimes25%
Never10%
Figure 1: Enjoyment of Reading (n=51)

17
Students were asked if they thought reading was important (n=51). Figure 2 shows that
78% (n=40) of the students felt that reading was always or often important. The remaining 22%
(n=11) of the students felt that reading was sometimes or never important.
Always70%
Often8%
Sometimes20%
Never2%
Figure 2: Importance of Reading (n=51)

18
Students were asked if they understood the books that they read (n=51). Figure 3 shows
that a marked number of students (74%, n=38) felt that they always or often understood what
they read, while 26% (n=13) of students felt that they sometimes or never understood what they
read.
Always 56%
Often18%
Sometimes20%
Never6%
Figure 3: Reading Comprehension (n=51)

19
Students were asked if they learned skills and strategies at school to help them understand
what they read (n=51). Figure 4 shows that a noteworthy amount of students (78%, n=40)
thought that they always or often learned strategies at school to help them understand what they
read. Twenty-two percent (n=11) of the students thought that they sometimes learned strategies
at school to help them understand what they read.
Always51%
Often27%
Sometimes22%
Never0%
Figure 4: Learning Reading Strategies at School (n=51)

20
Students were asked if they read at home (n=51). Figure 5 shows that 59% (n=30) of
students always or often read at home. Forty-one percent (n=21) of students sometimes or never
read at home.
Always41%
Often18%
Sometimes31%
Never10%
Figure 5: Reading at Home (n=51)
Summary
After reviewing the data from the student survey, the teacher researchers realized that the
students like to read (Figure 1) and they think that it is important (Figure 2). The students also
thought that they understood the material that they read (Figure 3). All of the students (n=51) felt
that they learned ways always, often or sometimes to help them understand what they read
(Figure 4). Looking at the surveys the teacher researchers also saw that most students (90%,
n=46) read at home always, often, or sometimes (Figure 5). The teacher researchers have found
that it is generally the other 10% of students who do not read at home that are the ones who are
struggling academically. The problem does not seem to be in the way that the children view the
process of reading or in the way that they think about reading.
21
Parent Survey
The purpose of the survey was to gain insight on the parents’ perceptions of their
family’s reading habits at home. The survey was administered once to 20 families of first grade
students from one classroom at Site A and 47 families of second grade students from two
classrooms at Site B for a total of 67 families during the week of January 29, 2007. The teacher
researchers collected a total of 33 parent surveys, with a return rate of 49%. The surveys were
sent home with each student with an attached envelope with the teacher researcher’s name on the
outside. The parents were asked to complete the survey at home and send it back to school in the
attached envelope with their child. They were asked not to put their name anywhere on the
survey. When the survey was returned, the children put their envelope in a basket in the back of
their classroom to ensure anonymity. The parent survey consisted of three questions that could
be answered with yes, no, sometimes or never, and two questions that could be answered by
circling all answers that applied. A copy of the parent survey can be found in Appendix B.

22
Parents were asked if they read at home (n=33). Figure 6 shows that 61% (n=21) of
parents always or often read at home. It also shows that 39% (n=13) of parents sometimes read at
home.
Alw ays 35%
Often26%
Sometimes39%
Never0%
Figure 6: Reading at Home (n=33)
23
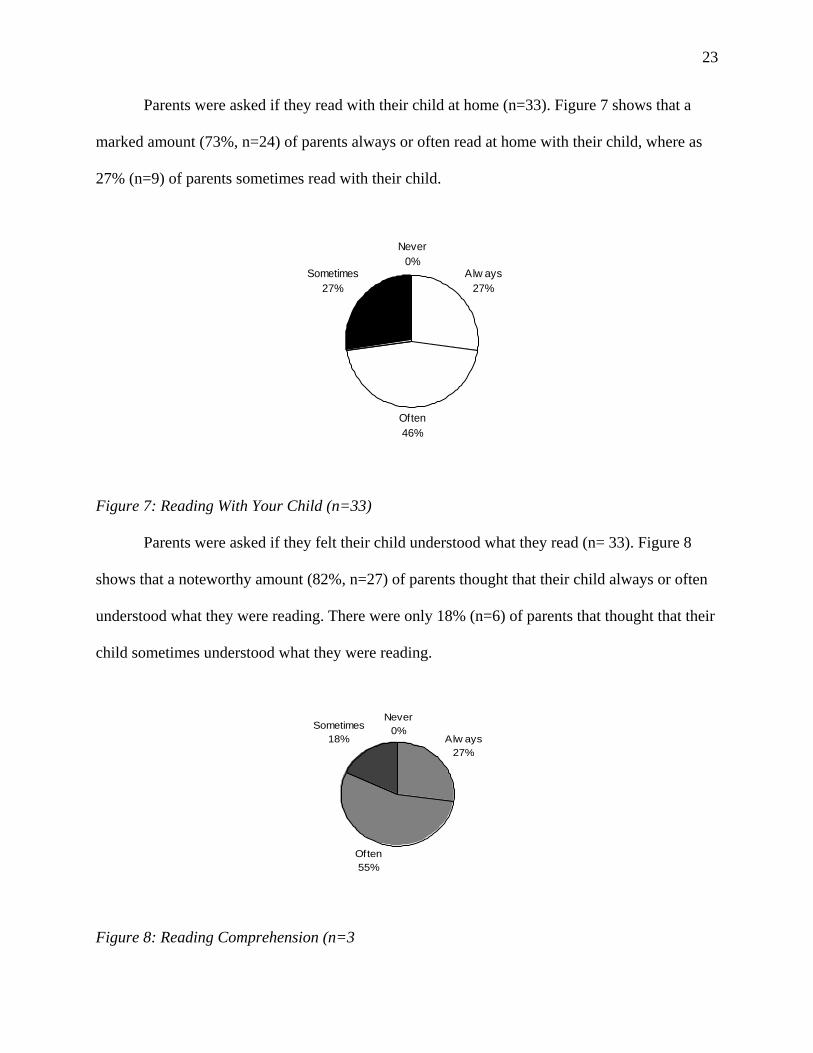
Parents were asked if they read with their child at home (n=33). Figure 7 shows that a
marked amount (73%, n=24) of parents always or often read at home with their child, where as
27% (n=9) of parents sometimes read with their child.
Alw ays 27%
Often46%
Sometimes27%
Never0%
Figure 7: Reading With Your Child (n=33)
Parents were asked if they felt their child understood what they read (n= 33). Figure 8
shows that a noteworthy amount (82%, n=27) of parents thought that their child always or often
understood what they were reading. There were only 18% (n=6) of parents that thought that their
child sometimes understood what they were reading.
Alw ays 27%
Often55%
Sometimes18%
Never0%
Figure 8: Reading Comprehension (n=3

24
Parents (n=33) were asked to identify any of the strategies that they used with their child
before, during, or after they read. Please refer to Figure 9 to see that 61% (n=20) of parents
retold or summarized, 55% (n=18) of parents worked on identifying characters, setting, plot,
problems, and solutions with their child, and 45% (n=15) of parents discussed real and make-
believe.
2018
1513 13 12
10
0
5
10
15
20
25
Retell orSummarize
Identify storyelements
Discuss realand make-
believe
Relate to otherexperiences
Find the mainidea anddetails
MakePredictions
Compare andContrast
Activities Done Before, During, or After Reading
Freq
uenc
y of
Res
pons
e
Figure 9: Activities Done Before, During, or After Reading. (n=33)

25
Parents (n=33) were asked to identify the kinds of books they read with their child at
home most often. They could circle as many as they would like. Figure 10 shows that 33%
(n=11) read nonfiction, 61% (n=20) read fiction, 79% (n=26) read picture books, and 42%
(n=14) read chapter books.
26
20
1411
0
5
10
15
20
25
30
Picture Fiction Chapter Non-f iction
Kinds of Books
Freq
uenc
y of
Res
pons
e
Figure 10: Kinds of Books (n=33)
Summary
After looking at the data from the parent survey, the teacher researchers saw that the
parents read at home (Figure 6) and they also read at home with their children to some degree
(Figure 7). They worked on strategies when they read (Figure 9), so when they are reading it is
not just a mindless task. The parents also felt that their child understood what they read always,
often or sometimes (Figure 8). None of the parents chose never for any of the questions. The
survey also revealed that most students chose fiction and picture books (Figure 10).
Teacher Survey
The purpose of the survey was to gain insight regarding other teachers’ perceptions of
reading comprehension, problems they encounter, and solutions they implement in their
classrooms. The survey was administered once to 30 kindergarten though second grade teachers

26
at Site A and 20 kindergarten through sixth grade teachers at Site B for a total of 50 teachers.
The teacher researchers used the data from the 28 surveys that were returned, for a 56% return
rate. The surveys were distributed during the week of January 29, 2007 to the teachers in their
personal school mailboxes. They had one week to complete the survey and return it in an
attached envelope to the teacher researchers’ personal school mailboxes. The teachers were
asked not to put their names on the surveys to keep the information anonymous. The teacher
survey about comprehension consisted of four questions that could be answered with a Likert
scale. The answers that could be circled included: consistently (4), most of the time (3),
sometimes (2), and never (1). There was also one question that could be answered by circling all
of the answers that applied to their classroom or their instruction. A copy of the classroom
teacher survey about comprehension can be found in Appendix C.
Teachers were asked if they saw students making connections to what they were reading
and to their background knowledge. Please refer to Figure 11 to see that 50% of the teachers
(n=14) felt that their students made connections consistently or most of the time. Half of the
teachers (50%, n=14) felt that their students made connections sometimes.
Consistiently7%
Most of the time43%
Sometimes50%
Never0%
Figure 11: Making Connections (n=28)

27
Teachers were asked if they saw low reading comprehension as a problem in their
classroom. Figure 12 shows that 67% (n=19) of teachers felt that it was a moderate or significant
problem.
Not a problem4%
Slight Problem29%
Moderate Problem
42%
Signif icant Problem
25%
Figure 12: Comprehension Problems (n=28)

28
Teachers were asked if they felt prepared and confident to teach comprehension strategies
with the materials and resources available to them. Figure 13 shows a marked amount of teachers
(75%, n=21) felt extremely and mostly confident and prepared. Twenty-five percent (n=7) felt
somewhat confident and prepared.
Extremely Prepared
18%
Mostly confident and
prepared57%
Somew hat confident and
prepared25%
Not at all confident and
prepared0%
Figure13: Teacher Preparedness (n=28)
Teachers were asked to indicate what reading strategies they used in their classrooms to
promote reading comprehension. The participants (n=28) were able to circle all that apply to
them. Figure 14 shows that 93% (n=26) used direct instruction, 89% (n=25) used guided reading,
and 89% (n=25) used cooperative learning groups. Fifty-four percent (n=15) used other
strategies or activities. The other activities included silent reading, graphic organizers, running
records, self-selected reading, phonics, read alouds, research, skill packets, tic-tac-toe activities,
shared reading, and books on tape. Silent reading, graphic organizers, running records, self-

29
selected reading, phonics, research, skill packets, tic-tac-toe activities, and books on tape were all
selected once. Read-alouds were selected four times and shared reading was selected two times.
26 25 25
1512 12
0
5
10
15
20
25
30
Direct
Instru
ction
Guided
Rea
ding
Coopera
tive L
earni
ng/G
roups
Other
Reader'
s Thea
ter
Litera
ture C
ircles
Classroom Strategies
Freq
uenc
y of
Res
pons
es
Figure 14: Classroom Strategies (n=28)

30
Teachers were asked if they felt that their students were motivated to read. Figure 15
shows 68% (n=19) of teachers felt that their students were always or often motivated to read.
Thirty-two percent (n=9) felt that their students were sometimes motivated.
Alw ays21%
Often47%
Sometimes32%
Never0%
Figure 15: Student Motivation (n=28)
Summary
The teacher survey gave the teacher researchers insight into what was going on in other
classrooms in their schools. Seven percent (n=2) of the teachers felt that students consistently
made connections between what they read and their background knowledge. That is not a high
number. Only 4% (n=1) of teachers felt that comprehension was not a problem. Most teachers
(96%, n=27) thought that this was a problem to some degree. Even though most teachers thought
it was a problem, 75% (n=21) felt that they were extremely or mostly confident and prepared to
teach reading comprehension. When the teachers were instructing, they used a variety of
strategies and activities to teach comprehension.
Running Records
The purpose of this instrument was to find each student’s instructional reading level.
Once this level was found, the teacher researchers could implement comprehension activities for

31
every student with a text that could be easily read by them. This way, decoding was not an issue
and comprehension could be the main focus. Nineteen students from one first grade classroom at
Site A and 32 students from two second grade classrooms at Site B, for a total of 51 students,
were given a book that they had never read that was close to their instructional reading level. The
teacher researchers administered one running record per student as a pre-documentation
assessment during the weeks of January 29, 2007 and February 5, 2007, and again as a post-
documentation assessment during the week of April 30, 2007. The set of books used to
administer the running records had 35 levels of books. First graders should be reading and
comprehending at a level 16 by the end of school year, and second graders should be reading and
comprehending at a level 22 by the end of the school year. The teacher researchers knew the
approximate instructional level of each student from previous running records and observations.
The instructional level was figured by the number of words read correctly divided by the number
of words read in the passage. The instructional level is found when 90-95% of the words are read
correctly by the student. The students were presented with a book and asked to make a prediction
of what they thought the story would be about. The teacher researchers recorded all verbal
responses on the running record form. The student read the story aloud while the teacher
researchers followed along, word for word, on a typed copy of the same text. The teacher
researchers marked the student’s miscues, omissions, and substitutions. The running record form
was used to calculate the amount of words read accurately. After the story was read, the teacher
researchers asked the student various comprehension questions about the text and recorded all
verbal responses. The information obtained from the running records was kept confidential by
keeping them in a locked file cabinet only accessible by the individual teacher researchers. A
copy of the running record form can be found in appendix D.

32
Figure 16 shows the instructional reading levels of each student in the second grade
classroom of Teacher Researcher A (n=17). The average reading level is 19, and there is a range
of 22 levels between the lowest and the highest students. To be able to reach level 22 by the end
of the year, students should be reading at a level 17 or above at this particular time. According to
this, seven students are not meeting these expectations.
123456789
1011121314151617181920212223242526272829303132333435
1 2 3 4 5 6 7 8 9 10 11 12 13 14 15 16 17
Students
Rea
ding
Lev
els
Figure 16: Instructional Reading Levels in the Classroom of Teacher Researcher A (n=17)

33
Figure 17 shows the instructional reading levels of each student in the first grade
classroom of Teacher Researcher B (n=19). The average reading level is 14, and there is a range
of 26 levels between the lowest and the highest students. As stated previously, the reading levels
are the same across grade levels, yet the expectations are different. To able to reach level 16 by
the end of the year, students should be reading at a level 7 or above at this particular time.
According to this, five students are not meeting these expectations.
0123456789
1011121314151617181920212223242526272829303132333435
1 2 3 4 5 6 7 8 9 10 11 12 13 14 15 16 17 18 19
Students
Rea
ding
Lev
els
Figure 17: Instructional Reading Levels in the Classroom of Teacher Researcher B (n=19)

34
Figure 18 shows the instructional reading levels of each student in the second grade
classroom of Teacher Researcher C (n=15). The average reading level is 19, and there is a range
of 22 levels between the lowest and the highest students. To be able to reach level 22 by the end
of the year, students should be reading at a level 17 or above at this particular time. According to
this, seven students are not meeting these expectations.
123456789
1011121314151617181920212223242526272829303132333435
1 2 3 4 5 6 7 8 9 10 11 12 13 14 15
Students
Rea
ding
Lev
els
Figure 18: Instructional Reading Levels in the Classroom of Teacher Researcher C (n=15)

35
Summary
After the teacher researchers administered and reviewed the data from the running
records, the teacher researchers saw that 37% (n=19) of the students were reading and
comprehending markedly below grade level. Sixty-three percent of the students were reading and
comprehending at or above grade level. It is obvious that strategies and interventions need to be
implemented to help the struggling readers.
Comprehension Checklists
The purpose of the comprehension checklist was to gain a baseline assessment of what
comprehension strategies have been mastered and are used regularly by the students. Nineteen
students from one first grade classroom at Site A, and 47 students from two second grade
classrooms at Site B, for a total of 66 students, were questioned individually about a book that
they had read that was at their instructional level. The teacher researchers administered one
comprehension checklist per student as a pre-documentation assessment during the weeks of
January 29, 2007 and February 5, 2007 and again as a post-documentation assessment during the
week of April 30, 2007. The instructional level was determined from administering the running
records, and was calculated by the number of words read correctly divided by the number of
words read in the passage. An instructional level is when 90-95% of the words were read
correctly. A checklist was used by the teacher researchers to document answers and the student’s
ability to use specific comprehension strategies. In a narrative text, the teacher researchers were
checking for the ability to make an initial prediction after reading the title and looking at the
cover. The teacher researchers were also checking for the ability to summarize the story by
telling main events from the beginning, middle and end of the passage in sequence, to state the
problem and solution, to identify the main characters and setting, and to make a connection

36
between the text and themselves, another text, or the world around them. In an expository text,
the teacher researchers were checking for the ability to make an initial prediction after reading
the title and looking at the cover, to state the topic or main idea and three supporting details, and
to make a connection between the text and themselves, another text, or the world around them.
The information gained from the comprehension checklist was kept confidential by keeping them
in a locked file cabinet only accessible by the individual teacher researchers. A copy of the
comprehension checklists can be found in Appendix E.
The teacher researchers gave running records to each student (n=51). Figure 19 shows
what strategies students were able to use while reading a narrative text. Ninety percent (n=46)
made predictions successfully, 84% (n=43) identified the setting, 76% (n=39) identified main
characters, 66% (n=33) made a connection, 65% (n=33) identified the problem, and 53% (n=27)
identified the solution. When summarizing the story, 73% (n=37) of students included events
from the beginning, 55% (n=28) included events from the middle, 63% (n=32) included events
from the end, and 43% (n=22) summarized the events in order.
4643
39 3733 33 32
28 2722
05
101520253035404550
Predict
ion
Setting
Main ch
aracte
rs
Beginn
ing
Problem
Make a
conn
ectio
nEnd
Middle
Solutio
n
Seque
nce
Comprehension Strategies in Narrative Text
Freq
uenc
y
Figure 19: Comprehension Checklist: Narrative Text (n=51)

37
The teacher researchers also gave running records to each student (n=51) for an
expository text. Figure 20 shows that 88% (n=45) restated the topic or main idea, 80% (n=41) of
students made an initial prediction, 65% (n=33) could make a connection to the text, and 49%
(n=25) restated three supporting details.
4541
33
25
05
101520253035404550
Main Idea Prediction Connections Details
Comprehension Strategies in Expository Text
Freq
uenc
y
Figure 20: Comprehension Checklist: Expository Text (n=51)
Summary
After the teacher researchers administered and reviewed the data from the comprehension
checklists, the teacher researchers noticed that when reading a narrative text, the students were
stronger (above 70%) in making predictions, identifying the main characters, identifying the
setting, and summarizing the beginning of the text (Figure 19). The teacher researchers realized
that the other strategies were weaker. When looking at the expository text, the teacher
researchers noticed that the students were better at making predictions and identifying the main
idea (Figure 20). The area that needed the most improvement was retelling three details from the
text.

38
Reflection
After we gathered and reviewed the data gathered we discovered many things. The
students, for the most part, liked to read and felt that it was important to read (Figure 1, Figure
2). They stated that they read at home and so did their parents. (Figure 5, Figure 6). They also
felt that they understood what they read. (Figure 3). It was interesting to see that the students
thought they understood, but the data reflects otherwise in most instances. We believe that some
of the students circled their answers to please us, even though we told them we would not know
who filled out the survey and that they should be honest. The parents also said that they read at
home. (Figure 7). We are not sure how truthful all the parents were. From looking at the parent
surveys and seeing that most children read picture books and fiction books at home, it begins to
explain why there was more difficulty in comprehending expository or nonfiction texts (Figure
10). We feel children need to be exposed to more nonfiction texts. We noticed that our
colleagues feel they are prepared and confident to teach reading comprehension and are using
many strategies with their students (Figure 13, Figure 14). They feel, to varying degrees, that
comprehension is a problem (Figure 12). We feel that this problem is more prevalent in districts
where there is a higher poverty level, as in Site B. The parents are not as supportive in Site B,
and we feel that plays a large part in the problem that we are trying to improve.
Probable Causes
Due to experiences that the teacher researchers have had at their research sites, it seemed
necessary to investigate, in depth, the causes of poor reading comprehension. This is such an
important factor in a child’s educational success. Those areas to be investigated include: lack of
basic decoding skills that are necessary to read successfully, poor reading comprehension
strategies, limited vocabulary, limited background knowledge and experiences, lack of exposure

39
to literature, diverse populations in the classrooms, poor student book choice, lack of motivation
and engagement, and teachers not feeling prepared to teach what is expected for their students to
learn.
The teacher researchers found that students lacked basic decoding skills needed to read,
which was a major component of students’ lack of comprehension skills. Too many children
struggle with reading skills (Armbruster, Lehr, & Osborn, 2001), with one in three students
having problems learning to read (Mathes, et al.,1997). Learning to read and understand written
words is a complex process (Caposey & Heider, 2003). Poor readers are a major concern in the
present day education system. Specific skills are necessary for children to learn to read,
(Armbruster et al., 2001) and poor readers are unable to connect words and sentences to make
sense. Their decoding skills are poor. Students focus on small parts of words and are unable to
read large chunks. Poor readers have poor comprehension skills because they have to solely
focus on their decoding. It is possible that the focus on decoding hinders comprehension skills
(Eldridge, 1990). In addition to decoding, many students lack fluency and oral reading skills
which affects their ability to successfully comprehend passages. Those students who are unable
to automatically decode a text are unable to comprehend and make connections between what
they read and their personal experiences. There is a noted relationship between fluency and the
ability to comprehend (Tyler, & Chard, 2000). It is a major problem that students do not have
basic reading comprehension skills, and teaching comprehension strategies takes a lot of time for
teachers to teach and students to learn (Anderson, O’Leary, Schuler, & Write, 2002; Vaughn,
Klingner, and Bryant, 2001). Taking this time is extremely important for students and teachers
because if students can not comprehend, then true reading is not taking place (Armbruster, et al.,
2001).

40
Improving reading comprehension is a large challenge facing teachers. Helping to guide
and strengthen student’s comprehension is something that many teachers seem to be constantly
working on. There have been few efforts put together that include useful reading strategies to
help reading comprehension (Gauthier, 2001). Teachers really don’t provide much direct
instruction, modeling, coaching, and scaffolding while teaching reading comprehension
(Stevens, Slavin, & Farnish, 1991).
Improving reading comprehension is also a great challenge facing students. There are so
many reading comprehension strategies for children to learn, that having too many strategies will
not help students use their comprehension skills very well. Teaching too many comprehension
strategies can confuse students and give them the impression that each of the strategies are not
important because they only use one for a short period of time before moving on to another. On
the other hand, focusing on one reading strategy at a time may make it hard for students to
integrate the different strategies when they read (Lloyd, 2004). Many students do not know how
to identify the main idea of a text, and they will either retell the entire story or not say anything
at all (Vaughn, & Klingner, 1999).
Teachers have a direct impact on their students’ growth in comprehension. Due to this
fact, teachers need to be careful about the kinds of questions that they ask their students
(Gauthier, 2001). Educators tend to emphasize literal comprehension, such as answering detail
questions, and do not put as much emphasis on nonliteral comprehension skills, such as
identifying the main idea (Stevens, et al., 1991). Most teachers test comprehension by asking
questions related to the text, and that does not engage many students (Lloyd, 2004). Children
who are accustomed to traditional comprehension questions in basal texts have come to believe
that responding to literature is confined to right or wrong choices (Whitin, 2002). Keene and

41
Zimmerman (1997) say that this approach does not teach students to become proficient,
independent, confident, and critical readers. There is also such an emphasis on standardized
testing that it is hard to incorporate conversations among children that are rich with ideas. Most
students read texts without understanding and without asking themselves questions as they read.
If they do ask themselves questions, most students do not know how to use that strategy to help
them comprehend, especially with nonfiction texts (Lloyd, 2004).
In reviewing the literature, the teacher researchers found that there is a lack of vocabulary
and previous personal experiences in students, which also contributes to poor comprehension.
Vocabulary development is a significant component to reading success (Albers, & Foil, 2003). It
plays a major part in a child’s reading ability and schools have a major role in helping to develop
vocabulary. It is necessary to know, understand, and be able to use words (Caposey, & Heider,
2003). In order to properly process reading skills, students must have the ability to know,
understand, and process words, as well as have a background of experiences that they can access.
Prior knowledge and an enriched vocabulary make it easier to process new information. Students
are not always able to use the necessary vocabulary skills across multiple settings (Albers, &
Foil, 2003). For instance, students may have a hard time understanding new vocabulary in
content areas because of lack of experience or exposure. Teachers are aware that there is a
relationship between vocabulary, comprehension, and the improvement of reading skills. Often
they are unaware of how to specifically teach vocabulary effectively. It is debatable whether
vocabulary should be taught as a pre-skill in all subjects or if it should be allowed to develop
naturally (Smith, 1997).
The literature informed the teacher researchers that lack of exposure to literature is a
major contributing factor to students’ lack of comprehension. In order for children to read,

42
someone needs to read to them. Many students lack the opportunities of exposure and immersion
in literature. They have not had the advantage of being read to or of watching others engage in
reading activities (Love, Batts, & Love-Owens, 1995). Reading in general is a very foreign
experience. The teacher researchers have noticed that it is very difficult to access students’ prior
knowledge due to the fact that there is limited outside exposure. It is also difficult for students to
answer questions about stories they have read because they can not relate to them or make
personal connections.
Teachers today are dealing with a multitude of challenges that they have never before
faced. Neglect, abuse, poverty, and language barriers are all too common. (Anderson, et al.,
2002; Caposey, & Heider, 2003; Mathes, et al., 1997; 2001). It is difficult for teachers to
effectively teach everyone under these circumstances. Many teachers do not feel prepared to
meet all of those needs with the skills and resources available (Mathes, et al., 1997; 2001;
Vaughn, et al., 2001). Teachers have to differentiate their instruction in so many ways to meet
students’ needs. Teachers also have to meet the academic and social needs of students with
learning disabilities, which can be difficult (Elbaum, Moody, & Schumm, 1999). Jenkins, Jewell,
Leceister, and Troutner (1990) state that the range of reading ability in an average classroom is
5.4 years (Mathes, et al., 1997). It can be very difficult to include students who are functioning
below grade level, or who are struggling. As these struggling learners get older, they get more
frustrated (Wood, & Jones, 1998). The teacher researchers feel that is a substantial problem in
both research sites, and these issues directly reflect lack of basic reading and comprehension
skills.
Another specific problem relating to lack of comprehension is that students choose books
that are inappropriate for them. This can lead to students being less engaged and unsuccessful in

43
comprehending (Guthier, 2006). Readers will not be engaged in a text if they can not relate their
experiences to it, predict, or evaluate what they read (King, 2001).
Even with all of the training and preparation, teachers do not feel prepared to deal with
the daily challenges of teaching reading. The goal of education is to produce readers competent
in both comprehension and fluency. It is necessary that teachers learn ways to effectively reach
all students, and not continue to allow students to fail at the current rates (Mathes, et al., 2001).
Teachers have fewer chances to meet one-on-one with struggling readers. This may lead to
students not getting all of the appropriate interventions that they need (Schwartz, 2005).
Many teachers feel that there are so many curriculums to cover that there is no time to go
into any one area in depth (Annarella, 1999). Teachers are often confused about what works and
how to implement effective practices (Armbruster, et al., 2001). Guided reading, end of selection
tests, graphic organizers, and fall and spring assessments are not used consistently by teachers
(Anderson, et al., 2002). It is the experience of the teacher researchers that not all of the teachers
at the research sites are consistent in the use of these specific techniques, especially guided
reading. Some teachers do not use these practices at all, some use them inconsistently, and some
use them consistently. Some reasons for this may include that teachers have a lack of experience
teaching leveled guided reading groups, or teaching different groups means different materials
and more time to prepare (Galloway-Bell, 2003).
Guided reading can also be a problem for the students. The students reading below level
are not getting the examples and stimulation that they may need from the students reading above
grade level because everyone is reading materials at the same level. Lower groups sometimes
also have lower expectations for themselves, too (Galloway-Bell, 2003). Another reason why
teachers may not consistently use guided reading practices is that the other children need to be

44
engaged during this time also. Most of the time teachers meet with guided reading groups while
the rest of the children are doing center work. This unsupervised seatwork is usually of poor
quality, poorly integrated with other reading activities, and not taken seriously by students or
teachers. This is especially true for younger students who do not have fully developed
independent reading skills or work skills (Galloway-Bell, 2003; Stevens, et al., 1991). During
center work, the classroom can become noisy and the children can be disruptive. This is not an
environment conducive to learning. It can also be hard for students to get help from their teacher
during this time (Elbaum, et al., 1999). Approximately two-thirds of a child’s reading time is
spent away from the teacher. Since that is a significant amount of time, teachers need to find
activities that children can do that are engaging and worthwhile (Ford, & Opitz, 2006). New
students can also have difficulties adapting to new classrooms or classes where different
practices are being used. There are many different formats to use when trying to teach reading
and improve comprehension. All of the formats differ in the number of students involved, the
amount and type of materials used, the structural elements included, and the focus of the content.
This may be difficult and confusing for the teacher to know what to do and when, how to group
the students appropriately for the task at hand, and what formats are most developmentally
appropriate based on the needs of the class. All students vary greatly in their needs and abilities,
so what works for one may not work for another (Elbaum, et al., 1999; Kimball-Lopez, 2003).
In conclusion the teacher researchers found that there are many underlying factors that
contribute to students’ poor reading comprehension. These include a lack of basic decoding skills
that are necessary to read successfully, poor reading comprehension strategies, limited
vocabulary, background knowledge, and experiences, lack of exposure to literature, diverse
populations in the classrooms, poor student book choice, lack of motivation and engagement, and

45
teachers who do not feel prepared to teach what is expected for their students to learn. Each of
these factors, when looked at individually, can cause students to have a significant problem
comprehending. When all of these factors are combined, as they are with the students in our
research sites, the results can be overwhelmingly negative.

46
CHAPTER 3
REVIEW OF THE LITERATURE
After reviewing the literature, the teacher researchers found that there are numerous ways
to increase reading comprehension. The interventions that seemed the most beneficial to the
teacher researchers were cooperative learning, guided reading, Reader’s Theater, and direct
instruction. Other factors that increase reading comprehension are increasing exposure to books
and literature and increasing reading motivation. The teacher researchers also reviewed literature
involving literature circles and their effectiveness.
After reviewing the literature, the teacher researchers have decided to use cooperative
learning as one of their reading intervention strategies. Group learning is a way to have students
work together to reach a goal. It is also called cooperative learning. Cooperative learning can be
effective in all content areas with all age groups. The size and make-up of the group can be
determined by the task or purpose for the group (O’Donnell, & O’Kelly, 1994). There are usually
four to six students in a group. Students have incentives to work well in groups and activities are
structured. There is usually some kind of direct instruction from the teacher followed by the
cooperative learning activity, and then there is some kind of follow-up and evaluation activity
(Stevens, et al., 1991). Slavin (1983; 1992) states that rewards are essential to effective
cooperative learning (O’Donnell, & O’Kelly, 1994). The groups need to be balanced in the
numbers of males and females and structured so that everyone participates (O’Donnell, &
O’Kelly, 1994). If the group is unbalanced, not everyone participates appropriately. It helps to
assign jobs or roles to minimize disruption (Elbaum, et al., 1999; O’Donnell, & O’Kelly, 1994).
It is important for teachers to be conscious of student concerns about group work and make good
instructional decisions (Elbaum, et al., 1999).

47
When students are in cooperative learning groups they can brainstorm, work, and make
decisions together (Milios, 2000). Cooperative learning requires students to reflect on their
knowledge and make generalizations and elaborations that they can convey to their peers, which
is an effective way to improve their “depth of processing” (Stevens, et al., 1991). When students
work together they can share their thoughts on how they solved a problem or their thought
process on a question. Sometimes hearing how their peers solved a problem helps students
understand better than hearing instructions from an adult. The use of questioning, discussion, and
cooperative learning is proven to be successful in teaching comprehension strategies (Gauthier,
2001). The more students work together, discuss, question, and summarize, the more they are
able to understand and retain (Caposey, & Heider, 2003). Cooperative learning provides a
broader and deeper understanding of concepts and a better appreciation of others (O’Donnell, &
O’Kelly, 1994). When cooperative learning is used students have a stronger sense of their
listening, writing, reading, and speaking skills (Bromley, & Modlo, 1997). When used
consistently cooperative learning groups positively effect achievement, especially in at-risk
children, because children see the importance of a group goal and doing their part (Elbaum, et
al., 1999; Slavin, 1999; Stevens, et al., 1991). Working in cooperative learning groups has
positive effects on class learning and structure (Johnson, & Johnson, 1988, 1997). When students
of different abilities are put together, everyone benefits. A mixed ability group gives students
with learning disabilities the chance to work with their nondisabled peers. Students enjoy
working in groups or pairs, and the higher students usually enjoy helping the lower students
(Elbaum, et al., 1999). Cooperative learning is a way to get children ready for the real world. It is
also stated that cooperative learning effects the way students work with each other. It helps get
them more motivated, helps them communicate better, and helps them share their metacognitive

48
strategies so others can understand and learn from them (Bromley, & Modlo, 1997). Cooperative
learning saves time and stress for teachers (Bromley, & Modlo, 1997). Research has shown that
good use of cooperative learning helps students stay on task, helps classroom management and
creates a good classroom moral, increases positive attitudes and self-esteem, improves relations
among different types of students, encourages responsibility and participation in learning, and
increases motivation. Students are able to communicate better with each other as well as with the
teacher (Caposey, & Heider, 2003; Stevens, et al., 1991). Teachers who use cooperative learning
have more mediated learning interactions. Those teachers also have fewer discipline issues. In
turn, their students tend to replicate the teacher’s interactions within their small groups (Gillies,
2006).
To work effectively in cooperative groups, a set of goals must be established. Students
must be taught the necessary skills (communication, leadership, trust, and conflict resolution) in
order to work in cooperative groups. This process should start out slowly, one lesson at a time,
and build as skills improve. Goals need to be specific and easy to understand (Johnson, &
Johnson, 1988, 1997). There is a need for a curriculum that includes social skills, values, and
morals, and teachers need to teach students about collaboration. Teachers need to start having
their students experience cooperative learning as soon as possible in their schooling. Along with
teaching cooperation, teachers need to teach collaborative literacy (Wood, Roser, & Martinez,
2001). Collaborative literacy is where literature is the start of helping children develop skills they
need to contribute to their class, home, and the rest of the world. In collaborative literacy
students are engaged in literature activities with other students. The books that they read are
books about how others can get along and work together. The activities force students to work
together to form a common goal, just like the books that they read. They use book talks to

49
discuss how the characters in the book worked towards their goals. These discussions help the
students use these ideas in their own life (Wood, et al., 2001). Teachers should also teach
constructive criticism. This enables children to focus on the behaviors of others and not the
individual student, how to be specific, and how to say what’s good and not just what’s bad
(Elbaum, et al., 1999). Learning to work cooperatively also provides life skills that can influence
career, family, and relationships. Cooperative learning has many benefits and we must return to
practices that will foster it (Johnson, & Johnson, 1988, 1997).
There are many different strategies to use when incorporating cooperative learning in the
classroom. A strategy called snap shot linkage can be used to increase comprehension. Teachers
assign something to be read that can be read and understood by all students. Groups work
together to read a section of the text and summarize it. They write down their summaries to share
with the class (Simplicio, 2003).
Coop-Dis-Q is a strategy where small groups are formed and questioning and discussion
of a reading is emphasized. Teachers are responsible for proposing a variety of questions.
Teachers initiate the discussions and then remove themselves from the group and observe
(Gauthier, 2001).
Slavin (1986) proposed a cooperative learning method called the cycle of instruction in
which students are taught a specific skill or process by direct instruction. The students work
together in their groups to practice, discuss, and assess each other on the new skill or process,
and then they are each tested individually with the opportunity to earn points for their team
(Stevens, et al., 1991).
Another technique of cooperative learning is an activity that goes by the acronym
MURDER. It stands for mood, understand, recall, detect errors, elaborate, and review. The mood

50
in the room is relaxed. Students understand the text by reading silently, and then they recall the
main story ideas. The errors or omissions in the summary of events are detected. The students
then elaborate on their main ideas and review the entire selection (Jacobs, 1998).
Peer-mediated instruction is simply having students work together to perform a task. This
helps students of all ability levels because they can help each other (Vaughn, et al., 2001).
Collaborative Strategic Reading is a beneficial strategy to use when cooperative groups
are heterogeneous. This strategy gives each student a responsibility or role in the group to ensure
that they are working successfully (Vaughn, & Klingner, 1999).
Cooperative story mapping is a strategy that activates prior knowledge. Students are
taught a specific story element and then use graphic organizers to make a visual representation of
the story element. All information put on the graphic organizer is done collectively (Mathes, et
al., 1997, 2001).
Buddy system groups are when you rank the class from most prepared to least prepared
in a subject area, such as numbering the students from 1 to 30. Next, divide them into three
subgroups, such as 1 to 10, 11 to 20, and 21 to 30 so that the groups resemble the traditional
high, medium, and low ability groups. Finally, achieve heterogeneous grouping by assigning the
top student in each of the three groups to one group, the second-highest student in each to
another, the third-highest to another, and so forth. The mixed groups should comprise individuals
who are sufficiently different in ability that they can benefit from each other’s help, but not so
different that they find one another intimidating. The buddies use each other as needed for things
like reading their work before they turn it in, answering their questions, and demonstrating or
discussing anything they may need help with.

51
Figure 21: Buddy System Groups
To help with comprehension, the class can read or partner read a text, then they can tell
their group members what they remember. It is important to model retelling using analogies and
imagery to personalize the story. When students do this, it helps them recall the information
later. When groups finish discussing, the teacher can work with the class to verbalize what they
remember and write down their responses. This process maximizes class participation. Students
can experience the content in many different forms, all in the language of their peers. Struggling
readers gather information from listening to others. Teachers can also give struggling readers the
same topical information to read but on an easier level. The students also feel more comfortable
speaking in front of a small group first, and then in front of a large group when they know their
answer is right (Wood, & Jones, 1998). Cooperative Integrated Reading and Composition
(CIRC) is a cooperative approach to reading and writing. Students are assigned to pairs in their
Students are numbered 1-30 (1 being the student who understands the concept the most, 30 being the student who understands the concept the least).
Students 1-10 are broken up into a
group (high group)
Students 11-20 are broken up into a
group (middle group)
Students 21-30 are broken up into a
group (low group)
Groups
Students 1,11,21 Students 2,12,22 Students 3,13,23
Groups
Students 4,14,24 Students 5,15,25
Students 6,16,26 Students 7,17,27
Groups
Students 8,18,28 Students 9,19,29
Students 10, 20, 30
52
reading groups, and then the pairs are assigned to teams made up of partners from two other
reading groups. CIRC focuses on three elements: story-related activities, direct instruction in
reading comprehension, and integrated writing/language arts. Story-related activities include
partner reading, story-related writing and making predictions, mastering word lists, story
retelling, spelling, partner checking, and tests. There is also direct instruction in reading
comprehension one day a week. Students learn skills such as identifying the main idea and
drawing conclusions. They are also able to work on mastering those skills with their groups. To
integrate writing/language arts, students draft compositions with the support of their peers, and
then they edit each other’s work for content, grammar, and mechanics. Students read
independently at home every night and turn in one book report every two weeks to earn points
for their team. In general, results show superior performance by the CIRC classes on
standardized achievement tests, writing samples, and oral reading inventories (Slavin, Madden,
Farnish, & Stevens, 1995).
Another intervention chosen by the teacher researchers is guided reading. Educators
wanted to use a reading program with the intention of using a coherent plan of skills
development, better assessment, and rich children’s literature. Some educators felt it was more
effective if this type of program was done with groups of students at the same ability level. In
this way every component, every test, and every lesson in the teacher’s program was designed at
a specific ability level, therefore success at the level would have a better chance of being
achieved. These groups make it possible for teachers to provide instruction that is on level. The
learning environment in these groups is quieter, less distracting, and more personal. There is
more discussion and participation, and the teachers are able to give immediate feedback. There is
more time to teach comprehension, questioning, and before, during, and after reading strategies.

53
Most students model the behavior of their same level peers who are doing well in school.
Attitudes towards certain subjects improve when students are grouped during those subjects.
During these groups lower students can feel successful and higher students can be challenged.
Homogeneous groups are a place where children can take risks and not fail. Slavin (1990)
supports the efficacy of leveled reading groups because the results in reading achievement are
higher. These groups are getting more popular especially where the population is more diverse.
English language learners, students with learning disabilities, and lower readers can get the
added support that they need because they can’t always get it in a non-leveled, whole class
setting (Galloway-Bell, 2003). Students increase their level of achievement, self-esteem, and
confidence when leveled reading groups are used. Leveled reading groups increase the pace and
levels of instruction for the higher readers, and they do not have the wait time as with mixed
ability groups. The lower groups get the individual attention, the repetition, and the review they
need. The higher students can compete with each other, and the lower students don’t have to
compete with the higher students (Galloway-Bell, 2003). Students who are taught using their
appropriate instructional level have limited decoding issues thus improving their comprehension.
Appropriate exposure to the printed word will help students develop their reading skills. The
group assisted approach to teaching reading can be a very good alternative approach. This
strategy is both efficient and easy to provide (Eldridge, 1990). Leveled-groups help students
when they move up reading levels because their independent reading is better (Galloway-Bell,
2003).
If guided reading groups are going to work effectively in the classroom, teachers need to
make sure the students that she is not working with are doing meaningful and engaging tasks.
One way to make sure they are doing meaningful work is to have another adult in the room

54
working with a reading group. That way there are fewer children to worry about being off task.
Another idea is to have writer’s workshop going during the same time as guided reading (Ford,
& Opitz, 2002). Often times, teachers have difficulty implementing writer’s workshop due to
time constraints or lack of appropriate instructional training. Centers can also be used for the
students who are not working with the teacher. Teachers need to remember that the centers
should be work that everyone can do independently (Ford, & Opitz, 2002). Center activities
should be concepts that have already been taught through direct instruction; therefore, they are
strictly used for review and practice. If the work in the centers is not something that can be done
independently, the students will be interrupting the teacher during the guided reading time with
questions about how to do the work. If students know the routines and how to work
independently, the classroom will work more smoothly (Ford, & Opitz, 2002).
The teacher researchers found that students need to be explicitly taught reading strategies,
mainly through guided reading groups. They also found the use of graphic organizers to help
comprehension. Students also need to read independently (Chevalier, Del Santo, Schneiner,
Skok, & Tucci, 2002). The use of graphic organizers, unison reading, buddy reading, repeated
reading, word tracking, and end of the selection tests are all successful ways to increase
comprehension (Anderson, et al., 2002; Eldridge, 1990). Teachers who use all of these strategies
while giving feedback will increase student comprehension. The books that should be used in
guided reading should be books that the students can read with about 90% accuracy. One or two
teaching points and new vocabulary should also be addressed during this time. Guided reading
groups are dynamic, or changing, as the students’ abilities change (Kimball-Lopez, 2003).
Guided reading is a helpful way for teachers to hear individual students and pay attention to what

55
kinds of mistakes they make. Knowing all of this will help the teacher instruct each student in the
most appropriate way (Schwartz, 2005).
Another specific intervention that aids reading comprehension is the use of drama,
specifically Reader’s Theater. Re-enacting a piece of literature leads to a better understanding of
characters, plot, and meaning. Literature becomes a living experience to be shared. The use of
Reader’s Theater encourages students to question, discover, and participate actively (Annarella,
1999). Reader’s Theater is a successful way to increase fluency and meaning in reading. Since
they are repeatedly reading the text, their fluency is increasing (Kimball-Lopez, 2003; Martinez,
Roser, & Strecker, 1998). Children use a script to practice their parts and rehearse together.
Because the students see these practices as rehearsals they find more meaning to the readings.
They use a script that is at their reading instructional level. Because it is at their level they can
focus more on the meaning of the readings. They are able to connect to the characters and
therefore get more out of the text than just a regular text. Reader’s Theater also builds
enthusiasm. Before the kids successfully do Reader’s Theater, they need to have others model
what good fluent reading sounds like. Students need feedback and instruction in order to make
Reader’s Theater successful (Martinez, et al., 1998). Repeated reading is effective with both
older and younger students. This process provides the repetition that is so necessary for
struggling readers. This activity has appeal to students because it is carried out cooperatively and
does not seem as intimidating as a story because of its format. This provides even the most
hesitant reader an opportunity to succeed. Passages are read automatically which benefits both
fluency and ultimately comprehension (Tyler, & Chard, 2000).
Direct instruction is a very important way to help students increase their reading
comprehension. Keene and Zimmerman (1997) and Goudis and Harvey (2000) state that there

56
are eight main comprehension strategies that should be taught and students should know. These
include making connections, questioning, inferring, visualizing, determining importance,
synthesizing, monitoring, and making sensory images (Lloyd, 2004). Comprehension strategies
can be taught, and they will help students understand what they are reading. Text comprehension
should be modeled and taught using specific teaching methods. (Armbruster, et al., 2001). Brown
and Palincsar (1982) have shown that three methods are very effective: instruction in
comprehension-fostering strategies, instruction on the importance and usefulness of those
strategies, and metacognitive monitoring strategies to check the appropriateness of strategy use
(Stevens, et al., 1991). One way to teach comprehension strategies is to use a process called a
think aloud. Think alouds enable teachers to model and effectively guide visualization and
prediction. Think alouds also show ways to process text, use prior knowledge, summarize, and
clarify (Caposey, & Heider, 2003). Another way to teach comprehension strategies through
direct instruction is with a strategy called Collaborative Strategic Reading (CSR). There are four
main reading strategies that are taught through CSR: preview and predicting (Preview), check for
understanding and vocabulary knowledge (Click and Clunk), main idea (Get the Gist), and
understanding the selection (Wrap-Up). These reading strategies are taught to the whole class.
The teacher tells about the strategy, models the strategy, and has some students use the strategy
correctly for the rest of the class. Each of the four strategies is taught one-by-one and then they
can be used together. Previewing is used to get students interested in the text, activate
background knowledge, and to make predictions. It is important to teach students to scan the text
by looking at the title, pictures, headings, key words, the first paragraph, and the last paragraph.
Click and clunk teaches students to monitor and think about what they are reading. This strategy
helps students realize when they are following information in the text and when they are having

57
difficulty following along. A click is when you really get something you are reading and a clunk
is when you don’t understand what you are reading. It is also necessary to teach strategies to use
to declunk, like using the dictionary, rereading and using context clues, breaking the word up,
and asking for help. Get the gist helps students identify the main idea of the text. It is helpful to
limit the number of words students can use to state the main idea to about ten words or less
(Mathes, et al., 1997). Teaching the main idea can be summarized in a few steps. The teacher has
to teach how to identify the most important who or what, provide evidence to support it, and then
write a sentence about it. The wrap-up strategy helps students review and remember what they
have read. An important part of this strategy is learning how to generate questions, and the
teacher might find it helpful to provide question stems. CSR allows students to learn and think
when they read. Vaughn and Klinger (2001) state that if children only learn a few reading
strategies they will be successful. Another direct instruction approach that can be used to
increase comprehension is the sketch-to-sketch strategy. This strategy allows students to draw
what a story means to them using lines, colors, shapes, symbols, and pictures. Teachers can also
assign a sentence or two to explain their sketches. This is a good strategy for at-risk readers. This
strategy helps students realize that there can be more than one correct answer or interpretation.
Students can make connections from their life and link the ideas of others to their own. Teachers
should talk to and guide students as they sketch to ensure an understanding of characters, plot,
and theme. Good conversations go past just retelling, and this strategy gives students the
opportunity to interpret and relate to their own lives or experiences (Whitin, 2002). Knowledge
of vocabulary is also directly related to reading comprehension. Direct vocabulary instruction
appears to be more effective than experience learning. Activities such as brainstorming,
mapping, and providing visualizations all help to make vocabulary clear and understandable.

58
Students benefit from being able to access their prior knowledge and experiences, so the use of
vocabulary instruction significantly increases comprehension by focusing on what is already
known and combining that with new information (Smith, 1997). Another way to directly instruct
vocabulary is through the use of drama activities. Teachers can make vocabulary introduction
memorable by wearing a silly hat or outfit or incorporating a physical action to relate to each
word. Once an understanding of each word is mastered, continued practice is still necessary
(Albers, 2003).
Increasing student exposure to books and literature can increase reading comprehension.
Classroom environments and procedures must be altered and made student friendly and inviting.
Warm library areas, writing centers, and abundant print media must be visible. A wide variety of
manipulatives and hands-on experiences must be available. All of these components are
necessary for improved reader comprehension (Love, et al., 1995).
Increasing student motivation can also increase reading comprehension. If students are
motivated it is directly correlated to their reading comprehension. Students need to be engaged in
their reading. Evidence has shown that the more students are motivated the better they
comprehend. There are many instructional practices that help increase comprehension. Students
need to have content goals for reading. If students are interested they will get more out of the
reading. Students need choices in the classroom. When they are able to choose what they will
read they are more likely do better. What the students reads needs to be of interest to them. If
they are interested, they will understand better. Teachers need to be involved. Students need to
know that their teacher cares and is interested in them. Extrinsic rewards and praise also help
students. Teachers need to stress mastery goals to the students. Students need to understand that
they are reading to get knowledge from the text, that they are reading to fully understand the

59
stories, and to understand the different genres of texts, for example poetry, folk tales, and
legends (Gauthier, 2006). Another way to increase reading motivation is to use predictable books
to teach reading. These books are already familiar or can be easily presented. Students learn sight
vocabulary by the mere repetition of the story presentation. Interest levels are
peaked because stories are more interesting and relevant. Stories can be shared over and
over again because they are loved and enjoyed. Oral reading skills are easily increased by
modeling and repetition. There is a sense of a “real book” (Love, et al., 1995).
Literature circles are a way for students to work together to increase reading
comprehension. The teacher researchers found this to be an effective intervention for students,
but chose not to implement it due to time constraints. Harvey Daniels (1994) defines literature
circles as small, temporary groups of students who choose to read the same thing. The teacher
gives book talks for the students to choose which book they find interesting. In the younger
grades, the teacher is responsible for deciding how much to read (depending on the weakest
reader) and for helping them prepare for the discussion. Each member of the group has a certain
role or responsibility that they must prepare for to take part in the discussion. Daniels also states
that the literature circles meet regularly, but the roles of the students change. When the book is
finished, the group comes up with some way to present their discussion to the class. Then there
are new books to choose from, and new groups are formed (Day, 2003). Literature circles should
be made up of four to six students, and can be used to discuss novels, picture books, poems,
chapters in a textbook, and newspaper articles. Teachers may get many sets of books that share
the same theme, genre, or author (Brabham, 2000). Fiction is used most in literature circles.
Farinacci (1998) and Petra-Nash and Dutch (2000) state that books should be ones that all ability
levels can understand, they should reflect the language needs and skills of the students, they

60
should be relevant to the students, and they have to be able to get them thinking (Lin, 2004).
Burns (1998) and Daniels (1994) say that students can have their own roles to help guide the
discussion. Some of the different roles can be discussion director, vocabulary enricher,
illustrator, and connector. It is very important for the teacher to take the time to thoroughly go
over the responsibilities of each role (Day, 2003). Students can help prepare for these roles with
assignment sheets. Students may also find other things in their reading like “wow” words, parts
that they don’t understand, parts that are exciting, things about the characters, or words they
don’t know (Brabham, 2000). Some of the roles involved are fun and easy for students to do. The
artful artist makes an art project of some part of the story, the literary luminary finds an
interesting part to share, the word wizard finds words that are difficult and presents the
definitions and some kind of activity, and the summarizer gives an overview (Day, 2003).
Literature circle discussions become better when the students have done it long enough to stop
using roles or assignment sheets (Lloyd, 2004). Farinacci (1998) states that teachers need to
teach what to do if students come across words they don’t know, how to respond to others, how
to select items to discuss, and how to get along (Lin, 2004). It is important to teach students to
respect everyone’s comments and value their questions. Other helpful suggestions for
implementing literature circles are: making a T-chart about what a literature circle looks like and
sounds like, brainstorming solutions to any problems that may arise, and having individual
conferences with students to help them prepare for their discussions (Lloyd, 2004).
There are many benefits to literature circles. Brabbham and Villaume (2000) say that
literature circles develop thoughtful, competent, and critical readers (Lin, 2004). They help
students make predictions, use imagery, make connections, summarize, understand vocabulary,
and ask and answer higher-order thinking questions (Brabham, 2000; Fink, 2003). Literature

61
circles also help students understand the text and themselves as a reader. Students can bring their
own experiences to the discussion while the others can picture these experiences, empathize, and
compare (King, 2001). Using literature circles increases listening skills, independence,
cooperation, and communication (Day, 2003). Struggling readers usually work well in literature
circles because they are in a low-risk environment, they can benefit from the modeling and
guidance of their peers, and they are more willing to stick with challenging texts in a discussion
group format (Brabham, 2000; Day, 2003; King, 2001; Lin, 2004).
In conclusion, the teacher researchers found many ways to effectively increase reading
comprehension. Those that were most effective to the teacher researchers’ situations include
cooperative learning, guided reading, Reader’s Theater, and direct instruction. It is also very
important to keep students engaged and motivated and to have an environment conducive to
reading. Literature circles are also beneficial to increase comprehension. It is obvious that using
combinations of different formats to teach reading gives students more interactions with text, and
these different interactions will increase word recognition, fluency, and reading comprehension
(Kimball-Lopez, 2003).
Project Objective and Processing Statements
As a result of cooperative learning groups, guided reading groups, and Reader’s Theater
groups, during the period of January 29 through May 11, 2007, the students of teacher
researchers A, B, and C, will increase their reading comprehension skills.
To accomplish this research project, the teacher researchers will develop cooperative
groups and teach the specific skills required to work cooperatively with others. The teacher
researchers will develop ability leveled guided reading groups and Reader’s Theater groups.
They will also develop instructional materials for specific reading comprehension strategies.

62
Project Action Plan
The action plan for the research project includes strategies to increase reading
comprehension for students in first and second grade. The following details the tasks for the
teacher researchers for each week of the project.
Prior to Documentation
January 15, 2007-January 26, 2007
• Xeroxed and assembled student consent forms.
• Xeroxed and assembled parent surveys, student surveys, and teacher surveys.
• Xeroxed comprehension checklists.
• Xeroxed running record forms.
• Distributed student consent forms on January 15, 2007.
• Collected student consent forms January 16, 2007-January 19, 2007.
• Gathered necessary materials.
Pre-Documentation
Weeks 1 and 2 January 29, 2007-February 9, 2007
• Passed out and administered student surveys on January 29, 2007.
• Each teacher researcher kept her student surveys in a locked file cabinet in her classroom.
• Sent home parent survey forms on January 29, 2007.
• Collected parent survey forms January 30, 2007-February 9, 2007.
• Passed out teacher surveys on January 29, 2007.
• Collected teacher surveys January 30, -February 2, 2007.
• Administered running records with comprehension questions to each child January 29,
2007-February 9, 2007.

63
• Each teacher researcher kept her running record forms in a locked file cabinet in her
classroom.
• Administered comprehension checklists to each child January 29, 2007-February 9, 2007.
• Xeroxed Reader’s Theater scripts for the implementation period and Xeroxed graphic
organizers for guided reading.
Intervention
Week 3 February 12-16, 2007
• The action researchers modeled the specific reading comprehension strategy-
making predictions.
• The action researchers implemented cooperative learning groups that focused on the use
of the specific strategy of the week-making predictions.
• The action researchers selected ability leveled guided reading groups and utilized graphic
organizers and processes such as choral, buddy, and repeated reading that focused on
improving reading comprehension.
Week 4 February 19-23, 2007
• The action researchers modeled the specific reading comprehension strategy-focusing on
the main idea and supporting details.
• The action researchers implemented cooperative learning groups that focused on the
week’s specific strategy-focusing on the main idea and supporting details.
• The action researchers continued to work with ability leveled guided reading groups, and
they used graphic organizers and processes such as choral, buddy, and repeated reading
that focused on improving reading comprehension.

64
Week 5 February 26-March 2, 2007
• The action researchers implemented ability leveled Reader’s Theater groups.
• Students in each group practiced orally reading their specific script daily.
• Students performed their script for peers at the end of the week.
Week 6 March 5-9, 2007
• The action researchers modeled the specific reading comprehension strategy-identifying
the setting and characters.
• The action researchers implemented cooperative learning groups that focused on the
specific strategy of the week-identifying the setting and characters.
• The action researchers continued to work with ability leveled guided reading groups, and
they utilized graphic organizers and processes such as choral, buddy, and repeated
reading that focused on improving reading comprehension.
Week 7 March 12-16, 2007
• The action researchers modeled the specific reading comprehension strategy-identifying
problems and solutions.
• The action researchers implemented cooperative learning groups that focused on the
specific strategy of the week-identifying problems and solutions.
• The action researchers continued to work with ability leveled guided reading groups that
utilized graphic organizers and processes such as choral, buddy, and repeated reading that
focused on improving reading comprehension.
Week 8 March 19-23
• The action researchers implemented ability leveled Reader’s Theater groups.
• Students in each group practiced orally reading their specific script daily.

65
• Students performed their script for peers at the end of the week.
March 26-March 30
• Spring Break
Week 9 April 2-6, 2007
• The action researchers modeled the specific reading comprehension strategy –
summarizing, or identifying the beginning, middle, and end.
• The action researchers implemented cooperative learning groups that focused on the
specific strategy of the week-summarizing, or identifying the beginning, middle, and end.
• The action researchers continued to work with ability leveled guided reading groups that
utilized graphic organizers and processes such as choral, buddy, and repeated reading that
focused on improving reading comprehension.
Week 10 April 9-13, 2007
• The action researchers modeled the specific reading comprehension strategy-making
connections.
• The action researchers implemented cooperative learning groups that focused on the
specific strategy of the week-making connections.
• The action researchers continued to work with ability leveled guided reading groups that
utilized graphic organizers and processes such as choral, buddy, and repeated reading that
focused on improving reading comprehension.
Week 11 April 16-20, 2007
• The action researchers implemented ability leveled Readers Theater groups.
• Students in each group practiced orally reading their specific script daily.
• Students performed their script for peers at the end of the week.

66
Week 12 April 23-27, 2007
• The action researchers used this week to review each specific comprehension strategy in
cooperative learning and guided reading groups.
Post-Documentation
Weeks 13-14 April 30-May 11, 2007
• Passed out and administered student surveys on April 30, 2007.
• Each teacher researcher kept her student surveys in a locked file cabinet in her classroom.
• Administered running records with comprehension questions to each child during the
weeks of April 30-May 11, 2007.
• Each teacher researcher kept her running record forms in a locked file cabinet in her
classroom.
• Administered comprehension checklist to each child during the weeks of
April 30-May 11, 2007.
• Each teacher researcher kept the comprehension checklists in a locked file cabinet in her
classroom.
Methods of Assessment
The teacher researchers gave a student survey about reading. The purpose of the survey
was to gain insight on the students’ perceptions of the importance of reading and how well they
understand what they read. The survey was administered to 32 students from two second grade
classrooms and 19 students from one first grade classroom for a total of 51 students during the
week of April 30, 2007. The survey was handed out to each student to complete.
The teacher researchers administered a running record to 32 students from two second
grade classrooms and 19 students from one first grade classroom during the weeks of

67
April 30, 2007 and May 7, 2007. The purpose of the running records was to find each student’s
instructional reading level. The instructional level is figured by the number of words read
correctly divided by the number of words read in the passage, and an instructional level is 90-
95% of the words are read correctly by the student.
The teacher researchers administered a comprehension checklist to 32 students from two
second grade classrooms and 19 students from one first grade classroom. The purpose of the
checklist was to identify the comprehension strategies that the students can use appropriately
while reading. In a narrative text, the teacher researchers checked for the ability to make an
initial prediction, to summarize the story, to state the problem and solution, to identify the main
characters and setting, and to make a connection. In an expository text, the teacher researchers
checked for the ability to make an initial prediction, to state the topic or main idea and three
supporting details, and to make a connection.

68
CHAPTER 4
PROJECT RESULTS
The objective of this action research project was to increase reading comprehension in
narrative and expository texts. The teacher researchers implemented specific reading
comprehension strategies through the use of cooperative learning groups, guided reading, and
reader’s theater. There were 19 first grade students and 32 second grade students, for a total of
51 students involved. This research project was implemented from January 15, 2007 to May 11,
2007.
Historical Description of Intervention
During the first week of pre-documentation, a student survey (Appendix A) was
administered in each classroom, parent surveys (Appendix B) were sent home, and a teacher
survey (Appendix C) was handed out. Overall we found that there was a positive outlook about
reading. It was also important to note that out colleagues felt confident and prepared to teach
reading comprehension strategies. We were upset about the number of responses that we
received from both parents and teachers. We were expecting a better response from them. It was
interesting to note that there was a wide variety of activities being used in many classrooms.
When looking through the student surveys we wondered if students had been completely honest
with their responses.
During the second week of pre-documentation, running records (Appendix D) and
comprehension checklists (Appendix E) were given to each student participant. Making an initial
prediction and identifying the main idea were strengths of many students. Many of our students
had difficulty retelling in sequence and making connections. We wondered if the lack of prior
experience contributed to the inability to make these connections. We also wondered if the low

69
socioeconomic status and the lack of parental involvement in Site B were contributing factors.
After the running records and comprehension checklists were given, we found it interesting how
big of a range we each have in our classes between the highest and lowest reading levels.
During each week of intervention we focused on a different reading strategy. We worked
on the different strategies in cooperative learning groups and guided reading groups. We used
activities including read alouds, think alouds, and graphic organizers (Appendices F-L,
respectively). When cooperative learning groups were used, students were placed in multi-ability
leveled groups. When guided reading groups were used, students were placed in ability-leveled
groups.
Table 6
Weekly Interventions
Week Strategy Date
1 Making Predictions February 12 – 16, 2007
2 Main Idea and Details February 19 – 23, 2007
3 Reader’s Theater February 26 – March 2, 2007
4 Setting and Characters March 5 – 9, 2007
5 Problem and Solution March 12 – 16, 2007
6 Reader’s Theater March 19 – 23, 2007
7 Beginning, Middle, End April 2 – 6, 2007
8 Making Connections April 9 – 13, 2007
9 Reader’s Theater April 16 – 20, 2007
10 Review April 23 – 27, 2007

70
During the first week of intervention we focused on predicting. We found this skill to be
a strength for our students. While working on this strategy, students engaged in picture walks,
and reading to a certain point in the story and stopping to discuss predictions. We also discussed
why they made their specific predictions. They were also able to explain why this skill was an
important one.
In the second week of intervention we focused on identifying the main idea and
supporting details. Some of the activities that we did were having the students work in groups to
come up with the main idea of a story in 10 words or less, and having discussions of different
books. There was good group interaction and cooperation. One thing that some of the students
struggled with was keeping their summaries short. They wanted to retell the whole story again
instead of picking out the main point. An interesting thing we found was that some students
could easily use this strategy in a group situation, but had difficulty doing it independently.
During the fourth week of intervention we worked on identifying the setting and
characters. Some of the activities used were reading different literature to discuss not only place,
but also times, dates, and seasons as aspects of setting, and using various graphic organizers.
Another activity that we did was having the students choose a character and draw the setting
around them. This activity led to good discussions about different points of view. All of the
students, no matter what the level, had success with using this strategy.
The fifth week of intervention we focused on identifying problems and solutions. Some
of the activities we did were role playing, graphic organizers, and reading different stories that
lent themselves to identifying and understanding cause and effect. All our students worked well
together and the groups ran smoothly. Once again we found that many students had some
difficulty identifying the problem and solution independently.

71
The seventh week involved summarizing strategies or identifying beginning, middle and
end. This week’s activities included having the students highlight the main events of a story
orally, draw beginning, middle, and end pictures after reading different stories, and completing
graphic organizers. Also during the week’s literacy centers, the students listened to a story on a
CD and individually completed a graphic organizer. A problem we faced was that many of the
students wanted to retell the whole story and not just the main points.
Making connections was worked on in week eight. We did a lot of discussion on relating
a book that they read to one that they have previously read, relating a book to themselves and
their lives, and relating a book to the world around them. At Site A there were problems making
text-to-text connections. At Site B there were problems relating texts to previous experiences.
Many of the children in this area came from disadvantaged and low-income families, therefore
making it challenging for parents to offer a broad range of experiences for them. We found it
interesting that at Site B, television and video games appeared to be the main focus of what their
related experiences included.
Week 10 of interventions we worked on reviewing all of the reading strategies. One
activity was we made story cubes. This is where students had to practice setting, characters,
summarizing, and identifying the problem and solution. This was a really good culminating
activity that encompassed all of our strategies.
During weeks three, six, and nine, we did Reader’s Theater (Appendix M). The first
week, we grouped the students according to their reading level. Each student had a script that
was at their level. There was a clear distinction between the low readers and the high readers.
The students knew who the low readers were and who the high readers were. Because of this, the
last two weeks we put the students in mixed ability groups. This was a far more successful plan.

72
It built student confidence, and they enjoyed working with classmates who they typically would
not have been grouped with. This was a highly enjoyable activity for all, and they worked well
together. Of all the experiences that we offered during this project, this was the most successful.
Students were able to improve their fluency, thus improving comprehension.
Weeks 11 and 12 were used to administer student surveys, running records, and
comprehension checklists to compare with the pre-documentation results. Every student
increased their reading level. While we were giving the running records and comprehension
checklists, we noticed that the students answered the questions easier and more quickly than
during pre-documentation. We all felt that they had a better understanding of the strategies.
One intervention we used was guided reading. Each group was made up of approximately
three to six students who met one to three times a week. While meeting with the groups, we
focused on teaching and reinforcing comprehension strategies. These strategies included making
initial predictions, identifying the main idea and supporting details, making connections,
identifying main characters, identifying the setting, stating the problem and solution, and also
summarizing the text by stating the beginning, middle, and end. Students need to be explicitly
taught reading strategies, mainly through guided reading groups (Chevalier, 2002). We used
graphic organizers to help the students understand and apply these strategies. The use of graphic
organizers during guided reading can also help student’s comprehension (Chevalier, 2002,
Anderson, 2002). With each group we introduced and explained new vocabulary that was going
to be in the text. One or two teaching points and new vocabulary should be taught during guided
reading (Kimball-Lopez, 2003). We also used choral reading, repeated reading, echo reading,
buddy reading, and word tracking with the groups. Using processes such as choral reading,

73
repeated reading, buddy reading or word tracking during guided reading can show positive
results (Eldredge, 1990).
Another intervention we used was cooperative learning groups. Group learning is a way
to have kids work together to reach a goal. It is also called cooperative learning (Milios, 2000).
We used cooperative learning groups two to three times per week. The cooperative learning
groups focused on increasing comprehension. The students worked on applying the different
comprehension strategies such as making initial predictions, identifying the main idea and
supporting details, making connections, identifying main characters, identifying the setting,
stating the problem and solution, and also summarizing the text by stating the beginning, middle,
and end while working together in their cooperative learning groups. The students did a variety
of cooperative learning activities. They worked in groups with students of differing ability levels
and completed different tasks and activities to increase comprehension. They read with a partner
or in small groups to strengthen their listening, reading, and speaking skills. When cooperative
learning is used students have a stronger sense of their listening, writing, reading, and speaking
skills (Bromley, 1997). They interacted with other students on a regular basis to increase reading
achievement. Cooperative learning also increases motivation and student interaction (Caposey,
2003). Working in cooperative groups has positive effects on class learning and structure
(Bromley, 1997; Elbaum, 1999; Gillies, 2006; Johnson, 1988, 1997; Stevens, 1991).
The last intervention that we used was Reader’s Theater. Reader’s theater is a successful
way to increase fluency and meaning in reading (Kimball-Lopez, 2003, Martinez, 1998, & Tyler,
2000). We grouped students together and gave them a script to practice. Each child had a part
that was appropriate for their reading level. They had one week to get ready to present one
Reader’s Theater script. They practiced with their groups approximately 10-20 minutes each day

74
for the first four days and then presented it to the class on the fifth day. Since the students are
repeatedly reading the text their fluency is increasing (Martinez, 1998). Reader’s Theater has
many benefits. First, the students see these practices as rehearsals they find more meaning to the
readings. Second, their parts are at their level so they can focus more on the meaning of the
readings. Third, they are able to connect characters and therefore get more out of the text than
just a regular text. Finally, Reader’s Theater also builds enthusiasm (Martinez, 1998). This
activity has appeal to students because it is carried out cooperatively and does not seem as
intimidating as a story because of its format (Tyler, 2000). We implemented this strategy three
times.
I, Teacher Researcher A, have learned that high expectations can and should be set for all
of our students. If they are given the appropriate instruction and tools, they will achieve, and
most likely, surpass those expectations. Focusing on individual comprehension strategies in
depth worked well for my students. They were better able to understand and then apply each
strategy, and it also fit well with my teaching style. I was able to incorporate many picture books
and nonfiction books into my instruction, which built motivation and enthusiasm for reading. I
learned to be much more flexible during this process. I have also found many ways to group
children, and to have them work together that boosts confidence, fosters appositive classroom
environment, and helps the children produce better work. I have also become more accountable
in assessing my students. I have gotten used to making anecdotal notes, which really helps me
know my students and their needs, which was something I did not do very often before.
I, Teacher Researcher B, have learned a lot about teaching, my students, and myself
during this action research project. I am continuously learning more ideas and practices to
implement into my teaching. When looking back at this project, I realized how important it is for

75
students to learn in steps, and not to immerse them into too many things at once. My students
learned and enjoyed learning the reading strategies. I felt that because I introduced each strategy
individually, modeled them, and gave the students opportunities to practice them, the children
really understood them. I also realized how beneficial cooperative learning is to children. They
enjoyed working together and got a lot out of their peers. I think I did a good job presenting the
reading strategies so that the students could get the best out of me. I will continue to do all of the
activities that I did during this project. I see how beneficial it was for my students this year, and I
know that it could be even more beneficial if those strategies and activities were done throughout
the entire year. This action research project made me become a more confident teacher. I clearly
saw the results of the hard work on my part and on the children’s part.
I, Teacher Researcher C, was surprisingly pleased with the effects of the cooperative
learning interventions that were implemented during this action research project. While teaching
reading comprehension skills is a part of most reading curriculums, this particular method, which
concentrated on each skill individually proved to be very advantageous. Students were able to
experience a wide variety of activities, both group and individual, that enhanced their
understanding of each skill. The use of popular children’s literature was extremely effective in
providing multiple experiences. Using Reader’s Theater was also a very successful tool. The
leveled scripts gave children an opportunity to participate, work cooperatively, and practice oral
reading. Practicing oral reading, a necessary skill, is often very mundane and boring. Children
tend to balk at rereading story passages. The use of scripts allowed students to practice, but in a
way that was fun and acceptable. As students read more, fluency and thus comprehension rose. I
will definitely use these interventions again, with only minor adjustments in implementation.
First, I will begin the program immediately at the beginning of the school year. I will allow more

76
time to teach each skill, and will offer more hands-on experiences, especially those to be used in
learning centers. Reader’s Theater will be used more consistently, as this definitely appealed to
students, while providing them with the necessary reading practice. The only drawback that I see
to any implementation is the time that will be involved. It will require a devoted effort to search
for and create weekly activities related to each specific comprehension skill that can be used in
group lessons and learning center projects. The overall block of time used for reading will need
to be restructures in order to accommodate the use of Reader’s Theater regularly. I do believe
that these changes can be made, and that these programs can be successfully included in my
reading curriculum. It is my hope that their use will significantly increase comprehension skills,
when used consistently.
Presentation and Analysis of Results
Throughout the project, the teacher researchers gathered data to assess the effectiveness
of cooperative learning to increase students’ reading comprehension. There were 51 students, 28
elementary teachers, and 51 families of the first and second grade students involved for a total of
184 participants. The researchers compared data gathered from a student survey (Appendix A),
running records (Appendix D), a comprehension checklist for a narrative text (Appendix E), and
a comprehension checklist for an expository text (Appendix F).

77
Student Survey
Students were asked if they liked to read (n=51). Figure 22 shows that 80% (n=41) of the
students liked to read always or often. Twenty percent (n=10) of the students liked to read
sometimes or never liked to read.
There was a 15% (n=8) increase from pre-documentation to post-documentation in the
number of students who liked to read always or often. There was a 15% (n=8) decrease in the
number of students who do not enjoy reading.
Always40%
Often25%
Sometimes25%
Never10%
Always39%
Often41%
Sometimes14%
Never6%
Figure 22: Enjoyment of Reading (n=51)

78
Students were asked if they thought reading was important (n=51). Figure 23 shows that
84% (n=43) of the students felt that reading was always or often important. The remaining 16%
(n=8) of the students felt that reading was sometimes or never important.
There was a 6% (n=3) increase from pre-documentation to post-documentation in the
number of students who felt that reading was important. There was a 6% decrease in the number
of students who felt that reading was sometimes of never important.
Always70%
Often8%
Sometimes20%
Never2%
Always74%
Often10%
Sometimes16%
Never0%
Figure 23: Importance of Reading (n=51)

79
Students were asked if they understood the books that they read (n=51). Figure 24 shows
that 80% (n=41) of students felt that they always or often understood what they read, while 20%
(n=10) of students felt that they sometimes or never understood what they read.
There was a 6% (n=3) increase from pre-documentation to post-documentation in the
number of students who felt that they always or often understood what they read, while there was
a 6% (n=3) decrease in the number of students who sometimes or never understood what they
read. It is important to note that “never” was not selected by any student during the post survey,
whereas three students selected “never” in the pre survey.
Always 56%
Often18%
Sometimes20%
Never6%
Always 47%
Often33%
Sometimes20%
Never0%
Figure 24: Reading Comprehension (n=51)

80
Students were asked if they learned ways at school to help them understand what they
read (n=51). Figure 25 shows that a noteworthy amount of students (82%, n=42) thought that
they always or often learned ways at school to help them understand what they read.
There was not a marked change in the data from the pre to the post survey.
Always51%
Often27%
Sometimes22%
Never0%
Always51%
Often31%
Sometimes18%
Never0%
Figure 25: Learning Reading Strategies at School (n=51)

81
Students were asked if they read at home (n=51). Figure 26 shows that 74% (n=38) of
students always or often read at home. Twenty-six percent (n=13) of students sometimes or
never read at home.
There was a noteworthy increase (15%, n=8) from pre-documentation to post-
documentation in the number of students who read at home.
Always41%
Often18%
Sometimes31%
Never10%
Always49%
Often25%
Sometimes24%
Never2%
Figure 26: Reading at Home (n=51)

82
Figure 27 shows the instructional reading levels of each student in the second grade
classroom of Teacher Researcher A (n=17). The average reading level was 23, and there was a
range of 21 levels between the lowest and highest student. At the end of second grade, students
should be reading at a level 22. Two students were not meeting these expectations.
The average reading level in the classroom was 19 during pre-documentation and 23
during post-documentation, which is an increase of four levels, with every student making
improvement. Five students who were not meeting expectations earlier are now at grade level.
123456789
1011121314151617181920212223242526272829303132333435
1 2 3 4 5 6 7 8 9 10 11 12 13 14 15 16
Students
Rea
ding
Lev
els
PrePost
Figure 27: Instructional Reading Levels in the Classroom of Teacher Researcher A (n=17)

83
Figure 28 shows the instructional reading levels of each student in the first grade
classroom of Teacher Researcher B (n=19). The average reading level was 22, and there was a
range of 23 levels between the lowest and highest student. At the end of first grade, students
should be reading at a level 16. One student was not meeting these expectations.
The average reading level in the classroom was 14 during pre-documentation and 22
during post-documentation, which is an increase of eight levels, with every student making
improvement. Four students who were not meeting expectations earlier are now at grade level.
123456789
1011121314151617181920212223242526272829303132333435
1 2 3 4 5 6 7 8 9 10 11 12 13 14 15 16 17 18 19
Students
Rea
ding
Lev
els
PrePost
Figure 28: Instructional Reading Levels in the Classroom of Teacher Researcher B (n=19)

84
Figure 29 shows the instructional reading levels of each student in the second grade
classroom of Teacher Researcher C (n=15). The average reading level was 23, and there was a
range of 13 levels between the lowest and highest student. At the end of second grade, students
should be reading at a level 22. Five students were not meeting these expectations.
The average reading level in the classroom was 19 during pre-documentation and 23
during post-documentation, which is an increase of four levels, with every student making
improvement. Two students who were not meeting expectations earlier are now at grade level.
123456789
1011121314151617181920212223242526272829303132333435
1 2 3 4 5 6 7 8 9 10 11 12 13 14 15
Students
Read
ing
Leve
ls
PrePost
Figure 29: Instructional Reading Level in the Classroom of Teacher Researcher C (n=15)

85
Comprehension Checklist
The teacher researchers gave running records to each student (n=51). Figure 30 shows
what strategies students were able to use while reading a narrative text. Ninety-two percent
(n=47) made predictions successfully, 90% (n=46) identified the setting, 75% (n=38) made a
connection, 94% (n=48) identified main characters, 84% (n=43) identified the problem, 80%
(n=41) identified the solution. When summarizing the story, 94% (n=48) of students included
events from the beginning, 88% (n=45) included events from the middle, 78% (n=40) included
events from the end, and 75% (n=38) summarized the events in order.
There was a 31% (n=16) increase in the number of students who could retell the story in
sequence. There was a 30% (n=14) increase in the number of students who could restate the
solution. There was an 18% (n=10) increase in the number of students who could restate the
problem. There was a 16% increase (n=9) in the number of students who could identify the main
character.
0
10
20
30
40
50
60
Predict
ion
Setting
Main ch
arac
ters
Beginn
ing
Problem
Mak
e a co
nnec
tion
End
Midd
le
Solutio
n
Seque
nce
Freq
uenc
y
PrePost
Figure 30: Comprehension Checklist: Narrative Text (n=51)

86
The teacher researchers also gave a running record to each student (n=51) for an
expository text. Figure 31 shows that 94% (n=48) of students restated the topic or main idea,
84% (n=43) of students made an initial prediction, 76% (n=39) of students could make a
connection to the text, and 76% (n=39) of students restated three supporting details.
It is noted that the largest growth was in restating three supporting details (26%, n=14).
0
10
20
30
40
50
60
Main Idea Prediction Connections Details
PrePost
Figure 31: Comprehension Checklist: Expository Text (n=51)
Conclusions and Recommendations
The data that was collected and analyzed about using cooperative learning as a tool to
increase reading comprehension showed that when specific strategies are implemented, students’
reading comprehension increased and the students were successful.

87
Based on running records administered at all three sites, the students’ reading levels
improved, on average, 5 levels. Prior to our interventions, 18 students were reading below grade
level. After interventions were implemented, only eight students were reading below grade level.
The comprehension checklist that was given at all three sites shows an increase in every
strategy that was presented to the students. There was a marked increase in the number of
students who were able to recall and state three supporting details from an expository text. This
was a strategy that our students really struggled with before. When reading a narrative text,
students increased in their ability to summarize the story in order. There was also a noteworthy
increase in the students’ ability to recall events from the middle of the story. Our students were
also better able to restate the solution to the problem in the story. Normally, these strategies
would not be focused on individually or as extensively. Due to the format that we used in our
action research project, we felt that more students had success at mastering these strategies. We
felt that it was important to present one strategy at a time, go over it in depth, model the strategy,
and give them a variety of opportunities to practice and apply those strategies with a variety of
texts. This was a very beneficial way for our students to improve their reading comprehension
skills.
Based on the student survey that was given at all three sites, we saw an increase in
students’ attitudes about reading, their feelings about the importance of reading, how much they
understood what they read, and how much they read at home.
In addition to the students’ academic success, we saw an increase in enthusiasm and
motivation towards reading. We feel that this is largely due to the fact that we implemented
Reader’s Theater, and we used a variety of literature to focus on each different strategy. It was

88
obvious that the students looked forward to and enjoyed working in their groups, especially
when they were practicing Reader’s Theater scripts.
Using cooperative learning as a method of teaching turned out to be a valuable tool to
help students learn comprehension strategies while encouraging positive interactions among
peers. All three of us will implement this teaching method again. We will start introducing the
different strategies at the beginning of the school year, which will enable us to spend more time
on each one. We will also make time to implement Reader’s Theater on a more consistent basis,
as this proved to be one of the most successful interventions that we used. Another change we
would make is to assess students’ reading levels and understanding of comprehension strategies
every quarter. This would give us the opportunity to not only see continuous growth, but also to
adjust instruction where appropriate.

89
REFERENCES Albers, S.R., & Foil, C.R (2003). Drama activities that promote and extend your students
vocabulary proficiency. Intervention in School and Clinic, 39(1), p22-29. Anderson, T., O’Leary, D., Schuler, K., & Write, L. (2002). Increasing reading comprehension
through the use of guided reading (RIEAUG2003). Illinois, United States: Saint Xavier University and Skylight Professional Development Field-Based Masters Program.
Annarella, L.A. (1999). Using readers theater in the classroom. Unpublished manuscript opinion
papers (120). Armbruster, B.B., Lehr, F. & Osborn, J. (2001), Put reading first-The research building blocks for teaching children to read. (Development Centers Program,
PR/Award Number R35R 70004), Office of Educational Research and Improvement, U.S. Department of Education.
Brabham, E. G. (2000). Continuing conversations about literature circles. The Reading Teacher,
54(3), 278-280. Bromley, K., & Modlo, M. (1997). Using cooperative learning to improve reading and writing in
language arts. Reading and Writing Quarterly: Overcoming Learning Difficulties, 13(1), 21-35.
Caposey, T., & Heider, B. (2003). Improving reading comprehension though cooperative
learning (CS 512 283). Illinois, United States: Saint Xavier University and Skylight Professional Development Field-Based Masters Program.
Chevalier, K., Del Santo, J., Schneiner, D., Skok, E., & Tucci, L.R. (2002). Comprehension: The
key to reading success (RIEMAR2003). Illinois, United States: Saint Xavier University and Skylight Professional Development Field-Based Masters Program.
City-Data.com. (n.d.). Site A, Illinois. Retrieved June 28, 2006, from http://www.city-data.com/ City-Data.com. (n.d.). Site B, Illinois. Retrieved June 28, 2006, from http://www.city-
data.com/city/SiteB-Illinois.html Day, C. (2003). Reading and responding in literature circles (Report No. PETA-PEN-140). New
South Wales, Australia: Primary English Teaching Association. (ERIC Document Reproduction Service No. ED480271)
District Site A. (n.d.). District site A educational foundation. Retrieved June 28, 2006, from
http://www.districtsiteA.com/ Elbaum, B., Moody, S. W., & Schumm, J. S. (1999). Mixed-ability grouping for reading: What
students think. Learning Disabilities Research and Practice, 14(1), 61-66.

90
Eldredge, J. L. (1990). Increasing the performance of poor readers in the third grade with a group assisted strategy. Brigham Young University: Provo, Utah.
Encyclopedia of Chicago. (2005). Site A, IL Retrieved June 28, 2006, from http://encyclopedia.chicagohistory.org/
Fink, L. (2003). Literature circles: Getting started. (ERIC Document Reproduction Service No. ED480242)
Ford, M. P., & Opitz, M. F. (2002). Using centers to engage children during guided reading time:
Intensifying learning experiences away from the teacher. Reading Teacher, 55(8), 710-717.
Galloway-Bell, S. (2003). A review of the literature: The effectiveness of leveled reading groups
in improving oral proficiency and comprehension to first grade students. San Rafael, CA: Dominican University of California: Division of Education. (ERIC Document Reproduction Service No. ED479119)
Gauthier, L. R. (2001). Coop-Dis-Q: A reading comprehension strategy. Intervention in school
and clinic, 36(4), 217-220. Gillies, R. M. (2006). Teachers’ and students’ verbal behaviours during cooperative and small-
group learning. British Journal of Educational Psychology, 76(2), 271-287. Guthrie, J. T., Wigfield, A., Humenick, N. M., Perencevich, K. C., Taboada, A., & Barbosa, P.
(2006). Influences of Stimulating Tasks on Reading Motivation and Comprehension. Journal of educational research, 99(4), 232-245.
Illinois State Board of Education. (n.d.). 2005 Illinois state report card. Retrieved June 28, 2006,
from http://www.districtsiteA.com/ Illinois State Board of Education. (n.d.). 2005 Illinois State report card. Retrieved June 28, 2006,
from http://www.siteB.com/reportcard/B%202005.pdf Jacobs, G. M. (1998). Cooperative learning techniques in reading instruction. Paper
presented at the SAAL and STU seminar on reading in multilingual contest: From theory to practice, Singapore, June 23, 1998.
Johnson, D.W., & Johnson, R.T. (1988, 1997). Cooperative learning, two heads are better than
one. Context Institute. Available at: http://www.context.org/ICLIB/IC18/Johnson.htm, 10/18/06
Kimball-Lopez, K. (2003). Just think of the possibilities: Formats for reading instruction in the
elementary classroom [Electronic version]. Reading Online, 6. (ERIC Document Reproduction Service No. EJ671174)

91
King, C. (2001). “I like group reading because we can share ideas”: The role of talk within the literature circle. Reading, 35(1), 32-35.
Lin, C. H. (2004). Literature circles. Teacher Librarian, 31(3), 23-25. Lloyd, S. W. (2004). Using comprehensive strategies as a springboard for student talk. Journal
of Adolescent and Adult Literacy, 48(2), 114-124. (ERIC Document Reproduction Service No. EJ684277)
Love, F. E., Batts, S. A. & Love-Owens, S. L. (1995). Using literature to build literacy.
Paper presented at the 1st Combined International Reading Conference-Great Lakes-Southwest. (ERIC document reproduction service No. ED393062)
Martinez, M., Roser, N. L., & Strecker, S. (1998). “I never thought I could be a star”: A
reader’s theater ticket to fluency. Reading Teacher, 52(4), 326-334. Mathes, P. G., Fuchs, D., & Fuchs, L. (2001). Cooperative story mapping (Report No. 0741
9325, 19970101). Tallahassee, FL: Department of Special Education, Florida State University. (ERIC document reproduction service No. EJ540975)
Mathes, P. G., Fuchs, D., & Fuchs, L. S. (1997). Cooperative story mapping. Remedial and
Special Education, 18, 20-27. Milios, R. (2000). Working together to reach a goal. Current Health, 24(2), 26-28. O’Donnell, A. M., & O’Kelly, J. (1994). Learning from peers: Beyond the rhetoric of positive
results. Educational Psychology Review, 6(4), 321-349. Schwartz, R. M. (2005). Decisions, decisions: Responding to primary students during guided
reading. Reading Teacher, 58(5), 436-443. Simplicio, J. S. C. (2003). Effectively using group reading strategies to enhance comprehension.
Reading Improvement, 40(3), 110-112. Site B Elementary School District #6. (2005). Site B Elementary. Retrieved June 28, 2006, from
http://www.siteB.com/schools/we/mission%20statement.html Slavin, R. E. (1999). Comprehensive approaches to cooperative learning: Roots and wings
program. Theory into Practice, 38(2), 74-79. Slavin, R. E., Madden, N. A., Farnish, A. M., & Stevens, R. J. (1995). Cooperative integrated
reading and composition (CIRC): A brief overview. (Contract Nos. G-83-00012; NIE-G-80-0113; OERI-G-86-0006). Washington, DC: National Institute of Education (ED), Washington, DC: Office of Educational Research and Improvement (ED), Washington, DC: National Diffusion Network; Office of Special Education and Rehabilitative Services (ED). (ERIC Document Reproduction Service No. ED378569)

92
Smith, C. B. (1997). Vocabulary instruction and reading comprehension. Eric Digest Bloomington, IN: ERIC Clearinghouse on Reading and Communication Skills. (ERIC document reproduction service No. ED328885)
Stevens, R. J., Slavin, R. E., & Farnish, A. M. (1991). The effects of cooperative learning and
direct instruction in reading comprehension strategies on main idea identification. Journal of Educational Psychology, 83(1), 8-16.
Tyler, B.J., & Chard, D. (2000). Using readers theater to foster fluency in struggling
readers. Reading and Writing Quarterly: Overcoming learning difficulties 16(2).
U.S. Census Bureau. (2000). Census 2000 demographic profile highlight. Retrieved June 28, 2006, from http://www.factfinder.census.gov
U.S. Census Bureau. (2000). Zip code tabulation area 60099. Retrieved June 28, 2006, from http://factfinder.census.gov/servlet/SAFFFacts?_event=Search&geo_id=&_geoContext=
&_street=&_county=60099&_cityTown=60099&_state=&_zip=60099&_lang=en& sse=on&pctxt=fph&pgsl=010
Vaughn, S., & Klingner, J. K. (1999). Teaching reading comprehension through collaborative
strategic reading. Intervention in School and Clinic, 34(5), 284-292. Vaughn, S., Klingner, J. K., & Bryant, D. P. (2001). Collaborative strategic reading as a means
to enhance peer-mediated instruction for reading comprehension and content-area learning. Remedial and Special Education, 22(2), 66-74.
Welcome to the City of Site A, Illinois. (2006). History of site A. Retrieved June 28, 2006, from
http://www.city ofsiteA.com/media/history_of_siteA/index.htm Welcome to the City of Site B, Illinois. (2006). Retrieved June 28, 2006, from
http://www.cityofsiteB.com/ Welcome to the City of Site B, Illinois. (2006). City of site B headline developments March
2006. Retrieved June 28, 2006, from http://www.cityofsiteB.com/city_departments/economic_development/developments.htm
Welcome to the City of Site B, Illinois. (2006). History of site B. Retrieved June 28, 2006, from
http://www.cityofsiteB.com/media/history_of_siteB/index.htm Welcome to the City of Site B, Illinois. (2006). The place for family fun. Retrieved June 28,
2006, from http://www.cityofsiteB.com/tourism/ Whitehead, D. (2002). “The story makes more sense to me now”: Teaching thinking through
guided reading. Reading: Literacy and Language, 36(1), 33-37.

93
Whitin, P. (2002). Leading into literature circles through the sketch-to-sketch strategy. The Reading Teacher, 55(5), 444-450.
Wood, K. D., & Jones, J. (1998). Tips for teaching [Electronic version]. Preventing School
Failure, 43(1), 37-38. Wood, K. D., Roser, N. L., & Martinez, M. (2001). Collaborative literacy: Lessons learned from
literature. Reading Teacher, 55(2), 102-111.

APPENDICES
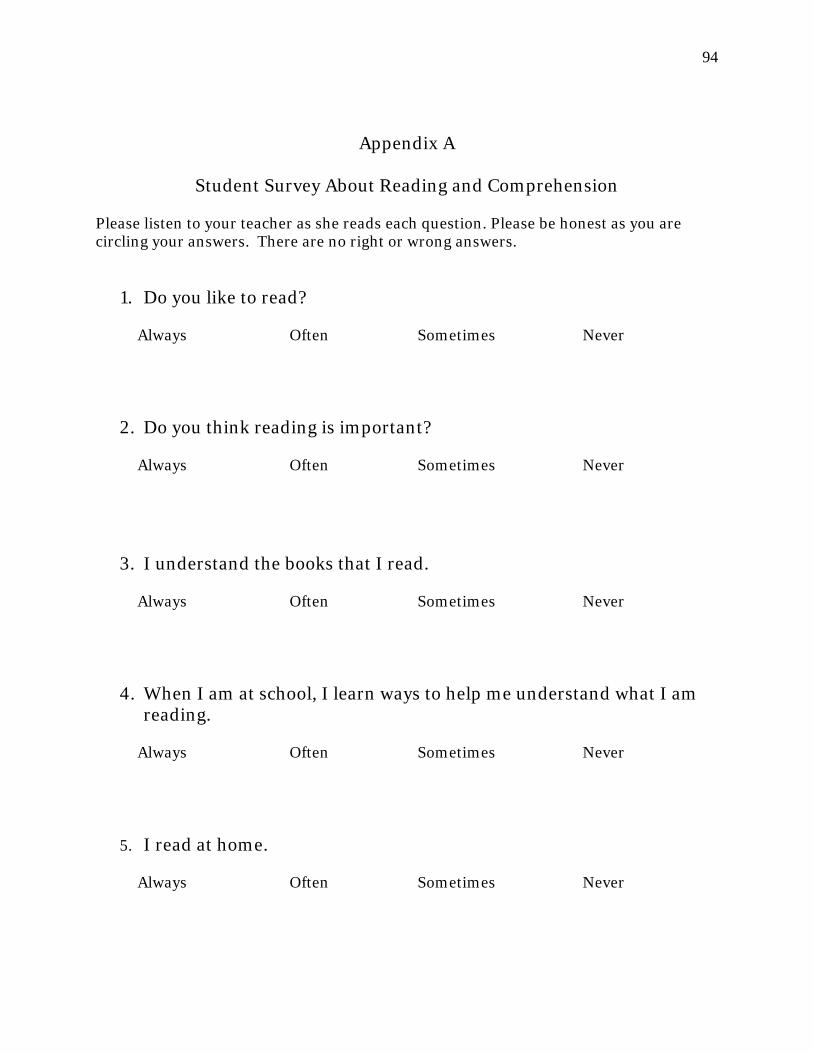
94
Appendix A
Student Survey About Reading and Comprehension Please listen to your teacher as she reads each question. Please be honest as you are circling your answers. There are no right or wrong answers.
1. Do you like to read?
Always Often Sometimes Never 2. Do you think reading is important?
Always Often Sometimes Never
3. I understand the books that I read.
Always Often Sometimes Never
4. When I am at school, I learn ways to help me understand what I am
reading.
Always Often Sometimes Never
5. I read at home.
Always Often Sometimes Never

95
Appendix B
Parent Survey About Reading and Comprehension Your assistance is needed in collecting information about reading and comprehension. PLEASE DO NOT PUT YOUR NAME ON THIS SURVEY. Please return the survey in the attached envelope with your child by Monday, February 5, 2007. Thank you so much for taking the time to complete this survey.
*Please note that there is a front and back to this survey.
1. Do you read at home?
Always Often Sometimes Never 2. Do you read with your child at home?
Always Often Sometimes Never
3. Do you feel your child understands what they are reading?
Always Often Sometimes Never
4. Circle any that you do with your child before, during, or after reading.
Make Predictions Retell or Summarize Relate what you are reading to other experiences Discuss real and make-believe Compare and Contrast Find the main idea and supporting details Identify characters, setting, plot, problems, and solutions

96
5. Please circle what kinds of books do you read with your child most often?
Nonfiction books Picture books Fiction books Chapter books

97
Appendix C
Classroom Teacher Survey About Comprehension Your assistance is needed in collecting information about reading comprehension. Please return the form in the attached envelope by Monday, February 5, 2007 to Amanda Hollingsworth’s or Cindy Zaugra’s mailbox. Thank you so much for taking the time to complete this survey.
*Please note that the scales differ for each question and there is a front and back to this survey.
1. Do you see students making connections to what they are reading and their background knowledge?
Consistently Most of the time Sometimes Never
4 3 2 1 2. Do you see low reading comprehension as a problem in your
classroom?
Not a problem Slight problem Moderate Problem
Significant problem
4 3 2 1
3. Do you feel prepared and confident to teach comprehension strategies with the materials and resources available to you?
Extremely
confident and prepared
Mostly confident and
prepared
Somewhat confident and
prepared
Not at all confident and
prepared 4 3 2 1

98
4. What strategies/activities do you do in your classrooms that promote reading comprehension? Circle all that apply.
Guide Reading Literature Circles Reader’s Theater Direct Instruction Cooperative Learning /Groups Other (please specify)_______________
5. Do you feel that your students are motivated to read?
Always Often Sometimes Never 4 3 2 1

99
Appendix D
Running Record Form

100
Appendix E
Comprehension Checklist: Narrative Text Student Name______________________Date____________ Title/Author_______________________________________ Level of book__________
Strategies to be assessed
Check if student is able to do
Can make an initial prediction Can identify main characters Can identify the setting Can restate the problem Can restate the solution Summarize
Beginning_____ Middle_____ End_____ In Sequence______
Can make a connection Comments/Analysis __________________________________________________________________________________________________________ Future Support Needed __________________________________________________________________________________________________________

101
Appendix E
Comprehension Checklist: Expository Text Student Name______________________Date____________ Title/Author_______________________________________ Level of book__________
Strategies to be assessed
Check if student is able to do
Can make an initial prediction Can restate topic or main idea Can restate three supporting details
Can make a connection Comments/Analysis _________________________________________________________________________________________________________________________________________________________________________________________________________________________________________________________________________ Future Support Needed _________________________________________________________________________________________________________________________________________________________________________________________________________________________________________________________________________

102
Appendix F
Making Predictions Graphic Organizer

103
Appendix G
Identifying Main Idea and Details Graphic Organizer

104
Appendix H
Identifying Characters Graphic Organizer

105
Appendix I
Identifying Problems and Solutions Graphic Organizer
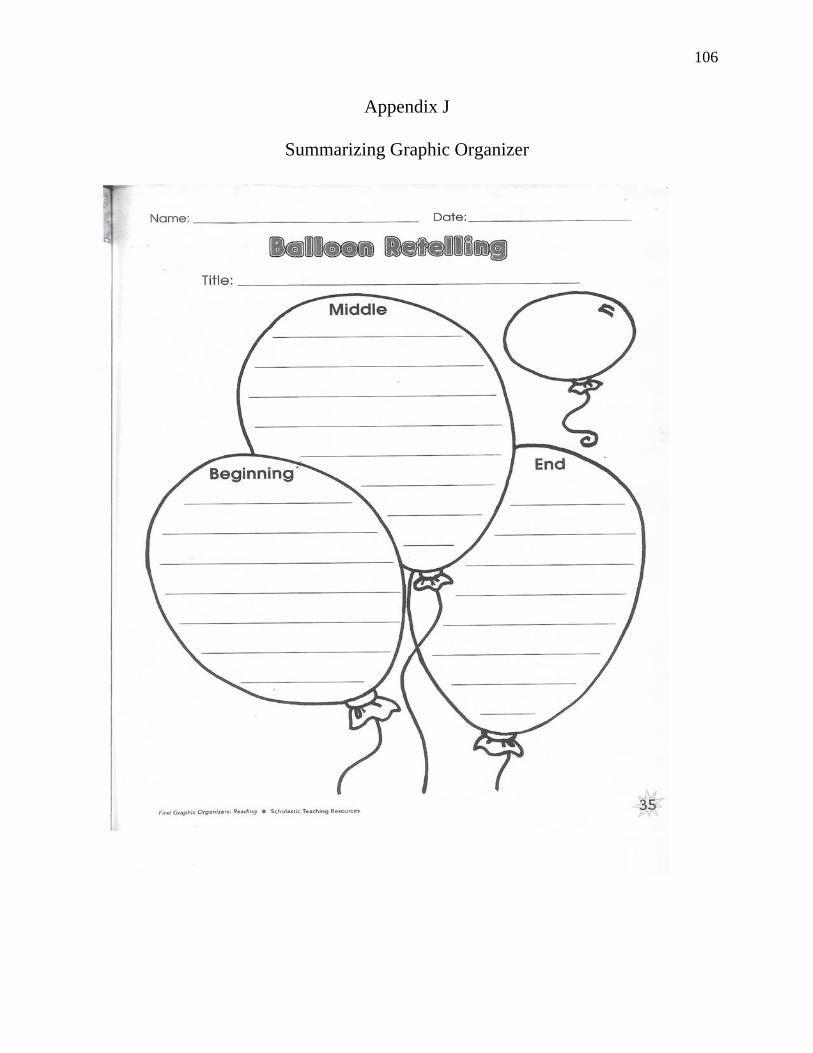
106
Appendix J
Summarizing Graphic Organizer

107
Appendix K
Making Connections Graphic Organizer
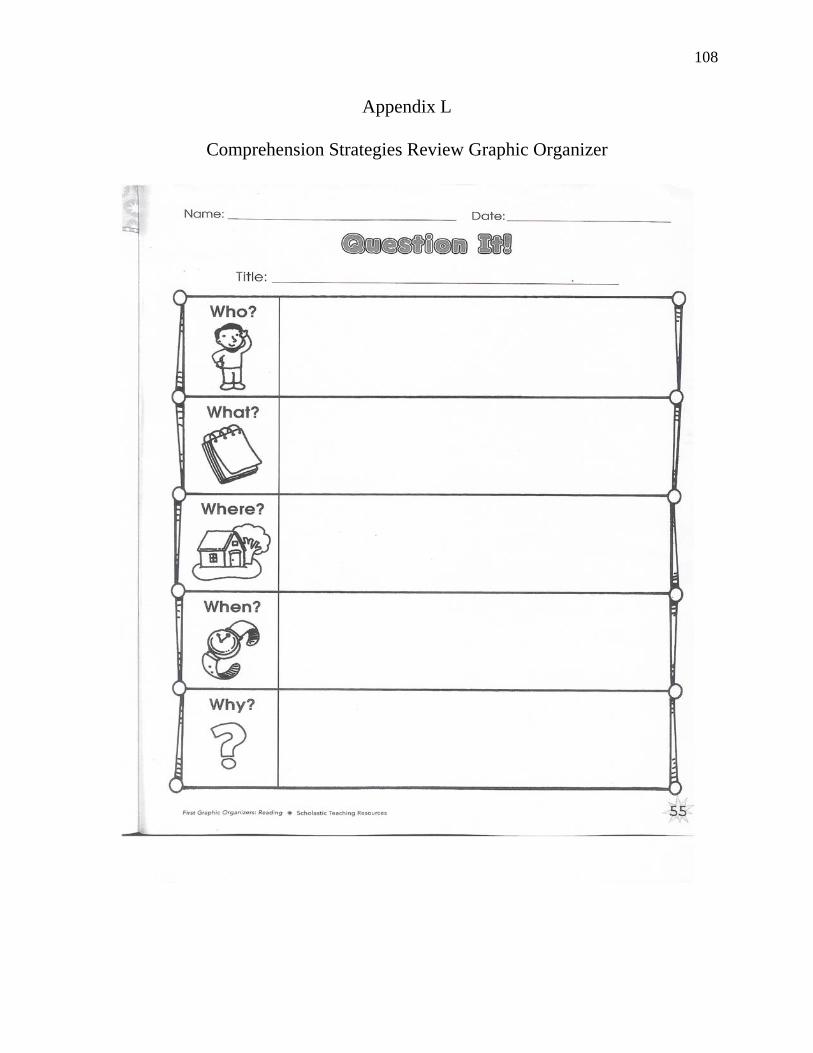
108
Appendix L
Comprehension Strategies Review Graphic Organizer

109
Appendix M
Page from a Reader’s Theater Script