increasing parent engagement in student learning using an its with automated messages. a thesis...
TRANSCRIPT


Increasing parent engagement in student learning using an ITS with automated messages.A thesis presentation for the degree of Master of Science in Computer Science by Zachary Broderick
Advisor: Neil HeffernanReader: Carolina RuizMarch 1st, 2011

• Introduction• Background
• ASSISTments
• Component Development
• Exploratory Study• Methods
• Results
• Discussion
• Experiment• Methods
• Results
• Discussion
Overview and Outline

• Intuition and literature:• Parental involvement in student
learning is beneficial (homework too)
• Contingent on access to information• Controlled by student
• Often limited to report card
• Direct communication with teacher costly
Introduction > Background

• Intelligent Tutoring Systems• Tutoring in software
• Collects detailed learning data used by teachers and students
• Give access to parents
• Possibilities• Carnegie Learning, Andes, IMMEX
• PowerSchool, Study Island
Introduction > Background

• ASSISTments• Free, online ITS developed at WPI
• Teachers create virtual classroom
• Students complete assignments
• Data presented in reports
Introduction > Background

Introduction > Background

• Parental Notification Component• Teachers give parents accounts
• Access to reports
• Messages from teacher
• Automated Messages
Component Development

Component Development

Component Development

• New area of research• Does the code work?
• Will parents be able to use the data?
• Will it improve engagement?
• What is teacher/parent feedback?
• What will we need to do to test it?
Exploratory Study

• Fall Pilot Test• Conducted at local middle school
• 2 ASSISTments (PIMSE) partner teachers
• 4 classes of 20 students, 8th grade math
• All parents invited to sign up
• Few logged in again after signing up
Exploratory Study > Methods

• Spring Experiment• Send messages from teachers to
remind parents to log in
• Pre/post survey to measure engagement
• Student survey as well
• Compare server logs against Fall pilot
• Monitor student performance
Exploratory Study > Methods

Exploratory Study > Methods
Exploratory Study
• Local middle school• Two ASSISTment teachers• 8th grade math, honors and non-honors• 4 classes/teacher, 20 students/class
• Students assigned to condition by class, 1 honors and one non-honors per teacher
• All parents invited in Fall, exp group sent messages in Spring
Condition Fall Spring
Experiment
• Parents are invited to sign up for accounts on ASSISTments and pilot parent notification.
• Parent activity is recorded in server logs
• Parents and students are given pre-survey to measure engagement
• Parents receive messages from teachers throughout the semester
• Parent activity is recorded in server logs• Parents and students are given post-survey
Control*
*(the control group is largely ignored in this study)
• Parents are invited to sign up for accounts on ASSISTments and pilot parent notification.
• Parent activity is recorded in server logs
• Parents can still use ASSISTments but do NOT receive messages from the teacher

• Parents logged in more• Parents felt more engaged• Student performance did not
improve
Exploratory Study > Results

Exploratory Study > Results
Table 3.1Parent responses to pre-survey questions on engagement
Survey Question
Survey Answer Averages
Pre Post Post - Pre
% of parents whose score:
IncreasedDecrea
sed Neither
I feel I have a good understanding of what is going on in my student’s math class.
3.58(0.90)
3.9(0.88) 0.32a 42% 21% 37%
I feel I have a good understanding of HOW my student is doing in math class.
4.06(0.80)
4.22(0.65) 0.17 33% 22% 45%
My child thinks I know how well he or she is performing in math class.
4.33 (0.69)
4.33(0.59) 0.00 17% 17% 66%
I feel my school is *not* giving me enough information to adequately monitor my student’s progress.
1.61(0.78)
1.78(0.88) 0.17 28% 28% 44%
In the past week, how frequently did you check up on your student’s homework?
2.58(1.22)
2.16 (0.9) -0.42 16% 32% 52%
How often do you give consequences (rewards/punishments) for grades and homework completion?
2.42(1.26)
2.16(1.21) -0.26 26% 47% 27%
How often have you interacted with ASSISTments in the last 30 days?
2.16(1.26)
2.63(0.9) 0.47 58% 26% 16%
How often did you initiate contact with your student’s teacher in the last 30 days?
0.11(0.32)
0.05(0.23) -0.05 5% 11% 84%
Standard deviations are noted in parentheses.a p ≤ 0.05 (approx.), effect size = 0.35

Exploratory Study > Results
Table 3.2Student responses to pre-survey questions on engagement
Survey Question
Survey Answer Averages
Pre Post Post - Pre
% of students whose score:
IncreasedDecreased Neither
I think my parents know what I’m doing in math class. 3.22
(1.06)3.31
(1.03) 0.08 34% 29% 37%
I think my parents know HOW I’m doing in math class. 4.25
(0.84)4.34
(0.78) 0.09 28% 21% 51%
My parents say down and helped me with my ASSISTment work this year.
36% 34% -2% 7% 9% 84%
Standard deviations are noted in parentheses.

Exploratory Study > Results
Table 3.3
Changes in Homework Completion Rates Based on Message Reception
Homework Completion RateGain
Received Messages Didn’t Receive Messages
Homework completed on time. -1.06%(14%)
2.13%(20%)
Homework completed by end of semester. 5.09%(22%)
3.77%(13%)
Average days late -5.84(9.49)
-4.44(5.96)
Standard deviation in parentheses.

Exploratory Study > Results
Table 3.4
Changes in Homework Completion Rates Based on Message Reception (Non-honors Students)
Homework Completion RateGain
Received Messages Didn’t Receive Messages
Homework completed on time. 4.38%(16%)
-0.55%(24%)
Homework completed by end of semester. 9.33%(30%)
5.93%(13%)
Average days late -10.63(11.27)
-6.78(6.62)
Standard deviation in parentheses.

Exploratory Study > Results
Table 3.5
Correlation of gains in homework completion rates with frequency of requests by parents for non-inbox pages of
ASSISTments
Homework Completion RateGain
Average Correlation
Homework completed on time.-6.03% 0.78**
Homework completed by end of semester.10.74% 0.54
Average days late-9.13 -0.33
**p ≤ 0.01

• Conclusion:• Parents need to be reminded
• Need stronger intervention
• Automated Messages:• More frequent, higher coverage
• Parents feel more engaged but…• Need stronger experimental design to
detect more reliably (noisy data)
• Might even detect performance gains
• Positive feedback
Exploratory Study > Discussion

Experiment > Methods
Experiment
• Local middle school• Two ASSISTment teachers• 7th grade math• 4 classes/teacher, 20 students/class
• Students assigned to condition by going through roster alphabetically
• Two units, 15 assignments and 1 test each• Intervention during 2nd unit for exp. group
Condition Unit 1 Unit 2
Experiment
• Students complete 15 homework assignments on ASSISTments.
• Students are given unit test• Parents are not yet involved
• Parents are given pre-survey to measure engagement
• Parents are invited to sign up for accounts on ASSISTments
• Parents receive automated messages from the system throughout the unit
• Students complete 15 homework assignments on ASSISTments
• Students are given unit test• Parents are given post-survey
Control
• Students complete 15 homework assignments on ASSISTments.
• Students are given unit test• Parents are not involved
• Parents are given pre-survey to measure engagement
• Parents are NOT given accounts and do NOT receive automated messages
• Students complete 15 homework assignments on ASSISTments
• Students are given unit test• Parents are given post-survey

Experiment > Results
Table 5.1Parent responses to survey questions on engagementScaled 1-5, 1=Strongly Disagree, 5=Strongly Agree
Survey QuestionControl Experiment
Unit 1 Unit 2 Gain Unit 1 Unit 2 Gain ∆Gain
I feel I have a good understanding of what is going on in my student’s math class. 3.47
(0.94)3.94
(0.83)0.47
(0.87)3.32
(1.08)3.77
(0.88)0.45
(1.03) -0.02
I feel I have a good understanding of how my student is performing in math class. 3.88
(0.99)4.29
(0.92)0.41
(0.94)3.74
(0.93)4.10
(0.79)0.35
(0.80) -0.06
I feel I am being provided enough information about my student's performance. 4.00
(1.06)4.18
(0.81)0.18
(1.01)4.03
(0.87)4.23
(0.72)0.19
(0.91) 0.02
I check to make sure my student has completed their homework at night.
3.59(1.00)
3.24(1.30)
-0.35(1.73)
3.74(1.34)
3.97(1.14)
0.23(1.12) 0.58
I closely monitor my student's performance (as in, check grades on assignments and tests) 4.29
(0.92)4.06
(1.03)-0.24(1.35)
4.19(0.79)
4.39(0.76)
0.19(0.65) 0.43
Standard deviations are noted in parentheses.N = 48
Experiment > Results
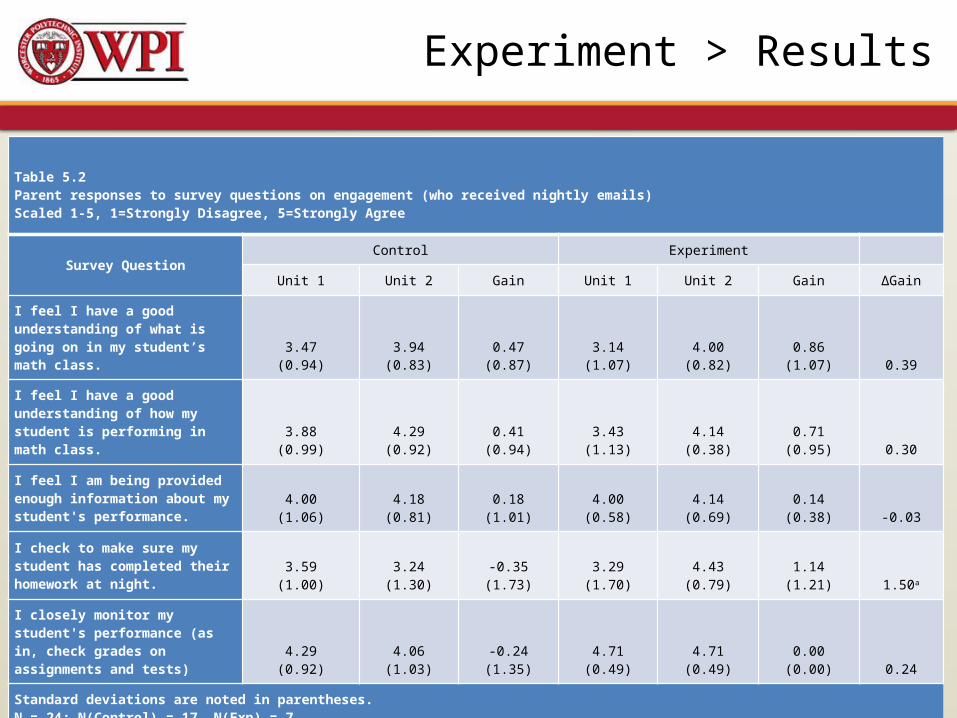
Table 5.2Parent responses to survey questions on engagement (who received nightly emails)Scaled 1-5, 1=Strongly Disagree, 5=Strongly Agree
Survey QuestionControl Experiment
Unit 1 Unit 2 Gain Unit 1 Unit 2 Gain ∆Gain
I feel I have a good understanding of what is going on in my student’s math class.
3.47(0.94)
3.94(0.83)
0.47(0.87)
3.14(1.07)
4.00(0.82)
0.86(1.07) 0.39
I feel I have a good understanding of how my student is performing in math class. 3.88
(0.99)4.29
(0.92)0.41
(0.94)3.43
(1.13)4.14
(0.38)0.71
(0.95) 0.30
I feel I am being provided enough information about my student's performance.
4.00(1.06)
4.18(0.81)
0.18(1.01)
4.00(0.58)
4.14(0.69)
0.14(0.38) -0.03
I check to make sure my student has completed their homework at night.
3.59(1.00)
3.24(1.30)
-0.35(1.73)
3.29(1.70)
4.43(0.79)
1.14(1.21) 1.50a
I closely monitor my student's performance (as in, check grades on assignments and tests)
4.29(0.92)
4.06(1.03)
-0.24(1.35)
4.71(0.49)
4.71(0.49)
0.00(0.00) 0.24
Standard deviations are noted in parentheses.N = 24; N(Control) = 17, N(Exp) = 7ap < 0.05, Effect Size=0.95

Experiment > Results
Table 5.3Parent responses to survey questions on engagement (low students)Scaled 1-5, 1=Strongly Disagree, 5=Strongly Agree
Survey QuestionControl Experiment
Unit 1 Unit 2 Gain Unit 1 Unit 2 Gain ∆Gain
I feel I have a good understanding of what is going on in my student’s math class.
3.67(0.98)
3.92(1.00)
0.25(0.87)
3.29(1.06)
3.81(0.81)
0.52(1.08) 0.27
I feel I have a good understanding of how my student is performing in math class. 4.08
(0.79)4.17
(1.03)0.08
(0.67)3.48
(0.93)3.90
(0.77)0.43
(0.81) 0.35
I feel I am being provided enough information about my student's performance.
4.25(0.87)
4.08(0.90)
-0.17(0.58)
3.86(0.91)
4.24(0.70)
0.38(0.86) 0.55a
I check to make sure my student has completed their homework at night.
3.67(0.89)
3.17(1.40)
-0.50(1.73)
3.67(1.20)
3.95(1.17)
0.29(0.78) 0.79
I closely monitor my student's performance (as in, check grades on assignments and tests)
4.33(0.78)
4.00(1.13)
-0.33(1.30)
4.00(0.77)
4.29(0.78)
0.29(0.72) 0.62
Standard deviations are noted in parentheses.N = 33ap < 0.05, Effect Size=0.86

Experiment > Results

Experiment > Results

Experiment > Results

Experiment > Results

Experiment > Results
Table 5.4Student performance data
Performance MetricControl Experiment
Unit 1 Unit 2 Gain Unit 1 Unit 2 Gain ∆Gain
Avg percent of assignments completed
93.85(10.55)
95.37(11.02)
1.52(10.09)
93.44(10.69)
97.87(5.58)
4.43(10.01) 2.91
Avg percent of assignments completed on time
84.16(14.56)
84.57(16.66)
0.41(15.89)
84.83(13.44)
87.18(14.49)
2.35(14.83) 1.94
Avg unit test score 3.23(0.63)
3.20(0.68)
-0.04(0.63)
3.32(0.51)
3.22(0.62)
-0.10(0.59) -0.06
Standard deviations are noted in parentheses.N = 152

Experiment > Results
Table 5.5Student performance data (Teacher J only)
Performance MetricControl Experiment
Unit 1 Unit 2 Gain Unit 1 Unit 2 Gain ∆Gain
Avg percent of assignments completed 91.14
(13.87)92.57
(13.82)1.43
(12.84)89.53
(12.75)96.84(6.88)
7.30(12.22) 5.87a
Avg percent of assignments completed on time 84.24
(13.95)81.64
(17.16)-2.60
(15.18)81.56
(14.65)87.00
(15.76)5.44
(15.80) 8.04b
Avg unit test score 3.29(0.78)
3.26(0.69)
-0.02(0.63)
3.34(0.54)
3.22(0.67)
-0.12(0.64) -0.09
Standard deviations are noted in parentheses.N = 85ap < 0.05, Effect Size=0.46bp < 0.05, Effect Size=0.53

Experiment > Results
Table 5.6Student performance data (nightly emails)
Performance MetricControl Experiment
Unit 1 Unit 2 Gain Unit 1 Unit 2 Gain ∆Gain
Avg percent of assignments completed
93.85(10.55)
95.37(11.02)
1.52(10.09)
91.13(12.94)
98.00(5.90)
6.87(13.45) 5.35
Avg percent of assignments completed on time
84.16(14.56)
84.57(16.66)
0.41(15.89)
78.47(14.79)
84.00(21.38)
5.53(16.86) 5.12
Avg unit test score 3.23(0.63)
3.20(0.68)
-0.04(0.63)
3.23(0.62)
3.13(0.64)
-0.10(0.54) -0.06
Standard deviations are noted in parentheses.N = 90; N(Control) = 75; N(Exp) = 15;

Experiment > Results
Table 5.7Student performance data (low performing)
Performance MetricControl Experiment
Unit 1 Unit 2 Gain Unit 1 Unit 2 Gain ∆Gain
Avg percent of assignments completed
84.57(15.24)
89.14(17.68)
4.57(15.53)
83.17(13.24)
95.63(7.79)
12.46(13.62) 7.89
Avg percent of assignments completed on time
65.24(11.68)
72.67(21.63)
7.43(20.32)
67.83(7.56)
78.54(17.84)
10.71(18.15) 3.28
Avg unit test score 2.88(0.79)
2.86(0.74)
-0.02(0.90)
3.09(0.58)
3.00(0.69)
-0.09(0.60) -0.06
Standard deviations are noted in parentheses.N = 45

• Results indicated:• Parent engagement increased
• Homework completion increased
• Performance did not increase
• Positive feedback or not needed
• Statistically:• Only a few reliable results
• Would not stand up to correction
• All trended strongly in right direction
• High effect sizes
Experiment > Discussion

• Results present, hard to detect• Noisy, real-world data
• IEP’s, internet access, ELL, abscenses
• Small sample sizes
• Ceiling effect
• Confound between units
• Causal chain
Experiment > Discussion

• More intervention• Avoid spamming
• Text messages?
• Conduct in spring w/ similar units• Use lower-knowledge students• Only send messages when there
is a problem?
Experiment > Future Work

• Thanks to:• Oak Middle School
• Christine O’Connor, Courtney Mulcahy, Kevin DeNolf, Jen Dufaul, Christ Starczewski
• ASSISTments Team• Neil and Cristina Heffernan
• Developers
• National Science Foundation• GK-12/PIMSE Grant
Acknowledgements