increasing native plant diversity in crested wheatgrass stands
TRANSCRIPT

Restoring Native Plants to Crested
Wheatgrass Stands in Eastern Oregon
Jane Mangold and Valerie FanslerMontana State University, Bozeman, MT
Pike San Isabel National Forest, Colorado Springs, CO

Crested Wheatgrass
• Introduced to North America in 1898
– Used to
• Stabilize soils
• Livestock forage
• Prevent weed invasion
• Reduce wildfire hazard
• Occupies more than 5 million
hectares in western U.S.
(Pellant and Lysne 2005)

Crested Wheatgrass Legacy
• Dominates seed bank and limits growth of native
species
• Native species recruitment unlikely
• To re-establish diversity:
– Suppression of crested wheatgrass plants and
propagules
– Deliberate introduction of desired species
(Marlette and Anderson 1986, Bakker et al. 1997, Cox
and Anderson 2004, Henderson and Naeth 2005)

Benefits of Restoring Natives
• Improves resource capture and cycling
• Increases resilience and resistance to
disturbance
• Improves wildlife habitat (esp. sagebrush
obligate species)
(USDI USFWS 2001, Kinzig et al. 2002,
USDI BLM 2005, USDA USFS 2008)

Objective
• Test various strategies for restoring native
plant species to crested wheatgrass-
dominated rangeland

Hypotheses
• Suppression treatments would decrease
crested wheatgrass density and cover
• Suppression treatment and revegetation
would interact to increase native species
density

Study Site
• 80 km south of Burns, OR
• Malheur National Wildlife Refuge
Burns
X

6/29/06
6/23/05
• Seeded to crested
wheatgrass in 1981 following wildfire

Crested Wheatgrass
Suppression Treatments
• Mechanical
– One pass with disk (1M)
– Two passes with disk (2M)
• Herbicide (glyphosate)
– Low rate (LH)
• 0.25X recommended rate
– High rate (HH)
• 1.0X recommended rate
• Undisturbed (UD)
• Mechanical
-17 Oct. 2005 (Trial 1)-15 May 2006 (Trial 2)
• Herbicide -12 July 2005 (Trial 1)
- 5 May 2006 (Trial 2)
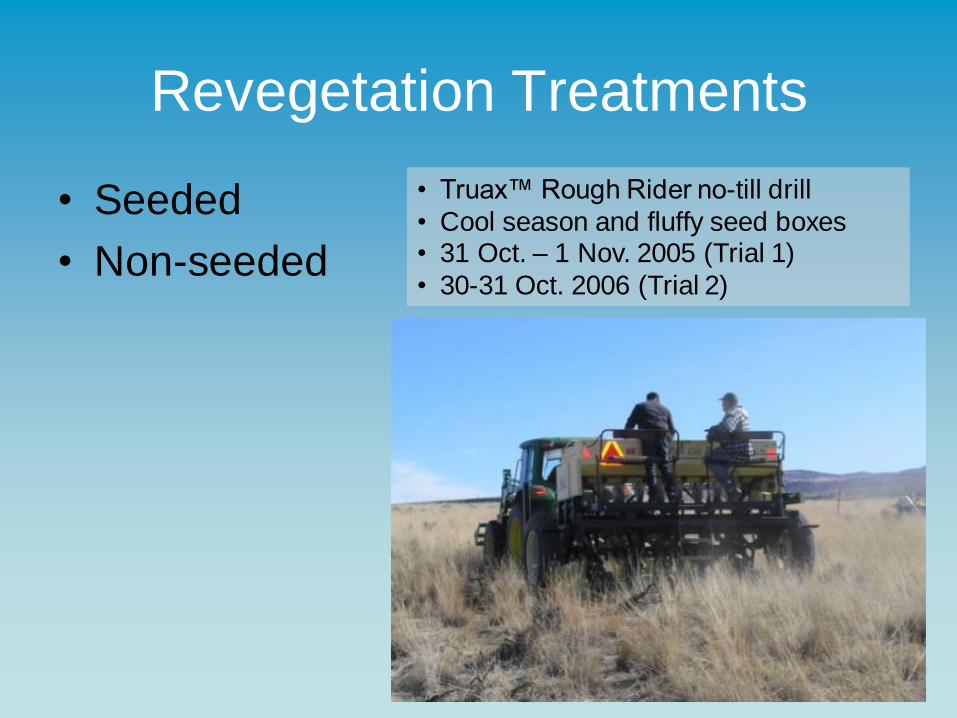
Revegetation Treatments
• Seeded
• Non-seeded
• Truax™ Rough Rider no-till drill
• Cool season and fluffy seed boxes • 31 Oct. – 1 Nov. 2005 (Trial 1)
• 30-31 Oct. 2006 (Trial 2)

Native Seed Mix
• 4 grasses– bluebunch wheatgrass (L)
– Sandberg’s bluegrass (S)
– Indian ricegrass (L)
– Squirreltail (L)
• 3 forbs– western yarrow (S)
– Lewis flax (L)
– Munro globemallow (L)
• 3 shrubs– Wyoming big sagebrush (S)
– four-wing saltbush (L)
– white-stemmed rabbitbrush (S)

Experimental Design
• Randomized block, split-split-plot
• Whole-plot = suppression treatment (30m
x 140m)
• Split-plot = seeding treatment (30m x 70m)
• Split-split-plot = year (2 trials)
• 5 replications

Sampling
• Density and canopy cover
– Crested wheatgrass
– Other perennial species
– Cheatgrass
• Density
– Seeded species
• 50, 0.25m2 frames/plot
• Trial 1
– 2006-2008
• Trial 2
– 2007-2008

Data Analysis
• Mixed effect split-split plot analysis
– Fixed effects = suppression treatment,
seeding treatment, year
– Random effects = block
• Means separated using Tukey’s Honestly
Significant Difference (HSD)
(Ramsey and Schafer 2002)

Treatment
HH 2M LH 1M UD
cre
ste
d w
he
atg
ras
s d
en
sit
y (
pla
nts
/m2)
0
2
4
6
8
10
12
14
16
18
2006
2007
2008
a
bb a
b
c
a
a aa
bb
a aa
X
Y
X X XX
Z
XY
Y
X
XY
Z
XY
Y
X
Treatment x Year Effect on
Crested Wheatgrass Density -Trial 1
HH = high rate herbicide
2M = mechanical, 2 passes LH = low rate herbicide
1M = mechanical,1 pass UD = undisturbed
HSDa = 1.1
HSDb = 1.5p < 0.01

Treatment
cre
ste
d w
heatg
rass d
en
sit
y (
pla
nts
/m2)
0
2
4
6
8
10
12
14
HH 2M LH 1M UD
a
bc
ab
d
cd
Treatment Effect on
Crested Wheatgrass Density -Trial 2
HSD = 1.7
p = 0.01
HH = high rate herbicide
2M = mechanical, 2 passes LH = low rate herbicide
1M = mechanical,1 pass UD = undisturbed

Treatment
HH 2M LH 1M UD
cre
ste
d w
heatg
rass c
over
(%)
0
5
10
15
20
25 2006
2007
2008
b
a
a
a
b
c
b
a
ab
a a
b
a
a
Y
X
XY
X
XY
Y
Z
YZ
XY Y
X X
Z
Z
Y
Treatment x Year Effect on
Crested Wheatgrass Cover-Trial 1
HSDa = 2.1
HSDb = 2.8p < 0.01
HH = high rate herbicide
2M = mechanical, 2 passes LH = low rate herbicide
1M = mechanical,1 pass UD = undisturbed

Treatment
HH 2M LH 1M UD
seed
ed
sp
ecie
s d
en
sit
y (
pla
nts
/m2)
0
10
20
30
40
50
2006
2007
2008
c
b
a
c
b
a
c
b
a
c
b
a
b b
a
X
X
X
Z
X
X
X
X
X
Y
X
X
X X
X
Treatment x Year Effect on
Seeded Species Density – Trial 1
HSDa = 4.9
HSDb = 5.0p < 0.01
HH = high rate herbicide
2M = mechanical, 2 passes LH = low rate herbicide
1M = mechanical,1 pass UD = undisturbed

Year
seed
ed
sp
ecie
s d
en
sit
y (
pla
nts
/m2)
0
5
10
15
20
25
30
2007 2008
a
b
Year Effect on Seeded Species Density
– Trial 2
HSD = 1.7p < 0.01

Conclusions—Eastern Oregon
• Suppression treatments not effective
• Mechanical suppression treatments increased
crested wheatgrass
• Seeded species
– High initial establishment in spite of poor
suppression
– Decreased over time

Implications
• Successive suppression treatments prior to
seeding natives
• Subsequent management to favor persistence of
native species

Acknowledgements
• USDA-Agricultural Research Service/EOARC
• USDA-FS-Rocky Mountain Research Station
• USFWS-Malheur National Wildlife Refuge
• USDA-NRCS
• Jim Truax
• GBNPSIP
• Colleagues in Idaho, Nevada, and Utah

Questions