increasing interconnections: to build or not to build
TRANSCRIPT

REPORT
Federal Planning Bureau Economic analyses and forecas ts
Increasing interconnections: to build or not to build,
that is (one of) the question(s) Addendum to the cost-benefit analysis of
adequate future power policy scenarios
September 2017
Danielle Devogelaer, [email protected]
Avenue des Arts 47-49 – Kunstlaan 47-49 1000 Brussels E-mail: [email protected] http://www.plan.be

Federal Planning Bureau
The Federal Planning Bureau (FPB) is a public agency that carries out, in support of political decision-making, forecasts and studies on economic, social-economic and environmental policy issues and ex-amines their integration into a context of sustainable development. It shares its expertise with the gov-ernment, parliament, social partners, national and international institutions.
The FPB adopts an approach characterised by independence, transparency and the pursuit of the gen-eral interest. It uses high-quality data, scientific methods and empirical validation of analyses. The FPB publishes the results of its studies and, in this way, contributes to the democratic debate.
The Federal Planning Bureau is EMAS-certified and was awarded the Ecodynamic enterprise label (three stars) for its environmental policy.
url: http://www.plan.be e-mail: [email protected]
With acknowledgement of the source, reproduction of all or part of the publication is authorised, except for commercial purposes. Responsible publisher: Philippe Donnay

REPORT
Federal Planning Bureau Avenue des Arts - Kunstlaan 47-49, 1000 Brussels phone: +32-2-5077311 fax: +32-2-5077373 e-mail: [email protected] http://www.plan.be
Increasing interconnections: to build or not to build, that is (one of) the question(s)
Addendum to the cost-benefit analysis of adequate future power policy scenarios
September 2017
Danielle Devogelaer, [email protected]
Abstract – At the request of the federal Minister of Energy, this report was carried out as a follow-up on the cost-benefit analysis published by the Federal Planning Bureau in February 2017. It constitutes an addendum to the February study in that some additional questions impacting the Belgian production park are scrutinized in detail. Four topics are dealt with. The first one concerns the impact of an increase in the Belgian cross-border transfer capacity by 2 GW on the functioning of the domestic thermal flexible park. The effect this will engender on the full load hours, the system marginal cost, CO2 emissions, the required volumes of natural gas and employment is studied. Second, an evaluation is drafted of the cost of keeping currently existing gas-fired power plants operational. A comparison with the cost of building new flexible and reliable units is provided. Third, the socio-economic impact of an increased risk of a black-out is scrutinized. The economic asymmetry this induces in relation to the costs and benefits of conserving sufficient domestic capacity in order to comply with the legally defined Loss of Load (LOLE) criterion of 3h is documented. Finally, the question of premature closure of currently existing Belgian gas-fired power plants that have not come to the end of their operational lifetime yet is investigated by means of different indicators throughout the paper.
Jel Classification – D47, L94, Q47, Q48 Keywords – Interconnections, missing money, black-out, generation adequacy

REPORT
Table of contents
Executive summary ................................................................................................ 1
Introduction ......................................................................................................... 3
1. Methodology ................................................................................................... 5
1.1. Introduction 5
1.2. Rolling horizon 5
1.3. Uncertainties 6
1.4. Electricity exchanges 6
1.5. Production technologies 6
2. Hypotheses ..................................................................................................... 8
2.1. Thermal park 8
2.2. Sun and wind 9
2.3. Electricity consumption 9
2.4. Demand response 10
2.5. International context 10
2.6. Interconnection capacity 10
3. Results ......................................................................................................... 12
3.1. Increase in the cross-border capacity 12
3.1.1. The scenarios 12
3.1.2. Coal before Gas 13
3.1.3. Gas before coal 17
3.1.4. Employment 20
3.1.5. Cost of the additional interconnections 20
3.2. Maintaining currently existing gas-fired power plants 23
3.3. Impact assessment of an increased risk of black-out 24
3.3.1. Adequate adequacy criterium 25
3.3.2. Impact of one CCGT 26
3.3.3. How many should we have? 27
3.3.4. Demand Response to the rescue 29
4. Key findings ................................................................................................... 31
5. Glossary ........................................................................................................ 32
6. References .................................................................................................... 33

REPORT
List of tables
Table 1 Combined cycle gas units in Belgium, year 2027 (MW) ····················································· 9
Table 2 Open cycle gas units in Belgium, year 2027 (MW) ·························································· 9
Table 3 Installed capacity, production (over 10 climatological years) and equivalent number of hours
at full capacity, solar PV and wind in Belgium, year 2027 ················································ 9
Table 4 Estimated costs of different interconnections to and from Belgium ···································· 21
Table 5 Natural gas-fired technologies, Belgium, year 2020 ······················································· 24
Table 6 Some security of supply indicators according to different scenarios, ·································· 26
Table 7 Input parameters for the DECC adequacy calculation ····················································· 27
List of graphs
Graph 1 The interconnected Crystal Super Grid system, illustration ·············································· 5
Graph 2 Hourly load profile and cumulative production in Crystal Super Grid, illustration ···················· 6
Graph 3 Variability of the demand in the different test cases during one week in January, illustration ··· 10
Graph 4 Inframarginal rents ····························································································· 15
Graph 5 Simplified representation of load centers (dark grey), wind and solar (orange) and water (blue)
in Europe ········································································································· 22
Graph 6 Optimal level of Security of Supply ·········································································· 27


REPORT
1
Executive summary
End of May 2017, the Federal Planning Bureau (FPB) received a formal request from the federal Minister of Energy Mrs Marghem to elaborate further on its Cost-Benefit Analysis (CBA), a study it performed on behalf of the DG Energy in February 2017. The goal of the CBA was to describe and quantify different costs and benefits of varying compositions of the structural block. The structural block is a concept de-fined by the national Transmission System Operator Elia to point to the potential investment needs in order to construct an adequate future Belgian power system by 2027. Although different costs and ben-efits were scrutinised amongst which the impact on the energy trade balance, on investment and system marginal costs, emissions, etc., the Minister asked for a further unravelling of some punctual additional topics and scenarios.
The formal request consisted in complementing the cost-benefit analysis (CBA) with, first and foremost, an analysis of the socio-economic impact of an extension of the cross-border interconnections. Since Belgium is an open economy with, at times, more than 25% of its current demand covered by imports, it should be well aware of the added uncertainties linked with further increasing the amount of im-ported electricity. The requested extension to be investigated is the 1 GW augmentation of the commer-cial capacity of both the NEMO and the ALEGRO interconnection. A second question concerned the cost of preserving the currently existing gas-fired power plants whilst the third question had the socio-economic impact of an increased risk of a black-out as interest. A last question relates to the premature closure of currently existing Belgian gas-fired power plants that have not yet come to the end of their operational lifetime.
A number of key findings can be deducted from this analysis. First, it once again demonstrates the major impact a fair carbon price can have on the functioning and the profitability of the Belgian gas units. If the carbon price on the EU ETS market could trigger a switch in the merit-order between coal and nat-ural gas, Belgian power plants will profit, run for more hours, export more electricity to the neighbours and overall would benefit in terms of increased inframarginal rents.
However, if a rise in the carbon price does not materialize, one should try to operate on a supranational level through credible cooperation initiatives: a reinforcement of the role of CORESO or even the Pen-talateral Forum may in this regard be beneficiary. The point is that, although Member States have sov-ereignty over their energy mix according to the Treaty of Lisbon, it is crucial that national phase-out plans are coordinated across a larger ‘zone’ which is directly being impacted by the phase-out. A such coordination may avoid black-outs, increase credibility and create an optimal level of ‘scarcity’ in the zone.
The question whether new interconnections with both the UK and Germany will have more benefits than costs hinges on this carbon price dilemma. In both merit-order cases (coal before gas and gas before coal), a clear decrease in both system marginal costs (‘price’) and CO2 emissions of the Belgian electricity sector can be observed. Nonetheless, in the former, generation by Belgian gas units is reduced and Bel-gium becomes more and more of a hub for electricity, providing throughput or transit of power from east to west and north to south (and vice versa). In the latter case, Belgium seems to benefit more from

REPORT
2
the increased interconnections, exporting vast amounts of home-made electricity towards Member States with a less advantageous, more carbon intensive electricity mix. Above that, the role of intercon-nections should not be limited to competitiveness (through price convergence) but it also spans system security of supply and integration of renewable energy sources.
In terms of missing money, once again, carbon prices play a pivotal role. When carbon prices are too low, there is missing money and attracting investors becomes hazardous. When carbon prices are raised to a level that triggers the gas-before-coal switch and the legally defined nuclear phase-out is honoured, money is not missing anymore and inframarginal rents should suffice to cover a rent on top of the fixed operations and maintenance costs.
Finally, if we succeed in keeping the capacity of the current operational thermal flexible park online until after the complete phase-out of all the nuclear units, generation adequacy should be assured. It is when one (or more) of the current units decides to leave the system that adequacy can no longer be guaranteed in terms of the legally defined LOLE criterium. Investments in new OCGT could mitigate the situation. Condition to trigger these investments, however, is that market design should be simul-taneously revised. Opportunities in terms of Demand Response should be carefully scrutinized because they can provide a cheaper way to guarantee security of electricity supply.

REPORT
3
Introduction
In May 2016, the national Transmission System Operator (TSO) Elia published a report on the adequacy and flexibility needs of the Belgian power system for the horizon 2027. In June 2016, the DG Energy organised a public consultation on the outcomes of this study. Following some of the concerns that stakeholders that responded to the public consultation raised, the DG Energy asked the Federal Plan-ning Bureau in October 2016 to perform a cost-benefit analysis of a selection of scenarios based on the adequacy study of Elia.
In February 2017, the Federal Planning Bureau published its cost-benefit analysis of a number of policy scenarios that are all consistent with an adequate Belgian power system by 2027. More specifically, five scenarios were scrutinised, all taking into account a maximum simultaneous import capacity in Belgium of 6500 MW by 2027. The analysis described and quantified different costs and benefits of varying com-positions of the so-called structural block within contexts in which the merit order is either coal before gas or gas before coal. The implications of the different capacity portfolio and import scenarios were translated into different types of costs (investment costs, system marginal costs, consumer and producer surplus, etc.) complemented by an impact estimation on the energy trade balance and employment.
End of May 2017, the federal Minister of Energy Mrs Marghem asked the Federal Planning Bureau to elaborate further on this study. The formal request consisted in complementing the cost-benefit analysis (CBA) with an analysis of the socio-economic impact of an extension of the cross-border interconnec-tions. This additional request finds its roots in the latest Network Development Plan1 in which Elia cites study projects aimed at reinforcing the interconnections with Germany and the UK that today are still under construction. Since Belgium is an open economy with, at times, more than 25% of its current demand covered by imports, it should be well aware of the added uncertainties linked with further increasing the amount of imported electricity. The decision to further invest in additional interconnec-tions (or reinforcements) hence should be based on a thorough cost-benefit analysis2.
This report then documents the impact of an increase in cross-border transfer capacity by 2 GW (+1 GW to and from Germany and +1 GW to and from the UK) on the functioning of the Belgian thermal (flexible) park. The effect on full load hours, system marginal cost, CO2 emissions, import/export patterns, re-quired volumes of natural gas and employment is described in part 3.1.
In addition to the interconnection analysis, three other topics are being investigated. First, an evaluation is made of the cost of maintaining currently existing gas-fired power plants operational. A comparison with the cost of building new flexible and reliable units (OCGT’s) is provided in part 3.2.
1 Elia (2015), Federaal ontwikkelingsplan van het transmissienet 2015-2025, p. 145. 2 In the framework of the Ten-Year Network Development Plan (TYNDP), national Transmission System Operators (TSO)
and/or ENTSO-E, the European Network of TSO’s, perform CBA’s for each project included in the TYNDP. The pan-European CBA methodology is used to assess these projects (https://www.entsoe.eu/major-projects/ten-year-network-development-plan/CBA-Methodology/Pages/default.aspx). An example can be found at https://www.entsoe.eu/Documents/TYNDP %20documents/TYNDP%202016/projects/P074.pdf. Above that, when a project is considered a Project of Common Interest (PCI), information from the TYNDP is taken and the CBA is adopted as eligibility criterium. PCI’s are intended to help create an integrated EU energy market and are considered key energy infrastructure projects by the European Commission.

REPORT
4
Part 3.3 then deals with the socio-economic impact of an increased risk of a black-out. The economic asymmetry this engenders in relation to the costs and benefits of conserving sufficient domestic capacity in order to comply with the legally defined Loss of Load (LOLE) criterion of 3h is scrutinized.
Finally, the question of premature closure of currently existing Belgian gas-fired power plants that have not come to the end of their operational lifetime yet is looked upon. There is no chapter specifically dedicated to this theme, but throughout the paper different indicators are calculated which shine a light on the matter, the calculation of the missing money in part 3.1.2.e and 3.1.3.e being one of them.

REPORT
5
1. Methodology
The methodology used in this report is for the most part identical to (or based on) the one described in the CBA3, part ‘Costs’. The main instrument that underlies most of the calculations is the optimal dis-patch model Crystal Super Grid (Artelys, 2015).
1.1. Introduction
Crystal Super Grid is a unit commitment optimal dispatch model for the electricity sector that can be used for one up to thirty three countries. It in fact minimizes total system production costs whilst align-ing demand with supply. It contains an extensive library of both physical and financial assets (thermal power plants, renewable energy sources, power lines, etc.) which allows a fine-grained level of detail for analyses. The data infeed for the model mainly originates in publicly available databases like ENTSO-E and the International Energy Agency (IEA). More specifically, the demand, the installed ca-pacities and the thermal availabilities are obtained from ENTSO-E, the fuel costs from IEA and the de-tailed capacity descriptions from the European TSO’s individual websites. Powerful optimization solv-ers are used to calculate the optimal dispatch of generating facilities in the interconnected zones. Results cover e.g. imports/exports between zones (countries or regions), marginal costs of electricity generation and CO2 emissions.
1.2. Rolling horizon
Crystal Super Grid runs on JAVA. The computation process is performed by successive optimisation problem resolutions over a rolling horizon. This is done to avoid perfect foresight issues at the end of the projection period. The model computes 14-day period (tactical horizon) problems with 7-day steps (rolling horizon) at each iteration. This way, each new computations’ tactical horizon overlaps with the previous one taking into account its deci-sions and the ensuing state of the system.
3 CBA is short for Cost-Benefit Analysis referring to Devogelaer, D. and D. Gusbin (2017), Cost-benefit analysis of a selection of
policy scenarios on an adequate future Belgian power system, Economic insights on different capacity portfolio and import scenarios, Federal Planning Bureau, Report.
Graph 1 The interconnected Crystal Super Grid sys-tem, illustration
Source: Crystal Super Grid.

REPORT
6
1.3. Uncertainties
Crystal Super Grid uses a (rather) deterministic approach. It does not implement the Monte Carlo method but, through design, can operate in a similar manner. More specifically, when uncertainties come into play, say in future demand series or intermittent production profiles, it is possible to evaluate a large number of climatological years in one single scenario. This is done by simulating an elevated number of test cases per scenario and by choosing its test cases strategically in such a way that ‘extremities’ are part of the draw.
In this study, scenarios are run with ten test cases each to take account of different meteorological years and hence the influence of the weather during a specific year on both demand and solar and wind production. It is important to specify that in the construction of future demand and variable renewable production profiles, a coherence between the two is taken into consideration. This is ensured by including the correlation between demand and variable renewable production observed in different climatological years. The model used to generate the different production profiles was developed by IAEW (Institut für Elektrische Anlagen und
Energiewirtschaft) at the university of Aachen RWTH.
1.4. Electricity exchanges
In this report, Crystal Super Grid with its hourly load profile, power plant ramp-up and emission trading is applied to the European electricity market to study the different questions. The European electricity market that is being considered, covers Belgium next to 32 European countries: Portugal, Spain, France, Italy, Greece, Cyprus, Macedonia, Bulgaria, Montenegro, Serbia, Romania, Bosnia, Croatia, Slovenia, Hungary, Slovakia, Austria, Czech Republic, Switzerland, Germany, Latvia, Luxembourg, Netherlands, UK, Northern Ireland, Ireland, Denmark, Poland, Lithuania, Estonia, Finland, Sweden, Norway.
The commercial electricity exchanges between these different countries are modelled through intercon-nections (NTC’s). The imported and exported volumes are calculated by the model for each scenario.
1.5. Production technologies
As regards the different power plants in this European ‘zone’, they are not modelled individually but are aggregated into production technology categories. Two major reasons can be cited:
– There is an apparent lack of data concerning the power systems of the other 32 countries: taking into account very detailed plant level data for the Belgian power sector but aggregating (hence, applying
Graph 2 Hourly load profile and cumulative produc-tion in Crystal Super Grid, illustration
Source: Crystal Super Grid.

REPORT
7
mean efficiencies, mean production costs, etc) for the other countries would create significant biases in the results;
– In the current version of the model, it is not possible to integrate start-up or running constraints. It therefore does not seem to bring much added value to integrate each plant individually since the additional time spent on integrating and running a more complex, therefore more time consuming model will not be compensated by (much) more valuable insights.
REPORT
8
2. Hypotheses
As regards the assumptions, the reader is referred to the CBA published in February. Nonetheless, for the sake of easy comprehension some crucial assumptions are repeated, next to the description of hy-potheses that are specific to this study.
2.1. Thermal park
Since this study takes the legal context as a given, notably the law on the progressive nuclear phase-out4, the nuclear power plants are not part of the exercise.
Concerning the remaining thermal park, two types of production can be distinguished: fatal (or must-run) and dispatchable. As regards the fatal production, two categories are integrated in the model: bio-mass and cogeneration. The production plan of these technologies is not optimised by the model be-cause they are considered to be units that have to produce, no matter how low (or high) the market price. The installed capacity of cogeneration equals 2938 MW with an annual average electricity pro-duction of 17 TWh. The installed biomass capacity is not expected to change compared to the situation of today: it is set at 1281 MW with an annual production around 8 TWh.
Upon decision of the Cabinet of the federal Minister of Energy, the dispatchable thermal park taken into consideration is made up of the existing gas-fired power plants that are currently in the market. This means that the generation units belonging to the strategic reserve are excluded from the study. The operational Belgian thermal production park as of 2017 is therefore integrated in the scenarios covering horizon 20275. The source used is the database constructed by Elia in the framework of the determina-tion of the need for strategic reserves for the winter 2017-2018.
One exception is made for Drogenbos: according to a communication with ENGIE, the Drogenbos OCGT (46.8 MW) is being decommissioned, whilst the CCGT (460 MW) is converted to an OCGT com-prising of 230 MW nameplate capacity made up of 2 GT’s of 115 MW each. Hence, Drogenbos is with-drawn from the list of CCGT and adapted in the list of OCGT. Table 1 summarizes the list of Belgian combined cycle gas units, Table 2 the open cycle gas units.
4 January 31, 2003, Loi sur la sortie progressive de l'énergie nucléaire à des fins de production industrielle d'électricité, http://www.ejus-
tice.just.fgov.be/cgi_loi/loi_a.pl?language=fr&caller=list&cn=2003013138&la=f&from-tab=loi&sql=dt=%27loi%27&tri=dd+as+rank&rech=1&numero=1
5 As the Cabinet specifically demanded to take this park into consideration, the question whether this park will still be available by 2027 given its age or how many investments will be necessary to keep it operational is not dealt with in this publication.

REPORT
9
Table 1 Combined cycle gas units in Belgium, year 2027 (MW) Production unit name Type Production capacity (MW)AMERCOEUR 1 GT CCGT-GT 270 AMERCOEUR 1 ST CCGT-ST 150 ANGLEUR TG 31 CCGT-GT 39 ANGLEUR TG 32 CCGT-GT 39 ANGLEUR TV33 CCGT-ST 39 HERDERSBRUG GT1 CCGT-GT 159 HERDERSBRUG GT2 CCGT-GT 159 HERDERSBRUG ST CCGT-ST 162 INESCO GT1 CCGT-GT 48.5 INESCO GT2 CCGT-GT 44.8 INESCO ST CCGT-ST 44.8 KNIPPEGROEN STEG CCGT 305 MARCINELLE ENERGIE TGV CCGT 405 RINGVAART STEG CCGT 357 SAINT-GHISLAIN STEG CCGT 350 T-POWER CCGT 425 ZANDVLIER POWER CCGT 384 TOTAL 3381 Source: Elia (2016).
Table 2 Open cycle gas units in Belgium, year 2027 (MW) Production unit name Type Production capacity (MW)ANGLEUR TG 41 GT 63 ANGLEUR TG 42 GT 63 DROGENBOS GT GT 230 HAM 31 GT 56 HAM 32 GT 56 IZEGEM GT 22 TOTAL 490 Source: Elia (2016), ENGIE.
2.2. Sun and wind
As regards the installed capacity of variable renewable energy sources, this is identical to what is im-plemented in the Base case (Elia, 2016a). Table 3 summarizes some indicators used in this report.
Table 3 Installed capacity, production (over 10 climatological years) and equivalent number of hours at full capacity, solar PV and wind in Belgium, year 2027 Installed capacity (MW) Mean annual production (GWh) Equivalent full-load hours (h)
Solar PV 4988 5563 1115 Wind* 5854 15852 2708 Source: Crystal Super Grid. Note: * both on and offshore wind.
2.3. Electricity consumption
In the model, the demand is represented by an hourly load profile. In order to guarantee the supply-demand equilibrium of the system, the electricity demand has to be satisfied at all moments in time by an equal power production (being generated somewhere in the system). The challenge to meet this bal-ance is linked to the variability of the residual demand.

REPORT
10
The uncertainty on the future power demand is taken into account by simulating different test cases that are correlated with the production pro-files of wind and sun as to attempt to accurately capture the variability of the residual demand (see also part 1.3). Graph 3 provides an illustration of the fluctuating demand in the different test cases implemented per scenario.
The average annual growth rate of the electricity demand between 2014 and 2027 equals 0,6% (Elia, 2016b). In the year 2027, the average annual de-mand (over the 10 test cases) equals 92,9 TWh.
2.4. Demand response
Following some remarks from stakeholders after the publication of the CBA, it was decided to further finetune this option as to more accurately capture the potential of this valuable source of flexibility. Whereas in the CBA, it was assumed that 1096 MW of Demand Response (DR) would be available by 2027 in coherence with the adequacy study from Elia (Elia, 2016a), the potential was revised upwards and adapted to the number used in the Addendum of Elia (Elia, 2016b). Next to that, the price was revised downwards. This study hence accounts for 1600 MW of DR6 with an activation price set at 175 €/MWh for 50% of this potential, 275 €/MWh for the other 50%.
2.5. International context
It is important to recall the international setting of this study. At the specific request of the Cabinet, the international framework in which the analyses are conducted is taken identical to the one described in the CBA of February. This means that, for neighbouring countries, the same capacity portfolio (hence, phase-out calendar) is implemented as is described in the CBA (Devogelaer and Gusbin, 2017).
2.6. Interconnection capacity
The commercial exchanges between countries are modelled through nodes in which every country is represented by one node. The exchanges are limited by the net transfer capacities (NTC). Losses are not considered in the model but a small part (0.1%) is deducted with any energy exchange as to avoid sym-metries and equivalent solutions. The maximum simultaneous import capacity for Belgium in 2027 is foreseen to have been increased up to 6500 MW.
6 This potential can be seen as an extrapolation of the total MR volume with a CAGR of 5% (E-Cube, 2017).
Graph 3 Variability of the demand in the different test cases during one week in January, illus-tration MW
Source: Crystal Super Grid.

REPORT
11
The first part of the study then integrates a further extension of the interconnections. This means that an additional 2000 MW is considered which corresponds to the extension of both the NEMO and the ALEGRO link with 1 extra GW7, constituting a maximum simultaneous import capacity of 8500 MW in 2027. This option is already mentioned in the latest Federal Network Development Plan of Elia (Elia, 2015) and was investigated in the adequacy study as a sensitivity (Elia, 2016a).
7 Although an investment of 2 GW in physical capacity does not necessarily lead to an increase of 2 GW in commercial capacity,
we subscribed to the analysis published in part 4.3.2 and 5.4.3 (Elia, 2016a) where it is stated that increases in the commercial capacity are taken into account and the maximum simultaneous import capacity is lifted from 6500 MW to 8500 MW.

REPORT
12
3. Results
3.1. Increase in the cross-border capacity
The first research question concerns the impact of an increase in the cross-border transmission capacity by 2 GW (+1 GW to and from Germany and +1 GW to and from the UK) on the functioning of the Belgian thermal flexible park. The effect this will induce on the full load hours, CO2 emissions, system marginal cost, the required volumes of natural gas and on employment will be documented in this part. Through-out this chapter and in a transversal manner, the question whether this option may lead to a premature closure of currently existing Belgian gas-fired power plants that have not come to the end of their oper-ational lifetime yet is being investigated by means of different indicators, the calculation of the missing money being one of them.
3.1.1. The scenarios
To tackle this question, four scenarios are constructed. They are broadly inspired on the contexts de-scribed in the CBA (Devogelaer and Gusbin, 2017).
The first scenario, called Gas2017, is a scenario in which the Belgian production park is identical to the Base_Gas scenario, although with two exceptions: more DR is available in the system8 and there is no structural block anymore. In fact, it is more accurate to state that the structural block which, in the CBA, was filled with different types of technologies (either gas-fired or decentral), is replaced by the gas-fired generation units that are currently part of the market in Belgium in 2017. Basically, this choice is made because in this report, the subject is not approached from the angle of security of supply or generation adequacy, but from an economic point of view in which the profitability (and survival) of current units is investigated. More specifically, potential changes in the profitability level by adding interconnection capacities is looked upon. To summarize: 3381 MW CCGT (see Table 1) and 490 MW OCGT (see Table 2) are integrated in the model9.
The second scenario called Gas2017_HighCO2 is identical to the first but with one difference: in the merit order, gas comes before coal. To put it differently: the CO2 price is (significantly) raised10. The analysis of this scenario can deliver insightful results because if the future carbon price is sufficiently high, it becomes interesting to switch from coal-based to gas-fired power plants, the latter seeing their number of running hours increase (dramatically). (Partly) replacing coal and lignite will have an effect that is not contained to Belgium: it can cross borders in terms of induced changes in production levels, import and export patterns and CO2 emissions all over Europe.
The third and fourth scenario, called Addinterco and Addinterco_HighCO2 respectively, are identical to scenario one and two but with an extension/reinforcement of the interconnections between Belgium and
8 See also part 2.4. 9 This apparently lower level of gas-fired units compared to the structural block of 4.4 GW in the CBA does not jeopardize the
legal criterium of generation adequacy because a simultaneous increase in the level of DR is considered (Artelys, 2017). 10 In the CBA, this can be interpreted as the Clima_Gas scenario but in which the structural block is being deleted and the current
gas-fired park is added.

REPORT
13
the UK and Belgium and Germany. In other words, by 2027, NEMO II and ALEGRO II are installed and operational and the maximum simultaneous import capacity is being lifted to 8500 MW.
Before plunging into the results of these scenarios, it is important to note that Elia in its adequacy study (Elia, 2016a) already performed a sensitivity analysis on the import capacity. In part 5.4.3 of its study, the results of an analysis in which the maximum simultaneous import capacity of Belgium is increased to 8.5 GW are described. According to their findings, the necessary volume of the structural block in 2027 can decrease by 1.5 GW when 2 GW of import capacity is added to the Belgian system. It is none-theless important to stress that Elia worked with steps of 500 MW and that this result is valid only in their Base scenario. More specifically, interconnections indeed bring a benefit in reducing the adequacy risk for as long as there is sufficient available production capacity on CWE/European scale. This benefit dilutes if the latter is not the case. For the Base case as we use in our study, this could mean that, for adequacy reasons, the structural block (which can be interpreted as the gas-fired park we will concen-trate on in this analysis) may be smaller. Hence, the park of 2017 will not be needed entirely from a security of supply point of view.
In the next sections, scenarios are compared two by two, meaning that the scenario Gas2017 is compared to the scenario Addinterco and the scenario Gas2017_HighCO2 is compared to Addinterco_HighCO2. Re-sults are reported below.
3.1.2. Coal before Gas
a. Full load hours
In the first analysis, the situation of constructing additional interconnections is looked upon in a context in which the CO2 price hovers around 17 €/tCO2. When we place the two scenarios next to one another (Gas2017 vs Addinterco), we notice that, in the case of 2 GW additional interconnections, 0.8 TWh less electricity is being produced by Belgian CCGT. Belgian CCGT therefore will count 232 less full load hours (FLH), tumbling from 4739 to 4507 FLH (-5%). Belgian OCGT will lose out on 64 full load hours going from 787 to 723 FLH (-8%).
This electricity is being replaced by more imports (+3 TWh). At the same time, we notice an increase in exports (+2.2 TWh). In a situation with 8.5 GW of maximum simultaneous interconnection capacity, we import more from Germany and the UK (apparently the 1 GW interconnection was a bottleneck), but less from the Netherlands and France. We also tend to export more to all our neighbouring countries, especially to the UK. The export to the UK grows from 1.9 TWh in a situation with NEMO I to 4 TWh with NEMO II operational. This can largely be attributed to the time difference between the two coun-tries. We also note that Belgium becomes more and more of a hub for electricity, providing throughput or transit of power (from Germany to the UK for example).
b. Required volumes of NG
Less production by CCGT and OCGT means less natural gas required to supply these units. The supply of natural gas destined to the power sector is reduced by 1.7 TWh-GCV, going from 33.2 TWh in Gas2017 to 31.5 TWh-GCV in Addinterco. This volume represents 2.4% (resp. 3.5%) of gas used for generating

REPORT
14
power in 2010 (resp. 2015). Compared to the projected natural gas imports in 2027 in a reference scenario (FPB, 2017, forthcoming), it is less than 1%.
c. CO2 emissions
Of course, differences in production and import/export patterns translate in differences in CO2 emis-sions11. For Belgium, because less natural gas is being burned to produce power, the CO2 emissions decrease by 0.3 Mt. Overall, on a European scale, they increase by 0.8 Mt. This increase is due to a rise in the production of coal- and lignite-based power in Europe: coal production increases by 1.7 TWh, lignite by 0.1 TWh. The CO2 emissions released by burning coal are only for a small part compensated by a lower production of CCGT (-1.3 TWh) and OCGT (-0.5 TWh). Countries that use more coal are principally Germany and Poland, less gas is used in a.o. Belgium and the UK.
d. System MC
The system marginal cost can be seen as a proxy for the “price” in an energy-only market design, but some nuances have to be taken into account:
– The system marginal cost is calculated as an average over the course of a year (8760h) and over the ten test cases: it therefore is not a momentary shot of the EPEX screen;
– It relates to the price of the commodity, not to the bill the end consumer receives at the end of the billing period;
– It depends on a number of assumptions as to the hypotheses relative to the price of the fuel, the conversion efficiency (which is taken to be 56% for existing CCGT, 59% for newly built CCGT and 34% for OCGT), the variable O&M costs and the price of CO2. The marginal production cost of an existing CCGT (resp. OCGT) then amounts to appr. 60 €/MWh (resp. 105 €/MWh) in 2027.
Comparing the two situations, we notice that the construction of the two additional interconnections will have a declining effect on the average system marginal cost. Installing a NEMO and ALEGRO ex-tension will trigger a downward pressure on system marginal costs of 0.33 €/MWh on average. Alt-hough this impact may seem rather modest, it has to be reminded that it is the result of the averaging out over the 10 test cases and the 8760 hours. Zooming in on test case level, hourly price differences up to 160 €/MWh can be detected, meaning that in the Addinterco scenario the price for 1 MWh of electricity at certain moments in time may be 160 € lower than in Gas2017. This happens for example when the latter has to rely on the more expensive DR option (priced at 275 €/MWh) whilst in the former, a foreign OCGT located in the UK can supply power at a lower price.
In absolute terms, average system marginal costs will decrease from 71.1 €/MWh in Gas2017 to 70.7 €/MWh in Addinterco. This will reflect on the consumer surplus: the consumer surplus in Belgium will increase by 39 M€, or 39 M€ less has to be spent by Belgian consumers on the purchase of the commodity electricity (excluding taxes, tariffs, etc.) in 2027. At the same time, production surplus will decrease be-cause production of gas-fired units diminishes and the average price the producers receive for gener-
11 It is important to recall that emissions from cogeneration are not reported in the model.
REPORT
15
ated electricity will be lower: this leads to a loss of 21 M€ in production surplus. For the UK and Ger-many, the opposite is happening. Their marginal costs increase, hence diminishing their consumer sur-plus, but because of increased production and higher wholesale prices, their production surplus over-compensates the loss in consumer surplus.
e. Missing Money
Missing money is a term that is used to describe a situation in which prices during critical hours are too low, leading to net revenues (revenues net of fuel and other operating costs) being inadequate to sup-port the efficient level and mix of generating capacity. This will engender underinvestment in generat-ing capacity, too many hours when capacity is fully utilized, too much reliance on non-price rationing, and too high a probability of a network collapse (Cramton and Stoft, 2006; Joskow, 2007).
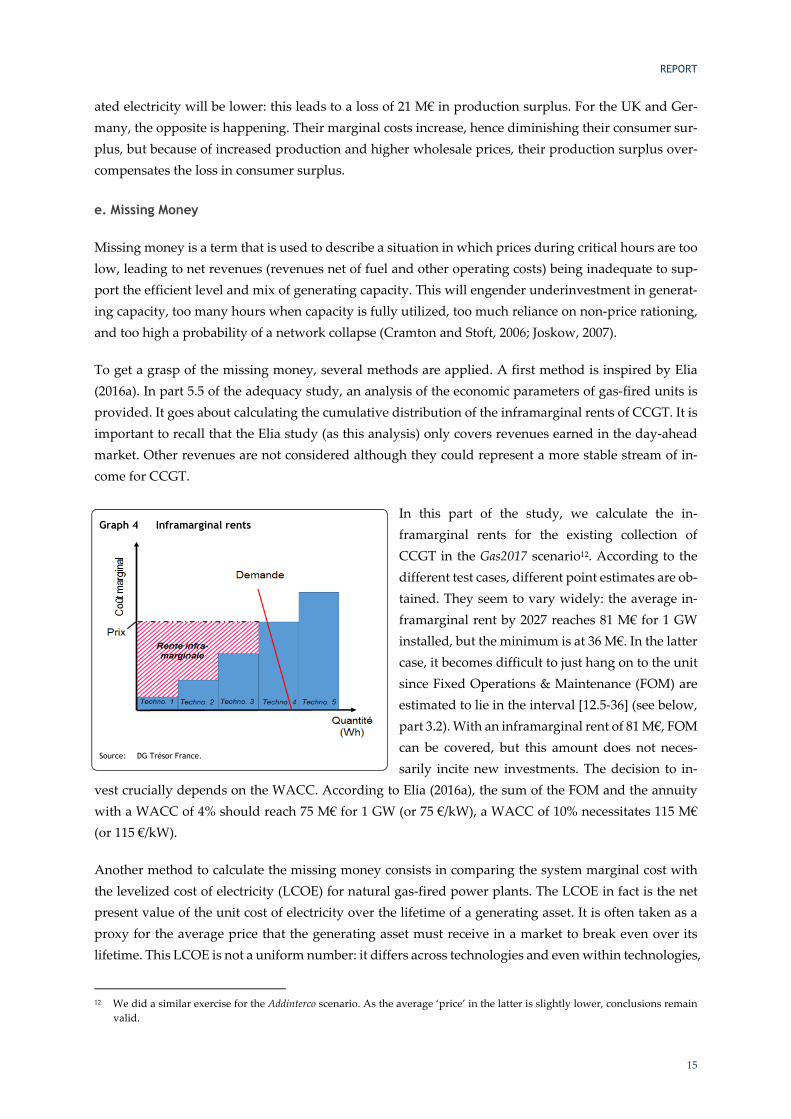
To get a grasp of the missing money, several methods are applied. A first method is inspired by Elia (2016a). In part 5.5 of the adequacy study, an analysis of the economic parameters of gas-fired units is provided. It goes about calculating the cumulative distribution of the inframarginal rents of CCGT. It is important to recall that the Elia study (as this analysis) only covers revenues earned in the day-ahead market. Other revenues are not considered although they could represent a more stable stream of in-come for CCGT.
In this part of the study, we calculate the in-framarginal rents for the existing collection of CCGT in the Gas2017 scenario12. According to the different test cases, different point estimates are ob-tained. They seem to vary widely: the average in-framarginal rent by 2027 reaches 81 M€ for 1 GW installed, but the minimum is at 36 M€. In the latter case, it becomes difficult to just hang on to the unit since Fixed Operations & Maintenance (FOM) are estimated to lie in the interval [12.5-36] (see below, part 3.2). With an inframarginal rent of 81 M€, FOM can be covered, but this amount does not neces-sarily incite new investments. The decision to in-
vest crucially depends on the WACC. According to Elia (2016a), the sum of the FOM and the annuity with a WACC of 4% should reach 75 M€ for 1 GW (or 75 €/kW), a WACC of 10% necessitates 115 M€ (or 115 €/kW).
Another method to calculate the missing money consists in comparing the system marginal cost with the levelized cost of electricity (LCOE) for natural gas-fired power plants. The LCOE in fact is the net present value of the unit cost of electricity over the lifetime of a generating asset. It is often taken as a proxy for the average price that the generating asset must receive in a market to break even over its lifetime. This LCOE is not a uniform number: it differs across technologies and even within technologies,
12 We did a similar exercise for the Addinterco scenario. As the average ‘price’ in the latter is slightly lower, conclusions remain
valid.
Graph 4 Inframarginal rents
Source: DG Trésor France.

REPORT
16
variations can be noted. The LCOE depends on a number of parameters amongst which the paid interest rate, fuel cost, load factor and the technical lifetime.
Two sources are used to determine the LCOE of Belgian CCGT. The first is the joint publication of the International Energy Agency and the Nuclear Energy Agency (2015). The LCOE for CCGT in Belgium in the year 2020 is estimated to be 114 $/MWh (103 $/MWh) when its load factor attains 50% (85%)13. When we compare this LCOE with the average “price” we obtain through our model (71 €/MWh) with a calculated load factor of 54%, we see that the LCOE cannot be repaid through revenues from the day-ahead market alone.
Another source is Albrecht et al. (2014). In this publication, an LCOE for CCGT is taken between 74 and 150 €/MWh. At the lower end of the interval, the load factor is assumed to be rather high. In that case, the CCGT seems to be marginally viable, but only slightly attractive for investors: they should just be able to recoup their investment. At the higher end, no investor will dare to jump.
It is important to point out that, if there is missing money, some firm thermal generators could be en-ticed to quit the market because of unavailability of FOM recovery. This may happen in a rather ‘disor-derly’ manner. When it materializes, supply shrinks at identical demand which leads to prices experi-encing an upwards pressure. This could even result in sustained periods of above long run marginal cost pricing, hence impacting in a positive manner the revenues of those generators who decided to stay. In terms of inframarginal rents earned by the remaining CCGT, we calculated that the demise of one CCGT could increase the rents by [3-15]%. In part 3.3, we analyse the impact this could have on security of electricity supply.
A point to stress is that our calculations only concern the year 2027. If future years hold more promise, it might be possible to reel in investors. But since wholesale power prices are very low today and that they are predicted to remain low for the years to come (Elia, 2016a), this should mean that the years after 2027 should be especially profitable with very high wholesale power prices to make up for the below-average years. This is rather unlikely since 1) politicians will take measures to avoid/mitigate the high price impact; 2) this would incite more people to self-produce and store their own electricity (be-come a prosumer), hence decreasing residual demand and future power prices.
Also, whether gas-fired power plants will have more rocky times during the intermediate ten-year pe-riod and whether they will survive up until 2027 is not the object of this study14. By 2027, the nuclear phase-out, as legally defined, will have created room for these natural gas units to operate. If the nuclear phase-out, for whatever reason, is postponed, this will impact the calculations. More specifically, the inframarginal rents and profitability prospects for gas-fired units will decrease because of the merit-order effect of prolonged nuclear units (Devogelaer and Laine, 2016).
The second analysis described in part 3.1.3 zooms in on a future in which the carbon price is significantly higher and triggers a gas before coal switch in the merit order.
13 Note that both fuel and carbon costs are estimated to be higher in the IEA/NEA publication. By comparing the results with
other countries having lower fuel and/or carbon costs, our conclusion seems robust. 14 Elia (2016a) gives some insights.
REPORT
17
3.1.3. Gas before coal
a. Full load hours
In this second analysis, the situation of constructing additional interconnections is looked upon in a context in which the CO2 price hovers around 55 €/tCO2. Compared to the previous situation, net elec-tricity production levels in Belgium are significantly higher: when we compare the scenarios Gas2017 and Gas2017_HighCO2, almost 10 TWh additional power will be generated by Belgian CCGT in the case of higher carbon prices. Throughout Europe, coal and lignite power plants lose ground in higher CO2 priced scenarios because of the imminent penalization proportional to their carbon content. The gener-ation in these carbon intensive plants will be replaced by an increase in the production of CCGT. Coun-tries that have natural gas in their capacity portfolio will augment its production, Belgium being amongst them. Therefore, Belgian gas-generated power will increase, raising CCGT load factors, and will flow to Member States that burn coal like the Netherlands and Germany.
In the case of the 2GW additional interconnection (scenario Addinterco_HighCO2), the amount of elec-tricity produced by Belgian CCGT even increases somewhat further (+37 GWh) but OCGT generate slightly less (-31 GWh). In terms of functioning, Belgian CCGT will have 11 more full load hours, going from 7656 to 7667 FLH (+0.1%). OCGT, on the other hand, will lose out on 63 full load hours, going from 784 to 721 FLH (-8%).
Import and export patterns change. When NEMO II and ALEGRO II are in place, exports from Belgium towards all our interconnected neighbours increase to attain 15.5 TWh compared to 11 TWh in Gas2017_HighCO2. Exports to Germany even double: they grow from 4.1 TWh in Gas2017_HighCO2 to 8.7 TWh in Addinterco_HighCO2. Imports towards Belgium also thrive. Where they reached 31 TWh in Gas2017_HighCO2, they now are at 35.5 TWh with imports from the UK to Belgium almost doubling: they grow from 7.3 TWh in Gas2017_HighCO2 to 14.3 TWh in Addinterco_HighCO2. What we can learn from these additional flows is that, in the case of a reinforcement of the interconnections with both Germany and the UK, Belgium will import more from gas producing countries (UK), less from neigh-bours having a more polluting mix (e.g. Netherlands, Germany) and will export more to all its neigh-bours, specifically to Germany.
b. Required volumes of NG
When a higher CO2 price is assumed, additional interconnections have no effect on natural gas supply to the power generation sector. Although the higher production of the CCGT exceeds the lower produc-tion of the OCGT, the difference in conversion efficiency (lower for OCGT than for CCGT) results in similar (absolute) changes in gas volumes. In other words, the additional gas used in the CCGT is ex-actly compensated by the lower gas consumption of the OCGT. In both scenarios, natural gas supply to the power sector is estimated to be 53 TWh-GCV in 2027.
REPORT
18
c. CO2 emissions
As regards CO2 emissions15, it is first instructive to cite the additional amount of CO2 produced in the Belgian electricity sector by going from a context with relatively low carbon prices to one in which the price of CO2 triggers a shift in the merit order. In the latter, because of the dramatic increase in CCGT activity, CO2 emissions in Belgium expand by 3.2 Mt. It should however be brought to the attention that the power sector is part of the European Emission Trading System (EU ETS) which is a cap-and-trade system. The emission reduction objective therefore is determined at European level by placing a cap on emissions whilst no target for ETS sectors is defined at Member State level. In practice, this means that when emissions in a certain country increase, additional permits have to be bought by the producers in that country on the destined auctions. This does not necessarily mean that the EU ETS cap will be sur-passed, rather the price of the permits will, in a normally functioning market, rise making the emitting of carbon (hence the electricity price) more expensive.
When we then compare the situation with and without NEMO II and ALEGRO II, we see that in the former, CO2 emissions are marginally lower: in the scenario Addinterco_HighCO2, they shrink by 5.7 kt (or 0.006 Mt). However, on a European scale, the effect is amplified. Because of the shift in the MOC triggered by the higher CO2 price, adding additional interconnections to and from Belgium will give room to a further replacement of the most polluting fuels and technologies. All over Europe, 1.9 TWh of coal, 1.9 TWh of lignite and 0.5 TWh of OCGT are being replaced by an additional 4.2 TWh of CCGT, giving way to a decrease in CO2 emissions. This effect is calculated to represent a decline of 2.5 Mt CO2
on European scale.
d. System MC
Comparing the two scenarios, we notice that the construction of the two additional interconnections will have a declining effect on the average system marginal cost. Installing a NEMO and ALEGRO ex-tension will trigger a decline in system marginal costs of 0.31 €/MWh on average. It is important to specify that this average is taken over all hours of the year (8760h) and over all ten test cases. Zooming in on test case level, hourly price differences up to 129 €/MWh can be seen, meaning that at certain hours, the presence of NEMO II and ALEGRO II will allow Belgian wholesale power prices to be 129 €/MWh lower than without those extensions.
In absolute terms, average system marginal costs will decrease from 97.1 €/MWh to 96.8 €/MWh. This will reflect on the consumer surplus. The consumer surplus in Belgium will increase by 33 M€, or 33 M€ less has to be spent by Belgian consumers on the purchase of the commodity electricity (excluding taxes, tariffs, etc.) in 2027. At the same time, production surplus will decrease because the average price the producers receive for generated electricity is lowered. The production surplus will be 20 M€ lower. The UK sees its production shoot by 4.4 additional TWh. Although its system MC is a bit higher (thereby lowering consumer surplus), the production surplus will be raised substantially. Germany, on the other hand, sees its production shrink by 2.6 TWh and its system MC decrease. This leads to a drop in the German production surplus triggered by both a price and volume effect. The consumer surplus, on the other hand, increases considerably due to lower wholesale power prices.
15 It is important to recall that emissions from cogeneration are not calculated in the model.

REPORT
19
e. Missing money
Also for the situation of more ambitious carbon prices, the missing money can be calculated. The first method inspired by Elia (2016a) calculates the inframarginal rents of CCGT in the year 2027. According to the different test cases, different point estimates for the inframarginal rents are obtained. The average inframarginal rent by 2027 reaches 134 M€ for 1 GW installed, the minimum hovering at 72 M€. Con-trary to the results obtained in part 3.1.2.e, FOM can be completely recouped by the inframarginal rents. Even new investments are likely to get their money back, since, according to Elia (2016a), the sum of the FOM and the annuity (with a WACC of 4%) should reach 75 M€ for 1 GW (or 75 €/kW), a WACC of 10% necessitates 115 M€ (or 115 €/kW). In 7 out of the 10 test cases, we see that inframarginal rents suffice to repay a WACC of 10%.
Even when additional interconnections are installed, missing money does not seem to be big of a prob-lem. The average inframarginal rent by 2027 then amounts to 131 M€ for 1 GW installed, the minimum is at 71 M€. Also in this case, FOM can be completely recovered by the inframarginal rents and even new investments are likely to get their money back. In 7 out of the 10 test cases, inframarginal rents suffice to repay a WACC of 10%.
Another indicator of the missing money can be seen in comparing the system marginal cost with the levelized cost of electricity (LCOE) for natural gas-fired power plants. The LCOE in fact is the net pre-sent value of the unit cost of electricity over the lifetime of a generating asset. It is often taken as a proxy for the average price that the generating asset must receive in a market to break even over its lifetime.
The same two sources are used to determine the LCOE of Belgian CCGT. The first is the joint publication of the International Energy Agency and the Nuclear Energy Agency (2015). The LCOE for CCGT in Belgium in the year 2020 is estimated to be 114 $/MWh (103 $/MWh) when its load factor attains 50% (85%). When we compare this LCOE with the average “price” we obtain through our model (97 €/MWh or 108 $/MWh) with a calculated load factor of 87%, we see that the LCOE approaches the sole revenues from the day-ahead market. The second source is Albrecht et al. (2014). In this publication, an LCOE for CCGT between 74 and 150 €/MWh is taken. At the lower end of the interval, the load factor is assumed to be high so we should take that value to compare with our case, meaning that our previous conclusion is confirmed.
A point to stress is that our calculations only concern the year 2027. Whether gas-fired power plants will have more rocky times during the intermediate ten-year period and whether they will survive is not the object of this study. By 2027, the nuclear phase-out, as legally defined, will have created room for these natural gas units to operate. If the nuclear phase-out, for whatever reason, is postponed, this will impact the calculations. More specifically, the inframarginal rents and profitability prospects for gas-fired units will decrease because of the merit-order effect of prolonged nuclear units (Devogelaer and Laine, 2016).

REPORT
20
3.1.4. Employment
According to sector interviews, approximately 30 persons are necessary to run and operate a natural gas-fired power plant. A premature closure of a gas unit would engender a loss in employment of these people. Some side remarks have to be added though.
It is not because the gas units (both CCGT and OCGT) have fewer running hours that they will be com-pletely useless to the system. They will run less because they are being outcompeted by certain foreign power plants. This, however, will benefit the Belgian customer because she will have to pay less for acquiring the commodity. Part 3.1.2.d already demonstrated that the additional interconnections have a downwards effect on system marginal cost. If this is the case, it has a beneficial impact on all energy-intensive customers supplying through (the) exchange (-based contracts) who can profit from lower commodity prices and hence be more competitive on the international scene, potentially creating new jobs in their respective sectors.
On the other hand, it does not eliminate the role gas units will have to play in the electricity system of the future. Although they function less, they are desperately needed when things start to heat up, in other words, when generation adequacy is on the line. If it is decided to keep them online (be it in a strategic reserve or through another mechanism) employment does not necessarily suffer. As already stated in the CBA, although running hours decrease, this does not immediately signify that its entire staff gets fired. A significant part of the work force is kept during the full year but it may be allocated in a different way.
As regards employment within the TSO, when asked about the potential job creation induced by build-ing new interconnections, the national TSO Elia responded that it was not able to put a number on the exact amount of newly created jobs. It did, however, pointed out the derivative effect of lowering whole-sale power prices that is to the benefit of the entire Belgian economy, thereby maintaining and contrib-uting to the creation of employment in Belgium.
3.1.5. Cost of the additional interconnections
This part, more specifically, part 3.1.5.a and 3.1.5.b are based on inputs from the Belgian National Reg-ulatory Authority (NRA) CREG16: the CREG provided a number of cost figures on interconnections that are either being built or being studied as a potential project.
a. In progress
Let’s start with ALEGRO. The ALEGRO project between Lixhe (BE) and Oberzier (DE) is the first un-derground HVDC interconnector in the CWE zone and the first direct physical connection between Belgium and Germany. According to the CREG, the estimated cost for Belgium to build the ALEGRO interconnection amounts to 262 M€. As can be seen in Table 4, this project is more expensive than two other interconnection projects, i.c. Avelin-Horta (FR-BE) and Brabo II and III (BE-NL). The costs for
16 Short for Commission for Electricity and Gas Regulation.

REPORT
21
these three interconnections are integrated in the transmission tariffs approved by the CREG and, hence, paid for by the consumers.
Table 4 Estimated costs of different interconnections to and from Belgium Project Timing Interconnection Capacity (MW) CAPEX (M€) Alegro 2020 BE-DE/DE-BE 1000 261.5 Avelin-Horta 2022 FR-BE 1000 107.6 BE-FR 500 Brabo II+III 2020-2023 BE-NL/NL-BE 1000 173.5 Nemo 2020 BE-UK/UK-BE 1000 323 Source: CREG, Elia.
For the NEMO project, the CREG specified that a specific regulatory framework applies since the UK system has a different set-up than Continental Europe. The NEMO interconnector project is a 1 GW HVDC cable between Belgium and the United Kingdom which is being jointly undertaken by Elia and the British TSO National Grid. It links the Richborough substation (UK) to the Gezelle substation (Bel-gium).
The estimated total cost of this interconnection amounts to 646 M€ of which half (323 M€) is applicable to Belgium. For the moment, no costs for this specific interconnection are integrated in the tariffs since it is believed that future congestion rents will be sufficiently high as to compensate the investment (as well as a fair return17).
b. Study projects
Since the potential second interconnections between Germany and Belgium (ALEGRO II) and the UK and Belgium (NEMO II) are both still in the study phase18, it is not straightforward to quote costs, all the more so because cost estimations are contingent on the connection point, the route, etc. In the frame-work of the evaluation of the Projects of Common Interest (PCI19), however, following figures from ACER, the Agency for the Cooperation of Energy Regulators, were obtained:
– CAPEX: 700 M€ for NEMO II and 500 M€ for ALEGRO II;
– OPEX: 6 M€/year for NEMO II and 4 M€/year for ALEGRO II.
Half of the CAPEX can reasonably be assumed to be applicable to Belgium: the investment cost for NEMO II (ALEGRO II) can then be estimated to be around 350 M€ (250 M€) for 1 GW of physical ca-pacity. This should, however, not be seen as a fixed rule and sole possibility. Another option could be that each TSO pays for assets on its own territory which, in the case of ALEGRO, would make things less expensive for Belgium.
17 More information on the regulatory framework of the NEMO project can be found in Annex 3 of the document
http://www.creg.be/sites/default/files/assets/Publications/Others/Z1109-7bNL.pdf. 18 Elia (2015), Plan de Développement fédéral du réseau de transport 2015-2025 via http://www.elia.be/~/media/files/Elia/Grid-
data/grid-development/Plan-de-Developpement-federal-du-reseau-de-transport_2015-2025.pdf. 19 https://ec.europa.eu/energy/en/topics/infrastructure/projects-common-interest.

REPORT
22
c. Benefits
Next to these costs, investing in the electricity grid with technologies that are more efficient and reliable also bring important benefits. A categorization of these benefits reflects the so-called trias energetica:
1. competitiveness: recently, the optimisation of the commercial cross-border electricity flows has been significantly improved by installing the market coupling mechanism. Nineteen European power mar-kets are coupled in this way guaranteeing that the power flows from countries where it is the least expensive to generate electricity to countries where it is the most expensive. Such a mechanism causes a considerable reduction in the costs to supply electricity. The development of the coupling mechanism and the interconnections have given way to a wider integration of the European markets as well as to price convergence. For the years 2013-2015, the difference in wholesale power prices between Germany and France was less than 0.01 €/MWh for more than 50% of the time and the same goes for Belgium20. A report by the Brattle Group (2011), an independent consulting firm, confirms that transmission investments increase competition in electricity markets, resulting in lower-cost electricity.
2. climate: through more (efficient) integration of renewable energy sources, transmission in-frastructure helps to deliver clean, low-cost re-newable energy all over Europe: from zones where wind (typically the North and coastal re-gions) and solar PV (South) have a competitive advantage towards the big load centers (often situated in the middle). As different power plants are created and retired and the nation’s electricity mix changes towards a higher pene-tration of renewable energy sources, the grid needs to be updated and expanded to keep pace. Upgrading and expanding transmission in itself creates a ripple effect by spurring further re-newable development.
3. security of supply: the historic role of interconnections and cross-border exchange of electricity was to guarantee security of supply21. Interconnections have allowed to augment the system resilience through facilitating the momentaneous access to foreign production in case of a strenuous situation on the national market. More reliable electricity supply can be further strengthened through an ex-pansion of interconnections (see also part 3.3.3).
In short, investments in interconnections have a long economical lifetime and do not serve a single pur-pose. Rather they are intended to prepare our country for the future. They not only are a way to secure
20 Commission de régulation de l'énergie (2016), Les interconnexions électriques et gazières en France. 21 Although Giesbertz (2017) notes that interconnectors have always been used as a mean to optimise the use of generation
resources across Europe. The role of interconnectors in facilitating cross-border trading and thus optimising the economic dispatch of power plants has always been crucial, not only in the period after the liberalisation.
Graph 5 Simplified representation of load centers (dark grey), wind and solar (orange) and water (blue) in Europe
Source: Elia (2017).
REPORT
23
a competitive supply by lowering average wholesale power prices and contributing to security of sup-ply, they are also needed for the integration of (way) more renewable energy sources like offshore wind from the North Sea.
Finally, the Brattle Group (2011) reports on the impact of transmission investment in the US in terms of job creation and economic development. According to their analysis, every $1 billion invested in US transmission infrastructure creates $2.4 billion in total economic activity and more than 13,000 full-time-equivalent jobs.
3.2. Maintaining currently existing gas-fired power plants
To know how much it costs to keep existing gas-fired units operational, four sources are consulted:
– According to calculations made by Fluxys, the independent operator of the natural gas transmission system in Belgium, the cost of maintaining 1 GW of existing CCGT amounts to 25 M€;
– During a communication with the sector, it was stated that to keep 4 GW CCGT operational, 50 M€ should be provided. This equals half the amount estimated by Fluxys;
– Elia (2016a) specifies that the FOM for Belgian CCGT amounts to 21 M€ per year;
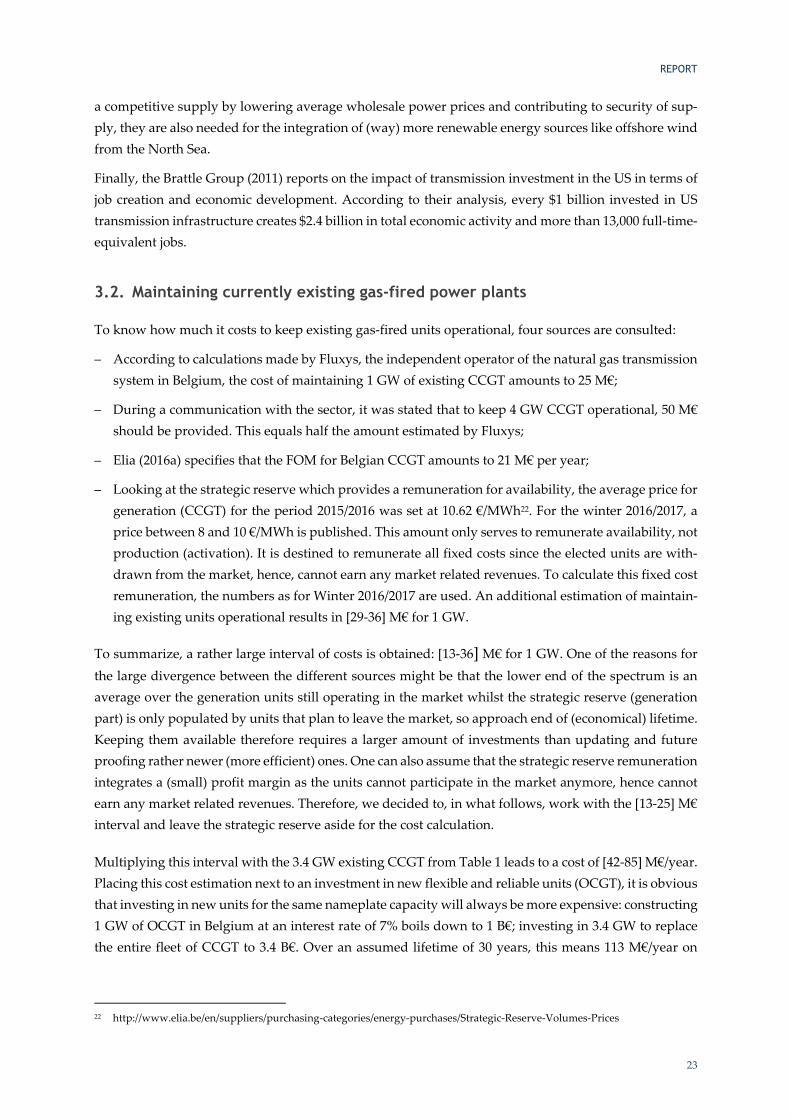
– Looking at the strategic reserve which provides a remuneration for availability, the average price for generation (CCGT) for the period 2015/2016 was set at 10.62 €/MWh22. For the winter 2016/2017, a price between 8 and 10 €/MWh is published. This amount only serves to remunerate availability, not production (activation). It is destined to remunerate all fixed costs since the elected units are with-drawn from the market, hence, cannot earn any market related revenues. To calculate this fixed cost remuneration, the numbers as for Winter 2016/2017 are used. An additional estimation of maintain-ing existing units operational results in [29-36] M€ for 1 GW.
To summarize, a rather large interval of costs is obtained: [13-36] M€ for 1 GW. One of the reasons for the large divergence between the different sources might be that the lower end of the spectrum is an average over the generation units still operating in the market whilst the strategic reserve (generation part) is only populated by units that plan to leave the market, so approach end of (economical) lifetime. Keeping them available therefore requires a larger amount of investments than updating and future proofing rather newer (more efficient) ones. One can also assume that the strategic reserve remuneration integrates a (small) profit margin as the units cannot participate in the market anymore, hence cannot earn any market related revenues. Therefore, we decided to, in what follows, work with the [13-25] M€ interval and leave the strategic reserve aside for the cost calculation.
Multiplying this interval with the 3.4 GW existing CCGT from Table 1 leads to a cost of [42-85] M€/year. Placing this cost estimation next to an investment in new flexible and reliable units (OCGT), it is obvious that investing in new units for the same nameplate capacity will always be more expensive: constructing 1 GW of OCGT in Belgium at an interest rate of 7% boils down to 1 B€; investing in 3.4 GW to replace the entire fleet of CCGT to 3.4 B€. Over an assumed lifetime of 30 years, this means 113 M€/year on
22 http://www.elia.be/en/suppliers/purchasing-categories/energy-purchases/Strategic-Reserve-Volumes-Prices
REPORT
24
average. Although the overnight cost23 of OCGT in Belgium is about 11% lower than CCGT, keeping existing CCGT online hence outbeats investing in new OCGT.
Table 5 Natural gas-fired technologies, Belgium, year 2020 Country Technology Net capacity
(MW) Electrical conversion efficiency (%)
Overnightcost ($/kWe)
Investment cost ($/kWe)
3% 7% 10%Belgium CCGT 420 60 1053 1085 1128 1160 OCGT 280 44 933 961 999 1028Source: IEA/NEA (2015).
Above that, the cost-of-use of a CCGT is lower than that of an OCGT because of the latter’s lower effi-ciency, thereby explaining their different positions in the merit-order curve. It should be pointed out, however, that although the investment cost is higher, having new flexible smaller scale units may bring additional advantages to the system in terms of complementarity with variable renewable energy sources, lower outage rates, less maintenance costs, etc. Prolonging rather old units will inevitably lead at some point in time to replacement investments.
An alternative is to transform currently existing CCGT in OCGT. This operation necessitates different technical, economical and organisational analyses but it is feasible and has been proven in the past. The Drogenbos plant is an example. It used to be a 460 MW CCGT and was transformed into a 230 MW OCGT. According to Fluxys (2017), the conversion of a 1 GW CCGT in OCGT (with reduced capacity) amounts to 1 M€ in annualised investment costs and 20 M€ in terms of operations and maintenance. The process can even be reversed: during the winter (January 2017), due to prolonged outages of several nuclear power plants both in France and Belgium it was decided to, for a period contained to a couple of weeks, reconvert the OCGT into a CCGT.
3.3. Impact assessment of an increased risk of black-out
The last part deals with the socio-economic impact of an increased risk of a black-out, next to the eco-nomic asymmetry this engenders in relation to the costs and benefits of conserving sufficient domestic capacity in order to comply with the legally defined LOLE benchmark of 3h.
23 Overnight cost includes pre-construction (owner’s), construction (engineering, procurement and construction) and contin-
gency costs, but not interest during construction (IDC). Investment cost includes overnight cost (with contingency) as well as the implied IDC.

REPORT
25
It is important to point out that no power system can be 100% reliable: there is always some trade-off between the cost of providing additional back-up capacity and the level of reliability achieved. The LOLE benchmark allows this trade-off to be made. Each additional unit of capacity brings an increased adequacy benefit; it is the criterium that will suggest the point at which this additional security benefit is outweighed by the cost of providing that capacity.
Other preliminary remark is that what is discussed in this part concerns the generation adequacy. Gen-eration adequacy (short: adequacy) is distinct from short term ‘operational security’ which is dependent on the moment to moment balancing of supply and demand. Operational security is and will continue to be the competence of the System Operator Elia.
3.3.1. Adequate adequacy criterium
Let’s start by first checking the adequacy criterium that Belgium adopted by law in 2014. The proposed methodology is taken from the London based Department of Energy and Climate Change (DECC, 2013)24. They advocate to take the ratio between the Cost of New Entry (CONE) and the Value of Lost Load (VOLL).
a. Cost of New Entry
The Cost of New Entry represents the cheapest cost of a new entrant peaking plant. It can be seen as the yearly amount of revenue needed to pay for capacity such that the discounted value (NPV) of its oper-ations is zero over its technical operating lifetime. The cheapest way of providing new capacity is through investing in an OCGT (DECC, 2013). In Belgium, this cost is estimated to be 65 €/kW25 (Fluxys, 2017). This figure was validated by the sector in a private communication.
24 Annex C: Reliability Standard Methodology. 25 DECC (2013) adopts a cost of 47£/kW which, at the current exchange rate, amounts to 53.5 €/kW. The noticeable difference
with Belgium can largely be explained by the overnight cost: according to IEA/NEA (2015), the overnight cost of an OCGT in UK is approximately 46% cheaper than in Belgium.
Box 1 LOLE criterium for Belgium
In the Electricity Act of April 29, 1999 and its ulterior amendments concerning the organisation of the electricity market, a legal criterium as to generation adequacy is defined: it is expressed in LOLE. The LOLE or Loss of Load Expectation represents the number of hours per year in which, over the long-term, it can statistically be expected that supply will not meet demand (DECC, 2013). When that occurs, the national TSO needs to turn to additional means to keep the system in balance. TSOs are usually able to solve this without major impacts on the system, i.e. by using instruments such as temporary voltage reductions or the selective disconnection of large industrial users.
Because of a lack of harmonised standards on European or regional (‘zonal’) level, Belgium defined its own double LOLE criterium. It states that the LOLE cannot exceed a maximum of 3h for a statis-tically speaking ‘normal’ year and a maximum of 20h for a statistically ‘exceptional’ year. Interesting to know is that 3h of LOLE translates into a system security level of 99.97%, meaning that 99.97% (1–(3/8760)) of the year, there will be no expected loss of load caused by insufficient generating capacity.

REPORT
26
b. Value of Lost Load
The Value of Lost Load is not a static concept, it is dynamic and not straightforward to determine. Devo-gelaer (2014) estimated the cost of a 1h blackout for the Belgian economy during a winter working day to be 120 M€, which is equivalent to a VOLL of 8.3 €/kWh26. In the calculations made by DECC, however, the ‘average’ VOLL is not taken into consideration. They chose to exclude some categories that are or should be able to participate in the reserve market through demand side response or else be able to change their electricity use in response to price signals (price-sensitive demand). Large commercial and industrial consumers are therefore not included in their reliability calculation. With this in mind, the Belgian VOLL was recalculated by excluding a number of sectors (ex. manufacturing). A weighted av-erage VOLL at times of winter peak demand then is estimated to amount to 23.3 €/kWh.
c. The ratio
Dividing the CONE by the VOLL, we get a value of 2.8 or almost 3 as is adopted in the Electricity Act. It seems that the reliability criterium was properly defined or at least is still accurate under the current circumstances.
3.3.2. Impact of one CCGT
Table 6 then brings in some Crystal Super Grid model results. In the scenario Gas 2017 as defined in part 3.1.1, the average LOLE over the ten test cases attains 2.6h. This is comfortably beneath the legally stip-ulated criterium of 3h as specified in the Electricity Act. Next, a new scenario is constructed in which 1 CCGT is retracted from the system: this is called Minus 1. The LOLE in Minus 1 increases to 3.1h. With-drawing a 500 MW CCGT from the current Belgian generating park has as effect that the legally defined criterium no longer is respected.
Table 6 Some security of supply indicators according to different scenarios, Scenario LOLE (hours) Max LOLE (hours) MC (€/MWh) Gas2017 2.6 14 71.9 Minus 1 3.1 15 73.9 Minus 2 6.1 22 79.0 Minus 3 16 50 88.8 Source: Crystal Super Grid.
Analysis of the model results and out-of-model calculations teach us that, to arrive at a safe LOLE of 3h, a minimum of 53 MW should be added to the power system described in Minus 1.
When 2 CCGT are closed and pulled out of the system, the average LOLE reaches 6.1h. In this case, not only the first but also the second condition stipulating that in a statistically exceptional year, maximum 20h of LOLE can occur, is breached. The (premature) closure of 3 CCGT would really be problematic.
In the last column of Table 6, the average system marginal cost of every scenario is depicted. It is obvious that the more capacity is withdrawn from the system, the higher the system marginal cost in Belgium. This is because of the high price attached to the Loss of Load27 which pulls the average price upwards.
26 Remark that this VOLL is approximately 40 times higher than the average price households pay for their electricity. 27 In the model, this is uniformly priced at 3000 €/MWh. For Belgium, this seems to be an underestimation (Devogelaer, 2014).

REPORT
27
Note, however, that incumbents stand to gain if vested producers leave the market (the Minus scenarios): in part 3.1.2.e, we calculated that, because of the higher resulting ‘price’, inframarginal rents in a sce-nario with one CCGT closing down may increase by as much as 15%. On the other hand, these higher prices may attract new entrants. Although their arrival may be beneficiary in terms of security of supply, the increase in supply will have a dampening effect on prices.
3.3.3. How many should we have?
How many gas-fired units should we then have? To solve the puzzle, the methodology as described in DECC (2013) is applied. In an optimal adequacy situation, the relationship between the cost of new entry (CONE), the expected number of hours of lost load (LOLE) and the value consumers place on avoiding lost load (VOLL) can be expressed as
CONE = LOLE*VOLL
This is illustrated in Graph 6. The optimal level of security of supply can be found at the intersection of two curves, being the cost of providing capacity and the cost of experiencing a black-out. In that point, the incremental cost of insuring customers against black-outs by foreseeing capacity is equal to the incremental cost to customers of a black-out. The graph in fact mirrors the asymmetry in costs between suffering from a shortage of capacity and keeping too much capacity available in the system.
When we apply this formula to the scenario Gas2017 (Table 7), we see that
CONE > LOLE*VOLL
Doing the same for scenario Minus 1, we obtain
CONE < LOLE*VOLL
Table 7 Input parameters for the DECC adequacy calculation Parameter Value Unit LOLE Gas2017 2.6 h LOLE Minus 1 3.1 h VOLL 23.3 €/kWh CONE 65 €/kW Source: Crystal Super Grid, Black-out Simulator, FPB calculations, Fluxys (2017).
What do these inequalities mean? First, it is important to recall that in this exercise, OCGT are chosen to determine the CONE. This choice was made because OCGT are the marginal units in the system28.
28 For the majority of the time. Nowadays, DR bids are only occasionally cleared after OCGT, but this is bound to change in the
future (see part 3.3.4).
Graph 6 Optimal level of Security of Supply
Source: DECC (2013).

REPORT
28
OCGT are only dispatched once other plants are already operating and the system is running out of capacity. This is because, although it is the cheapest type of capacity to construct, it has very high run-ning costs. If it is assumed that wholesale prices can match the value that consumers place on electricity or, in other words, prices are allowed to rise to the Value of Lost Load (23300 €/MWh), then the OCGT can recover its costs by running for 3 hours a year. If that is the case, a 1MW peaking plant will be called upon during the really critical moments in the system who will cumulatively last for 3 hours. It will then cover roughly 3 MWh of load at a price of 23300 €/MWh, causing earnings to be around 70000 €, hence recouping its investment.
If more capacity were to be installed (i.e. if we had a more secure system than implied by the reliability standard), then the marginal peaking plant would run less often and therefore would serve less than 3 MWh of load per MW of capacity. The cost of serving this load would therefore exceed the value that customers place on electricity and it would represent poor value for money for customers. If less capac-ity were to be installed (i.e. if we had a less secure system than implied by the reliability standard), then the marginal peaking plant would serve more than 3 MWh of load per MW of capacity. The cost of serving this load would therefore be less than VOLL and so building more capacity would offer value for money for customers. A similar conclusion was drawn in recent work from Ovaere (2017). For a case of cross-border reserves procurement, he states:
“Reserves should be procured up to the point where the marginal cost of procurement is equal to the marginal expected cost of interruptions. … Optimal procurement increases with the VOLL.“
Since generation adequacy can be modelled in a similar manner as network adequacy, this can be trans-posed to our case by changing ‘reserves’ to ‘OCGT’.
To sum things up, in a situation in which the CONE is lower than the multiplication of the VOLL and the LOLE, the system reserve of the power generation park deviates from the adequacy criterium. In an optimal situation, capacity should be added at a cost that, for society, is lower than suffering a big-scale interruption.
Box 2 Can prices rise to the level of the VOLL?
Can prices rise to the level of the VOLL instead of being capped at an administrative level? In one of the preambles of the proposal for a Regulation on the internal market for electricity, the European Commission (2016) writes:
“Effective scarcity pricing will encourage market participants to be available when the market most needs it and ensures that they can recover their costs in the wholesale market. It is therefore critical to ensure that, as far as possible, administrative and implicit price caps are removed to allow scarcity prices to in-crease up to reflecting the value of lost load.”
Article 9 of this proposal for a Regulation states that prices in the wholesale market may not be capped unless this cap is set at the VOLL. Article 10 even obliges Member States to establish a single estimate of VOLL for their territory expressed in €/MWh.

REPORT
29
Applied to the scenarios Gas2017 and Gas2017_HighCO2, it is safe to state that by 2027, if the currently operational gas units can be kept online, generation adequacy should not be the source of major prob-lems. Adding interconnections in Addinterco and Addinterco_HighCO2 even alleviates the problem by having a positive influence on generation adequacy: the average LOLE decreases by 0.1h. A similar result could already be seen in Elia (2016a): when 2 GW of import capacity is added to the Belgian system29, the necessary volume of the structural block in 2027 can decrease by 1.5 GW and the LOLE is 0.1h lower than in the Base case. This should come as no surprise since the historical role of intercon-nections was to add to system security of supply (see also part 3.1.5.c).
If one or more of the CCGT closes, generation adequacy will be jeopardized. Two things can be done:
– prevent the CCGT from leaving the market: prolonging the system of Strategic Reserves30 could be envisaged;
– trigger investments in new OCGT. For the latter to be profitable, however, the current price cap should be lifted and prices should be able to rise to the level of the VOLL.
3.3.4. Demand Response to the rescue
In the previous section, we assumed that OCGT are the cheapest way of increasing adequacy in a power system suffering from an insufficient LOLE. But is it really? If the newly built OCGT only have to run for a very limited number of hours per year, couldn’t there be cheaper solutions?
Demand Response can be the answer. If Demand Response can be offered at a price lower than that of building new OCGT, it should be eligible for safeguarding adequacy. Finding data on Demand Re-sponse, however, is not an easy undertaking. Fraunhofer ISI and FfE (2014) claim that minimal prices triggering industrial DR are to be situated within an interval of 100 to 400 €/MWh. The same interval, albeit a bit broader, can also be found in Rooijers et al (2014). DIW Berlin confirms by advancing that the variable costs of industrial DR are usually high but stay below 500 €/MWh (Stede, 2016).
In the contracted volumes and prices for the Strategic Reserve for the Winter period 2015-201631, prices for DR are displayed which, according to our calculations, amount to 35.4 €/kW (without activation). These prices only cover the Winter period (November-March). In systems with way more variable re-newable energy sources, hence a decrease in firm or reliable available capacity (RAC), and maintenance schedules for thermal plants concentrated during the Summer months, we want the DR to be available the entire year. Probably, this puts an upwards stress on prices (or a downwards stress on customer’s bills through reclaimed discounts). The thing is, as long as it is beneath the 65 €/kW of an OCGT, DR should be the preferred option to assure generation adequacy because:
– it does not necessitate the building of new infrastructure that stands idle for a vast period of the year;
– it does not emit any greenhouse gas emissions.
29 This is a sensitivity described in part 5.4.3 in Elia (2016a). 30 Technically, there is no end date specified for the system of Strategic Reserves. Even if this system will still be operational by
2027, the recuperated CCGT will have to enter into competition with DR (see also part 3.3.4). 31 http://www.elia.be/en/suppliers/purchasing-categories/energy-purchases/Strategic-Reserve-Volumes-Prices.

REPORT
30
Moreover, the penetration of residential storage, be it through the installation of stationary batteries or the purchase of electric vehicles, cumulated and managed by an aggregator should be able to reduce prices for DR further, or at least add a lower cost category.
If that happens, the ratio as defined in part 3.3.1.c will decrease, that is, if we assume the VOLL to be constant. But will the value consumers place on loosing load and foregoing on electricity consumption be the same if they possess their own production capacity (solar PV) and means to store it (stationary or rolling batteries)? Or maybe that is a good time to rethink security of supply altogether: in times when the majority of demand can and will respond to prices and technology has evolved in such a way that even households can take care of their own security of supply, is it still necessary that the federal government provides this (entirely)? Can the supranational/regional32 level, potentially through the functioning of the ROCs as defined in the Clean Energy Package (European Commission, 2016) be more meaningful?
32 Regional not in the sense of the regional entities in Belgium, but rather as the zone to which Belgium belongs, i.c. the CWE-
zone or the Pentalateral Forum.

REPORT
31
4. Key findings
At the end of this study, some takeaways can be formulated.
First and foremost, this analysis once again demonstrates the major impact a fair carbon price can have on the functioning and the profitability of Belgian gas units. If the carbon price on the EU ETS market could trigger a switch in the merit-order between coal and natural gas, Belgian power plants would profit, run for more hours, export more electricity to the neighbours and overall will benefit in terms of increased inframarginal rents.
If a rise in the carbon price which nowadays oscillates around 6 €/tCO2 does not materialize, one should try to operate on a supranational level through credible cooperation initiatives: a reinforcement of the role of CORESO as the interpretation of the Regional Operational Centers (ROCs) posited in the Euro-pean Commission’s Clean Energy Package could in that regard be considered a good vehicle. The point is that, although Member States have sovereignty over their energy mix according to the Treaty of Lis-bon, it is crucial that national phase-out plans are coordinated across a larger ‘zone’ which is directly impacted by the phase-out. A such coordination may avoid black-outs, increase credibility and create an optimal level of ‘scarcity’ in the zone. It could then be used to facilitate the gradual phase-out of coal, lignite, old gas & nuclear power plants, thereby easing the entry into a new era of the energy transition.
The question whether new interconnections with both the UK and Germany have more benefits than costs hinges on this carbon price dilemma. In both merit-order cases (coal before gas and gas before coal), a clear decrease in both system marginal costs (‘price’) and CO2 emissions of the Belgian electricity sector can be noticed. Nonetheless, in the former, generation by Belgian gas units is reduced and Bel-gium becomes more and more of a hub for electricity, providing throughput or transit of power from east to west and north to south (and vice versa). In the latter case, Belgium seems to benefit more from the increased interconnections, exporting vast amounts of home-made electricity towards Member States with a less advantageous, more polluting electricity mix. Above that, the role of interconnections should not be limited to competitiveness (through price convergence) but it also spans system security of supply and integration of renewable energy sources.
In terms of missing money, once again, carbon prices play a pivotal role. When carbon prices are too low, there is missing money and attracting investors becomes hazardous. When carbon prices are raised to a level that triggers the gas-before-coal switch and the legally defined nuclear phase-out is honoured, money is not missing anymore and inframarginal rents should suffice to cover a rent on top of the fixed operations and maintenance costs.
Finally, if we succeed in keeping the current operational thermal flexible park online until after the phase-out of the nuclear units, generation adequacy should be assured. It is when one (or more) of the current units decides to leave the system that adequacy can no longer be guaranteed in terms of the legally defined LOLE criterium. Investments in new OCGT could mitigate the situation. Condition to trigger these investments, however, is that market design should be simultaneously revised. Opportu-nities in terms of Demand Response should be carefully scrutinized because they can possibly provide a cheaper way to guarantee security of electricity supply.
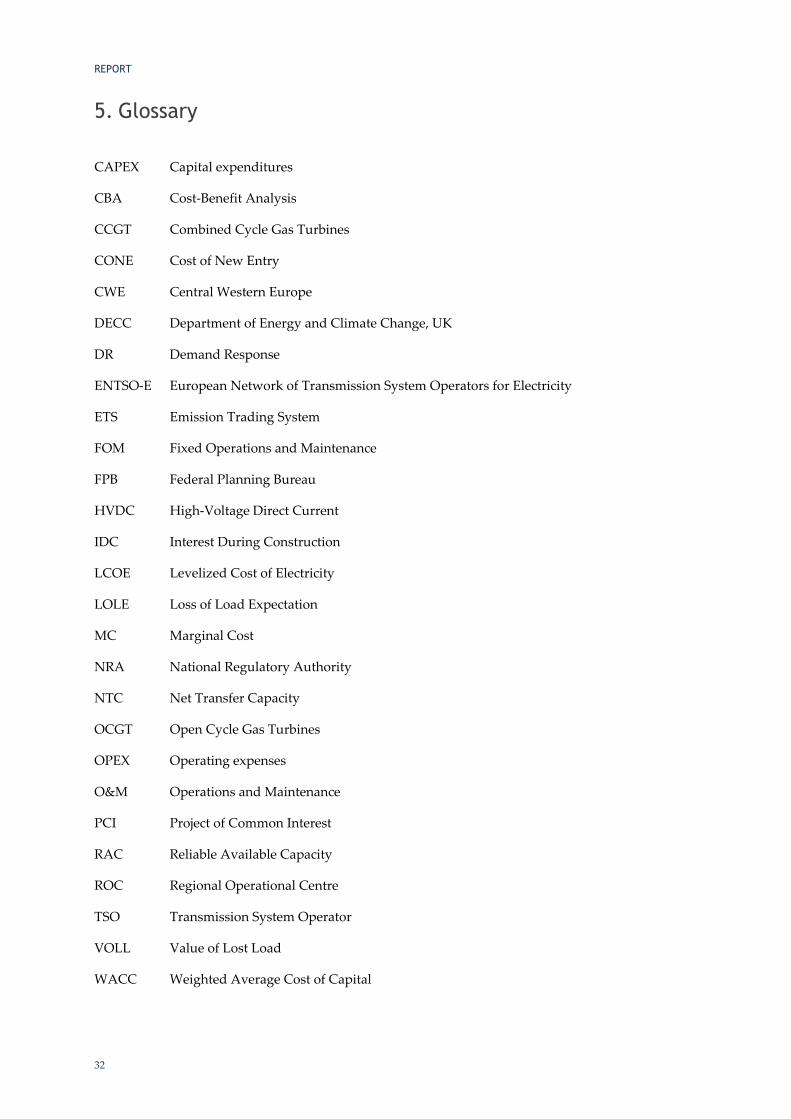
REPORT
32
5. Glossary
CAPEX Capital expenditures
CBA Cost-Benefit Analysis
CCGT Combined Cycle Gas Turbines
CONE Cost of New Entry
CWE Central Western Europe
DECC Department of Energy and Climate Change, UK
DR Demand Response
ENTSO-E European Network of Transmission System Operators for Electricity
ETS Emission Trading System
FOM Fixed Operations and Maintenance
FPB Federal Planning Bureau
HVDC High-Voltage Direct Current
IDC Interest During Construction
LCOE Levelized Cost of Electricity
LOLE Loss of Load Expectation
MC Marginal Cost
NRA National Regulatory Authority
NTC Net Transfer Capacity
OCGT Open Cycle Gas Turbines
OPEX Operating expenses
O&M Operations and Maintenance
PCI Project of Common Interest
RAC Reliable Available Capacity
ROC Regional Operational Centre
TSO Transmission System Operator
VOLL Value of Lost Load
WACC Weighted Average Cost of Capital

REPORT
33
6. References
Albrecht, J. and R. Laleman (2014), Policy trade-offs for the Belgian electricity system, University of Ghent.
Artelys (2017), Étude sur la flexibilité du système belge, Rapport final pour le SPF Économie.
Brattle Group (2011), Employment and Economic Benefits of Transmission Infrastructure Investment in the U.S. and Canada, Report prepared for the Working group for Investment in Reliable and Economic electric Systems.
Cramton, P. and S. Stoft (2006), The Convergence of Market Designs for Adequate Generating Capacity, man-uscript, April.
DECC (2013), Consultation on the draft Electricity Market Reform Delivery Plan, July.
Devogelaer, D. (2014), Belgische black-outs berekend, Een kwantitatieve evaluatie van stroompannes in België, Federal Planning Bureau, Working paper 3-14.
Devogelaer, D. and B. Laine (2016), Drivers of wholesale electricity prices in a small, open economy, Some evidence from the nuclear restart in Belgium, Federal Planning Bureau, Working paper 9-16.
Devogelaer, D. and D. Gusbin (2017), Cost-benefit analysis of a selection of policy scenarios on an adequate future Belgian power system, Economic insights on different capacity portfolio and import scenarios, Federal Planning Bureau, Report, February.
E-Cube, Integration of the Market Response 2017, Task Force Implementation Strategic Reserve, Presentation, Brussels, July 12th 2017.
Elia (2015), Federaal ontwikkelingsplan van het transmissienet 2015-2025.
Elia (2016a), Studie over de nood aan ‘adequacy’ en aan flexibiliteit in het Belgische elektriciteitssysteem, periode 2017-2027, April.
Elia (2016b), Addendum to the Elia study regarding the “adequacy” and flexibility needs of the Belgian power system for the period 2017-2027: Additional scenario and clarifications, September.
Elia (2017), Elia’s kijk op de Belgische energievisie voor 2050, Report, June.
European Commission (2017), Proposal for a Regulation of the European Parliament and of the Council on the internal market for electricity (recast), COM (2016) 861 final/2.
Fluxys (2017), Gas, gasinfrastructuur en gastechnologie: kerningrediënten in de energiemix van morgen, Presentatie.
Fraunhofer ISI and Forschungsgesellschaft für Energiewirtschaft mbH (2014), Load management as a way of covering peak demand in Southern Germany, Final report on a study conducted for Agora Ener-giewende, May.
Giesbertz, P. (2017), The power market design column – The interconnector demystified, March.
IEA/NEA (2015), Projected costs of generating electricity, 2015 edition.
REPORT
34
Joskow, P. (2007), Capacity payments in imperfect electricity markets: need and design.
Joskow, P. and J. Tirole (2007), Reliability and Competitive Electricity Markets, RAND Journal of Economics, Vol 38, No 1, 60-84 5.
Ministère de l’Économie et des Finances (2017), Électricité verte : les avantages d'une approche européenne, TRÉSOR-ÉCO n° 197, Paris, France.
Ovaere, M. (2017), Economics of power transmission reliability, Doctoral dissertation, Catholic University of Leuven, Belgium.
Rooijers, F.J., de Buck, A., Croezen, H.J. and B.E. Kampman (2014), Match van vraag en aanbod, Denktank vernieuwing energiemarkt, Bijlage 2, CE Delft, November.
Stede, J. (2016), Demand Response in Germany: technical potential, benefits and regulatory challenges, DIW Berlin, May.