increased b cell proliferation and reduced ig production in … · laurent delpy,x eric pinaud,x...
TRANSCRIPT
of November 1, 2018.This information is current as
Ig Production in DREAM Transgenic MiceIncreased B Cell Proliferation and Reduced
NaranjoC. Oliveros, Laurent Delpy, Eric Pinaud and Jose R. Magali Savignac, Britt Mellström, Anne-Gaëlle Bébin, Juan
http://www.jimmunol.org/content/185/12/7527doi: 10.4049/jimmunol.1000152November 2010;
2010; 185:7527-7536; Prepublished online 8J Immunol
MaterialSupplementary
2.DC1http://www.jimmunol.org/content/suppl/2010/11/08/jimmunol.100015
Referenceshttp://www.jimmunol.org/content/185/12/7527.full#ref-list-1
, 18 of which you can access for free at: cites 38 articlesThis article
average*
4 weeks from acceptance to publicationFast Publication! •
Every submission reviewed by practicing scientistsNo Triage! •
from submission to initial decisionRapid Reviews! 30 days* •
Submit online. ?The JIWhy
Subscriptionhttp://jimmunol.org/subscription
is online at: The Journal of ImmunologyInformation about subscribing to
Permissionshttp://www.aai.org/About/Publications/JI/copyright.htmlSubmit copyright permission requests at:
Email Alertshttp://jimmunol.org/alertsReceive free email-alerts when new articles cite this article. Sign up at:
Print ISSN: 0022-1767 Online ISSN: 1550-6606. All rights reserved.1451 Rockville Pike, Suite 650, Rockville, MD 20852The American Association of Immunologists, Inc.,
is published twice each month byThe Journal of Immunology
by guest on Novem
ber 1, 2018http://w
ww
.jimm
unol.org/D
ownloaded from
by guest on N
ovember 1, 2018
http://ww
w.jim
munol.org/
Dow
nloaded from
The Journal of Immunology
Increased B Cell Proliferation and Reduced Ig Production inDREAM Transgenic Mice
Magali Savignac,*,† Britt Mellstrom,*,‡ Anne-Gaelle Bebin,x Juan C. Oliveros,*
Laurent Delpy,x Eric Pinaud,x and Jose R. Naranjo*,‡
DREAM/KChIP-3 is a calcium-dependent transcriptional repressor highly expressed in immune cells. Transgenic mice expressing
a dominant active DREAMmutant show reduced serum Ig levels. In vitro assays show that reduced Ig secretion is an intrinsic defect
of transgenic B cells that occurs without impairment in plasma cell differentiation, class switch recombination, or Ig transcription.
Surprisingly, transgenic B cells show an accelerated entry in cell division. Transcriptomic analysis of transgenic B cells revealed that
hyperproliferative B cell response could be correlated with a reduced expression of Klf9, a cell-cycle regulator. Pulse-chase experi-
ments demonstrated that the defect in Ig production is associated with reduced translation rather than with increased protein
degradation. Importantly, transgenic B cells showed reduced expression of the Eif4g3 gene, which encodes a protein related to
protein translation. Our results disclose, to our knowledge, a novel function of DREAM in proliferation and Ig synthesis in
B lymphocytes. The Journal of Immunology, 2010, 185: 7527–7536.
Antigen exposure activates a profound structural and func-tional metamorphosis in small resting B lymphocytesleading to proliferation and differentiation into Ab-se-
creting plasma cells. This complex program involves proliferation,generationofmemorycells, isotypeswitching,andaffinitymaturation(1, 2). The proliferative phase encompasses multiple rounds of di-vision and is followed by an extensive differentiation process drivenby specific changes in gene expression (3). During plasma cell dif-ferentiation, B lymphocytes undergo a dramatic architectural trans-formation with expansion of the intracellular membrane network,particularly the rough endoplasmic reticulum (ER), where Igs aresynthesized and assembled into functional Abs. Igs mature throughthe Golgi complex and then travel through the exocytic pathway tobe secreted. Increased demands on the secretory machinery trigger
the unfolded protein response (UPR), a global cellular reaction thatcontrols expression of ER molecular chaperones, protein synthesis
and degradation, cell cycle progression and apoptosis (4).The transcriptional repressor downstream regulatory element
antagonist modulator (DREAM) is a Ca2+-binding protein that
binds specifically to downstream regulatory element (DRE) se-
quences in DNA (5). The level of nuclear Ca2+, the interaction with
other nucleoproteins such as cAMP response element modulator
and CREB, and the PI3K pathway regulate the binding of DREAM
to DRE sites (5–8). Mutation of two key amino acids within any of
the functional EF hands of DREAM results in a protein insensitive
to Ca2+ (EFmDREAM) that remains bound to DNA during Ca2+
stimulation (5). Because DREAM binds to DRE sites as a tetramer,
EFmDREAM is shown to function as a dominant active mutant in
a background of wild-type DREAM in vitro (9) and endogenous
DREAM in vivo (10, 11). Moreover, DREAM can impair the re-
cruitment of CREB-binding protein (CBP) by phospho-CREB and
block CBP-mediated transactivation at cAMP response element
sites in a Ca2+-dependent manner allowing cross talk between
cAMP and Ca2+ signaling pathways in the nucleus (7). Two
leucine-charged residue rich domains mediate protein–protein
interactions of the DREAM protein. The L56V mutation in the
leucine-charged residue rich domain of DREAM, which is re-
sponsible for the DREAM–CREB interaction, results in a mutant
(LmDREAM) that fails to block CBP-mediated transactivation at
cAMP response element sites. Thus, the dominant active double
mutant of DREAM (EFLmDREAM, hereafter called daDREAM)
will specifically block Ca2+-induced de-repression of DREAM
target genes at DRE sites without affecting CREB-mediated tran-
scription (7). DREAM, also known as potassium channel interact-
ing protein (KChIP)-3, or calsenilin, belongs to a group of struc-
turally and functionally related Ca2+-binding proteins (KChIP 1 to
4) that interact with DRE sites (12), Kv4 potassium channels (13),
and presenilins (14) regulating Ca2+-dependent transcription, chan-
nel gating, and Ca2+ release from the ER, respectively. Because
DREAM forms heterotetramers with other KChIP proteins that
bind DNA, daDREAM acts as a cross-dominant active mutant
for the nuclear function of all four KChIP proteins, as previously
shown in neurons and T cells (10, 12).
*Centro Nacional de Biotecnologıa, Consejo Superior de Investigaciones Cientıficas;‡Centro Investigacion Biomedica En Red en Enfermedades NEuroDegenerativas,Madrid, Spain; †Purpan Hospital, INSERM, U563, Toulouse; and xNational Centerfor Scientific Research, University of Limoges UMR 6101, Faculty of Medicine,Limoges, France
Received for publication January 20, 2010. Accepted for publication October 6,2010.
This work was supported by grants from the European Community (NoE/512032),Fundacion La Caixa, Ministerio de Ciencia e Innovacion, and the Center for Bio-medical Research in Neurodegenerative Diseases Network (to J.R.N. and B.M.). M.S.was supported by the Association pour la Recherche sur le Cancer, Marie CurieIndividual Fellowship, and a Ramon y Cajal Senior Scientist contract.
The sequences presented in this article have been submitted to the Gene ExpressionOmnibus database under accession number GSE16874.
Address correspondence and reprint requests to Jose R. Naranjo, Centro Nacional deBiotecnologıa, Consejo Superior de Investigaciones Cientıficas, Madrid, Spain, Dar-win 3, Cantoblanco Campus, 28049 Madrid, Spain. E-mail address: [email protected]
The online version of this article contains supplemental material.
Abbreviations used in this paper: BM, bone marrow; CBP, CREB-binding protein;CSR, class switch recombination; daDREAM, dominant active DREAM; DRE,downstream regulatory element; DREAM, downstream regulatory element antagonistmodulator; Edem1, ER-degradation enhancing a-mannosidase-like protein; Eif4g3,eukaryotic translation initiation factor 4 g, 3; ER, endoplasmic reticulum; ERAD,ER-associated degradation; GLTs, germline transcripts; HPRT, hypoxanthine-gua-nine phosphoribosyltransferase; KChIP, potassium channel interacting protein; KO,knockout; N, nucleus; PI, propidium iodide; Rps9, ribosomal protein S9; UPR, un-folded protein response.
Copyright� 2010 by The American Association of Immunologists, Inc. 0022-1767/10/$16.00
www.jimmunol.org/cgi/doi/10.4049/jimmunol.1000152
by guest on Novem
ber 1, 2018http://w
ww
.jimm
unol.org/D
ownloaded from
DREAM is highly expressed in theCNS, thyroid gland, testis, andthe thymus. Early in vitro studies described specific target genesfor DREAM repression in the brain (5) and in the thyroid gland(15). More recently, using transgenic mice expressing daDREAM(hereafter TgDREAM mice), we have shown reduced proliferationand decreased IL-2, IL-4, and IFN-g production after TCR en-gagement in transgenic T lymphocytes. These effects are purelytranscriptional and involve binding of DREAM to specific DREslocated in the promoters of these cytokines (10).In this study, we show that DREAM is expressed in bone marrow
and mature B cells. Expression of daDREAM in B lymphocytesreduced the levels of the IgM and IgG subclasses in serum ofTgDREAM mice and increased the proliferative response in vitro.Gene expression profiling of transgenic B cells showed repressionof Klf9, a cell-cycle regulator, and Eif4g3, a protein related totranslation initiation. Pulse-chase experiments suggest that a re-duction in protein synthesis rather than increased degradation ac-counts for the deficit in Ig production. Our results reveal a criticalfunction of DREAM- and KChIP-2–regulated genes in Ig subclassproduction and proliferation in B lymphocytes.
Materials and MethodsAnimals
DREAM transgenic mice (line 1 [L1] and line 33 [L33]) were prepared bypronuclear microinjection in the C57BL/6xCBA hybrid background. Bothtransgenic lines carry a single copy of a transgenic cassette containing thedominant activeDREAMmutant, an IRES, and the LacZ reporter gene underthe control of the CaMKIIa promoter. Transgenic lines were maintained asheterozygotes, and age- and sex-matched littermates were used as controls.Expression of the transgene in both lines was found to be ubiquitous in theCNS and the immune system (10). DREAM knockout (KO) mice have beenreported previously (16). The Centro Nacional de Biotecnologıa–ConsejoSuperior de Investigaciones Cientıficas institutional animal care and usecommittee approved animal protocols.
B cell isolation and stimulation
B cells were isolated by negative selection using CD43microbeads (MACS;Miltenyi, Bergisch Gladbach, Germany) according to the manufacturer’sprotocol. The purity of the different subpopulations was above 98% asassayed by flow cytometry. B cells were grown in RPMI with Glutamaxcontaining 10% FCS (Invitrogen, Barcelona, Spain), nonessential aminoacids (0.1 mM), sodium pyruvate (1 mM), penicillin (100 U/ml), strepto-mycin (100 mg/ml), and 50 mM 2-mercaptoethanol and were maintained at37˚C in an atmosphere at 5% CO2. For stimulation, B cells (0.43 106) werecultured in 24-well plates and stimulated with LPS (20 mg/ml; Sigma,St. Louis, MO) and mouse recombinant IL-4 (10 ng/ml; BD Pharmingen,San Diego, CA). After 4 d in culture, IgG1 was measured by flow cytometry.Supernatants for IgG1 and IgE quantification were collected at day 5. ForCFSE labeling, resting B cells were exposed to CFSE for 30 min at 37˚C(2.5 mM; Molecular Probes, Carlsbad, CA) and cultured as described. ForB cell proliferation assays, 0.23 106 B cells were cultured in 96-well plates,and the cultures were pulsed for 16 h with 1 Ci [3H] (40 Ci/nmol; Amer-sham, Barcelona, Spain) before harvesting on glass fiber filters. Incorpo-ration of [3H]thymidine was measured using an automatic counter (Wallac,Waltham, MA). For apoptosis analysis, B cells were stained with propidiumiodide without permeabilization before analysis on an Epics XL cytometer(Coulter, Brea, CA). For cell cycle analysis, B cells were fixed in absoluteethanol precooled to 4˚C. After RNAse treatment, propidium iodide wasadded before analysis on an Epics XL cytometer (Coulter). For electronmicroscopy analysis, B cells were stimulated with LPS plus IL-4 for 3 d andprepared as described (17). The hamster mAb against CD40 (clone HM40-3) was from BD Pharmingen.
Ig ELISA
Rat anti-mouse IgG1 (LO-MG1-13), IgG2a (LO-MG2a-9), IgG2b (LO-MG2b-1), IgG3 (LO-MG3-13), IgM (LO-MM-3), or IgE (LO-ME-3) Absfor coating of plates and rat anti-mouse/HRP (LO-MK-1) as secondarydetection step were from Serotec. For IgE, the secondary detection step wasdone with biotin-conjugated rat anti-mouse IgE mAb (BD Pharmingen) anddetected by streptavidin–HRP conjugate (Amersham).
Flow cytometry analysis
Single-cell populations were prepared from the femurs and spleens, and Fcreceptors were blocked with anti-CD16/CD32. Cells (13 106) were stainedin PBS/1% FCS with the respective Abs for 20 min at 4˚C. MonoclonalAbs FITC-conjugated (B220, CD43, IgM, IgD), PE-conjugated (IgM), orbiotin-conjugated (CD43, IgG1, isotype of IgG1) (Pharmingen, San Diego,CA) were used. Biotin-conjugated monoclonal Abs were detected usingstreptavidin Cy-Chrome (BD Pharmingen). Analyses were performed onan Epics XL cytometer (Coulter).
Qualitative and quantitative real-time RT-PCR
RNA was isolated from B cells using TRIzol (Invitrogen), treated withDNAse (Ambion, Austin, TX), and reverse transcribed using hexamerprimers and MMLV reverse transcriptase. To confirm the absence of ge-nomic DNA, each sample was processed in parallel without reverse tran-scriptase. Semiquantitative RT-PCR assays for preswitched and post-switched germline transcripts were performed as described (18). b-Actinexpression was used as a loading control. Quantitative real-time PCRfor daDREAM, DREAM, KChIPs, and hypoxanthine-guanine phosphor-ibosyltransferase (HPRT) was performed as described (10). Quantificationof Pax5, Bcl6, Xbp-1, Blimp-1, calnexin, calreticulin, BiP, CHOP, Klf9,Edem1, Derlin3, Eif4g3, and Rps9 was done using specific primers andTaqMan MGB probes (Applied Biosystems, Austin, TX). The results werenormalized as indicated by parallel amplification of HPRT. Primers forquantitative RT-PCR assays preswitched and postswitched g1 and εgermline transcripts are reported in Supplemental Tables I and II. Speci-ficity of the g1 and ε primers was determined using negative controls and bythe analysis of dissociation curves. Serially diluted cDNA samples wereused to estimate the efficiency (Ef) of each PCR, which was 1.99 in allcases. Calculation of fold differences was performed as described in Ref. 19and was based on the equation (1 + EfHPRT)
Ct HPRT x 2 Ct HPRT cal (1 + Ef g1or ε-Ct)Ct (g1 or ε) cal 2 Ct (g1 or ε) x, where Ct is the number of cycles at whichthe threshold of fluorescence is reached, x is a given sample, and cal is thecalibrator used to normalize all results (resting B cells).
Western blots
Purified B cells were incubated in lysis buffer (50 mM Tris-HCl, pH 7.5,150 mM NaCl, 1% Nonidet P-40, protease inhibitor mixture [RocheApplied Science, Indianapolis, IN]) for 30 min on ice. Lysates were clearedby centrifugation. Abs against calreticulin and calnexin were from Stress-gen Bioreagents, and biotin anti-mouse IgG1 (clone A85-1) was from BDPharmingen. IgG1 was detected by streptavidin–HRP conjugate (Amer-sham). Cytosolic and nuclear extracts were prepared from purified B cellsusing the NE-PER Extraction Reagents (Pierce, Madrid, Spain). DREAM-specific bands were detected by Western blot using a rabbit polyclonal Ab(Ab731) prepared against aa 22–42 in the DREAM protein. This Ab rec-ognizes endogenous and mutant DREAM and does not cross-react withother members of the KChIP family. b-Actin (clone AC-15; Sigma) wasused as a loading control. Blots were developed by chemiluminescence(ECL Advance, GE Healthcare; or SuperSignal West Dura, Pierce).
Pulse-chase experiments
B cells were stimulated with LPS plus IL-4 for 3 d and then starved for 1 h at37˚C in methionine/cysteine-free RPMI 1640 medium (Sigma) supple-mented with 2 mM glutamine, 5% dialyzed FCS, 1 mM sodium pyruvate,penicillin (100 U/ml), and streptomycin (100 mg/ml). Cells were labeledwith 1 mCi [35S]methionine/cysteine (PerkinElmer, Waltham, MA) for 60min at 37˚C. Cells were chased in culture medium supplemented withexcess unlabeled cysteine/methionine for 0–4 h, washed in ice-cold PBS,and lysed. Supernatants were collected after centrifugation for 10 minat 13,000 rpm. IgG proteins, mostly IgG1 in B cells after LPS plus IL-4stimulation, were captured with protein G-Sepharose (Amersham). Theproteosome inhibitor MG132 (50 mM) was added to one sample at time 0 asinternal control. Labeled proteins were resolved by SDS-PAGE and visu-alized by autoradiography.
RNA extraction and microarray hybridization
RNA from naive or 2-d LPS plus IL-4 stimulated B cells was prepared usingTRIzol (Invitrogen) and the RNAeasy Mini Kit (Qiagen, Madrid, Spain).RNAwas quantified, and the quality was assessed with a 2100 Bioanalyzer(Agilent Technologies). cDNAwas synthesized from 4 mg total RNA usingone-cycle target labeling and control reagents (Affymetrix, Santa Clara,CA) to produce biotin-labeled cRNA. The cRNA preparation (15 mg) wasfragmented at 94˚C for 35 min into 35–200 bases in length. Labeled cRNAswere hybridized to Affymetrix chips (GeneChip Mouse Genome 430 2.0Array). Each sample was added to a hybridization solution containing 100
7528 DREAM REGULATES B CELL FUNCTIONS
by guest on Novem
ber 1, 2018http://w
ww
.jimm
unol.org/D
ownloaded from
mM 2-(N-morpholino) ethanesulfonic acid, 1 M Na+, and 20 mM EDTA inthe presence of 0.01% Tween 20 to a final cRNA concentration of 0.05 mg/ml. Hybridization was performed for 16 h at 45˚C. Each microarray waswashed and stained with streptavidin–PE in a Fluidics station 450 (Affy-metrix) and scanned at 1.56-mm resolution in a GeneChip Scanner 3000 7GSystem (Affymetrix).
Microarray data analysis
Three biological replicates were independently hybridized for each tran-scriptomic comparison. GeneChip intensities were background-corrected,normalized, and summarized by the robust multichip average method(20) using the “Affy” package (21) from Bioconductor (http://www.bioconductor.org). For each comparison, moderated t test was appliedto identify differentially expressed genes as implemented in the “Limma”package (22) from Bioconductor. Raw p values were adjusted for multiplehypothesis testing using the false discovery rate method (23). Genes withfalse discovery rate,0.1 and fold changes.1.5 or,21.5 at both 0 and 2 dwere included in the list of induced or repressed candidates, respectively.FIESTA (http://bioinfogp.cnb.csic.es/tools/FIESTA) viewer was used tofacilitate the application of these numerical filters and the selection ofcandidate genes in each comparison (24). For the biological classificationof candidate genes, Gene Ontology terms included in the “generic GO slimset” (S. Mundodi and A. Ireland; http://www.geneontology.org/GO.slims.shtml) were used to group candidate genes into a reduced number of bi-ological categories. Terms from “Molecular function” name space weretaken into account. The Gene Ontology terms associated with the geneswere obtained from the original Affymetrix annotation files available athttp://www.affymetrix.com.
Statistical analysis
Student unpaired two-tailed t test was used for statistical analyses. Thep values #0.05 were considered significant. Asterisks represent statisticalsignificance versus the appropriate control in each case: *p , 0.05; **p ,0.01; ***p , 0.001.
ResultsDevelopment of B lymphocytes is normal in TgDREAM mice
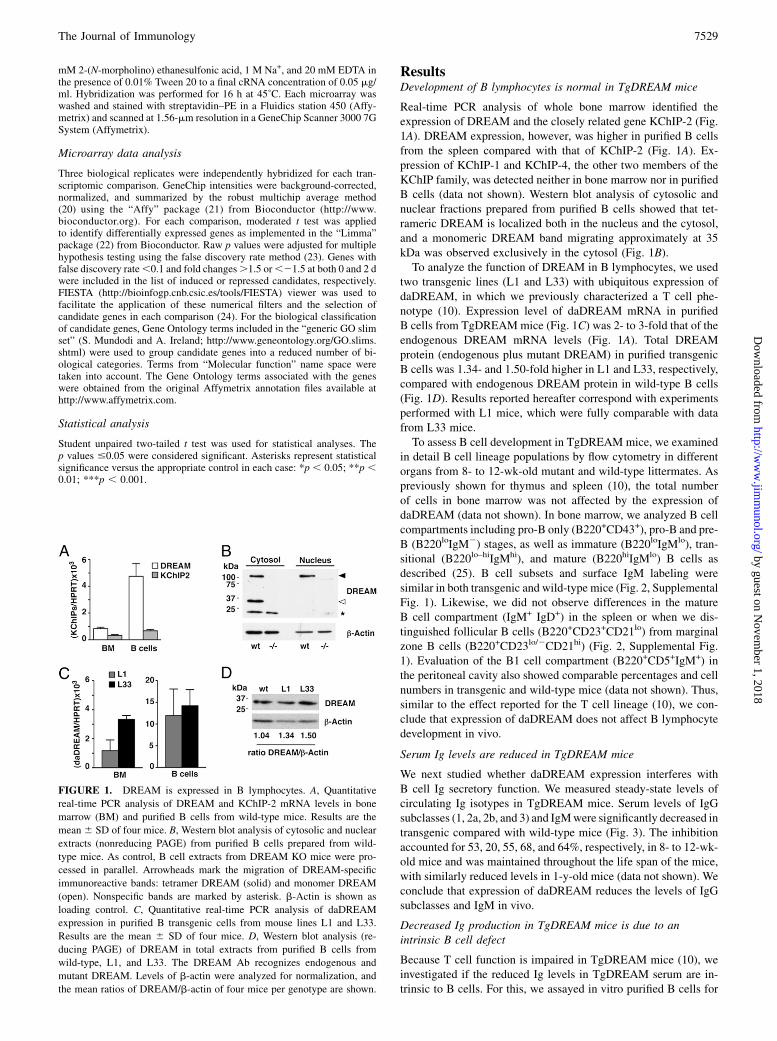
Real-time PCR analysis of whole bone marrow identified theexpression of DREAM and the closely related gene KChIP-2 (Fig.1A). DREAM expression, however, was higher in purified B cellsfrom the spleen compared with that of KChIP-2 (Fig. 1A). Ex-pression of KChIP-1 and KChIP-4, the other two members of theKChIP family, was detected neither in bone marrow nor in purifiedB cells (data not shown). Western blot analysis of cytosolic andnuclear fractions prepared from purified B cells showed that tet-rameric DREAM is localized both in the nucleus and the cytosol,and a monomeric DREAM band migrating approximately at 35kDa was observed exclusively in the cytosol (Fig. 1B).To analyze the function of DREAM in B lymphocytes, we used
two transgenic lines (L1 and L33) with ubiquitous expression ofdaDREAM, in which we previously characterized a T cell phe-notype (10). Expression level of daDREAM mRNA in purifiedB cells from TgDREAMmice (Fig. 1C) was 2- to 3-fold that of theendogenous DREAM mRNA levels (Fig. 1A). Total DREAMprotein (endogenous plus mutant DREAM) in purified transgenicB cells was 1.34- and 1.50-fold higher in L1 and L33, respectively,compared with endogenous DREAM protein in wild-type B cells(Fig. 1D). Results reported hereafter correspond with experimentsperformed with L1 mice, which were fully comparable with datafrom L33 mice.To assess B cell development in TgDREAM mice, we examined
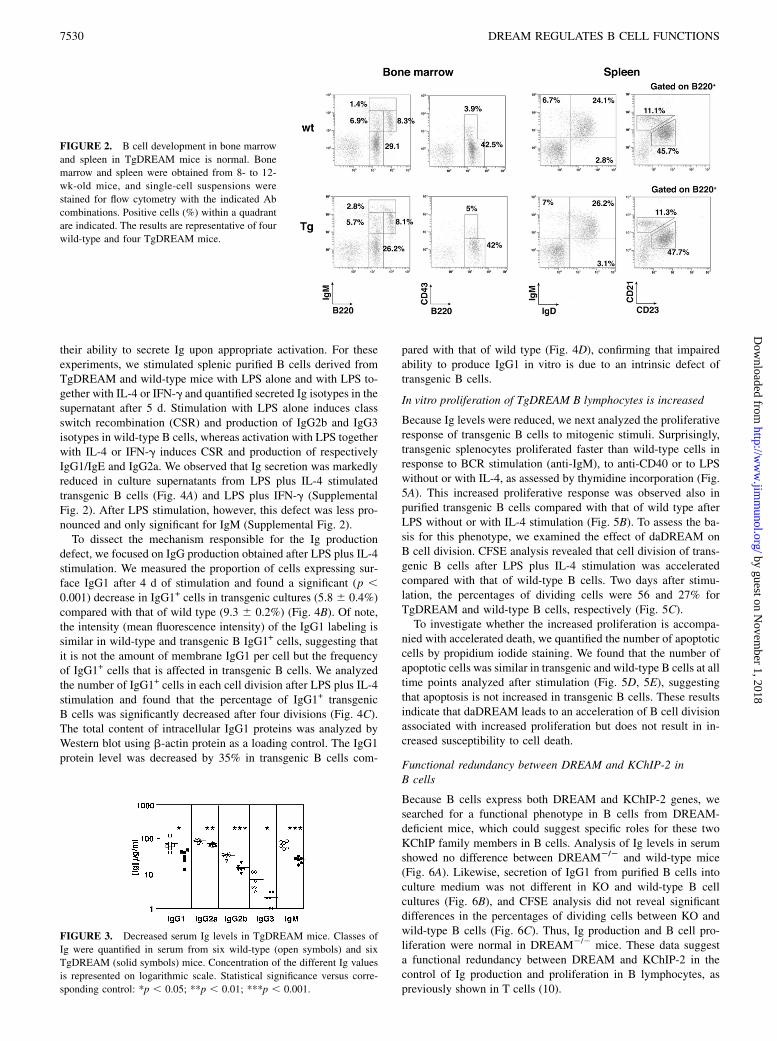
in detail B cell lineage populations by flow cytometry in differentorgans from 8- to 12-wk-old mutant and wild-type littermates. Aspreviously shown for thymus and spleen (10), the total numberof cells in bone marrow was not affected by the expression ofdaDREAM (data not shown). In bone marrow, we analyzed B cellcompartments including pro-B only (B220+CD43+), pro-B and pre-B (B220loIgM2) stages, as well as immature (B220loIgMlo), tran-sitional (B220lo–hiIgMhi), and mature (B220hiIgMlo) B cells asdescribed (25). B cell subsets and surface IgM labeling weresimilar in both transgenic and wild-type mice (Fig. 2, SupplementalFig. 1). Likewise, we did not observe differences in the matureB cell compartment (IgM+ IgD+) in the spleen or when we dis-tinguished follicular B cells (B220+CD23+CD21lo) from marginalzone B cells (B220+CD23lo/2CD21hi) (Fig. 2, Supplemental Fig.1). Evaluation of the B1 cell compartment (B220+CD5+IgM+) inthe peritoneal cavity also showed comparable percentages and cellnumbers in transgenic and wild-type mice (data not shown). Thus,similar to the effect reported for the T cell lineage (10), we con-clude that expression of daDREAM does not affect B lymphocytedevelopment in vivo.
Serum Ig levels are reduced in TgDREAM mice
We next studied whether daDREAM expression interferes withB cell Ig secretory function. We measured steady-state levels ofcirculating Ig isotypes in TgDREAM mice. Serum levels of IgGsubclasses (1, 2a, 2b, and 3) and IgMwere significantly decreased intransgenic compared with wild-type mice (Fig. 3). The inhibitionaccounted for 53, 20, 55, 68, and 64%, respectively, in 8- to 12-wk-old mice and was maintained throughout the life span of the mice,with similarly reduced levels in 1-y-old mice (data not shown). Weconclude that expression of daDREAM reduces the levels of IgGsubclasses and IgM in vivo.
Decreased Ig production in TgDREAM mice is due to anintrinsic B cell defect
Because T cell function is impaired in TgDREAM mice (10), weinvestigated if the reduced Ig levels in TgDREAM serum are in-trinsic to B cells. For this, we assayed in vitro purified B cells for
FIGURE 1. DREAM is expressed in B lymphocytes. A, Quantitative
real-time PCR analysis of DREAM and KChIP-2 mRNA levels in bone
marrow (BM) and purified B cells from wild-type mice. Results are the
mean 6 SD of four mice. B, Western blot analysis of cytosolic and nuclear
extracts (nonreducing PAGE) from purified B cells prepared from wild-
type mice. As control, B cell extracts from DREAM KO mice were pro-
cessed in parallel. Arrowheads mark the migration of DREAM-specific
immunoreactive bands: tetramer DREAM (solid) and monomer DREAM
(open). Nonspecific bands are marked by asterisk. b-Actin is shown as
loading control. C, Quantitative real-time PCR analysis of daDREAM
expression in purified B transgenic cells from mouse lines L1 and L33.
Results are the mean 6 SD of four mice. D, Western blot analysis (re-
ducing PAGE) of DREAM in total extracts from purified B cells from
wild-type, L1, and L33. The DREAM Ab recognizes endogenous and
mutant DREAM. Levels of b-actin were analyzed for normalization, and
the mean ratios of DREAM/b-actin of four mice per genotype are shown.
The Journal of Immunology 7529
by guest on Novem
ber 1, 2018http://w
ww
.jimm
unol.org/D
ownloaded from
their ability to secrete Ig upon appropriate activation. For theseexperiments, we stimulated splenic purified B cells derived fromTgDREAM and wild-type mice with LPS alone and with LPS to-gether with IL-4 or IFN-g and quantified secreted Ig isotypes in thesupernatant after 5 d. Stimulation with LPS alone induces classswitch recombination (CSR) and production of IgG2b and IgG3isotypes in wild-type B cells, whereas activation with LPS togetherwith IL-4 or IFN-g induces CSR and production of respectivelyIgG1/IgE and IgG2a. We observed that Ig secretion was markedlyreduced in culture supernatants from LPS plus IL-4 stimulatedtransgenic B cells (Fig. 4A) and LPS plus IFN-g (SupplementalFig. 2). After LPS stimulation, however, this defect was less pro-nounced and only significant for IgM (Supplemental Fig. 2).To dissect the mechanism responsible for the Ig production
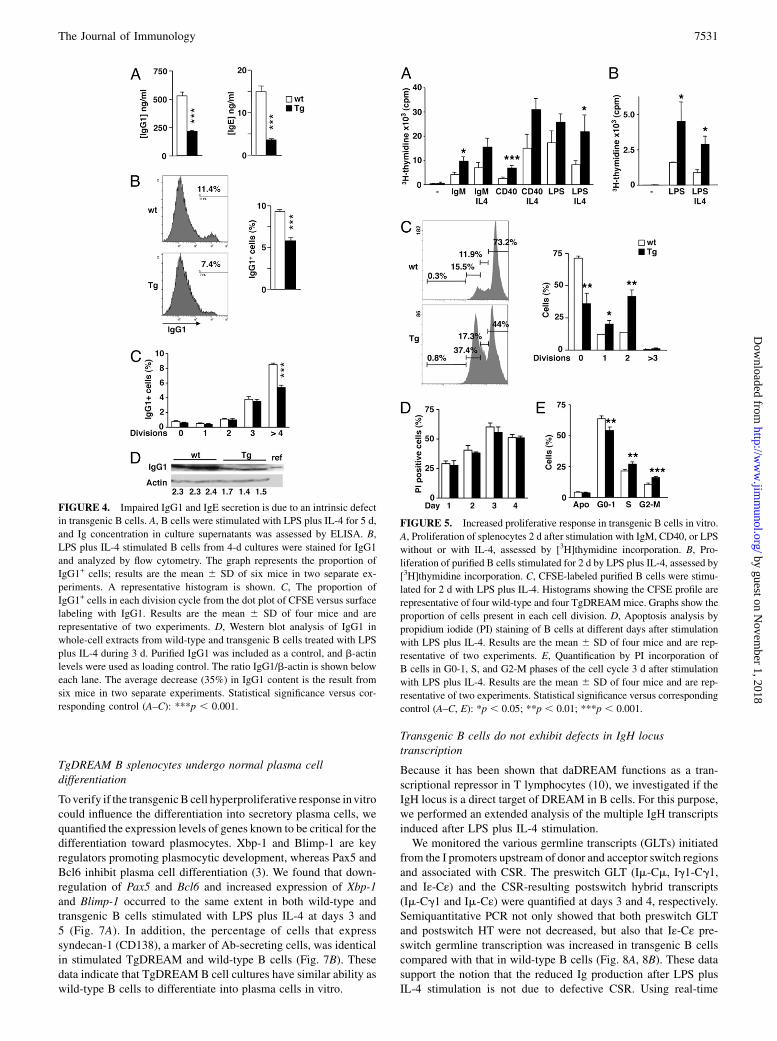
defect, we focused on IgG production obtained after LPS plus IL-4stimulation. We measured the proportion of cells expressing sur-face IgG1 after 4 d of stimulation and found a significant (p ,0.001) decrease in IgG1+ cells in transgenic cultures (5.8 6 0.4%)compared with that of wild type (9.3 6 0.2%) (Fig. 4B). Of note,the intensity (mean fluorescence intensity) of the IgG1 labeling issimilar in wild-type and transgenic B IgG1+ cells, suggesting thatit is not the amount of membrane IgG1 per cell but the frequencyof IgG1+ cells that is affected in transgenic B cells. We analyzedthe number of IgG1+ cells in each cell division after LPS plus IL-4stimulation and found that the percentage of IgG1+ transgenicB cells was significantly decreased after four divisions (Fig. 4C).The total content of intracellular IgG1 proteins was analyzed byWestern blot using b-actin protein as a loading control. The IgG1protein level was decreased by 35% in transgenic B cells com-
pared with that of wild type (Fig. 4D), confirming that impairedability to produce IgG1 in vitro is due to an intrinsic defect oftransgenic B cells.
In vitro proliferation of TgDREAM B lymphocytes is increased
Because Ig levels were reduced, we next analyzed the proliferativeresponse of transgenic B cells to mitogenic stimuli. Surprisingly,transgenic splenocytes proliferated faster than wild-type cells inresponse to BCR stimulation (anti-IgM), to anti-CD40 or to LPSwithout or with IL-4, as assessed by thymidine incorporation (Fig.5A). This increased proliferative response was observed also inpurified transgenic B cells compared with that of wild type afterLPS without or with IL-4 stimulation (Fig. 5B). To assess the ba-sis for this phenotype, we examined the effect of daDREAM onB cell division. CFSE analysis revealed that cell division of trans-genic B cells after LPS plus IL-4 stimulation was acceleratedcompared with that of wild-type B cells. Two days after stimu-lation, the percentages of dividing cells were 56 and 27% forTgDREAM and wild-type B cells, respectively (Fig. 5C).To investigate whether the increased proliferation is accompa-
nied with accelerated death, we quantified the number of apoptoticcells by propidium iodide staining. We found that the number ofapoptotic cells was similar in transgenic and wild-type B cells at alltime points analyzed after stimulation (Fig. 5D, 5E), suggestingthat apoptosis is not increased in transgenic B cells. These resultsindicate that daDREAM leads to an acceleration of B cell divisionassociated with increased proliferation but does not result in in-creased susceptibility to cell death.
Functional redundancy between DREAM and KChIP-2 inB cells
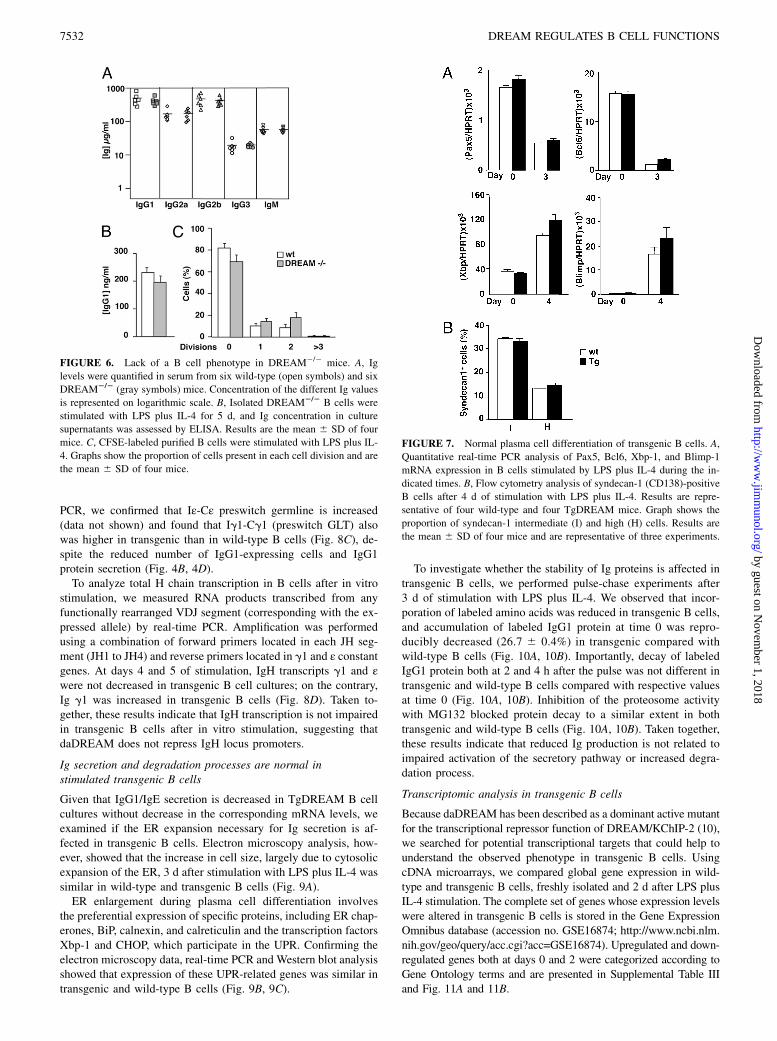
Because B cells express both DREAM and KChIP-2 genes, wesearched for a functional phenotype in B cells from DREAM-deficient mice, which could suggest specific roles for these twoKChIP family members in B cells. Analysis of Ig levels in serumshowed no difference between DREAM2/2 and wild-type mice(Fig. 6A). Likewise, secretion of IgG1 from purified B cells intoculture medium was not different in KO and wild-type B cellcultures (Fig. 6B), and CFSE analysis did not reveal significantdifferences in the percentages of dividing cells between KO andwild-type B cells (Fig. 6C). Thus, Ig production and B cell pro-liferation were normal in DREAM2/2 mice. These data suggesta functional redundancy between DREAM and KChIP-2 in thecontrol of Ig production and proliferation in B lymphocytes, aspreviously shown in T cells (10).
FIGURE 2. B cell development in bone marrow
and spleen in TgDREAM mice is normal. Bone
marrow and spleen were obtained from 8- to 12-
wk-old mice, and single-cell suspensions were
stained for flow cytometry with the indicated Ab
combinations. Positive cells (%) within a quadrant
are indicated. The results are representative of four
wild-type and four TgDREAM mice.
FIGURE 3. Decreased serum Ig levels in TgDREAM mice. Classes of
Ig were quantified in serum from six wild-type (open symbols) and six
TgDREAM (solid symbols) mice. Concentration of the different Ig values
is represented on logarithmic scale. Statistical significance versus corre-
sponding control: *p , 0.05; **p , 0.01; ***p , 0.001.
7530 DREAM REGULATES B CELL FUNCTIONS
by guest on Novem
ber 1, 2018http://w
ww
.jimm
unol.org/D
ownloaded from
TgDREAM B splenocytes undergo normal plasma celldifferentiation
Toverify if the transgenicB cell hyperproliferative response invitrocould influence the differentiation into secretory plasma cells, wequantified the expression levels of genes known to be critical for thedifferentiation toward plasmocytes. Xbp-1 and Blimp-1 are keyregulators promoting plasmocytic development, whereas Pax5 andBcl6 inhibit plasma cell differentiation (3). We found that down-regulation of Pax5 and Bcl6 and increased expression of Xbp-1and Blimp-1 occurred to the same extent in both wild-type andtransgenic B cells stimulated with LPS plus IL-4 at days 3 and5 (Fig. 7A). In addition, the percentage of cells that expresssyndecan-1 (CD138), a marker of Ab-secreting cells, was identicalin stimulated TgDREAM and wild-type B cells (Fig. 7B). Thesedata indicate that TgDREAM B cell cultures have similar ability aswild-type B cells to differentiate into plasma cells in vitro.
Transgenic B cells do not exhibit defects in IgH locustranscription
Because it has been shown that daDREAM functions as a tran-scriptional repressor in T lymphocytes (10), we investigated if theIgH locus is a direct target of DREAM in B cells. For this purpose,we performed an extended analysis of the multiple IgH transcriptsinduced after LPS plus IL-4 stimulation.We monitored the various germline transcripts (GLTs) initiated
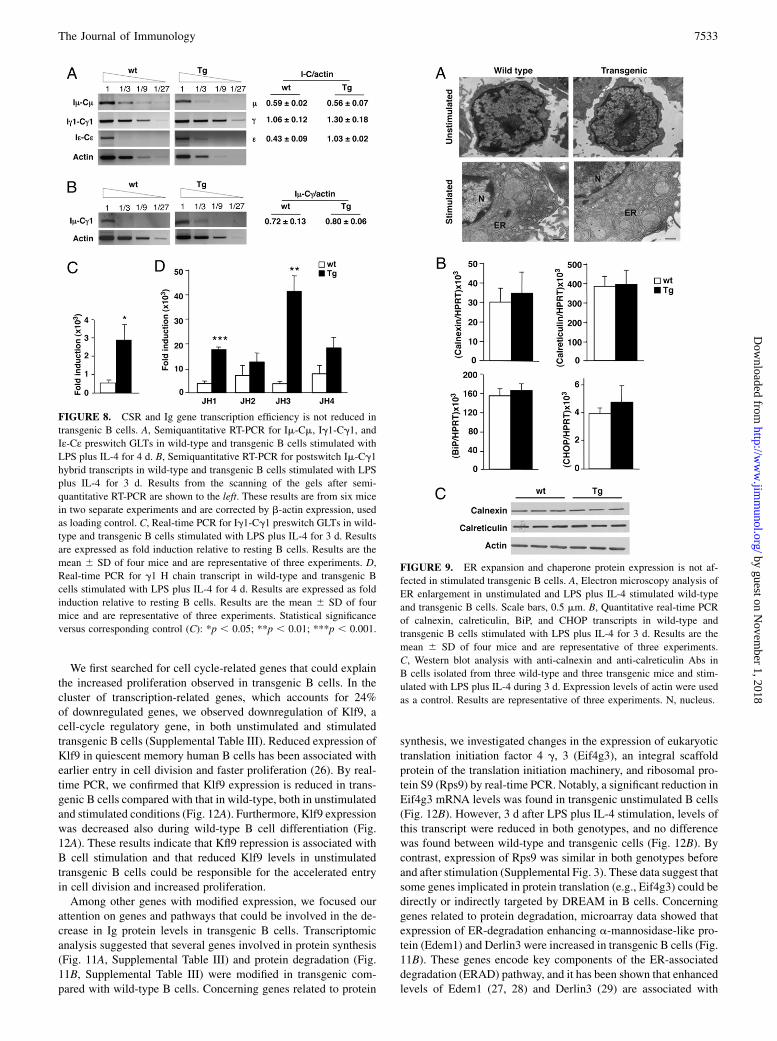
from the I promoters upstream of donor and acceptor switch regionsand associated with CSR. The preswitch GLT (Im-Cm, Ig1-Cg1,and Iε-Cε) and the CSR-resulting postswitch hybrid transcripts(Im-Cg1 and Im-Cε) were quantified at days 3 and 4, respectively.Semiquantitative PCR not only showed that both preswitch GLTand postswitch HT were not decreased, but also that Iε-Cε pre-switch germline transcription was increased in transgenic B cellscompared with that in wild-type B cells (Fig. 8A, 8B). These datasupport the notion that the reduced Ig production after LPS plusIL-4 stimulation is not due to defective CSR. Using real-time
FIGURE 5. Increased proliferative response in transgenic B cells in vitro.
A, Proliferation of splenocytes 2 d after stimulation with IgM, CD40, or LPS
without or with IL-4, assessed by [3H]thymidine incorporation. B, Pro-
liferation of purified B cells stimulated for 2 d by LPS plus IL-4, assessed by
[3H]thymidine incorporation. C, CFSE-labeled purified B cells were stimu-
lated for 2 d with LPS plus IL-4. Histograms showing the CFSE profile are
representative of four wild-type and four TgDREAMmice. Graphs show the
proportion of cells present in each cell division. D, Apoptosis analysis by
propidium iodide (PI) staining of B cells at different days after stimulation
with LPS plus IL-4. Results are the mean 6 SD of four mice and are rep-
resentative of two experiments. E, Quantification by PI incorporation of
B cells in G0-1, S, and G2-M phases of the cell cycle 3 d after stimulation
with LPS plus IL-4. Results are the mean 6 SD of four mice and are rep-
resentative of two experiments. Statistical significance versus corresponding
control (A–C, E): *p , 0.05; **p , 0.01; ***p , 0.001.
FIGURE 4. Impaired IgG1 and IgE secretion is due to an intrinsic defect
in transgenic B cells. A, B cells were stimulated with LPS plus IL-4 for 5 d,
and Ig concentration in culture supernatants was assessed by ELISA. B,
LPS plus IL-4 stimulated B cells from 4-d cultures were stained for IgG1
and analyzed by flow cytometry. The graph represents the proportion of
IgG1+ cells; results are the mean 6 SD of six mice in two separate ex-
periments. A representative histogram is shown. C, The proportion of
IgG1+ cells in each division cycle from the dot plot of CFSE versus surface
labeling with IgG1. Results are the mean 6 SD of four mice and are
representative of two experiments. D, Western blot analysis of IgG1 in
whole-cell extracts from wild-type and transgenic B cells treated with LPS
plus IL-4 during 3 d. Purified IgG1 was included as a control, and b-actin
levels were used as loading control. The ratio IgG1/b-actin is shown below
each lane. The average decrease (35%) in IgG1 content is the result from
six mice in two separate experiments. Statistical significance versus cor-
responding control (A–C): ***p , 0.001.
The Journal of Immunology 7531
by guest on Novem
ber 1, 2018http://w
ww
.jimm
unol.org/D
ownloaded from
PCR, we confirmed that Iε-Cε preswitch germline is increased(data not shown) and found that Ig1-Cg1 (preswitch GLT) alsowas higher in transgenic than in wild-type B cells (Fig. 8C), de-spite the reduced number of IgG1-expressing cells and IgG1protein secretion (Fig. 4B, 4D).To analyze total H chain transcription in B cells after in vitro
stimulation, we measured RNA products transcribed from anyfunctionally rearranged VDJ segment (corresponding with the ex-pressed allele) by real-time PCR. Amplification was performedusing a combination of forward primers located in each JH seg-ment (JH1 to JH4) and reverse primers located in g1 and ε constantgenes. At days 4 and 5 of stimulation, IgH transcripts g1 and εwere not decreased in transgenic B cell cultures; on the contrary,Ig g1 was increased in transgenic B cells (Fig. 8D). Taken to-gether, these results indicate that IgH transcription is not impairedin transgenic B cells after in vitro stimulation, suggesting thatdaDREAM does not repress IgH locus promoters.
Ig secretion and degradation processes are normal instimulated transgenic B cells
Given that IgG1/IgE secretion is decreased in TgDREAM B cellcultures without decrease in the corresponding mRNA levels, weexamined if the ER expansion necessary for Ig secretion is af-fected in transgenic B cells. Electron microscopy analysis, how-ever, showed that the increase in cell size, largely due to cytosolicexpansion of the ER, 3 d after stimulation with LPS plus IL-4 wassimilar in wild-type and transgenic B cells (Fig. 9A).ER enlargement during plasma cell differentiation involves
the preferential expression of specific proteins, including ER chap-erones, BiP, calnexin, and calreticulin and the transcription factorsXbp-1 and CHOP, which participate in the UPR. Confirming theelectron microscopy data, real-time PCR and Western blot analysisshowed that expression of these UPR-related genes was similar intransgenic and wild-type B cells (Fig. 9B, 9C).
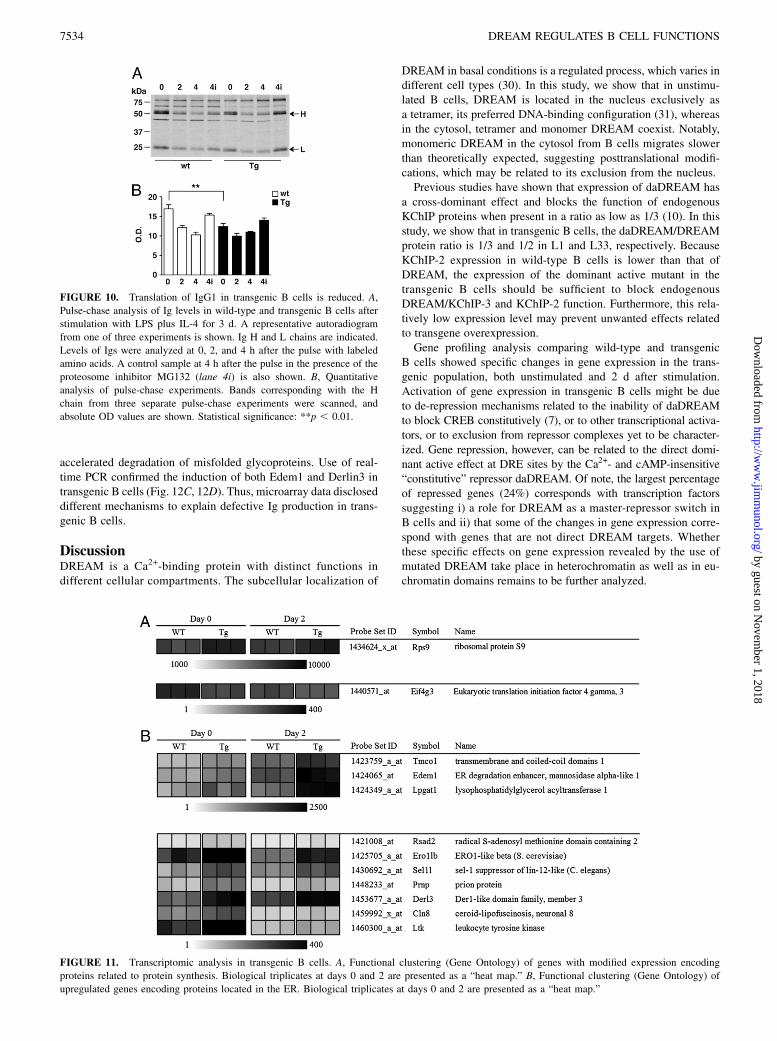
To investigate whether the stability of Ig proteins is affected intransgenic B cells, we performed pulse-chase experiments after3 d of stimulation with LPS plus IL-4. We observed that incor-poration of labeled amino acids was reduced in transgenic B cells,and accumulation of labeled IgG1 protein at time 0 was repro-ducibly decreased (26.7 6 0.4%) in transgenic compared withwild-type B cells (Fig. 10A, 10B). Importantly, decay of labeledIgG1 protein both at 2 and 4 h after the pulse was not different intransgenic and wild-type B cells compared with respective valuesat time 0 (Fig. 10A, 10B). Inhibition of the proteosome activitywith MG132 blocked protein decay to a similar extent in bothtransgenic and wild-type B cells (Fig. 10A, 10B). Taken together,these results indicate that reduced Ig production is not related toimpaired activation of the secretory pathway or increased degra-dation process.
Transcriptomic analysis in transgenic B cells
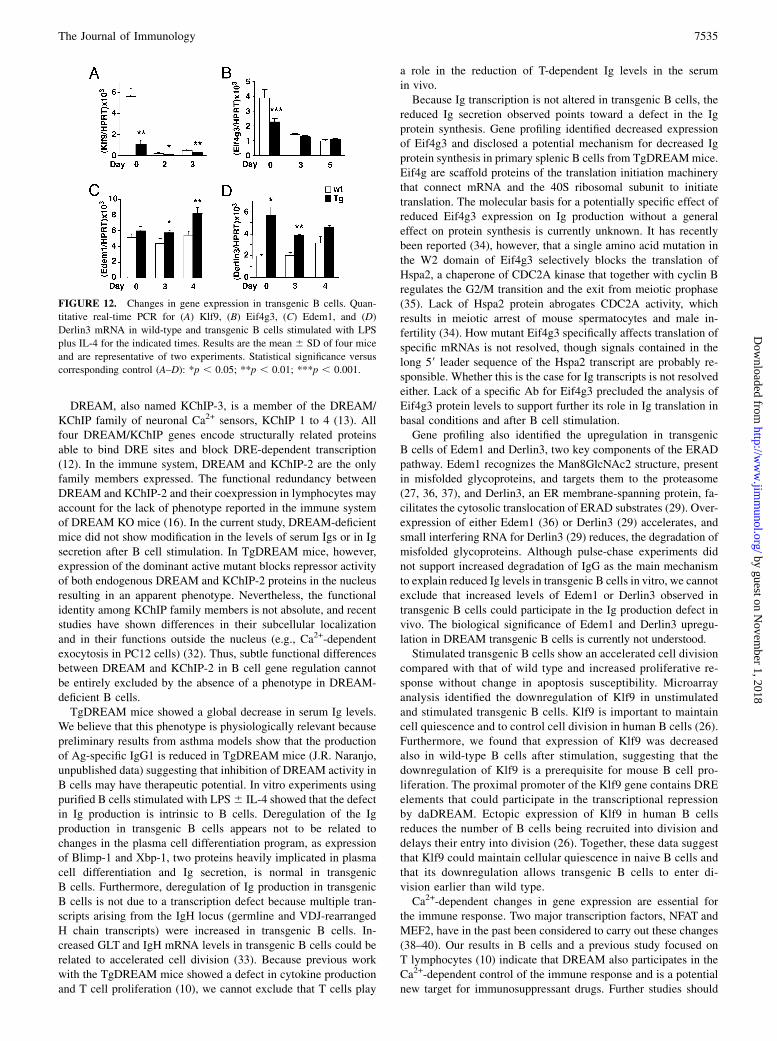
Because daDREAM has been described as a dominant active mutantfor the transcriptional repressor function of DREAM/KChIP-2 (10),we searched for potential transcriptional targets that could help tounderstand the observed phenotype in transgenic B cells. UsingcDNA microarrays, we compared global gene expression in wild-type and transgenic B cells, freshly isolated and 2 d after LPS plusIL-4 stimulation. The complete set of genes whose expression levelswere altered in transgenic B cells is stored in the Gene ExpressionOmnibus database (accession no. GSE16874; http://www.ncbi.nlm.nih.gov/geo/query/acc.cgi?acc=GSE16874). Upregulated and down-regulated genes both at days 0 and 2 were categorized according toGene Ontology terms and are presented in Supplemental Table IIIand Fig. 11A and 11B.
FIGURE 6. Lack of a B cell phenotype in DREAM2/2 mice. A, Ig
levels were quantified in serum from six wild-type (open symbols) and six
DREAM2/2 (gray symbols) mice. Concentration of the different Ig values
is represented on logarithmic scale. B, Isolated DREAM2/2 B cells were
stimulated with LPS plus IL-4 for 5 d, and Ig concentration in culture
supernatants was assessed by ELISA. Results are the mean 6 SD of four
mice. C, CFSE-labeled purified B cells were stimulated with LPS plus IL-
4. Graphs show the proportion of cells present in each cell division and are
the mean 6 SD of four mice.
FIGURE 7. Normal plasma cell differentiation of transgenic B cells. A,
Quantitative real-time PCR analysis of Pax5, Bcl6, Xbp-1, and Blimp-1
mRNA expression in B cells stimulated by LPS plus IL-4 during the in-
dicated times. B, Flow cytometry analysis of syndecan-1 (CD138)-positive
B cells after 4 d of stimulation with LPS plus IL-4. Results are repre-
sentative of four wild-type and four TgDREAM mice. Graph shows the
proportion of syndecan-1 intermediate (I) and high (H) cells. Results are
the mean 6 SD of four mice and are representative of three experiments.
7532 DREAM REGULATES B CELL FUNCTIONS
by guest on Novem
ber 1, 2018http://w
ww
.jimm
unol.org/D
ownloaded from
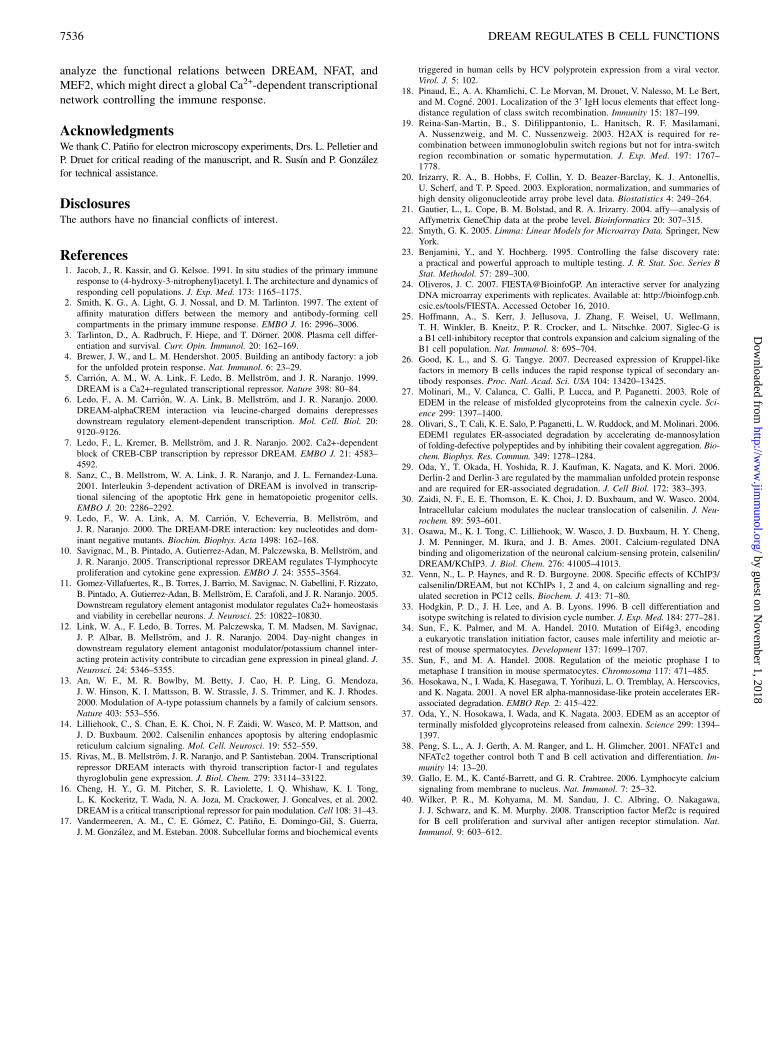
We first searched for cell cycle-related genes that could explainthe increased proliferation observed in transgenic B cells. In thecluster of transcription-related genes, which accounts for 24%of downregulated genes, we observed downregulation of Klf9, acell-cycle regulatory gene, in both unstimulated and stimulatedtransgenic B cells (Supplemental Table III). Reduced expression ofKlf9 in quiescent memory human B cells has been associated withearlier entry in cell division and faster proliferation (26). By real-time PCR, we confirmed that Klf9 expression is reduced in trans-genic B cells compared with that in wild-type, both in unstimulatedand stimulated conditions (Fig. 12A). Furthermore, Klf9 expressionwas decreased also during wild-type B cell differentiation (Fig.12A). These results indicate that Kfl9 repression is associated withB cell stimulation and that reduced Klf9 levels in unstimulatedtransgenic B cells could be responsible for the accelerated entryin cell division and increased proliferation.Among other genes with modified expression, we focused our
attention on genes and pathways that could be involved in the de-crease in Ig protein levels in transgenic B cells. Transcriptomicanalysis suggested that several genes involved in protein synthesis(Fig. 11A, Supplemental Table III) and protein degradation (Fig.11B, Supplemental Table III) were modified in transgenic com-pared with wild-type B cells. Concerning genes related to protein
synthesis, we investigated changes in the expression of eukaryotictranslation initiation factor 4 g, 3 (Eif4g3), an integral scaffoldprotein of the translation initiation machinery, and ribosomal pro-tein S9 (Rps9) by real-time PCR. Notably, a significant reduction inEif4g3 mRNA levels was found in transgenic unstimulated B cells(Fig. 12B). However, 3 d after LPS plus IL-4 stimulation, levels ofthis transcript were reduced in both genotypes, and no differencewas found between wild-type and transgenic cells (Fig. 12B). Bycontrast, expression of Rps9 was similar in both genotypes beforeand after stimulation (Supplemental Fig. 3). These data suggest thatsome genes implicated in protein translation (e.g., Eif4g3) could bedirectly or indirectly targeted by DREAM in B cells. Concerninggenes related to protein degradation, microarray data showed thatexpression of ER-degradation enhancing a-mannosidase-like pro-tein (Edem1) and Derlin3 were increased in transgenic B cells (Fig.11B). These genes encode key components of the ER-associateddegradation (ERAD) pathway, and it has been shown that enhancedlevels of Edem1 (27, 28) and Derlin3 (29) are associated with
FIGURE 8. CSR and Ig gene transcription efficiency is not reduced in
transgenic B cells. A, Semiquantitative RT-PCR for Im-Cm, Ig1-Cg1, and
Iε-Cε preswitch GLTs in wild-type and transgenic B cells stimulated with
LPS plus IL-4 for 4 d. B, Semiquantitative RT-PCR for postswitch Im-Cg1
hybrid transcripts in wild-type and transgenic B cells stimulated with LPS
plus IL-4 for 3 d. Results from the scanning of the gels after semi-
quantitative RT-PCR are shown to the left. These results are from six mice
in two separate experiments and are corrected by b-actin expression, used
as loading control. C, Real-time PCR for Ig1-Cg1 preswitch GLTs in wild-
type and transgenic B cells stimulated with LPS plus IL-4 for 3 d. Results
are expressed as fold induction relative to resting B cells. Results are the
mean 6 SD of four mice and are representative of three experiments. D,
Real-time PCR for g1 H chain transcript in wild-type and transgenic B
cells stimulated with LPS plus IL-4 for 4 d. Results are expressed as fold
induction relative to resting B cells. Results are the mean 6 SD of four
mice and are representative of three experiments. Statistical significance
versus corresponding control (C): *p , 0.05; **p , 0.01; ***p , 0.001.
FIGURE 9. ER expansion and chaperone protein expression is not af-
fected in stimulated transgenic B cells. A, Electron microscopy analysis of
ER enlargement in unstimulated and LPS plus IL-4 stimulated wild-type
and transgenic B cells. Scale bars, 0.5 mm. B, Quantitative real-time PCR
of calnexin, calreticulin, BiP, and CHOP transcripts in wild-type and
transgenic B cells stimulated with LPS plus IL-4 for 3 d. Results are the
mean 6 SD of four mice and are representative of three experiments.
C, Western blot analysis with anti-calnexin and anti-calreticulin Abs in
B cells isolated from three wild-type and three transgenic mice and stim-
ulated with LPS plus IL-4 during 3 d. Expression levels of actin were used
as a control. Results are representative of three experiments. N, nucleus.
The Journal of Immunology 7533
by guest on Novem
ber 1, 2018http://w
ww
.jimm
unol.org/D
ownloaded from
accelerated degradation of misfolded glycoproteins. Use of real-time PCR confirmed the induction of both Edem1 and Derlin3 intransgenic B cells (Fig. 12C, 12D). Thus, microarray data discloseddifferent mechanisms to explain defective Ig production in trans-genic B cells.
DiscussionDREAM is a Ca2+-binding protein with distinct functions indifferent cellular compartments. The subcellular localization of
DREAM in basal conditions is a regulated process, which varies indifferent cell types (30). In this study, we show that in unstimu-lated B cells, DREAM is located in the nucleus exclusively asa tetramer, its preferred DNA-binding configuration (31), whereasin the cytosol, tetramer and monomer DREAM coexist. Notably,monomeric DREAM in the cytosol from B cells migrates slowerthan theoretically expected, suggesting posttranslational modifi-cations, which may be related to its exclusion from the nucleus.Previous studies have shown that expression of daDREAM has
a cross-dominant effect and blocks the function of endogenousKChIP proteins when present in a ratio as low as 1/3 (10). In thisstudy, we show that in transgenic B cells, the daDREAM/DREAMprotein ratio is 1/3 and 1/2 in L1 and L33, respectively. BecauseKChIP-2 expression in wild-type B cells is lower than that ofDREAM, the expression of the dominant active mutant in thetransgenic B cells should be sufficient to block endogenousDREAM/KChIP-3 and KChIP-2 function. Furthermore, this rela-tively low expression level may prevent unwanted effects relatedto transgene overexpression.Gene profiling analysis comparing wild-type and transgenic
B cells showed specific changes in gene expression in the trans-genic population, both unstimulated and 2 d after stimulation.Activation of gene expression in transgenic B cells might be dueto de-repression mechanisms related to the inability of daDREAMto block CREB constitutively (7), or to other transcriptional activa-tors, or to exclusion from repressor complexes yet to be character-ized. Gene repression, however, can be related to the direct domi-nant active effect at DRE sites by the Ca2+- and cAMP-insensitive“constitutive” repressor daDREAM. Of note, the largest percentageof repressed genes (24%) corresponds with transcription factorssuggesting i) a role for DREAM as a master-repressor switch inB cells and ii) that some of the changes in gene expression corre-spond with genes that are not direct DREAM targets. Whetherthese specific effects on gene expression revealed by the use ofmutated DREAM take place in heterochromatin as well as in eu-chromatin domains remains to be further analyzed.
FIGURE 10. Translation of IgG1 in transgenic B cells is reduced. A,
Pulse-chase analysis of Ig levels in wild-type and transgenic B cells after
stimulation with LPS plus IL-4 for 3 d. A representative autoradiogram
from one of three experiments is shown. Ig H and L chains are indicated.
Levels of Igs were analyzed at 0, 2, and 4 h after the pulse with labeled
amino acids. A control sample at 4 h after the pulse in the presence of the
proteosome inhibitor MG132 (lane 4i) is also shown. B, Quantitative
analysis of pulse-chase experiments. Bands corresponding with the H
chain from three separate pulse-chase experiments were scanned, and
absolute OD values are shown. Statistical significance: **p , 0.01.
FIGURE 11. Transcriptomic analysis in transgenic B cells. A, Functional clustering (Gene Ontology) of genes with modified expression encoding
proteins related to protein synthesis. Biological triplicates at days 0 and 2 are presented as a “heat map.” B, Functional clustering (Gene Ontology) of
upregulated genes encoding proteins located in the ER. Biological triplicates at days 0 and 2 are presented as a “heat map.”
7534 DREAM REGULATES B CELL FUNCTIONS
by guest on Novem
ber 1, 2018http://w
ww
.jimm
unol.org/D
ownloaded from
DREAM, also named KChIP-3, is a member of the DREAM/KChIP family of neuronal Ca2+ sensors, KChIP 1 to 4 (13). Allfour DREAM/KChIP genes encode structurally related proteinsable to bind DRE sites and block DRE-dependent transcription(12). In the immune system, DREAM and KChIP-2 are the onlyfamily members expressed. The functional redundancy betweenDREAM and KChIP-2 and their coexpression in lymphocytes mayaccount for the lack of phenotype reported in the immune systemof DREAM KO mice (16). In the current study, DREAM-deficientmice did not show modification in the levels of serum Igs or in Igsecretion after B cell stimulation. In TgDREAM mice, however,expression of the dominant active mutant blocks repressor activityof both endogenous DREAM and KChIP-2 proteins in the nucleusresulting in an apparent phenotype. Nevertheless, the functionalidentity among KChIP family members is not absolute, and recentstudies have shown differences in their subcellular localizationand in their functions outside the nucleus (e.g., Ca2+-dependentexocytosis in PC12 cells) (32). Thus, subtle functional differencesbetween DREAM and KChIP-2 in B cell gene regulation cannotbe entirely excluded by the absence of a phenotype in DREAM-deficient B cells.TgDREAM mice showed a global decrease in serum Ig levels.
We believe that this phenotype is physiologically relevant becausepreliminary results from asthma models show that the productionof Ag-specific IgG1 is reduced in TgDREAM mice (J.R. Naranjo,unpublished data) suggesting that inhibition of DREAM activity inB cells may have therapeutic potential. In vitro experiments usingpurified B cells stimulated with LPS6 IL-4 showed that the defectin Ig production is intrinsic to B cells. Deregulation of the Igproduction in transgenic B cells appears not to be related tochanges in the plasma cell differentiation program, as expressionof Blimp-1 and Xbp-1, two proteins heavily implicated in plasmacell differentiation and Ig secretion, is normal in transgenicB cells. Furthermore, deregulation of Ig production in transgenicB cells is not due to a transcription defect because multiple tran-scripts arising from the IgH locus (germline and VDJ-rearrangedH chain transcripts) were increased in transgenic B cells. In-creased GLT and IgH mRNA levels in transgenic B cells could berelated to accelerated cell division (33). Because previous workwith the TgDREAM mice showed a defect in cytokine productionand T cell proliferation (10), we cannot exclude that T cells play
a role in the reduction of T-dependent Ig levels in the serumin vivo.Because Ig transcription is not altered in transgenic B cells, the
reduced Ig secretion observed points toward a defect in the Igprotein synthesis. Gene profiling identified decreased expressionof Eif4g3 and disclosed a potential mechanism for decreased Igprotein synthesis in primary splenic B cells from TgDREAMmice.Eif4g are scaffold proteins of the translation initiation machinerythat connect mRNA and the 40S ribosomal subunit to initiatetranslation. The molecular basis for a potentially specific effect ofreduced Eif4g3 expression on Ig production without a generaleffect on protein synthesis is currently unknown. It has recentlybeen reported (34), however, that a single amino acid mutation inthe W2 domain of Eif4g3 selectively blocks the translation ofHspa2, a chaperone of CDC2A kinase that together with cyclin Bregulates the G2/M transition and the exit from meiotic prophase(35). Lack of Hspa2 protein abrogates CDC2A activity, whichresults in meiotic arrest of mouse spermatocytes and male in-fertility (34). How mutant Eif4g3 specifically affects translation ofspecific mRNAs is not resolved, though signals contained in thelong 59 leader sequence of the Hspa2 transcript are probably re-sponsible. Whether this is the case for Ig transcripts is not resolvedeither. Lack of a specific Ab for Eif4g3 precluded the analysis ofEif4g3 protein levels to support further its role in Ig translation inbasal conditions and after B cell stimulation.Gene profiling also identified the upregulation in transgenic
B cells of Edem1 and Derlin3, two key components of the ERADpathway. Edem1 recognizes the Man8GlcNAc2 structure, presentin misfolded glycoproteins, and targets them to the proteasome(27, 36, 37), and Derlin3, an ER membrane-spanning protein, fa-cilitates the cytosolic translocation of ERAD substrates (29). Over-expression of either Edem1 (36) or Derlin3 (29) accelerates, andsmall interfering RNA for Derlin3 (29) reduces, the degradation ofmisfolded glycoproteins. Although pulse-chase experiments didnot support increased degradation of IgG as the main mechanismto explain reduced Ig levels in transgenic B cells in vitro, we cannotexclude that increased levels of Edem1 or Derlin3 observed intransgenic B cells could participate in the Ig production defect invivo. The biological significance of Edem1 and Derlin3 upregu-lation in DREAM transgenic B cells is currently not understood.Stimulated transgenic B cells show an accelerated cell division
compared with that of wild type and increased proliferative re-sponse without change in apoptosis susceptibility. Microarrayanalysis identified the downregulation of Klf9 in unstimulatedand stimulated transgenic B cells. Klf9 is important to maintaincell quiescence and to control cell division in human B cells (26).Furthermore, we found that expression of Klf9 was decreasedalso in wild-type B cells after stimulation, suggesting that thedownregulation of Klf9 is a prerequisite for mouse B cell pro-liferation. The proximal promoter of the Klf9 gene contains DREelements that could participate in the transcriptional repressionby daDREAM. Ectopic expression of Klf9 in human B cellsreduces the number of B cells being recruited into division anddelays their entry into division (26). Together, these data suggestthat Klf9 could maintain cellular quiescence in naive B cells andthat its downregulation allows transgenic B cells to enter di-vision earlier than wild type.Ca2+-dependent changes in gene expression are essential for
the immune response. Two major transcription factors, NFAT andMEF2, have in the past been considered to carry out these changes(38–40). Our results in B cells and a previous study focused onT lymphocytes (10) indicate that DREAM also participates in theCa2+-dependent control of the immune response and is a potentialnew target for immunosuppressant drugs. Further studies should
FIGURE 12. Changes in gene expression in transgenic B cells. Quan-
titative real-time PCR for (A) Klf9, (B) Eif4g3, (C) Edem1, and (D)
Derlin3 mRNA in wild-type and transgenic B cells stimulated with LPS
plus IL-4 for the indicated times. Results are the mean 6 SD of four mice
and are representative of two experiments. Statistical significance versus
corresponding control (A–D): *p , 0.05; **p , 0.01; ***p , 0.001.
The Journal of Immunology 7535
by guest on Novem
ber 1, 2018http://w
ww
.jimm
unol.org/D
ownloaded from
analyze the functional relations between DREAM, NFAT, andMEF2, which might direct a global Ca2+-dependent transcriptionalnetwork controlling the immune response.
AcknowledgmentsWe thank C. Patino for electron microscopy experiments, Drs. L. Pelletier and
P. Druet for critical reading of the manuscript, and R. Susın and P. Gonzalez
for technical assistance.
DisclosuresThe authors have no financial conflicts of interest.
References1. Jacob, J., R. Kassir, and G. Kelsoe. 1991. In situ studies of the primary immune
response to (4-hydroxy-3-nitrophenyl)acetyl. I. The architecture and dynamics ofresponding cell populations. J. Exp. Med. 173: 1165–1175.
2. Smith, K. G., A. Light, G. J. Nossal, and D. M. Tarlinton. 1997. The extent ofaffinity maturation differs between the memory and antibody-forming cellcompartments in the primary immune response. EMBO J. 16: 2996–3006.
3. Tarlinton, D., A. Radbruch, F. Hiepe, and T. Dorner. 2008. Plasma cell differ-entiation and survival. Curr. Opin. Immunol. 20: 162–169.
4. Brewer, J. W., and L. M. Hendershot. 2005. Building an antibody factory: a jobfor the unfolded protein response. Nat. Immunol. 6: 23–29.
5. Carrion, A. M., W. A. Link, F. Ledo, B. Mellstrom, and J. R. Naranjo. 1999.DREAM is a Ca2+-regulated transcriptional repressor. Nature 398: 80–84.
6. Ledo, F., A. M. Carrion, W. A. Link, B. Mellstrom, and J. R. Naranjo. 2000.DREAM-alphaCREM interaction via leucine-charged domains derepressesdownstream regulatory element-dependent transcription. Mol. Cell. Biol. 20:9120–9126.
7. Ledo, F., L. Kremer, B. Mellstrom, and J. R. Naranjo. 2002. Ca2+-dependentblock of CREB-CBP transcription by repressor DREAM. EMBO J. 21: 4583–4592.
8. Sanz, C., B. Mellstrom, W. A. Link, J. R. Naranjo, and J. L. Fernandez-Luna.2001. Interleukin 3-dependent activation of DREAM is involved in transcrip-tional silencing of the apoptotic Hrk gene in hematopoietic progenitor cells.EMBO J. 20: 2286–2292.
9. Ledo, F., W. A. Link, A. M. Carrion, V. Echeverria, B. Mellstrom, andJ. R. Naranjo. 2000. The DREAM-DRE interaction: key nucleotides and dom-inant negative mutants. Biochim. Biophys. Acta 1498: 162–168.
10. Savignac, M., B. Pintado, A. Gutierrez-Adan, M. Palczewska, B. Mellstrom, andJ. R. Naranjo. 2005. Transcriptional repressor DREAM regulates T-lymphocyteproliferation and cytokine gene expression. EMBO J. 24: 3555–3564.
11. Gomez-Villafuertes, R., B. Torres, J. Barrio, M. Savignac, N. Gabellini, F. Rizzato,B. Pintado, A. Gutierrez-Adan, B. Mellstrom, E. Carafoli, and J. R. Naranjo. 2005.Downstream regulatory element antagonist modulator regulates Ca2+ homeostasisand viability in cerebellar neurons. J. Neurosci. 25: 10822–10830.
12. Link, W. A., F. Ledo, B. Torres, M. Palczewska, T. M. Madsen, M. Savignac,J. P. Albar, B. Mellstrom, and J. R. Naranjo. 2004. Day-night changes indownstream regulatory element antagonist modulator/potassium channel inter-acting protein activity contribute to circadian gene expression in pineal gland. J.Neurosci. 24: 5346–5355.
13. An, W. F., M. R. Bowlby, M. Betty, J. Cao, H. P. Ling, G. Mendoza,J. W. Hinson, K. I. Mattsson, B. W. Strassle, J. S. Trimmer, and K. J. Rhodes.2000. Modulation of A-type potassium channels by a family of calcium sensors.Nature 403: 553–556.
14. Lilliehook, C., S. Chan, E. K. Choi, N. F. Zaidi, W. Wasco, M. P. Mattson, andJ. D. Buxbaum. 2002. Calsenilin enhances apoptosis by altering endoplasmicreticulum calcium signaling. Mol. Cell. Neurosci. 19: 552–559.
15. Rivas, M., B. Mellstrom, J. R. Naranjo, and P. Santisteban. 2004. Transcriptionalrepressor DREAM interacts with thyroid transcription factor-1 and regulatesthyroglobulin gene expression. J. Biol. Chem. 279: 33114–33122.
16. Cheng, H. Y., G. M. Pitcher, S. R. Laviolette, I. Q. Whishaw, K. I. Tong,L. K. Kockeritz, T. Wada, N. A. Joza, M. Crackower, J. Goncalves, et al. 2002.DREAM is a critical transcriptional repressor for pain modulation. Cell 108: 31–43.
17. Vandermeeren, A. M., C. E. Gomez, C. Patino, E. Domingo-Gil, S. Guerra,J. M. Gonzalez, and M. Esteban. 2008. Subcellular forms and biochemical events
triggered in human cells by HCV polyprotein expression from a viral vector.Virol. J. 5: 102.
18. Pinaud, E., A. A. Khamlichi, C. Le Morvan, M. Drouet, V. Nalesso, M. Le Bert,and M. Cogne. 2001. Localization of the 39 IgH locus elements that effect long-distance regulation of class switch recombination. Immunity 15: 187–199.
19. Reina-San-Martin, B., S. Difilippantonio, L. Hanitsch, R. F. Masilamani,A. Nussenzweig, and M. C. Nussenzweig. 2003. H2AX is required for re-combination between immunoglobulin switch regions but not for intra-switchregion recombination or somatic hypermutation. J. Exp. Med. 197: 1767–1778.
20. Irizarry, R. A., B. Hobbs, F. Collin, Y. D. Beazer-Barclay, K. J. Antonellis,U. Scherf, and T. P. Speed. 2003. Exploration, normalization, and summaries ofhigh density oligonucleotide array probe level data. Biostatistics 4: 249–264.
21. Gautier, L., L. Cope, B. M. Bolstad, and R. A. Irizarry. 2004. affy—analysis ofAffymetrix GeneChip data at the probe level. Bioinformatics 20: 307–315.
22. Smyth, G. K. 2005. Limma: Linear Models for Microarray Data. Springer, NewYork.
23. Benjamini, Y., and Y. Hochberg. 1995. Controlling the false discovery rate:a practical and powerful approach to multiple testing. J. R. Stat. Soc. Series BStat. Methodol. 57: 289–300.
24. Oliveros, J. C. 2007. FIESTA@BioinfoGP. An interactive server for analyzingDNA microarray experiments with replicates. Available at: http://bioinfogp.cnb.csic.es/tools/FIESTA. Accessed October 16, 2010.
25. Hoffmann, A., S. Kerr, J. Jellusova, J. Zhang, F. Weisel, U. Wellmann,T. H. Winkler, B. Kneitz, P. R. Crocker, and L. Nitschke. 2007. Siglec-G isa B1 cell-inhibitory receptor that controls expansion and calcium signaling of theB1 cell population. Nat. Immunol. 8: 695–704.
26. Good, K. L., and S. G. Tangye. 2007. Decreased expression of Kruppel-likefactors in memory B cells induces the rapid response typical of secondary an-tibody responses. Proc. Natl. Acad. Sci. USA 104: 13420–13425.
27. Molinari, M., V. Calanca, C. Galli, P. Lucca, and P. Paganetti. 2003. Role ofEDEM in the release of misfolded glycoproteins from the calnexin cycle. Sci-ence 299: 1397–1400.
28. Olivari, S., T. Cali, K. E. Salo, P. Paganetti, L. W. Ruddock, and M. Molinari. 2006.EDEM1 regulates ER-associated degradation by accelerating de-mannosylationof folding-defective polypeptides and by inhibiting their covalent aggregation. Bio-chem. Biophys. Res. Commun. 349: 1278–1284.
29. Oda, Y., T. Okada, H. Yoshida, R. J. Kaufman, K. Nagata, and K. Mori. 2006.Derlin-2 and Derlin-3 are regulated by the mammalian unfolded protein responseand are required for ER-associated degradation. J. Cell Biol. 172: 383–393.
30. Zaidi, N. F., E. E. Thomson, E. K. Choi, J. D. Buxbaum, and W. Wasco. 2004.Intracellular calcium modulates the nuclear translocation of calsenilin. J. Neu-rochem. 89: 593–601.
31. Osawa, M., K. I. Tong, C. Lilliehook, W. Wasco, J. D. Buxbaum, H. Y. Cheng,J. M. Penninger, M. Ikura, and J. B. Ames. 2001. Calcium-regulated DNAbinding and oligomerization of the neuronal calcium-sensing protein, calsenilin/DREAM/KChIP3. J. Biol. Chem. 276: 41005–41013.
32. Venn, N., L. P. Haynes, and R. D. Burgoyne. 2008. Specific effects of KChIP3/calsenilin/DREAM, but not KChIPs 1, 2 and 4, on calcium signalling and reg-ulated secretion in PC12 cells. Biochem. J. 413: 71–80.
33. Hodgkin, P. D., J. H. Lee, and A. B. Lyons. 1996. B cell differentiation andisotype switching is related to division cycle number. J. Exp. Med. 184: 277–281.
34. Sun, F., K. Palmer, and M. A. Handel. 2010. Mutation of Eif4g3, encodinga eukaryotic translation initiation factor, causes male infertility and meiotic ar-rest of mouse spermatocytes. Development 137: 1699–1707.
35. Sun, F., and M. A. Handel. 2008. Regulation of the meiotic prophase I tometaphase I transition in mouse spermatocytes. Chromosoma 117: 471–485.
36. Hosokawa, N., I. Wada, K. Hasegawa, T. Yorihuzi, L. O. Tremblay, A. Herscovics,and K. Nagata. 2001. A novel ER alpha-mannosidase-like protein accelerates ER-associated degradation. EMBO Rep. 2: 415–422.
37. Oda, Y., N. Hosokawa, I. Wada, and K. Nagata. 2003. EDEM as an acceptor ofterminally misfolded glycoproteins released from calnexin. Science 299: 1394–1397.
38. Peng, S. L., A. J. Gerth, A. M. Ranger, and L. H. Glimcher. 2001. NFATc1 andNFATc2 together control both T and B cell activation and differentiation. Im-munity 14: 13–20.
39. Gallo, E. M., K. Cante-Barrett, and G. R. Crabtree. 2006. Lymphocyte calciumsignaling from membrane to nucleus. Nat. Immunol. 7: 25–32.
40. Wilker, P. R., M. Kohyama, M. M. Sandau, J. C. Albring, O. Nakagawa,J. J. Schwarz, and K. M. Murphy. 2008. Transcription factor Mef2c is requiredfor B cell proliferation and survival after antigen receptor stimulation. Nat.Immunol. 9: 603–612.
7536 DREAM REGULATES B CELL FUNCTIONS
by guest on Novem
ber 1, 2018http://w
ww
.jimm
unol.org/D
ownloaded from