incorporating the audited financial statements · this fund may invest in securities traded on...
TRANSCRIPT

RHB Asset Management Sdn Bhd (174588-X)
Head OfficeLevel 8, Tower 2 & 3, RHB Centre Jalan Tun Razak50400 Kuala Lumpur, Malaysia
Tel : +603 9205 8000
Fax : +603 9205 8100
www.rhbgroup.com
RHB GOLDEN DRAGON FUND
ANNUAL REPORT 2017
Incorporating The Audited Financial Statements
For the financial year ended 31 December 2017

1
GENERAL INFORMATION ABOUT THE FUND
Name, Category and Type
Fund Name - RHB Golden Dragon FundFund Category - Mixed asset fundFund type - Growth and income fund
Investment Objective, Policy and Strategy
Objective of the Fund
This Fund aims to maximise total returns through a combination of long term* growth of capital and current income.
* Note: “long term” in this context refers to a period of between 5 – 7 years.
Strategy
The Fund seeks to achieve its investment objective through a diversified portfolio of equities and equity-linked securities issued by companies whose businesses are in the Greater China (i.e. the People‟s Republic of China, Hong Kong SAR and Taiwan)(“China Equities”) and Malaysian fixed income securities.
The asset allocation of the Fund will be as follows:-
30% - 70% of Net Asset Value
- Investments in securities of and securities relating to companies whose businesses are in the Greater China (ie the People‟s Republic of China, Hong Kong SAR and Taiwan)and are listed on the Greater China markets and/or other markets.
30% - 70% of Net Asset Value
- Investments in Malaysian fixed income securities, money market instruments, cash and deposits with financial institutions.
The above asset allocation will be reviewed from time to time depending on economic and market conditions.
1

2
Investment Philosophy
Our investment philosophy describes the approach that the investment team will adhere to when constructing an equity or fixed income portfolio. The fund managers invest in well-managed companies with strong balance sheets that possess competitive advantages that should enable them to outperform their peers over economic cycles. The fund managers are active investors that make high conviction security selection decisions, but at the same time do not take unnecessary or excessive risks nor take speculative positions. The fund managers seek to outperform their peers and beat their benchmark by buying mispriced or cheap securities. Following our disciplined sell strategy, the fund managers would then exit positions when the target price is reached. Concurrently, the fund managers understand the Fund‟s risk profile and act within the Fund‟s mandate.
2
3
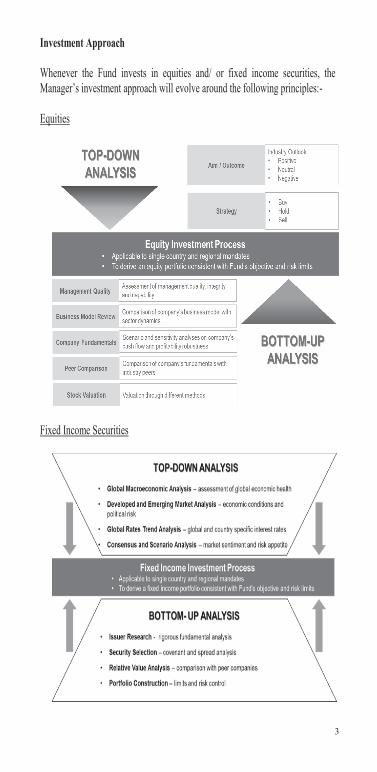
Investment Approach
Whenever the Fund invests in equities and/ or fixed income securities, the Manager‟s investment approach will evolve around the following principles:-
Equities
Fixed Income Securities
3
4
Performance Benchmark
The performance of the Fund is benchmarked against the Golden Dragon Index which is a composite benchmark comprising 50% Morgan Stanley Capital International (MSCI) Golden Dragon Index (MYR) and 50% RAM qs MGS 3-7(Medium).
Permitted Investments and Restrictions
This Fund may invest in securities traded on Bursa Malaysia Securities Berhad or any other market considered as an Eligible Market, unlisted securities, collective investment schemes, securities/instruments in foreign markets, financial derivatives, structured products, liquid assets (including money market instruments and deposits with any financial institutions), participate in the lending of securities, and any other investments permitted by the Securities Commission Malaysia from time to time.
Distribution Policy
Consistent with the Fund‟s objective to maximize total returns through a combination of long term growth of capital and current income, the Fund will distribute a portion of its returns to unit holders. Distributions, if any, afterdeduction of taxation and expenses are generally declared annually.
4

5
MANAGER‟S REPORT
MARKET REVIEW
China equities enjoyed a vigorous rally throughout the year 2017, in a sharp contrast to the subdued year 2016. Strong economic data, higher reflation in the upstream manufacturing sectors, decent improvement in corporate earnings and abundant fund inflow all contributed to the market rally. The supply-side reforms in China, aimed at the elimination of excess capacities in the heavy industries, paid off in the year. The regained pricing power and better profit margins fueled corporate earnings growth. With more mature Shanghai/Shenzhen Stock Connect scheme allowing mainland Chinese to invest China equities in the Hong Kong (“HK”) bourse, the influx of southbound fund buoyed the share prices. Among sectors, biggest gainers were insurance, property, internet and autos, which benefited from higher domestic bond yield, rapid destocking in primary home market, strong growth in mobile games and e-commerce, and encouraging auto sales figures, respectively. Throughout the course of the whopping rally, only a mild correction was seen before the end of the year. This was mainly due the profit taking and Chinese government‟s proactive measures in clamping down the wealth management product business within the shadow banking sector.
Hong Kong shares rose in the year 2017 albeit less vigorous rally as compared to China shares. Among Hong Kong shares, outperformers were still Macau gaming names, as the casino operators kept reporting stronger-than-expected gaming revenue throughout the year, together with a more balanced gambler mix and profit margins. The surge in the heavy-weighted property shares was supported by the continuously strong primary sales, lower mortgage rate, and higher expectation on quality land-bank replenishment. Investors simply shrugged off the risk of the United States (“US”) interest rate hike given still abundant liquidity in the Hong Kong banking system. Hong Kong banking sector also climbed on the expectation of improving loan yield in the wake of the gradual rise in the interbank interest rate.
Taiwan shares advanced in the first half but lost steam in the second half of the year 2017. For the full year, Taiwan equities lagged behind China and Hong Kong peers. Tech sector benefited from the strong foreign fund inflow at the beginning of the year, when investors bet on the recovery the tech food chain. Personal computer (“PC”), liquid crystal displays (“LCD”) and smartphone components rose in tandem. However, fund flow reversed towards the end of the year when share valuation became more demanding. Meanwhile, brokers downgraded the sales outlook of a US renowned smartphone maker, which led to a sharp correction of its upstream component vendors. Non-tech stocks remained lackluster throughout the year, given fewer appetites from foreign investors and weaker fundamental factors. For instance, certain leading insurers were affected by poor-than-expected investment
5

6
gains. Petrochemical sector was hit by weakened product demand. Export and industrial names fared even worse on strong Taiwanese Dollar.
Regarding Malaysian fixed income, USDMYR has continued to strengthen towards the end of December 2017 and there were several reasons to it. One of the reasons was Bank Negara Malaysia (“BNM”) to potentially hike interest rates in year 2018 on the back of solid Gross Domestic Product (“GDP”) numbers shown in year 2017 and at the same time the United States Dollar (“USD”) has also lost its luster towards the end of year 2017 when US Congress passed and adopted the new tax reform. It was expected that there will be more supply of US Treasuries to hit market in year 2018 and that would not bode well to the USD in a short term basis. In summary, the Malaysian Government Securities (“MGS”) yield curve flattened but this was more apparent on the longer end. A rundown of the month-end‟s close was as follows: 3-, 5-, 7-, 10-, 15-, 20- and 30-year MGS were reported at 3.338% (November-2017: 3.406%), 3.531% (3.626%), 3.876% (3.907%), 3.905% (3.890%), 4.401% (4.441%), 4.580% (4.600%) and 4.850% (4.893%) respectively. Contrast to MGS curve movement, Government Investment Issues (“GII”) – Shariah compliant version of MGS, which exhibited negative butterfly twist (i.e. short- and long-end yield curve tightened while intermediate yield curve widened). The 3-, 5-, 7-, 10-,15-, 20- and 30-year GII were reported at 3.469% (November-2017: 3.462%), 3.791% (3.885%), 4.097% (4.050%), 4.187% (4.272%), 4.683% (4.680%), 4.771% (4.836%) and 4.945% (4.981%) respectively.
ECONOMIC REVIEW AND OUTLOOK
On the economic side, the most astonishing signs for China in the year 2017 were the stronger than expected economic growth and reflation in the upstream manufacture sector. For the full-year 2017, China‟s GDP rose 6.9%, much higher than government target of 6.5%. Although fixed asset investment saw a bit slow down, industrial production and industrial profits showed a very resilient trend given the rebound in the prices of basic materials, strong sales volume growth and recovering profit margins. As the supply side reform is ongoing and globaleconomic recovery is intact, economic outlook for China in the year 2018 remains bright.
For Taiwan, exports rebounded in the second half of the year 2017. Business capex cycles have turned better in China, which should further support the demand in tech spending upgrade. New smartphone models and persistent upgrade in applications bode well to Taiwan exports. As the gradual recovery in exports carries on, it should filter more into domestic demand as well, and this should translate into the gradual recovery in private consumption. Nonetheless, investment growth is likely to be sluggish.
6
7
On the local economic front, Malaysia‟s November 2017 Consumer Prices Index (“CPI”) rose 3.4% from a year ago as expected by the consensus due to higher transport and food costs. Based on seasonally adjusted term, the overall CPI for November 2017 increased 0.7% as compared to October and core inflation rose 2.2% compared to a year ago. The Statistics Department said among the major groups which recorded increases in November 2017 were the indices for transport (+10.8%), food and non-alcoholic beverages (+4.0%), restaurants and hotels (+2.8%), household equipment (+2.5%), health (+2.2%) and housing, water, electricity, gas and other fuels (+2.2%). The average price of one liter of RON95 petrol was RM2.30 in November 2017 compared to RM1.95 a year ago. As for RON97, the average price increased to RM2.59 in November 2017 from RM2.30 a year ago. Nevertheless, the reading bias skewed towards tighter monetary conditions. That said, the government has mooted the idea of mitigating the impact of higher crude oil prices should the RON95 prices rise beyond RM2.50/liter for consecutive three months. If this is implemented, it would suggest some insulation of headline inflation from increases in global fuel prices.
REVIEW OF FUND PERFORMANCE AND STRATEGY DURING THE YEAR
According to Lipper Investment Management (“Lipper IM”), for the financial year under review, the Fund registered a gain of 13.68%* in Malaysian Ringgit (“MYR”) terms, as compared to its benchmark return of 16.20%*. The benchmark consists of 50% Morgan Stanley Capital International (“MSCI”) Golden Dragon (MYR) and 50% RAM qs MGS 3-7 (Medium). The Fund achieved its investment objective during the financial year under review.
The Fund was overweight in equities with over 55% weight at the beginning of the year. This strategy was effective and Fund performance was buoyed by the rally of the broad market. Starting from the second quarter, the Fund increased its weight infixed income in view of strengthened MYR against USD. Although trimming our position in equities at the second quarter of the year, we put more focus on bottom-up analysis and country selection. The Fund was overweight in both Taiwanese and China while underweight in Hong Kong, which continued to bring positive return during the financial year under review. However, before the end of the year, the correction in Taiwanese technology stocks slightly pulled back the investment return. * Source: Lipper Investment Management (“Lipper IM”), 18 January 2018
MARKET OUTLOOK AND STRATEGY GOING FORWARD
We hold our long-term positive view over China equities. Market now expects the earnings per share (“EPS‟) for the overall China listed equities to grow 15% for the
7

8
year 2018, similar to that in year 2017. This reveals the earnings up-cycle is still well in place. In addition, our view built on plenty liquidity remains unchanged. As the valuation of China equities is still lower than regional peers, both overseas and mainland Chinese investors are expected to invest in China equities, which would help bolster the fund inflow. On the other hand, China‟s 19th Communist Party Congress was held during October 2017, emphasizing the quality of growth and addressing structural risk. We still believe earlier clampdown of shadow banking by the central government is only an ongoing de-leverage measure, but it would notalter the trend of southbound fund influx in the long run.
We maintain our positive view over old economy names such as financial sector in view of the improvement in loan asset quality, better new business value margins and still undemanding valuation. The basic material and machinery sectors, in the longer term, will continue to benefit from ongoing supply-side reforms, while near term pressure would be derived from the weaker fixed asset investment data. For the new economy sector like internet, earnings growth outlook remain brisk while valuation still look demanding. We therefore only suggest bargain hunting and selection of high-quality, industry leader names that could enjoy multiple years of earnings growth.
We maintain our neutral view over Taiwan equities. The downward revision of Apple‟s iPhone shipment and weaker-than-expected handset sales in China will remain the major drag on the overall market. Nonetheless, the sharp share price correction has largely priced in the negative factor, in our view. Until new product offerings and likely improved production to kick in during the second half of next year, we will hold a neutral on Apple‟s supply chain names. At the same time, we see fair valuation on Taiwan equity market while foreign fund inflow remains weak for the non-tech sector, and we believe the recent rebound in petrochemical sector will fail to buoy the overall investment sentiment. We now prefer insurance names, which are set to benefit from rising US interest rate.
On the fixed income side, some of the most significant recent developments in the global economy are the broader higher growth, steady inflation and the rising Advanced Economy (“AE”) policy rates. We continue to expect global economic outlook to largely characterized by these recent developments as the synchronized of global economy growth appears to be somewhat evidenced in recent major economies data and activities. However, after picking up quite sharply in year 2017, we expect global nominal GDP growth to be moderate (not to the significant slowdown) due to higher base effects and the concentrated effort by central banks to raise policy rates could trigger slowdown in global growth as markets adjusting to a major tightening in financial conditions. With subdued inflation despite robust growth recently, financial imbalances appear to be building.
8

9
In year 2018, expectation is for the handful of AE central banks to continue tightening path (US, UK, Canada, Australia and New Zealand) while global central banks purchases to fall from $180 billion per month to roughly zero by end-2018. Fed‟s balance sheet reduction should ramp up by end-2018 as planned to USD50 billion per month. Given that, risk free asset supply will no doubt increase but not to a level that will derail the real economy recovery. Nevertheless, risk free assets corrections could still trigger or cause a global slowdown if the “forward guidance message” from central banks is significantly detached from the market participants.Mirroring global growth trends, Malaysia‟s growth data has continuously surprised on the upside in year 2017 with the recent 3rd Quarter GDP recorded 6.2%, the fastest quarterly growth since 2nd Quarter of 2014. Headline inflation is expected to be at the upper end of the forecast range of 3.5%-4.0% in 2017. Moving into year 2018, headline inflation is projected to moderate at about 2.5%-3.5% on expectation of smaller effect from global cost factors. Nonetheless, from the mid-point of 3% inflation forecast in year 2018, BNM hawkish stand recently will bring the real interest rates back into positive territory. We therefore expect BNM to hike 25bps in year 2018 but further tightening in policy rates will broadly depending on the incoming data as well as trajectory of global monetary conditions. In term of strategy, we are neutral on duration with mildly bullish in expectation that local demand dynamics tend to be more constructive in the first quarter. As for the allocation, we overweight credit over government bonds for yield pick-up while strategically taking opportunity on the re-pricing rewards of government bonds.
9

10
PERFORMANCE DATA
Annual Total ReturnsYear Ended 31 December
2017%
2016%
2015%
2014%
2013%
RHB Golden Dragon Fund- Capital Return 13.68 (5.15) 2.04 6.55 11.05- Income Return - 7.56 9.13 - -- Total Returns 13.68 2.02 11.36 6.55 11.05
Golden Dragon Index 16.20 6.02 8.85 7.76 7.00
Average Annual Return1 Year
31.12.2016-31.12.2017
%
3 Years31.12.2014-31.12.2017
%
5 Years31.12.2012-31.12.2017
%
10 Years31.12.2007-31.12.2017
%RHB Golden Dragon
Fund 13.68 8.89 8.85 2.70
Golden Dragon Index (RM) 16.20 10.27 9.10 4.61
10

11
Performance of RHB Golden Dragon Fund for the period from 31 December 2007 to 31 December 2017
Cumulative Return Over The Period (%)
Source: Lipper IM, 18 January 2018
The abovementioned performance figures are indicative returns based on daily Net Asset Value of a unit (as per Lipper Database) since inception.
The calculation of the above returns is based on computation methods of Lipper.
Note : Past performance is not necessarily indicative of future performance and unit prices and investment returns may go down, as well as up.
The abovementioned performance computations have been adjusted to reflect distribution payments and unit splits wherever applicable.
11

12
As At 31 DecemberFund Size 2017 2016 2015Net Asset Value (RM million) 37.69 44.02* 51.97*Units In Circulation (million) 69.25 91.96* 102.98*Net Asset Value Per Unit (RM) 0.5443 0.4787* 0.5047*
As At 31 DecemberHistorical Data 2017 2016 2015Unit PricesNAV - Highest (RM) 0.5634 0.5203* 0.6014* - Lowest (RM) 0.4807 0.4386* 0.4964*
Distribution and Unit Split Gross Distribution Per Unit (sen) - 3.6000 4.5750Net Distribution Per Unit (sen) - 3.6000 4.5750Ex date - 28.12.2016 16.12.2015NAV before distribution (cum) - 0.5089 0.5416NAV after distribution (ex) - 0.4760 0.5010
Unit Split - - -
OthersManagement Expense Ratio(MER) (%) # 2.10 2.19 2.08
Portfolio Turnover Ratio (PTR) (times)## 0.31 1.57 0.45
* The figures quoted are ex-distribution
# The MER for the financial year was lower compared with the previous financial year due to lower expenses incurred during the financial year under review (refer to Note 14).
## The PTR for the financial year was lower compared with previous corresponding financial year due to lesser investment activities during the financial year under review (refer to Note 15).
DISTRIBUTION
For the financial year under review, no distribution has been proposed by the Fund.
12
13
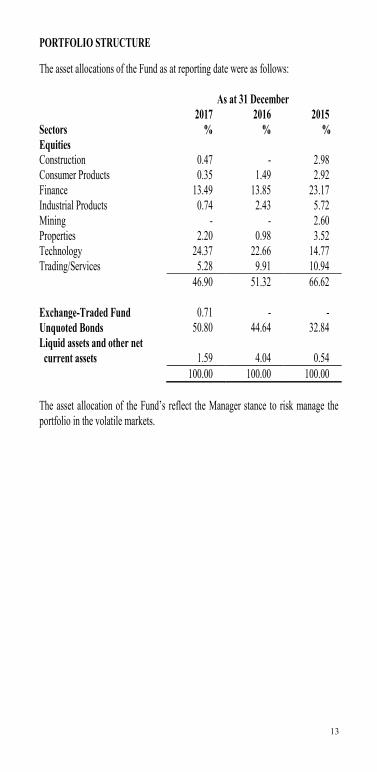
PORTFOLIO STRUCTURE
The asset allocations of the Fund as at reporting date were as follows:
As at 31 December2017 2016 2015
Sectors % % %EquitiesConstruction 0.47 - 2.98Consumer Products 0.35 1.49 2.92Finance 13.49 13.85 23.17Industrial Products 0.74 2.43 5.72Mining - - 2.60Properties 2.20 0.98 3.52Technology 24.37 22.66 14.77Trading/Services 5.28 9.91 10.94
46.90 51.32 66.62
Exchange-Traded Fund 0.71 - -Unquoted Bonds 50.80 44.64 32.84Liquid assets and other net
current assets 1.59 4.04 0.54100.00 100.00 100.00
The asset allocation of the Fund‟s reflect the Manager stance to risk manage the portfolio in the volatile markets.
13

14
BREAKDOWN OF UNIT HOLDINGS BY SIZE
Account Holders No. Of Units Held*Size of Holdings No. % („000) %5,000 and below 189 28.29 524 0.765,001 to 10,000 112 16.77 769 1.1110,001 to 50,000 287 42.96 6,060 8.7550,001 to 500,000 73 10.93 8,419 12.16500,001 and above 7 1.05 53,478 77.22Total 668 100.00 69,250 100.00
*Excluding Manager‟s stock
SOFT COMMISSION
The Fund Manager may only receive soft commission in the form of research and advisory services that assist in the decision-making process relating to the Fund‟s investments.
During the financial year under review, the soft commission received from the brokers had been retained by the Manager as the goods and services provided are of demonstrable benefit to the unitholders.
14

15
RHB GOLDEN DRAGON FUND STATEMENT OF FINANCIAL POSITION AS AT 31 DECEMBER 2017
Note 2017 2016RM RM
ASSETSFinancial assets at fair value through profit or loss (“FVTPL”) 5 37,093,701 42,241,649
Deposits with a licensed financial institution 6 360,142 420,194
Amount due from stockbroker - 209,781Amount due from Manager - 240Bank balances 6 450,114 1,388,918TOTAL ASSETS 37,903,957 44,260,782
LIABILITIESAmount due to stockbroker 117,253 92,547Amount due to Manager 12,512 53,828Accrued management fee 61,781 71,512Amount due to Trustee 2,059 2,384Other payables and accruals 7 16,298 20,311TOTAL LIABILITIES 209,903 240,582
NET ASSET VALUE 37,694,054 44,020,200
UNITHOLDERS‟ FUNDSUnitholders‟ capital 106,099,552 118,099,054Accumulated losses (68,405,498) (74,078,854)
37,694,054 44,020,200
UNITS IN CIRCULATION (UNITS) 8 69,254,000 91,955,000
NET ASSET VALUE PER UNIT (EX-DISTRIBUTION*) (RM) 0.5443 0.4787*
The accompanying notes are an integral part of the financial statements. 15
RHB GOLDEN DRAGON FUND STATEMENT OF FINANCIAL POSITION AS AT 31 DECEMBER 2017
Note 2017 2016RM RM
ASSETSFinancial assets at fair value through profit or loss (“FVTPL”) 5 37,093,701 42,241,649
Deposits with a licensed financial institution 6 360,142 420,194
Amount due from stockbroker - 209,781Amount due from Manager - 240Bank balances 6 450,114 1,388,918TOTAL ASSETS 37,903,957 44,260,782
LIABILITIESAmount due to stockbroker 117,253 92,547Amount due to Manager 12,512 53,828Accrued management fee 61,781 71,512Amount due to Trustee 2,059 2,384Other payables and accruals 7 16,298 20,311TOTAL LIABILITIES 209,903 240,582
NET ASSET VALUE 37,694,054 44,020,200
UNITHOLDERS‟ FUNDSUnitholders‟ capital 106,099,552 118,099,054Accumulated losses (68,405,498) (74,078,854)
37,694,054 44,020,200
UNITS IN CIRCULATION (UNITS) 8 69,254,000 91,955,000
NET ASSET VALUE PER UNIT (EX-DISTRIBUTION*) (RM) 0.5443 0.4787*
The accompanying notes are an integral part of the financial statements.
15

16
RHB GOLDEN DRAGON FUND STATEMENT OF COMPREHENSIVE INCOME FOR THE FINANCIAL YEAR ENDED 31 DECEMBER 2017
Note 2017 2016RM RM
INVESTMENT INCOMEDividend income 508,910 666,667Interest income 9 1,057,043 875,638Net gain on financial assets at fair value
through profit or loss (“FVTPL”) 5 5,307,705 365,873Net foreign currency exchange (loss)/gain (136,703) 50,795
6,736,955 1,958,973
EXPENSESManagement fee 10 (779,714) (825,037)Trustee‟s fee 11 (25,991) (27,501)Audit fee (6,650) (6,300)Tax agent‟s fee (2,800) (30,691)Transaction cost (97,352) (318,691)Other expenses (95,117) (125,799)
(1,007,624) (1,334,019)
Profit before taxation 5,729,331 624,954Taxation 12 (55,975) (55,161)Profit after taxation and total
comprehensive income for the financial year 5,673,356 569,793
Profit after taxation is made up of the following:Realised amount 4,057,415 2,577,991Unrealised amount 1,615,941 (2,008,198)
5,673,356 569,793
The accompanying notes are an integral part of the financial statements.
15
RHB GOLDEN DRAGON FUND STATEMENT OF FINANCIAL POSITION AS AT 31 DECEMBER 2017
Note 2017 2016RM RM
ASSETSFinancial assets at fair value through profit or loss (“FVTPL”) 5 37,093,701 42,241,649
Deposits with a licensed financial institution 6 360,142 420,194
Amount due from stockbroker - 209,781Amount due from Manager - 240Bank balances 6 450,114 1,388,918TOTAL ASSETS 37,903,957 44,260,782
LIABILITIESAmount due to stockbroker 117,253 92,547Amount due to Manager 12,512 53,828Accrued management fee 61,781 71,512Amount due to Trustee 2,059 2,384Other payables and accruals 7 16,298 20,311TOTAL LIABILITIES 209,903 240,582
NET ASSET VALUE 37,694,054 44,020,200
UNITHOLDERS‟ FUNDSUnitholders‟ capital 106,099,552 118,099,054Accumulated losses (68,405,498) (74,078,854)
37,694,054 44,020,200
UNITS IN CIRCULATION (UNITS) 8 69,254,000 91,955,000
NET ASSET VALUE PER UNIT (EX-DISTRIBUTION*) (RM) 0.5443 0.4787*
The accompanying notes are an integral part of the financial statements. 16

17
RHB GOLDEN DRAGON FUND STATEMENT OF CHANGES IN NET ASSET VALUE FOR THE FINANCIAL YEAR ENDED 31 DECEMBER 2017
Unitholders‟ capital
Accumulated losses
Total net asset value
RM RM RM
Balance as at 1 January 2016 123,540,406 (71,567,263) 51,973,143Movement in net asset value:
Total comprehensive income for the financial year - 569,793 569,793
Creation of units arising from applications 801,006 - 801,006
Creation of units arising from distribution 3,081,384 - 3,081,384
Cancellation of units (9,323,742) - (9,323,742)Distributions (Note 13) - (3,081,384) (3,081,384)
Balance as at 31 December 2016 118,099,054 (74,078,854) 44,020,200
Balance as at 1 January 2017 118,099,054 (74,078,854) 44,020,200Movement in net asset value:
Total comprehensive incomefor the financial year - 5,673,356 5,673,356
Creation of units arising from applications 5,457,548 - 5,457,548
Cancellation of units (17,457,050) - (17,457,050)Balance as at 31 December
2017 106,099,552 (68,405,498) 37,694,054
The accompanying notes are an integral part of the financial statements.
15
RHB GOLDEN DRAGON FUND STATEMENT OF FINANCIAL POSITION AS AT 31 DECEMBER 2017
Note 2017 2016RM RM
ASSETSFinancial assets at fair value through profit or loss (“FVTPL”) 5 37,093,701 42,241,649
Deposits with a licensed financial institution 6 360,142 420,194
Amount due from stockbroker - 209,781Amount due from Manager - 240Bank balances 6 450,114 1,388,918TOTAL ASSETS 37,903,957 44,260,782
LIABILITIESAmount due to stockbroker 117,253 92,547Amount due to Manager 12,512 53,828Accrued management fee 61,781 71,512Amount due to Trustee 2,059 2,384Other payables and accruals 7 16,298 20,311TOTAL LIABILITIES 209,903 240,582
NET ASSET VALUE 37,694,054 44,020,200
UNITHOLDERS‟ FUNDSUnitholders‟ capital 106,099,552 118,099,054Accumulated losses (68,405,498) (74,078,854)
37,694,054 44,020,200
UNITS IN CIRCULATION (UNITS) 8 69,254,000 91,955,000
NET ASSET VALUE PER UNIT (EX-DISTRIBUTION*) (RM) 0.5443 0.4787*
The accompanying notes are an integral part of the financial statements. 17

18
RHB GOLDEN DRAGON FUND STATEMENT OF CASH FLOWS FOR THE FINANCIAL YEAR ENDED 31 DECEMBER 2017
Note 2017 2016RM RM
CASH FLOWS FROM OPERATING ACTIVITIES
Proceeds from sale of investments 20,823,987 77,353,898Purchase of investments (10,211,949) (67,892,857)Interest received from unquoted investments 1,020,911 723,757Interest received from deposits with
financial institutions 13,880 73,286Dividends received 451,479 611,506Net realised foreign exchange loss - (91,613)Management fee paid (789,445) (838,185)Trustee‟s fee paid (26,315) (27,940)Payment for other fees and expenses (108,581) (162,614)Net cash generated from operating activities 11,173,967 9,749,238
CASH FLOWS FROM FINANCING ACTIVITIES
Cash proceeds from units created 5,457,788 800,766Payment for cancellation of units (17,498,366) (9,363,073)Net cash used in financing activities (12,040,578) (8,562,307)
Net (decrease)/increase in cash and cash equivalents (866,611) 1,186,931
Foreign currency translation differences (132,245) 142,408Cash and cash equivalents at the beginning
of the financial year 1,809,112 479,773Cash and cash equivalents at the end of the
financial year 810,256 1,809,112
Cash and cash equivalents comprise:Bank balances 6 450,114 1,388,918Deposits with a licensed financial
institution 6 360,142 420,194810,256 1,809,112
The accompanying notes are an integral part of the financial statements.
15
RHB GOLDEN DRAGON FUND STATEMENT OF FINANCIAL POSITION AS AT 31 DECEMBER 2017
Note 2017 2016RM RM
ASSETSFinancial assets at fair value through profit or loss (“FVTPL”) 5 37,093,701 42,241,649
Deposits with a licensed financial institution 6 360,142 420,194
Amount due from stockbroker - 209,781Amount due from Manager - 240Bank balances 6 450,114 1,388,918TOTAL ASSETS 37,903,957 44,260,782
LIABILITIESAmount due to stockbroker 117,253 92,547Amount due to Manager 12,512 53,828Accrued management fee 61,781 71,512Amount due to Trustee 2,059 2,384Other payables and accruals 7 16,298 20,311TOTAL LIABILITIES 209,903 240,582
NET ASSET VALUE 37,694,054 44,020,200
UNITHOLDERS‟ FUNDSUnitholders‟ capital 106,099,552 118,099,054Accumulated losses (68,405,498) (74,078,854)
37,694,054 44,020,200
UNITS IN CIRCULATION (UNITS) 8 69,254,000 91,955,000
NET ASSET VALUE PER UNIT (EX-DISTRIBUTION*) (RM) 0.5443 0.4787*
The accompanying notes are an integral part of the financial statements. 18

19
RHB GOLDEN DRAGON FUND NOTES TO THE FINANCIAL STATEMENTS FOR THE FINANCIAL YEAR ENDED 31 DECEMBER 2017
1. THE FUND, THE MANAGER AND THEIR PRINCIPAL ACTIVITIES
The RHB Golden Dragon Fund (hereinafter referred to as “the Fund”) was constituted pursuant to the execution of a Master deed dated 27 April 2004 as modified via its first supplemental master deed dated 8 June 2004, second supplemental master deed dated 19 October 2005, third supplemental master deed dated 8 December 2005, fourth supplemental master deed dated 28 February 2006, fifth supplemental master deed dated 9 March 2006, sixth supplemental master deed dated 22 September 2006, seventh supplemental master deed dated 15 December 2006, eighth supplemental master deed dated 30 January 2007, ninth supplemental master deed dated 9 April 2007, tenth supplemental master deed dated 14 May 2007, eleventh supplemental master deed dated 15 May 2007, twelfth supplemental master deed dated 27 June 2007, thirteenth supplemental master deed dated 24 December 2007, fourteenth supplemental master deed dated 28 February 2013, fifteenth supplemental master deed dated 4 September 2013, sixteenth supplemental master deed dated 2 March 2015,seventeenth supplemental master deed dated 8 May 2015, eighteenth supplemental master deed dated 25 May 2015 and nineteenth supplemental master deed dated 3 June 2015 (hereinafter referred to as “the Deeds”) between RHB Asset Management Sdn Bhd (“the Manager”) and HSBC (Malaysia) Trustee Berhad (“the Trustee”).
The Fund was launched on 8 May 2007 and will continue its operations until terminated according to the conditions provided in the Deed.
The principal activity of the Fund is to invest in Permitted Investments as defined under the Deed.
All investments will be subject to the Securities Commission‟s (“SC”) Guidelines on Unit Trust Funds, SC requirements, the Deeds, except where exemptions or variations have been approved by the SC, internal policies and procedures and objective of the Fund.
The main objective of the Fund is to maximise total returns through a combination of long term (between 5 – 7 years) growth of capital and current income.
The Manager, a company incorporated in Malaysia, and is a wholly-owned subsidiary of RHB Investment Bank Berhad, effective 6 January 2003. Its principal activities include rendering of investment management services, management of unit trust funds and private retirement schemes and provision of investment advisory services.
These financial statements were authorised for issue by the Manager on 27 February 2018.
19

20
2. SUMMARY OF SIGNIFICANT ACCOUNTING POLICIES
2.1 Basis of preparation of the financial statements
The financial statements have been prepared under the historical cost convention, as modified by financial assets and financial liabilities (including derivative instruments) at fair value through profit or loss, except as disclosed in the summary of significant accounting policies, and in accordance with Malaysian Financial Reporting Standards (“MFRS”) and International Financial Reporting Standards (“IFRS”).
The preparation of financial statements in conformity with MFRS and IFRS requires the use of certain critical accounting estimates and assumptions that affect the reported amounts of assets and liabilities and disclosure of contingent assets and liabilities at the date of the financial statements, and the reported amounts of revenues and expenses during the financial year. It also requires the Manager to exercise its judgement in the process of applying the Fund‟s accounting policies. Although these estimates and judgement are based on the Manager‟s best knowledge of current events and actions, actual results may differ.
(a) The Fund has applied the following amendments for the first time for the financial year beginning on 1 January 2017:
Amendments to MFRS 107 “Statement of Cash Flows – Disclosure Initiative” (effective from 1 January 2017) introduce an additional disclosure on changes in liabilities arising from financing activities.
The adoption of these amendments did not have any impact on the current year or any prior period and is not likely to affect future periods.
20

21
2. SUMMARY OF SIGNIFICANT ACCOUNTING POLICIES (CONTINUED)
2.1 Basis of preparation of the financial statements (continued)
(b) The new standards and amendments to published standards which are relevant to the Fund but not yet effective and have not been early adopted are as follows:
(i) Financial year beginning on/after 1 January 2018
MFRS 9 “Financial Instruments” (effective from 1 January 2018) will replace MFRS 139 “Financial Instruments: Recognition and Measurement”.
MFRS 9 retains but simplifies the mixed measurement model in MFRS 139 and establishes three primary measurement categories for financial assets: amortised cost, fair value through profit or loss and fair value through other comprehensive income (“OCI”). The basis of classification depends on the entity‟s business model and the cash flow characteristics of the financial asset. Investments in equity instruments are always measured at fair value through profit or loss with an irrevocable option at inception to present changes in fair value in OCI (provided the instrument is not held for trading). A debt instrument is measured at amortised cost only if the entity is holding it to collect contractual cash flows and the cash flows represent principal and interest.
For liabilities, the standard retains most of the MFRS 139 requirements. These include amortised cost accounting for most financial liabilities, with bifurcation of embedded derivatives. The main change is that, in cases where the fair value option is taken for financial liabilities, the part of a fair value change due to an entity‟s own credit risk is recorded in other comprehensive income rather than the profit or loss, unless this creates an accounting mismatch.
MFRS 9 introduces an expected credit loss model on impairment that replaces the incurred loss impairment model used in MFRS 139. The expected credit loss model is forward-looking and eliminates the need for a trigger event to have occurred before credit losses are recognised.
The above standards and amendments to published standards are not expected to have a significant impact on the Fund‟s financial statements.
21

22
2. SUMMARY OF SIGNIFICANT ACCOUNTING POLICIES (CONTINUED)
2.2 Financial assets
Classification
Financial assets are designated as fair value through profit or loss when they are managed and their performance evaluated on a fair value basis.
The Fund designates its investments in quoted investments and unquoted fixed income securities as financial assets at fair value through profit or loss at inception.
Loans and receivables are non-derivative financial assets with fixed or determinable payments that are not quoted in an active market and have been included in current assets. The Fund‟s loans and receivables comprise cash and cash equivalents, amount due from stockbroker and amount due from Manager which are all due within 12 months.
Recognition and measurement
Regular purchases and sales of financial assets are recognised on the trade date, the date on which the Fund commits to purchase or sell the asset. Investments are initially recognised at fair value. Subsequent to initial recognition, financial assets at fair value through profit or loss are measured at fair value.
Transaction costs are costs incurred to acquire or dispose financial assets or liabilities at fair value through profit or loss. They include fees and commissions paid to agents, advisors, brokers and dealers. Transaction costs, when incurred, are immediately recognised in profit or loss as expenses.
Financial assets are derecognised when the rights to receive cash flows from the investments have expired or have been transferred and the Fund has transferred substantially all risks and rewards of ownership.
Unrealised losses or gains arising from changes in the fair value of the financial assets at fair value through profit or loss are recognised in profit or loss in the financial year which they arise.
22

23
2. SUMMARY OF SIGNIFICANT ACCOUNTING POLICIES (CONTINUED)
2.2 Financial assets (continued)
Recognition and measurement (continued)
Quoted investments are initially recognised at fair value and subsequently re-measured at fair value based on the market price quoted on the relevant stock exchanges at the close of the business on the valuation day, where the close price falls within the bid-ask spread. In circumtances where the last traded market price isnot within the bid-ask spread, the Manager will determine the point within the bid-ask spread that is most representative of the fair value.
If a valuation based on the market price does not represent the fair value of the securities, for example during abnormal market conditions or when no market price is available, including in the event of a suspension in the quotation of the securities for a period exceeding 14 days, or such shorter period as agreed by the Trustee, then the securities are valued as determined in good faith by the Manager, based on the methods or bases approved by the Trustee after appropriate technical consultation.
Unquoted fixed income securities denominated in Ringgit Malaysia are revalued on a daily basis based on fair value prices quoted by a bond pricing agency (“BPA”) registered with the SC as per the SC Guidelines on Unit Trust Funds. Where such quotations are not available or where the Manager is of the view that the price quoted by the BPA for a specific unquoted fixed income security differs from the market price by more than 20 basis points, the Manager may use the market price, provided that the Manager:
(i) Records its basis for using a non-BPA price; (ii) Obtains necessary internal approvals to use the non-BPA price; and (iii) Keeps an audit trail of all decisions and basis for adopting the market price.
Deposits with a licensed financial institution are stated at cost plus accrued interest calculated on the effective interest method over the period from the date of placement to the date of maturity of the respective deposits, which is a reasonable estimate of fair value due to the short-term nature of the deposits.
Loans and receivables are subsequently carried at amortised cost using the effectiveinterest method.
23

24
2. SUMMARY OF SIGNIFICANT ACCOUNTING POLICIES (CONTINUED)
2.2 Financial assets (continued)
Impairment of financial assets
For assets carried at amortised cost, the Fund assesses at the end of the financial period whether there is objective evidence that a financial asset or group of financial assets is impaired. A financial asset or a group of financial assets is impaired and impairment losses are incurred only if there is objective evidence of impairment as a result of one or more events that occurred after the initial recognition of the asset (a „loss event‟) and that loss event (or events) has an impact on the estimated future cash flows of the financial asset or group of financial assets that can be reliably estimated.
The amount of the loss is measured as the difference between the asset‟s carrying amount and the present value of estimated future cash flows (excluding future credit losses that have not been incurred) discounted at the financial asset‟s original effective interest rate. The carrying amount of the asset is reduced and the amount of the loss is recognised in profit or loss. If „loans and receivables‟ has a variable interest rate, the discount rate for measuring any impairment loss is the current effective interest rate determined under the contract. As a practical expedient, the Fund may measure impairment on the basis of an instrument‟s fair value using an observable market price.
If, in a subsequent period, the amount of the impairment loss decreases and the decrease can be related objectively to an event occurring after the impairment was recognised (such as an improvement in the debtor‟s credit rating), the reversal of the previously recognised impairment loss is recognised in profit or loss. When an asset is uncollectible, it is written off against the related allowance account. Such assets are written off after all the necessary procedures have been completed and the amount of the loss has been determined.
24

25
2. SUMMARY OF SIGNIFICANT ACCOUNTING POLICIES (CONTINUED)
2.3 Financial liabilities
Financial liabilities are classified according to the substance of the contractual arrangements entered into and the definitions of a financial liability.
Financial liabilities, within the scope of MFRS 139 “Financial Instruments: Recognition and Measurement‟‟, are recognised in the statement of financial position when, and only when, the Fund becomes a party to the contractual provisions of the financial instrument.
The Fund‟s financial liabilities which include amount due to Manager, accrued management fee, amount due to Trustee, amount due to stockbrokers and other payables and accruals are recognised initially at fair value plus directly attributable transaction costs and subsequently measured at amortised cost using the effective interest method.
A financial liability is de-recognised when the obligation under the liability is extinguished. Gains and losses are recognised in the profit or loss when the liabilities are de-recognised, and through the amortisation process.
2.4 Unitholders‟ capital
The unitholders‟ contributions to the Fund meet the criteria to be classified as equity instruments under MFRS 132 “Financial Instruments: Presentation”. Those criteria include:
the units entitle the holder to a proportionate share of the Fund‟s net assets value;
the units are the most subordinated class and class features are identical; there is no contractual obligations to deliver cash or another financial asset
other than the obligation on the Fund to repurchase; and the total expected cash flows from the units over its life are based
substantially on the profit or loss of the Fund.
The outstanding units are carried at the redemption amount that is payable at each financial year if unitholder exercises the right to put the unit back to the Fund.
Units are created and cancelled at prices based on the Fund‟s net asset value per unit at the time of creation or cancellation. The Fund‟s net asset value per unit is calculated by dividing the net assets attributable to unitholders with the total number of outstanding units.
25

26
2. SUMMARY OF SIGNIFICANT ACCOUNTING POLICIES (CONTINUED)
2.5 Distribution
Distribution to the Fund‟s unitholders is accounted for as a deduction from realised reserves. A proposed distribution is recognised as a liability in the year in which it is approved by the Trustee.
2.6 Income recognition
Dividend income from quoted investments is recognised when the Fund‟s right to receive payment is established.
Interest income from deposits with licensed financial institutions and unquoted fixed income securities are recognised on an accrual basis using the effective interest method.
Realised gain or loss on sale of quoted investments is arrived at after accounting for cost of investments, determined on the weighted average cost method.
Realised gain or loss on sale of unquoted fixed income securities is measured by the difference between the net disposal proceeds and the carrying amount of investments, adjusted for accretion of discount or amortisation of premium.
2.7 Taxation
Current tax expense is determined according to Malaysian tax laws and includes all taxes based upon the taxable income earned during the financial year.
Tax on dividend income from foreign quoted securities is based on the tax regime of the respective countries that the Fund invests in.
2.8 Cash and cash equivalents
For the purpose of the statement of cash flows, cash and cash equivalents comprise bank balances and deposits with a licensed financial institution which are subject to an insignificant risk of changes in value.
2.9 Amount due from/to stockbrokers
Amounts due from and due to stockbrokers represent receivables for securities sold and payables for securities purchased that have been contracted for but not yet settled or delivered on the date of the statement of financial position respectively.
26

27
2. SUMMARY OF SIGNIFICANT ACCOUNTING POLICIES (CONTINUED)
2.9 Amount due from/to stockbrokers (continued)
These amounts are recognised initially at fair value and subsequently measured at amortised cost using the effective interest method, less impairment for amounts due from stockbrokers. See accounting policy 2.2 on impairment of financial assets.
2.10 Presentation and functional currency
Items included in the financial statements of the Fund are measured using the currency of the primary economic environment in which the Fund operates (the “functional currency”). The financial statements are presented in Ringgit Malaysia(“RM”), which is the Fund‟s presentation and functional currency.
Due to mixed factors in determining the functional currency of the Fund, the Manager has used its judgement to determine the functional currency that most faithfully represents the economic effects of the underlying transactions, events and conditions and have determined the functional currency to be in RM primarily due to the following factors:
The Fund‟s cash is denominated in RM for the purpose of making settlement of the creation and cancellation.
The Fund‟s units are denominated in RM. The Fund‟s significant expenses are denominated in RM.
2.11 Foreign currency translation
Foreign currency transactions are translated into the functional currency using the exchange rates prevailing at the dates of the transactions or valuation where items are remeasured. Foreign exchange gains and losses resulting from the settlement of such transactions and from the translation at period end exchange rates of monetary assets and liabilities denominated in foreign currencies are recognised in profit or loss.
2.12 Segmental information
Operating segments are reported in a manner consistent with the internal reporting used by the chief operating decision-maker. The operating results are regularly reviewed by the Manager and the Investment Committee. The Investment Committee assumes the role of chief operating decision maker, for performance assessment purposes and to make decisions about resources allocated to the investment segment based on the recommendation by the Investment & Security Selection Committee.
27

28
3. FINANCIAL RISK MANAGEMENT OBJECTIVES AND POLICIES
The Fund is exposed to a variety of risks, which include management risk, stock market risk, price risk, interest rate risk, issuer risk, currency risk, credit risk, liquidity risk, individual stock risk, inflation risk, non-compliance risk and capital risk.
Financial risk management is carried out through internal control processes adopted by the Manager and adherence to the investment restrictions as stipulated in the SC Guidelines on Unit Trust Funds.
(a) Management risk
Poor management of the Fund may jeopardise the investment of each unitholder. Therefore, it is important for the Manager to set the investment policies and appropriate strategies to be in line with the investment objective before any investment activities can be considered. However, there can be no guarantee that these measures will produce the desired results.
(b) Stock market risk
The value of the Fund‟s investments is subject to the fluctuations of the markets it invests in and the performance of those investments. The risk is managed through portfolio diversification whereby investments are diversified in a portfolio of securities from different market sectors. The risk is also managed via asset allocation whereby the equity exposure will be reduced in the event of an anticipated weakness in the stock market.
28
29
3. FINANCIAL RISK MANAGEMENT OBJECTIVES AND POLICIES (CONTINUED)
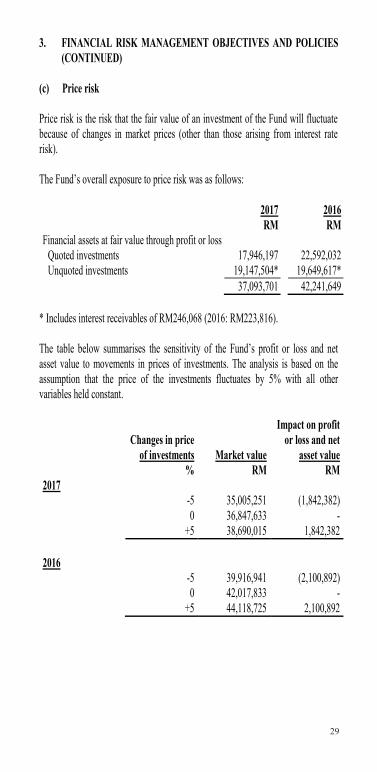
(c) Price risk
Price risk is the risk that the fair value of an investment of the Fund will fluctuate because of changes in market prices (other than those arising from interest rate risk).
The Fund‟s overall exposure to price risk was as follows:
2017 2016RM RM
Financial assets at fair value through profit or lossQuoted investments 17,946,197 22,592,032Unquoted investments 19,147,504* 19,649,617*
37,093,701 42,241,649
* Includes interest receivables of RM246,068 (2016: RM223,816).
The table below summarises the sensitivity of the Fund‟s profit or loss and net asset value to movements in prices of investments. The analysis is based on the assumption that the price of the investments fluctuates by 5% with all other variables held constant.
Changes in price of investments Market value
Impact on profit or loss and net
asset value% RM RM
2017-5 35,005,251 (1,842,382)0 36,847,633 -
+5 38,690,015 1,842,382
2016-5 39,916,941 (2,100,892)0 42,017,833 -
+5 44,118,725 2,100,892
29

30
3. FINANCIAL RISK MANAGEMENT OBJECTIVES AND POLICIES (CONTINUED)
(d) Interest rate risk
In general, when interest rates rise, unquoted fixed income securities prices will tend to fall and vice versa. Therefore, the net asset value of the Fund may also tend to fall when interest rates rise or are expected to rise. However, investors should be aware that should the Fund hold unquoted fixed income securities till maturity, such price fluctuations would dissipate as it approaches maturity, and thus the growth of the net asset value shall not be affected at maturity. In order to mitigate interest rates exposure of the Fund, the Manager will manage the duration of the portfolio via shorter or longer tenured assets depending on the view of the future interest rate trend of the Manager, which is based on its continuous fundamental research and analysis.
This risk is crucial since unquoted fixed income securities portfolio management depends on forecasting interest rate movements. Prices of unquoted fixed income securities move inversely to interest rate movements, therefore as interest rates rise, the prices of unquoted fixed income securities decrease and vice versa. Furthermore, unquoted fixed income securities with longer maturity and lower yield coupon rates are more susceptible to interest rate movements.
Investors should note that unquoted investments in fixed income securities (such as the bonds held by the Fund) and money market instruments are subject to interest rate fluctuations. Such investments may be subject to unanticipated rise in interest rates which may impair the ability of the issuers to make payments of interest income and principal, especially if the issuers are highly leveraged. An increase in interest rates may therefore increase the potential of default by an issuer.
The table below summarises the sensitivity of the Fund‟s profit or loss and net asset value to movements in prices of unquoted investments held by the Fund as a result of movement in interest rate. The analysis is based on the assumptions that the interest rate increased and decreased by 1% with all other variables held constant.
% Change in interest rateImpact on profit
or loss and net asset value
2017 2016RM RM
+1% (51,912) (62,745)- 1% 52,505 62,499
The Fund‟s indirect exposure to interest rate risk arising from investment in money market instruments is expected to be minimal as the Fund‟s investments comprise mainly short term deposits with approved licensed financial institutions.
30

31
3. FINANCIAL RISK MANAGEMENT OBJECTIVES AND POLICIES (CONTINUED)
(e) Issuer risk
The value of each individual unquoted fixed income security that a unit trust fund invests in may decline for a number of reasons which is directly related to the issuer, such as, the management performance, financial leverage and reduced demand for the issuer‟s goods or services. The Manager aims to reduce these risks by using diversification that is expected to reduce the volatility as well as the risk for the Fund‟s portfolio.
(f) Currency risk
Currency risk is associated with financial instruments that are quoted and/or priced in foreign currency denomination. Malaysian based investor should be aware that if the Ringgit Malaysia appreciates against the currencies in which the portfolio of the investment is denominated, this will have an adverse effect on the net asset value of the fund and vice versa. Investors should note any gains or losses arising from the movement of foreign currencies against its home currency may therefore increase or decrease the capital gains of the financial instruments. Nevertheless, investors should realise that currency risk is considered as one of the major risks to financial instruments in foreign assets due to the volatile nature of the foreign exchange market.
The Fund did not have any significant financial liabilities denominated in foreign currencies as at the reporting date. The following table indicates the currencies to which the Fund had significant exposure at the reporting date on its financial assets. The analysis calculates the effect of a reasonably possible movement of each foreign currency rate against Ringgit Malaysia on equity and on income with all other variables held constant.
31

32
3. FINANCIAL RISK MANAGEMENT OBJECTIVES AND POLICIES (CONTINUED)
(f) Currency risk (continued)
The following table sets out the foreign currency risk concentrations of the Fund:
Financial assets at
fair value through profit or
loss
Cash and cash
equivalents
Amount due from
stockbroker
Amount due to
stockbroker TotalRM RM RM RM RM
2017HKD 10,367,710 - - (117,253) 10,250,457TWD 4,972,011 332,312 - - 5,304323USD 2,606,476 114,249 - - 2,720,725
17,946,197 446,561 - (117,253) 18,275,505
2016HKD 14,677,483 - 209,781 (92,547) 14,794,717TWD 5,775,338 19,513 - - 5,794,851USD 2,139,211 1,364,058 - - 3,503,269
22,592,032 1,383,571 209,781 (92,547) 24,092,837
The table below summarises the sensitivity of the Fund's profit or loss and net asset value to changes in foreign exchange movements at the end of each reporting year. The analysis is based on the assumption that the foreign exchange rate fluctuates by 5%, with all other variables remain constants. This represents management's best estimate of a reasonable possible shift in the foreign exchange rate, having regard to historical volatility of this rate. Disclosures below are shown in absolute terms, changes and impacts could be positive or negative.
32

33
3. FINANCIAL RISK MANAGEMENT OBJECTIVES AND POLICIES (CONTINUED)
(f) Currency risk (continued)
Change in foreign
exchange rate
Impact on profitor loss and
net asset value% RM
2017HKD 5 512,523 TWD 5 265,216 USD 5 136,036
913,775
2016HKD 5 739,736TWD 5 289,743USD 5 175,163
1,204,642
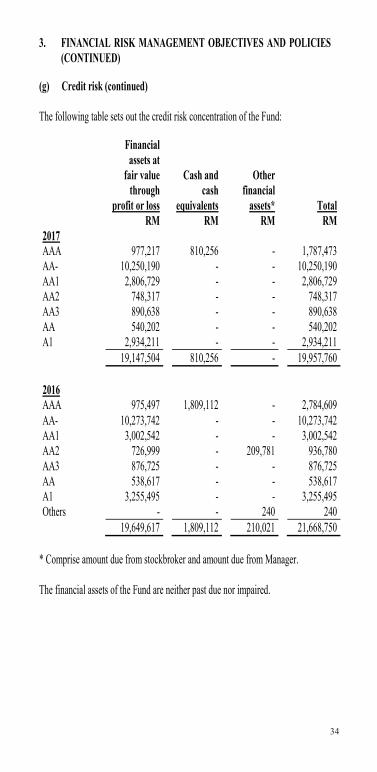
(g) Credit risk
Credit risk refers to the possibility that the issuer of a particular investment will not be able to make timely or full payments of principal or income due on that investment. Credit risk arising from unquoted investments can be managed by performing continuous fundamental credit research and analysis to ascertain the creditworthiness of its issuer. In addition, the Manager imposes a minimum rating requirement as rated by either local and/or foreign rating agencies and manages the duration of the investment in accordance with the objective of the Fund.
Credit risk arising from placements of deposits in licensed financial institutions is managed by ensuring that the Fund will only place deposits in reputable licensed financial institutions. The settlement terms of the proceeds from the creation of units receivable from the Manager are governed by the SC Guidelines on Unit Trust Funds.
33
34
3. FINANCIAL RISK MANAGEMENT OBJECTIVES AND POLICIES (CONTINUED)
(g) Credit risk (continued)
The following table sets out the credit risk concentration of the Fund:
Financialassets at
fair valuethrough
profit or loss
Cash andcash
equivalents
Otherfinancial
assets* TotalRM RM RM RM
2017AAA 977,217 810,256 - 1,787,473AA- 10,250,190 - - 10,250,190AA1 2,806,729 - - 2,806,729AA2 748,317 - - 748,317AA3 890,638 - - 890,638AA 540,202 - - 540,202A1 2,934,211 - - 2,934,211
19,147,504 810,256 - 19,957,760
2016AAA 975,497 1,809,112 - 2,784,609AA- 10,273,742 - - 10,273,742AA1 3,002,542 - - 3,002,542AA2 726,999 - 209,781 936,780AA3 876,725 - - 876,725AA 538,617 - - 538,617A1 3,255,495 - - 3,255,495Others - - 240 240
19,649,617 1,809,112 210,021 21,668,750
* Comprise amount due from stockbroker and amount due from Manager. The financial assets of the Fund are neither past due nor impaired.
34

35
3. FINANCIAL RISK MANAGEMENT OBJECTIVES AND POLICIES (CONTINUED)
(h) Liquidity risk
Liquidity risk is the risk that the Fund will encounter difficulty in meeting its financial obligations.
Liquidity risk exists when particular investments are difficult to sell, possibly preventing a unit trust fund from selling such illiquid securities at an advantageous time or price. Unit trust funds with principal investment strategies that involve securities or securities with substantial market and/or credit risk tend to have the greater exposure to liquidity risk. As part of its risk management, the Manager will attempt to manage the liquidity of the Fund through asset allocation and diversification strategies within the portfolio. The Manager will also conduct constant fundamental research and analysis to forecast future liquidity of its investments.
The table below summarises the Fund‟s financial liabilities into relevant maturity groupings based on the remaining year from the statement of financial position date to the contractual maturity date. The amounts in the table are the contractual undiscounted cash flows.
Less than 1 month
Between 1 month to 1 year
RM RM2017Amount due to stockbroker 117,253 -Amount due to Manager 12,512 -Accrued management fee 61,781 -Amount due to Trustee 2,059 -Other payables and accruals - 16,298
193,605 16,298
2016Amount due to stockbroker 92,547 -Amount due to Manager 53,828 -Accrued management fee 71,512 -Amount due to Trustee 2,384 -Other payables and accruals - 20,311
220,271 20,311
35

36
3. FINANCIAL RISK MANAGEMENT OBJECTIVES AND POLICIES (CONTINUED)
(i) Individual stock risk
The performance of each individual stock that a unit trust fund invests is dependent upon the management quality of the particular company and its growth potential. Hence, this would have an impact on the unit trust fund‟s prices and its dividend income. The Manager aims to reduce all these risks by using diversification that is expected to reduce the volatility as well as the risk for the Fund‟s portfolio. In addition, the Manager will also perform continuous fundamental research and analysis to aid its active asset allocation management especially in its stock selection process.
(j) Inflation risk
Inflation reduces purchasing power of money. In an inflationary environment, fixed rate securities are exposed to higher inflation risks than inflation-linked securities. This risk can be minimised by investing in securities that can provide positive real rate of return. (k) Non-compliance risk
This is the risk of the Manager not complying with the internal policies, the Deeds of the Fund, all applicable laws or guidelines issued by the regulators. This may occur as a result of system failure or the inadvertence of the Manager. The magnitude of such risk and its impact on the Fund and/or unitholders are dependent on the nature and severity of the non-compliance. Non-compliance may adversely affect the Fund especially if the investment of the Fund has to be disposed at a lower price to rectify the non-compliance.
(l) Capital risk
The capital of the Fund is represented by equity consisting of unitholders‟ capital of RM106,099,552 (2016: RM118,099,054) and accumulated losses of RM68,405,498 (2016: RM74,078,854). The amount of equity can change significantly on a daily basis as the Fund is subject to daily subscriptions and redemptions at the discretion of unitholders. The Fund‟s objective when managing capital is to safeguard the Fund‟s ability to continue as a going concern in order to provide returns for unitholders and benefits for other stakeholders and to maintain a strong capital base to support the development of the investment activities of the Fund.
36

37
4. FAIR VALUE ESTIMATION
Fair value is defined as the price that would be received to sell an asset or paid to transfer a liability in an orderly transaction between market participants at the measurement date (i.e. an exit price).
The fair value of financial assets and financial liabilities traded in active market (such as publicly traded derivatives and trading securities) are based on quoted market prices at the close of trading on the financial period end date.
An active market is a market in which transactions for the asset or liability take place with sufficient frequency and volume to provide pricing information on an ongoing basis.
The fair value of financial assets that are not traded in an active market is determined by using valuation techniques. The Fund uses a variety of methods and makes assumptions that are based on market conditions existing at each period end date.
Valuation techniques used for non-standardised financial instruments such as options, currency swaps and other over-the-counter derivatives, include the use of comparable recent transactions, reference to other instruments that are substantially the same, discounted cash flow analysis, option pricing models and other valuation techniques commonly used by market participants making the maximum use of market inputs and relying as little as possible on entity-specific inputs.
For instruments for which there is no active market, the Fund may use internally developed models, which are usually based on valuation methods and techniques generally recognised as standard within the industry. Valuation models are used primarily to value unlisted equities, debt securities and other debt instruments for which market were or have been inactive during the financial period. Some of the inputs to these models may not be market observable and are therefore estimated based on assumptions.
The output of a model is always an estimate or approximation of a value that cannot be determined with certainty, and valuation techniques employed may not fully reflect all factors relevant to the positions the Fund holds.
Valuations are therefore adjusted, where appropriate, to allow for additional factors including model risk, liquidity risk and counterparty risk.
37
38
4. FAIR VALUE ESTIMATION (CONTINUED)
The fair values are based on the following methodologies and assumptions:
(i) For bank balances, deposits and placements with a financial institution with maturities less than 1 year, the carrying value is a reasonable estimate of fair value.
(ii) The carrying value of receivables and payables are assumed to approximate their fair values due to their short term nature.
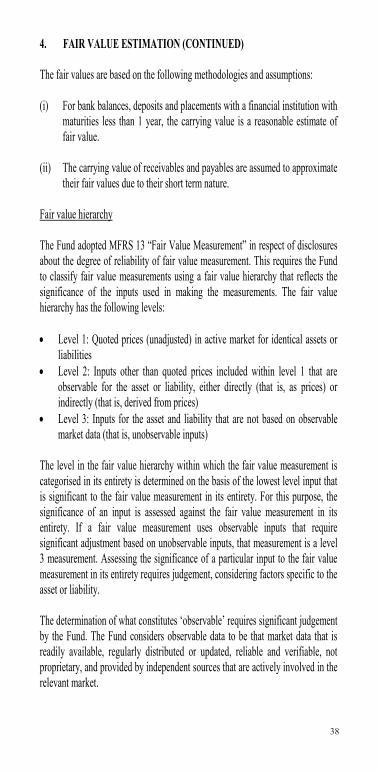
Fair value hierarchy
The Fund adopted MFRS 13 “Fair Value Measurement” in respect of disclosures about the degree of reliability of fair value measurement. This requires the Fund to classify fair value measurements using a fair value hierarchy that reflects the significance of the inputs used in making the measurements. The fair value hierarchy has the following levels:
Level 1: Quoted prices (unadjusted) in active market for identical assets or liabilities
Level 2: Inputs other than quoted prices included within level 1 that are observable for the asset or liability, either directly (that is, as prices) or indirectly (that is, derived from prices)
Level 3: Inputs for the asset and liability that are not based on observable market data (that is, unobservable inputs)
The level in the fair value hierarchy within which the fair value measurement is categorised in its entirety is determined on the basis of the lowest level input that is significant to the fair value measurement in its entirety. For this purpose, the significance of an input is assessed against the fair value measurement in its entirety. If a fair value measurement uses observable inputs that require significant adjustment based on unobservable inputs, that measurement is a level 3 measurement. Assessing the significance of a particular input to the fair value measurement in its entirety requires judgement, considering factors specific to the asset or liability.
The determination of what constitutes „observable‟ requires significant judgement by the Fund. The Fund considers observable data to be that market data that is readily available, regularly distributed or updated, reliable and verifiable, not proprietary, and provided by independent sources that are actively involved in the relevant market.
38

39
4. FAIR VALUE ESTIMATION (CONTINUED)
Fair value hierarchy (continued)
The following table analyses within the fair value hierarchy the Fund‟s financial assets (by class) measured at fair value:
Level 1 Level 2 Level 3 TotalRM RM RM RM
2017Financial assets at fair
value through profit or loss
- Quoted investments 17,946,197 - - 17,946,197- Unquoted investments - 19,147,504 - 19,147,504
17,946,197 19,147,504 - 37,093,701
2016Financial assets at fair
value through profit or loss
- Quoted investments 22,592,032 - - 22,592,032- Unquoted investments - 19,649,617 - 19,649,617
22,592,032 19,649,617 - 42,241,649
Investments in active listed equities, i.e. quoted investments whose values are based on quoted market prices in active markets are classified within Level 1. The Fund does not adjust the quoted prices for these instruments.
Financial instruments that trade in markets that are considered to be active but are valued based on quoted market prices, dealer quotations or alternative pricing sources supported by observable inputs are classified within Level 2. This includes unquoted fixed income investments. As Level 2 instruments include positions that are not traded in active markets and/or are subject to transfer restrictions, valuations may be adjusted to reflect illiquidity and/or non-transferability, which are generally based on available market information. The Fund‟s policies on valuation of these financial assets are stated in Note 2.2.
39

40
5. FINANCIAL ASSETS AT FAIR VALUE THROUGH PROFIT OR LOSS
2017 2016RM RM
Financial assets designated as FVTPL:Quoted investments – foreign 17,946,197 22,592,032Unquoted investments – local 19,147,504 19,649,617
37,093,701 42,241,649
2017 2016RM RM
Net gain on financial assets at FVTPL comprised:- net realised gain on sale of financial assets at FVTPL 3,575,706 2,516,479- net unrealised gain/(loss) on changes in fair value 1,731,999 (2,150,606)
5,307,705 365,873
Financial assets designated as FVTPL as at 31 December 2017 are as follows:
Name of Counter Quantity Cost
Fair valueas at
31.12.2017
Fair value as at 31.12.2017expressed as a percentage
of value ofthe Fund
RM RM %QUOTED INVESTMENTS –
FOREIGN
HONG KONG ConstructionChina Railway Construction
Corporation-H
37,500 247,485 175,787 0.47
Consumer ProductsBrilliance China Automotive
Holdings Ltd 12,000 56,365 129,764 0.34I-Cable Communications Ltd 5,619 832 666 0.01
57,197 130,430 0.35
FinanceAgricultural Bank of China
Ltd 215,000 422,829 404,917 1.07AIA Group Ltd 27,600 580,009 951,778 2.53Bank of China Holdings Ltd 79,000 166,669 156,958 0.42
40

41
5. FINANCIAL ASSETS AT FAIR VALUE THROUGH PROFIT OR LOSS (CONTINUED)
Financial assets designated as FVTPL as at 31 December 2017 are as follows: (continued)
Name of Counter Quantity Cost
Fair valueas at
31.12.2017
Fair value as at 31.12.2017expressed as a percentage
of value ofthe Fund
RM RM %QUOTED INVESTMENTS –
FOREIGN (CONTINUED)
HONG KONG (CONTINUED)Finance (continued)BOC Hong Kong Holdings
Ltd 7,000 125,183 143,423 0.38China Construction Banking
– Holdings 270,000 718,771 1,005,826 2.67China Pacific Insurance
(GR) CO-H 7,000 134,863 135,999 0.36Hong Kong Exchanges &
Clearing Ltd 2,000 204,622 248,145 0.66Ping An Insurance Group
Company Ltd - Holdings 31,000 446,852 1,304,805 3.462,799,798 4,351,851 11.55
Industrial ProductsChina Resources Cement
Holdings Ltd 50,000 111,362 132,972 0.35China Resources Gas Group
Ltd 10,000 153,073 146,683 0.39264,435 279,655 0.74
PropertiesCheung Kong Hutchison
Holdings Ltd 5,180 283,058 262,921 0.70Sun Hung Kai Properties Ltd 5,000 363,179 337,345 0.89Wheelock And Company Ltd 8,000 255,865 230,967 0.61
902,102 831,233 2.20
41

42
5. FINANCIAL ASSETS AT FAIR VALUE THROUGH PROFIT OR LOSS (CONTINUED)
Financial assets designated as FVTPL as at 31 December 2017 are as follows: (continued)
Name of Counter Quantity Cost
Fair valueas at
31.12.2017
Fair value as at 31.12.2017expressed as a percentage
of value ofthe Fund
RM RM %QUOTED INVESTMENTS –
FOREIGN (CONTINUED)
HONG KONG (CONTINUED)TechnologyAAC Technologies Holdings
Incorporation 2,000 75,687 144,251 0.38Tencent Holdings Ltd 13,000 1,054,318 2,730,837 7.25
1,130,005 2,875,088 7.63
Trading/ServicesChina Mobile Ltd 14,000 646,022 574,055 1.52Cnooc Ltd 20,000 117,503 116,104 0.31Petrochina Company Ltd –
Holdings 230,000 816,682 648,561 1.72Shenzhou International
Group 10,000 318,913 384,946 1.021,899,120 1,723,666 4.57
TOTAL HONG KONG 7,300,142 10,367,710 27.51
42

43
5. FINANCIAL ASSETS AT FAIR VALUE THROUGH PROFIT OR LOSS (CONTINUED)
Financial assets designated as FVTPL as at 31 December 2017 are as follows: (continued)
Name of Counter Quantity Cost
Fair valueas at
31.12.2017
Fair value as at 31.12.2017expressed as a percentage
of value ofthe Fund
RM RM %QUOTED INVESTMENTS –
FOREIGN (CONTINUED)
TAIWANExchange-Traded FundYuanta/P-Shares Taiwan Top
50 ETF
24,000 254,267 269,320 0.71
FinanceFubon Financial Holding –
Preference Shares
4,397
31,632
38,260 0.10Fubon Financial Holding
Company Ltd 100,000 393,807 692,562 1.84425,439 730,822 1.94
TechnologyAdvanced Semiconductor
Engineering Incorporation 82,498 270,864 429,921 1.14Hon Hai Precision Industry
Company Ltd 36,700 252,179 477,259 1.27Largan Precision Company
Ltd 1,500 462,485 823,698 2.19Novatek Microelectronics
Ltd 3,000 45,570 46,512 0.12Taiwan Semiconductor
Manufacturing Company Ltd 70,000 513,814 2,194,479 5.821,544,912 3,971,869 10.54
TOTAL TAIWAN 2,224,618 4,972,011 13.19
43

44
5. FINANCIAL ASSETS AT FAIR VALUE THROUGH PROFIT OR LOSS (CONTINUED)
Financial assets designated as FVTPL as at 31 December 2017 are as follows: (continued)
Name of Counter Quantity Cost
Fair valueas at
31.12.2017
Fair value as at 31.12.2017expressed as a percentage
of value ofthe Fund
RM RM %QUOTED INVESTMENTS
– FOREIGN (CONTINUED)
UNITED STATES TechnologyAlibaba Group
Holding Ltd 2,800 922,799 1,958,205 5.19Baidu Incorporation 400 272,832 379,973 1.01
1,195,631 2,338,178 6.20
Trading/ServicesCTRIP.com
International Ltd -ADR
1,500 291,393 268,298 0.71
TOTAL UNITED STATES 1,487,024 2,606,476 6.91
TOTAL QUOTED INVESTMENTS –FOREIGN 11,011,784 17,946,197 47.61
44
45
5. FINANCIAL ASSETS AT FAIR VALUE THROUGH PROFIT OR LOSS (CONTINUED)
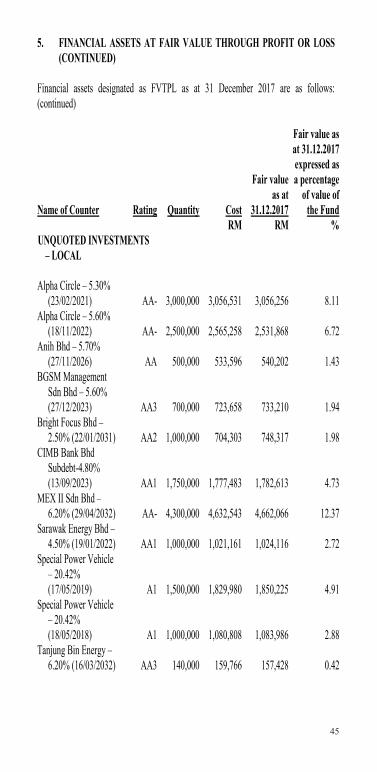
Financial assets designated as FVTPL as at 31 December 2017 are as follows: (continued)
Name of Counter Rating Quantity Cost
Fair valueas at
31.12.2017
Fair value as at 31.12.2017expressed as a percentage
of value ofthe Fund
RM RM %UNQUOTED INVESTMENTS
– LOCAL
Alpha Circle – 5.30% (23/02/2021) AA- 3,000,000 3,056,531 3,056,256 8.11
Alpha Circle – 5.60% (18/11/2022) AA- 2,500,000 2,565,258 2,531,868 6.72
Anih Bhd – 5.70% (27/11/2026) AA 500,000 533,596 540,202 1.43
BGSM Management Sdn Bhd – 5.60% (27/12/2023) AA3 700,000 723,658 733,210 1.94
Bright Focus Bhd –2.50% (22/01/2031) AA2 1,000,000 704,303 748,317 1.98
CIMB Bank Bhd Subdebt-4.80% (13/09/2023) AA1 1,750,000 1,777,483 1,782,613 4.73
MEX II Sdn Bhd –6.20% (29/04/2032) AA- 4,300,000 4,632,543 4,662,066 12.37
Sarawak Energy Bhd –4.50% (19/01/2022) AA1 1,000,000 1,021,161 1,024,116 2.72
Special Power Vehicle – 20.42% (17/05/2019) A1 1,500,000 1,829,980 1,850,225 4.91
Special Power Vehicle – 20.42% (18/05/2018) A1 1,000,000 1,080,808 1,083,986 2.88
Tanjung Bin Energy –6.20% (16/03/2032) AA3 140,000 159,766 157,428 0.42
45

46
5. FINANCIAL ASSETS AT FAIR VALUE THROUGH PROFIT OR LOSS (CONTINUED)
Financial assets designated as FVTPL as at 31 December 2017 are as follows: (continued)
Name of Counter Rating Quantity Cost
Fair valueas at
31.12.2017
Fair value as at 31.12.2017expressed as a percentage
of value ofthe Fund
RM RM %UNQUOTED INVESTMENTS
– LOCAL (CONTINUED)
TNB Northern Energy – 4.83% (29/05/2036) AAA 1,000,000 984,010 977,217 2.59
TOTAL UNQUOTED INVESTMENTS – LOCAL 19,069,097 19,147,504 50.80
TOTAL INVESTMENTS 30,080,881 37,093,701 98.41
ACCUMULATED UNREALISED GAIN 7,012,820
TOTAL FINANCIAL ASSETS AT FVTPL 37,093,701
46

47
5. FINANCIAL ASSETS AT FAIR VALUE THROUGH PROFIT OR LOSS (CONTINUED)
Financial assets designated as FVTPL as at 31 December 2016 are as follows: (continued)
Name of Counter Quantity Cost
Fair valueas at
31.12.2016
Fair value as at 31.12.2016 expressed as a percentage
of value ofthe Fund
RM RM %QUOTED INVESTMENTS –
FOREIGN
HONG KONG Consumer ProductsBrilliance China Automotive
Holdings Ltd 78,000 366,369 481,997 1.10China Mengniu Dairy
Company Ltd 20,000 181,556 172,886 0.39547,925 654,883 1.49
FinanceAIA Group Ltd 20,000 342,325 506,275 1.15Bank of China Holdings Ltd 150,000 294,115 298,558 0.68China Construction Banking
– Holdings 340,000 905,119 1,174,442 2.67China Taiping Insurance
Holdings Ltd 45,000 393,750 416,592 0.95Dah Sing Financial Holdings
Ltd 36,000 938,183 1,092,512 2.48Hong Kong Exchanges &
Clearing Ltd 2,000 189,328 211,999 0.48Huatai Securities Company
Ltd 28,000 240,721 239,772 0.54Industrial & Commercial
Bank of China - Holdings 150,000 326,403 403,573 0.92Ping An Insurance Group
Company Ltd - Holdings 45,000 648,656 1,010,236 2.294,278,600 5,353,959 12.16
47

48
5. FINANCIAL ASSETS AT FAIR VALUE THROUGH PROFIT OR LOSS (CONTINUED)
Financial assets designated as FVTPL as at 31 December 2016 are as follows: (continued)
Name of Counter Quantity Cost
Fair valueas at
31.12.2016
Fair value asat 31.12.2016expressed as a percentage
of value ofthe Fund
RM RM %QUOTED INVESTMENTS –
FOREIGN (CONTINUED)
HONG KONG (CONTINUED)Industrial ProductsChina Oilfield Services
Ltd 80,000 350,466 333,274 0.76China Petroleum &
chemical Corporation 100,000 292,323 318,230 0.72Techtronic Industries
Company Ltd 26,000 423,780 418,212 0.951,066,569 1,069,716 2.43
PropertiesCheung Kong Hutchison
Holdings Ltd 180 6,247 9,155 0.02Henderson Land
Development Company Ltd 17,700 379,951 422,450 0.96
386,198 431,605 0.98
TechnologyAAC Technologies
Holdings Incorporation 12,000 425,509 489,148 1.10China Longyuan Power
Group Company Ltd 100,000 334,901 350,632 0.80Tencent Holdings Ltd 22,000 1,784,230 2,414,729 5.49
2,544,640 3,254,509 7.39
48

49
5. FINANCIAL ASSETS AT FAIR VALUE THROUGH PROFIT OR LOSS (CONTINUED)
Financial assets designated as FVTPL as at 31 December 2016 are as follows: (continued)
Name of Counter Quantity Cost
Fair valueas at
31.12.2016
Fair value as at 31.12.2016expressed as a percentage
of value ofthe Fund
RM RM %QUOTED INVESTMENTS –
FOREIGN (CONTINUED)
HONG KONG (CONTINUED)Trading/ServicesBYD Company Ltd -
Holdings 22,000 588,641 519,988 1.18China Mobile Ltd 22,000 1,015,178 1,046,340 2.38China Resources Phoenix
Health Holdings Company Ltd 50,000 288,431 286,986 0.65
China Unicom Hong Kong Ltd 60,000 302,690 313,485 0.71
Li & Fung Ltd 90,000 186,687 177,572 0.41Orient Overseas
International Ltd 17,000 304,847 316,234 0.72Petrochina Company Ltd –
Holdings 290,000 1,029,730 969,849 2.20Sands China Ltd 5,000 71,260 97,494 0.22Sinopharm Medicine
Holdings Company Ltd 10,000 204,727 184,863 0.423,992,191 3,912,811 8.89
TOTAL HONG KONG 12,816,123 14,677,483 33.34
49

50
5. FINANCIAL ASSETS AT FAIR VALUE THROUGH PROFIT OR LOSS (CONTINUED)
Financial assets designated as FVTPL as at 31 December 2016 are as follows: (continued)
Name of Counter Quantity Cost
Fair valueas at
31.12.2016
Fair value as at 31.12.2016expressed as a percentage
of value ofthe Fund
RM RM %QUOTED INVESTMENTS –
FOREIGN (CONTINUED)
TAIWANFinanceFubon Financial Holding –
Preference Shares 4,397 31,632 37,669 0.09Fubon Financial Holding
Co Ltd 100,000 393,807 705,840 1.60425,439 743,509 1.69
TechnologyAdvanced Semiconductor
Engineering Incorporation 80,000 258,424 365,930 0.83Hon Hai Precision Industry
Company Ltd 51,700 355,250 602,475 1.37Largan Precision Company
Ltd 2,000 616,646 1,049,072 2.38Taiwan Semiconductor
Manufacturing Company Ltd 120,000 880,824 3,014,352 6.85
2,111,144 5,031,829 11.43
TOTAL TAIWAN 2,536,583 5,775,338 13.12
UNITED STATESTechnologyBaidu Incorporation 800 545,663 589,377 1.34Alibaba Group Holding Ltd 2,800 922,799 1,101,734 2.50
1,468,462 1,691,111 3.84
50
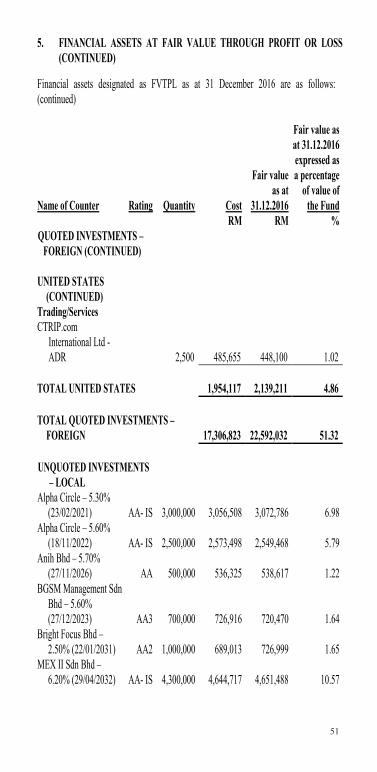
51
5. FINANCIAL ASSETS AT FAIR VALUE THROUGH PROFIT OR LOSS (CONTINUED)
Financial assets designated as FVTPL as at 31 December 2016 are as follows: (continued)
Name of Counter Rating Quantity Cost
Fair valueas at
31.12.2016
Fair value as at 31.12.2016expressed as a percentage
of value ofthe Fund
RM RM %QUOTED INVESTMENTS –
FOREIGN (CONTINUED)
UNITED STATES (CONTINUED)
Trading/ServicesCTRIP.com
International Ltd -ADR 2,500 485,655 448,100 1.02
TOTAL UNITED STATES 1,954,117 2,139,211 4.86
TOTAL QUOTED INVESTMENTS –FOREIGN 17,306,823 22,592,032 51.32
UNQUOTED INVESTMENTS – LOCAL
Alpha Circle – 5.30% (23/02/2021) AA- IS 3,000,000 3,056,508 3,072,786 6.98
Alpha Circle – 5.60% (18/11/2022) AA- IS 2,500,000 2,573,498 2,549,468 5.79
Anih Bhd – 5.70% (27/11/2026) AA 500,000 536,325 538,617 1.22
BGSM Management Sdn Bhd – 5.60% (27/12/2023) AA3 700,000 726,916 720,470 1.64
Bright Focus Bhd –2.50% (22/01/2031) AA2 1,000,000 689,013 726,999 1.65
MEX II Sdn Bhd –6.20% (29/04/2032) AA- IS 4,300,000 4,644,717 4,651,488 10.57
51

52
5. FINANCIAL ASSETS AT FAIR VALUE THROUGH PROFIT OR LOSS (CONTINUED)
Financial assets designated as FVTPL as at 31 December 2016 are as follows: (continued)
Name of Counter Rating Quantity Cost
Fair valueas at
31.12.2016
Fair value as at
31.12.2016expressed
as a percentage of value of
the FundRM RM %
UNQUOTED INVESTMENTS – LOCAL (CONTINUED)
Sarawak Energy Bhd –4.50% (19/01/2022) AA1 1,000,000 1,021,326 1,016,706 2.31
Special Power Vehicle –20.42% (17/05/2019) A1 1,500,000 2,028,868 2,031,009 4.61
Special Power Vehicle –20.42% (18/05/2018) A1 1,000,000 1,223,707 1,224,486 2.78
Tanjung Bin Energy –6.20% (16/03/2032) AA3 140,000 160,562 156,255 0.36
TNB Northern Energy –4.83% (29/05/2036) AAA 1,000,000 983,351 975,497 2.22
YTL Power International – 4.55% (10/06/2022) AA1 2,000,000 2,009,214 1,985,836 4.51
TOTAL UNQUOTED INVESTMENTS – LOCAL 19,654,005 19,649,617 44.64
TOTAL INVESTMENTS 36,960,828 42,241,649 95.96
ACCUMULATED UNREALISED GAIN 5,280,821
TOTAL FINANCIAL ASSETS AT FVTPL 42,241,649
52

53
6. CASH AND CASH EQUIVALENTS
2017 2016RM RM
Deposits with a licensed financial institution 360,142 420,194Bank balances 450,114 1,388,918
810,256 1,809,112
Deposits with a licensed financial institution include interest receivable of RM112 (2016: RM92).
2017 2016RM RM
Weighted average rate of return 3.80% 4.00%
Average maturity 2 days 3 days
7. OTHER PAYABLES AND ACCRUALS
2017 2016RM RM
Audit fee payable 6,650 6,300Tax agent's fee payable 3,000 3,200Sundry payables and accruals 6,404 10,500GST payable 244 311
16,298 20,311
8. UNITS IN CIRCULATION
2017 2016Units Units
At the beginning of the financial year 91,955,000 102,981,000Creation of units during the financial year:
Arising from applications 10,845,000 1,684,504Arising from distribution - 6,473,496
Cancellation of units during the financial year (33,546,000) (19,184,000)At the end of the financial year 69,254,000 91,955,000
53

54
9. INTEREST INCOME
2017 2016RM RM
Interest income from unquoted investments 1,043,163 802,352Interest income from deposits with a licensed
financial institution 13,880 73,2861,057,043 875,638
10. MANAGER‟S FEE
In accordance with the Deed, the Manager shall be entitled to a fee at a rate agreed between the Manager and the Trustee which the rate shall not exceed 1.80% per annum of the net asset value of the Fund, calculated on a daily basis.
The management fee provided in the financial statements is 1.80% (2016: 1.80%) per annum based on the net asset value of the Fund, calculated on a daily basis for the financial year.
There will be no further liability to the Manager in respect of management fee other than the amount recognised above.
11. TRUSTEE‟S FEE
In accordance with the Deed, the Trustee shall be entitled to a fee at a rate agreed between the Manager and the Trustee which the rate shall not exceed 0.08% per annum of the net asset value, calculated on a daily basis.
The Trustee‟s fee provided in the financial statements is 0.06% (2016: 0.06%) per annum based on the net asset value of the Fund, calculated on a daily basis for the financial year.
There will be no further liability to the Trustee in respect of Trustee fee other than the amount recognised above.
54

55
12. TAXATION
(a) Tax charge for the financial year
2017 2016RM RM
Current taxation - foreign 55,975 55,161
(b) Numerical reconciliation of income tax expense
The numerical reconciliation between the profit before taxation multiplied by the Malaysian statutory income tax rate and the tax expense of the Fund is as follows:
2017 2016RM RM
Profit before taxation 5,729,331 624,954
Tax calculated at a tax rate of 24% 1,375,039 149,989Tax effects of:- Investment income not subject to tax (1,616,868) (470,153)- Expenses not deductible for tax purposes 39,706 118,963- Restriction on tax deductible expenses for unit
trust funds 202,123 201,201- Foreign tax in other countries 55,975 55,161Tax expense 55,975 55,161
55

56
13. DISTRIBUTION
Distribution to unitholders for the financial year ended 31 December 2016 is from the following sources:
2016RM
Prior financial year’s realised gain 3,194,183Less: Expenses (112,799)Distributions for the financial year 3,081,384
Total gross distributions per unit (sen) 3.6000Total net distributions per unit (sen) 3.6000
Included in the above distributions is an amount of RM3,194,183 derived from previous financial year’s realised gain.
The net distribution consists of the following: 2017 2016RM RM
Reinvestment - 3,081,384- 3,081,384
Gross distribution is derived using total income less total expenses.
Gross distribution per unit is derived from gross realised income less expenses divided by the number of units in circulation, while net distribution per unit is derived from gross realised income less expenses and taxation divided by the number of units in circulation.
There are unrealised losses arising during the financial year.
56

57
14. MANAGEMENT EXPENSE RATIO (“MER”)
2017%
2016%
MER 2.10 2.19
Management expense ratio includes management fee, Trustee‟s fee, audit fee, tax agent's fee and other administrative expenses which is calculated as follows:
MER = (A + B + C + D + E) x 100 F
A = Management feeB = Trustee‟s feeC = Audit feeD = Tax agent‟s feeE = Other expenses excluding Goods and Services Tax (GST) on
transaction costsF = Average net asset value of the Fund for the financial year,
calculated on a daily basis
The average net asset value of the Fund for the financial year, calculated on a daily basis is RM43,256,603 (2016: RM45,832,924).
15. PORTFOLIO TURNOVER RATIO (“PTR”)
2017 2016The portfolio turnover ratio for the financial
year (times) 0.31 1.57
The portfolio turnover ratio is derived from the following calculation:
(Total acquisition for the financial year + total disposal for the financial year) 2 Average net asset value of the Fund for the financial year calculated on a daily basis
where:
total acquisition for the financial year = RM10,216,304 (2016: RM67,855,119)total disposal for the financial year = RM16,764,442 (2016: RM76,011,990)
57

58
16. UNITS HELD BY THE MANAGER AND PARTIES RELATED TO THE MANAGER
The related parties and their relationship with the Fund are as follows:
Related parties Relationship
RHB Asset Management Sdn Bhd The Manager
RHB Investment Bank Berhad Holding company of the Manager
RHB Bank Berhad Ultimate holding company of the Manager
RHB Securities Hong Kong Ltd Related company of the Manager The number of units held by the Manager is as follows:
2017 2016Units RM Units RM
The Manager 4,233 2,304 2,649 1,268
The units are held beneficially by the Manager for booking purposes and were transacted at the prevailing market price.
Other than the above, there were no units held by Directors or parties related to the Manager.
58

59
17. TRANSACTIONS BY THE FUND
Details of transactions by the Fund for the financial year ended 31 December 2017 are as follows:
BrokersValue of
trades
Percentageof totaltrades
Brokeragefees
Percentage of total
brokeragefees
RM % RM %RHB Securities Hong Kong
Ltd* 6,651,416 21.78 16,371 26.62Instinet Singapore Services
Pte Ltd 4,802,107 15.72 9,908 16.11Credit Suisse (Hong Kong)
Ltd 3,740,514 12.25 9,351 15.20China International Capital
Corporation Hong Kong Securities Ltd 2,862,954 9.37 7,157 11.64
Hong Leong Bank Bhd 2,003,200 6.56 - -Affin Hwang Investment
Bank Bhd 1,960,575 6.42 3,083 5.01Citigroup Global Markets
Asia Ltd 1,860,389 6.09 4,651 7.56CIMB Bank Bhd 1,754,900 5.75 - -BOCI Securities Limited 1,482,735 4.86 2,965 4.82Masterlink Securities
Corporation 1,136,093 3.72 3,408 5.54Others 2,284,835 7.48 4,611 7.50
30,539,718 100.00 61,505 100.00
59

60
17. TRANSACTIONS BY THE FUND (CONTINUED)
Details of transactions (including money market placements) by the Fund for the financial year ended 31 December 2016 are as follows:
* Included in transactions by the Fund are trades conducted with RHB Investment Bank Bhd, the holding company of the Manager, RHB Securities Hong Kong Ltd, a related company of the Manager. The Manager is of the opinion that all transactions with the related companies have been entered into in the normal courses of business at agreed terms between the related parties.
Broker/financial institution
Value of trades
Percentageof totaltrades
Brokeragefees
Percentage of total
brokeragefees
RM % RM %RHB Investment Bank Bhd* 25,314,950 15.44 - -RHB Securities Hong Kong
Ltd* 24,606,153 15.01 61,515 29.26Maybank Bhd 17,854,208 10.89 - -CIMB Bank Bhd 11,218,993 6.84 - -CIMB Investment Bank
Bhd 10,931,375 6.67 22,268 10.59Public Bank Bhd 10,861,048 6.63 - -Citigroup Global Markets
Asia Ltd 10,159,598 6.20 26,751 12.72Hong Leong Investment
Bank Bhd 8,233,733 5.02 - -BOCI Securities Limited 7,858,388 4.79 15,717 7.48China International Capital
Corporation Hong Kong Securities Ltd 7,341,352 4.48 18,353 8.73
Others 29,551,947 18.03 65,631 31.22163,931,745 100.00 210,235 100.00
60
61
18. SEGMENT INFORMATION
The Investment & Security Selection Committee of the Manager recommends strategic resource allocations of the Fund to the Investment Committee of the Manager (collectively referred to as “Committee”). The Investment Committee of the Manager will then endorse the strategic decision recommended by the Investment & Security Selection Committee for adoption on behalf of the Fund. The operating segments are determined based on the recommendation by the Investment & Security Selection Committee and reviewed by the Investment Committee.
The internal reporting provided to the Committee for the Fund‟s assets, liabilities and performance is prepared on a consistent basis with the measurement and recognition principles of MFRS. The Committee is responsible for the Fund‟s entire portfolio and considers the business from both a geographic and investment perspective. Geographically, the Committee considers the performance of investment in overall basis.
The reportable operating segments derive their income by seeking investments to achieve targeted returns commensurate with an acceptable level of risk within each portfolio. These returns consist of dividend, interest and gains on the appreciation in the value of investments, which are derived from Malaysia and outside Malaysia.
There were no changes in the reportable segments during the financial year.
61

62
STATEMENT BY MANAGER
We, Patrick Chin Yoke Chung and Abdul Aziz Peru Mohamed, two of the Directors of RHB Asset Management Sdn Bhd, do hereby state that in the opinion of the Directors of the Manager, the accompanying financial statements set out on pages 15 to 61 are drawn up in accordance with the provisions of the Deeds and give a true and fair view of the financial position of the Fund as of 31 December 2017 and of its financial performance and cash flows for the financial year then ended in accordance with Malaysian Financial Reporting Standards and International Financial Reporting Standards.
On behalf of the Manager
PATRICK CHIN YOKE CHUNG ABDUL AZIZ PERU MOHAMEDDirector Director
Kuala Lumpur, Malaysia 27 February 2018
62

63
TRUSTEE‟S REPORT TO THE UNITHOLDERS OF RHB GOLDEN DRAGON FUND
We have acted as Trustee of RHB Golden Dragon Fund (“the Fund”) for the financial year ended 31 December 2017. To the best of our knowledge, RHB Asset Management Sdn Bhd (“the Management Company”), has operated and managed the Fund in accordance with the following:
a) limitations imposed on the investment powers of the Management Company and the Trustee under the Deeds, the Securities Commission‟s Guidelines on Unit Trust Funds, the Capital Markets and Services Act 2007 and other applicable laws;
b) valuation/pricing is carried out in accordance with the Deeds and any regulatory requirements; and
c) creation and cancellation of units are carried out in accordance with the Deeds and any regulatory requirements.
For HSBC (Malaysia) Trustee Berhad
Tan Bee Nie Head, Trustee Operations
Kuala Lumpur 27 February 2018
63

64
INDEPENDENT AUDITORS‟ REPORT TO THE UNITHOLDERS OFRHB GOLDEN DRAGON FUND
REPORT ON THE AUDIT OF THE FINANCIAL STATEMENTS
Our opinion
In our opinion, the financial statements of RHB Golden Dragon Fund (“the Fund”) give a true and fair view of the financial position of the Fund as at 31December 2017 and of its financial performance and its cash flows for the financial year then ended in accordance with Malaysian Financial Reporting Standards and International Financial Reporting Standards.
What we have audited
We have audited the financial statements of the Fund, which comprise the statement of financial position as at 31 December 2017, and the statement of comprehensive income, statement of changes in net asset value and statement of cash flows for the financial year then ended, and notes to the financial statements, including a summary of significant accounting policies, as set out on pages 15 to 61.
Basis for opinion
We conducted our audit in accordance with approved standards on auditing in Malaysia and International Standards on Auditing. Our responsibilities under those standards are further described in the “Auditors‟ responsibilities for the audit of the financial statements” section of our report.
We believe that the audit evidence we have obtained is sufficient and appropriate to provide a basis for our opinion.
Independence and other ethical responsibilities
We are independent of the Fund in accordance with the By-Laws (on Professional Ethics, Conduct and Practice) of the Malaysian Institute of Accountants (“By-Laws”) and the International Ethics Standards Board for Accountants‟ Code of Ethics for Professional Accountants (“IESBA Code”), and we have fulfilled our other ethical responsibilities in accordance with the By-Laws and the IESBA Code.
64

65
INDEPENDENT AUDITORS‟ REPORT TO THE UNITHOLDERS OFRHB GOLDEN DRAGON FUND (CONTINUED)
REPORT ON THE AUDIT OF THE FINANCIAL STATEMENTS (CONTINUED)
Information other than the financial statements and auditors‟ report thereon
The Manager of the Fund is responsible for the other information. The other information comprises Manager‟s report, but does not include the financial statements of the Fund and our auditors‟ report thereon.
Our opinion on the financial statements of the Fund does not cover the other information and we do not express any form of assurance conclusion thereon.
In connection with our audit of the financial statements of the Fund, our responsibility is to read the other information and, in doing so, consider whether the other information is materially inconsistent with the financial statements of the Fund or our knowledge obtained in the audit or otherwise appears to be materially misstated.
If, based on the work we have performed, we conclude that there is a material misstatement of this other information, we are required to report that fact. We have nothing to report in this regard.
Responsibilities of the Manager for the financial statements
The Manager of the Fund is responsible for the preparation of the financial statements of the Fund that give a true and fair view in accordance with Malaysian Financial Reporting Standards and International Financial Reporting Standards. The Manager is also responsible for such internal control as the Manager determines is necessary to enable the preparation of financial statements of the Fund that are free from material misstatement, whether due to fraud or error.
In preparing the financial statements of the Fund, the Manager is responsible for assessing the Fund‟s ability to continue as a going concern, disclosing, as applicable, matters related to going concern and using the going concern basis of accounting unless the Manager either intend to liquidate the Fund or to terminate the Fund, or have no realistic alternative but to do so.
65

66
INDEPENDENT AUDITORS‟ REPORT TO THE UNITHOLDERS OFRHB GOLDEN DRAGON FUND (CONTINUED)
REPORT ON THE AUDIT OF THE FINANCIAL STATEMENTS (CONTINUED)
Auditors‟ responsibilities for the audit of the financial statements
Our objectives are to obtain reasonable assurance about whether the financial statements of the Fund as a whole are free from material misstatement, whether due to fraud or error, and to issue an auditors‟ report that includes our opinion. Reasonable assurance is a high level of assurance, but is not a guarantee that an audit conducted in accordance with approved standards on auditing in Malaysia and International Standards on Auditing will always detect a material misstatement when it exists. Misstatements can arise from fraud or error and are considered material if, individually or in the aggregate, they could reasonably be expected to influence the economic decisions of users taken on the basis of these financial statements.
As part of an audit in accordance with approved standards on auditing in Malaysia and International Standards on Auditing, we exercise professional judgement and maintain professional scepticism throughout the audit. We also:
(a) Identify and assess the risks of material misstatement of the financial statements of the Fund, whether due to fraud or error, design and perform audit procedures responsive to those risks, and obtain audit evidence that is sufficient and appropriate to provide a basis for our opinion. The risk of not detecting a material misstatement resulting from fraud is higher than for one resulting from error, as fraud may involve collusion, forgery, intentional omissions, misrepresentations, or the override of internal control.
(b) Obtain an understanding of internal control relevant to the audit in order to design audit procedures that are appropriate in the circumstances, but not for the purpose of expressing an opinion on the effectiveness of Fund‟s internal control.
(c) Evaluate the appropriateness of accounting policies used and the reasonableness of accounting estimates and related disclosures made by the Manager.
66

67
INDEPENDENT AUDITORS‟ REPORT TO THE UNITHOLDERS OFRHB GOLDEN DRAGON FUND (CONTINUED)
REPORT ON THE AUDIT OF THE FINANCIAL STATEMENTS (CONTINUED)
Auditors‟ responsibilities for the audit of the financial statements (continued)
(d) Conclude on the appropriateness of the Manager‟s use of the going concern basis of accounting and, based on the audit evidence obtained, whether a material uncertainty exists related to events or conditions that may cast significant doubt on the Fund‟s ability to continue as a going concern. If we conclude that a material uncertainty exists, we are required to draw attention in our auditors‟ report to the related disclosures in the financial statements of the Fund or, if such disclosures are inadequate, to modify our opinion. Our conclusions are based on the audit evidence obtained up to the date of our auditors‟ report. However, future events or conditions may cause the Fund to cease to continue as a going concern.
(e) Evaluate the overall presentation, structure and content of the financial statements of the Fund, including the disclosures, and whether the financial statements represent the underlying transactions and events in a manner that achieves fair presentation.
We communicate with the Manager regarding, among other matters, the planned scope and timing of the audit and significant audit findings, including any significant deficiencies in internal control that we identify during our audit.
OTHER MATTERS
This report is made solely to the unitholders of the Fund and for no other purpose. We do not assume responsibility to any other person for the content of this report.
PRICEWATERHOUSECOOPERS PLT (LLP0014401-LCA & AF 1146) Chartered Accountants
Kuala Lumpur 27 February 2018
67

68
CORPORATE INFORMATION
MANAGERRHB Asset Management Sdn Bhd
PRINCIPAL AND REGISTERED OFFICELevel 8, Tower Two & Three, RHB Centre, Jalan Tun Razak, 50400 Kuala Lumpur
BUSINESS OFFICELevel 8, Tower Two & Three, RHB Centre, Jalan Tun Razak, 50400 Kuala Lumpur
Email address: [email protected]: 03 – 9205 8000Fax: 03 – 9205 8100Website: http://www.rhbgroup.com
BOARD OF DIRECTORSMr Patrick Chin Yoke Chung (Non-Independent Non-Executive Chairman)Encik Abdul Aziz Peru Mohamed (Senior Independent Non-Executive Director)Mr Chin Yoong Kheong (Independent Non-Executive Director)Ms Ong Yin Suen (Managing Director)Dr. Ngo Get Ping (Independent Non-Executive Director)Ms Choo Shan (Independent Non-Executive Director)
(Appointed on 3 July 2017)
INVESTMENT COMMITTEE MEMBERS Mr Patrick Chin Yoke Chung (Chairman) (Re-designated on 1 November 2017)Encik Abdul Aziz Peru Mohamed (Appointed on 1 November 2017)Ms Choo Shan (Appointed on 1 November 2017)YBhg Dato‟ Darawati Hussain (Appointed on 1 December 2017)YBhg Dato‟ Khairussaleh Ramli (Chairman) (Resigned on 1 November 2017)Mr Ong Seng Pheow (Resigned on 1 November 2017)YBhg Datuk Haji Faisal Siraj (Resigned on 1 December 2017)
CHIEF EXECUTIVE OFFICERMr Ho Seng Yee (Retired on 31 December 2017)
SECRETARYEncik Azman Shah Md Yaman (LS No. 0006901)
68

69
BRANCHES
Kuala Lumpur Office B-9-6, Megan Avenue 1No. 189, Jalan Tun Razak50400 Kuala LumpurTel: 03-2171 2755 Fax: 03-2770 0022
Sri Petaling Office No. 53-1 & 53-2 Jalan Radin TengahBandar Baru Sri Petaling57000 Kuala LumpurTel: 03-9054 2470 Fax: 03-9054 0934
Penang Office 64-D, Level 5, Lebuh Bishop10200 PenangTel: 04-264 5639 / 04-263 4848Fax: 04-264 5640 / 04-262 8844
Butterworth Office 2677, Jalan Chain FerryTaman Inderawasih13600 Prai, PenangTel: 04-390 0022 Fax: 04-390 0023
Ipoh Office 4th Floor, 21-25Jalan Seenivasagam, Greentown30450 Ipoh, PerakTel: 05-242 4311 Fax: 05-242 4312
Johor Bahru Office 2nd Floor, 21 & 23Jalan Molek 1/30, Taman Molek81100 Johor Bahru, JohorTel: 07-358 3587 Fax: 07-358 3581
Kuantan Office B 32-34, 2nd Floor, Lorong Tun Ismail 8Sri Dagangan II25000 Kuantan, PahangTel: 09-517 3611 Fax: 09-517 3612
Kota Bharu Office No 3953-H, 1st FloorJalan Kebun Sultan15350 Kota Bharu, KelantanTel: 09-741 8539 Fax: 09-741 8540
69

70
Kota Kinabalu Office Lot No. C-02-04, 2nd FloorBlock C, Warisan SquareJalan Tun Fuad Stephens88000 Kota Kinabalu, SabahTel: 088-528 686/692 Fax: 088-528 685
Melaka Office 581B, Taman Melaka Raya75000 MelakaTel: 06-284 4211 Fax: 06-292 2212
Batu Pahat Office 53, 53-A and 53-B Jalan Sultanah83000 Batu Pahat, JohorTel: 07-438 0271 Fax: 07-438 0277
Miri Office Lot 1268, First FloorCentre Point Commercial CentreJalan Melayu98000 Miri, SarawakTel: 085-422 788 Fax: 085-415 243
Kuching Office Lot 172, Section 49, K.T.L.DJalan Chan Chin Ann93100 Kuching, SarawakTel: 082-245 611 Fax: 082-242 712
TRUSTEE HSBC (Malaysia) Trustee Berhad
BANKER RHB Bank Berhad
AUDITORS PricewaterhouseCoopers PLT
TAX ADVISER PricewaterhouseCoopers Taxation Services Sdn Bhd
DISTRIBUTORS Affin Bank BhdAlliance Bank Malaysia BhdAmBank BhdAmInvestment Bank BhdApex Investment Services BhdAreca Capital Sdn BhdCIMB Investment Bank BhdCIMB Wealth AdvisorHong Leong Bank BhdHSBC Bank Malaysia BhdiFAST Capital Sdn Bhd
70

71
DISTRIBUTORS Kenanga Investment Bank BhdManulife Asset Management Services BhdRHB Investment Bank BhdPhillip Mutual BhdRHB Bank BhdStandard Chartered Bank Malaysia BhdUnited Overseas Bank (Malaysia) Bhd
71