(incorporated in france as a public limited company) · 1 societe generale (incorporated in france...
TRANSCRIPT
1
SOCIETE GENERALE(Incorporated in France as a Public Limited Company)
Corporate & INDIAN BRANCHESInvestment BankIng
Economic & Political Weekly EPW july 15, 2016 vol lI No 29
INDEPENDENT AUDITOR’S REPORTTO THE APEX COMMITTEESOCIETE GENERALE – INDIAN BRANCHES
Report on the Financial Statements We have audited the accompanying financial statements of SOCIETE GENERALE - INDIAN BRANCHES (“the Bank”), which comprise the Balance Sheet as at 31 March 2016, the Profit and Loss account, the Cash Flow Statement for the year then ended, and a summary of the significant accounting policies and other explanatory information. Management’s Responsibility for the Financial Statements The Bank’s Apex Committee is responsible for the matters stated in Section 134(5) of the Companies Act, 2013 (“the Act”) with respect to the preparation of these financial statements that give a true and fair view of the financial position, financial performance and cash flows of the Bank in accordance with the provisions of Section 29 of the Banking Regulation Act, 1949, accounting principles generally accepted in India, including the Accounting Standards prescribed under section 133 of the Act, in so far as applicable to banks, and the Guidelines issued by the Reserve Bank of India.This responsibility also includes maintenance of adequate accounting records in accordance with the provisions of the Act, for safeguarding the assets of the Bank and for preventing and detecting frauds and other irregularities; selection and application of appropriate accounting policies; making judgments and estimates that are reasonable and prudent; and design, implementation and maintenance of adequate internal financial controls, that were operating effectively for ensuring the accuracy and completeness of the accounting records, relevant to the preparation and presentation of the financial statements that give a true and fair view and are free from material misstatement, whether due to fraud or error.Auditor’s Responsibility Our responsibility is to express an opinion on these financial statements based on our audit.We have taken into account the provisions of the Act, the accounting and auditing standards and matters which are required to be included in the audit report under the provisions of the Act and the Rules made thereunder. We conducted our audit of the financial statements in accordance with the Standards on Auditing specified under Section 143(10) of the Act. Those Standards require that we comply with ethical requirements and plan and perform the audit to obtain reasonable assurance about whether the financial statements are free from material misstatement. An audit involves performing procedures to obtain audit evidence about the amounts and the disclosures in the financial statements. The procedures selected depend on the auditor’s judgment, including the assessment of the risks of material misstatement of the financial statements, whether due to fraud or error. In making those risk assessments, the auditor considers internal financial control relevant to the Bank’s preparation of the financial statements that give a true and fair view in order to design audit procedures that are appropriate in the circumstances. An audit also includes evaluating the appropriateness of the accounting policies used and the reasonableness of the accounting estimates made by the Bank’s Management, and evaluating the overall presentation of the financial statements. We believe that the audit evidence we have obtained is sufficient and appropriate to provide a basis for our audit opinion on the financial statements.Opinion In our opinion and to the best of our information and according to the explanations given to us, the aforesaid financial statements give the information required by the Banking Regulation Act, 1949 and the Act in the manner so required and give a true and fair view in conformity with the accounting principles generally accepted in India, of the state of affairs of the Bank as at 31st March, 2016, and its profit and its cash flows for the year ended on that date. Report on Other Legal and Regulatory Requirements 1. As required by Section 143 (3) of the Act and Section 30 of the Banking Regulation Act, 1949, we report that: a) We have sought and obtained all the information and explanations which to the best of our knowledge and belief were necessary for the purposes
of our audit. b) In our opinion, the transactions of the Bank which have come to our notice have been within the powers of the Bank. c) As explained in paragraph 2 below, the financial accounting systems of the Bank are centralised and, therefore, accounting returns are not
required to be submitted by the Branches. d) In our opinion, proper books of account as required by law have been kept by the Bank so far as it appears from our examination of those books. e) The Balance Sheet, the Profit and Loss account, and the Cash Flow Statement dealt with by this Report are in agreement with the books of account. f) In our opinion, the aforesaid financial statements comply with the Accounting Standards prescribed under section 133 of the Act, as applicable. g) With respect to the adequacy of the internal financial controls over financial reporting of the Bank and the operating effectiveness of such
controls, refer to our Report in “Annexure A”. Our report expresses an unmodified opinion on the adequacy and operating effectiveness of the Bank’s internal financial controls over financial reporting.
h) With respect to the other matters to be included in the Auditor’s Report in accordance with Rule 11 of the Companies (Audit and Auditors) Rules, 2014, in our opinion and to the best of our information and according to the explanations given to us:
i. The Bank has disclosed the impact of pending litigations on its financial position in its financial statements – Refer Schedule 12 and Schedule 18.21.(iii) to the financial statements.
ii. The Bank has made provision, as required under the applicable law or accounting standards, for material foreseeable losses, if any, on long-term contracts including derivative contracts - Refer Schedule 12 and Schedule 18.21.(iii) to the financial statements.
iii. There were no amounts which were required to be transferred, to the Investor Education and Protection Fund by the Bank.2. We report that during the course of our audit we have performed select relevant procedures at 2 branches. Since the Bank considers its key operations
to be automated, with the key applications largely integrated to the core banking systems, it does not require its branches, to submit any financial returns. Accordingly our audit is carried out centrally at the Head Office based on the necessary records and data required for the purposes of the audit being made available to us.
For DELOITTE HASKINS & SELLS Chartered Accountants
(Firm’s Registration No.117365W)
Sd/-Anjum A. Qazi
PartnerMumbai, June 24, 2016 (Membership No.104968)
2
SOCIETE GENERALE(Incorporated in France as a Public Limited Company)
Corporate & INDIAN BRANCHESInvestment BankIng
july 15, 2016 vol lI No 29 EPW Economic & Political Weekly
ANNEXURE “A” TO THE INDEPENDENT AUDITOR’S REPORT (Referred to in paragraph 1 (g) under ‘Report on Other Legal and Regulatory Requirements’ of our report of even date)
Report on the Internal Financial Controls Over Financial Reporting under Clause (i) of Sub-section 3 of Section 143 of the Companies Act, 2013 (“the Act”)
We have audited the internal financial controls over financial reporting of SOCIETE GENERALE - INDIAN BRANCHES (“the Bank”) as at 31 March 2016 in conjunction with our audit of the financial statements of the Bank for the year ended on that date. Management’s Responsibility for Internal Financial ControlsThe Bank’s management is responsible for establishing and maintaining internal financial controls based on the internal control over financial reporting criteria established by the Bank considering the essential components of internal control stated in the Guidance Note on Audit of Internal Financial Controls Over Financial Reporting issued by the Institute of Chartered Accountants of India. These responsibilities include the design, implementation and maintenance of adequate internal financial controls that were operating effectively for ensuring the orderly and efficient conduct of its business, including adherence to Bank’s policies, the safeguarding of its assets, the prevention and detection of frauds and errors, the accuracy and completeness of the accounting records, and the timely preparation of reliable financial information, as required under the Companies Act, 2013, the Banking Regulation Act, 1949 and the Guidelines issued by the Reserve Bank of India.Auditor’s ResponsibilityOur responsibility is to express an opinion on the Bank’s internal financial controls over financial reporting based on our audit. We conducted our audit in accordance with the Guidance Note on Audit of Internal Financial Controls Over Financial Reporting (the “Guidance Note”) issued by the Institute of Chartered Accountants of India and the Standards on Auditing prescribed under Section 143(10) of the Companies Act, 2013, to the extent applicable to an audit of internal financial controls. Those Standards and the Guidance Note require that we comply with ethical requirements and plan and perform the audit to obtain reasonable assurance about whether adequate internal financial controls over financial reporting was established and maintained and if such controls operated effectively in all material respects.Our audit involves performing procedures to obtain audit evidence about the adequacy of the internal financial controls system over financial reporting and their operating effectiveness. Our audit of internal financial controls over financial reporting included obtaining an understanding of internal financial controls over financial reporting, assessing the risk that a material weakness exists, and testing and evaluating the design and operating effectiveness of internal control based on the assessed risk. The procedures selected depend on the auditor’s judgement, including the assessment of the risks of material misstatement of the financial statements, whether due to fraud or error.We believe that the audit evidence we have obtained is sufficient and appropriate to provide a basis for our audit opinion on the Bank’s internal financial controls system over financial reporting.Meaning of Internal Financial Controls Over Financial ReportingA Bank’s internal financial control over financial reporting is a process designed to provide reasonable assurance regarding the reliability of financial reporting and the preparation of financial statements for external purposes in accordance with generally accepted accounting principles and other applicable regulations. A Bank’s internal financial control over financial reporting includes those policies and procedures that (1) pertain to the maintenance of records that, in reasonable detail, accurately and fairly reflect the transactions and dispositions of the assets of the Bank; (2) provide reasonable assurance that transactions are recorded as necessary to permit preparation of financial statements in accordance with generally accepted accounting principles, and that receipts and expenditures of the Bank are being made only in accordance with authorisations of Management of the Bank; and (3) provide reasonable assurance regarding prevention or timely detection of unauthorised acquisition, use, or disposition of the Bank’s assets that could have a material effect on the financial statements.Inherent Limitations of Internal Financial Controls Over Financial ReportingBecause of the inherent limitations of internal financial controls over financial reporting, including the possibility of collusion or improper management override of controls, material misstatements due to error or fraud may occur and not be detected. Also, projections of any evaluation of the internal financial controls over financial reporting to future periods are subject to the risk that the internal financial control over financial reporting may become inadequate because of changes in conditions, or that the degree of compliance with the policies or procedures may deteriorate.OpinionIn our opinion, to the best of our information and according to the explanations given to us, the Bank has, in all material respects, an adequate internal financial controls system over financial reporting and such internal financial controls over financial reporting were operating effectively as at 31 March, 2016, based on the internal control over financial reporting criteria established by the Bank considering the essential components of internal control stated in the Guidance Note on Audit of Internal Financial Controls Over Financial Reporting issued by the Institute of Chartered Accountants of India.
For Deloitte Haskins & SellsChartered Accountants
(Firm’s Registration No.117365W)
Sd/-Anjum A. Qazi
Partner (Membership No.104968)Mumbai, June 24, 2016
3
SOCIETE GENERALE(Incorporated in France as a Public Limited Company)
Corporate & INDIAN BRANCHESInvestment BankIng
Economic & Political Weekly EPW july 15, 2016 vol lI No 29
PROFIT AND LOSS ACCOUNT FOR THE yEAR ENDED MARCH 31, 2016
Rs. (000’s)
Schedule For the year For the year Ended March Ended March 31, 2016 31 2015
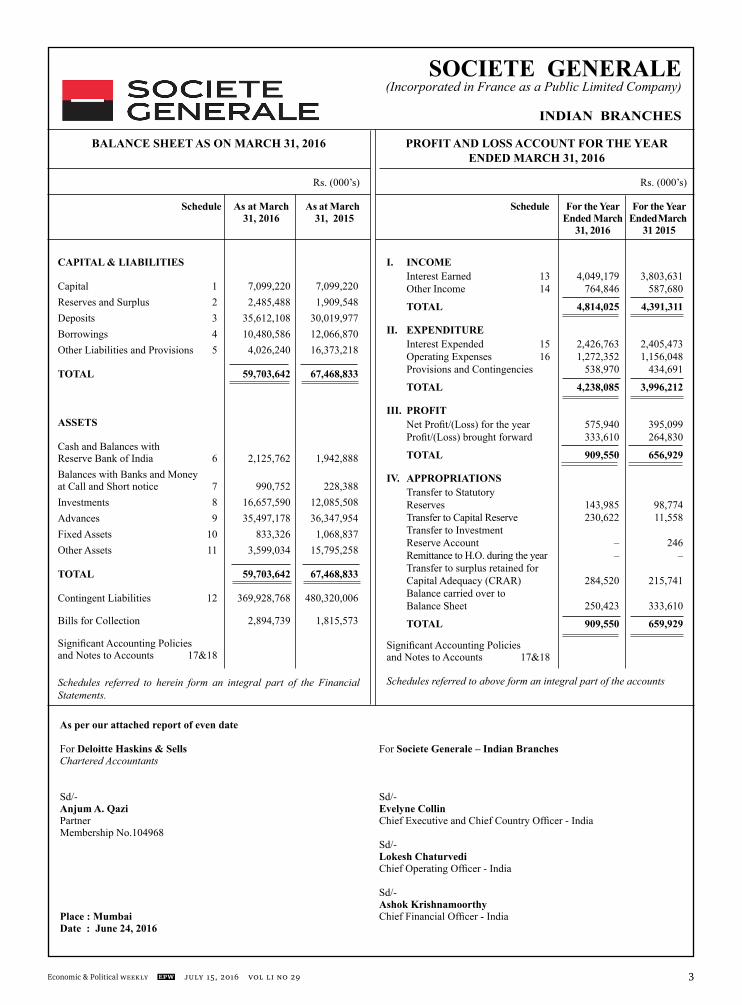
I. INCOME Interest Earned 13 4,049,179 3,803,631 Other Income 14 764,846 587,680
TOTAL 4,814,025 4,391,311
II. EXPENDITURE Interest Expended 15 2,426,763 2,405,473 Operating Expenses 16 1,272,352 1,156,048 Provisions and Contingencies 538,970 434,691
TOTAL 4,238,085 3,996,212
III. PROFIT Net Profit/(Loss) for the year 575,940 395,099 Profit/(Loss) brought forward 333,610 264,830
TOTAL 909,550 656,929
IV. APPROPRIATIONS Transfer to Statutory Reserves 143,985 98,774 Transfer to Capital Reserve 230,622 11,558 Transfer to Investment Reserve Account – 246 Remittance to H.O. during the year – – Transfer to surplus retained for Capital Adequacy (CRAR) 284,520 215,741 Balance carried over to Balance Sheet 250,423 333,610
TOTAL 909,550 659,929
Significant Accounting Policiesand Notes to Accounts 17&18
Schedules referred to above form an integral part of the accounts
BALANCE SHEET AS ON MARCH 31, 2016
Rs. (000’s)
Schedule As at March As at March 31, 2016 31, 2015
CAPITAL & LIABILITIES
Capital 1 7,099,220 7,099,220 Reserves and Surplus 2 2,485,488 1,909,548 Deposits 3 35,612,108 30,019,977 Borrowings 4 10,480,586 12,066,870 Other Liabilities and Provisions 5 4,026,240 16,373,218
TOTAL 59,703,642 67,468,833
ASSETS
Cash and Balances with Reserve Bank of India 6 2,125,762 1,942,888 Balances with Banks and Money at Call and Short notice 7 990,752 228,388 Investments 8 16,657,590 12,085,508 Advances 9 35,497,178 36,347,954 Fixed Assets 10 833,326 1,068,837 Other Assets 11 3,599,034 15,795,258
TOTAL 59,703,642 67,468,833
Contingent Liabilities 12 369,928,768 480,320,006
Bills for Collection 2,894,739 1,815,573
Significant Accounting Policiesand Notes to Accounts 17&18
Schedules referred to herein form an integral part of the Financial Statements.
As per our attached report of even date For Deloitte Haskins & Sells For Societe Generale – Indian Branches Chartered Accountants
Sd/- Sd/- Anjum A. Qazi Evelyne Collin Partner Chief Executive and Chief Country Officer - India Membership No.104968 Sd/- Lokesh Chaturvedi Chief Operating Officer - India Sd/- Ashok Krishnamoorthy Place : Mumbai Chief Financial Officer - India Date : June 24, 2016

4
SOCIETE GENERALE(Incorporated in France as a Public Limited Company)
Corporate & INDIAN BRANCHESInvestment BankIng
july 15, 2016 vol lI No 29 EPW Economic & Political Weekly
Rs. (000’s)
CASH FLOW STATEMENT FOR THE yEAR ENDED 31 MARCH 2016
Particulars For the year Ended For the year Ended March 31, 2016 March 31, 2015
Cash Flow from Operating ActivitiesNet Profit as per Profit and Loss Statement 575,940 395,099 Add: Income Tax Provision 382,000 388,000 Add: Deferred Tax (Asset)/Liability 175,971 (13,660)Net profit before taxation and extraordinary items 1,133,911 769,439 Adjustments for: Depreciation on Fixed Assets 200,578 172,227 (Profit)/Loss on sale of fixed assets (422,154) (58)Interest paid on sub-ordinated debt during the year 90,774 97,395 Addition to/(Write-back) of provision for Loan Losses – (4,286)Addition to/(Write-back) of Standard Assets (8,083) 38,886 Provision on Country Risk (3,680) 4,909 Provision for Unhedged Foreign Currency Exposure (7,238) 17,681 Other Losses/write-offs – 3,739 Provision on Investments – (578)Operating profit before working capital changes 984,108 1,099,354 (Increase)/Decrease in Investments (4,922,082) (4,873,374)(Increase)/Decrease in Advances 850,776 (9,791,006)(Increase)/Decrease in Other Assets 11,841,100 3,280,254 Increase/(Decrease) in Deposits 5,592,130 9,520,059 Increase/(Decrease) in Other Liabilities & Provisions (12,503,947) (2,680,178)Income taxes (paid)/received (7,489) (371,863)Net Cash Flow generated from/(used in) Operating Activities A 1,834,596 (3,816,754)Cash flows from investing activities Purchase of fixed assets (73,277) (727,063)Proceeds from sale of fixed assets 510,977 58 Proceeds from maturity of Held to Maturity Investments 350,000 300,000 Net Cash Flow generated from/(used in) Investing Activities B 787,700 (427,005)Cash flows from financing activities Effect of exchange fluctuation on sub-ordinated debt 377,430 (762,496)Interest paid on sub-ordinated debt during the year (90,774) (97,395)Increase/(Decrease) in Borrowings other than Sub-ordinated debt (1,963,714) 5,718,997 Net Cash Flow generated from/(used in) Financing Activities C (1,677,058) 4,859,106 Net increase/(decrease) in cash and cash equivalents (A+B+C) 945,238 615,347 Cash and Cash equivalents at the beginning of the year 2,171,276 1,555,929 Cash and Cash equivalents at the end of the year 3,116,514 2,171,276 Notes: Cash and Cash Equivalents represent Cash and Balances with Reserve Bank of India (As per Schedule 6) 2,125,762 1,942,888 Balances with Banks & Money at Call and Short Notice (As per Schedule 7) 990,752 228,388 3,116,514 2,171,276 Significant Accounting Policies and Notes to Accounts 17 & 18Schedules referred to herein form an integral part of the Financial Statements.
As per our attached report of even dateFor Deloitte Haskins & Sells For Societe Generale – Indian Branches Chartered Accountants Sd/- Sd/- Anjum A. Qazi Evelyne Collin Partner Chief Executive and Chief Country Officer - India Membership No.104968 Sd/- Lokesh Chaturvedi Chief Operating Officer - India Sd/- Place : Mumbai Ashok Krishnamoorthy Date : June 24, 2016 Chief Financial Officer - India

5
SOCIETE GENERALE(Incorporated in France as a Public Limited Company)
Corporate & INDIAN BRANCHESInvestment BankIng
Economic & Political Weekly EPW july 15, 2016 vol lI No 29
As at March As at March 31, 2016 31, 2015 SCHEDULE 4 – BORROWINGS
I Borrowings in India (i) Reserve Bank of India – – (ii) Other Banks 2,493,825 2,000,000 (iii) Other institutions and agencies – –
2,493,825 2,000,000 II Borrowings outside India (i) Subordinated Debt from Head Office 3,468,170 3,090,740 (ii) Other Banks 4,518,591 6,976,130 7,986,761 10,066,870
Total (I+II) 10,480,586 12,066,870
Secured borrowings included in I & II above – –
SCHEDULE 5 – OTHER LIABILITIES AND PROVISIONS
I Bills Payable 688 1,366 II Inter-Office Adjustment (Net) – – III Interest Accrued 283,070 224,137 IV Provision for standard assets 229,174 244,494 V Deferred Tax Liability (Net) 187,294 11,323 VI Others (including provisions) 3,326,014 15,891,898
Total 4,026,240 16,373,218
SCHEDULE 6 – CASH ANDBALANCES WITHRESERVE BANK OF INDIAI Cash in hand (including foreign currency notes) 524 1,419 II Balances with Reserve Bank of India (i) In Current Account 2,125,238 1,941,469 (ii) In Other Account – –
Total (I+II) 2,125,762 1,942,888
SCHEDULE 7 – BALANCES WITH BANKS & MONEy AT CALL AND SHORT NOTICEI In India (i) Balances with Banks (a) In Current Account 2,153 1,783 (b) In Other Deposit Account – (ii) Money at Call and Short Notice (a) With Banks 750,000 – (b) With Other Institutions – –
752,153 1,783
II Outside India (i) In Current Account 238,599 226,605 (ii) In Other Deposit Accounts – – (iii) Money at Call and Short Notice – –
238,599 226,605
Total (I+II) 990,752 228,388
SCHEDULES FORMING PART OF FINANCIAL STATEMENTS AS AT MARCH 31, 2016
As at March As at March 31, 2016 31, 2015 SCHEDULE 1 – CAPITAL(i) Amount brought in by Bank by way of Capital As per Last Balance Sheet 7,099,220 7,099,220 Add: Capital infusion during the year – – Total 7,099,220 7,099,220 (ii) Amount of deposit kept with the Reserve Bank of India under section 11(2)(b) of the Banking Regulation Act, 1949 1,050,000 950,000 SCHEDULE 2 – RESERVES &SURPLUSI STATUTORy RESERVE As per Last Balance Sheet 938,818 840,044 Add: Transfer from Profit & Loss Account 143,985 98,774 1,082,803 938,818 II CAPITAL RESERVE As per Last Balance Sheet 13,135 1,577 Add: Transfer from Profit & Loss Account 230,622 11,558 243,757 13,135 III SURPLUS RETAINED FOR CAPITAL ADEQUACy (CRAR) As per Last Balance Sheet 532,612 316,871 Add: Transfer from Profit & Loss Account 284,520 215,741 817,132 532,612 IV INVESTMENT RESERVE ACCOUNT (IRA) As per Last Balance Sheet 91,373 91,127 Add: Transfer from Profit & Loss Account – 246 91,373 91,373 V BALANCE IN PROFIT AND LOSS ACCOUNT Balance carried forward from Profit and Loss Account 250,423 333,610 Total 2,485,488 1,909,548
SCHEDULE 3 – DEPOSITSA. I Demand Deposits (i) From Banks 267,533 31,176 (ii) From Others 1,821,480 1,489,892 2,089,013 1,521,068
II Savings Bank Deposits 14,769 4,893 III Term Deposits (i) From Banks – – (ii) From Others 33,508,326 28,494,016 33,508,326 28,494,016 Total 35,612,108 30,019,977
B (i) Deposits of Branches in India 35,612,108 30,019,977 (ii) Deposits of branches outside India – – Total 35,612,108 30,019,977
Rs. (000’s) Rs. (000’s)

6
SOCIETE GENERALE(Incorporated in France as a Public Limited Company)
Corporate & INDIAN BRANCHESInvestment BankIng
july 15, 2016 vol lI No 29 EPW Economic & Political Weekly
As at March As at March 31, 2016 31, 2015 SCHEDULE 10 (Contd.)I.b Asset held for sale/disposal At book value At cost as per last Balance Sheet 533,974 533,974 Additions during the year – – Deductions during the year (533,974) – – 533,974 Depreciation to date Beginning of the year 448,847 425,631 Additions during the year 1,935 23,216 Deductions during the year (450,782) – 0 448,847 Total (I) 586,460 697,240 II Other fixed assets (including Furniture and Fixtures) At book value Beginning of the year 740,674 620,619 Additions during the year 60,848 131,295 Deductions during the year (33,076) (11,240) 768,446 740,674 Depreciation to date Beginning of the year 395,336 267,129 Additions during the year 160,917 139,447 Deductions during the year (27,800) (11,240) 528,453 395,336 Total (II) 239,993 345,338 III Capital work in progress 6,873 26,259 Total 833,326 1,068,837
SCHEDULE 11 – OTHER ASSETSI Inter-Office Adjustment (Net) – – II Interest accrued 345,162 227,949 III Tax paid in advance/tax deducted at source (net of provisions) 72,545 198,154 IV Deferred Tax Assets (Net) – – V Stationery and stamps 28 22 VI Others 3,181,299 15,369,133 Total 3,599,034 15,795,258
SCHEDULE 12 – CONTINGENT LIABILITIES ((refer note 18.21.iii)) I Claims against the bank not acknowledged as debts – – II Liability for partly paid investments – – III Liabilities on account of outstanding forward exchange contracts 62,549,945 87,911,443 IV Liabilities on account of outstanding derivative contracts 288,319,195 371,632,511 V Guarantees given on behalf of constituents (a) In India 16,516,307 16,312,918 (b) Outside India – – VI Acceptances, endorsements and other obligations 2,543,321 4,463,134 VII Other items for which the Banks is contingently liable – – Total 369,928,768 480,320,006
SCHEDULES FORMING PART OF FINANCIAL STATEMENTS AS AT MARCH 31, 2016
Rs. (000’s) Rs. (000’s)
As at March As at March 31, 2016 31, 2015
SCHEDULE 8 – INVESTMENTS I Investments in India in (i) Government securities (*) 16,657,590 12,085,508 (ii) Other approved securities – – (iii) Shares – – (iv) Debentures and bonds – – (v) Subsidiaries/Joint Ventures – – (vi) Others – – 16,657,590 12,085,508 II Investments outside India – – 16,657,590 12,085,508 III Investments in India Gross Value 16,657,590 12,085,508 Less:– Provision on Investments – – Net Value 16,657,590 12,085,508
* includes Securities kept with CCIL as margin for securities segment of book value of Rs. 594,177 (P. Y. BV 424,756); for CBLO segment book value of Rs. 1,132,432 (Previous Year Rs. 243,640); for Forex segment book value of Rs. 44,391 (Previous Year Rs. 26,863) and with RBI under section 11(2)(b)(ii) of Banking Regulation Act, 1949 of Face Value of Rs. 1,050,000 (Previous Year Face Value Rs. 950,000). SCHEDULE 9 – ADVANCESA (i) Bills purchased and discounted 8,909,061 5,163,321 (ii) Cash credits, Overdrafts & Loans 22,453,336 23,160,423 (iii) Term Loans 4,134,781 8,024,210 Total 35,497,178 36,347,954 B (i) Secured by tangible assets* 10,804,856 13,023,407 (ii) Covered by Bank/ Government Guarantees 7,663,165 4,860,501 (iii) Unsecured 17,029,157 18,464,046 *includes advances against book debts Total 35,497,178 36,347,954 C I Advances in India (i) Priority Sector 12,267,964 10,296,768 (ii) Public Sector – – (iii) Banks 4,736,658 1,933,971 (iv) Others 18,492,556 24,117,215 Sub-total 35,497,178 36,347,954 II Advances outside India – – Sub-total – – Total 35,497,178 36,347,954
SCHEDULE 10 – FIXED ASSETSI.a Premises At book value Beginning of the year 649,913 54,145 Additions during the year 12,429 595,768 Deductions during the year (1,257) – 661,085 649,913 Depreciation to date Beginning of the year 37,800 28,236 Additions during the year 37,726 9,564 Deductions during the year (901) – 74,625 37,800

7
SOCIETE GENERALE(Incorporated in France as a Public Limited Company)
Corporate & INDIAN BRANCHESInvestment BankIng
Economic & Political Weekly EPW july 15, 2016 vol lI No 29
Rs. (000’s) For the year For the year Ended March Ended March 31, 2016 31, 2015
SCHEDULE 13 – INTERESTEARNEDI Interest/Discount on Advances/Bills 2,984,734 2,786,275 II Income on Investments 1,057,907 1,011,365 III Interest on balance with Reserve Bank of India and other inter-bank funds 5,475 1,827 IV Others 1,063 4,164 Total 4,049,179 3,803,631
SCHEDULE 14 – OTHER INCOMEI Commission, Exchange and Brokerage 194,759 139,548 II Profit/(Loss) on sale of Investments (net) 21,372 48,269 III Profit/(Loss) on sale of assets (net) 422,154 58 IV Profit/(Loss) on Foreign Exchange Transactions (net) (169,078) 901,029 V Income earned by way of dividends, etc. from subsidiaries, companies, joint venture abroad/ in India – – VI Miscellaneous Income (refer note 18.21.xv) 295,639 (501,224)
Total 764,846 587,680
Rs. (000’s) For the year For the year Ended March Ended March 31, 2016 31, 2015
SCHEDULE 15 – INTERESTEXPENDEDI Interest on Deposits 2,226,263 2,187,601 II Interest on Reserve Bank of India/Inter-bank borrowings 174,575 141,468 III Others 25,925 76,404 Total 2,426,763 2,405,473
SCHEDULE 16 – OPERATING EXPENSES I Payment to and provisions for employees 451,604 450,935 II Rent, Taxes and Lighting 51,088 62,967 III Printing and Stationery 4,456 3,621 IV Advertisement and Publicity 5,924 5,081 V Depreciation on Bank’s Property 200,578 172,227 VI Directors’ Fees, Allowances and Expenses – – VII Auditors’ Fees and Expenses 2,430 1,509 VIII Law Charges 2,854 2,853 IX Postage, Telegrams, Telephones etc. 13,587 11,043 X Repairs and Maintenance 39,962 40,653 XI Insurance 37,411 30,520 XII Head Office Charges 151,432 116,912 XIII Intra-Group Service Fee 110,288 71,290 XIV Inter-unit recharges 95,158 74,023 XV CSR Expenditure 5,250 6,500 XVI Other Expenditure (refer note 18.19.iv) 100,330 105,914 Total 1,272,352 1,156,048
Schedule 17- SIGNIFICANT ACCOUNTING POLICIES
SCHEDULES FORMING PART OF FINANCIAL STATEMENTS FOR THE yEAR ENDED MARCH 31, 2016
I Principal Accounting Policies 1. Background The accompanying financial statements for the year ended 31st March 2016 comprise the accounts of the Indian branches of Societe Generale,
which is incorporated in France as a Public Limited Company. The Indian operations are located in Mumbai, New Delhi and Sanand with Mumbai being the headquarters.
The Apex Committee is supreme body of the bank. The members of the Apex Committee includes:
Chief Executive Officer Chief Operating Officer Chief Financial Officer Head – HR Head – Legal & Compliance Head – Internal Audit Head – Operations
Head – Market Risk Head – Operational Risk Head – IT Head – Communications Head – Credit Head – Corporate Banking (on rotation) Head – Trade Finance (on rotation)
2. Basis of Preparation The financial statements have been prepared in accordance with statutory requirements prescribed under the Banking Regulation Act, 1949.
The accounting and reporting policies of Societe Generale India used in the preparation of these financial statements is the accrual method of accounting and historical cost convention and it conforms with Generally Accepted Accounting Principles in India (“Indian GAAP”), the guidelines issued by Reserve Bank of India (“RBI”) from time to time, Accounting Standards (AS) specified under Section 133 of the Companies Act, 2013, read with Rule 7 of the Companies (Accounts) Rules, 2014 and the relevant provisions of the 2013 Act, as applicable and practices generally prevalent in the banking industry in India.
3. Use of estimates The preparation of the financial statements requires Management to make estimates and assumptions that affect the reported amounts of assets,
liabilities (including contingent liabilities) as at the date of the financial statements, revenues and expenses during the period. Although these estimates are based upon management’s best knowledge of current events and actions, actual results could differ from those estimates. Any revision to the accounting estimates is recognized prospectively in current and future periods.

8
SOCIETE GENERALE(Incorporated in France as a Public Limited Company)
Corporate & INDIAN BRANCHESInvestment BankIng
july 15, 2016 vol lI No 29 EPW Economic & Political Weekly
4. Significant Accounting Policies 4a. Transactions involving foreign exchange (a) Foreign currency monetary assets, liabilities and off Balance Sheet items are translated at the Balance Sheet date at exchange rates notified
by the Foreign Exchange Dealers’ Association of India (‘FEDAI’). The resulting gains or losses are accounted in the Profit and Loss Account. (b) Foreign exchange positions are revalued at the rates notified by FEDAI. The resulting gains or losses are recognized in the Profit and Loss Account. (c) Income and expenditure in foreign currency is translated at the exchange rates prevailing on the date of the transaction. (d) Monetary assets and liabilities, contingent liabilities on accounts of guarantees, endorsements and other obligations denominated in
foreign currencies are stated at the exchange rates notified by FEDAI at the Balance Sheet date.4b. Investments Classification & income recognition As per the guidelines for investments laid down by the Reserve Bank of India (‘RBI’), the investment portfolio of the Bank is classified as on
the date of purchase under “Held to Maturity”, “Available for Sale” and “Held for Trading” categories. The Bank follows settlement date accounting for its investments.
Costs including brokerage and commission pertaining to investments, paid at the time of acquisition, are charged to the Profit and Loss Account. Cost of investments is computed based on the First-In-First-Out (FIFO) method
Profit/loss on sale of investments in the ‘Held to Maturity’ category is recognised in the Profit and Loss Account and Profit is thereafter appropriated (net of applicable taxes and statutory reserve requirements) to Capital Reserve.
Profit/loss on sale of investments in ‘Available for Sale’ and ‘Held for Trading’ categories is recognised in the Profit and Loss Account. Broken period interest (the amount of interest from the previous interest payment date till the date of purchase/sale of instruments) on debt
instruments is treated as a revenue item. Provision for non-performing investments is made based on a periodic review of investments as per Bank’s policy and after having considered
the provisioning guidelines issued by the RBI. Basis of classification Investments that are held principally for resale within 90 days from the date of purchase are classified under HFT category. Investments which
the Bank intends to hold till maturity are classified as HTM securities. Investments in the equity of subsidiaries/joint ventures are categorised as HTM in accordance with the RBI guidelines. Investments which are not classified in the above categories are classified under AFS category.
Short Sale The Bank undertakes short sale transactions in Central Government dated securities in accordance with RBI guidelines. The short position is
reflected as the amount received on sale and is classified under ‘Other Liabilities’. The short position is marked to market and loss, if any, is charged to the Statement of Profit and Loss while gain, if any, is ignored. Profit/Loss on settlement of the short position is recognised in the Statement of Profit and Loss.
Valuation & provisioning a) Treasury Bills, Commercial Paper and Certificates of Deposit being discounted instruments, are valued at carrying cost. b) Held to Maturity: Investments under this category are carried at cost of acquisition, adjusted for the premium, which is amortized over
the residual maturity of the security. Any diminution, other than temporary, in the value of such securities is provided for. Realized gains on sale of investments under HTM category are recognized in the Profit and Loss Account and the profit is thereafter
appropriated (net of taxes, if any and net of transfer to Statutory Reserve as applicable) to Capital Reserve Account in accordance with the RBI guidelines. Loss on sale is recognized in the Profit and Loss Account.
c) Available for Sale & Held for Trading: Investments in both of these categories are valued - at lower of cost of acquisition or market value as declared by Primary Dealers Association of India jointly with Fixed Income Money Market and Derivatives Association (‘FIMMDA’). Securities under each category are valued scrip-wise and depreciation/appreciation is aggregated for each classification. Net depreciation, if any, in aggregate for each classification is recognized in the Profit and Loss Account and net appreciation, if any, is ignored. Except in cases where provision for diminution other than temporary is created, the book value of the individual securities is not changed as a result of periodic valuations.
d) Quoted investments are valued based on prices declared by Primary Dealers Association of India jointly with Fixed Income Money Market and Derivatives Association (FIMMDA) periodically, subsidiary general ledger account transactions and price list of RBI.
e) Market value of investments where current quotations are not available is determined as per the norms laid down by the RBI as under: (i) Market value of unquoted Government Securities, where interest is received regularly, is derived by applying a mark-up above the
corresponding ‘yield to maturity’ for Government Securities of equivalent maturity put out by FIMMDA. (ii) In case of unquoted bonds and debentures, where interest is received regularly, the market price is derived based on the ‘yield to
maturity’ for Government Securities as suitably marked up for credit risk applicable to the credit rating of the instrument. Transfer between categories: Reclassification of investments from one category to the other, if done, is in accordance with RBI guidelines and
any such transfer is accounted for at the lower of acquisition cost/book value/market value, as at the date of transfer. Depreciation, if any, on such transfer is fully provided for.
Accounting for Repo/Reverse Repo: In accordance with RBI circular No. IDMD 4135/11.08.43/2009-10 dated 23rd March, 2010, Repo and Reverse Repo transactions in securities are accounted for as collateralised borrowing and lending transactions respectively. The borrowing cost on repo transactions is accounted as Interest Expense and revenue on reverse repo transactions is accounted as Interest Income.
Repo and reverse repo transactions with the RBI under the Liquidity Adjustment Facility (LAF) are accounted for as secured borrowing and lending transactions.
4c. Advances Advances are classified as performing and non-performing advances (‘NPAs’) based on the RBI guidelines and are stated net of bills rediscounted,
specific provisions, interest in suspense for non-performing advances, claims received from Export Credit Guarantee Corporation, provisions for funded interest term loan classified as non-performing advances and provisions in lieu of diminution in the fair value of restructured assets. Also, NPAs are classified into sub-standard, doubtful and loss assets. Interest on NPAs is transferred to an interest suspense account and not recognised in the Profit and Loss Account.

9
SOCIETE GENERALE(Incorporated in France as a Public Limited Company)
Corporate & INDIAN BRANCHESInvestment BankIng
Economic & Political Weekly EPW july 15, 2016 vol lI No 29
Provisions for non-performing advances have been made based on a periodic review of advances as per the Bank’s policy, which comply with the provisioning guidelines issued by the RBI. Specific loan loss provision in respect of non-performing advances is charged to the Profit and Loss Account. Any recoveries made by the Bank in case of NPAs written off are recognized in the Profit and Loss Account.
In accordance with RBI guidelines and prudential provisioning norms, the Bank has provided general provision on standard assets including credit exposures computed as per the current marked to market values of interest rate and foreign exchange derivative contracts at levels stipulated by RBI from time to time and disclosed in Schedule 5 –“Other liabilities and provisions”.
Further to the provisions required to be held according to the asset classification status, provisions are held for individual country exposures (other than for home country exposure). Countries are categorised into risk categories as per Export Credit Guarantee Corporation of India Ltd. (‘ECGC’) guidelines and provisioning is done in respect of that country where the net funded exposure is one percent or more of the Bank’s total assets.
For entities with Unhedged Foreign Currency Exposure (UFCE), provision is made in accordance with the guidelines issued by RBI, which requires to ascertain the amount of UFCE, estimate the extent of likely loss and estimate the riskiness of un-hedged position. This provision is classified under Schedule 5 – Other Liabilities in the balance sheet.
The Bank does not have a policy of creating floating provisions. In accordance with RBI guidelines, accelerated provision is made on non-performing advances which were not earlier reported by the Bank
as Special Mention Account under “SMA-2” category to Central Repository of Information on Large Credits (CRILC). Accelerated provision is also made on non-performing advances which are erstwhile SMA-2 accounts with Aggregate exposure (AE) ‘1,000 million or above and Joint Lenders’ Forum (JLF) is not formed or they fail to agree upon a common Corrective Action Plan (CAP) within the stipulated time frame.
4d. Fixed Assets (a) Fixed assets are stated at historical cost less accumulated depreciation/amortisation and adjusted for impairment, if any. Cost includes
cost of purchase inclusive of freight, duties, incidental expenses and all expenditure like site preparation, installation costs and professional fees incurred on the asset before it is ready to put to use. Subsequent expenditure incurred on assets put to use is capitalised only when it increases the future benefit/functioning capability from/of such assets.
(b) Depreciation is provided using the Straight Line Method as per the useful lives of the assets estimated by the management, or at the useful life prescribed under part “C” of schedule II of the Companies Act, 2013 whichever is lower. Depreciation on tangible fixed assets has been provided on the straight-line method as per the useful life prescribed in schedule II to the companies Act, 2013 except in respect of the premises, software and motor vehicle in which case the life of the assets has been assessed as under based on the nature of the assets, estimated usage of the asset.
Assets Useful Life Schedule II Premises 23 years 60 years Improvement to own premises 10 years Furniture and Fixtures 10 years 10 years Office Equipments 5 years 5 years Computers 3 years 3 years Software 4 years 6 years Motor Vehicles 4 years 8 years Leasehold Improvements Over the life of the lease (c) Depreciation on improvements to leased premises is based on the primary period of the lease of such premises. (d) All fixed assets purchased in a block of 10 or less individually costing less than Rs. 30,000/- are fully charged to the Profit and Loss
Account in the year of purchase. (e) Profit on sale of premises, if any, is transferred to Capital Reserve as per the RBI guidelines. (f) Fixed assets that have been retired from active use and are held for disposal are stated at the lower of their net book value and net realisable
value and are shown separately in the financial statements. Any expected loss is recognised immediately in the profit and loss statement.4e. Staff Retirement Benefits (a) Provident Fund The eligible employees of the Bank are entitled to receive benefits under the provident fund, a defined contribution plan, in which both
employees and the Bank make monthly contributions at a specified percentage of the covered employees’ salary (currently 12% of employees’ salary), which is recognised as an expense in the Profit and Loss Account during the period. The contributions as specified under the law are paid to the provident fund set up as irrevocable trust by the Bank. The Bank is generally liable for annual contributions and any shortfall in the fund assets based on the government specified minimum rates of return and recognises such contributions and shortfall, if any, as an expense in the year incurred.
(b) Gratuity The Bank provides for its gratuity liability which is a defined benefit scheme, based on actuarial valuation at the Balance Sheet date
carried out by an independent actuary using the Projected Unit Credit Method. The actuarial gains or losses arising during the year are recognized in the Profit and Loss Account and are not deferred. The Bank makes contribution to a Gratuity Fund administered by trustees and managed by a life insurance company.
(c) Pension The Bank has a pension scheme, which is a defined contribution plan for employees participating in the scheme. The contributions are
accounted for on an accrual basis and charged to the Profit and Loss account. (d) Short term compensated absences are provided for based on estimates, by charging to the Profit and Loss Account. (e) Long Service Awards The Bank provides lump sum benefits linked to final eligible salary after completing each 5 years of service. The detailed actuarial
valuation of the present value of the defined benefit obligations may be made at the interval not exceeding three years. However, with a view that the amount recognized in the financial statement do not differ materially from the amount that would be determined at the balance sheet date, the most recent valuation is reviewed at the balance sheet date and updated to reflect any material transactions and other material changes in circumstances (including changes in interest rate) between the date of valuation and the balance sheet date. The fair value of any plan assets is determined at each balance sheet date.

10
SOCIETE GENERALE(Incorporated in France as a Public Limited Company)
Corporate & INDIAN BRANCHESInvestment BankIng
july 15, 2016 vol lI No 29 EPW Economic & Political Weekly
4f. Net Profit/(Loss) The net profit/ (loss) disclosed in the Profit and Loss Account is after provisions, if any, for: ● taxes (including deferred tax) ● non-performing advances ● standard assets and derivatives ● diminution in the value of investments ● other necessary provisions4g. Derivatives Notional amounts of derivative transactions comprising of forwards, swaps, futures and options are disclosed as off Balance Sheet exposures.
The Bank recognises all derivative contracts (other than those designated as hedges) at fair value, on the date on which the derivative contracts are entered into and are re-measured at fair value as at the Balance Sheet or reporting dates. Changes in the fair value of derivatives other than those designated as hedges are recognised in the Profit and Loss Account.
All outstanding derivative transactions are recorded as Off-Balance Sheet items. The trading positions are Mark to market on a daily basis whereas hedge deals are recorded on accrual basis.
MTM receivables and payables are being disclosed in the Financials on a gross basis4h. Taxes on Income Tax expense comprises of current and deferred tax. Current income tax is determined in accordance with the Income-tax Act, 1961 and the
rules framed there under. Deferred tax adjustments comprise of changes in the deferred tax assets and liabilities. Deferred tax reflects the impact of the timing differences between taxable income and accounting income for the year
Deferred tax is measured based on the tax rates and the tax laws enacted or substantively enacted at the Balance Sheet date. Deferred tax assets are recognised only to the extent that there is reasonable certainty that sufficient future taxable income will be available against which such deferred tax assets can be realised. In situations where the Bank has unabsorbed depreciation or carry forward tax losses, all deferred tax assets are recognised only if there is virtual certainty, supported by convincing evidence that they can be realised against future taxable profits.
At each Balance Sheet date the Bank re-assesses unrecognised deferred tax assets. It recognizes previously unrecognised deferred tax assets to the extent that it has become reasonably certain or virtually certain, as the case may be that sufficient future taxable income will be available against which such deferred tax assets can be realized.
The carrying amount of deferred tax assets is reviewed at each Balance Sheet date and appropriately adjusted to reflect the amount that is reasonably/virtually certain to be realised.
Wealth tax liability is determined in accordance with the provisions of the Wealth Tax Act, 1957.4i. Revenue Recognition (i) Interest income is recognized in the Profit and Loss Account as it accrues, except in the case of interest on non-performing assets which
is recognized on receipt basis as per income recognition and asset classification norms of the RBI. (ii) Commission received on guarantees and letters of credit issued is amortised on a straight-line basis over the period of the contract. (iii) Loan processing fee is recognized as income when due. (iv) Income on discounted instruments is recognized over the tenure of the instrument on a straight line basis.4j. Lease transactions Lease of assets under which all the risks and benefits of ownership are actively retained by the lessor are classified as operating leases. Payments
made under operating leases are charged to the Profit and Loss Account on a straight line basis over the lease term.4k. Provisions, contingent liabilities and contingent assets The Bank estimates the probability of any loss that might be incurred on outcome of contingencies on the basis of information available up to
the date on which the financial statements are prepared. A provision is recognised when an enterprise has a present obligation as a result of a past event and it is probable that an outflow of resources will be required to settle the obligation, in respect of which a reliable estimate can be made. Provisions are not discounted and are determined based on management estimates of amounts required to settle the obligation at the Balance Sheet date, supplemented by experience of similar transactions. These are reviewed at each Balance Sheet date and adjusted to reflect the current management estimates. In cases where the available information indicates that the loss on the contingency is reasonably possible but the amount of loss cannot be reasonably estimated, a disclosure to this effect is made in the financial statements. In case of remote possibility neither provision nor disclosure is made in the financial statements. The Bank does not account for or disclose contingent assets, if any.
Provisions for onerous contract are recognized when the expected benefits to be derived by the Bank from a contract are lower than the unavoidable cost of meeting the future obligation under the contract. The provision is measured at the present value of the expected cost of terminating the contract and the expected net cost of continuing with the contract. Before a provision is established, the Bank recognizes any impairment loss on the asset associated with that contract.
4l. Cash and cash equivalents Cash and cash equivalents include cash in hand, balances with RBI, balances with other banks and money at call and short notice(including
the effect of changes in exchange rates on cash and cash equivalents in foreign currency).4m. Impairment The carrying amounts of assets are reviewed at each Balance Sheet date if there is any indication of impairment based on internal/external factors.
Impairment loss, if any, is provided in the Profit and Loss Account to the extent of carrying amount of assets exceeds their estimated recoverable amount.4n. Segment Information The disclosure relating to segment information is in accordance with the guidelines issued by RBI.4o. Societe Generale has policy of allocating certain costs incurred centrally by Head Office, subsidiaries and branches based on group cost
allocation methodology.

11
SOCIETE GENERALE(Incorporated in France as a Public Limited Company)
Corporate & INDIAN BRANCHESInvestment BankIng
Economic & Political Weekly EPW july 15, 2016 vol lI No 29
Schedule18 -NOTES APPENDED TO AND FORMING PART OF THE FINANCIAL STATEMENTS FOR THE yEAR ENDED 31 MARCH, 2016
All amts in Rs. ‘000s, unless otherwise stated1. Internal Controls over Financial Reporting The Apex Committee of the Bank certifies that it has laid down the internal financial controls to be followed by the Bank and that such controls
are adequate and were operating effectively.2. Capital: The Bank’s capital adequacy ratio as on March 31, 2016 computed under Basel III is given below: Rs. ‘000s Sr. Particulars As at As at No. 31st March, 2016 31st March, 2015 i) Common Equity Tier I Capital (%) 18.87% 17.77% ii) Tier I Capital (%) 18.87% 17.77% iii) Tier II Capital (%) 7.93% 7.36% iv) Total CRAR % 26.80% 25.13% v) Percentage of the shareholding of the Government of India – – vi) Amount of Tier I capital 9,117,584 8,383,161 vii) Amount of Additional Tier I capital – viii) Amount of Tier II Capital of which – Subordinated Debt from Head Office 3,468,170 3,090,740 – Others 361,873 380,874 Amount of Tier II Capital 3,830,043 3,471,614 (ix) Total Capital 12,947,627 11,854,775 (x) Total Risk weighted Assets 48,310,074 47,172,116
Subordinated Debt: Rs. ‘000s Particulars 31.03.2016 31.03.2015 EUR 46 million for a period of 10 years 3,468,170 3,090,740
The subordinated debt is revalued, at the year end and the resulting gain or loss on revaluation is recognized in the Profit and Loss Account. The Subordinated debt as revalued as on March 31, 2016 amounts to Rs. 3,468,170 (P.Y Rs. 3,090,740).
3. Investments in India – Value of Investments: Rs. ‘000s Particulars 31.03.2016 31.03.2015 Gross value of investments in India* 16,657,590 12,085,508 Provision for depreciation in India* – – Net value of investments in India* 16,657,590 12,085,508 * The Bank has not made any investment outside India Movement in provision for depreciation on investments: Rs. ‘000s Particulars 2015-16 2014-15 Opening Balance at beginning of the year – 578 Add: Provisions made during the year – – Less: Write-off/write-back of excess provisions during the year – (578) Closing Balance at end of the year – –
4. Repos and Reverse Repos (i) Details of Repos and Reverse Repos including Liquidity Adjustment Facility (in face value terms): Rs. ‘000s Particulars Minimum Maximum Daily average As at 31.03.2016 outstanding outstanding outstanding during the year during the year during the year Securities sold under repos – Government Securities – 4,845,600 181,986 – – Corporate Debt Securities – – – – Securities purchased under reverse repos – – – – – Government Securities – 1,040,000 5,315 – – Corporate Debt Securities
Particulars Minimum Maximum Daily average As at 31.03.2015 outstanding outstanding outstanding during the year during the year during the year Securities sold under repos – Government Securities – 4,618,700 406,441 – – Corporate Debt Securities – – – – Securities purchased under reverse repos – – – – – Government Securities – 2,222,700 16,970 – – Corporate Debt Securities – – – –

12
SOCIETE GENERALE(Incorporated in France as a Public Limited Company)
Corporate & INDIAN BRANCHESInvestment BankIng
july 15, 2016 vol lI No 29 EPW Economic & Political Weekly
5. Non-SLR Investment Portfolio: (i) Issuer Composition of Non SLR investments as at 31.03.2016 No Issuer Amount Extent of Extent of ‘below Extent of Extent of private investment ‘unrated’ ‘unlisted’ placement grade’ Securities Securities Securities (1) (2) (3) (4) (5) (6) (7) 1 PSUs – – – – – 2 FIs – – – – – 3 Banks – – – – – 4 Private Corporates – – – – – 5 Subsidiaries/Joint Ventures – – – – – 6 Others – – – – – 7 Provision held towards depreciation – – – – – Total – – – – –
Issuer Composition of Non SLR investments as at 31.03.2015 No Issuer Amount Extent of Extent of ‘below Extent of Extent of private investment ‘unrated’ ‘unlisted’ placement grade’ Securities Securities Securities (1) (2) (3) (4) (5) (6) (7) 1 PSUs – – – – – 2 FIs – – – – – 3 Banks – – – – – 4 Private Corporates – – – – – 5 Subsidiaries/Joint Ventures – – – – – 6 Others * – – – – – 7 Provision held towards depreciation – – – – – Total – – – – –
(ii) Non performing Non-SLR Investments: Nil (P.Y. – Nil) and total provision held: Nil (P.Y. – Nil) (iii) During the year ended 31st March, 2016 and 31st March 2015, the sale of securities from HTM portfolio was within 5% of the book
value of instrument in HTM category at the beginning of the year. During the year ended 31st March 2016 and 31st March 2015 there was no transfer of securities to/from HTM category.
6. Derivatives (i) Forward rate agreements/Interest Rate Swaps outstanding: Rs. ‘000s Items 31.03.2016 31.03.2015 The Notional principal of swap agreements 280,228,662 359,196,607 Loss which would be incurred if counterparties failed to fulfill their obligations under the agreements 1,640,472 1,426,274 Collateral required by the Bank upon entering into swaps Note (a) Note (a) Concentration of credit risk arising from the swaps % – Banks and Financial Institutions 99.998% 99.976% – Others 0.002% 0.024% Fair value of the swap book (31,528) (67,377)
(a) As per prevailing market practice, the Bank does not insist on collateral from the counterparties to these contracts. Nature and terms of interest rate swaps: Outstanding as at 31.03.16:
Nature No. Notional principal Terms (Rs.’ 000s) Trading Swaps 358 140,805,000 Floating Receivable v/s Fixed Payable linked to NSE MIBOR Trading Swaps 336 133,900,000 Fixed Receivable v/s Floating Payable linked to NSE MIBOR Trading Swaps 10 2,750,000 Floating Receivable v/s Fixed Payable linked to 6M MIFOR Trading Swaps 11 2,750,000 Fixed Receivable v/s Floating Payable linked to 6M MIFOR Trading Swaps 0 – Floating Receivable v/s Fixed Payable linked to 6M USD LIBOR Trading Swaps 0 – Fixed Receivable v/s Floating Payable linked to 6M USD LIBOR Trading Swaps 2 11,831 Floating Receivable v/s Fixed Payable linked to 3M USD LIBOR Trading Swaps 2 11,831 Fixed Receivable v/s Floating Payable linked to 3M USD LIBOR 719 280,228,662

13
SOCIETE GENERALE(Incorporated in France as a Public Limited Company)
Corporate & INDIAN BRANCHESInvestment BankIng
Economic & Political Weekly EPW july 15, 2016 vol lI No 29
Outstanding as at 31.03.15: Nature No. Notional principal Terms (Rs.’ 000s) Trading Swaps 454 176,455,000 Floating Receivable v/s Fixed Payable linked to NSE MIBOR Trading Swaps 460 176,130,000 Fixed Receivable v/s Floating Payable linked to NSE MIBOR Trading Swaps 11 3,000,000 Floating Receivable v/s Fixed Payable linked to 6M MIFOR Trading Swaps 13 3,500,000 Fixed Receivable v/s Floating Payable linked to 6M MIFOR Trading Swaps 0 – Floating Receivable v/s Fixed Payable linked to 6M USD LIBOR Trading Swaps 0 – Fixed Receivable v/s Floating Payable linked to 6M USD LIBOR Trading Swaps 2 55,804 Floating Receivable v/s Fixed Payable linked to 3M USD LIBOR Trading Swaps 2 55,804 Fixed Receivable v/s Floating Payable linked to 3M USD LIBOR 942 359,196,608
Nature and terms of forward rate agreements: Outstanding as at 31.03.2016: Nil (P.Y. – Nil) (ii) Risk Exposure in Derivatives: – Qualitative Disclosures The Bank undertakes transactions in Derivatives, namely, Foreign exchange forward contracts, Interest rate swaps, Currency interest
rate swaps within the limits approved. There is a clear segregation of duties between the front and back offices and each function independently. The global risk management systems of the Societe Generale group are adopted by the Indian branches for both market and credit risk.
The calculation of the various market risk parameters is undertaken both by the Banks Regional Office in Hong Kong (DFIN/MPC/MAC) and by the local Branch Risk Manager (BRM). The report along with exceptions, if any is circulated to the local management and front office. BRM monitors the limits based on the reports generated locally as well as the reports received from Regional Office.
Quantitative Disclosure as at 31.03.2016: Rs. ‘000s Sr. No. Particulars Currency Interest Rate
Derivatives # Derivatives 1 Derivatives (Notional Principal amount) a) For hedging – – b) For trading 70,640,478 280,228,662 2 Marked to Market Positions a) Assets (+) 728,221 1,640,472 b) Liability (–) (887,378) (1,671,999) 3 Credit Exposure 3,110,175 3,881,065 4 Likely impact of one percentage change in interest rate (100*PV01) a) on hedging derivatives – – b) on trading derivatives 26,909 146,984 5 Maximum of 100*PV01 observed during the year a) on hedging – – b) on Trading 26,909 159,374 6 Minimum of 100*PV01 observed during the year a) on hedging – – b) on Trading 12,734 1,521
Quantitative Disclosure as at 31.03.2015: Rs. ‘000s Sr. No. Particulars Currency Interest Rate Derivatives # Derivatives
1 Derivatives (Notional Principal amount) a) For hedging – – b) For trading 100,347,347 359,196,607 2 Marked to Market Positions a) Assets (+) 873,202 1,426,274 b) Liability (–) (1,491,470) (1,493,651) 3 Credit Exposure 3,835,303 4,296,340 4 Likely impact of one percentage change in interest rate (100*PV01) a) on hedging derivatives – – b) on trading derivatives 12,664 13,568 5 Maximum of 100*PV01 observed during the year a) on hedging – – b) on Trading 49,602 120,115 6 Minimum of 100*PV01 observed during the year a) on hedging – – b) on Trading 12,664 398 # Currency derivatives include forward foreign exchange contracts.

14
SOCIETE GENERALE(Incorporated in France as a Public Limited Company)
Corporate & INDIAN BRANCHESInvestment BankIng
july 15, 2016 vol lI No 29 EPW Economic & Political Weekly
(iii) Unhedged/uncovered foreign currency exposure The Bank’s foreign currency exposures as at March 31, 2016 that are not hedged /covered by either derivative instruments or otherwise
are within the Net Overnight Open Position limit (NOOP) and the Aggregate Gap limit, as approved by the RBI. NOOP as at March 31, 2016 is Rs. (137,262) (P.Y. – Rs. 163,062).
(iv) Exchange Traded Interest Rate Derivatives:
Sr. No. Particulars 31.03.2016 31.03.2015 1 Notional principal amount of exchange traded interest rate derivatives undertaken during the year. – – 2 Notional principal amount of exchange traded interest rate derivatives outstanding at the end of the year. – – 3 Notional principal amount of exchange traded interest rate derivatives outstanding and not “highly effective”. – – 4 Mark to market value of exchange traded interest rate derivatives outstanding and not “highly effective”. – –
(v) Credit default swaps: The Bank has not entered into any Credit Default Swap transactions.
7. Asset Quality (i) Non-Performing Assets
Particulars 2015-16 2014-15
Net NPAs to Net Advances (%) – – Gross Non-Performing Advances – Opening Balance at beginning of the year – 4,286 Additions during the year – – Less: Amounts recovered – 4,286 Less: Amounts written off – – Closing Balance at end of the year – – Provisions for Non-Performing Advances (excluding provision for standard assets) Opening Balance at beginning of the year – 4,286 Add: Provisions made during the year – – Less: Write-off/write-back of excess provisions during the year – 4,286 Closing Balance at end of the year – – Net Non-Performing Advances Opening Balance at beginning of the year – – Additions during the year – – Less: Amounts recovered – – Less: Amounts written off – – Closing Balance at end of the year – –
(ii) Details of financial assets sold to Securitization/Reconstruction Company for Asset Reconstruction
No financial assets have been sold to Securitization/Reconstruction Company for Asset Reconstruction during the year (P.Y. – Nil)
(iii) Details of non-performing financial assets purchased/sold
No non-performing financial assets have been purchased/sold from/to other banks during the year (P.Y. - Nil)
(iv) Provision on Standard Assets
Rs. ‘000s
Particulars 31.03.2016 31.03.2015 Standard Advances* 201,184 211,967 Credit Exposure on Derivatives 27,990 32,527 Total 229,174 244,494
* includes provision towards un-hedged foreign currency exposure of Rs. 10,443 (in ‘000s) (P.Y Rs. 17,681 in 000s).

15
SOCIETE GENERALE(Incorporated in France as a Public Limited Company)
Corporate & INDIAN BRANCHESInvestment BankIng
Economic & Political Weekly EPW july 15, 2016 vol lI No 29
(v) Particulars of Accounts Restructured The following tables set forth, for the periods indicated, details of loan assets subjected to restructuring. As at 31st March, 2016 Sr. Type of Restructuring Others no. Asset Classification Standard Sub-Standard Doubtful Loss Total Details
1 Restructured No. of borrowers – – – – – Accounts as on April 1 of the Amount outstanding – – – – – FY (opening figures)* Provision thereon – – – – – 1A Movement in Opening Balances No. of borrowers – – – – – (Recoveries) Amount outstanding – – – – – Provision thereon – – – – – 2 Fresh Restructuring during the year No. of borrowers – – – – – Amount outstanding – – – – – Provision thereon – – – – – 3 Upgradations to restructured No. of borrowers – – – – – standard category during the FY Amount outstanding – – – – – Provision thereon – – – – – 4 Restructured Standard Advances which No. of borrowers – – – – – cease to attract higher provisioning Amount outstanding – – – – – and/ or additional risk weight at the end Provision thereon – – – – – of the FY and hence need not be shown as restructured standard advances at the beginning of the next FY 5 Downgradations of restructured No. of borrowers – – – – – accounts during the FY Amount outstanding – – – – – Provision thereon – – – – – 6 Write-offs of restructured accounts No. of borrowers – – – – – during the FY Amount outstanding – – – – – Provision thereon – – – – – 7 Restructured Accounts as on March No. of borrowers – – – – – 31 of the FY (closing figures*) Amount outstanding – – – – – Provision thereon – – – – –
As at 31st March, 2015
Sr. Type of Restructuring Others no. Asset Classification Standard Sub-Standard Doubtful Loss Total Details 1 Restructured No. of borrowers – – – – – Accounts as on April 1 of the Amount outstanding – – – – – FY (opening figures)* Provision thereon – – – – – 1A Movement in Opening Balances No. of borrowers – – – – – (Recoveries) Amount outstanding – – – – – Provision thereon – – – – – 2 Fresh Restructuring during the year No. of borrowers – – – – – Amount outstanding – – – – – Provision thereon – – – – – 3 Upgradations to restructured No. of borrowers – – – – – standard category during the FY Amount outstanding – – – – – Provision thereon – – – – – 4 Restructured Standard Advances which No. of borrowers – – – – – cease to attract higher provisioning Amount outstanding – – – – – and/ or additional risk weight at the end Provision thereon – – – – – of the FY and hence need not be shown as restructured standard advances at the beginning of the next FY 5 Downgradations of restructured No. of borrowers – – – – – accounts during the FY Amount outstanding – – – – – Provision thereon – – – – – 6 Write-offs of restructured accounts No. of borrowers – – – – – during the FY Amount outstanding – – – – – Provision thereon – – – – – 7 Restructured Accounts as on March No. of borrowers – – – – – 31 of the FY (closing figures*) Amount outstanding – – – – – Provision thereon – – – – –
* ExcludingthefiguresofStandardRestructuredAdvanceswhichdonotattracthigherprovisioningorriskweight(ifapplicable) TherearenocasesrestructuredonaccountofCDRmechanismorSMEdebtrestructuringinthecurrentorpreviousyear.

16
SOCIETE GENERALE(Incorporated in France as a Public Limited Company)
Corporate & INDIAN BRANCHESInvestment BankIng
july 15, 2016 vol lI No 29 EPW Economic & Political Weekly
8. Business Ratios:
Particulars 2015-16 2014-15 Interest Income as a percentage to Working Funds** 6.20% 7.05% Non-Interest Income as a percentage to Working Funds** 1.17% 1.09% Operating profit& as a percentage to Working Funds** 1.71% 1.54% Return on assets $ 0.88% 0.73% Business per employee (Rs. 000s)#@ 687,784 571,869 Profit per employee (Rs. 000s)# 5,592 3,406
** WorkingFundsrepresentstheaverageoftotalassetsasreportedtoRBIbytheBankinFormXunderSection27oftheBankingRegulationAct, 1949.
$ Netprofitasapercentagetoworkingfunds # Productivity ratios are based on average employee numbers. @ Business means total of advances and deposits as at year end, excluding interbank deposits & OperatingProfit=InterestIncome+OtherIncome–InterestExpenses–OperatingExpenses % Previousyear’sfiguresarenotreclassifiedtoconformtocurrentyear’spresentation.9. Exposures (i) Exposure to Real Estate Sector* Rs. ‘000s Category 31.03.2016 31.03.2015 a) Direct exposure: (i) Residential mortgages – – (ii) Commercial real estate – – (iii) Investments in mortgage backed securities (MBS) and other securitised exposures: a) Residential b) Commercial Real Estate – – b) Indirect exposure: Fund based and non-fund based exposures on National Housing Bank (NHB) andf housing finance companies (HFCs) – – Total Real Estate Exposure – – * – On limit basis or outstanding basis whichever is higher. (ii) Exposure to Capital Market* Rs. ‘000s
No Particulars 31.03.2016 31.03.2015 1 Direct investments made in equity shares, convertible bonds, convertible
debentures and units of equity-oriented mutual funds the corpus of which is not exclusively invested in corporate debt – – 2 Advances against shares, bonds, debentures or other securities or on clean
basis to individuals for investment in equity shares (including IPO's/ESOPS), convertible bonds or convertible debentures, units of equity oriented mutual funds – –
3 Advances for any other purposes where shares or convertible bonds or convertible debentures or units of equity oriented mutual funds are taken as primary security – –
4 Advances for any other purposes to the extent secured by collateral security of shares or convertible bonds or convertible debentures or units of equity oriented mutual funds i.e. where the primary security other than shares/convertible bonds/convertible debentures/units of equity oriented mutual funds does not fully cover the advances – –
5 Secured and unsecured advances to stockbrokers and guarantees issued on behalf of stockbrokers and market makers 100,000 100,000
6 Loans sanctioned to Corporates against the security of shares/bonds/debentures or other securities or on clean basis for meeting promoter's contribution to the equity of new companies in anticipation of raising resources – –
7 Bridge loans to companies against expected equity flows/issues – – 8 Underwriting commitments taken up in respect of primary issue of shares
or convertible bonds or convertible debentures or units of equity oriented mutual funds – –
9 Financing to stockbrokers for margin trading – – 10 All exposures to venture capital funds (both registered and unregistered)
deemed to be on par with equity and hence reckoned for capital market exposure. – –
Total Exposure to Capital Market 100,000 100,000 *–Basislimitbasisoutstanding,whicheverishigher.

17
SOCIETE GENERALE(Incorporated in France as a Public Limited Company)
Corporate & INDIAN BRANCHESInvestment BankIng
Economic & Political Weekly EPW july 15, 2016 vol lI No 29
(iii) Country Risk Exposure Rs. ‘000s
Risk Category Exposure (net) Provision held Exposure (net) Provision held as at 31.03.16 as at 31.03.16 as at 31.03.15 as at 31.03.15 Insignificant 4,788,966 7,816 4,451,914 10,056 Low 2,543,441 2,821 812,027 – Moderate 1,381,243 30,688 1,709,319 34,950 High 140,239 – 187,500 – Very High 25,369 – 153,814 – Restricted – – – – Off-Credit – – – –
Total 8,879,258 41,325 7,314,574 45,006
The Bank has compiled the data for the purpose of this disclosure (from its internal MIS system and has been furnished by the management) which has been relied upon by the auditors.
(iv) Disclosure on Single/Group Borrower Limits During the year 2015-16, the Bank’s credit exposures to single borrowers and group borrowers were within the limits prescribed by
Reserve Bank of India. However, due to a merger sanctioned by the Hon. High Court of Delhi, between our two of our clients, viz. “Vodafone Mobile Services Limited” and “Vodafone Spacetel Limited”, belonging to the same Corporate Group, the Bank found itself to have exceeded the exposure on a single counterparty, to the extent of the merger. However, the Group Borrower Limits were not exceeded, either before or after the merger. The Bank has already initiated necessary steps in informing the Clients, to reduce exposure, on maturity of the facilities drawn.
The Bank does not consider its exposure to financial institutions including Banks for purpose of monitoring individual and group exposure limits as per RBI guidelines.
During the year 2014-15, the Bank’s credit exposures to single borrowers and group borrowers were within the limits prescribed by Reserve Bank of India.
(v) Unsecured Advances There are no advances for which intangible security such as charge over the rights, licenses, authority, etc. are accepted as collateral by
the Bank.10. Disclosures for the dealings with the Group entities 31 March 2016 Rs. ‘000s Sr. Type of Entity Name of Entity Total Intra Group Total Exposure No. Exposure [(E)= as per cent of (A)+(B)+(C) - (D)] Paid-up Capital and Reserves 1 BRD GROUPE SOCIETE GENERALE SA 16,246 0.18% 2 KOMERCNI BANK 525,598 5.83% 3 ROSBANK 66,255 0.74% 4 SG ASIA HOLDINGS (INDIA) PVT LTD 100,000 1.11% 5 SOCIETE GENERALE ALGERIE 74,321 0.82% 6 Subsidiary – SOCIETE GENERALE CHINA LIMITED 509,718 5.66% 7 Parent SOCIETE GENERALE GLOBAL SOLUTION CENTRE PVT. LTD. 48,875 0.54% 8 SG MAROCAINE CASABLANCA 2,058 0.02% 9 SOGECAP SPOLKA AKCYJNA ODDZIAL W POLSCE 45,068 0.50% 10 SG DE BANQUES EN COTE DIVOIRE 11,793 0.13% 11 SOCIETE GENERALE SENEGAL 9,142 0.10% 12 CREDIT DU NORD 20,909 0.23%
Total Intra Group Exposure 1,429,983
Total Exposure of the Bank 87,142,813
% of Intra-group exposure to total exposure of the bank 1.64%
Note: The exposures to M/s. ALD Automotive Private Limited are excluded from the above computation of Intra Group Exposures for F.Y. 2015-16 based on the exemption as per Master Circular on Intra Group Transactions and Exposures DBOD.No.BP.BC.96/21.06.102/2013-14 dated February 11, 2014 reference no. 3.4.C. The Letter of Comfort is issued by Societe Generale Paris (Head Office of Societe Generale India) for the facility sanctioned by Societe Generale India to M/s. ALD Automotive Private Limited.
During the Financial Year 2015-16 there was no breach in intra-group exposure, during the previous Financial Year 2014-15 there was a breach in case of two group entities namely ALD Automative Pvt. Ltd. and SG Algeria.

18
SOCIETE GENERALE(Incorporated in France as a Public Limited Company)
Corporate & INDIAN BRANCHESInvestment BankIng
july 15, 2016 vol lI No 29 EPW Economic & Political Weekly
31 March 2015 Rs. ‘000s Sr. Type of Entity Name of Entity Total Intra Group Total Exposure No. Exposure [(E)= as per cent of (A)+(B)+(C) - (D)] Paid-up Capital and Reserves 1 ALD Automotive Private Limited 1,799,964 20.90 2 BRD Groupe SG Bucharest 3,251 0.04 3 Credit Du Nord 143 0.00 4 Komercini Bank 551,059 6.40 5 Subsidiary – Rosbank 2,020 0.02 6 Parent SG Asia Holdings (India) Pvt Ltd 100,000 1.16 7 SG Algerie 2,190,485 25.43 8 SG China Limited 105,900 1.23 9 SG Global Solution Centre Pvt Ltd 39,476 0.46 10 SG Marocaine,Casablanca 7,353 0.09 Total Intra Group Exposure 4,799,651 Total Exposure of the Bank 85,364,211 % of Intra-group exposure to total exposure of the bank 5.62%
Limits breached as at March 31, 2015 Rs. ‘000s Entity Amount Total Exposure as per cent of Paid-up Capital and Reserves ALD Automotive Private Limited 1,799,964 20.90 SG Algeria 2,190,485 25.43
11. Asset Liability Management Maturity Pattern of certain items of assets and liabilities as at 31.03.2016 Rs. ‘000s
Day 1 2 to 7 8 to 14 15 to 28 29 days to Over 3 Over 6 Over 1 Over 3 Over 5 Total Particulars days days days 3 months Months Months year to years to years to 6 to 12 3 years 5 years months months
Loans and Advances 4,985,343 536,991 653,610 1,298,175 4,424,575 2,838,014 532,665 18,727,579 1,395,102 105,104 35,497,168 Investment 5,890,934 – – 4,211,494 3,071,089 2,255,628 131,530 321,501 1,304 774,110 16,557,590 Deposits 791,553 2,855,593 1,842,339 4,185,000 19,439,217 4,674,949 504,507 1,313,245 5,705 – 35,612,108 Borrowings – 3,951,435 808,311 – 2,252,670 – – – – 3,468,170 10,480,586 Foreign Currency Assets 843,020 313,378 403,748 416,473 2,157,174 1,429,096 29 4,381,231 – – 9,944,419 Foreign Currency Liabilities 438,867 2,451,558 808,311 4,553 2,252,670 2,903 477,090 76,612 – 3,468,170 9,980,734
Maturity Pattern of certain items of assets and liabilities as at 31.03.2015 Rs. ‘000s
Day 1 2 to 7 8 to 14 15 to 28 29 days to Over 3 Over 6 Over 1 Over 3 Over 5 Total Particulars days days days 3 months Months Months year to years to years to 6 to 12 3 years 5 years months months
Loans and Advances 2,804,184 134,140 1,005,601 1,155,759 4,545,601 3,292,359 2,153,267 19,763,469 1,304,361 189,213 36,347,954 Investment 1,823,035 – – 3,654,999 4,990,879 1,203,707 143,592 267,969 1,327 – 12,085,508 Deposits 505,844 162,176 4,211,500 2,922,939 17,560,651 2,746,384 286,175 1,618,650 5,658 – 30,019,977 Borrowings – 5,851,130 – – 3,125,000 – – – – 3,090,740 12,066,870 Foreign Currency Assets 364,411 125,140 968,934 785,232 3,262,444 2,306,951 8,446,857 – – – 16,259,969 Foreign Currency Liabilities 218,168 3,851,163 - - 3,125,000 1,812 2,896,963 - - 6,164,170 16,257,276
Classification of assets and liabilities under the different maturity buckets is based on the same estimates and assumptions as used by the Bank for compiling the return submitted to the RBI which has been relied upon by the auditors. Maturity profile of foreign currency assets and liabilities is excluding off Balance Sheet transactions.
12. Concentration of Deposits, Advances, Exposures and NPAs a) Concentration of Deposits Rs. ‘000s
Particulars 31.03.2016 31.03.2015 Total deposits of twenty largest depositors 34,586,405 29,691,869 % of deposits of twenty largest depositors to total deposits 97.12% 98.91%

19
SOCIETE GENERALE(Incorporated in France as a Public Limited Company)
Corporate & INDIAN BRANCHESInvestment BankIng
Economic & Political Weekly EPW july 15, 2016 vol lI No 29
b) Concentration of Advances* Rs. ‘000s Particulars 31.03.2016 31.03.2015 Total advances to twenty largest borrowers 34,916,440 34,310,418 % of advances of twenty largest borrowers to total advances 40.07% 40.19%
* AdvancescomputedbasedondefinitionofCreditExposureincludingderivativesasperMasterCircularonExposureNorms DBR.No.Dir.BC.12/13.03.00/2015-16datedJuly1,2015. TheBankhascompiledthedataforthepurposeofthisdisclosure(fromitsinternalMISsystemandhasbeenfurnishedbythemanagement)
whichhasbeenrelieduponbytheauditors. c) Concentration of Exposures** Rs. ‘000s Particulars 31.03.2016 31.03.2015 Total exposure to twenty largest borrowers/customers 34,916,440 34,310,418 % of exposures to twenty largest borrowers/customers to total advances 40.07% 40.19%
** Exposures represent credit, derivatives and investment exposure as prescribed in Master Circular on Exposure Norms DBR.No.Dir.BC.12/13.03.00/2015-16datedJuly1,2015.
TheBankhascompiledthedataforthepurposeofthisdisclosure(fromitsinternalMISsystemandhasbeenfurnishedbythemanagement)whichhasbeenrelieduponbytheauditors.
d) Concentration of NPAs Rs. ‘000s
Particulars 31.03.2016 31.03.2015 Total exposure to top four NPA accounts* – –
* RepresentsGrossexposure13. Sector Wise Advances Rs. ‘000s Particulars 2015-16 2014-15 Sr. Sector* Outstanding Gross Percentage Outstanding Gross Percentage No. Total NPAs of Gross Total NPAs of Gross Advances Gross NPAs to Advances NPAs to Total Total Advances Advances in that in that sector sector A Priority Sector 1 Agriculture and allied activities 200,000 – 0.00% – – 0.00% 2 Advances to industries sector eligible as priority sector lending 11,530,565 – 0.00% 8,235,726 – 0.00% 3 Services 537,399 – 0.00% 2,061,042 – 0.00% 4 Personal loans – – 0.00% – – 0.00% Sub-total (A) 12,267,964 – – 10,296,768 – B Non Priority Sector 1 Agriculture and allied activities – – 0.00% – – 0.00% 2 Industry 18,492,556 – 0.00% 22,152,829 – 0.00% 3 Services 4,736,658 – 0.00% 3,896,409 – 0.00% 4 Personal loans – – 0.00% 1,948 – 0.00% Sub-total (B) 23,229,214 – 0.00% 26,051,186 0.00% Total (A+B) 35,497,178 – 0.00% 36,347,954 0.00% * TheBankhascompiledthedataforthepurposeofthisdisclosure(fromitsinternalMISsystemandhasbeenfurnishedbythemanagement)
whichhasbeenrelieduponbytheauditors.14. Movement of NPAs Rs. ‘000s Particulars 2015-2016 2014-2015 i. Net NPAs to Net Advances % – – ii. Movement of NPAs (Gross) – Gross NPAs as on 1st April (opening balance) – 4,286 Additions (Fresh NPAs) during the year – – Sub-total (A) – 4,286 Less: – (i) Up gradations – – (ii) Recoveries (excluding recoveries made from upgraded accounts) – 4,286 (iii) Technical/Prudential Write-offs – – (iv) Write-offs other than those under (iii) above – – Sub-total (B) – 4,286 Gross NPAs as on 31st March (closing balance) (A-B) – –

20
SOCIETE GENERALE(Incorporated in France as a Public Limited Company)
Corporate & INDIAN BRANCHESInvestment BankIng
july 15, 2016 vol lI No 29 EPW Economic & Political Weekly
14. Movement of NPAs (Continued) Rs. ‘000s Particulars 2015-2016 2014-2015 iii. Movement of Net NPAs – a. Opening balance – – b. Additions during the year – – c. Reductions during the year – – d. Closing balance – – iv. Movement of provisions for NPAs (excluding provisions on standard assets) – a. Opening balance – 4,286 b. Provisions made during the year – – c. Write-off/write-back of excess provisions – 4,286 d. Closing balance – –
Movement of Technical Write-offs and Recoveries: Rs. ‘000s
Particulars 2015-2016 2014-2015 Opening balance of Technical/Prudential written-off accounts as at 1st April – – Add: Technical/Prudential write-offs during the year – – Sub-Total (A) – – Less: Recoveries/Reductions made from previously Technical/Prudential written-off accounts during the year (B) – – Closing Balance as at 31st March (A-B) – –
15. The Provision Coverage Ratio (PCR) of the Bank after considering technical write-off is NIL as at 31st March, 2016 (previous year: Nil).16. Overseas Assets, NPAs and Revenue Rs. ‘000s Particulars 31.03.2016 31.03.2015 Total Assets – – Total NPAs – – Total Revenues – –
17. Off Balance Sheet SPVs sponsored (which are required to be consolidated as per accounting norms)- Domestic and Overseas: NIL (P.Y. – Nil)18. The bank has not undertaken any factoring business during the Financial Year 2015-16 (P.Y. Nil).19. Miscellaneous (i) Amount of provisions made for Income-Tax during the year Rs. ‘000s Particulars 2015-16 2014-15 – Current tax expense 382,000 388,000 – Deferred tax expense/(benefit) 175,971 (13,660) TOTAL 557,971 374,340
(ii) Disclosure of Penalties imposed by RBI The Reserve Bank of India, in terms of the circular dated July 24, 2010 bearing ref. IDMD.DOD.17/11.01.01 (B) 2010-11, imposed a
penalty of INR 500,000/- (P.Y. 774,387) for ‘SGL bouncing’ for the security shortfall incident that occurred in the Financial Year 2014-15. During the Financial year 2014-15, Reserve Bank of India levied penal interest of Rs. 53,238 u/s 46(4) of the Banking Regulation Act,
1949 due to shortfall in CRR maintenance. (iii) Bancassurance Business Rs. ‘000s Nature of Income 2015-16 2014-15 Selling life insurance policies – – Selling non life insurance policies – – Selling mutual fund products – – Others (to be specified) – – (iv) Operating Expenses: The major components of other expenditure are as follows: Rs. ‘000s Particulars 2015-16 2014-15 Outsourced Expenses 11,116 4,512 Professional Fees 11,617 22,493 Travel Expenses 17,374 14,395 GTR Expenses 27,622 –20. Disclosures as per Accounting Standards (AS) issued by the Institute of Chartered Accountants of India (ICAI) (i) Employee Benefits- AS 15 Provident Fund: The contribution to the employee’s provident fund amounted to Rs. 15,460 for the year ended 31 March 2016 (P.Y. – Rs. 15,581) Pension Fund: The contribution to the employee’s pension fund amounted to Rs. 12,217 for the year ended 31 March 2016 (P.Y. – Rs. 16,132) Gratuity: The Bank’s gratuity scheme is managed by Life Insurance Corporation of India Ltd. Based on an actuarial valuation the insurance
company claims the difference between the present value of the gratuity obligation and the fund value.

21
SOCIETE GENERALE(Incorporated in France as a Public Limited Company)
Corporate & INDIAN BRANCHESInvestment BankIng
Economic & Political Weekly EPW july 15, 2016 vol lI No 29
The details of the Bank’s post retirement benefit plans for gratuity for its employees in accordance with AS 15(R) are given below which are certified by the actuary and relied upon by the auditors:
Rs. ‘000s Reconciliation of Defined Benefit Obligations 2015-16 2014-15
Present Value of the Obligation at the beginning of the year 47,725 34,776 Interest cost 4,017 3,506 Current service cost 5,630 4,047 Benefits paid (12,730) – Actuarial gain/(loss) on obligations (3,047) 5,396 Present Value of the Obligation at the end of the year 41,594 47,725
Reconciliation of Fair Value of Plan Assets 2015-16 2014-15 Fair Value Plan Assets at the beginning of the year 32,147 23,220 Expected return on Plan Assets 2,452 1,988 Employer's contribution 8,955 6,684 Benefits paid (12,730) – Actuarial gain /(loss) on obligations (63) 255 Assets distributed on settlements – – Fair Value Plan Assets at the end of the year 30,761 32,147
Amount to be recognized in Balance Sheet 2015-16 2014-15 Present Value of funded obligations 41,593 47,725 Fair value of Plan Assets (30,761) (32,147) Present Value of unfunded obligations – – Unrecognized past service cost – – Amount not recognized as an asset – – Net (Asset)/Liability in Balance Sheet under "Other Assets/Other Liabilities and Provisions" 10,832 15,578
Amount to be recognized in Profit and Loss Account 2015-16 2014-15 Current service cost 5,630 4,047 Interest on defined benefit obligation 4,017 3,506 Expected Return on Plan Assets (2,452) (1,988) Net Actuarial losses/(gains) recognized during the year (2,985) 5,141 Past service cost – – Total expense recognized in the Profit & Loss Account under "Payments to and Provision for Employees" 4,210 10,706 Actual Return on Plan Assets 2,389 2,243
Experience Adjustments # 2015-16 2014-15 2013-14 2012-13 2011-12 Defined Benefit Obligation 41,594 47,725 34,776 42,566 34,734 Plan Assets 30,761 32,147 23,220 32,370 31,297 Surplus/(Deficit) (10,832) (15,578) (11,556) (10,196) (3,437) Exp. Adj. on plan liabilities (4,037) 1,215 (796) 4,760 (807) Exp. Adj. on plan assets (63) 255 (188) 628 556
Summary of Principal Actuarial Assumptions 2015-16 2014-15 Discount Rate (p.a.) 7.80% 8.05% Expected rate of return on assets (p.a.) 7.50% 7.50% Salary Escalation rate (p.a.) 7.00% 10.00% for first year & 7% thereafter Mortality rate Indian Assured Indian Assured Lives Mortality Lives Mortality (2006-2008) (2006-2008)
Particulars 2015-16 2014-15
Expected Employer’s Contribution for next year 10,000 8,000

22
SOCIETE GENERALE(Incorporated in France as a Public Limited Company)
Corporate & INDIAN BRANCHESInvestment BankIng
july 15, 2016 vol lI No 29 EPW Economic & Political Weekly
As the Gratuity Fund is managed by a Life Insurance Company, details of Investment are not available with the Bank. Leave Encashment: The Bank charged an amount of Rs. 3,504 as liability for leave encashment for the year ended 31 March, 2016
(P.Y. – Rs. 4,977) Long Service Awards: The actuarial liability for Long Service Awards in accordance with AS-15 (R) was Rs. 2,652 (‘000s) for the year
ended 31 March, 2016. Prior to 31 March 2016, provision for Long Service Awards was provided on pro-rata basis (Rs. 3,647). (ii) Segment Reporting- AS 17 (a) The Bank in India operates as a single unit and there are no identifiable geographical segments. (b) The Bank has classified its business into the following segments, namely: ● Treasury – primarily comprising of trading in forex, bonds, government securities and derivatives. ● Other Banking Operations – comprising of Corporate Banking and Trade Finance. ● Residual Operations – comprising of services recharged to the SG network. (c) Segment revenues stated below are aggregate of Schedule 13 – Interest income and Schedule 14 – Other income after considering
the net inter-segment fund transfer pricing. (d) Segment result is net of expenses both directly attributable as well as allocated costs of support functions. (e) Segment assets and liabilities include the respective amounts directly attributable to each of the segments. Rs. ‘000s Business Segments/ Treasury Other Banking operations Residual Operations Total Particulars 31.03.2016 31.03.2015 31.03.2016 31.03.2015 31.03.2016 31.03.2015 31.03.2016 31.03.2015
Gross Revenue 149,481 338,967 4,223,069 4,023,761 19,321 28,583 4,391,871 4,391,311 Intersegment revenue (106,365) (188,626) 106,365 188,626 – – – – Segment Revenue 43,116 150,341 4,329,434 4,212,387 19,321 28,583 4,391,871 4,391,311 Unallocated Revenue – – – – – – 422,154 – Results (260,837) (394,153) 953,273 1,138,747 19,321 24,845 1,133,911 769,439 Unallocated Expenses – – Operating Profit 1,133,911 769,439 Income Tax (557,971) (374,340) Extraordinary Profit/Loss – – Net profit 575,940 395,099
OTHER INFORMATION Segment Assets 10,524,708 19,305,721 48,214,101 46,927,890 – 9,464 58,738,809 66,243,075 Unallocated assets 964,833 1,225,758
Total Assets 59,703,642 67,468,833
Segment Liabilities 13,701,773 27,686,280 45,641,015 39,791,925 – 5,053 59,342,788 67,483,258 Unallocated Liabilities 360,854 (14,425) Total Liabilities 59,703,642 67,468,833
Geographical Segment
Business Segments/Particulars Domestic International Total 2015-16 2014-15 2015-16 2014-15 2015-16 2014-15 Revenue 4,814,025 4,391,311 – – 4,391,311 Assets 59,747,642 67,043,260 – – 67,043,260
SegmentalInformationisprovidedaspertheMISavailableforinternalreportingpurposes,whichincludescertainestimatesandassumptions.The methodology adopted in compiling and reporting the above information has been relied upon by the auditors.
(iii) Related Party Disclosures - AS 18 (a) The transactions of the Bank with related parties in terms of Accounting Standard 18 on “Related Party Disclosures” notified under
the Companies (Accounting Standards) Rules, 2006 and the related guidelines issued by RBI are detailed below except where there is only one entity/ person in any category of related parties.
(b) The details of related parties are as under: Parent Société Générale, France - Head Office and its branches: The Bank has considered transactions between itself and its Parent and other branches of the Parent as ‘one entity’ and accordingly as
per the guidance on compliance with the accounting standards by banks issued by the Reserve Bank of India, has not disclosed details pertaining to them.

23
SOCIETE GENERALE(Incorporated in France as a Public Limited Company)
Corporate & INDIAN BRANCHESInvestment BankIng
Economic & Political Weekly EPW july 15, 2016 vol lI No 29
Subsidiaries/Joint ventures of the parent
1. ALD Automotive Pvt Ltd 2. BRD Groupe SG Bucharest 3. Credit Du Nord 4. Komercini Banka 5. Newedge Broker India Pvt Ltd. 6. Rosbank 7. Société Générale Marocaine De Banques, Casablanca 8. SG Spolka Akcyjna W Polsce 9. SG-Social Security Bank Limited 10. SG Asia Holding (India) P Ltd 11. Société Générale de Banques en Cote d'Ivoire 12. SG Hambros Bank Trust,Guernsey 13. SG Global Solution Centre Pvt Ltd 14. SG Wealth Management Solution Pvt Ltd 15. Société Générale Cyprus 16. Societe Generale (China) Ltd. 17. Société Générale Algérie 18. Societe Generale De Banques Au Benin 19. Socuete Generale Dr Banques Au Senegal 20. Union De Banques Arabes
Key Management Personnel: Names: Evelyne Collin - Chief Executive & Chief Country Officer (01st January 2015 till date) Nancera Moreau - Chief Operating Officer - India (25th August 2014 till 25th August 2015) Lokesh Chaturvedi – Chief Operating Officer – India (01st July 2015 till date)
Details of Remuneration paid: FY 2015-2016 (Rs. ‘000s): 45,217 FY 2014-2015 (Rs. ‘000s): 28,919
Disclosure in respect of transactions with subsidiaries of Head Office: Rs. ‘000s Particulars 31.03.2016 Maximum 31.03.2015 Maximum Outstanding Outstanding during the year during the year Deposits 18,584,498 23,731,310 18,387,768 30,320,810 Advances 352,993 2,123,193 1,586,353 1,843,891 Non-Funded Commitments 2,966,890 3,802,747 2,659,536 2,771,690 Receivables 760 760 913 913 Payables 196,468 196,468 193,935 193,935
The information is as certified by the management and relied upon by the auditors. Rs. ‘000s Particulars 2015-16 2014-15 Interest Expense 1,315,356 14,00,334 Interest Income 78,072 82,888 Rendering of Services* 13,673 11,641 Receipt of Services 121,117 81,457
*includesfeeincomeonNon-fundedCommitmentsandForeignExchangetransactions
Material related party transactions are given below: The following were the material transactions between the Bank and its related parties for the year ended 31 March 2016. A specific
related party transaction is disclosed as a material related party transaction wherever it exceeds 10% of all related party transactions in that category.
Purchase of Fixed Assets During the year ended March 31, 2016, the Bank purchased fixed assets from SG Global Solution Centre Pvt. Ltd. amounting to Rs. NiL
(P.Y. – Rs. 2,667).

24
SOCIETE GENERALE(Incorporated in France as a Public Limited Company)
Corporate & INDIAN BRANCHESInvestment BankIng
july 15, 2016 vol lI No 29 EPW Economic & Political Weekly
Interest Expense Interest on deposits paid to SG Asia Holding (India) P Ltd Rs. 1,058,324 (P.Y. – Rs. 784,165), Newedge Broker India Pvt Ltd Rs. 170,248
(P.Y. – Rs. 555,973), Societe Generale Global Centre Pvt. Ltd. Rs. 86,750 (P.Y. – Rs. 60,103) Interest Income Interest on loans from ALD Automotive Pvt Ltd Rs. 77,864 (P.Y. – Rs. 82,121) Rendering of Services Fee and Commission Income/Other Income/Income on Foreign Exchange transactions received from ALD Automotive Pvt. Ltd.
Rs. 1,526 (P.Y. Rs. 1,890), SG Global Solution Centre Pvt. Ltd. Rs. 3,591 (P.Y. Rs. 3,402), Komercini Bank Rs. 2,814 (P.Y. – Rs. 2,065) and SG Algeria Rs. 839 (P.Y. – Rs. 1,252), SG Asia Holding( India) Pvt. Ltd Rs.2,185 (P.Y. – Rs. 1,022), RosBank Rs. 1211 (P.Y. – Rs 431).
Receipt of Services Payment to ALD Automotive Pvt. Ltd. Rs. 7,253 (P.Y. Rs. 6,800) towards car leasing services and SG Global Solution Centre Pvt. Ltd.
Rs. 113,864 (P.Y. Rs 74,656) towards back office support and software services. (iv) Lease Accounting- AS 19 (a) Nature of Lease – Operating Lease for motor cars, office premises and residential premises for staff (b) Minimum Lease Payments over the non-cancelable period of the lease: Rs.11,891 (P.Y.- Rs. 25,543) Rs. ‘000s Particulars 2015-16 2014-15
Up to 1 year 11,891 13,652 1-5 years – 11,891 Above 5 years – – TOTAL 11,891 25,543
(c) Lease payments recognized in the Profit and Loss Account during the year: Rs. 39,115 (P.Y. Rs. 49,198) (d) The lease agreements do not have any undue restrictive or onerous clauses other than those normally prevalent in similar agreements
regarding use of assets, lease escalation clauses, renewals and a restriction on sub-leases. (v) Taxes on Income-AS 22 In accordance with Accounting Standard 22 on “Accounting for taxes on income” issued by the Institute of Chartered Accountants of India,
the Bank has recognized Deferred Tax Asset (DTA) on timing differences to the extent there is reasonable certainty based on contracts and arrangements in place which will enable the Deferred Tax Asset to reverse:
Rs. ‘000s Particulars 31.03.2016 31.03.2015
Deferred Tax Asset – Accumulated Losses – – – Provision for doubtful debts 18,339 47,201 – Amortization of Premium on HTM Securities 480 386 – Provision for employee benefits 15,944 14,540 Deferred Tax Liability – Fixed Assets 222,057 73,450 Net Deferred Tax Asset/(Liability) (187,294) (11,323)
Note: The increase in Deferred Tax Liability on Fixed Assets was on account of Timing Difference arisen due to sale of premises held for sale.
(vi) Other than Internally generated Intangible assets Rs. ‘000s
Application Software 31.03.2016 31.03.2015 Gross Block At cost as at 31st March of the preceding year 459,762 454,509 Additions during the year 42,542 5,253 Deductions during the year – – TOTAL: 502,304 459,762 Depreciation/Amortization As at 31st March of the preceding year 259,137 146,764 Charge for the year 117,839 112,373 Deductions during the year – – Depreciation to date 376,976 259,137 Net block 125,328 200,625

25
SOCIETE GENERALE(Incorporated in France as a Public Limited Company)
Corporate & INDIAN BRANCHESInvestment BankIng
Economic & Political Weekly EPW july 15, 2016 vol lI No 29
(vii) Capital Commitments Rs. ‘000s Capital Commitments 31.03.2016 31.03.2015 Estimated amount of contracts remaining to be executed on capital account and not provided for. – 16,553
21. Additional Disclosures (i) Termination Benefits Payments to and provision for employees includes Rs. Nil (P.Y: Nil) towards termination benefits. (ii) Employee Stock Options Société Generale (Parent) provides its employees worldwide the opportunity to become shareholders of the company on preferential
terms as part of the annual capital increase reserved for the employees. All eligible employees can participate in the “International Group Savings Plan” and subscribe to Societe Generale shares within their individual entitlement during the limited period of subscription.
The preferential terms includes a discount to the reference price and an “Employers Matching Contribution” up to the specified limit per employee. Payments to and provision for employees includes Rs. Nil (P.Y: Rs. 2,092) towards this scheme. There is no future liability in respect of this scheme.
(iii) Provisions and Contingencies Description of Contingent Liabilities Claims against the Bank not acknowledged as debt This represents legal claim filed against the Bank in its normal course of business and tax claims/demands raised by the Income tax
authorities, which are disputed by the Bank. The Bank has been advised by RBI vide its letter dated February 2, 2016 to apply for compounding of an alleged FEMA violation related
to a client account in private banking operations. The matter is under consideration and the contingent liability, if any, is not ascertainable on balance sheet date.
Liability on account of forward exchange and derivative contracts The Bank enters into foreign exchange contracts, currency options, forward rate agreements, currency swaps, interest rate swaps and
interest rate options on its own account and for customers. The notional amounts that are recorded as contingent liabilities form the basis for the calculation of the interest component on the contracts where applicable.
Guarantees given on behalf of constituents, Acceptances, Endorsements and other obligations As a part of its normal banking activities, the Bank issues documentary credit and guarantees on behalf of its customers. Provisions and Contingencies recognized in the Profit and Loss Account include: Rs. ‘000s
PROVISIONS AND CONTINGENCIES 2015-16 2014-15 I. Taxation Charge – Current tax expense 382,000 388,000 – Deferred tax expense/ (benefit) 175,971 (13,660) II. Provision/(Write back) for loan losses – (4,286) III. Provision for Standard Assets (8,083) 38,886 IV. Provision for depreciation on Investments – (578) V. Provision for Un-hedged Foreign Currency Exposure (7,238) 17,681 VI. Provision for Country Risk (3,680) 4,908 VII. Others – 3,740 TOTAL 538,970 434,691
(iv) Floating Provisions: Nil (P.y. Nil) (v) Draw down from Reserves: Bank did not have draw downs from reserves during the year ended 31 March 2016. In accordance with the RBI requirement on creation
and utilization of Investment reserve in respect of HFT and AFS investments, amount of Rs. 246 (in’000s) was transferred to Investment reserve account during the year ended 31 March 2015.
(vi) Disclosure of Complaints:
Sr. No. Customer Complaints 2015-16 2014-15 a) No. of complaints pending at the beginning of the year – 1 b) No. of complaints received during the year 1 – c) No. of complaints redressed received during the year 1 1 d) No. of complaints pending at the end of the year – –
The above information does not include complaints redressed within 1 working day and is as certified by the Management and relied upon by the auditors.

26
SOCIETE GENERALE(Incorporated in France as a Public Limited Company)
Corporate & INDIAN BRANCHESInvestment BankIng
july 15, 2016 vol lI No 29 EPW Economic & Political Weekly
Disclosure of Awards passed by the Banking Ombudsman
Sr. No. Awards passed by the Banking Ombudsman 2015-16 2014-15 a) No. of unimplemented awards at the beginning of the year – – b) No. of awards passed by the Banking Ombudsmen during the year – – c) No. of awards implemented during the year – – d) No. of unimplemented awards at the end of the year – –
The above information is as certified by the Management and relied upon by the auditors. (vii) Disclosure of Letters of Comfort The Bank has not issued any Letter of Comfort during the year. The assessed cumulative financial obligation under the Letters of Comfort
issued and outstanding is Nil. (P.Y. Nil) (viii) Disclosures on Remuneration In accordance with the requirement of the RBI Circular No. DBOD.NO.BC.72/29.67/001/2011-12 dated 13 January 2012, the Bank has
submitted to the Reserve Bank of India a letter from the Head Office which states that the compensation policies in India including that for the Chief Executive Officer are in line with the Financial Stability Board (FSB) requirements.
(ix) Disclosure on Fixed Assets During the financial year bank sold the premises held for sale and the profit on sale of premises has been reported as profit from extra-
ordinary activities in Profit and Loss Statement. In accordance with RBI guidelines profit of Rs. 224,526 was transferred to Capital Reserve net of Statutory Reserve and net of tax (at effective tax rate).
(x) Disclosure on Corporate Social Responsibility (CSR) Expenditure (a) As per the provisions of section 135 of the Companies Act 2013, the Bank was required to spend INR 12,959 (‘000s) (b) Amount spent during the year Rs. ‘000s
Particulars Paid yet to be paid Total
(i) Construction/acquisition of any asset (ii) On purpose other than (i) above 5,250 – 5,250
During the year 2015-16, the Bank has spent Rs. 5,250 (‘000s) on various CSR activities, which is equivalent to 0.81% of its average net profits of the last three financial years. As an integral part of society, the Bank is aware of its corporate social responsibilities and has been engaged in community and social investment. The Bank stays committed to its corporate social responsibility and intends to continually increase the impact of its CSR initiatives. The Bank will make concerted efforts to spend the prescribed CSR amount in the subsequent years.
Since the CSR provisions in the Companies Act, 2013 were notified from April 01, 2014, our focus during the first financial year has been to build capacity and putting in place strong governance and policies as well as a robust monitoring framework to ensure optimal and effective utilization of the funds that will guide CSR spending in the coming years. The shortfall in CSR funding for financial year 2015-16 is on account of significant time spent on capacity building and development of internal framework to strengthen CSR monitoring and utilization as well as inability to identify and locate sufficient number of projects within our identified areas of intervention and which cleared our stringent due diligence on financial, regulatory and program parameters.
(xi) Disclosure on transfer to Depositor Education and Awareness Fund (DEAF) Rs. ‘000s
Particulars 2015-16 2014-15 Opening balance of amounts transferred to DEAF 1,376 – Add: Amounts transferred to DEAF during year 885 1,376 Less: Amounts reimbursed by DEAF towards claims – – Closing balance of amounts transferred to DEAF 2,261 1,376
(xii) Based on the available information, there are no outstanding dues towards principal amount or interest thereon remaining unpaid to any supplier covered under, Micro, Small and Medium Enterprises development Act, 2006 as at the end of the accounting year.
Further, no interest was due or payable by the Bank to any supplier during the year under the provisions of the said Act. (xiii) Unhedged Foreign Currency Exposures The Bank has provided for unhedged foreign currency exposure as per RBI master circular DBOD.No.BP.BC.1/21.04.048/2014-15 dated
01 July 2014 on prudential norms on income recognition, asset classification and provisioning pertaining to advances. The Bank considers all customers who have borrowed from the Bank and covers gross sum of all items on the customer’s balance sheet that has an impact on the profit and loss account due to movement in foreign exchange rates. While providing for unhedged foreign currency exposure, the Bank has considered both financial hedges and natural hedges. The Bank has internally devised the mechanism of identifying the un-hedged foreign currency exposure to individual clients based on their latest audited result. This has enabled the Bank to consider incremental provisioning under the RBI norm and adhere to the requirements.
Provision towards unhedged foreign currency exposure as on 31 March 2016 is Rs 10,443 (in ‘000s) (previous year: 17,681) and the capital held by the Bank towards this risk is Rs. 13,972 (in ‘000s) (previous year: 21,612).

27
SOCIETE GENERALE(Incorporated in France as a Public Limited Company)
Corporate & INDIAN BRANCHESInvestment BankIng
Economic & Political Weekly EPW july 15, 2016 vol lI No 29
(xiv) Liquidity Coverage Ratio (LCR) Rs. ‘000s
Sr. Particulars Quarter Ended Quarter Ended Quarter Ended Quarter Ended Quarter Ended No. 31-Mar-2016 31-Dec-2015 30-Sep-2015 30-June-2015 31-Mar-2015 Total Un- Total Total Un- Total Total Un- Total Total Un- Total Total Un- Total weighted Weighted weighted Weighted weighted Weighted weighted Weighted weighted Weighted Value Value Value Value Value Value Value Value Value Value (average) (average) (average) (average) (average) (average) (average) (average) (average) (average)
High Quality Liquid Assets 1 Total High Quality Liquid Assets (HQLA) 105,232 75,160 77,249 70,703 68,018 Cash Outflows 2 Retail deposits and deposits from small business customers, of which: 228 14 393 24 263 16 198 12 109 7 (i) Stable deposits 178 9 306 15 205 10 155 8 87 4 (ii) Less stable deposits 50 5 86 9 58 6 43 4 22 2 3 Unsecured wholesale funding, of which: 392,115 180,496 351,182 166,600 329,146 154,908 371,683 149,973 364,294 186,994 (i) Operational deposits (all counterparties) – – – – – – – – 5,070 2,090 (ii) Non-operational deposits (all counterparties) 392,115 180,496 351,182 166,600 329,146 154,908 371,683 149,973 329,304 154,984 (iii) Unsecured debt – – – – – – – – 29,920 29,920 4 Secured wholesale funding – – – – – 5 Additional requirements, of which 29,159 8,766 24,683 7,485 31,185 9,516 33,790 10,285 14,236 4,647 (i) Outflows related to derivative exposures and other collateral requirements 26 26 114 114 230 230 211 211 537 537 (ii) Outflow related to loss of funding on debt products – – – – – – – – – – (iii) Credit and liquidity facilities 29,133 8,740 24,569 7,371 30,955 9,287 33,579 10,074 13,699 4,110 6 Other contractual funding obligations 7,840 7,840 6,914 6,914 2,357 2,357 1,188 1,188 18,279 8,657 7 Other contingent funding obligations 152,974 6,378 74,744 3,737 226,832 11,342 210,070 10,503 218,603 10,930 8 Total Cash Outflows 203,494 184,760 178,139 171,961 211,235 Cash Inflows 9 Secured lending – – – – – – – – – – 10 Inflows from fully performing exposures 1,581 1,581 687 687 1,583 1,583 13,983 13,983 40,848 20,772 11 Other cash inflows 153,337 78,700 169,227 87,824 128,813 65,370 90,656 45,348 91,868 46,217 12 Total Cash Inflows 154,918 80,281 169,914 88,511 130,396 66,953 104,639 59,331 132,716 66,989 Total adjusted value Total adjusted value Total adjusted value Total adjusted value Total adjusted value 13 Total HQLA* 105,232 75,160 77,249 70,703 68,018 14 Total Net Cash Outflows* 123,213 96,249 111,186 112,630 144,247 15 Liquidity Coverage Ratio (%)* 85.60% 81.48% 69.57% 65.00% 50.78%
* The average weighted, unweighted amounts, TOTAL HQLA, Total Net Cash Outflow, LCR are calculated taking simple average of month end numbers for each quarter. Qualitative Disclosure
1) In accordance with Basel III norms, the LCR requirement has been introduced by RBI for banks in India effective 1 January 2015 with a minimum 60% for the calendar year 2015, rising in equal steps each calendar year to reach the minimum 100% requirement by 1 January 2019. The minimum requirement for calendar year 2016 is 70.
2) LCR standard aims to ensure sufficient liquidity within the bank through High Quality Liquidity Assets (HQLA) to survive acute stress scenario lasting for 30 days, as it is expected that the bank will take appropriate corrective action within 30 days.
3) Banks HQLA primarily consists of GSEC investments above the SLR limit and Government securities within the mandatory SLR requirement, to the extent allowed by RBI under MSF and FALLCR.
4) The Bank’s ALCO is responsible for liquidity risk management on an overall basis, providing guidance to respective stakeholders within the Bank.
5) The amounts for the period April 2015 to February 2016 have been compiled from the LCR returns submitted by the Bank to RBI on a monthly basis.
(xv) Miscellaneous income includes Net Profit/(Loss) on derivative transactions Rs. 189,819 (P.Y. Rs. (826,446)) and recovery from network Rs. 19,320 (P.Y. Rs. 28,582)
(xvi) In terms of RBI Master Circular on Foreign Investments in India dated July 01, 2015, the bank does not have any subsidiary companies and as such no certificate was required from the statutory auditors on an annual basis as regards status of compliance with the instruction on downstream investments in compliance with the FEMA provisions.
(xvii) Previous year’s figures have been regrouped or rearranged, wherever necessary, to conform to current year’s presentation.
For Societe Generale – Indian Branches
Sd/- Sd/- Sd/- Ashok Krishnamoorthy Lokesh Chaturvedi Evelyne Collin Chief Financial Officer - India Chief Operating Officer Chief Executive and Chief Country Officer Place: Mumbai Date: June 24, 2016

28
SOCIETE GENERALE(Incorporated in France as a Public Limited Company)
Corporate & INDIAN BRANCHESInvestment BankIng
july 15, 2016 vol lI No 29 EPW Economic & Political Weekly
Basel III disclosures of the Indian Branches for the year ended 31 March 2016All amts in Rs. ’000s, unless otherwise stated
DF 1. Scope of application 1. Qualitative and Quantitative Disclosures: The Bank is subject to the capital adequacy guidelines stipulated by RBI, which are based on the framework of the Basel Committee on Banking
Supervision. As per Basel III guidelines, the Bank is required to maintain a minimum Capital to Risk Weighted Assets Ratio (CRAR) of 9% {11.5% including Capital Conservation Buffer (CCB)}, with minimum Common Equity Tier I (CET1) of 5.5% (8% including CCB) as on 31st March 2019. These guidelines on Basel III has been implemented on 1st April 2013 in a phased manner. The minimum capital required to be maintained by the Bank for the year ended 31st March 2016 is 9% with minimum Common Equity Tier 1 (CET1) of 5.5%.
The risk management framework of Indian operations is integrated with the Bank’s strategy and business planning processes at global level. The Bank has comprehensive risk management framework to monitor, evaluate and manage the principal risks assumed in conducting its activities. The risk management function in India is as per directives and framework set out at Head Office level.
As at March 31, 2016, the Bank does not have any investment in subsidiaries/Joint Ventures and Associates, significant minority equity investment in insurance, financial and commercial entities.
2. Capital structure Qualitative Disclosures Bank regulatory capital consists of two components – Tier 1 capital and Tier 2 capital. Both components of capital provide support for
banking operations and protect depositors. As per Reserve Bank of India (RBI) guidelines, the composition of capital instruments for foreign banks in India would include the following elements:
Tier 1 Capital: ● Interest-free funds received from Head Office ● Statutory reserves kept in Indian books ● Remittable surplus retained in Indian books which is not repatriable so long as the bank functions in India ● Capital Reserves ● Interest-free funds remitted from Head Office for acquisition of property Tier 2 Capital: ● General provisions and loss reserves: General provisions and loss reserves can be reckoned up to a maximum of 1.25 per cent of the total Credit risk-weighted assets. Such
provisions and reserves include provisions on Standard Assets, Country Risk Exposures, Unhedged Foreign Currency Exposures and Investment Reserve Account’.
● Head Office borrowings in foreign currency raised by foreign banks operating in India classified as subordinated debt subject to a maximum ceiling of 50% of the Tier 1 capital maintained in India.
Quantitative Disclosures (a) Tier 1 Capital (Rs. ‘000s) Amount Received from Head Office 6,754,150 Statutory Reserves 1,082,803 Remittable Surplus Retained in India for CRAR 817,132 Capital Reserves 243,757 Interest-free funds remitted from Head Office for acquisition of property 345,070 Less : Intangible Assets (125,328) Total Tier 1 Capital 9,117,584
(b) Tier 2 Capital (Rs. ‘000s) General Provisions 229,174 Investment Reserve 91,373 Country Risk Provisions 41,326 Total Tier 2 Capital 361,873
(c) Debt Capital Instruments Eligible for inclusion in Upper Tier 2 Capital (Rs. ‘000s) Total Amount Outstanding – of which amount raised during the current year – Amount eligible to be reckoned as capital funds –
(d) Subordinated Debt Eligible for inclusion in Lower Tier 2 Capital (Rs. ‘000s) Total amount outstanding 3,468,170 of which amount raised during the current year – Amount eligible to be reckoned as capital funds –
(e) Other deduction from capital. There are no other deductions from capital. (f) Total Eligible Capital The total eligible capital is Rs. 12,947,627 (‘000s).

29
SOCIETE GENERALE(Incorporated in France as a Public Limited Company)
Corporate & INDIAN BRANCHESInvestment BankIng
Economic & Political Weekly EPW july 15, 2016 vol lI No 29
DF 2. Capital Adequacy Qualitative Disclosures The Bank has assessed its capital requirement taking into account the 3 main risks as defined by Pillar 1 of the Basel III norms viz: Credit
Risk, Market Risk and Operational Risk. The Credit Risk is computed using the Standardised Approach, the Market Risk is calculated using the Standardised Duration Approach and the Operational Risk is calculated using the Basic Indicator Approach. The risk computation under each of these 3 categories is adequately covered by the Capital of the Bank.
The Bank has assessed its future capital requirement and the same has been documented in the ICAAP (Internal Capital Adequacy Assessment Process) based on the position as of March 31’2016. The capital requirement will be re-assessed taking into consideration the position of the Bank for the financial year ended March 31’2016.
The existing level of Capital is adequate to meet the Bank’s current and future business requirements and the CRAR ratio of the Bank is significantly higher than that prescribed by the regulators. A summary of the Bank’s capital requirement for credit, market and operational risk and the capital adequacy ratio as on 31st March 2016 is presented below:
Quantitative Disclosures (Rs. ‘000s) (a) Capital Requirements for Credit Risk: Portfolios subject to Standardised Approach 3,333,212 Securitisation Exposures – (b) Capital Requirements for Market Risk: Standardised Duration Approach : Interest Rate Risk 474,066 Foreign Exchange risk (including Gold) 180,000 Equity Risk – (c) Capital Requirement for Operational Risk: Basic Indicator Approach 247,945 Total Eligible Capital 12,947,627 Total Risk Weighted Assets 48,310,074 Total Capital Ratio 26.80 % Tier 1 Capital Ratio 18.87 %
DF 3. Credit risk: general disclosures Qualitative Disclosures Credit Risk has been defined as the risk of financial loss if counterparty defaults on an obligation under a contract. It arises mainly from direct
lending, off-balance sheet exposures such as guarantees and from the Bank’s investments in debt securities. Strategy and processes (including credit risk management policy of the Bank) The credit risk management framework is based upon Societe Generale group policies and revolves around certain key principles ● All transactions and facilities must be authorized in advance. ● All requests for authorizations relating to a specific client or client group are handled by a single operating division. ● All authorizations are given by an independent risk department, and approval rests on a framework based on internal counterparty risk
ratings, Loss given default and a risk-adjusted return on capital analysis ● There are internal caps on the total sub-investment grade exposure (defined as internal rating of 6 (six) or below), exposure to sensitive
sectors and on the extent of unsecured exposure. ● There are also specific controls on exposures to banks and financial institutions, designed to ensure against excessive risk concentration. Structure and Organization: The risk ratings are provided by operating divisions and are validated by the risk officers. The Risk department is independent of the operating
divisions. The local Risk department was separated from Credit department in December 2011. Risk ratings are included in all credit proposals and are factored into all credit decisions. These ratings are independently validated by respective Risk Divisions in Head Office or Regional Hubs.
There is a specialized and centralized department for financial institutions which is located in Paris. Scope and nature of risk reporting and measurement: The internal rating models measure counterparty risk (expressed as a probability of default by the borrower in one year) and transaction risk
(expressed as the amount that will be lost should a borrower default). An in house database stores all credit limits. The risk on counterparty exposure on market transactions is measured by modeling the future mark to market value of transactions, after taking
into effect netting and correlation effects. Non-performing advances: Non performing advances are identified by regular appraisals of the portfolio by management or in accordance with RBI guidelines, whichever
is earlier. Specific provision is made on a case by case basis, subject to minimum provisioning levels prescribed by RBI. Special attention is paid to early identification of problem exposures. The Bank’s approach towards problem exposures is:
● Quick identification and isolation of potential weak /non-performing credits for concentrated attention through inclusion in the watch list. Watch list discussions are attended by Senior Management, Head of Risk and the Relationship Manager.
● Continued and rigorous follow up of these credits with the intention to monitor a possible turnaround or an early exit. ● A structured and sustained pro-active approach complemented by a rigorous follow up procedures. For recognition of past due and impaired loans and advances, the Bank follows guidelines prescribed by Reserve Bank of India as contained
in circular DBOD.No.BP.BC.1/21.04.048/2013-14 dated July 01, 2013 on “Prudential norms on Income Recognition, Asset Classification and Provisioning pertaining to Advances” and other circulars/notifications issued by RBI during the course of the year in this regard.

30
SOCIETE GENERALE(Incorporated in France as a Public Limited Company)
Corporate & INDIAN BRANCHESInvestment BankIng
july 15, 2016 vol lI No 29 EPW Economic & Political Weekly
Quantitative Disclosures a) Total gross credit risk exposure Rs.’ 000s Fund Based (Note 1) Non Fund Based (Note 2) Total As at 31.03.2016 51,182,850 29,041,802 80,224,652
1. The above amounts represent exposures before credit risk mitigants. 2. Non fund based exposures excludes exposures pertaining to FX and Derivatives. b) Geographic distribution of exposures Rs.’ 000s As at 31.03.2016 Fund Based Non Fund Based Total Overseas – – – Domestic 51,182,850 29,041,802 80,224,652 Total 51,182,850 29,041,802 80,224,652
c) Industry type distribution of exposures Rs.’ 000s Industry Fund based Non fund based Total All Engineering 6,702,648 8,897,121 15,599,769 Basic Metal & Metal Products 15,000 – 15,000 Cement and Cement Products 355,000 2,109,070 2,464,070 Chemical and chemicals products 7,635,000 1,695,476 9,330,476 Food Processing 3,140,000 601,416 3,741,416 Gems and Jewellery 3,900,000 95,911 3,995,911 Infrastructure 4,500,000 350,000 4,850,000 Mining and Quarrying – 50,000 50,000 Other Industries 6,761,873 2,944,347 9,706,220 Other Residuary Advances 163 – 163 Petroleum (non-infra), Coal Products (non-mining) and Nuclear Fuels 400,000 234,901 634,901 Rubber, Plastic and their Products 1,250,000 750,000 2,000,000 Textiles 905,000 250,107 1,155,107 Vehicles, Vehicle Parts and Transport Equipments 4,565,000 203,320 4,768,320 Banking & Finance 7,663,166 17,778,293 25,441,459 NBFC 3,390,000 – 3,390,000 Total 51,182,850 35,959,963 87,142,813
d) Residual contractual maturity breakdown of assets Rs.’ 000s As at 31.03.2016 1 day 11,981,719 2-7 days 1,288,875 8-14 days 653,610 15-28 days 6,145,723 29 days -3 months 9,034,552 Over 3 months -6 months 5,493,893 Over 6 months -upto 1 year 2,538,000 Over 1 year -upto 3 years 19,266,681 Over 3 years to 5 years 1,396,634 Over 5 years 1,903,956 Total 59,703,642
e) Amount of NPAs (Gross) – NIL (P.Y. Rs.NIL) f) Net NPAs- Nil (P.Y. Nil) g) NPA Ratios Gross NPAs to gross advances 0.00% (P.Y.0.00%) Net NPAs to net advances- 0% (P.Y.0%) h) Movement of NPAs Rs.’ 000s Gross NPAs Provision Net NPA Opening balance – – – Additions – – – Reduction (including write backs/write offs) – – – Closing balance – – – i) Non performing investments – Nil j) Provisions held for non-performing investments – Nil

31
SOCIETE GENERALE(Incorporated in France as a Public Limited Company)
Corporate & INDIAN BRANCHESInvestment BankIng
Economic & Political Weekly EPW july 15, 2016 vol lI No 29
k) Movement of provisions for depreciation on investments Rs.’ 000s 2015-16 Opening Balance at beginning of the year – Add: Provisions made during the year – Less: Write-off/write-back of excess provisions during the year – Closing Balance at end of the year –
DF 4. Credit risk: disclosures for portfolios subject to the standardised approach Qualitative Disclosures The Bank relies on the ratings given by the following External Credit Rating Agencies (ECRAs) approved by the RBI to calculate its capital
requirement under the standardised approach for credit risk Domestic Credit Rating Agencies for external ratings of Indian Corporates: 1) Credit Analysis and Research Ltd.(CARE) 2) CRISIL. 3) India Ratings & Research Private Limited (earlier known as FITCH India) 4) ICRA Ltd, Brickwork Ratings India Pvt. Ltd., SMERA Ratings Limited The Bank has used issue-specific solicited ratings available in the public domain (for both Long Term and Short Term facilities) from the above
domestic rating agencies to allocate appropriate risk weighting for both funded as well as non-funded exposures on corporate customers. The mapping of external credit ratings and risk weights for corporate exposures is provided in the tables below: Riskweightmappingoflongtermcorporateratings
Long term ratings Risk weights
AAA 20% AA 30% A 50% BBB 100% BB & Below 150% Unrated 100%
Riskweightmappingofshorttermcorporateratings
Short Term Ratings CARE CRISIL FITCH ICRA Risk weights A1+ A1+ A1+ A1+ 20% A1 A1 A1 A1 30% A2 A2 A2 A2 50% A3 A3 A3 A3 100% A4 & D A4 & D A4 & D A4 & D 150% Unrated Unrated Unrated Unrated 100% The claims on banks incorporated in India and foreign banks branches in India, excluding investment in equity shares and other instruments
eligible for capital status are risk weighted as under:
CRAR % Scheduled Banks Other Banks > 9 20% 100% 6 to < 9 50% 150% 3 to < 6 100% 250% 0 < 3 150% 350% Negative 625% 625% International ECRAs for external ratings of Foreign Banks, Foreign Sovereigns, Foreign Public Sector Entities and Non-Resident Corporates: a) Fitch b) Moody’s c) Standard & Poor’s The mapping of external credit ratings and risk weights for the above entities are provided in the tables below to the extent applicable. Risk weight mapping of foreign banks Updated
S&P and Fitch ratings AAA to AA A BBB BB to B Below B Unrated Moody’s rating Aaa to Aa A Baa Ba to B Below B Unrated Risk weight 20% 50% 50% 100% 150% 50%

32
SOCIETE GENERALE(Incorporated in France as a Public Limited Company)
Corporate & INDIAN BRANCHESInvestment BankIng
july 15, 2016 vol lI No 29 EPW Economic & Political Weekly
Amount outstanding under various risk buckets: Rs.’ 000s As at 31.03.2016 Below 100 % risk weight 11,523,096 100 % risk weight 21,132,922 More than 100 % risk weight 2,749,136 Deducted – Total** 35,405,154
**The above Risk Weighted Assets excludes exposures to QCCP and CVA charge as at March 31, 2016.DF 5. Credit risk mitigation: disclosures for standardised approaches: Qualitative Disclosures Policy for collateral valuation and Management All corporate and institutional facilities are reviewed (and hence revalued) at least on an annual basis. All deeds of ownership/ titles related
to collateral are held in physical custody under the control of executives independent of the business. Unsecured exposures cannot exceed the overall ceiling fixed for such facilities.
The main categories of recognized collateral taken by the Bank conform to the list of eligible financial collateral advised in Section 7.3.5 of RBI’s Prudential guidelines on Capital Adequacy and Market discipline and include cash on deposits, marketable equities, and recognized debt securities.
The Bank also extends credit facilities against guarantees from international corporates and banks. For a corporate guarantee to be recognized as a credit risk mitigant, the guarantor must have a rating of A or above from Standard & Poor’s, Fitch and/or Moody’s.
The Bank is not active in securitization of standard assets in India. Quantitative Disclosures: As on March 31, 2016, the total exposure covered by eligible financial collateral after application of haircuts was Rs. 28,231 (P.Y. Rs. 4,913) DF 6. Securitisation: disclosure for standardised approach The Bank has not undertaken any securitization operation during the year. DF 7. Market risk in trading book Qualitative Disclosures Market risk arises out of the fluctuation in the interest rates, foreign exchange rates and the consequent change in the prices of various financial
instruments held by the Bank. The financial instruments are revalued on a daily basis as per the guidelines issued by the regulatory authorities. The change in the valuation of the financial instruments may result in profit or loss for the Bank.
The primary objective of Bank’s market risk management is the continuous and independent monitoring of positions, market and counterparty risks incurred by the Bank’s trading activities, and the comparison of these positions and risks with established limits.
Strategy and Process: All open Market Risk is subject to approved limits. The limits are set based on the projected business plan of the Risk Taking Unit, market
environment and the risk perception. The Risq/Mar limits are defined as per the HO Market Risk policy under which the requests for limits are made by the relevant business line accompanied by supporting rationale (viz. projected business plan and historical utilizations). Risq/Mar then reviews and validates the limits in discussion with the business lines. All approved limits are then recorded in the reference systems for Market Limits (Colibris). The approved Risq/Mar limits are also presented to the Bank’s ALCO, which reviews and revalidates the limits. The Risq/Mar limits are reviewed on an annual basis or if particular circumstances arise.
In addition to the Risq/Mar limits, SG India also has local Stress Test, portfolio-wise VaR and PV01 limits. The local limits setting process involves, initiation of the request for limits by TFO to Branch Risk Manager (BRM), which then reviews and validates the limits based on the rationale provided by the TFO. While reviewing the proposed limits, the BRM considers the business plan forecasts, past utilizations, market environment and risk perception. Subsequently, the limits are then presented to ALCO for its approval. The ALCO takes into consideration TFO’s capacity and capability to perform within the proposed limits evidenced by the experience of the Traders, controls and risk management, audit ratings and trading revenues. Post approval by the ALCO, the limits are documented in the limits package of SG India and updated in all the relevant risk monitoring reports. SG India also has Stop Loss limits applicable to the trading desk that is approved by the ALCO and the respective business head at the SG’s Regional Office.
Structure and organisation of market risk management The local BRM is overall responsible for the management of Market Risk under support and guidance from the Market Risk Department
(Risq/Mar) at the HO Level. The local BRM, functions within the broad framework defined by Risq/Mar, HO and ensures compliance with the local regulatory requirements. It works independently of Front Office, who have no hierarchical authority over BRM and no pressure may be brought to bear by traders in relation to allocated limits or calculated risk amounts used by BRM. The Treasury Front Office (TFO) is the Risk Taking Unit within the bank. The primary responsibility for risk management of market transactions is held by TFO s as part of the ongoing management of their activities and the continuous monitoring of their positions.
Scope and nature of risk measurement, risk reporting and risk monitoring system: Market risk is monitored and controlled using parameters, such as , Value at Risk (VaR), Sensitivity limits (parallel shift in interest rates), net
open position limit (Foreign exchange positions) and stress test. The bank has set limits on each of these parameters and the utilizations are reported on a daily basis to the senior management.

33
SOCIETE GENERALE(Incorporated in France as a Public Limited Company)
Corporate & INDIAN BRANCHESInvestment BankIng
Economic & Political Weekly EPW july 15, 2016 vol lI No 29
All trading transactions are booked in the front office deal booking system called X-ONE. This system is capable of calculating the position and sensitivity on treasury transactions that are used by TFO to view the risk on their portfolio. . Additionally, TFO refers to another system called ‘Mercury’ to view the sensitivities on their positions. The Market Risk parameteres like VaR, stress tests, FTQ (flight to quality), Interest Rate sensitivity (10bps) and Forex Spot Position are computed by the Market Risk Department at HO (RISQ/MAR) using systems called RISK-ONE and AGRisk. The local BRM compiles the sensitivities and VaR report for the Bank’s portfolio using reports received from the Regional Office as well as those that are generated locally using RISK-ONE system. The SG’s VaR model uses historical simulation methodology based on a 1-day time horizon at the 99% confidence interval using a 1-year sliding window.
The bank has adopted stress testing as an integral part of its risk management framework and as such it is used to evaluate potential vulnerability to some unlikely but plausible events or movements in financial variable. While there is a well-defined global framework designed at the SG’s HO level on stress test, that covers all the geographical locations and markets including the Indian branches of SG, the bank has adopted a localized stress test framework in order to incorporate the local risk factors having an impact on the Bank’s portfolio. The Bank performs Market Risk Stress Test on a quarterly basis for both the Trading and accrual portfolios. The methodology, assumptions, scenarios and results of the Stress Test are presented to ALCO and APEX Committee for discussion and review.
Capital requirements for market risk: Rs.’ 000s Standardised duration approach As at 31.03.2016 Interest rate risk 474,066 Foreign exchange risk 180,000 Equity risk – Capital requirements for market risk 654,066
DF 8. Operational risk Qualitative disclosures The operational risk is defined as the risk of loss resulting from inadequate or failed internal processes, people and systems or from external
events, including events of low probability of occurrence, but with a risk of high loss. This definition includes legal risk but excludes strategic and reputation risks.
Strategy and Process The Bank has an Operational risk policy in place which classifies Operational Risk events into 8 major heads and 49 sub heads to map with
the Basel II Loss Event Type Classifications, Event Description, Corrective & Preventive Action plan and loss amounts & recoveries. The risk is managed through a system of prevention, control and coverage that comprises detailed procedures, permanent supervision, and insurance policies, further supported by reviews by the internal audit and the Head-office teams.
Structure and Organisation Implementation of the Operational Risk framework of the bank is done by the Operational Risk Manager under guidance of the Chief Operating
Officer and guidance from regional Security & Anti Fraud Expertise (SAFE) team responsible for Operational Risk topics. The framework rests on 5 pillars:-
Operational Loss Collection. Risk & Controls Self Assessment Permanent Supervision Key Risk Indicators Scenario Analysis The Operational Risk aspects are discussed in the monthly APEX Committee meeting & specific topics are discussed Operational Risk
Management Committee chaired by the Chief Executive Officer – India and participants from the respective Business Functions. Scope and nature of Risk reporting/measurement system The Bank has clearly defined the nature, scope of risk reporting by putting in place systems and thresholds for loss data collection, measurement
and reporting by category and sub category of events. The Bank’s internal classification has been mapped to the Basel II Loss Event Type Classifications. Based on this classification Risk Drivers (KRIs) that convey any control weakness that could cause an Operational Risk Event are identified and assessed through multiple evaluation questions.
The Bank also has a RCSA (Risk Control & Self Assessment) process in place which helps to evaluate the inherent risk in the business and the controls in place to mitigate it. The process covers all business units of the bank.
Hedging/Mitigating techniques The ORM policy is also designed to alert the operating divisions as soon as possible if they are vulnerable to risks so as to ensure that they
react immediately to reduce potential losses and/or the severity of such losses. The gaps/residual risk identified during the above mentioned RSCA exercise are addressed by implementing additional controls to ensure a robust ORM structure.
The Bank has adopted the Basic Indicator approach to compute the capital requirement for operational risk as prescribed by RBI. The Bank has made an application to the RBI for migrating to The Standardised Approach (TSA)/ Advanced Measurement approach (AMA).
DF 9. Interest rate risk in the banking book (IRRBB) In order to manage the risk optimally, the Interest Rate Risk in the Banking Book (IRRBB) is centralized within the ALM desk in Finance
department. The Head Office has assigned sensitivity limits on the IRRBB which also covers the capital and investments held in the HTM category. The risks arising out of various commercial banking activities are transferred to the ALM desk using the internal funds transfer pricing mechanism.
The ALM desk manages and hedges, if required, the IRRBB with Treasury under the guidance of the ALCO. The IRRBB is measured on a Quarterly basis.

34
SOCIETE GENERALE(Incorporated in France as a Public Limited Company)
Corporate & INDIAN BRANCHESInvestment BankIng
july 15, 2016 vol lI No 29 EPW Economic & Political Weekly
Quantitative Disclosures Market Risk Limits (Amounts in EUR) 1- Value at Risk : VAR 99% VAR Limit Usage Global 3,000,000 303,500 10% Trading 3,000,000 301,500 10%
2 -Interest Rate Sensitivity Limits (expressed in EUR for +10bps)
Parallel Limit Usage Global 500,000 42,616 9%
3- Stress Tests
Limit Usage Stress Test 20,000,000 1,867,000 9%
As required under Pillar III norms, the increase/decline in earnings and economic value for an upward/downward rate shock of 200 basis points as on March 31, 2016, broken down by currency is as follows:
Earnings Perspective (Rs. ‘000s) Currency Interest Rate Shock 2% Increase 2% Decrease Rupees and other major currencies (10,898) 10898 US Dollar (35076) 35076
Economic Value Perspective (Rs. ‘000s) Currency Interest rate shock 2% increase 2% decrease Rupees and other major currencies 650,795 (650,795) US Dollar 23,328 (23,328)
DF 11. Composition of capital Rs. in ‘000 Particulars Amount Amounts Subject to Ref No. Pre-Basel III Treatment Common Equity Tier 1 capital: instruments and reserves 1 Directly issued qualifying common share capital plus related stock surplus
(share premium) (Funds from Head Office) 6,754,150 – Schedule 1 2 Retained earnings 817132 – Schedule 2 3 Accumulated other comprehensive income (and other reserves) 1,671,630 – Schedule 1
& 2 4 Directly issued capital subject to phase out from CET1 (only applicable to
non-joint stock companies) – – Public sector capital injections grandfathered until January 1, 2018 – – 5 Common share capital issued by subsidiaries and held by third parties
(amount allowed in group CET1) – – 6 Common Equity Tier 1 capital before regulatory adjustments 9,242,912 – Common Equity Tier 1 capital : regulatory adjustments 7 Prudential valuation adjustments – – 8 Goodwill (net of related tax liability) – – 9 Intangibles other than mortgage-servicing rights (net of related tax liability) 125,328 – Schedule 10 10 Deferred tax assets – – 11 Cash-flow hedge reserve – – 12 Shortfall of provisions to expected losses – – 13 Securitisation gain on sale – – 14 Gains and losses due to changes in own credit risk on fair valued liabilities – – 15 Defined-benefit pension fund net assets – – 16 Investments in own shares (if not already netted off paid-up capital on reported
balance sheet) – –

35
SOCIETE GENERALE(Incorporated in France as a Public Limited Company)
Corporate & INDIAN BRANCHESInvestment BankIng
Economic & Political Weekly EPW july 15, 2016 vol lI No 29
17 Reciprocal cross-holdings in common equity – – 18 Investments in the capital of banking, financial and insurance entities that are outside
the scope of regulatory consolidation, net of eligible short positions, where the bank does not own more than 10% of the issued share capital (amount above 10% threshold) – –
19 Significant investments in the common stock of banking, financial and insurance entities that are outside the scope of regulatory consolidation, net of eligible short positions (amount above 10% threshold) – –
20 Mortgage servicing rights(amount above 10% threshold) – – 21 Deferred tax assets arising from temporary differences (amount above 10% threshold,
net of related tax liability) – – 22 Amount exceeding the 15% threshold – – 23 of which : significant investments in the common stock of financial entities – – 24 of which : mortgage servicing rights – – 25 of which : deferred tax assets arising from temporary differences – – 26 National specific regulatory adjustments (26a+26b+26c+26d) – – 26b of which : Investments in the equity capital of unconsolidated non-financial subsidiaries – – 26c of which : Shortfall in the equity capital of majority owned financial entities which
have not been consolidated with the bank – – 26d of which : Unamortized pension funds expenditures – – Regulatory Adjustments Applied to Common Equity Tier 1 in respect of Amounts
Subject to Pre-Basel III Treatment – – of which : HO Debit Balance – – 27 Regulatory adjustments applied to Common Equity Tier 1 due to insufficient
Additional Tier 1 and Tier 2 to cover deductions – – 28 Total regulatory adjustments to Common equity Tier 1 125,328 – Schedule 10 29 Common Equity Tier 1 capital (CET1) 9,117,584 – Additional Tier 1 capital : instruments 30 Directly issued qualifying Additional Tier 1 instruments plus related stock surplus
(share premium) (31+32) – – 31 of which : classified as equity under applicable accounting standards
(Perpetual Non-Cumulative Preference Shares) – – 32 of which : classified as liabilities under applicable accounting standards
(Perpetual debt Instruments) – – 33 Directly issued capital instruments subject to phase out from Additional Tier 1 – – 34 Additional Tier 1 instruments (and CET1 instruments not included in row 5)
issued by subsidiaries and held by third parties (amount allowed in group AT1) – – 35 of which : instruments issued by subsidiaries subject to phase out – – 36 Additional Tier 1 capital before regulatory adjustments – – Additional Tier 1 capital: regulatory adjustments 37 Investments in own Additional Tier 1 instruments – – 38 Reciprocal cross-holdings in Additional Tier 1 instruments – – 39 Investments in the capital of banking, financial and insurance entities that are outside
the scope of regulatory consolidation, net of eligible short positions, where the bank does not own more than 10% of the issued common share capital of the entity (amount above 10% threshold) – –
40 Significant investments in the capital of banking, financial and insurance entities that are outside the scope of regulatory consolidation (net of eligible short positions) – –
41 National specific regulatory adjustments (41a+41b) – – 41a Investments in the Additional Tier 1 capital of unconsolidated insurance subsidiaries – – 41b Shortfall in the Additional Tier 1 capital of majority owned financial entities which
have not been consolidated with the bank – – Regulatory Adjustments Applied to Additional Tier 1 in respect of Amounts Subject
to Pre-Basel III Treatment – – of which : … – –

36
SOCIETE GENERALE(Incorporated in France as a Public Limited Company)
Corporate & INDIAN BRANCHESInvestment BankIng
july 15, 2016 vol lI No 29 EPW Economic & Political Weekly
42 Regulatory adjustments applied to Additional Tier 1 due to insufficient Tier 2 to cover deductions – –
43 Total regulatory adjustments to Additional Tier 1 capital – – 44 Additional Tier 1 capital (AT1) – – 44a Additional Tier 1 capital reckoned for capital adequacy – – 45 Tier 1 capital (T1 = CET1 + Admissible AT1) (29 + 44a) 9,117,584 – Tier 2 capital : instruments and provisions 46 Directly issued qualifying Tier 2 instruments plus related stock surplus – 47 Directly issued capital instruments subject to phase out from Tier 2* 3,468,170 – Schedule 4 48 Tier 2 instruments (and CET1 and AT1 instruments not included in rows 5 or 34)
issued by subsidiaries and held by third parties (amount allowed in group Tier 2) – – 49 of which : instruments issued by subsidiaries subject to phase out – – 50 Provisions (Please refer to Note to Template Point 50) 361,873 – Schedule 2
& 5(iv) 51 Tier 2 capital before regulatory adjustments 3,830,043 – Tier 2 capital: regulatory adjustments 52 Investments in own Tier 2 instruments – – 53 Reciprocal cross-holdings in Tier 2 instruments – – 54 Investments in the capital of banking, financial and insurance entities that are
outside the scope of regulatory consolidation, net of eligible short positions, where the bank does not own more than 10% of the issued common share capital of the entity (amount above the 10% threshold) – –
55 Significant investments13 in the capital banking, financial and insurance entities that are outside the scope of regulatory consolidation (net of eligible short positions) – –
56 National specific regulatory adjustments (56a+56b) – – 56a of which : Investments in the Tier 2 capital of unconsolidated insurance subsidiaries – – 56b of which : Shortfall in the Tier 2 capital of majority owned financial entities
which have not been consolidated with the bank – – Regulatory Adjustments Applied To Tier 2 in respect of Amounts Subject to
Pre-Basel III Treatment – – of which : Investment in Subsidiaries – – 57 Total regulatory adjustments to Tier 2 capital – – 58 Tier 2 capital (T2) 3,830,043 – 58a Tier 2 capital reckoned for capital adequacy14 – 58b Excess Additional Tier 1 capital reckoned as Tier 2 capital – – 58c Total Tier 2 capital admissible for capital adequacy (58a + 58b) – – 59 Total capital (TC = T1 + Admissible T2) (45 + 58c) 12, 947,627 – Risk Weighted Assets in respect of Amounts Subject to Pre-Basel III Treatment – of which : … – – 60 Total risk weighted assets (60a + 60b + 60c) 48,310,074 – 60a of which : total credit risk weighted assets 37,035,691 – 60b of which : total market risk weighted assets 8,175,067 – 60c of which : total operational risk weighted assets 3,099,316 – Capital ratios 61 Common Equity Tier 1 (as a percentage of risk weighted assets) 18.87% – 62 Tier 1 (as a percentage of risk weighted assets) 18.87% – 63 Total capital (as a percentage of risk weighted assets) 26.80% – 64 Institution specific buffer requirement (minimum CET1 requirement plus
capital conservation and countercyclical buffer requirements, expressed as a percentage of risk weighted assets) – –
65 of which : capital conservation buffer requirement – – 66 of which : bank specific countercyclical buffer requirement – –

37
SOCIETE GENERALE(Incorporated in France as a Public Limited Company)
Corporate & INDIAN BRANCHESInvestment BankIng
Economic & Political Weekly EPW july 15, 2016 vol lI No 29
67 of which : G-SIB buffer requirement – – 68 Common Equity Tier 1 available to meet buffers (as a percentage of risk weighted assets) – – National minima (if different from Basel III) 69 National Common Equity Tier 1 minimum ratio (if different from Basel III minimum) 5.50% – 70 National Tier 1 minimum ratio (if different from Basel III minimum) 7.00% – 71 National total capital minimum ratio (if different from Basel III minimum) 9.00% – Amounts below the thresholds for deduction (before risk weighting) 72 Non-significant investments in the capital of other financial entities – – 73 Significant investments in the common stock of financial entities – – 74 Mortgage servicing rights (net of related tax liability) – – 75 Deferred tax assets arising from temporary differences (net of related tax liability) – – Applicable caps on the inclusion of provisions in Tier 2 76 Provisions eligible for inclusion in Tier 2 in respect of exposures subject to
standardised approach (prior to application of cap) 270,500 – 77 Cap on inclusion of provisions in Tier 2 under standardised approach 462,946 – 78 Provisions eligible for inclusion in Tier 2 in respect of exposures subject to
internal ratings-based approach (prior to application of cap) N.A. – 79 Cap for inclusion of provisions in Tier 2 under internal ratings-based approach N.A. – Capital instruments subject to phase-out arrangements (only applicable between March 31, 2017 and March 31, 2022) 80 Current cap on CET1 instruments subject to phase out arrangements N.A. – 81 Amount excluded from CET1 due to cap (excess over cap after redemptions
and maturities) N.A. – 82 Current cap on AT1 instruments subject to phase out arrangements N.A. – 83 Amount excluded from AT1 due to cap (excess over cap after redemptions
and maturities) N.A. – 84 Current cap on T2 instruments subject to phase out arrangements N.A. – 85 Amount excluded from T2 due to cap (excess over cap after redemptions
and maturities) N.A. – * Subordinated debt received from Head Office Note to the template Row No. of the template Particular Rs. in ‘000 10 Deferred tax assets associated with accumulated losses – Deferred tax assets (excluding those associated with accumulated losses) net of Deferred tax liability – Total as indicated in row 10 – 19 If investments in insurance subsidiaries are not deducted fully from capital and instead considered
under 10% threshold for deduction, the resultant increase in the capital of bank – of which : Increase in Common Equity Tier 1 capital – of which : Increase in Additional Tier 1 capital – of which : Increase in Tier 2 capital – 26b If investments in the equity capital of unconsolidated non-financial subsidiaries are not deducted and
hence, risk weighted then : – (i) Increase in Common Equity Tier 1 capital – (ii) Increase in risk weighted assets – 44a Excess Additional Tier 1 capital not reckoned for capital adequacy (difference between Additional
Tier 1 capital as reported in row 44 and admissible Additional Tier 1 capital as reported in 44a) – of which : Excess Additional Tier 1 capital which is considered as Tier 2 capital under row 58b - 50 Eligible Provisions included in Tier 2 capital 270,500 Eligible Revaluation Reserves included in Tier 2 capital 91,373 Total of row 50 361,873 58a Excess Tier 2 capital not reckoned for capital adequacy (difference between Tier 2 capital as
reported in row 58 and T2 as reported in 58a) -

38
SOCIETE GENERALE(Incorporated in France as a Public Limited Company)
Corporate & INDIAN BRANCHESInvestment BankIng
july 15, 2016 vol lI No 29 EPW Economic & Political Weekly
Table DF-12 : Composition of Capital- Reconciliation requirements Step 1 Rs. in ‘000 Balance sheet as Under regulatory in published scope of financial statements consolidation As at 31.03.2016 As at 31.03.2016 A Capital & Liabilities i. Paid-up Capital (funds from HO) 7,099,220 7,099,220 Reserves & Surplus 2,485,488 2,485,488 Minority Interest – – Total Capital 9,584,708 9,584,708 ii. Deposits 35,612,108 35,612,108 of which : Deposits from banks 267,533 267,533 of which : Customer deposits 35,344,575 35,344,575 of which : Other deposits (pl. specify) – – iii. Borrowings 10,480,586 10,480,586 of which : From RBI – – of which : From banks 2,493,825 2,493,825 of which : From other institutions & agencies – – of which : Others (pl. specify) (Borrowings outside India) 7,986,761 7,986,761 of which : Capital instruments – – iv. Other liabilities & provisions 4,026,240 4,026,240 Total 59,703,642 59,703,642 B Assets i. Cash and balances with Reserve Bank of India 2,125,762 2,125,762 Balance with banks and money at call and short notice 990,752 990,752 ii. Investments : 16,657,590 16,657,590 of which : Government securities 16,657,590 16,657,590 of which : Other approved securities – – of which : Shares – – of which : Debentures & Bonds – – of which : Subsidiaries/Joint Ventures/Associates – – of which : Others (Commercial Papers, Mutual Funds etc.) – – iii. Loans and advances 35,497,178 35,497,178 of which : Loans and advances to banks 7,663,165 7,663,165 of which : Loans and advances to customers 27,834,013 27,834,013 iv. Fixed assets 833,326 833,326 v. Other assets 3,599,034 3,599,034 of which : Goodwill and intangible assets – – of which : Deferred tax assets – – vi. Goodwill on consolidation – – vii. Debit balance in Profit & Loss account – – Total Assets 59,703,642 59,703,642Step 2 Particulars (Rs. in ‘000s) Balance sheet as in Under regulatory published financial scope of statements consolidation As at 31.03.2016 As at 31.03.2016 A Capital & Liabilities i. Paid-up Capital (funds from HO) of which : Amount eligible for CET1 9,242,912 9,242,912 of which : Amount eligible for AT1 – – Reserves & Surplus 341,796 341,796 Minority Interest – – Total Capital 9,584,708 9,584,708 ii. Deposits 35,612,108 35,612,108 of which : Deposits from banks 267,533 267,533 of which : Customer deposits 35,344,575 35,344,575 of which : Other deposits (pl. specify) – –

39
SOCIETE GENERALE(Incorporated in France as a Public Limited Company)
Corporate & INDIAN BRANCHESInvestment BankIng
Economic & Political Weekly EPW july 15, 2016 vol lI No 29
iii. Borrowings 10,480,586 10,480,586 of which : From RBI – – of which : From banks 2,493,825 2,493,825 of which : From other institutions & agencies – – of which : Others (pl. specify) (Borrowings outside India) 7,986,761 7,986,761 of which : Capital instruments – – iv. Other liabilities & provisions 4,026,240 4,026,240 of which : DTLs related to goodwill – – of which : DTLs related to intangible assets – – Total 59,703,642 67,043,260 Assets B i. Cash and balances with Reserve Bank of India 2,125,762 2,125,762 Balance with banks and money at call and short notice 990,752 990,752 ii. Investments: 16,657,590 16,657,590 of which : Government securities 16,657,590 16,657,590 of which : Other approved securities – – of which : Shares – – of which : Debentures & Bonds – – of which : Subsidiaries/Joint Ventures/Associates – – of which : Others (Commercial Papers, Mutual Funds etc.) – – iii. Loans and advances 35,497,178 35,497,178 of which : Loans and advances to banks 7,663,165 7,663,165 of which : Loans and advances to customers 27,834,013 27,834,013 iv. Fixed assets 833,326 833,326 v. Other assets 3,599,034 3,599,034 of which : Goodwill and intangible assets – – of which : Goodwill – – of which : Intangible assets – – Deferred tax assets – – vi. Goodwill on consolidation – – vii. Debit balance in Profit & Loss account – – Total Assets 59,703,642 59,703,642Step 3 : Common Equity Tier 1 capital: instruments and reserves Component of Source based on regulatory reference numbers/ capital reported letters of the balance by bank sheet under the
regulatory scope of consolidation from step 2 1 Directly issued qualifying common share (and equivalent for non-joint
stock companies) capital plus related stock surplus 6,754,150 6,754,150 2 Retained earnings 817,132 817,132 3 Accumulated other comprehensive income (and other reserves) 1,671,630 1,671,630 4 Directly issued capital subject to phase out from CET1 (only applicable
to non-joint stock companies) – – 5 Common share capital issued by subsidiaries and held by third parties
(amount allowed in group CET1) – – 6 Common Equity Tier 1 capital before regulatory adjustments 9,117,584 9,117,584 7 Prudential valuation adjustments – – 8 Goodwill (net of related tax liability) – – 9 Other intangibles other than mortgage-servicing rights (net of related tax liability) 125,328 125,328 10 Deferred tax assets that rely on future profitability excluding those arising
from temporary differences (net of related tax liability) – – 11 Regulatory adjustments applied to Common Equity Tier 1 and Tier 2 to
cover deductions – – Common Equity Tier 1 capital (CET1) 9,117,584 9,117,584

40
SOCIETE GENERALE(Incorporated in France as a Public Limited Company)
Corporate & INDIAN BRANCHESInvestment BankIng
july 15, 2016 vol lI No 29 EPW Economic & Political Weekly
DF-13: Main Features of Regulatory Capital InstrumentsAs of 31st March 2016, there were no regulatory capital instruments issued by SG.DF -14. Full Terms and Conditions of Regulatory Capital Instruments As of 31st March 2016, there were no regulatory capital instruments issued by SG.DF-15. Disclosure Requirements for RemunerationThe Bank’s compensation policies including that of CEO’s, is in conformity with the Financial Stability Board principles and standards. In accordance with the requirements of the RBI Circular No. DBOD No.BC.72/29.67/001/2011-12 dated 13 January 2012, the Regional Office of the Bank has submitted a declaration to RBI confirming the aforesaid matter. Accordingly no disclosure is required to be made in this regard.DF-16: Equities – Disclosure for Banking Book PositionsAs of 31st March 2016, it was NIL.DF 17- Summary comparison of accounting assets vs. leverage ratio exposure measure Item (Rs. in Millions) 1 Total consolidated assets as per published financial statements 59,704 2 Adjustment for investments in banking, financial, insurance or commercial entities that are consolidated
for accounting purposes but outside the scope of regulatory consolidation – 3 Adjustment for fiduciary assets recognized on the balance sheet pursuant to the operative accounting
framework but excluded from the leverage ratio exposure measure – 4 Adjustments for derivative financial instruments 6,991 5 Adjustment for securities financing transactions (i.e. repos and similar secured lending) – 6 Adjustment for off-balance sheet items (i.e. conversion to credit equivalent amounts of off-balance
sheet exposures) 12,962 7 Other adjustments (860) 8 Leverage ratio exposure 78,796
DF 18. Leverage ratio common disclosure template Item (Rs. in Millions) On-balance sheet exposures 1 On-balance sheet items (excluding derivatives and SFTs, but including collateral) 58,968 2 (Asset amounts deducted in determining Basel III Tier 1 capital) (125) 3 Total on-balance sheet exposures (excluding derivatives and SFTs) (sum of lines 1 and 2) 58,843 Derivative exposures 4 Replacement cost associated with all derivatives transactions (i.e. net of eligible cash variation margin) 2,369 5 Add-on amounts for PFE associated with all derivatives transactions 4,623 6 Gross-up for derivatives collateral provided where deducted from the balance sheet assets pursuant to
the operative accounting framework – 7 (Deductions of receivables assets for cash variation margin provided in derivatives transactions) – 8 (Exempted CCP leg of client-cleared trade exposures) – 9 Adjusted effective notional amount of written credit derivatives – 10 (Adjusted effective notional offsets and add-on deductions for written credit derivatives) – 11 Total derivative exposures (sum of lines 4 to 10) 6,991 Securities financing transaction exposures 12 Gross SFT assets (with no recognition of netting), after adjusting for sale accounting transactions – 13 (Netted amounts of cash payables and cash receivables of gross SFT assets) – 14 CCR exposure for SFT assets – 15 Agent transaction exposures – 16 Total securities financing transaction exposures (sum of lines 12 to 15) – Other off-balance sheet exposures 17 Off-balance sheet exposure at gross notional amount 44,756 18 (Adjustments for conversion to credit equivalent amounts) (31,794) 19 Off-balance sheet items (sum of lines 17 and 18) 12,962 Capital and total exposures 20 Tier 1 capital 9,118 21 Total exposures (sum of lines 3, 11, 16 and 19) 78,796 Leverage ratio 22 Basel III leverage ratio 11.57