incompletefigureperceptionandinvisiblemasking · complex array of lines (ghent 1956), or where...
TRANSCRIPT

1 IntroductionSystematic investigation of incomplete-figure perception was initiated by pioneers ofGestalt psychology and continued experimentally with the application of information-processing theory to visual perception (Attneave 1954, 1955; Biederman 1987). Now,the development of investigations of algorithms and mechanisms for the reconstructionof whole objects from their parts is one of the promising approaches in visual psycho-physics to the modeling of image processing in the visual system (Field 1987, 1994;Field and Hayes 2004; Ginsburg 1986; Hess et al 2003; Olshausen and Field 1996, 1997,2004a, 2004b).
Within clinical and developmental fields, the ability to correctly perceive and identifyimages presented in obscured, fragmented, or incomplete form has been used for morethan half a century to study ontogenetic visual development and visual closure (Foremanand Hemmings 1987; Ghent 1956; Gollin 1960; Mooney 1957; Patterson et al 1999;Spitz and Borland 1971; Street 1931), perceptual development in different cultures(Bentley and Dere� gowski 1987), implicit memory (Snodgrass and Hirschman 1994;Snodgrass and Poster 1992; Snodgrass et al 1987), shape recognition algorithms (Ghoshand Petkov 2005), cell assembly models of rapid perceptual learning (Gruber et al2002), residual memory in amnesic patients (Corkin 1982; Warrington and Weiskrantz1968), and visual-perceptual changes resulting from brain injury or dysfunction(Giersch et al 2000; McCarthy and Warrington 1990; Mack et al 1993; Poppelreuter1917; Warrington and James 1967; see Bradshaw and Mattingley 1995; Corkin 1982;Martin 2006; Warrington 1982).
Incomplete figure perception and invisible masking
Perception, 2006, volume 35, pages 1441 ^ 1457
Valery Chikhman, Yuri Shelepin, Nigel Foremanô, Aleksey Merkuljev, Sergey ProninPavlov Institute of Physiology, Russian Academy of Sciences, nab. Makarova 6, 199034 St Petersburg,Russia; ôDepartment of Psychology, Middlesex University, Queensway, Enfield EN3 4SF, Middlesex,UK; e-mail: [email protected] 5 October 2004, in revised form 20 January 2006
Abstract. The Gollin test (measuring recognition thresholds for fragmented line drawings ofeveryday objects and animals) has traditionally been regarded as a test of incomplete figureperception or closure', though there is a debate about how such closure is achieved. Here, figuralincompleteness is considered to be the result of masking, such that absence of contour elementsof a fragmented figure is the result of the influence of an `invisible' mask. It is as though thefigure is partly obscured by a mask having parameters identical to those of the background.This mask is `invisible' only consciously, but for the early stages of visual processing it is real andhas properties of multiplicative noise. Incomplete Gollin figures were modeled as the figurecovered by the mask with randomly distributed transparent and opaque patches. We adjusted thestatistical characteristics of the contour image and empty noise patches and processed thoseusing spatial and spatial-frequency measures. Across 73 figures, despite inter-subject variability,mean recognition threshold was always approximately 15% of total contour in naive observers.Recognition worsened with increasing spectral similarity between the figure and the `invisible'mask. Near threshold, the spectrum of the fragmented image was equally similar to that of the`invisible' mask and complete image. The correlation between spectral parameters of figures atthreshold and complete figures was greatest for figures that were most easily recognised. Acrosstest sessions, thresholds reduced when either figure or mask parameters were familiar. We arguethat recognition thresholds for Gollin stimuli in part reflect the extraction of signal from noise.
DOI:10.1068/p5366

Performance on the Gollin Incomplete Figures Test (Gollin 1960) appears to bedependent upon the integrity of several areas of the human brain, but particularlyposterior cortex in the right hemisphere, since, compared with controls, patients withright parieto-occipital damage typically require a great deal more contour to be displayedin order to extract the figural Gestalt (McCarthy and Warrington 1990; Warringtonand James 1967; though see Vakil et al 1992). Originally, the test involved the presenta-tion of stimulus cards, each successive card containing 5% more figure elements thanthe preceding card, a participant's score being the percentage of figure contour presentwhen the image was first correctly identified (Gollin 1960). More recently, incrementalpresentation of individual figure elements has become possible with the use of com-puterised versions of the task which consequently allow more precise measurements ofthreshold (Foreman and Hemmings 1987). With this protocol, a wide range of verbaland non-verbal materials has been studied as test stimuli (Foreman and Hemmings1987; Reales et al 2002; Snodgrass and Poster 1992). However, despite the use of suchtests in cognitive psychology and as clinical diagnostic instruments, it remains unclearwhat the Gollin test precisely measures (Mack et al 1993). Little attention has beenpaid to the essential geometric and statistical properties of Gollin images prior to,and at, recognition threshold. Such an analysis may be beneficial in providing a betterunderstanding of the perceptual processes that contribute to correct identification, andlead to better understanding of the mechanisms that are deficient in some categoriesof agnosic patient.
It is well known from the work of Biederman (Biederman 1987; Hummel andBiederman 1992), in which human image recognition was investigated by using partiallydeleted line drawings, that not all line segments in a figure are equally informativefor recognition. In other words, recognition can depend upon the inclusion or omis-sion of particularly informative features, a phenomenon which gave rise to the geonstheory of human perceptual recognition (Biederman 1987). The importance of informa-tive features was demonstrated in 4 ^ 6-year-old children (Murray and Szymczyk 1978),and incomplete figures can be designed deliberately to include or omit informativefeatures (Bentley and Dere� gowski 1987). These may be distinctive characteristics, or,more generally, points of extreme contour curvature (De Winter and Wagemans 2004).However, other mechanisms are involved. Such a feature model does not accountfor recognition when only very small amounts of contour are randomly presented.After only 2 ^ 3 presentations, a figure can be identified as a telephone or an elephantwith only a few contour elements displayed (3% ^ 4% of total contour), elementspreviously not experienced in that combination, so not selected to represent curvatureextremes. In the Gollin test, recognition thus appears to be relatively independentof the positions of particular fragments, ie irrespective of the presentation sequence,suggesting that recognition occurs via a matching process in which the displayedfeature elements are superimposed on an internalised model or template of the com-plete figure. Of course, this is not necessarily incompatible with the feature model,since (particularly on first exposure to a stimulus) informative features will becomeincreasingly accessible as contour accumulates.
But what processes do recognition thresholds reflect? Repetition of the Gollin testresults in rapidly diminishing thresholds, arguably because of implicit perceptual learn-ing and memory (Snodgrass et al 1987; Vakil et al 1992; Warrington and Weiskrantz1968), though the physiological mechanisms that underpin incomplete-image perceptionremain unknown.
The Gollin test may be comparable to the Mooney Test of Visual Closure (Mooney1957), which similarly requires the perception of a whole from fragmented informa-tionö in that case incomplete facial silhouettes. Or it may be more closely aligned toother tests in which object ambiguity is achieved by having drawings embedded in a
1442 V Chikhman, Y Shelepin, N Foreman, A Merkuljev, S Pronin

complex array of lines (Ghent 1956), or where several line drawings overlap, as in thePoppelreuter (1917) test (see Bradshaw and Mattingley 1995; Vokey et al 1986). In fact,available evidence suggests that performance on the Gollin test correlates with thaton the Poppelreuter test, but not with performance on the Mooney test (Foreman1991), further suggesting that it invokes a process of signal extraction from noise, sinceoverlapping figures in the Poppelreuter test work as (visible) masks for one another(cf Vokey et al 1986).
We investigate here whether the incompleteness of the Gollin test figures in theirfragmented form is also the result of a form of (invisible) masking, which brings aboutpartial occlusion of the figure. If this is so, the threshold which is measured in theGollin test ought to be strongly influenced by the parameters of the mask, and it oughtto be possible, ultimately, to determine where in the visual system the geometrical andstatistical parameters of the Gollin figures and the `invisible' mask are processed.
Note that the masking does not have to be `invisible', since a visible occludingsurface helps an observer to integrate separated components of fragmentary images(Bregman 1981; Kanizsa 1979).
Specifically, we propose that, where the Gollin figures are concerned, incomplete-ness is the result of the figure being partially obscured by a mask similar to a texturehaving transparent windows (where figure elements are visible) and opaque elements(where they are hidden). The brightness and colour of the opaque elements are identicalto the background, and the size of transparent windows corresponds to the size offragments of the incomplete figure. In other words, progressing from a blank screen tothe recognition threshold (as increasing numbers of figure elements are displayed) canbe thought of as the progressive removal of an `invisible' mask (see figure 1), corre-spondingly increasing the likelihood of signal extraction from noise. The procedure ofmask (noise) superposition on the whole figure (signal) is mathematically describedas a logical AND' operation; the algorithm for the presentation of incomplete figuresat different levels of appearance/fragmentation has been organised according to thisprinciple.
If recognition depends on extracting signal (the image) from noise (the invisiblemask), then it should be possible to measure the statistical properties of the invisible maskat various thresholds of recognition and to compare the mask properties with those ofthe image at each threshold. Spatial-frequency spectral Fourier analysis has been used forthis purpose, in view of its past widespread use in signal/noise processing and imagequantification (Ginsburg 1986; Piotrowski and Campbell 1982; Pratt 1978), and in visualphysiology and psychology generally (Campbell and Robson 1968; Glezer 1995; Kulikowskiand Robson 1999; see eg Bruce et al 1996; Field and Brady 1997; Stark 1982; Wandell1995).
2 Experiment 12.1 Methods2.1.1 Participants. Eleven observers participated (eight male), an opportunity sample oflaboratory colleagues and visitors aged between 9 and 50 years. They were eitheremmetropic or had fully corrected vision. Nine were naive to the purpose of the study.Data analysis was conducted, first including and then excluding the two experiencedparticipants, though in most instances their inclusion made little difference to the results.
2.1.2 Equipment and procedure. Stimuli consisted of 73 contour figures (line drawings)of familiar everyday objects and animals, generated with specialised graphics softwareand presented on a Sony PS200 monitor (resolution 8006600 pixels, frame rate 85 Hz).The host computer was an IBM PC with Intel Celeron 400 MHz CPU and MattroxMillennium G450 videocard. In these experiments we used only binary (black ^white)
Incomplete figures and masking 1443

stimuli, but since the equipment was used for various test purposes, the nonlinearluminance response of the display (gamma function) was linearised by means of theinverse function of the luminance response as measured with a standard photometer.The figures were generated and stored in memory as 5126512 pixel bmp-files. In theexperiment they were presented as incomplete figures (see figure 1), beginning from0% of contour on the screen, and accumulating slowly to 100% by the addition ofsmall fragments of contour appearing at the rate of 1 sÿ1. These fragments appeared asa result of multiplication (logical AND') of the pixel values of the `transparent' pro-gram window by corresponding pixel values of the complete figure. In the process offragmented image formation, fragments containing the contour were randomly chosenfor multiplication and accumulation on the screen. Contour thickness was on average8 pixels. The background luminance was 5 cd mÿ2 and the luminance of the whitebars 80 cd mÿ2. The size of presented images (5126512 pixels) with screen resolutionset at 8006600 pixels, at the usual viewing distance of 120 cm, represented 8 deg ofvisual angle.
The observers did not know the size of the transparent window in the program,ie the statistical properties of the `invisible' mask. They were asked to depress the spacebar on the keyboard and hold it down to progressively display the figure. As soon asthe participant recognised the figure, he/she released the space bar, which immediately
(a)
(b)
(c)
Figure 1. Illustration of a Gollin test figure, as afigure partially occluded by a multiplicative mask.(a) The complete figure, as white contour on a blackbackground; (b) the mask, as transparent windowson the black background; (c) the fragmented figureresulting from multiplication.
1444 V Chikhman, Y Shelepin, N Foreman, A Merkuljev, S Pronin
interrupted the accumulation of figure elements. The participant's task was to identifyand name each figure as quickly as possible. If a figure was misidentified, the partici-pant was asked to resume until the correct response was obtained. The threshold(minimal contour required for recognition) was recorded as the amount of contour pres-ent on the screen at the instant of correct recognition. Following correct recognition,the participant proceeded without delay to the next figure. Except for one participantfor whom presentation order was randomised, the order was quasi-randomised, thesequences of fragment appearance being stored and repeated for each observer.
Our program, in which figure fragments appear over a mask whose transparentwindow size can be varied, is a development of the computerised version of the Gollintest reported by Foreman and Hemmings (1987) and Vokey et al (1986).
To examine familiarity effects, the same test procedure was repeated on two sepa-rate occasions, 5 days and then 8 days after the initial test.
2.1.3 Data analysis. Geometrical and statistical parameters of test images were obtainedat the threshold of recognition in the spatial-frequency domain by digital image pro-cessing, and these were compared with the same parameters for the complete imagesand the modeled `invisible' masks.
The first geometrical parameter to be measured was the number of pixels on thescreen at correct recognition, recorded as an absolute number and in relative units. Therelative threshold was taken as K=% � 100Vi =Vc where Vi is the average number of pixelsrequired for recognition of the incomplete figure, and Vc is the number of pixels inthe complete figure. This threshold value was established for each of the 73 figures.
Correlations were calculated between thresholds and (a) overall contour lengths(for the complete figures), (b) parameters of 2-D Fourier spectra, and (c) statisticalproperties of the `invisible' mask.
Statistical and spectral characteristics of both incomplete and complete figures werethen obtained. For these measures at threshold, a 2-D Fast Fourier Transform (FFT)analysis was carried out, representing the image in the frequency domain. The FFTprocedure was used for spectral image calculation (Makulov and Pauk 1992) for sub-threshold (3% of complete contour), threshold (the percentage present at recognition,peculiar to each figure), and suprathreshold (100%) figures. For each test image themagnitude of the Fourier image was calculated together with the amplitude distributionof Fourier components in three dominant directions: vertical, horizontal, and passingat 458 through the centre of the coordinates. The amplitude profiles were obtained byaveraging across directions for all test images and for all observers.
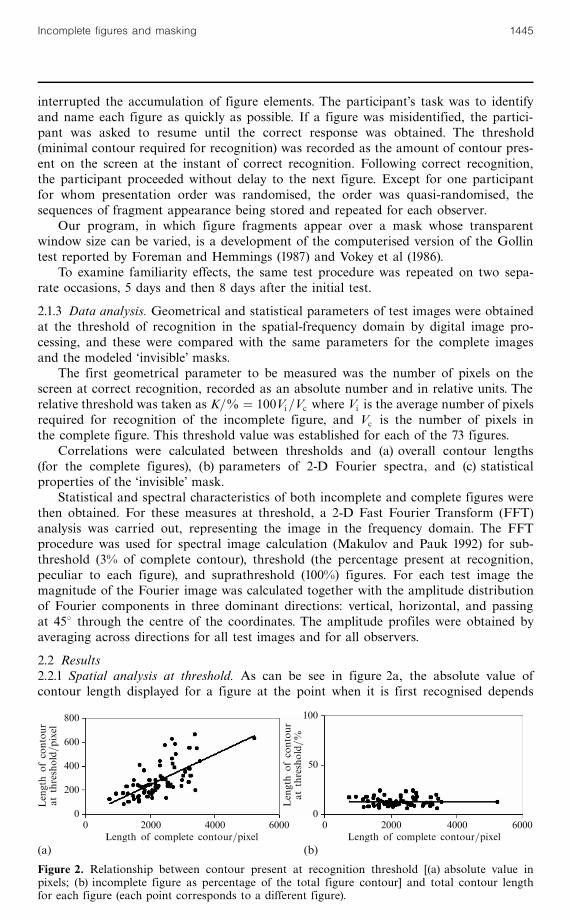
2.2 Results2.2.1 Spatial analysis at threshold. As can be see in figure 2a, the absolute value ofcontour length displayed for a figure at the point when it is first recognised depends
800
600
400
200
0
Length
ofcontour
atthreshold=pixel
100
50
0
Length
ofcontour
atthreshold=%
0 2000 4000 6000 0 2000 4000 6000Length of complete contour=pixel Length of complete contour=pixel
(a) (b)
Figure 2. Relationship between contour present at recognition threshold [(a) absolute value inpixels; (b) incomplete figure as percentage of the total figure contour] and total contour lengthfor each figure (each point corresponds to a different figure).
Incomplete figures and masking 1445

on the absolute value of the contour length in the complete figure. The coefficient oflinear correlation was found to be statistically highly reliable (r � 0:67, p 5 0:001).Figure 2b shows the data expressed in terms of relative values (ie the threshold valueexpressed as a percentage of the total contour length). The correlation between thresh-old and total values was found to be low (r � ÿ0:02, p 4 0:05). The results were foundto be very similar for all the test figures employed; despite inter-subject variability(4% ^ 25%), recognition occurred when an average of 12.5% of total figure contourwas displayed, irrespective of the total length of contour comprising the full figure.When the corresponding figure was obtained for the naive observers alone, the averagethreshold value was found to approximate 15% (cf figure 2b).
2.2.2 Spectral characteristics at threshold. The correlation between the threshold valuesand the mean amplitude of magnitude profiles was found to be low and unreliable(r � ÿ0:16, p 4 0:05). Figure 3 shows the parameter variation in magnitude profilesof spatial-frequency spectra of the Gollin figures at a sub-threshold contour value(a figure of 3% was adopted here, since this was well below the threshold for any ofthe figures), at threshold, and at a suprathreshold (we adopted 100%) value of contourlength. For this we estimated the variation in the average amplitude in magnitudeprofiles of different images. It is interesting that the variability of spectral parameterswas at a particularly low level (and, most likely, a minimum) at the threshold value ofcontour least required for recognition.
2.2.3 Mask characteristics and relationship with figure characteristics. By subtractingthe spectral parameters (the profile of amplitude ^ spatial-frequency spectra) of the com-plete image from the spectral parameters of the same but incomplete image, we obtainedthe spectral parameters which approximately describe the `invisible' mask. Figure 4 showsthe result of such a subtraction, approximately describing the mask amplitude ^ frequencyspectra for incomplete images differing in transparent window size. The contour valuefor these fragmented images was about average threshold value. The characteristics ofthe amplitude ^ frequency spectra of the textures are shown in the figure. It is clearthat the result of spectral parameter subtraction is similar to the spectral character-istics of corresponding textures with the size of elements equal to the size of thetransparent window used in the generation of the Gollin figure. We processed sometexture images with different values of probability of elements. We found that the formof the amplitude ^ frequency spectra of such textures shows practically no change, butthe amplitude itself does change. We therefore used the amplitude ^ frequency param-eters for correlation analysis, allowing comparison between textures having identicalprobability of elements. For convenience and picture clarity the value of probability ofelements was chosen as 50%.
30
20
10
0
Coefficientofvariation=%
200
150
100
50
0
Coefficientofvariation=%
3% threshold 100% 0 50 100 150 200 250Contour length Spatial frequency=cycles per image
(a) (b)
Figure 3. Variation of figure spectral parameters. (a) Parameter variation for different amountsof contour in the figure; (b) variation of harmonic amplitudes of the magnitude profile of theFourier image at 3% of contour displayed (small black dots), at threshold (black dots), and 100%of contour displayed (gray dots).
1446 V Chikhman, Y Shelepin, N Foreman, A Merkuljev, S Pronin

This procedure allows the measurement of the statistical parameters of the `invisible'masks, but also their comparison with the same parameters of the Gollin images. Forthis purpose, we synthesised mask textures composed of random elements having thesame size as the transparent windows used in the generation of Gollin figures (maskelements having a 50% probability of occurrence). Correlation analysis was used to relatethe obtained profiles of amplitude ^ frequency spectra for each fragmented figure to theprofile of the amplitude ^ frequency spectra of the complete image, and also to the profileof the amplitude ^ frequency spectra of the texture mask with corresponding fragmentsize.
200
150
100
50
0
Amplitude
1 51 101 151 201 251 1 51 101 151 201 251Spatial frequency=cycles per image Spatial frequency=cycles per image
1000
800
600
400
200
0
Amplitude
1 51 101 151 201 251 1 51 101 151 201 251
Spatial frequency=cycles per image Spatial frequency=cycles per image
(a) (b)
(c) (d)
(e) (f)
(g) (h)
Figure 4. Mask and texture spectral parameters. (a) Fragmented image (464 pixels); (b) frag-mented image (13613 pixels); (c) mask magnitude profile (464 pixels); (d) mask magnitudeprofile (13613 pixels); (e) texture (464 pixels); (f ) texture (13613 pixels); (g) texture magni-tude profile (464 pixels); (h) texture magnitude profile (13613 pixels).
Incomplete figures and masking 1447

The spectral parameters of images with different levels of fragmentation wereestimated and (with correlation coefficients used as measures of similarity) related tothe parameters of threshold test images, with those of complete images, and with thoseof the modeled `invisible' masks. One can see in figure 5 the dependence of recognitionthresholds on the level of similarity between the amplitude spectra of the figures andof the `invisible' mask. Increasing the similarity of the spectra resulted in increasedthresholds, ie worsening or increased difficulty of recognition.
2.2.4 Effects of familiarity. Across test sessions, there was a significant reduction inthe percentage of figure needed on screen for correct recognition. Table 1 shows theresults of a correlation analysis of the derived statistical and spectral characteristics ofthe `invisible' mask, and those of threshold test images obtained in the three spacedtests. The first column of table 1 shows the mean threshold values during test sessions;the remaining columns show the obtained correlation coefficients between the thresh-old values of fragmented images and the mean amplitude of magnitude profiles, thespectral parameters of the `invisible' mask, and between these threshold values andthe absolute value of contour present at recognition. It is clear that the influenceof the spectral similarity of the `invisible' mask on threshold became smaller by testday 3, but that the influence of the mean magnitude increased. The correlation betweenthe amount of contour present at recognition and total figure contour was small andnon-significant on all days.
2.3 DiscussionIn experiment 1 we correlated the spatial/geometrical and statistical properties of frag-mented figures with their recognition thresholds. On the basis of earlier pilot studiesof conventional Gollin figures (Foreman and Hemmings 1987), we speculated that thepercentage of figure required on screen for recognition would be broadly similaracross figures. According to the `principle of least action' (Shelepin 1999; Shelepin and
30
25
20
15
10
5
0
Threshold=%
ÿ1 ÿ0:5 0 0.5 1Correlation similarity, R
Figure 5. Thresholds and spectral similarity between figure and the `invisible' mask.
Table 1. Threshold correlation with test image characteristics.
Test day Mean Mean magnitude Correlation similarity Contour absolutethreshold=% of spatial-frequency with invisible value, R
spectrum, R mask, R
1 12.41 ÿ0.16 0.46*** ÿ0.022 8.4 ÿ0.31** 0.42*** 0.003 6.99 ÿ0.49*** 0.26* ÿ0.11Note: * p 5 0:05; ** p 5 0:01; ** p 5 0:001.
1448 V Chikhman, Y Shelepin, N Foreman, A Merkuljev, S Pronin
Krasilnikov 2003), we hypothesised that the variability of spectral parameters wouldbe particularly low at threshold. Initial results of the study of the geometrical param-eters of Gollin fragmented figures and their connections with recognition thresholdwere described in our previous work (Chernova et al 1999; Chikhman et al 2001;Merkuljev et al 2003).
In terms of variability of recognition thresholds, our results have demonstrated that,while there was substantial variation in the percentage required for recognition byindividual participants, the mean value of contour length required for recognition thresh-old was linearly proportional to the total contour length in the complete figure, and,for naive observers, was surprisingly stable at 15% across all the 73 figures employed.Perceptual strategies may vary among individuals, depending on perceptual and otherfactors related to specific and non-specific processes involved in recognising, naming, andguessing (Snodgrass et al 1987; Vokey et al 1986), and the individual's ability to detectinformative features such as points of maximal curvature (De Winter and Wagemans2004). We cannot explain why the mean value should be so stable across a wide range offigures. However, it appears that, irrespective of the characteristics of the particularfigure, a certain level or percentage of fragmentation is typically required to enable aperceptual judgment to be made, although there is apparently random variation aboutthat mean value. Further studies are required to determine whether there are types offigures, or levels of figure detail, symmetry, or complexity, or ratios of external to internalfeatures, which would contravene this principle.
Our findings in relation to spectral magnitude profiles at threshold are indeedconsistent with the `principle of least action' (Shelepin 1999; Shelepin and Krasilnikov2003), which predicts that the variability of spectral parameters would be at a minimumat recognition threshold.
Repeated exposure to Gollin stimuli results in a rapid and dramatic reduction inthe amount of contour required for recognition, a result which has been replicatedhere, supporting several previous studies (Foreman and Hemmings 1987; Snodgrasset al 1987). This finding illustrates the benefits of the Gollin test as a particularly goodinstrument for measuring perceptual learning, priming, and memory (Shum et al 1999;Warrington and Weiskrantz 1968ösee section 1). In the present study, we have shownthat the influence of spectral similarity between the figure and mask becomes smallerwith repeated exposures. We interpret our results as indicating that repeated exposureto a figure results in the learning of a library of templates, against which incomingvisual information is matched on a point-by-point basis, until the degree of matching issufficient to allow positive recognition of the figure.
3 Experiment 2This study was carried out to assess in more detail the phenomenon observed inexperiment 1öthe low variability of spectral parameters of fragmented figures at recog-nition threshold. To extend these results, we made the same measurements but withdifferent transparent window sizes to investigate whether fragment size influences thethreshold. The participants in this study were children aged 9 ^ 10 years, who wereconsidered a suitable subject pool, since Gollin (1960) reported that the recognitionthresholds (percentage of contour required for recognition on first exposure) did notdiffer significantly between an adult sample and children between 54 ^ 65 months of age,and, more recently, DiGiulio et al (1994) showed that priming of Gollin test performancestabilised by 8 years of age.
3.1 Method3.1.1 Participants and apparatus. Participants were twenty-eight children, recruited froma school in St Petersburg, Russia, aged 9 ^ 10 years. Of these, sixteen were male and
Incomplete figures and masking 1449

twelve female. They were either emmetropic or had fully corrected vision. The apparatuswas the same as in experiment 1.
3.1.2 Procedure. The procedure was also the same as in experiment 1 except that only40 of the 73 stimuli were used, split into 4 groups of 10, groups being matched fordifficulty (according to the average recognition thresholds recorded for the adult groupin experiment 1). Within these stimulus groups, average threshold and threshold rangeswere equal.
Fragmented figures were generated as in experiment 1 by successive addition andaccumulation of small fragments of the contour, but at a rate of five transparentwindows per second. The contour thickness was about 8 pixels, and the sizes of thetransparent windows for the respective figure groups were 464, 767, 10610, and13613 pixels. We synthesised four textures as analogues of `invisible' masks accord-ingly, with the sizes of random elements also being 464, 767, 10610, 13613 pixelsand having a 50% probability of occurrence.
Each participant was shown the 4 groups of figures in random order, the totalpresentation time being �7 min.
For each complete and threshold-fragmented image, and for each texture mask, wetook the magnitude of the Fourier image and measured the amplitude distribution ofthe magnitude profiles, as described in experiment 1. For comparison with the exper-imentally obtained data, versions of each figure with different levels of fragmentationwere generated (having 3%, 5%, 7%, 10%, 30%, 50%, and 70% of the total contourpresent), for each of the four selected sizes of the transparent mask window. Spectralparameters were obtained for all these versions.
3.2 Results, data analysis, and discussionCorrelation coefficients were calculated to determine the spectral similarity for differentlevels of figure fragmentation, and for different groups of test figures with different sizesof transparent windows. Figure 6 shows the change of similarity of spectral param-eters of fragmented figures with the same parameters as the complete figures and the`invisible' mask, for figure fragments and transparent windows of different sizes.
It is clear that, as contour is progressively added, the similarity of the spectralparameters of the fragmented figure and of the complete figure increases, but thatbetween the fragmented figure and texture mask decreases. The point where the two lines
0.90
0.70
0.50
1.00
0.90
0.80
0.70
0.95
0.85
0.75
1.00
0.95
0.90
0.85
0.80
Coefficientof
Coefficientof
correlation
correlation
1 10 100 1 10 100Contour=% of total Contour=% of total
(a) (b)
(c) (d)
Figure 6. Change of spectrum similarity with contour formation. (a) 464 pixels; (b) 767 pixels;(c) 10610 pixels; (d) 13613 pixels. The light line shows spectral correlation of fragmented figurewith the mask and the dark line with the complete figure.
1450 V Chikhman, Y Shelepin, N Foreman, A Merkuljev, S Pronin

cross in each graph is the point at which the spectral parameters of the fragmentedfigure are equally similar to the spectral parameters of the complete figure and tothose of the texture mask. One can see from figure 6 that it is around this point thatthe threshold of recognition is situated, when the fragmented figure becomes moresimilar to the figure with complete contour, and as the signal-to-noise ratio increases.This is consistent with the `optimal observer' conceptösee Krasilnikov et al (1999).
On one hand, changing window size changes the number of displayed fragmentsrequired to achieve threshold, and on the other hand, it changes the spatial-frequencyspectrum of both the mask and the fragmented figure. The first effect is understand-able and trivial; when a program with transparent window size smaller than the thicknessof the contour is used, recognition will inevitably occur with a smaller percentage ofcontour present.We used stimulus contours with thicknesses up to 8 ^ 10 pixels, and as thetransparent window size in the program grew, the absolute number of fragments requiredfor threshold increased accordingly. How spatial-frequency parameters relate preciselyto the threshold requires further investigation and is the subject of ongoing studies.
4 Experiment 3This experiment was carried out to investigate further the familiarity effect seen inexperiment 1, but this time considering both familiarity with the figures and familiaritywith the mask as parameters. The dependent variable was again the threshold contourrequired for fragmented figure recognition. It was shown in experiment 2 that increasingthe transparent window size leads to an increase in the recognition threshold. Previousstudies, with conventional computer-generated Gollin images have shown that expo-sures to different forms of Gollin stimuli (for example, `horse' stimuli but with varyingdepictions of a horse) can prime one another, as judged from the differential effect onsubsequent recognition thresholds (Vokey et al 1986). A small threshold reduction canoccur that is due to non-specific familiarity with the test demands and protocol,though the major factor is familiarity with the test stimuli as such (Snodgrass et al 1987).As in experiment 1, figure familiarity was provided here by repeated presentation of thesame figures. We assume that mask familiarity (familiarity with the mask parameters)can be created by using the same (ie familiar) transparent window size in generatingthe fragmented figure. In Gollin figure formation, fragment size was determined by theprogrammed transparent window size, and therefore the observed fragment size deter-mined the `invisible' mask parameters. It is important to note that from the specificdetermination of the threshold in the Gollin test procedure (threshold value in pixels),fragment size influences the threshold contour value, according to the thicknessof the contour. To estimate the influence of familiarity with the `invisible' mask withoutthe influence of other factors (contour thickness, for example) we determined thethreshold in this experiment as percentages of the norms previously obtained for eachprogrammed window size. We hypothesised that the smallest reduction in thresholdsacross sessions would be obtained when both the mask and the figures were equallyunfamiliar. However, on assuming that the mask is processed and extracted in the courseof Gollin test performance, this should show itself in a reduction in threshold when aparticipant becomes familiar with the mask parameters alone.
4.1 Method4.1.1 Participants and apparatus. Thirty-seven male observers participated. They werestudents of a medical academy aged between 18 and 25 years. They were either emme-tropic or had fully corrected vision. The apparatus used was the same as in experiment 1.
4.1.2 Procedure and data analysis. Thresholds were initially obtained for each transparentwindow size, for 40 figures presented to thirty naive observers (from among the thirty-seven selected participants), and these data were used as norms thereafter. For this
Incomplete figures and masking 1451
purpose the thirty observers were divided into three groups of ten, tested with differentprogram window sizes (464, 767, and 10610 pixels). The obtained thresholds were usedfurther as norm values (`Norm contour values for naive observers' in table 2).
The remaining seven participants were first exposed to 20 Gollin figures, formedwith a 767 pixel transparent window, and then performed the Gollin test procedureas in experiment 1. 3 days later they were retested. For this, 40 figures were prepared,divided into four groups of 10, presented in counterbalanced group order as far aspossible. For figure group 1, both figure and mask were familiar; this was achieved byusing 10 figures from the first test and the same size of transparent window (ie 767pixels). For figure group 2, only the figures were familiar; this was achieved by using10 of the same figures as previously but formed with a novel size of transparentwindow (464 pixels). For figure group 3, only the mask was familiar; this was achievedby using 10 new figures, but generated with the same size of transparent window (767pixels) as in the first test. For figure group 4, both figure and mask were unfamiliar;this was achieved by using 10 new figures generated with a novel size of transparentwindow (10610 pixels). The threshold contour values (table 2) were thereby obtainedfor each transparent window size.
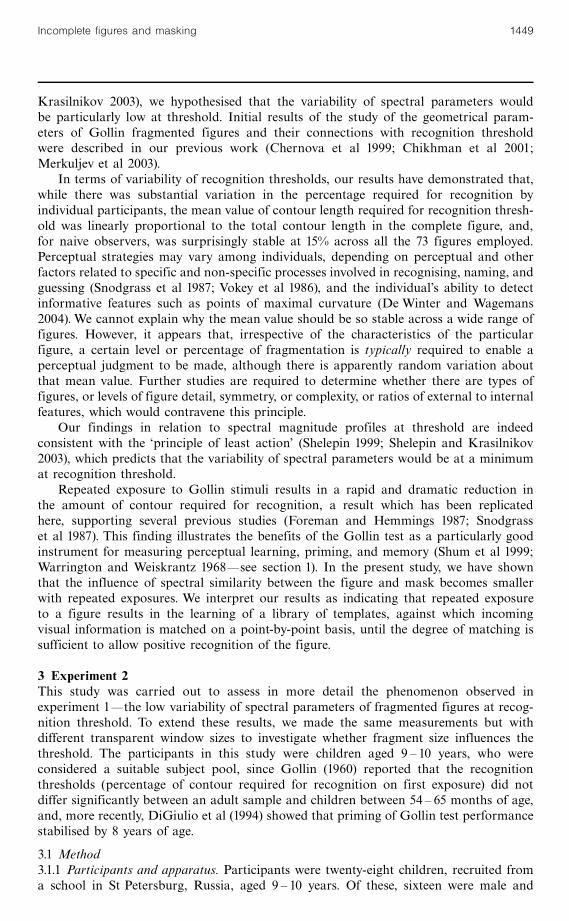
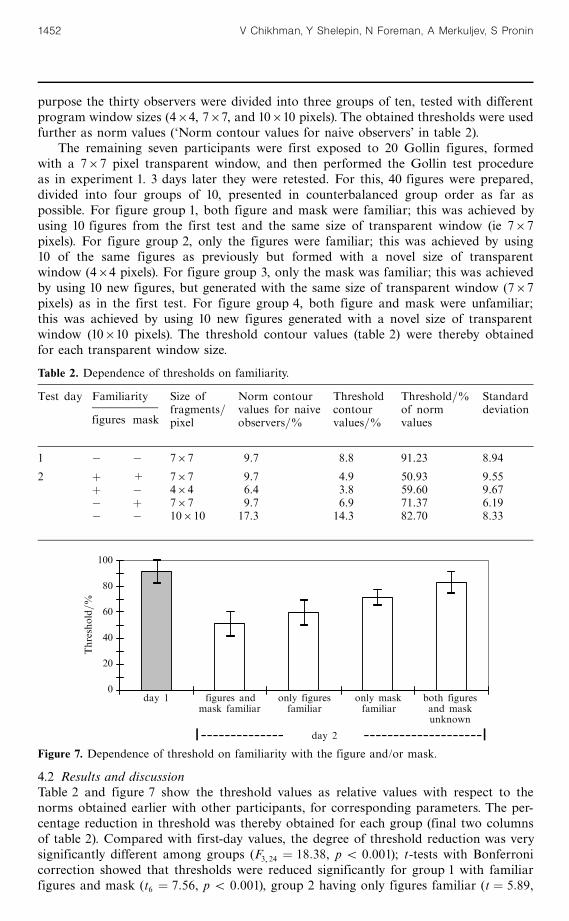
4.2 Results and discussionTable 2 and figure 7 show the threshold values as relative values with respect to thenorms obtained earlier with other participants, for corresponding parameters. The per-centage reduction in threshold was thereby obtained for each group (final two columnsof table 2). Compared with first-day values, the degree of threshold reduction was verysignificantly different among groups (F3 24 � 18:38, p 5 0:001); t-tests with Bonferronicorrection showed that thresholds were reduced significantly for group 1 with familiarfigures and mask (t6 � 7:56, p 5 0:001), group 2 having only figures familiar (t � 5:89,
,
Table 2. Dependence of thresholds on familiarity.
Test day Familiarity Size of Norm contour Threshold Threshold=% Standard
figures maskfragments= values for naive contour of norm deviationpixel observers=% values=% values
1 ÿ ÿ 767 9.7 8.8 91.23 8.94
2 � + 767 9.7 4.9 50.93 9.55� ÿ 464 6.4 3.8 59.60 9.67ÿ � 767 9.7 6.9 71.37 6.19ÿ ÿ 10610 17.3 14.3 82.70 8.33
100
80
60
40
20
0
Threshold=%
day 1 figures and only figures only mask both figuresmask familiar familiar familiar and mask
unknown
day 2
Figure 7. Dependence of threshold on familiarity with the figure and/or mask.
1452 V Chikhman, Y Shelepin, N Foreman, A Merkuljev, S Pronin

p 5 0:002), and group 3 having only the mask familiar (t � 4:48, p 5 0:01), but notfor group 4 where both figures and mask were unfamiliar (t � 1:71, p 4 0:05). Althoughit is not surprising that for any condition in which the figures are novel, threshold isminimally reduced (except, perhaps, owing to non-specific factors, such as better acquain-tance with the test protocol), the demonstration that increased familiarity with maskparameters leads to a significant reduction in threshold implies that mask parametersare being encoded and remembered across trials.
5 DiscussionIn the studies reported here, we used incomplete-contour Gollin figures, the forms andtypes of which were similar to those used previously in clinical studies and assessmentsfor the testing of agnosias (see Martin 2006, and Bradshaw and Mattingley 1995) andin other experimental and clinical applications (Warrington and Weiskrantz 1968; seesection 1 above). Although the Gollin test is convenient for the study of perceptuallearning, which takes place particularly rapidly, the present studies have been con-cerned both with performance when an observer is exposed for the first time to a setof accumulating figures, and then with the effects of repeated exposure. Gollin figuresrepresent canonical images of common everyday objects or animals, but the particularimage and form of presentation as fragmented images is completely novel. We assumethat in this situation, at first impression, the mechanisms of recognition of a wholeobject are engaged (the extraction of a Gestalt). We assume that the visual system,confronted by the need to identify a fragmented representation, extracts a signal(Gestalt, or whole figure with complete contour) from the noise (the `invisible' mask),determining all its geometrical or statistical properties. This investigation started froma specific question: are there any interesting (specific) physical (optical, geometrical,statistical) properties of incomplete figures that vary according to whether the stimulusis below, at, or above the recognition threshold? Our main hypothesis assumes thatperception of a fragmented figure can be conceived as the perception of single visiblefragments, the filtration of invisible fragments, and thus the formation of the wholeobject (Gestalt) from visible fragments. We postulate that in the first observation of anunfamiliar object `library' the observer perceives fragments as a whole object from thestart, but a masked object. There are differences in this context with Biederman's(1987) work, where it is asserted that the basis of perception is not a whole structure(Gestalt) but only informative features, which must be related and combined to gen-erate the whole object. Our results do not address this issue directly, since, when afigure is extracted from noise, a new set of criteria may be applied that either usean overall Gestalt, mapped against an internal representation of the whole object, ormapped according to the presence or absence of particular informative features. It islikely that particular informative features may be used more in some cases than in others,depending on whether the overall appearance of the object or crucial elements bestconvey its identity. When contour figures are presented for the first time to observers,the influence of informative features may be important, but they are unlikely to be crucial,though for each subsequent presentation of the same objects, the perceptual learningcurve is likely to reflect the storage and matching of these informative features.
A masking approach has been adopted previously by Vokey et al (1986), who usedsomewhat more complete illustrations than the line drawing used here. However, in thatcase, rather than progressively removing an `invisible' mask, they removed elements of avisible texture mask from around the figure, so that threshold was achieved when thebalance between figure and explicit mask elements was such that the figure becamediscriminable from ground. It is important that these authors also recognised the benefitsof analysing Gollin figures in terms of signal-to-noise ratio.
Incomplete figures and masking 1453

The subtraction of the complete signal from the signal with noise is a traditionalmeans of measuring noise parameters. It is possible to apply this principle in spatialand spatial-frequency-based analyses. We assume (see above) that subtraction of theparameters of amplitude spectra for complete and incomplete images gives us an aver-age description of the statistical properties of the `invisible' mask. Can the visualsystem extract the properties of this mask? We postulate that the visual system esti-mates a statistical distribution of invisible fragments which are connected with thevisible ones. The mask which is used for the formation of a fragmented figure withthe help of the window program, and texture with the same element size are similar(figure 3), but in our case the effective part of the mask is the part which occludesthe figure contour.
Thus, we have attempted to determine, with the aid of image processing methods,the different parameters of fragmented images, and to demonstrate the possibility of usingsuch parameters for whole-figure extraction by the visual system. The use of amplitudespectra for image comparison has the advantage of being invariant to the displacementof the figure in the spatial domain. Apart from this, it is known that spatial-frequencyanalysis of mask textures can use magnitude only (Caelli 1982). An alternative wouldbe the use of phase information, but this would vary with spatial displacements ofimages, and we regard it as extremely unlikely that in this task the visual system needsin-phase information on the spectra of fragmented figures. The experiments with differ-ent sequences of appearance of elements support this idea. The incomplete figures atthe threshold of recognition had different sequences of appearing elements, yet thepercentage of contour required for recognition was similar.
To determine the similarity between the fragmented figure and the mask in thespatial domain the exact displacement of different transparent mask elements is impor-tant. Two versions of the mask will be different, despite each conforming to the constraintthat any element has a 50% probability of appearance. However, the parameters of theamplitude ^ frequency spectra will be practically the same for different mask versions,and we can use the same profile of the mask amplitude ^ frequency spectra for com-parison with the corresponding spectral values of different fragmented figures. Usingspatial-frequency analysis, we can obtain statistical characteristics of figures that aresimpler than those obtainable in the spatial domain. Moreover, if we use only theparameters of the amplitude spectra, we can analyse figures with analyses based onvisual function rather than semantic/naming processes, thus simplifying further dataprocessing and interpretation.
The obtained results are consistent with our assertion that fragmented Gollin figures,and other similar fragmented images, can be regarded as being partially occluded by an`invisible' mask. This novel approach implies that the visual system successfully extractsthe figure from this `invisible' mask at the point when a Gollin test figure is correctlyperceived. For this, the visual system must determine the statistical properties of the`invisible' mask, as the typical texture, ie to determine the size and probability of itselements, which can be deduced from their amplitude spectrum. It is possible that thisis accomplished by using (a) the average size of observed fragments and (b) the averagedistance between fragments. We suppose that the visual system approximately estimatesthe information in the image that can be described by the amplitude spectrum of the`invisible' mask on the basis of these two parameters. This would optimise signal-from-noise extraction, and after that achieve matched filtration.
An earlier correlation study investigating performance on different tests requiringthe identification of fragmented or ambiguous figures showed that Gollin test perfor-mance correlates significantly with that on the Poppelreuter test but not with thaton the Mooney test (Foreman 1991). This supports the idea that in performance ofthe Gollin test, the visual system enables mechanisms of signal-from-noise extraction,
1454 V Chikhman, Y Shelepin, N Foreman, A Merkuljev, S Pronin

the noise arguably represented by either a visible (Poppelreuter) or an invisible (Gollin)mask. In this case, incomplete-figure perception (at first encounter with the images)may be an important and measurable criterion for diagnosing an apperceptive agnosicpatient who appears to suffer from image degradation. A deficient mechanism forsignal-from-noise extraction would be expected to produce an effective figure degrada-tion, making the correct identification of line drawings difficult. This is indeed whathas been observed in apperceptive agnosic patients (Warrington 1982). Work is currentlyin progress to assess this conclusion, by means of studies in which exogenous noiseof various kinds is introduced into Gollin figures. On the basis of the present studies,we would argue that in some cases of apperceptive agnosia the patient might be suffer-ing from a difficulty in extracting signal from noise, and thus might best be describedas suffering from `filtration agnosia'.
Acknowledgments. We gratefully acknowledge the helpful comments of anonymous referees.The research was supported by the Russian Foundation for Basic Research grants 02-06-80099,06-07-89137, and 05-04-49032; also by the Russian Foundation for Humanities, grants 06-06-00252aand 05-06-06085a.
ReferencesAttneave F, 1954 ``Some information aspects of visual perception'' Psychological Review 61 183 ^ 198Attneave F, 1955 ` Symmetry, information and memory for patterns''American Journal of Psychology
68 209 ^ 222Biederman I, 1987 ` Recognition-by-components: A theory of human understanding'' Psychologi-
cal Review 94 115 ^ 147Bentley A M, Dere� gowski J B, 1987 ` Pictorial experience as a factor in the recognition of
incomplete figures''Applied Cognitive Psychology 1 209 ^ 216Bradshaw J L, Mattingley J B, 1995 Clinical Neuropsychology: Behavioral and Brain Science
(New York: Academic Press)Bregman A S, 1981 `Asking the `what for' question in auditory perception'', in Perception Organi-
zation Eds M Kubovy, J Pomerantz (Mahwah, NY: Lawrence Erlbaum Associates) pp 99 ^ 118Bruce V, Green P, Georgeson M, 1996 Visual Perception (Hove, Sussex: Psychology Press)Caelli T, 1982 ` On discriminating visual textures and images'' Perception & Psychophysics 31 149 ^ 159Campbell F, Robson J, 1968 `Application of Fourier analyses to the visibility of gratings'' Journal
of Physiology 197 551 ^ 566Chernova N D, Muravyova S, Shelepin Y, Foreman N, Tadtaeva Z, Chikhman V, Pronin S, 1999
` Gollin test on a noisy backgrounds'' Perception 28 Supplement, 77Chikhman V N, Shelepin Y E, Foreman N, Merkuljev AV, Krasilnikov N N, 2001 ` The Gollin test
and the optical properties of incomplete figures at threshold'' Perception 30 Supplement, 89Corkin S, 1982 ``Some relationships between global amnesias and the memory impairments in
Alzheimer's Disease'', in Alzheimer's Disease: A Report of Progress Eds S Corkin, K L Davis,J H Growdon, E Usdin, R J Wurtman (New York: Raven Press) pp 149 ^ 164
De Winter J, Wagemans J, 2004 ` Contour-based object identification and segmentation: Stimuli,norms and data, and software tools'' Behavior Research Methods, Instrumentation, & Computers36 604 ^ 624
DiGiulio D V, Seidenberg M, O'Leary D S, Raz N, 1994 ` Procedural and declarative memory:A development study'' Brain and Cognition 25 79 ^ 91
Field D J, 1987 ` Relations between the statistics of natural images and the response propertiesof cortical cells'' Journal of the Optical Society of America A 4 2379 ^ 2394
Field D J, 1994 ` What is the goal of sensory coding?'' Neural Computation 6 559 ^ 601Field D J, Brady N, 1997 ``Visual sensitivity, blur and the sources of variability in the amplitude
spectra of natural scenes'' Vision Research 37 3367 ^ 3383Field D, Hayes A, 2004 ` Contour integration and the lateral connections of V1 neurons'', in The
Visual Neurosciences Eds M Chalupa, J S Werner (Cambridge, MA: MIT Press) pp 1069 ^ 1979Foreman N, 1991 ` Correlates of performance on the Gollin and Mooney tests of visual closure''
Journal of General Psychology 118 13 ^ 20Foreman N, Hemmings R, 1987 ` The Gollin incomplete figure test: a flexible, computerised
version'' Perception 16 543 ^ 548Ghent L, 1956 ` Perception of overlapping and embedded figures by children of different ages''
American Journal of Psychology 69 575 ^ 587
Incomplete figures and masking 1455

Ghosh A, Petkov N, 2005 ` Robustness of shape descriptors to incomplete contour representations''IEEE Transactions on Pattern Analysis and Machine Intelligence (PAMI) 27 1793 ^ 1804
Giersch A, Humphreys G W, Boucart M, Kovacs I, 2000 ``The computation of occluded contoursin visual agnosia: Evidence for early computation prior to shape binding and figure ^ groundcoding'' Cognitive Neuropsychology 17 731 ^ 759
Ginsburg A, 1986 ` Spatial filtering and visual form perception'', in Handbook of Perception andHuman Performance Ed. K Boff (New York: John Wiley and Sons) pp 99 ^ 109
Glezer V D, 1995 Vision and MindöModelling Mental Functioning (Mahwah, NJ: LawrenceErlbaum Associates) page 274
Gollin E S, 1960 ` Developmental studies of visual recognition of incomplete objects'' Perceptualand Motor Skills 11 289 ^ 298
Gruber T, Muller M M, Keil A, 2002 ` Modulation of induced gamma band responses in aperceptual learning task in the human EEG'' Journal of Cognitive Neuroscience 14 732 ^ 744
Hess R F, Hayes A, Field D J, 2003 ``Contour integration and cortical processing'' Journal ofPhysiology, Paris 97 105 ^ 119
Hummel J, Biederman I, 1992 ` Dynamic binding in a neural network for shape recognition''Psychological Review 99 480 ^ 517
Kanizsa G, 1979 Organization in Vision (New York: Praeger)Krasilnikov N N, Shelepin Y E, Krasilnikova O I, 1999 ` The use of the principles of the optimal
observer in modelling the human visual system'' Journal of Optical Technology 66 782 ^ 787Kulikowski J J, Robson A G, 1999 ` Spatial, temporal and chromatic channels: Electrophysiological
foundations'' Journal of Optical Technology 66 797 ^ 808McCarthy R A, Warrington E K, 1990 Cognitive Neuropsychology: A Clinical Introduction (San
Diego, CA: Academic Press) pp 31, 302Mack J L, Patterson M B, Schnell A H, Whitehouse P J, 1993 ` Performance of subjects with
probable Alzheimer Disease and normal elderly controls on the Gollin Incomplete PicturesTest'' Perceptual and Motor Skills 77 951 ^ 969
Makulov V B, Pauk V N, 1992 ` Software for image processing on personal computers'' Journalof Optical Engineering 31 782 ^ 788
Martin G N, 2006 Human Neuropsychology second edition (Harlow, Essex: Prentice-Hall)Merkuljev A, Shelepin Y, Chikhman V, Pronin S, Foreman N, 2003 ` The optical and geometrical
parameters of incomplete contour figures at threshold'' Russian Physiological Journal 89731 ^ 737
Mooney C M, 1957 `Age in the development of closure ability in children'' Canadian Journal ofPsychology 2 219 ^ 226
Murray F S, Szymczyk J M, 1978 ` Effects of distinctive features on the recognition of incompletefigures'' Developmental Psychology 14 356 ^ 362
Olshausen B A, Field D J, 1996 ` Emergence of simple-cell receptive field properties by learninga sparse code for natural images'' Nature 381 607 ^ 609
Olshausen B A, Field D J, 1997 ` Sparse coding with an overcomplete basis set: A strategy employedby V1?'' Vision Research 37 3311 ^ 3325
Olshausen B A, Field D J, 2004a ` Sparse coding of sensory inputs''Current Opinion in Neurobiology14 481 ^ 487
Olshausen B A, Field D J, 2004b ` What is the other 85% of V1 doing?'', in 23 Problems in SystemsNeuroscience Eds T J Sejnowski, L van Hemmen (Oxford: Oxford University Press)
Patterson M B, Mack J L, Schnell A H, 1999 ` Performance of elderly and young normals onthe Gollin Incomplete Pictures Test'' Perceptual and Motor Skills 89 663 ^ 664
Piotrowski L N, Campbell F W, 1982 `A demonstration of the visual importance and flexibilityof spatial-frequency amplitude and phase'' Perception 11 337 ^ 346
Poppelreuter W, 1917 Die psychischen Scha« digungen durch Kopfschuss im Kriege 1914 ^ 1916 (Leipzig:Voss)
Pratt W K, 1978 Digital Image Processing (New York: John Wiley and Sons)Reales J M, Ballesteros S, Garcia E, 2002 ` Visual word identification thresholds for the 260
fragmented words of the Snodgrass and Vanderwart pictures in Spanish'' Behavior ResearchMethods, Instruments, & Computers 34 276 ^ 285
ShelepinY E, 1999 ` Principle of least action, vision and conditioned reflexes theory'', in Mechanismsof Adaptive Behavior (St Petersburg: Pavlov Institute of Physiology) pp 195 ^ 196
Shelepin Y E, Krasilnikov N N, 2003 ` The principle of least action, vision physiology, andconditioned reflexes theory'' Russian Physiological Journal 89 725 ^ 730
Shum D, Jamieson E, Bahr M, Wallace G, 1999 ` Implicit and explicit memory in children withtraumatic brain injury'' Journal of Clinical and Experimental Neuropsychology 21 149 ^ 158
1456 V Chikhman, Y Shelepin, N Foreman, A Merkuljev, S Pronin
Snodgrass J G, Hirschman E, 1994 ` Dissociations among implicit and explicit memory tasks:The role of stimulus similarity'' Journal of Experimental Psychology: Learning, Memory, andCognition 20 150 ^ 160
Snodgrass J G, Poster M, 1992 ` Visual-word recognition thresholds for screen-fragmented names ofthe Snodgrass and Vanderwart pictures'' Behavior Research Methods, Instruments, & Computers24 1 ^ 15
Snodgrass J G, Smith B, Feenan K, Corwin J, 1987 ` Fragmenting pictures on the Apple Macintoshcomputer for experimental and clinical applications'' Behavior Research Methods, Instruments,& Computers 19 270 ^ 274
Spitz H H, Borland M D, 1971 ` Redundancy in line drawings of familiar objects: effects of ageand intelligence'' Cognitive Psychology 2 196 ^ 205
Stark H, 1982 Application of Optical Fourier Transforms (New York: Academic Press)Street R F, 1931 A Gestalt Completion Test (New York: Teachers College, Columbia University)Vakil E, Hoofien D, Blachstein H, 1992 ` Total amount learned versus learning rate of verbal and
nonverbal information, in differentiating left- from right-brain-injured patients'' Achives ofClinical Neuropsychology 7 111 ^ 120
Vokey J R, Baker J G, Hayman G, Jacoby L L, 1986 ` Perceptual identification of visually degradedstimuli'' Behavior Research Methods, Instruments, & Computers 18 1 ^ 9
Wandell B A, 1995 Foundations of Vision (Sunderland, MA: Sinauer Associates)Warrington E K, 1982 ` Neuropsychological studies of object identification'' Philosophical Trans-
actions of the Royal Society of London 298 15 ^ 33Warrington E, James M, 1967 ` Disorders of visual perception in patients with localized cerebral
lesions'' Neuropsychologia 5 253 ^ 266Warrington E, Weiskrantz L, 1968 ` New method of testing long-term retention with special
reference to amnesic patients'' Nature 217 972 ^ 974
Incomplete figures and masking 1457

ß 2006 a Pion publication

Conditions of use. This article may be downloaded from the E&P website for personal researchby members of subscribing organisations. This PDF may not be placed on any website (or otheronline distribution system) without permission of the publisher.