income tax non-compliance of small and medium enterprises
TRANSCRIPT
Curtin Business School School of Economics and Finance
Income Tax Non-compliance of Small and Medium Enterprises in
Malaysia: Determinants and Tax Compliance Costs
Hijattulah Abdul Jabbar
This thesis is presented for the Degree of Doctor of Philosophy
of Curtin University of Technology
August 2009
ii
DECLARATION
To the best of my knowledge and belief this thesis contains no material previously
published by any other person except where due acknowledgment has been made.
This thesis contains no material which has been accepted for the award of any other
degree or diploma in any university.
Signature:
Date: 11 August 2009
iii
ABSTRACT
This study examines the influence of tax compliance costs on non-compliance behaviour,
taken together with the business characteristics and managerial perceptions of corporate
taxation. The study focuses on corporate Small and Medium Enterprises (SMEs) in
Malaysia under the Income Tax Self-Assessment System (SAS). This is the first study on
corporate income tax compliance in the Malaysian context and among the first to
integrate tax compliance costs, tax attitudes and the likely compliance behaviour of
corporations, both in Malaysia and internationally. Thus it makes a significant
contribution given this dearth of international literature on corporate tax compliance.
The study adopts a traditional large-scale postal survey questionnaire technique that has
been employed extensively by studies of both tax compliance and compliance costs
studies internationally. Specifically, estimation of tax compliance costs largely follows
the usual technique used by Pope, the ‘father’ of tax compliance costs studies in Australia
and Asia. This estimation method was first established by Sandford, the ‘grandfather’ of
modern tax compliance costs studies, and has been globally employed with some
modification to the local context. On the other hand, tax attitudes and the likely
compliance/non-compliance behaviour of SMEs are measured from a business
managerial or respondent perspective. The above primary postal survey, as well as two
additional surveys—a web survey of SMEs and a postal survey of tax professionals—
have been undertaken as a measure of consistency of the primary postal survey.
The income tax compliance costs for Malaysian SMEs are estimated at RM9,295 per
company, amounting to RM1,084 million in aggregate for the 2006 tax year. The findings
of this study demonstrate that the average income tax compliance costs of SMEs under
the SAS have decreased significantly by 58 percent in absolute terms. Despite this, the
increasing composition of both external costs and computational costs, by 16 and 15
percent respectively, reveals that the role of tax professionals and routine tax works have
become substantially greater under the SAS regime. The figure for compliance costs
relative to tax revenue of eight percent is found to be similar to a pre-SAS Malaysian

iv
study, and is also within the international range overall. As for the offsetting benefits, the
value of tax deductibility is estimated to be almost RM1,700 per SME company, RM196
million in aggregate, or around 18 percent of the compliance costs, thus giving average
net compliance costs of RM7,595 or RM888 million in total.
The current study provides evidence of the influence of tax complexity and probability of
tax audit on corporate SME tax non-compliance in Malaysia. Compliance costs, in
particular, together with two business characteristics, i.e. business size and tax level, and
the managerial perceptions about tax fairness and the Inland Revenue Board (IRB)
relationship, are found not to influence corporate tax non-compliance. On the other hand,
the effect of the remaining four variables, i.e. business length, sector, tax rate and tax
incentives, is inconclusive. In terms of international comparisons, the effects of business
size on previous corporate tax compliance are mixed, but the business sector was found
to influence corporate tax compliance.
Regarding tax compliance costs, the need to recognise the presence and regressivity of
tax compliance costs upon SMEs should be, at this stage, recognised at the national level.
Further, at a later stage, such issues should be systematically considered and assessed for
any major change in tax policy. Findings regarding tax complexity suggest that the IRB
should continue their tax simplification measures in a more comprehensive manner to
significantly minimise the compliance burden for all business taxpayers, of any size. In
terms of tax auditing, the IRB may want to increase substantially the magnitude of such
activity, and should utilise such information effectively to lift taxpayers’ levels of
awareness about the likelihood of their businesses being selected for a tax audit.
Finally, it is acknowledged that there are several limitations of the current study,
including those usually associated with self-reporting mail surveys, which may limit the
interpretation of the current findings. Despite this, the study makes a significant
contribution given the limited number of studies in the field of corporate tax compliance
and tax compliance costs studies, particularly for Malaysian SMEs. Future research into

v
this area, including several extensions of this study, could make further valuable
contributions in this area.

vi
DEDICATION
This thesis is dedicated to my wife, Salmah Hassan and our children, Munirah, Noor
Afnan and Noor Amnan.
Also dedicated to my late father, Abdul-Jabbar Shaik Mohamed (Al-Marhum); my
mother, Ramjan Mohd Yusof; and my brothers—Sayeed Ibrahim, Hakim, Sarubuddin
and Shajahan.

vii
ACKNOWLEDGMENTS
In the name of Allah [God], the most Gracious and the most Merciful. All praise and
thanks are certainly due to Allah, for all the blessings throughout my life and especially
during this doctoral journey. Many people deserve thanks and appreciation on the
completion of this thesis.
First and foremost, I would like to thank my supervisor, Associate Professor Jeff Pope
from the School of Economics and Finance, Curtin Business School (CBS), who has been
actively interested in my work and has always been available to advise me. I am very
grateful for his detailed and constructive comments and also for his important guidance
and support throughout my research and thesis writing. As a ‘father’ of tax compliance
costs studies in the Asia–Pacific countries, he has shared with me a lot of his expertise
and research insights. It has been an honour to successfully complete this thesis under his
supervision.
I also express my appreciation to my associate supervisors, Professor Dale Pinto from the
School of Business Law and Taxation, CBS, and Professor Hajah Mustafa Mohd
Hanefah, formerly from University Utara Malaysia (UUM) and now at University Sains
Islam Malaysia, for their continuous advice and encouragement. My sincere thanks also
go to Dr John Fielder, from The Learning Centre, Curtin University, for enabling me to
improve my language skills over the duration of writing this thesis.
I am also grateful for the help and encouragement of many friends and colleagues, both in
Malaysia (mainly from the UUM) and in Perth (including those from the UUM and
Curtin University). It is also a pleasure to express my gratitude wholeheartedly to Musa
Las and Norizan Azizan for their kind help and generosity during my stay in Perth. I am
also indebted to all my teachers, lecturers and professors, not all of whom can be
mentioned by name.
viii
Above all, I owe extra-special thanks to my beloved wife, Salmah Hassan, and our lovely
kids—Munirah, Noor Afnan and Noor Amnan—for their patience, understanding and,
more importantly, their sacrifices over the past three and half years. My heartfelt thanks
are due to my mother, brothers and their families, and my parents-in-law for their love
and support. All their ‘doa’ [prayer] over the years has sustained me on my journey.
Besides the people mentioned above, I would like to thank the many organisations that
have supported and facilitated this study, in particular UUM, CBS, the Small and
Medium Industries Development Corporation of Malaysia, SME Bank (Alor Setar
Branch), and all the companies that responded to my surveys.
The author of this thesis has jointly published articles during his doctoral study, either as
a first-named author or a co-author. Additionally, several conference papers were
presented and co-published in the relevant conference proceedings. The contribution of
these publications are acknowledged in this thesis, updated and referenced accordingly.
Any errors are the responsibility of the author. These publications are listed below:
Abdul-Jabbar, H & Pope, J 2008, ‘The Effects of the Self-Assessment System on the Tax
Compliance Costs of Small and Medium Enterprises in Malaysia’, Australian Tax
Forum, vol. 23, no. 3, pp. 289–307.
Abdul-Jabbar, H & Pope, J 2008, ‘Exploring the Relationship between Tax Compliance
Costs and Compliance Issues in Malaysia’, Journal of Applied Law and Policy,
vol. 1, no. 1, pp. 1–20.
Abdul-Jabbar, H & Pope, J 2009 (Forthcoming), ‘Tax Attitudes and Compliance among
Small and Medium Enterprises in Malaysia’, New Zealand Journal of Taxation
Law and Policy, vol. 15, no. 3.
ix
Abdul-Jabbar, H & Pope, J 2009, ‘The Effect of the Self-Assessment System on the Tax
Attitudes and Behaviour of Small and Medium Enterprises in Malaysia’, in the
21st Annual Conference of Australasian Tax Teachers Association, Christchurch,
19–21 January.
Pope, J & Abdul-Jabbar, H 2007, ‘Tax Simplicity and Small Business in Malaysia: Past
Developments and the Future’, in the 19th Annual Conference of Australasian
Tax Teachers Association, Brisbane, 22–24 January.
Pope, J & Abdul-Jabbar, H 2007, ‘Small and Medium Enterprises in Malaysia: Issues of
the Tax Compliance Burden', in the 7th Asian Academy of Management
International Conference, Penang, 21–25 May.
Pope, J & Abdul-Jabbar, H 2007, ‘Small and Medium Enterprises and the Regulatory
Burden in Malaysia: Alleviating the Compliance Costs of the Goods and Services
Tax’, in 4th Global Economy Conference, Shah Alam, 9–10 July.
Pope, J & Abdul-Jabbar, H 2008, ‘Tax Compliance Costs of Small and Medium
Enterprises in Malaysia: Policy Implications’, Curtin Business School, Perth,
Working Paper 2008.08.
Pope, J & Abdul-Jabbar, H 2008, ‘Small and Medium-sized Enterprises and Tax
Compliance Burden in Malaysia: Issues and Challenges for Tax Administration’,
Small Enterprise Research: The Journal of SEAANZ, vol. 16, no. 1, pp. 47–60.
x
TABLE OF CONTENTS
Page
DECLARATION …………………………………………………………... ii
ABSTRACT ………..………………………………………………………. iii
DEDICATION ……………………………………………………………... vi
ACKNOWLEDGEMENTS ……………………………………………….. vii
TABLE OF CONTENTS ………………………………………………….. x
LIST OF TABLES ………………………………………………………… xvii
LIST OF FIGURES ……………………………………………………….. xxiv
LIST OF ABBREVIATIONS ……………………………………………... xxv
KEY GLOSSARY …………………………………………………………. xxvii
CHAPTER 1: INTRODUCTION ………………………………………… 1
1.1 Background …………………………………………………………...
1.2 Income Tax, Non-compliance and Small and Medium Enterprises in
Malaysia ………………………………………………………………
1.2.1 Significance of Income Tax …………………………………..
1.2.2 Significance of Tax Non-compliance …………………………
1.2.3 The Importance of Small and Medium Enterprises …………..
1.3 Research Objectives …………………………………………………..
1.4 Significance of the Study …….……………………………………….
1.5 Analysis of Key Terms ………..……………………………………...
1.5.1 Tax Compliance or Non-compliance …………..……………..
1.5.2 Tax Compliance Costs …………...……...……………………
1.5.3 Small and Medium Enterprises ……………………………….
1.5.4 Exchange Rate …………...……...…………………….............
1.6 Presentation of the Thesis ……………..……………………………...
1
3
3
4
7
9
9
11
11
13
14
16
16

xi
CHAPTER 2: REVIEW OF STUDIES OF TAX COMPLIANCE AND
TAX COMPLIANCE COSTS ……………………………
19
2.1 Introduction …………………………………………………………...
2.2 A Review of Tax Compliance Studies ………………………………..
2.2.1 International Tax Compliance Studies……….………………..
2.2.2 Malaysian Tax Compliance Studies ……..……………………
2.3 A Review of Tax Compliance Costs Studies …………………………
2.3.1 International Compliance Costs Studies ……………………...
2.3.2 Malaysian Compliance Costs Studies …………….…….…….
2.4 Chapter Summary ………………..…………………………….……..
19
19
19
26
32
32
42
45
CHAPTER 3: TAXATION OF SMALL AND MEDIUM
ENTERPRISES AND MAJOR ISSUES IN MALAYSIA
47
3.1 Introduction …………………………………………………………...
3.2 Malaysian Income Taxation under Self-Assessment …………………
3.2.1 Overview ……………………………………………………...
3.2.2 Duties and Responsibilities of Business Taxpayers …………..
3.2.3 Recent Major Business Income Tax Changes ………………...
3.3 Key Features of Income Taxation for Small and Medium Enterprises .
3.4 Major Income Tax Difficulties and Issues for Small and Medium
Enterprises …………………………………………………………….
3.4.1 Overall Perspective …………………………………………...
3.4.2 Record Keeping and Documentation …………………………
3.4.3 Tax Complexity ……………………………………………….
3.4.4 Business Legal Form ………………………………………….
3.4.5 Tax Compliance Costs ………………………………………..
3.5 Chapter Summary …………………………………………………….
47
47
47
49
52
56
58
58
59
60
61
63
63
CHAPTER 4: RESEARCH DESIGN AND METHODOLOGY ……….. 64
4.1 Introduction …………………………………………………………...
4.2 Survey Research Design ……………………………………………...
64
64

xii
4.3 Data Collection Method and Strategy ………………………………...
4.4 Measurement Issues and Approach …………………………………...
4.4.1 Estimating Compliance Costs ………………………………...
4.4.2 Benefits of Tax Compliance ………………………………….
4.4.3 Measuring Compliance Behaviour ……………………………
4.5 Questionnaire Design ………………………………………………....
4.6 Pilot Interviews ……………………………………………………….
4.7 Survey Implementation ……………………………………………….
4.8 Population and Sample of the Study ………………………………….
4.9 Non-Response Bias ………………………………………………..….
4.10 Method of Data Analysis ……………………………………………..
4.10.1 Overall Approach ……………………………………………..
4.10.2 Compliance Costs Estimation ………………………………...
4.10.3 Relationship between Compliance Costs and Compliance
Behaviour ……………………………………………………..
4.10.4 Determinants of Compliance Behaviour …………...…………
4.11 Additional Surveys ……………………………………………………
4.11.1 Web Survey …………………………………………………...
4.11.2 Survey of Tax Professionals ………………………………….
4.12 Chapter Summary …………………………………………………….
66
73
73
75
77
84
88
90
93
95
97
97
98
99
100
100
100
103
104
CHAPTER 5: COMPLIANCE COSTS ESTIMATES OF SMALL
AND MEDIUM ENTERPRISES .………………………...
105
5.1 Introduction …………………………………………………………...
5.2 Responses and Rate …………………………………………………...
5.3 Profile of Responding Small and Medium Enterprises ……………….
5.4 Internal Costs of Compliance …………………………………………
5.4.1 Tax Difficulties Faced by the Small and Medium Enterprises .
5.4.2 Internal Staff Time ……………………………………………
5.4.3 Time Valuation ……………………………………………….
5.4.4 Mean Internal Costs ……..……………………………………
105
105
108
117
117
118
119
120

xiii
5.5 External Costs of Compliance ………………………………………...
5.5.1 Mean External Tax Fees …….………………………………..
5.5.2 Reason for Using External Services ………………………….
5.6 Additional Costs of Compliance ……………………………………...
5.6.1 Mean Additional Costs ………………………………………..
5.6.2 Nature of Additional Costs …………………………………...
5.7 Mean Compliance Costs ……………………………………………...
5.7.1 Overall Mean Compliance Costs ……………………………..
5.7.2 Compliance Costs by Small and Medium Enterprise Profile ...
5.7.3 Distribution of Compliance Costs …………………………….
5.7.4 Compliance Costs Analysis by Internal-External Ratio ……...
5.7.5 Compliance Costs Analysis by Computational-Planning Ratio
5.8 Possible Compensation and Compliance Costs ………………...…….
5.9 Aggregate Gross Compliance Costs Estimates ……………………….
5.10 Estimation of Offsetting Benefits …………………………………….
5.11 Net Aggregate Compliance Costs Estimates …………………………
5.12 The Web Survey ………………………………………………………
5.12.1 Overall Responses and Business Profile ……………………...
5.12.2 Compliance Costs Estimates ………………………………….
5.12.3 Compliance Costs Distribution ……………………………….
5.12.4 Possible Compensation and Compliance Costs ………...…….
5.12.5 Tax Deductibility and Aggregate Compliance Costs …………
5.13 Chapter Summary …………………………………………………….
121
121
121
122
122
123
124
124
125
129
132
136
141
142
144
147
148
148
149
150
151
152
153
CHAPTER 6: TAX ATTITUDES AND COMPLIANCE BEHAVIOUR
OF SMALL AND MEDIUM ENTERPRISES …………..
155
6.1 Introduction …………………………………………………………...
6.2 Tax Attitudes of Small and Medium Enterprises ……………………..
6.2.1 Assessment of Reliability and Validity ……………………….
6.2.2 Tax Complexity ……………………………………………….
6.2.3 Tax Fairness ………………………………………………......
155
155
155
158
159

xiv
6.2.4 Tax Rate ………………………………………………………
6.2.5 Other Attitudinal Aspects ……………………………………..
6.3 Tax Compliance Behaviour of Small and Medium Enterprises ………
6.4 Relationship of Tax Attitudes and Tax Behaviour ……………………
6.5 Relationship of Tax Attitudes and Compliance Costs …....…….…….
6.6 Relationship of Tax Behaviour and Compliance Costs ………………
6.7 Determinants of Compliance Behaviour ……………………………...
6.8 Findings of the Web Survey …………………………………………..
6.8.1 Introduction …………………………………………………...
6.8.2 Tax Attitudes ………………………………………………….
6.8.3 Tax Behaviour ………………………………………………...
6.8.4 Relationship of Tax Attitudes, Behaviour and Compliance
Costs …………………………………………………………..
6.8.5 Determinants of Compliance Behaviour ……………………...
6.9 Findings of the Professional Survey ………………………………….
6.9.1 Responses and Profile ………………………………………...
6.9.2 Tax Attitudes and Behaviour from Tax Professionals’
Viewpoints ……………………………………………………
6.10 Chapter Summary …………………………………………………….
160
161
163
166
168
169
173
178
178
179
180
181
182
183
183
187
189
CHAPTER 7: COMPARISON OF FINDINGS AND DISCUSSION ….. 191
7.1 Introduction …………………………………………………………...
7.2 Compliance Costs Estimates ………………………………………….
7.2.1 Comparison with Web Survey ………………………………..
7.2.2 Comparison with Prior Malaysian Studies ……………………
7.2.3 Comparison with International Studies ……………………….
7.3 Tax Attitudes ………………………………………………………….
7.3.1 Comparison with Web Survey ………………………………..
7.3.2 Comparison with Tax Professionals’ Survey …………………
7.3.3 Comparison with Prior Malaysian Studies ……………………
7.3.4 Comparison with International Studies ……………………….
191
191
191
194
201
206
206
207
208
211
xv
7.4 Compliance Behaviour ………………………………………………..
7.4.1 Comparison with Web Survey ………………………………..
7.4.2 Comparison with Tax Professionals’ Survey …………………
7.4.3 Comparison with Prior Malaysian Studies ……………………
7.4.4 Comparison with International Studies ……………………….
7.5 The Relationship among Tax Attitudes, Behaviour and Compliance
Costs …………………………………………………………………..
7.6 Determinants of Compliance Behaviour ……………………………...
7.6.1 Comparison with Web Surveys ……………………………….
7.6.2 Comparison with Tax Professionals’ Survey …………………
7.6.3 Comparison with Prior Malaysian Studies ……………………
7.6.4 Comparison with International Studies ……………………….
7.7 Chapter Summary …………………………………………………….
212
212
212
213
214
214
216
216
218
218
221
224
CHAPTER 8: CONCLUSIONS AND POLICY
RECOMMENDATIONS ………………………………….
226
8.1 Introduction …………………………………………………………...
8.2 The Summary of Key Findings ……………………………………….
8.2.1 Compliance Costs Estimates ………………………………….
8.2.2 The Relationship between Compliance Costs and Compliance
Behaviour ……………………………………………………..
8.2.3 Determinants of Tax Compliance Behaviour …………………
8.2.4 Other Key Findings …………………………………………...
8.3 Major Policy Recommendations………………………………………
8.3.1 Institutional and Policy Recognition of Tax Compliance Costs
8.3.2 Tax Simplification and Compliance Costs Minimisation …….
8.3.3 Publicising Tax Audit Information …………………………...
8.3.4 Overall Tax Administration in Malaysia …………………….
8.4 Limitations of the Study ………………………………………………
8.5 Recommendations for Future Research ………………………………
8.6 Concluding Remarks ………………………………………………….
226
226
226
228
230
231
232
232
236
240
241
242
244
246

xvi
REFERENCES …………………………………………………………….. 247
APPENDICES ……………………………………………………………...
Appendix A:
Definitions for Small and Medium Enterprises in Malaysia 270
Appendix B:
Summary of Tax Compliance Studies in Malaysia, 1994–2008 …………………………………………………
284
Appendix C:
Other Tax Studies (Not compliance-related) in Malaysia … 288
Appendix D:
Summary of Major Compliance Costs Studies on Corporate Income Taxation ………………………………..
289
Appendix E:
Summary of Costs of Compliance Studies in Malaysia …... 293
Appendix F:
Primary Postal Survey Questionnaire (English Version) …. 294
Appendix G:
Primary Postal Survey Questionnaire (Malay Version) …... 298
Appendix H:
Covering Letter to Postal Survey …………………………. 302
Appendix I:
Postcard First Reminder …………………………………. 303
Appendix J:
Second Reminder to Postal Survey ……………………….. 304
Appendix K:
Single Question Postcard Survey ………………………... 305
Appendix L:
Questionnaire for Web Survey (printable version) ……….. 306
Appendix M:
E-mail Correspondence for the Web Survey ……………… 314
Appendix N:
Respondents’ Profile and Details of Key Findings in the Web Survey ………………………………………………..
316
Appendix O:
Questionnaire for Tax Professionals ……………………… 326
Appendix P:
Data Validation …………………………………………… 330
Appendix Q:
Rotated Component Matrix for Factor Analysis ………….. 332
Appendix R:
Regression Analysis: Assessment of Assumptions ……….. 333
Appendix S:
Detailed Results of Multiple Regressions ………………… 336
Appendix T:
Details of Key Findings of the Survey of Tax Professionals 338
Appendix U:
Summary of Suggestions Made by Respondents …………. 340
xvii
LIST OF TABLES
Page Table 1.1
: Malaysian Federal Tax Revenue, 2002–2008 ……………... 3
Table 1.2
: Malaysian Corporate Tax Revenue, 2002–2008 …………... 4
Table 1.3
: Additional Taxes and Penalties Recovered from Investigation and Audit activities, 1996–2006 ……………..
6
Table 1.4
: Malaysian Small and Medium Enterprises by Size, 2005 ….. 8
Table 1.5
: National SMEs: Definition by Sectors and Criteria ………... 15
Table 2.1
: Summary of Corporate Tax Compliance Studies in the US ... 23
Table 2.2
: Malaysian Tax Compliance Studies on Business Income Taxpayers ………………………............................................
29
Table 2.3
: Summary of Corporate Tax Compliance Costs Studies Worldwide ..............................................................................
40
Table 2.4
: Earlier Income Tax Compliance Studies in Malaysia ............ 43
Table 2.5
: Compliance Costs in Malaysia prior to Self-Assessment System ………………………………………………………
44
Table 2.6
: Average Costs of Complying with Corporate Income Tax: Listed Firms …………………………………………………
45
Table 3.1
: Types of Federal Taxes in Malaysia ………………………... 48
Table 3.2
: Public Rulings on Records and Documentations …………... 50
Table 3.3
: Public Rulings on Basis Period …………………………….. 54
Table 3.4
: Major Differences between Corporate Business and Individual Taxation ………………………………………….
57
Table 4.1
: Self-reporting Measurement in Prior Tax Compliance Studies ………………………………………………………
79
Table 4.2
: Specific Types of Non-compliance in Prior Tax Compliance Studies ………………………………………………………
82

xviii
Table 4.3
: Non-compliance Context in Prior Tax Compliance Studies .. 83
Table 4.4
: Main References in Developing Questions for Attitudinal Aspects ………………………………………………………
85
Table 4.5
: Mail-out Personalisation ……………………………………. 91
Table 4.6
: Mailing Pattern of the Study ………………..…….………… 92
Table 4.7
: Gross and Net Population of the Study ……..……………… 93
Table 4.8
: Population and Sample Size by Stratified Proportionate Sampling …………………………………………………….
95
Table 4.9
: Comparative Perceived Level of Compliance Costs ……….. 96
Table 4.10
: Sample Size of Web Survey ………………………...……… 101
Table 4.11
: E-mailing Pattern of the Web Survey ……………...……….. 102
Table 4.12
: Personalisation in the Web Survey …………………………. 102
Table 5.1
: Sample Frame and Response Rate for Postal Survey ………. 106
Table 5.2
: Out of Frame Responses ……………………………………. 106
Table 5.3
: Respondents’ Position ……………………………………… 107
Table 5.4
: Position of ‘Other’ Respondents ……………………………. 107
Table 5.5
: SMEs by Financial Year-end ……………………………….. 109
Table 5.6
: SMEs by Main Business Sector …………………………….. 110
Table 5.7
: SMEs by Length of Business ……………………………….. 111
Table 5.8
: SMEs by Number of Staff Employed ………………………. 112
Table 5.9
: SMEs by Turnover Level …………………………………... 113
Table 5.10
: Size of Business by the NSDC Definition ………………….. 113
Table 5.11
: SMEs by Paid-up Capital ………………………………...… 114
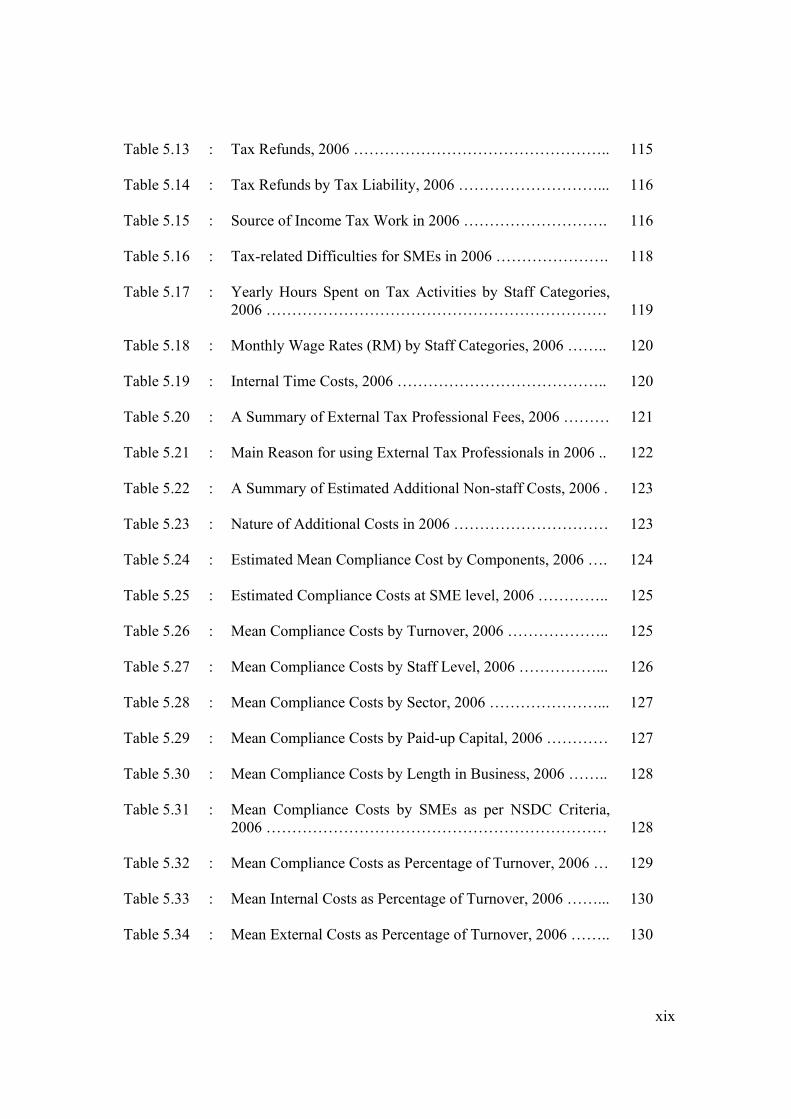
Table 5.12 : Estimated Tax Liability, 2006 ……………………………… 115
xix
Table 5.13
: Tax Refunds, 2006 ………………………………………….. 115
Table 5.14
: Tax Refunds by Tax Liability, 2006 ………………………... 116
Table 5.15
: Source of Income Tax Work in 2006 ………………………. 116
Table 5.16
: Tax-related Difficulties for SMEs in 2006 …………………. 118
Table 5.17
: Yearly Hours Spent on Tax Activities by Staff Categories, 2006 …………………………………………………………
119
Table 5.18
: Monthly Wage Rates (RM) by Staff Categories, 2006 …….. 120
Table 5.19
: Internal Time Costs, 2006 ………………………………….. 120
Table 5.20
: A Summary of External Tax Professional Fees, 2006 ……… 121
Table 5.21
: Main Reason for using External Tax Professionals in 2006 .. 122
Table 5.22
: A Summary of Estimated Additional Non-staff Costs, 2006 . 123
Table 5.23
: Nature of Additional Costs in 2006 ………………………… 123
Table 5.24
: Estimated Mean Compliance Cost by Components, 2006 …. 124
Table 5.25
: Estimated Compliance Costs at SME level, 2006 ………….. 125
Table 5.26
: Mean Compliance Costs by Turnover, 2006 ……………….. 125
Table 5.27
: Mean Compliance Costs by Staff Level, 2006 ……………... 126
Table 5.28
: Mean Compliance Costs by Sector, 2006 …………………... 127
Table 5.29
: Mean Compliance Costs by Paid-up Capital, 2006 ………… 127
Table 5.30
: Mean Compliance Costs by Length in Business, 2006 …….. 128
Table 5.31
: Mean Compliance Costs by SMEs as per NSDC Criteria, 2006 …………………………………………………………
128
Table 5.32
: Mean Compliance Costs as Percentage of Turnover, 2006 … 129
Table 5.33
: Mean Internal Costs as Percentage of Turnover, 2006 ……... 130
Table 5.34
: Mean External Costs as Percentage of Turnover, 2006 …….. 130
xx
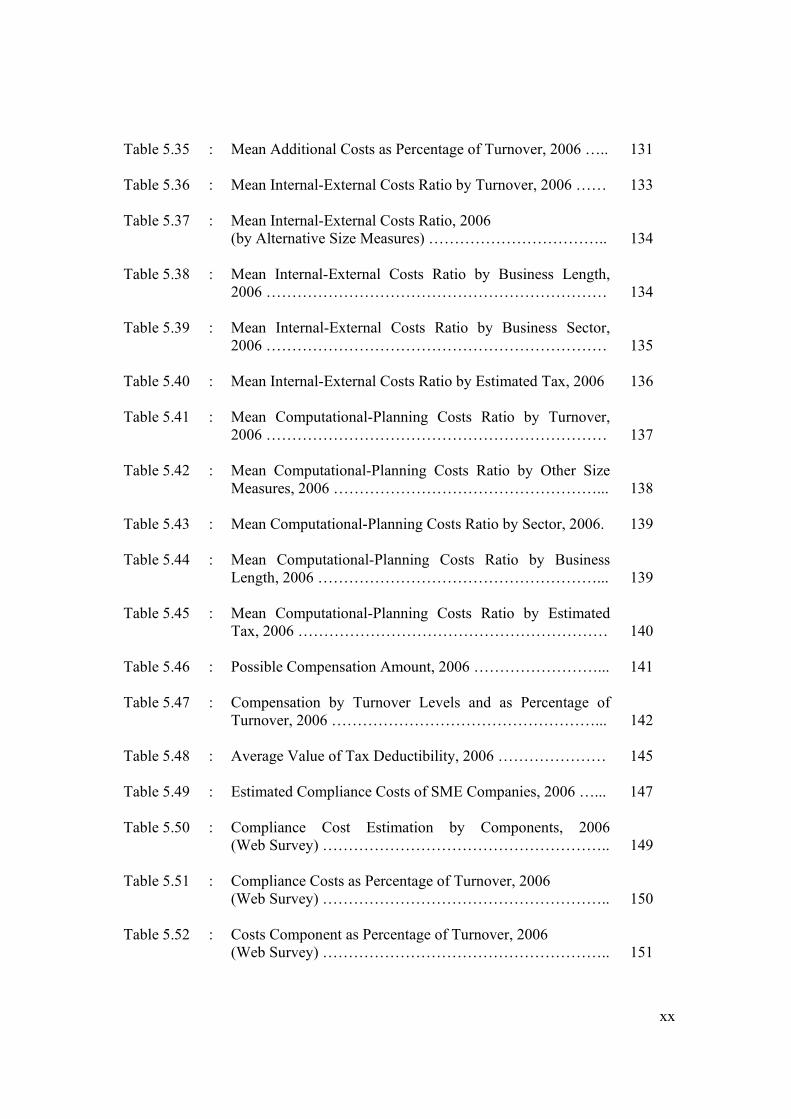
Table 5.35
: Mean Additional Costs as Percentage of Turnover, 2006 ….. 131
Table 5.36
: Mean Internal-External Costs Ratio by Turnover, 2006 …… 133
Table 5.37
: Mean Internal-External Costs Ratio, 2006 (by Alternative Size Measures) ……………………………..
134
Table 5.38
: Mean Internal-External Costs Ratio by Business Length, 2006 …………………………………………………………
134
Table 5.39
: Mean Internal-External Costs Ratio by Business Sector, 2006 …………………………………………………………
135
Table 5.40
: Mean Internal-External Costs Ratio by Estimated Tax, 2006 136
Table 5.41
: Mean Computational-Planning Costs Ratio by Turnover, 2006 …………………………………………………………
137
Table 5.42
: Mean Computational-Planning Costs Ratio by Other Size Measures, 2006 ……………………………………………...
138
Table 5.43
: Mean Computational-Planning Costs Ratio by Sector, 2006. 139
Table 5.44
: Mean Computational-Planning Costs Ratio by Business Length, 2006 ………………………………………………...
139
Table 5.45
: Mean Computational-Planning Costs Ratio by Estimated Tax, 2006 ……………………………………………………
140
Table 5.46
: Possible Compensation Amount, 2006 ……………………... 141
Table 5.47
: Compensation by Turnover Levels and as Percentage of Turnover, 2006 ……………………………………………...
142
Table 5.48
: Average Value of Tax Deductibility, 2006 ………………… 145
Table 5.49
: Estimated Compliance Costs of SME Companies, 2006 …... 147
Table 5.50
: Compliance Cost Estimation by Components, 2006 (Web Survey) ………………………………………………..
149
Table 5.51
: Compliance Costs as Percentage of Turnover, 2006 (Web Survey) ………………………………………………..
150
Table 5.52
: Costs Component as Percentage of Turnover, 2006 (Web Survey) ………………………………………………..
151

xxi
Table 5.53
: Compensation by Turnover Levels and as Percentage of Turnover, 2006 (Web Survey) ………………………………
152
Table 5.54
: Average Value of Tax Deductibility, 2006 (Web Survey) …. 152
Table 5.55
: Compliance Costs Estimates, 2006 (Web Survey) …………. 153
Table 6.1
: Reliability Coefficient of Tax Attitudinal Aspects …………. 156
Table 6.2
: Tax Attitudinal Statements …………………………………. 157
Table 6.3
: Attitudes towards Corporate Income Tax Complexity ……... 158
Table 6.4
: Attitudes towards Corporate Tax Fairness …………………. 160
Table 6.5
: Attitudes towards Corporate Tax Rate Structure …………… 161
Table 6.6
: Other Tax Attitudinal Aspects ……………………………… 162
Table 6.7
: Respondents’ Views towards Non-compliance Behaviour … 164
Table 6.8
: Respondents’ Views towards Partial Non-compliance Behaviour ……………………………………………………
165
Table 6.9
: Tax Attitudinal Aspects and Tax Behaviour: Correlation Analysis ……………………………………………………..
166
Table 6.10
: Tax Attitudes and Compliance Costs: Correlation Analysis .. 168
Table 6.11
: Perceived IRB Relationship and Compliance Costs ………... 169
Table 6.12
: Tax Behaviour and Compliance Costs: Correlation Analysis 170
Table 6.13
: Understatement of Income and Mean Compliance Costs ….. 170
Table 6.14
: Overstatement of Deductions and Mean Compliance Costs .. 171
Table 6.15
: Partial Non-compliance Behaviour and Mean Compliance Costs ………………………………………………...………
172
Table 6.16
: Compliance Behaviour and Mean Compliance Costs: Firm Level ………………………………………………………...
173
Table 6.17
: A Summary of Results of Multiple Regressions …………… 177
Table 6.18 : Tax Attitudes in the Web Survey …....................................... 179
xxii
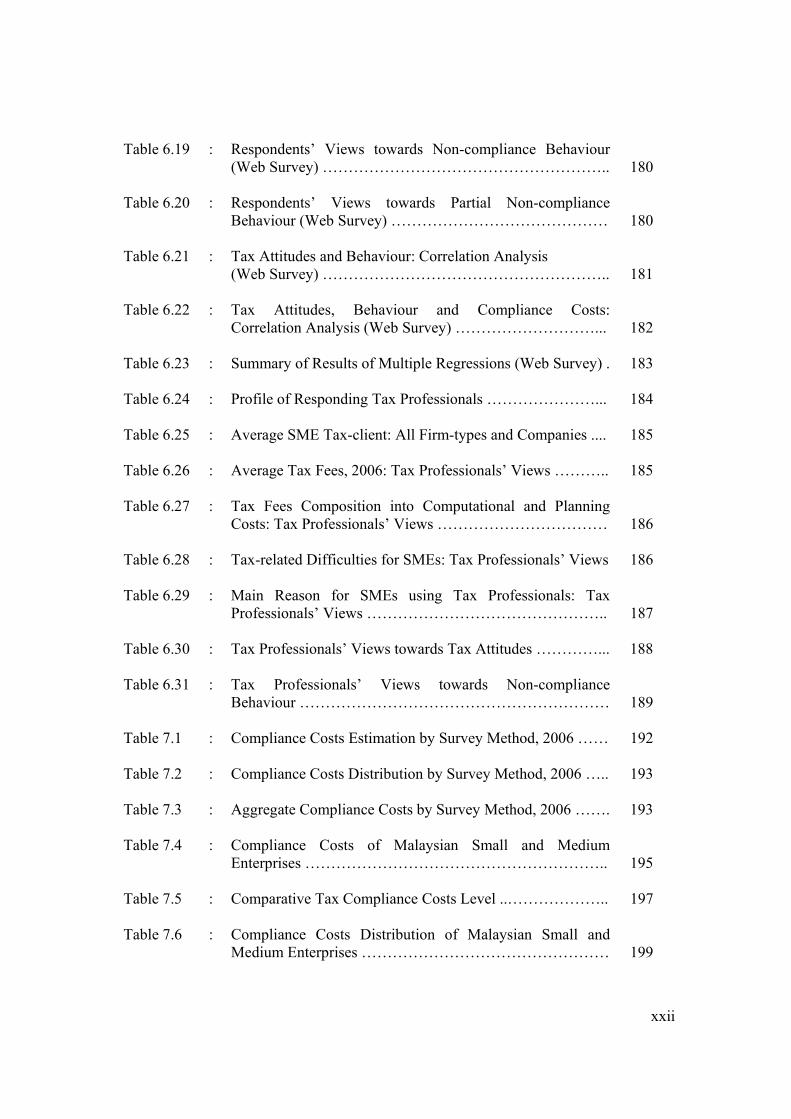
Table 6.19
: Respondents’ Views towards Non-compliance Behaviour (Web Survey) ………………………………………………..
180
Table 6.20
: Respondents’ Views towards Partial Non-compliance Behaviour (Web Survey) ……………………………………
180
Table 6.21
: Tax Attitudes and Behaviour: Correlation Analysis (Web Survey) ………………………………………………..
181
Table 6.22
: Tax Attitudes, Behaviour and Compliance Costs: Correlation Analysis (Web Survey) ………………………...
182
Table 6.23
: Summary of Results of Multiple Regressions (Web Survey) . 183
Table 6.24
: Profile of Responding Tax Professionals …………………... 184
Table 6.25
: Average SME Tax-client: All Firm-types and Companies .... 185
Table 6.26
: Average Tax Fees, 2006: Tax Professionals’ Views ……….. 185
Table 6.27
: Tax Fees Composition into Computational and Planning Costs: Tax Professionals’ Views ……………………………
186
Table 6.28
: Tax-related Difficulties for SMEs: Tax Professionals’ Views 186
Table 6.29
: Main Reason for SMEs using Tax Professionals: Tax Professionals’ Views ………………………………………..
187
Table 6.30
: Tax Professionals’ Views towards Tax Attitudes …………... 188
Table 6.31
: Tax Professionals’ Views towards Non-compliance Behaviour ……………………………………………………
189
Table 7.1
: Compliance Costs Estimation by Survey Method, 2006 …… 192
Table 7.2
: Compliance Costs Distribution by Survey Method, 2006 ….. 193
Table 7.3
: Aggregate Compliance Costs by Survey Method, 2006 ……. 193
Table 7.4
: Compliance Costs of Malaysian Small and Medium Enterprises …………………………………………………..
195
Table 7.5
: Comparative Tax Compliance Costs Level ..……………….. 197
Table 7.6 : Compliance Costs Distribution of Malaysian Small and Medium Enterprises …………………………………………
199
xxiii
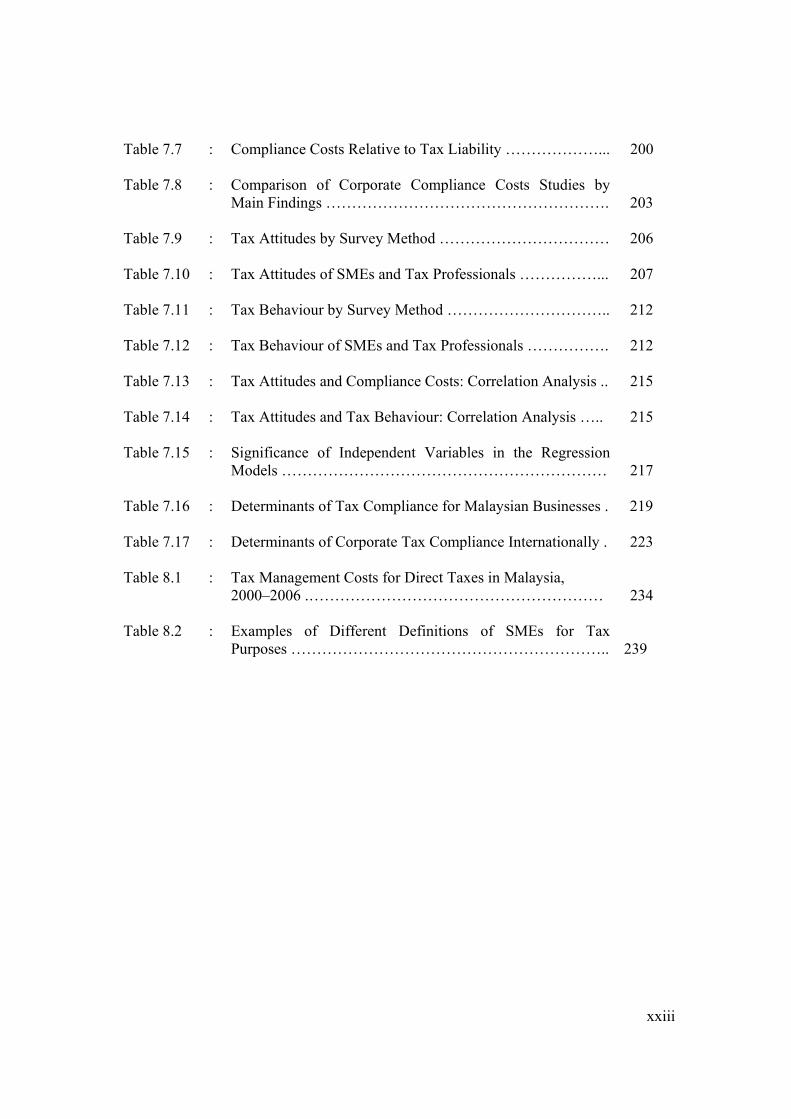
Table 7.7
: Compliance Costs Relative to Tax Liability ………………... 200
Table 7.8
: Comparison of Corporate Compliance Costs Studies by Main Findings ……………………………………………….
203
Table 7.9
: Tax Attitudes by Survey Method …………………………… 206
Table 7.10
: Tax Attitudes of SMEs and Tax Professionals ……………... 207
Table 7.11
: Tax Behaviour by Survey Method ………………………….. 212
Table 7.12
: Tax Behaviour of SMEs and Tax Professionals ……………. 212
Table 7.13
: Tax Attitudes and Compliance Costs: Correlation Analysis .. 215
Table 7.14
: Tax Attitudes and Tax Behaviour: Correlation Analysis ….. 215
Table 7.15
: Significance of Independent Variables in the Regression Models ………………………………………………………
217
Table 7.16
: Determinants of Tax Compliance for Malaysian Businesses . 219
Table 7.17
: Determinants of Corporate Tax Compliance Internationally . 223
Table 8.1
: Tax Management Costs for Direct Taxes in Malaysia, 2000–2006 .…………………………………………………
234
Table 8.2
: Examples of Different Definitions of SMEs for Tax Purposes ……………………………………………………..
239

xxiv
LIST OF FIGURES
Page
Figure 2.1 : Financial Self-interest Model ……………………………... 21
Figure 2.2 : Expanded Model of Taxpayer Compliance ……………….. 21
xxv
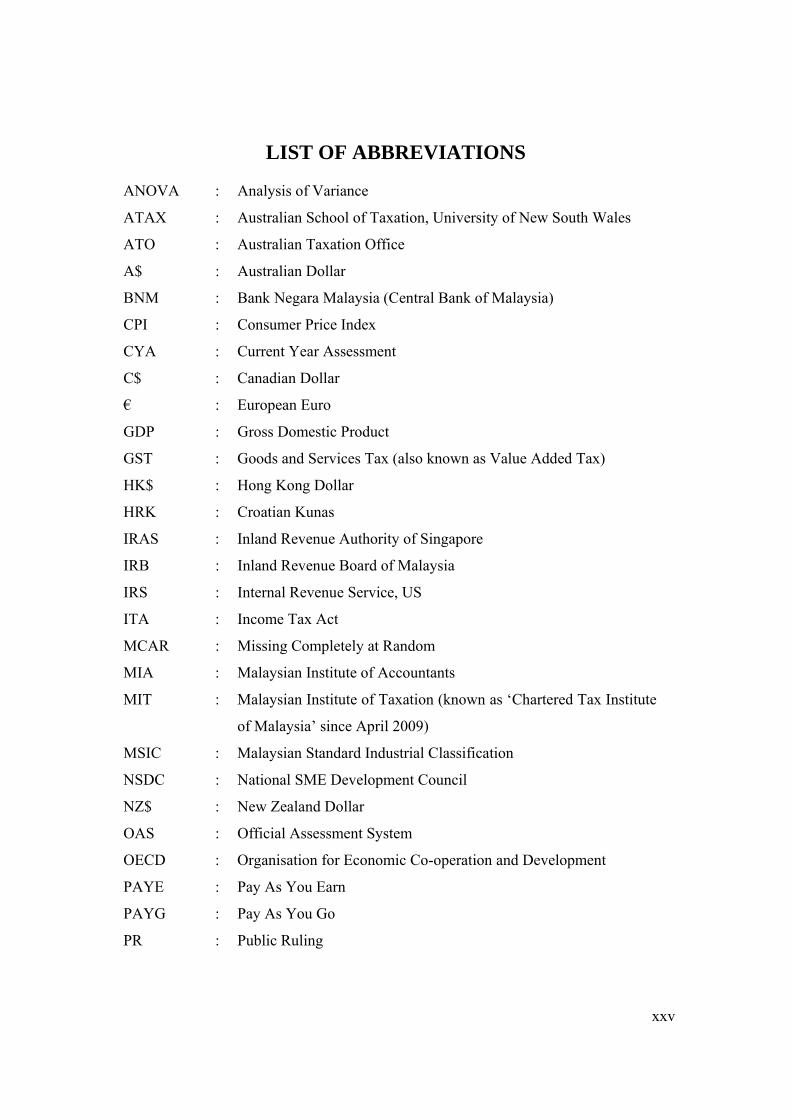
LIST OF ABBREVIATIONS ANOVA : Analysis of Variance
ATAX : Australian School of Taxation, University of New South Wales
ATO : Australian Taxation Office
A$ : Australian Dollar
BNM : Bank Negara Malaysia (Central Bank of Malaysia)
CPI : Consumer Price Index
CYA : Current Year Assessment
C$ : Canadian Dollar
€ : European Euro
GDP : Gross Domestic Product
GST : Goods and Services Tax (also known as Value Added Tax)
HK$ : Hong Kong Dollar
HRK : Croatian Kunas
IRAS : Inland Revenue Authority of Singapore
IRB : Inland Revenue Board of Malaysia
IRS : Internal Revenue Service, US
ITA : Income Tax Act
MCAR : Missing Completely at Random
MIA : Malaysian Institute of Accountants
MIT : Malaysian Institute of Taxation (known as ‘Chartered Tax Institute
of Malaysia’ since April 2009)
MSIC : Malaysian Standard Industrial Classification
NSDC : National SME Development Council
NZ$ : New Zealand Dollar
OAS : Official Assessment System
OECD : Organisation for Economic Co-operation and Development
PAYE : Pay As You Earn
PAYG : Pay As You Go
PR : Public Ruling

xxvi
PIA : Promotion of Investments Act
PYA : Preceding Year Assessment
RM : Malaysian Ringgit
RMC : Royal Malaysian Customs Department
R$ : Brazilian Real
SAS : Self-Assessment System
SIT : Slovenian Tolar
SBDTF : Small Business Deregulation Task Force, Australia
(also known as the Bell Committee)
SME : Small and Medium Enterprise
SMEs : Small and Medium Enterprises
SME Bank : SME Bank of Malaysia
SME Corp : Small and Medium Enterprises Corporation Malaysia
(formerly SMIDEC), see SMIDEC
SMIDEC : Small and Medium Industries Development Corporation, Malaysia
(now known as SME Corp), see SME Corp
SPSS : Statistical Package for the Social Sciences
STD : Schedular Monthly Tax Deduction
STFB : The Special Taskforce to Facilitate Business, Malaysia
(also known as PEMUDAH)
S$ : Singaporean Dollar
TCMP : Taxpayer Compliance Measurement Program
TDM : Total Design Method
TIS : Tax Impact Statement (also known as Regulatory Impact
Statement or Compliance Costs Assessment)
TRP : Tax Review Panel, Malaysia
UK : United Kingdom
₤ : Pound Sterling
US : United States of America
US$ : United States Dollar
UUM : University Utara Malaysia
xxvii
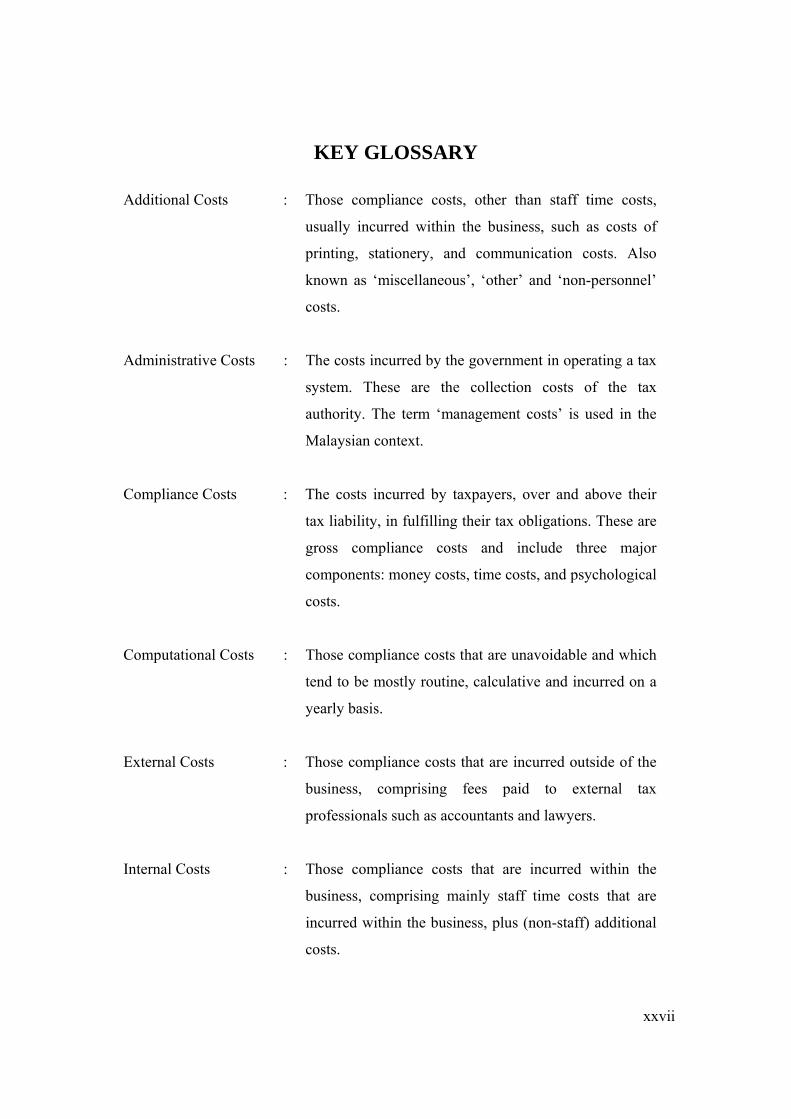
KEY GLOSSARY
Additional Costs : Those compliance costs, other than staff time costs,
usually incurred within the business, such as costs of
printing, stationery, and communication costs. Also
known as ‘miscellaneous’, ‘other’ and ‘non-personnel’
costs.
Administrative Costs : The costs incurred by the government in operating a tax
system. These are the collection costs of the tax
authority. The term ‘management costs’ is used in the
Malaysian context.
Compliance Costs : The costs incurred by taxpayers, over and above their
tax liability, in fulfilling their tax obligations. These are
gross compliance costs and include three major
components: money costs, time costs, and psychological
costs.
Computational Costs : Those compliance costs that are unavoidable and which
tend to be mostly routine, calculative and incurred on a
yearly basis.
External Costs : Those compliance costs that are incurred outside of the
business, comprising fees paid to external tax
professionals such as accountants and lawyers.
Internal Costs : Those compliance costs that are incurred within the
business, comprising mainly staff time costs that are
incurred within the business, plus (non-staff) additional
costs.
xxviii
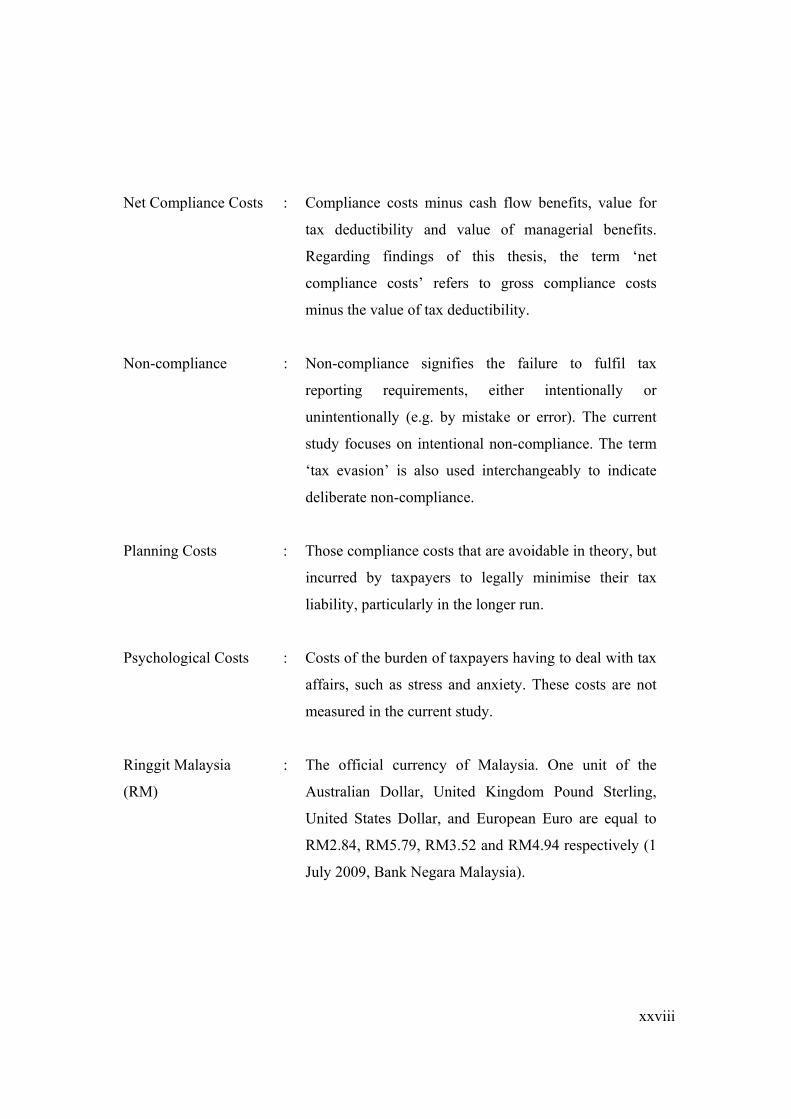
Net Compliance Costs : Compliance costs minus cash flow benefits, value for
tax deductibility and value of managerial benefits.
Regarding findings of this thesis, the term ‘net
compliance costs’ refers to gross compliance costs
minus the value of tax deductibility.
Non-compliance : Non-compliance signifies the failure to fulfil tax
reporting requirements, either intentionally or
unintentionally (e.g. by mistake or error). The current
study focuses on intentional non-compliance. The term
‘tax evasion’ is also used interchangeably to indicate
deliberate non-compliance.
Planning Costs : Those compliance costs that are avoidable in theory, but
incurred by taxpayers to legally minimise their tax
liability, particularly in the longer run.
Psychological Costs : Costs of the burden of taxpayers having to deal with tax
affairs, such as stress and anxiety. These costs are not
measured in the current study.
Ringgit Malaysia
(RM)
: The official currency of Malaysia. One unit of the
Australian Dollar, United Kingdom Pound Sterling,
United States Dollar, and European Euro are equal to
RM2.84, RM5.79, RM3.52 and RM4.94 respectively (1
July 2009, Bank Negara Malaysia).
xxix
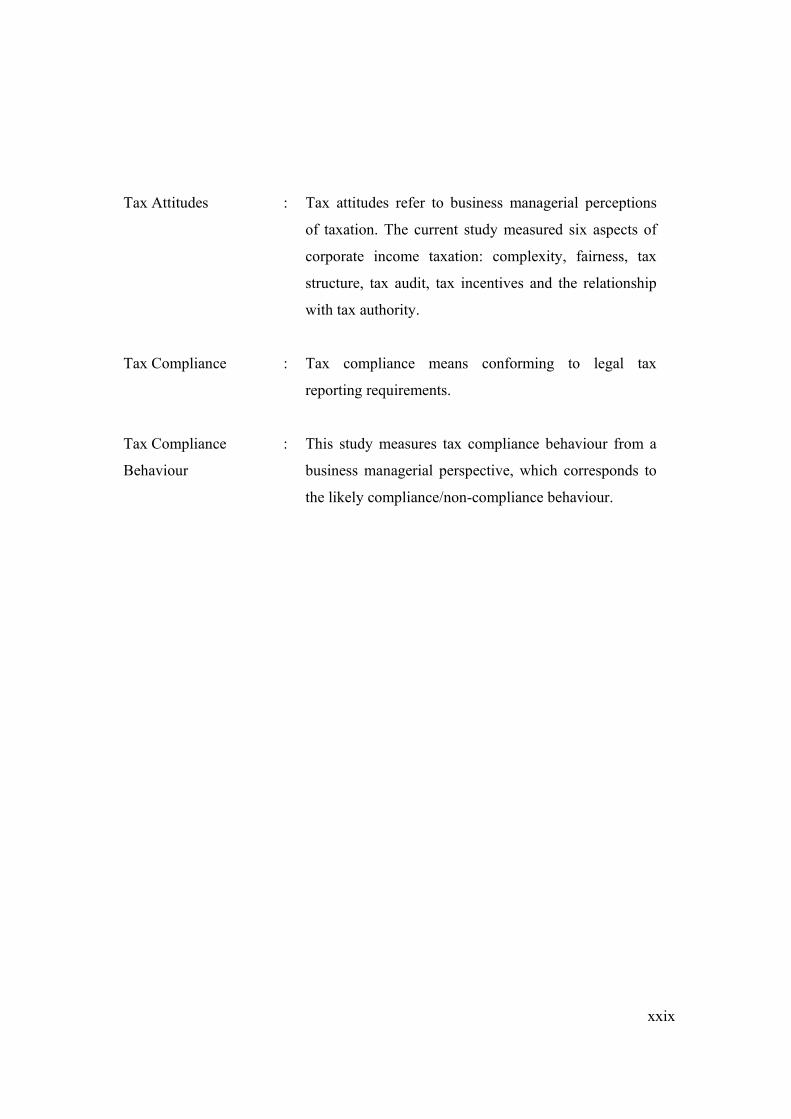
Tax Attitudes : Tax attitudes refer to business managerial perceptions
of taxation. The current study measured six aspects of
corporate income taxation: complexity, fairness, tax
structure, tax audit, tax incentives and the relationship
with tax authority.
Tax Compliance : Tax compliance means conforming to legal tax
reporting requirements.
Tax Compliance
Behaviour
: This study measures tax compliance behaviour from a
business managerial perspective, which corresponds to
the likely compliance/non-compliance behaviour.

1
CHAPTER ONE
INTRODUCTION
1.1 BACKGROUND
Malaysia is one of the fastest growing developing countries in Asia, located specifically
in the South East Asian region, with a land area of just over 330,000 square kilometers
and a population of about 27 million (Department of Statistics Malaysia 2008). It
incorporates two main regions, with 11 states in Peninsular Malaysia, and two in
Northern Borneo. There are also three federal territories. Malaysia is a multi-racial
country with mainly Malay (53 percent), Chinese (26 percent) and Indian (8 percent)
ethnic groups. It is also a multi-religious country—predominantly Muslim (61 percent),
but with strong numbers of Buddhists, Christians, and Hindus (Department of Statistics
Malaysia 2005). As a former British colony, Malaysia is a member of the
Commonwealth of Nations, practising a system of parliamentary democracy and a
Constitutional Monarchy. His Majesty the Yang di-Pertuan Agong (King of Malaysia)
is the Head of the country and the Prime Minister is the Head of government, who
exercises the Executive power.
Economically, Malaysia has been transformed from being a largely agricultural
economy to an increasingly industrialised economy that focuses on manufacturing and
the services sectors—see, for example, Tan (1993, p. 62) and Embong (1996, p. 528).
The growth of Malaysia’s Gross Domestic Product (GDP) was recorded at 5.3 percent,
5.9 percent and 6.3 percent respectively for the years 2005, 2006 and 2007,1 with a total
contribution from the services and manufacturing sectors amounting to almost 90
percent, 83 percent and 84 percent for the corresponding years respectively (Treasury of
Malaysia 2006, p. 29; 2007, p. 26; 2008, p. 38). In 2008 and 2009, GDP growth is
expected to be 5.7 percent and 5.4 percent respectively (Treasury of Malaysia 2008, p.
1 As an overall comparison, Malaysia’s GDP growth between 2005 and 2007 is about double that of Australia, the UK and the US, but lower than that of China, India and Singapore (Source of GDP data: International Monetary Fund 2009).

2
38). However, the impact of the 2008/09 global economic crisis is expected to lower
these original forecasts slightly.
Like the rest of the world, taxation plays a vital economic role in Malaysia and remains
a main source of government revenue. Taxation has been typically categorised into two
main types—direct and indirect. The current study focuses on income tax, which is the
main type of direct taxation in Malaysia, under the Self-Assessment System (SAS).
The income tax SAS was introduced in Malaysia to replace the Official Assessment
System (OAS) in stages: first to companies from the year of assessment 2001; and,
subsequently, to individuals and other taxpayers, i.e. club and co-operative societies, in
2004. The SAS involves a substantial shift of responsibility on to the taxpayers in terms
of their compliance obligations and burden, particularly to business taxpayers.
Government regulations, particularly taxation, are a major concern of the business
sector internationally. The tax regulatory burdens appear to fall disproportionately on
Small and Medium Enterprises (SMEs) worldwide (see for example Sandford, Godwin
and Hardwick 1989; Pope 1995; Sandford 1995; Evans et al. 1997). This prevalence
remains true regardless of the tax system or type of taxes. From the perspective of the
Malaysian tax authority, that is, the Inland Revenue Board of Malaysia (IRB), concern
about tax compliance is among the main reasons for introducing the SAS. This thesis
addresses this concern by estimating income tax compliance costs, examining tax
attitudes, and the likely compliant or non-compliant behaviour of corporate SMEs, from
a business managerial perspective, in the SAS regime.
This chapter starts with an overall background for this research, by briefly highlighting
the significance of income tax, the significance of tax non-compliance, and the
importance of SMEs in Malaysia. The research objectives, together with the specific
research questions, and significance of the study are presented next. This is followed by
definitions of the key terms employed throughout this thesis. Finally, the structure of
the thesis is outlined.
3
1.2 INCOME TAX, NON-COMPLIANCE AND SMALL AND MEDIUM
ENTERPRISES IN MALAYSIA
1.2.1 Significance of Income Tax
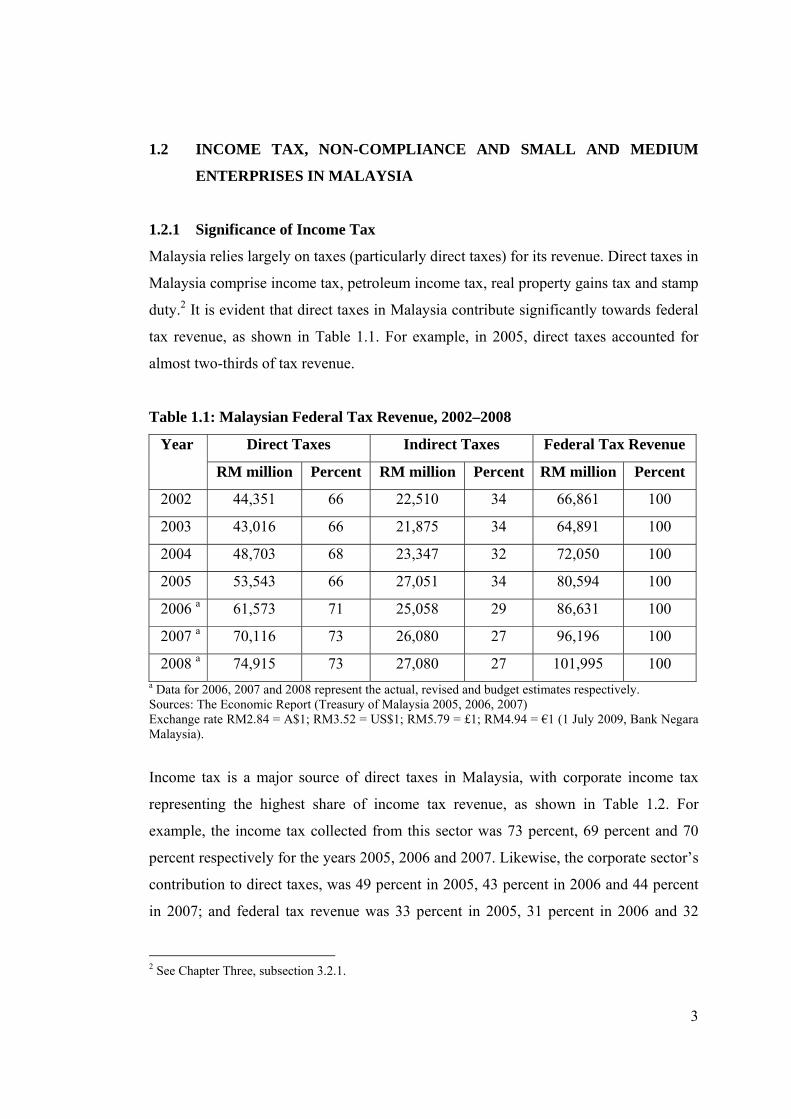
Malaysia relies largely on taxes (particularly direct taxes) for its revenue. Direct taxes in
Malaysia comprise income tax, petroleum income tax, real property gains tax and stamp
duty.2 It is evident that direct taxes in Malaysia contribute significantly towards federal
tax revenue, as shown in Table 1.1. For example, in 2005, direct taxes accounted for
almost two-thirds of tax revenue.
Table 1.1: Malaysian Federal Tax Revenue, 2002–2008
Year Direct Taxes Indirect Taxes Federal Tax Revenue
RM million Percent RM million Percent RM million Percent
2002 44,351 66 22,510 34 66,861 100
2003 43,016 66 21,875 34 64,891 100
2004 48,703 68 23,347 32 72,050 100
2005 53,543 66 27,051 34 80,594 100
2006 a 61,573 71 25,058 29 86,631 100
2007 a 70,116 73 26,080 27 96,196 100
2008 a 74,915 73 27,080 27 101,995 100 a Data for 2006, 2007 and 2008 represent the actual, revised and budget estimates respectively. Sources: The Economic Report (Treasury of Malaysia 2005, 2006, 2007) Exchange rate RM2.84 = A$1; RM3.52 = US$1; RM5.79 = £1; RM4.94 = €1 (1 July 2009, Bank Negara Malaysia).
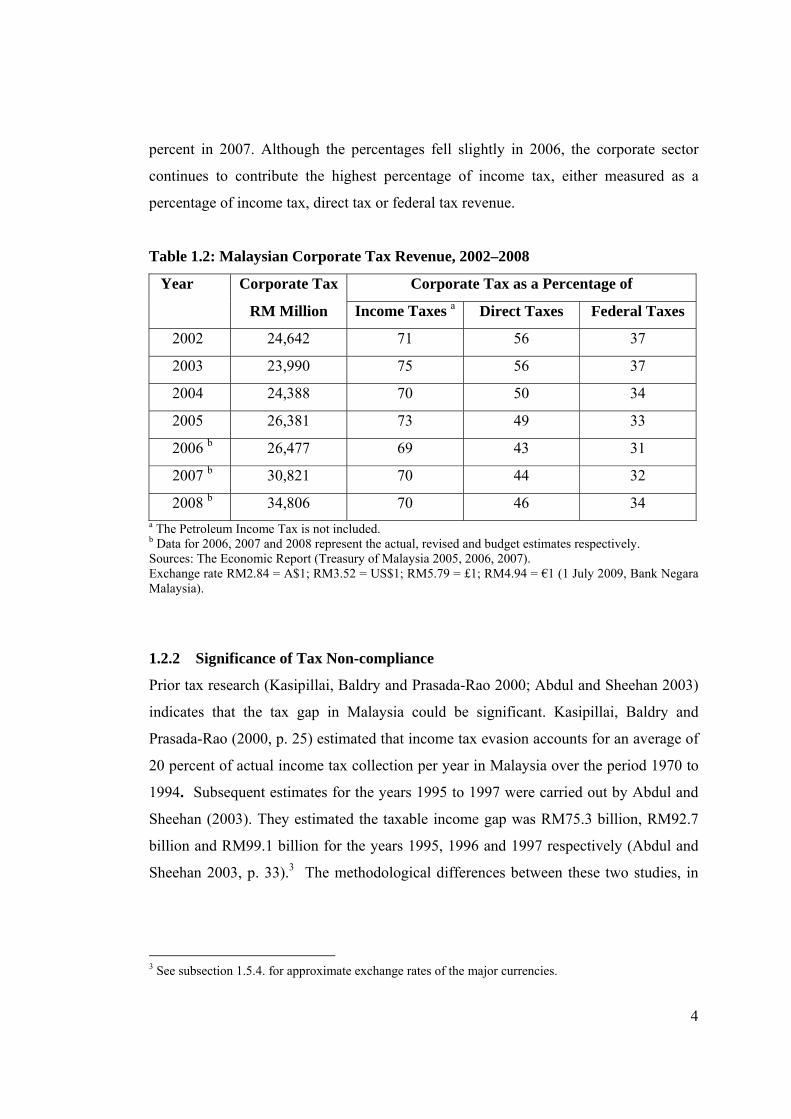
Income tax is a major source of direct taxes in Malaysia, with corporate income tax
representing the highest share of income tax revenue, as shown in Table 1.2. For
example, the income tax collected from this sector was 73 percent, 69 percent and 70
percent respectively for the years 2005, 2006 and 2007. Likewise, the corporate sector’s
contribution to direct taxes, was 49 percent in 2005, 43 percent in 2006 and 44 percent
in 2007; and federal tax revenue was 33 percent in 2005, 31 percent in 2006 and 32
2 See Chapter Three, subsection 3.2.1.
4
percent in 2007. Although the percentages fell slightly in 2006, the corporate sector
continues to contribute the highest percentage of income tax, either measured as a
percentage of income tax, direct tax or federal tax revenue.
Table 1.2: Malaysian Corporate Tax Revenue, 2002–2008
Year Corporate Tax Corporate Tax as a Percentage of
RM Million Income Taxes a Direct Taxes Federal Taxes
2002 24,642 71 56 37
2003 23,990 75 56 37
2004 24,388 70 50 34
2005 26,381 73 49 33
2006 b 26,477 69 43 31
2007 b 30,821 70 44 32
2008 b 34,806 70 46 34 a The Petroleum Income Tax is not included. b Data for 2006, 2007 and 2008 represent the actual, revised and budget estimates respectively. Sources: The Economic Report (Treasury of Malaysia 2005, 2006, 2007). Exchange rate RM2.84 = A$1; RM3.52 = US$1; RM5.79 = £1; RM4.94 = €1 (1 July 2009, Bank Negara Malaysia).
1.2.2 Significance of Tax Non-compliance
Prior tax research (Kasipillai, Baldry and Prasada-Rao 2000; Abdul and Sheehan 2003)
indicates that the tax gap in Malaysia could be significant. Kasipillai, Baldry and
Prasada-Rao (2000, p. 25) estimated that income tax evasion accounts for an average of
20 percent of actual income tax collection per year in Malaysia over the period 1970 to
1994. Subsequent estimates for the years 1995 to 1997 were carried out by Abdul and
Sheehan (2003). They estimated the taxable income gap was RM75.3 billion, RM92.7
billion and RM99.1 billion for the years 1995, 1996 and 1997 respectively (Abdul and
Sheehan 2003, p. 33).3 The methodological differences between these two studies, in
3 See subsection 1.5.4. for approximate exchange rates of the major currencies.

5
particular to the terms used, are worth considering.4 No estimates of tax evasion are
available in Malaysia since 1998. Kasipillai (2003, p. 13) claims that the prevalence of
tax evasion is a major concern for the government. It is important to note that the work
of Kasipillai, Baldry and Prasada-Rao (2000) and Abdul and Sheehan (2003) were
carried out before the implementation of self-assessment. Under the mechanism of self-
assessment, the magnitude of the tax evasion figure is probably higher.
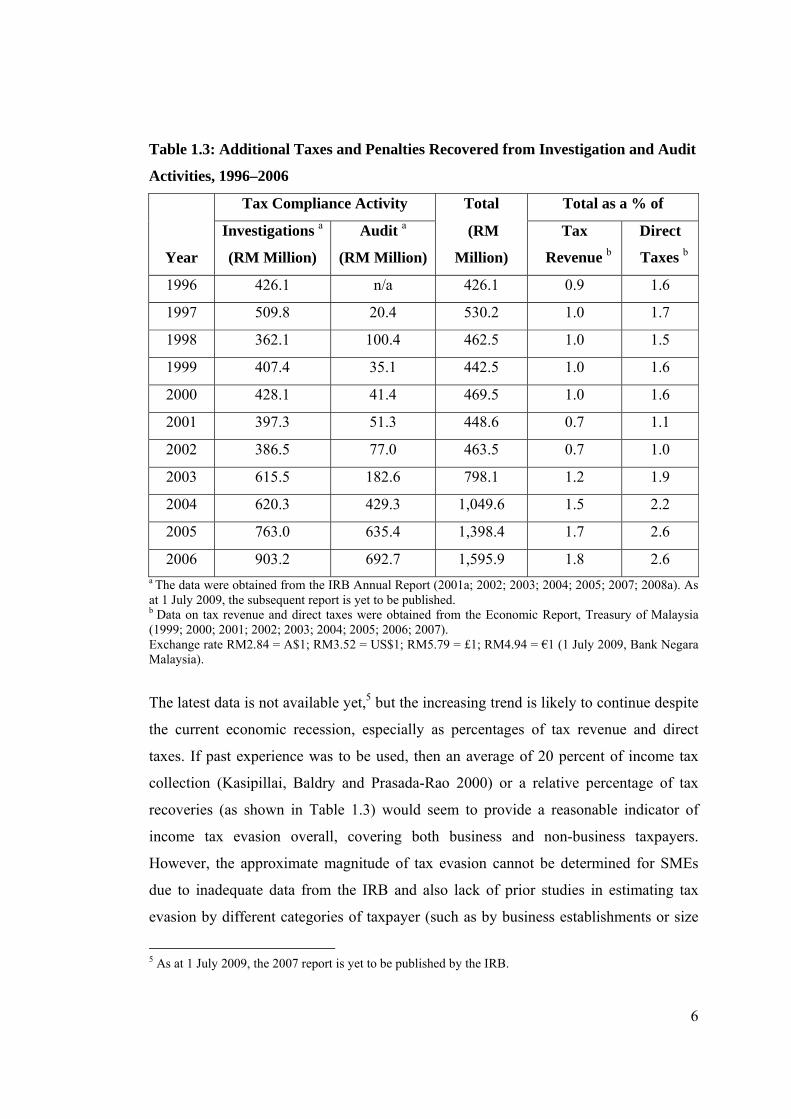
From the perspective of the tax authority, there are no comprehensive estimates of tax
evasion or non-compliance in Malaysia. However, the IRB publishes annual statistics
on the amount of taxes and penalties recovered from IRB investigations and audit
activities. The additional taxes and penalties cover mainly income tax and other direct
taxes—for example, the real property gains tax and stamp duty. Kasipillai (1999, p. 48)
claims that such data provide some evidence as to the magnitude of the problems of
deliberate non-compliance in Malaysia. The amount of taxes and penalties recovered
from investigation and audit activities approached almost RM500 million per year up to
2002, as shown in Table 1.3. In 2003, they had increased significantly to almost RM800
million, to just over RM1 billion in 2004, and to almost RM1.4 billion in 2005. The tax
recovery amount, expressed as a percentage of direct and/or federal taxes, indicates a
stable trend up to 2000, declining slightly in 2001 and 2002, and thereafter growing
increasingly. In 2005, tax recovery amounts were 2.6 percent and 1.7 percent of direct
taxes and federal taxes respectively.
4 Abdul and Sheehan used the term ‘taxable income gap’, which refers to the difference between taxable income (as estimated using national accounts) and taxable income (as assessed by the tax authority). On the other hand, tax gap refers to the difference between total tax collected and what should have been collected. The latter term is often used in the literature (see a review by McManus and Warren 2006).
6
Table 1.3: Additional Taxes and Penalties Recovered from Investigation and Audit
Activities, 1996–2006
Tax Compliance Activity Total Total as a % of
Year
Investigations a
(RM Million)
Audit a
(RM Million)
(RM
Million)
Tax
Revenue b
Direct
Taxes b
1996 426.1 n/a 426.1 0.9 1.6
1997 509.8 20.4 530.2 1.0 1.7
1998 362.1 100.4 462.5 1.0 1.5
1999 407.4 35.1 442.5 1.0 1.6
2000 428.1 41.4 469.5 1.0 1.6
2001 397.3 51.3 448.6 0.7 1.1
2002 386.5 77.0 463.5 0.7 1.0
2003 615.5 182.6 798.1 1.2 1.9
2004 620.3 429.3 1,049.6 1.5 2.2
2005 763.0 635.4 1,398.4 1.7 2.6
2006 903.2 692.7 1,595.9 1.8 2.6 a The data were obtained from the IRB Annual Report (2001a; 2002; 2003; 2004; 2005; 2007; 2008a). As at 1 July 2009, the subsequent report is yet to be published. b Data on tax revenue and direct taxes were obtained from the Economic Report, Treasury of Malaysia (1999; 2000; 2001; 2002; 2003; 2004; 2005; 2006; 2007).
Exchange rate RM2.84 = A$1; RM3.52 = US$1; RM5.79 = £1; RM4.94 = €1 (1 July 2009, Bank Negara Malaysia).
The latest data is not available yet,5 but the increasing trend is likely to continue despite
the current economic recession, especially as percentages of tax revenue and direct
taxes. If past experience was to be used, then an average of 20 percent of income tax
collection (Kasipillai, Baldry and Prasada-Rao 2000) or a relative percentage of tax
recoveries (as shown in Table 1.3) would seem to provide a reasonable indicator of
income tax evasion overall, covering both business and non-business taxpayers.
However, the approximate magnitude of tax evasion cannot be determined for SMEs
due to inadequate data from the IRB and also lack of prior studies in estimating tax
evasion by different categories of taxpayer (such as by business establishments or size
5 As at 1 July 2009, the 2007 report is yet to be published by the IRB.
7
of business). The above figures signify the overall importance of income tax evasion in
Malaysia. The tax literature recognises that measuring the true extent of non-
compliance is not possible, but estimates from the tax gap approach are generally used
to indicate the possible sources and the level of non-compliance (see for example
Graetz and Wilde 1985; Roth, Scholz and Witte 1989, p. 23; McManus and Warren
2006).
On the other hand, McKerchar (2002b, p. 8) argues that a better understanding of non-
compliance is of greater priority rather than measuring the tax gap. She believes that
this will contribute to a better tax system that eventually will reduce the tax gap. The
current study does not attempt to estimate income tax evasion, but recognises its
importance in Malaysia. Thus, this thesis examines the issue of income tax non-
compliance in the context of Malaysian SMEs under the SAS regime.
1.2.3 The Importance of Small and Medium Enterprises
This section highlights the importance of the SME sector in Malaysia. Taxation of
SMEs and major tax-related issues are presented in Chapter Three. Small and medium
enterprises have played an important role in the economic growth of the nation,
particularly in developing countries, such as Malaysia. In 2005, there were almost
520,000 SMEs, comprising around 99 per cent of all enterprises in Malaysia,
contributing almost 48 per cent of the total value added of the business establishments
and around 65 per cent of total employment (National SME Development Council
2006, pp. 19-23). Sole proprietorships account for the highest percentage of SME
business establishments (69 percent), followed by private limited companies (21
percent) and partnerships (10 percent). In terms of size, micro businesses account for
nearly 80 percent of SMEs, as shown in Table 1.4.

8
Table 1.4: Malaysian Small and Medium Enterprises by Size, 2005
Business size Number Percentage
Micro 411,849 79.4
Small 95,490 18.4
Medium 11,657 2.2
Total SMEs 518,996 100
Source: National SME Development Council (2006, p. 21).
As Malaysia aims to be a fully industrialised nation by the year 2020, SMEs will play a
vital ongoing supportive role in this. Small and Medium Enterprises are also expected to
complement the activities of the large enterprises through integration into the
mainstream of the industrial development process (BT Online 1996). For these reasons,
the SME sector has been continuously supported by the government (Osman and
Hashim 2003). The importance of SMEs has been further recognised by the
establishment of the National SME Development Council (NSDC); more importantly,
the Council is chaired by the Prime Minister. The National SME Development Council
was established in June 2004 as the highest policy-making body to chart the direction
and strategies for comprehensive and coordinated development of SMEs across all
sectors of the economy. At the time of its establishment, Bank Negara Malaysia (BNM)
acted as the Secretariat to the NSDC. In July 2008, the Secretariat function was
conveyed to the Small and Medium Industries Development Corporation (SMIDEC).6
In terms of tax revenue, the contribution of SMEs is unknown, since no data is publicly
available. The annual report of the IRB published income tax collection by general
categories of taxpayer (for example, individual, co-operatives and company) and not by
size of the businesses. Further, the establishment of an SME could be in the form of an
incorporated body (company) or unincorporated body (sole-proprietor or partnership).
Considering this, the amount of income tax paid by SMEs would be included in
company and individual taxpayers’ assessments. Nonetheless, in recognising the
6 For further information, refer to the NSDC website at http://www.smeinfo.com.my. Recently, on 3 July 2009, the SMIDEC has been transformed into the SME Central Coordinating Agency, known as the Small and Medium Enterprises Corporation Malaysia (SME Corp).

9
importance of SMEs in Malaysia, it is presumed that SMEs, as taxpayers, could
contribute significantly to income tax revenue (corporate tax and personal tax,
depending on its establishment). Having recognised the significant role of SMEs and
their contribution to national growth, particularly tax revenue, the current study
estimates compliance costs and examines this and other factors (such as SME
characteristics and attitudes) influencing the taxation compliance behaviour of SME
companies in Malaysia.
1.3 RESEARCH OBJECTIVES
This study examines the determinants of non-compliance behaviour of small and
medium-sized companies in Malaysia, with particular emphasis on income tax
compliance costs under the SAS regime. Three research questions have been developed
to meet the above overall research objective. First, what are the costs faced by SMEs in
complying with corporate income tax laws in Malaysia for the tax year 2006? Secondly,
to what extent do compliance costs influence the likely compliance behaviour of SMEs?
Thirdly, what is the extent of the relationship between compliance costs and compliance
behaviour, taken together with other variables i.e. characteristics of SMEs, attitudes of
owner-manager and structure of tax systems?
1.4 SIGNIFICANCE OF THE STUDY
This study extends the scope of taxpayer compliance research to the area of corporate
income taxation. This is the first study into corporate tax compliance in Malaysia and
adds to the very limited international literature on corporate taxation. This study
examines the determinants of non-compliance behaviour of corporations. Almost all
prior tax compliance research focussed on the individual taxpayer, with only five
studies (Rice 1992; Kamdar 1997; Mills 1998; Joulfaian 2000; Hanlon, Mills and
Slemrod 2005) known to this author investigating the determinants of corporate tax

10
compliance behaviour. Additionally, there are also few theoretical papers or notes that
relate to corporate tax evasion (Marrelli 1984; Kreutzer and Lee 1986, 1988; Wang and
Conant 1988; Lee 1998). More importantly, these limited studies were predominantly
carried out in the US. This study is also probably the first study on corporate tax
compliance among developing countries and, more importantly, undertaken outside the
US.
The current Malaysian study specifically focuses on corporate SME businesses. Out of
the five US empirical studies above, only a study by Rice (1992) is confined to SME
corporations. Thus, this study contributes more specifically in the context of SME
taxation. Determinants of non-compliance are examined in this study, with particular
emphasis directed to the influence of compliance costs on SME non-compliance. The
international tax literature noted that there is a lack of research that relates compliance
costs with taxpayer compliance behaviour. In a response to Richardson and Sawyer
(2001, p. 207), and particularly to Hasseldine (2001, p. 11), this study applies
behavioural research methods to investigating the linkages between taxpayer
compliance research and tax compliance costs research.
A study by Chattopadhyay and Das-Gupta (2002b) was perhaps the first to merge both
tax compliance costs and compliance behaviour in a single study. However, their
findings are not conclusive, but rather tentative due to key methodological limitations
(Chattopadhyay and Das-Gupta 2002b, p. iii, 25).7 Another study, by Yesegat (2009),
was also conducted at the same time as the current study. The study has used a better
methodology by employing both quantitative and qualitative methods, but the
relationship between compliance costs and compliance behaviour is analysed merely
from experimental data, including the compliance costs figure.8 The Indian study was
confined to personal taxpayers and the Ethiopian study to value added taxpayers. The
current study integrates both the tax compliance and compliance costs aspects in the
context of corporate taxation, SMEs in particular.
7 See Chapter Two, subsection 2.2.1. 8 See Chapter Two, subsection 2.2.1.

11
Further, the 2006 Malaysian experience of the postponement of the proposed Goods and
Services Tax (GST) indicates a need for the introduction of Tax Impact Statements
(TIS)9 regarding major tax changes and/or new tax legislation, particularly those
affecting SMEs. A lack of recognition of the burden imposed on businesses, regardless
of size, is among the major reasons causing the indefinite postponement of the GST.10
Consideration of the tax compliance burden through TIS is useful for the tax policy
debate. This would be a similar policy to that adopted in the Organisation for Economic
Co-operation and Development (OECD) countries (Evans and Walpole 1999).
This study is also significant in providing evidence on the issue of corporate tax
compliance under the SAS regime. Prior studies show the importance of voluntary tax
compliance in ensuring effective and efficient implementation of the SAS.
Consideration of tax compliance costs, some understanding of the attitudes, and the
likely compliance behaviour of business executives could provide direction to policy
makers, particularly in enhancing voluntary tax compliance. The Malaysian tax
authority, as well as foreign tax regimes which currently operate a SAS or intend to
adopt the system in the future, may significantly benefit from this study.
1.5 ANALYSIS OF KEY TERMS
1.5.1 Tax Compliance or Non-compliance
Tax compliance, simply put, means adherence to tax reporting requirements; that is, that
the taxpayer files all required tax returns at the proper time and that the returns
accurately report tax liability in accordance with the tax laws, regulations, and court
decisions applicable at the time the return is filed (Roth, Scholz and Witte 1989, p. 21).
Non-compliance, on the other hand, signifies failing to meet tax reporting requirements.
Non-compliance represents the most inclusive conceptualisation with respect to the
9 Also known as Regulatory Impact Statement (RIS) and Compliance Costs Assessment (CCA). 10 As June 2009, the GST (also known as Value Added Tax) is yet to be implemented in Malaysia. It is anticipated that the government will initiate again it after the full recovery from the current economy climate.
12
failure to meet tax obligations, whether intentional or unintentional (Kinsey 1984, p. 2).
Other terms used to describe tax non-compliance include tax evasion, cheating, errors
and misreporting (Long and Swingen 1991). The term ‘tax evasion’ is often used
interchangeably with non-compliance in the tax literature despite some differences,
particularly with reference to intention. Tax evasion, in lay terms, means hiding taxable
income from the tax authority (Pyle 1989, p. 111).
In Malaysia, non-compliance may take four main forms: failure to submit a tax return,
understatement of income, overstatement of deductions, and failure to pay assessed
taxes by the due date (Baldry and Kasipillai 1996). The extent of non-compliance by
each of these categories is not known (Kasipillai 2003, p. 13), at least publicly. For
business taxpayers, other forms of non-compliance include failure to perform a number
of duties and responsibilities as required by the law.11 Intentional non-compliance is
among the most serious tax offences in Malaysia. It is subject to a fine of at least
RM1,000 and up to RM20,000 or three years imprisonment, or both, plus a penalty of
three times the amount of tax undercharged (Section 114, Income Tax Act (ITA) 1967).
The current study focuses on two forms of intentional income tax non-compliance, that
is, understatement of income and overstatement of deductions.12 A separate analysis of
the various forms of non-compliance is urged by a number of tax researchers (see
mainly Long and Swingen 1991, p. 664; Richardson and Sawyer 2001, p. 224). The
term ‘non-compliance’ is used throughout this thesis, but the term ‘tax evasion’ can also
be used interchangeably in the context of intentional non-compliance. This study adopts
a taxpayer orientation by measuring the likely compliance/non-compliance behaviour
from SME business managerial or respondent perspectives,13 as such findings on
compliance behaviour throughout this thesis refer to possible compliance/non-
compliance. A similar approach is taken by a number of tax compliance researchers
internationally e.g. Hite (1988); Reckers, Sanders and Roark (1994); Kaplan, Newberry
and Reckers (1997); Chan, Troutman and O’Bryan (2000); Kasipillai, Mat-Udin and
11 See Chapter Three, subsection 3.2.2. 12 See Chapter Four, subsection 4.4.3 and Section 4.5. 13 See Chapter Four, subsection 4.4.3.
13
Zainol-Ariffin (2003). A few other authors also prefer to use the term ‘compliant
attitude’ rather than ‘tax compliance’ or ‘tax compliance behaviour’ e.g. Hasseldine
(1999); Tan and Chin-Fatt (2000); Abdul-Manaf, Hasseldine and Hodges (2005).
1.5.2 Tax Compliance Costs
Compliance costs of taxation are costs incurred by taxpayers, in addition to their tax
liability in conforming to the tax requirements. Sandford, Godwin and Hardwick (1989,
pp. 10-12) defined compliance costs as those costs incurred by taxpayers, or third
parties such as businesses, in meeting the requirements laid upon them in complying
with a given tax structure. For a business, the compliance costs include the cost of
collecting, remitting and accounting for tax purposes; the costs of acquiring relevant tax
knowledge and information; payments to external professionals; and also costs related
to incidental and overhead costs (Sandford, Godwin and Hardwick p. 10).
Compliance costs of taxation include three major components, namely money costs,
time costs and psychological costs to the taxpayer (Sandford, Godwin and Hardwick
1989, pp. 11-12). The money costs refer to an amount spent on tax advisers or
professionals (i.e. tax agents, accountants, investment advisers, legal practitioners) and
expenses relating to taxation guides, books, communication and other incidental costs.
On the other hand, time costs are incurred on record keeping tax information,
completing the tax form, or in preparing tax details for the tax professionals, as well as
time spent on dealing with the tax authorities. Meanwhile, psychological costs refer to
taxpayers having to deal with his/her tax affairs, such as the anxiety of handling
complex tax matters.
Compliance costs are also categorised into their sources i.e. internal and external or
types i.e. computational or planning (e.g. Pope, Fayle and Chen 1991). Internal
compliance costs refer to both money costs and time costs that are incurred within the
business. External compliance costs refer mainly to fees paid to external tax
professionals, such as accountants and lawyers. Computational costs are mostly routine,
calculative and incurred on a yearly basis. In contrast, planning costs relate to further
14
efforts taken by taxpayers to legally minimise their tax liability, particularly in the
longer run.
Additionally, Sandford, Godwin and Hardwick (1989, pp. 13-14) recognised cash flow
benefits and managerial benefits as offsets to compliance costs. Consequently, the term
‘net compliance costs’ was in use representing compliance costs after offsetting
benefits. Since managerial benefits cannot be easily measured quantitatively, the
researcher normally deducts the cash value benefits only in arriving at net compliance
costs (Sandford and Hasseldine 1992, p. 7). Benefits arising from tax deductibility have
also been included and estimated as an offsetting benefit of compliance since the mid
1990s (Allers 1994, pp. 38-40; Evans et al. 1997).
This study estimates compliance costs, covering both the money costs and time costs,
incurred by the SME companies in complying with corporate income taxation in 2006.
The estimates are carried out both at the company level (disaggregate) and subsequently
to a presumed population of SME companies in Malaysia (aggregate). Compliance costs
are also analysed in terms of the internal/external and computational/planning
classifications. The current study also estimates the net compliance costs after taking
into account the value of tax deductibility, both at the firm and aggregate levels.
Potential cash flow benefits are recognised in this study, but data availability does not
permit estimation. Thus, the term ‘net compliance costs’ in this thesis refers to gross
compliance costs minus a value for tax deductibility. More details on compliance costs
estimates are presented in Chapters Four and Five.
1.5.3 Small and Medium Enterprises
This study adopts the standard national definition of SMEs established by the NSDC.
This national definition was adopted in Malaysian on 13 September 2005 (National
SME Development Council 2005). However, the definition was initially established by
the NSDC on 1 December 2004 (Bank Negara Malaysia 2004) and was subsequently
endorsed by them on 9 June 2005. It is important to note that this definition has been
used earlier to classify SMEs in the SME Annual Report 2005 (National SME

15
Development Council 2006). Prior to 2005, there was no common definition of SMEs
employed in Malaysia. Various measures have been used, including the number of full-
time employees, annual sales turnover, amount of assets, shareholders’ funds, paid-up
capital, and combinations of these methods. For example, the SMIDEC, a primary
government agency responsible for the development of SMEs in Malaysia, has defined
SMEs as businesses with an annual sales turnover not exceeding RM25 million, and
with full-time employees not exceeding 150.
Since 2005, the standard definitions for Malaysian SMEs are based on two criteria,
either the number of employees or annual sales turnover (National SME Development
Council 2005). Further, the SMEs have been categorised primarily into four sectors:
manufacturing, manufacturing-related services (MRS), primary agriculture, and other
services (including information and communications technology). The overall SME
definitions, based on the number of full-time employees and annual sales turnover by
sector, are shown in Table 1.5. Importantly, specific criteria, both in terms of staff
number or turnover level, differ among the manufacturing/MRS sector and the
services/primary agriculture sector. For example, the upper limit in terms of turnover
level is RM25 million for SMEs in the manufacturing and MRS sectors compared to
RM5 million in the services and primary agriculture sectors.
Table 1.5: National SMEs: Definition by Sectors and Criteria
Criteria a
Sectors Number of
Employees
Annual Turnover
(RM)
Manufacturing
Manufacturing-related services ≤ 150 ≤ 25 million
Primary Agriculture
Services ≤ 50 ≤ 5 million a Businesses are to meet either criteria. Source: National SME Development Council (2005, pp. 3-5). Exchange rate RM2.84 = A$1; RM3.52 = US$1; RM5.79 = £1; RM4.94 = €1 (1 July 2009, Bank Negara Malaysia).
16
The NSDC also further distinguishes between micro, small and medium-sized
enterprises (see Appendix A). For example, in the manufacturing and MRS sectors, an
enterprise with full-time employees of less than five or with annual turnover of less than
RM250,000, is classified as a micro enterprise; with full-time employees of between 5
and 50, or annual turnover of between RM250,000 and less than RM10 million, as a
small enterprise; and with full-time employees of between 51 and 150, or with annual
turnover of between RM10 million and RM25 million, as a medium enterprise.
Unfortunately, the upper limit for the lowest turnover level used to define SMEs into
micro enterprises is different between the manufacturing/MRS sectors (i.e. less than
RM250,000) and the services/primary agriculture sectors (i.e. less than RM200,000).
The current study standardised the turnover amount to RM250,000 so as to facilitate
responses from all sectors into a single questionnaire. For staff criteria, no adjustment
was made as the lowest number of staff among all the four sectors is the same, i.e. less
than five.
1.5.4 Exchange Rate
All Malaysian monetary data, including compliance costs estimates, throughout this
thesis are stated in Ringgit Malaysia (RM). As a general guide, one unit of the
Australian Dollar (A$), United Kingdom Pound Sterling (£), United States Dollar (US$)
and European Euro (€) are equal to RM2.84, RM5.79, RM3.52 and RM4.94
respectively (1 July 2009, Bank Negara Malaysia). Exchange rates for other currencies
are given in a footnote, where applicable.
1.6 PRESENTATION OF THE THESIS
This study is organised into eight chapters, namely introduction, review of tax
compliance and tax compliance costs studies, taxation of SMEs and major issues in
Malaysia, research design and methodology, compliance costs estimates of SMEs, tax

17
attitudes and compliance behaviour of SMEs, comparison of findings and discussion,
and conclusion and policy recommendations.
Chapter One provides the background of the study, research objectives and specific
research questions, significance of the study, analysis of terms employed, and
organisation of the remaining chapters. The background of the study highlights the
likely magnitude of the tax gap, the significance of corporate income tax to federal
government revenue, and the importance of SMEs in Malaysia.
Chapter Two provides a review of the literature on tax compliance and tax compliance
costs, focusing on business taxpayers and corporations, in particular. Chapter Three
presents an overview of income taxation in Malaysia and detailed discussion of income
taxation of SMEs under the SAS regime. More importantly, the major income tax
difficulties and issues surrounding the SME sector are highlighted in this chapter.
Chapter Four discusses the research design and methodology adopted in this study. This
includes survey questionnaire design; survey implementation; population; and the
sample and method of data analysis, covering mainly the primary postal survey and two
additional surveys. This chapter also provides detailed discussion on the measurement
issues and approach adopted in relation to compliance costs and compliance behaviour.
Findings of the study are presented in Chapters Five and Six. Chapter Five presents
compliance costs estimates of SME companies, covering both the gross and net
compliance costs, estimated mainly at the firm level, and at the aggregate corporate
SME level. The analysis of compliance costs by business profiles (including distribution
by turnover level), cost sources and cost types are also presented in this chapter.
Chapter Six reports findings on tax attitudes and compliance of SME companies
measured from a business managerial perspective. The chapter also examines the
association among variables—that is, compliance costs, tax attitudes and tax
behaviour—and, more importantly, considers the determinants of compliance
behaviour. These two chapters (five and six) primarily cover the findings of the main
18
postal survey on SMEs. Findings of the two additional surveys, i.e. SME web survey
and tax professionals’ postal survey, are also presented, but in less detail, mainly to
support the primary postal survey.
Chapter Seven compares key findings of the main survey and two additional surveys.
This comparison broadly shows the consistency of the compliance costs estimates and
findings on tax attitudes and compliance behaviour in the current study. This chapter
also discusses the current findings to earlier relevant studies, both in Malaysia and
internationally.
Finally, Chapter Eight summarises and discusses the major findings, major policy
recommendations, limitations of the study, and possible directions for further research.

19
CHAPTER TWO
REVIEW OF STUDIES OF TAX COMPLIANCE AND TAX
COMPLIANCE COSTS
2.1 INTRODUCTION
This chapter presents a literature review of the two key aspects of this thesis, namely tax
compliance and tax compliance costs. These reviews are important in providing a
theoretical background for this study as the current investigation integrates both
taxpayer compliance and tax compliance costs into a single study. These two aspects are
considered within both international and Malaysian settings, but focusing on business
taxpayers. As there are a prolific number of studies internationally that focus on these
two aspects with individuals, this area is presented broadly, but is followed by a detailed
review of corporate tax studies. In Malaysia, prior tax compliance studies are restricted
to individuals, but nearly all compliance costs studies are limited to corporations. As
such, tax compliance studies cover business individuals in detail, with tax compliance
costs including all studies. A review of major tax issues in SME corporations is
presented in Chapter Three. Relevant literature on research methods is covered later in
Chapter Four.
2.2 A REVIEW OF TAX COMPLIANCE STUDIES
2.2.1 International Tax Compliance Studies
Concern about voluntary tax compliance has led to numerous studies of tax compliance
issues, particularly income tax. Comprehensive reviews of prior major tax compliance
studies are provided by Jackson and Milliron (1986) and Richardson and Sawyer
(2001), the former being well cited in the tax literature. Jackson and Milliron (1986)
provide a review of 43 tax compliance studies carried out between the 1970s and 1985.
Richardson and Sawyer (2001), in a similar way, provide a review and synthesis of
more than 130 tax compliance studies published from 1985 to 1997 and, most
20
importantly, provide discussion on the progress made following suggestions given by
Jackson and Milliron. Both reviews considered the key tax compliance variables,
methods employed, issues and theory involved.
Specifically, their reviews identified a number of behavioural determinants of tax
compliance behaviour. Fischer, Wartick and Mark (1992, p. 3) broadly classify them
into four categories: demographic e.g. age, gender; proxy for non-compliance
opportunity e.g. education, income level, income source and occupation; attitudinal e.g.
ethics, tax fairness, peer influence; and structural e.g. tax complexity, revenue authority
contact, sanctions, detection probability, and tax rates. The possibility of other factors—
such as compliance costs, tax preparers, framing of tax decisions, and tax incentives—
though recognised are examined less. Overall, the findings of many studies on the
determinants of tax compliance behaviour of individual taxpayers are somewhat mixed,
even when different research methods are employed (Jackson and Milliron 1986;
Richardson and Sawyer 2001).
Besides these two comprehensive reviews, several other reviews are available—for
example, Fischer, Wartick and Mark (1992); Cuccia (1994); Andreoni, Erard and
Feinstein (1998) and Hasseldine and Li (1999). Overall these reviews also raise similar
concerns over the variables influencing tax compliance behaviour. The detail of these
tax compliance studies is not considered in this section as the current study focuses on
corporate taxpayers rather than individuals. Nonetheless, relevant findings, mainly to
business taxpayers, are discussed where appropriate. The fact that tax compliance
studies predominantly centre on the income tax compliance of individual taxpayers is
recognised in the literature (Long and Swingen 1991, p. 665; Rice 1992, p. 126;
Kamdar 1997, p. 37), particularly individuals without a business.
Prior research generally adopts economic deterrence and/or fiscal psychology models in
explaining the tax compliance behaviour of individuals (Hasseldine and Li 1999, p. 94).
In terms of a model, the seminal work of Allingham and Sandmo (1972) applies a
financial self-interest model in the context of tax compliance. This model is based on an

21
economics-of-crime approach introduced by Becker (1968). The model suggests that
tax rate, detection probability and penalty structure are determining factors for
compliance costs that affect compliance behaviour, as shown in Figure 2.1. Arguably,
the model only considers the economic variables.
Fischer, Wartick and Mark (1992) expand the model to incorporate the sociological and
psychological variables as well (Figure 2.2). This expanded model predicts that
demographic variables indirectly influence tax compliance behaviour through their
effects on non-compliance opportunities and attitudes.
Attitudes and Perceptions Taxpayer
Compliance Behaviour
Demographic Variables
Structure of Tax System
Non-compliance Opportunity
Source: Fischer, Wartick and Mark (1992, p. 4).
Figure 2.2: Expanded Model of Taxpayer Compliance
Tax Rate
Detection Probability
Penalty Structure
Compliance Costs
Compliance Behaviour
Figure 2.1: Financial Self-interest Model
Source: Fischer, Wartick and Mark (1992, p. 3) derived from Becker (1968).

22
Many tax researchers have acknowledged that prior tax compliance studies on
individuals provide a formal framework analysis for the corporate tax compliance
decision, (see especially Pyle 1989, p. 87; Rice 1992, p. 127; Kamdar 1997, p. 38;
Joulfaian 2000, p. 698). The remainder of this section focuses on business taxpayers,
particularly corporate SMEs, as the main focus of this chapter. The literature review
reveals that there are at least five tax compliance studies that are relevant to corporate
tax compliance (Rice 1992; Kamdar 1997; Mills 1998; Joulfaian 2000; Hanlon, Mills
and Slemrod 2005). A summary of these corporate tax compliance studies and their key
findings are shown in Table 2.1.
The first empirical evidence on corporate income tax non-compliance was provided by
Rice (1992). Rice used the 1980 Taxpayer Compliance Measurement Program (TCMP)
database provided by the US Internal Revenue Service (IRS). He found no evidence to
link firm size with tax compliance. However, the fact that this study was confined to
medium-sized corporations must be noted.
Kamdar (1997, p. 39) argues that further work is necessary before drawing any
conclusions on the determinants of corporate non-compliance. Kamdar conducted a
time series analysis by utilising both the standard theoretical model of compliance and
one extended to include a couple of variables to examine the extent and determinants of
corporate income tax compliance. The basic compliance model assumes that the amount
of income reported by a taxpayer is a function of true income, marginal tax rates,
probability of detections for companies, penalties for non-compliance, and other
socioeconomic features. Kamdar found that audit rates and profits have a positive and
significant effect on compliance, suggesting that a greater audit coverage could lead to a
substantial rise in tax revenues (Kamdar 1997, p. 46). Despite the fact that corporate tax
evasion was not prevalent in his study, he emphasised that corporate compliance
improvement could result in significant revenue increases (Kamdar 1997, p. 46).
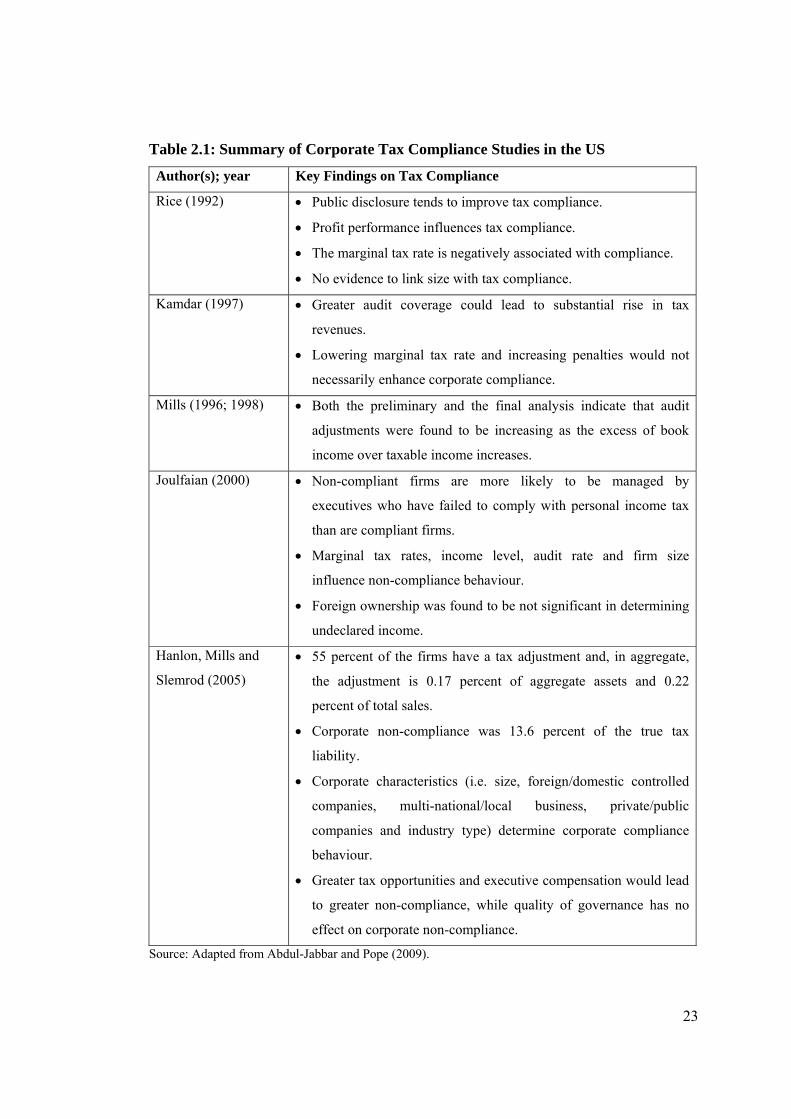
23
Table 2.1: Summary of Corporate Tax Compliance Studies in the US
Author(s); year Key Findings on Tax Compliance
Rice (1992) Public disclosure tends to improve tax compliance.
Profit performance influences tax compliance.
The marginal tax rate is negatively associated with compliance.
No evidence to link size with tax compliance.
Kamdar (1997) Greater audit coverage could lead to substantial rise in tax
revenues.
Lowering marginal tax rate and increasing penalties would not
necessarily enhance corporate compliance.
Mills (1996; 1998) Both the preliminary and the final analysis indicate that audit
adjustments were found to be increasing as the excess of book
income over taxable income increases.
Joulfaian (2000) Non-compliant firms are more likely to be managed by
executives who have failed to comply with personal income tax
than are compliant firms.
Marginal tax rates, income level, audit rate and firm size
influence non-compliance behaviour.
Foreign ownership was found to be not significant in determining
undeclared income.
Hanlon, Mills and
Slemrod (2005)
55 percent of the firms have a tax adjustment and, in aggregate,
the adjustment is 0.17 percent of aggregate assets and 0.22
percent of total sales.
Corporate non-compliance was 13.6 percent of the true tax
liability.
Corporate characteristics (i.e. size, foreign/domestic controlled
companies, multi-national/local business, private/public
companies and industry type) determine corporate compliance
behaviour.
Greater tax opportunities and executive compensation would lead
to greater non-compliance, while quality of governance has no
effect on corporate non-compliance.
Source: Adapted from Abdul-Jabbar and Pope (2009).

24
In another study, Mills (1998, p. 355) noted that the IRS audit adjustments increase as
book-tax differences increase, which indicates likely non-compliance. She refers to
book-tax differences as the differences between accounting income and taxable income.
She asserts that the book-tax differences act as a possible sign of non-compliance. In
her preliminary analysis, she measured the book-tax differences in two ways, i.e. pre-
tax book income less taxable income and federal tax expense less tax declared on the
return (Mills 1996, p. 424). Later, in 1998 (Mills, p. 346), the book-tax differences were
also measured by using the US deferred income tax expense, particularly for public
companies.
A study by Joulfaian (2000) also employed the corporate TCMP data. Joulfaian (2000,
p. 698) argued that managerial preferences might determine corporate compliance
behaviour. The understatement of personal income tax by managers was used as a proxy
of managerial preferences. The undeclared amount of corporate net income (in excess of
US$100) represents the dependent variable and is measured by the differences between
corrected (through audit) and reported income. The independent variables include
managerial preferences and other firm attributes—namely audit rate, marginal corporate
tax rate, net income, sales and foreign ownership—as determinants of compliance
behaviour. Joulfaian found that non-compliant firms are more likely to be managed by
executives who have failed to comply with their personal income tax than are compliant
firms. Thus, he urged tax researchers to incorporate managerial preferences as one of
the determinants of corporate tax compliance (Joulfaian 2000, p. 701).
More recently, Hanlon, Mills and Slemrod (2005) explored the relationship between
corporate non-compliance and corporate characteristics. Tax deficiencies proposed by
the IRS upon audit were mainly used as a measure of non-compliance. In terms of
corporate characteristics, firm size, industry, foreign ownership, multi-nationality, and
public or private companies were among characteristics assessed in their study. Larger
firms were found to be more non-compliant than smaller firms, but medium-sized
businesses had the lowest rate of non-compliance, suggesting that corporate tax non-
compliance was U-shaped. It is surprising that medium-sized businesses were more

25
compliant than small businesses. Hanlon, Mills and Slemrod acknowledged that such an
inconsistent pattern is to be connected with the opportunity for non-compliance
(Hanlon, Mills and Slemrod 2005, p. 27). As for other characteristics of companies,
they found that foreign controlled companies were less non-compliant than domestic
companies, multi-national and private companies had a greater deficiency relative to
non-multinational and public companies respectively, and the overall industry effects
were significant too. As for other variables, Hanlon, Mills and Slemrod (2005)
demonstrated that greater tax opportunities and executive compensation would lead to
greater non-compliance, and that the quality of governance has no effect on non-
compliance, while no evidence was found to support effective tax rates influencing non-
compliance.
Slemrod (2004a, p. 83) argued that the tax situation of both companies and owners is
closely related, and urged researchers to analyse these simultaneously. He expected a
similar connection between compliance/non-compliance and compliance costs,14 and
presumed that tax complexity led to non-compliance as well (Slemrod 2004a, p. 93). Up
until early 2000, the possible association between compliance costs and tax compliance
behaviour remained unidentified for either business or non-business taxpayers
(Hasseldine 2001, p. 9; Richardson and Sawyer 2001, p. 207). An Indian study by
Chattopadhyay and Das-Gupta (2002b) is perhaps among the first to integrate tax
compliance costs and tax behaviour of personal taxpayers into a single study. However,
the study is subject to major methodological shortcomings, mainly due to data
incompleteness, low responses and sample representations.
More recently, Yesegat (2009) has also incorporated these two aspects of compliance in
an Ethiopian study, but confined to VAT taxpayers. She has employed a mixed method
approach by using a survey approach, i.e. face-to-face semi-structured questionnaire
interviews of both taxpayers and tax practitioners, and experimentation with student
subjects. Compliance costs were found to adversely affect tax compliance behaviour,
but their relationship was statistically weak, suggesting that VAT compliance improves
14 See Section 2.3 for a review of tax compliance costs studies.

26
to some extent as the compliance costs are reduced.15 A noteworthy aspect is that the
relationship between compliance costs estimates and compliance behaviour is derived
primarily from the experimental data, i.e. all variables, including compliance costs, are
hypothetical in nature.16 Nevertheless, Yesegat (2009, p. 213) believed that an attitude
question in the semi-structured interview questions to taxpayers supported her overall
finding.17
2.2.2 Malaysian Tax Compliance Studies
Despite growing problems of tax non-compliance and evasion in Malaysia,18 very few
studies have been carried out and not much is known about the extent and determinants
of such problems, particularly since the implementation of the self-assessment regime in
Malaysia in 2001. A review of mainly published studies (including conference papers)
reveals that there are 20 Malaysian tax compliance studies for the period between 1994
and 2008.19 These studies are either partly or wholly related to tax compliance
behaviour. Income tax is the primary focus, with two exceptions (Tayib 1998; Abdul-
Manaf 2004), both related to local government taxes.
Similar to international trends on compliance behaviour research, Malaysian studies
also focused on individual taxpayers. Little attention has been paid to business
taxpayers, and surprisingly none to the corporate sector. Out of 18 studies on income
tax compliance behaviour, only one has solely focused on individuals with business
income, either self-employed or from a partnership (Ramasamy et al. 2003), while the
other seven studies had some respondents with a business income, mostly self-
employed (Hanefah 1996; Kasipillai 1997; Kasipillai et al. 1999; Abdul 2003; Loo
2006a; Che Azmi and Perumal 2008; Sia et al. 2008). A few studies sought responses
respectively from tax professionals (i.e. accountants or tax agents), and tax officers
15 Provided that the probability of detection also increased (Yesegat 2009, p. 214). 16 Compliance costs were manipulated in terms of 5,000 laboratory tokens plus a certain percent of sales, i.e. 1, 5 and 10 percent. These tokens were converted into the Ethiopian currency during the analysis stage. 17 Respondents were asked to indicate their agreement/disagreement to a single statement expressed as ‘the burden of compliance costs discourages me from fulfilling my VAT obligations’. 18 See Chapter One, subsection 1.2.2. 19 Refer Appendix B, for a complete list and summary of these studies.

27
(Che-Ayub 1994; Kasipillai 1997; Singh 2003) and students (Kasipillai, Aripin and
Amran 2003; Loo 2006b; Ahmad, Hanefah and Mohd Noor 2007) as well. In terms of
research method, a survey approach, particularly the mail questionnaire, seems to be
widely used in Malaysian studies. The first study was conducted by Che-Ayub (1994).
However, she focused on the perceptions of tax officers and tax agents towards the tax
administrative system and evasion determinants of individual taxpayers in Malaysia.
The study by Hanefah (1996) was probably the first to examine the tax compliance
behaviour of the Malaysian individual taxpayer, including the self-employed. Hanefah
investigated the efficiency and the productivity of the Malaysian tax administrative
system, predominantly in the OAS, with a view to implementing a SAS in Malaysia. As
part of his research, he studied the perceptions about the income tax administration
system, tax fairness, and the tax law complexity of personal income tax. To achieve
this, he adapted the expanded model of taxpayer compliance developed by Fischer,
Wartick and Mark (1992). Meanwhile, other Malaysian studies partly examined a few
factors and did not make comprehensive attempts to examine compliance behaviour—
for example, the effects of education (Kasipillai, Aripin and Amran 2003), tax
knowledge (Ramasamy et al. 2003; Loo 2006a, 2006b), tax fairness, effectiveness of
the IRB, the compliant attitude of other taxpayers (Ramasamy et al. 2003), ethics
(Kasipillai, Mat-Udin and Zainol-Arifin 2003) or selected demographic factors
(Kasipillai and Abdul-Jabbar 2006) on tax compliance.
As there is no specific tax compliance study on corporate taxpayers, some of the major
findings pertaining to individual business taxpayers are considered in more detail
below. Studies by Ramasamy et al. (2003) and Abdul (2003) are of particular interest,
as both studies are largely relevant to the business context. Additionally, studies by
Hanefah (1996), Loo (2006a), and Sia et al. (2008) considered a substantial number of
responses obtained mainly from the self-employed and few from partnership businesses.
Individuals with business income comprised around 21 percent in Hanefah (1996), 37
percent in Loo (2006a) and between 22 and 94 percent in Sia et al. (2008). Studies by
Kasipillai et al. (1999) and Che Azmi and Perumal (2008) also cover self-employed

28
taxpayers. However, both studies are not considered in this section as the former study
had only around four percent of self-employed businesses, and the latter study was
restricted to tax fairness and did not encompass tax compliance behaviour. The earlier
findings in this regard are important as they provide a framework for this research.
A summary of key findings on Malaysian tax compliance studies on business
individuals is shown in Table 2.2. Further details of these studies, together with other
studies on non-business individuals, are presented Appendix B.20
Ramasamy et al. (2003) exclusively cover small business income taxpayers. Their study
was conducted by way of an interview survey to examine factors influencing the
compliance behaviour of small business entrepreneurs in the northern peninsular of
Malaysia. Four independent variables were used to determine the compliance behaviour
of individual entrepreneurs. The independent variables were the extent of tax
knowledge of small entrepreneurs, attitudes towards compliance by other taxpayers,
attitudes towards the effectiveness of the IRB, and attitudes towards fairness of the tax
system. Three hundred and twelve individual entrepreneurs were selected by way of
non-random sampling and interviewed. They had obtained a response rate of 62 percent.
Two main conclusions can be drawn from the Ramasamy et al. (2003) study. First,
attitudes towards other taxpayers’ compliance and attitudes towards tax fairness are
positively related to small business compliance behaviour. Secondly, and surprisingly,
the amount of tax knowledge and attitudes towards the effectiveness of the IRB have no
relationship to the compliance behaviour of entrepreneurs. Ramasamy et al. (2003, p.
25) suggest that this is probably due to the limitations of the study—the inability to
differentiate between intentional and non-intentional non-compliance. They argued that
the reason for non-compliance could be due to ignorance of the tax laws or due to the
inability to understand the complex nature of tax laws.
20 Other tax studies, i.e. not compliance-related, are outlined in Appendix C.

29
Table 2.2: Malaysian Tax Compliance Studies on Business Income Taxpayers
Author(s); year Key Findings on Compliance Attitudes and Behaviour
Hanefah (1996) Tax law was perceived to be unfair and tax complexity
existed.
Some knowledge and understanding of the tax system
would enhance compliance.
Ramasamy et al.
(2003)
Attitudes towards others’ compliance and fairness were
positively related to compliance behaviour.
Tax knowledge and attitudes towards effectiveness of the
IRB has no relationship to compliance behaviour
Abdul (2003) Non-compliance is severe in older persons, males with high
taxable income levels and those who received non-salary
income.
Tax officers believed that taxpayers’ intention, role of tax
agents, taxpayers’ ignorance of tax law and financial strain
were the main reasons for non-compliance.
Loo (2006a) Tax knowledge, tax structure, perceptions about tax fairness
and perceptions about tax administration were found to
influence tax behaviour, but tax knowledge had the most
effect.
The financial constraints did not show any effect on
compliance behaviour.
Sia et al. (2008) Compliant and non-compliant taxpayers had similar
perceptions toward tax fairness, tax morals and peer
influence.
Source: Abdul-Jabbar and Pope (2009).

30
Abdul (2003) is probably the first to use the official IRB data. She analysed the main
characteristics of income tax non-compliance from the perspectives of both tax evaders
(i.e. taxpayers that are found guilty by the IRB for the period 1995 to 1997) and tax
officers. In scrutinising all 507 individual files of tax evaders, she observed that almost
99 percent of non-compliance was due to either the failure to declare income (68.2
percent) or the understatement of income (30.4 percent). The remainder (less than two
percent) was due to either overstatement of deductions or expenses (Abdul 2003, p. 66).
An interview survey of 60 tax officers shows a slightly different finding. Tax officers
believed that 63 percent of the non-compliance was due to both failure to declare
income (30 percent) and understatement of income (33 percent). Another 25 percent
and 12 percent were in regard to inflating expenses or over-claiming deductions
respectively. Abdul (2003, p. 70) believed that the difference could be partly related to
methodologies used for ranking. Tax officers were asked to rank type of non-
compliance in order of importance. On the other hand, evidence on the types of non-
compliance was extracted from the evader’s tax file. Other possible reasons given are
related to time frame (for example, the actual file data were relevant for the period
between 1995 and 1997), while tax officers’ responses were obtained from more than
80 percent of officers who had worked for at least 10 years.
In terms of factors influencing non-compliance, Abdul (2003, pp. 70-71) focused on
four demographic variables, namely age group, gender, income level and income
source. She observed that non-compliance was particularly severe in older persons
(those aged 50 and above), males, individuals with high taxable income levels
(RM50,000 and over per annum), and those who received income from sources other
than wages and salaries, for example, sole-proprietors and the self-employed (Abdul
2003, p. 89). Her study also indicated that around 62 percent of the tax evaders provided
no reasons at all, while around 34 percent gave reasons such as ignorance of tax law and
forgetting to declare, or similar reasons, for their evasion (Abdul 2003, p. 91). From the
perspective of tax officers, the main reasons for non-compliance were believed to be
taxpayers’ intentional evasion, the role of tax preparers (by way of omission or using
31
loopholes in the tax legislation) followed by taxpayers’ ignorance of income tax law
and financial strain (Abdul 2003, p. 94).
In an earlier study, Hanefah (1996) examined perceptions of the income tax
administration system, tax fairness, and the tax law complexity of personal income tax.
Overall, his findings indicate that tax law is perceived to be unfair and complex. He also
provides evidence that some knowledge and understanding of the tax system is likely to
enhance tax compliance. One of his main findings with regard to the self-employed
taxpayer shows that there is a high tendency for them to appoint tax professionals in the
SAS regime.
Recently, Loo (2006a) explored the influence of the implementation of the SAS in
Malaysia on the compliance behaviour of individual taxpayers. She conducted a
repeated survey design immediately before and after the implementation of the SAS.
Five independent variables were included, namely assessment system, tax knowledge,
tax structure, financial constraints and attitude towards tax. Tax compliance behaviour
is measured by three independent income types: taxable income, exempt income and
casual income. Overall, her findings indicate that the change from the OAS to the SAS
has to some extent influenced the compliance behaviour of individual taxpayers.
Specifically, tax knowledge, tax structure and attitude towards tax were found to
influence income reporting behaviour; tax knowledge had the greatest effect. As for the
other two types of compliance, only tax knowledge and tax attitudes were found to be
significant in both cases. Financial constraints did not show any effect on all types of
compliance behaviour.
More recently, Sia et al. (2008) compared the factors affecting the compliance
behaviour of both compliant and non-compliant individual taxpayers. It is worth
mentioning that both groups of respondents were selected from the IRB database. A
mail survey was used to gather information from both compliant and non-compliant
taxpayers. Non-compliant taxpayers are those who had previously received additional
assessment following tax audits. On the other hand, compliant taxpayers are assumed to
32
be from those who have not been audited. Their study obtained an overall response rate
of almost 10 percent. Interestingly, just over 94 percent of the non-compliant
respondents were those from self-employed or partnership businesses. Meanwhile,
about 22 percent of the compliant respondents came from this group. Overall, the study
by Sia et al. (2008) indicates that both groups of taxpayers had similar perceptions
toward tax fairness, tax morale and others’ compliance.
Similar to the international studies, these Malaysian studies also broadly indicate that
the attitudes of individual taxpayers, particularly towards tax fairness, tax rate structure,
and tax administration, influence their tax compliance behaviour. Thus, the current
study considers these three variables in the context of corporate SME taxation.
Perceptions towards corporate tax complexity and probability of tax audit are also
included so as to recognise the relevance of these factors in the SAS regime. Having
acknowledged the importance of tax incentives to the SME sector internationally (see
especially Freedman 2003; Crawford and Freedman 2008),21 attitudes to such tax
incentives are also examined. The above review shows that no prior Malaysian studies
examined the effect of tax compliance costs on tax compliance behaviour, even for non-
business individuals. The current study emphasises and contributes to this potential
linkage in particular. A review of tax compliance costs studies internationally and in
Malaysia is presented in the section below.
2.3 A REVIEW OF TAX COMPLIANCE COSTS STUDIES
2.3.1 International Compliance Costs Studies
The financial self-interest model suggests that tax rate, detection probability and penalty
structure are determining factors of compliance costs that eventually affect tax
compliance behaviour. The importance of compliance costs in influencing compliance
behaviour and the lack of empirical research in examining this relationship has been
21 See also Chapter Three, subsection 3.4.4.

33
discussed succinctly above.22 Nonetheless, evidence shows that international research
into estimating tax compliance costs has grown strongly since the 1990s (Sandford,
Godwin and Hardwick 1989; Pope 1995; Sandford 1995; Evans et al. 1997).
Compliance cost estimates in the modern era have been conducted internationally,
mainly in the UK, the USA, Australia and Canada for over 20 years, and now cover
other countries, including Netherlands, Spain, Croatia, New Zealand, Singapore,
Malaysia, Hong Kong, India, South Africa, and more recently Ethiopia. Currently, the
requirement of a Tax Impact Statement (also known as Regulatory Impact Statement
and Compliance Costs Assessment) for tax law changes is a normal practice in
Organisation for Economic Co-operation and Development (OECD) countries,
including Australia, the European Union, New Zealand, the UK and the US (Evans and
Walpole 1999, p. 21).
The development of earlier research on tax compliance costs has been discussed in three
phases by Sandford, Godwin and Hardwick (1989, pp. 27-34), covering the period
between the 1930s and early 1980s. Earlier attempts were carried out in the 1930s to
1960s in North America, followed by the Europe phase from the 1960s to 1970s, and
finally a worldwide phase from the 1980s onwards. More recent studies that have been
conducted since the 1980s to early 2002 are outlined by Evans (2003b). Studies that
have been carried out thereafter include those in Australia (Board of Taxation 2007;
Lignier 2008), the UK (Chittenden, Kauser and Poutziouris 2005; Chittenden et al.
2005; Kauser et al. 2005; Mathieu, Waddams and Antwi 2007), the US (Guyton et al.
2003; DeLuca et al. 2005; Guyton et al. 2005), Canada (Vaillancourt and Clemens
2008), Croatia (Blazic 2004), Slovenia (Klun 2004a, 2004b), South Africa (SBP 2005)
and the newest in Ethiopia (Yesegat 2009). Broadly, these studies cover a range of
taxes, with income tax and VAT/GST being the largest in number. The current study
focuses on business income tax and SME corporations in particular, thus key findings of
the relevant studies are discussed in this section. Notwithstanding this, overall findings
of comprehensive studies of all major taxes are given where applicable.
22 See Section 2.2.

34
The first study on taxation compliance costs was carried out by Haig (1935) about 75
years ago on large corporations using a mail survey covering all federal and state taxes
in the US. In the UK, a systematic and exhaustive study on compliance costs was
carried out by Sandford (1973). Sandford used a survey method in collecting responses
mainly from individuals, including the self-employed, on personal income tax. His main
finding reveals that compliance costs amounted to between 1.9 and 3.4 percent of total
tax revenue. He also noted that low income taxpayers had higher compliance costs (on
the average) as a fraction of income compared to higher income taxpayers. This
provides evidence of the presence of regressivity. Thereafter, following a number of
pioneering UK compliance costs studies by Sandford, Godwin and Hardwick (1989), a
considerable number of studies have been undertaken globally. This includes
comprehensive studies of all federal taxes in Australia (Pope et al. 1990 – 1994; Evans
et al. 1997), New Zealand (Sandford and Hasseldine 1992) and the Netherlands (Allers
1994).
Recently, Evans (2003b), in reviewing prior studies in taxation operating costs, has
highlighted that there are at least 100 published studies into compliance costs,
administrative costs or both. Out of these, Evans added that more than 60 publications
have taken place since 1980 to early 2002. Evans (2003b, p. 66) noted that the first
study in the Asia–Pacific region was only published in Australia in 1990, following
pioneering work by Pope, Fayle and Duncanson (1990). Subsequently, Pope headed a
series of four compliance costs studies on major Australian federal taxes, covering a
wide range of taxes, including personal income tax, company income tax (Pope, Fayle
and Chen 1991; 1994), fringe benefits tax (Pope, Fayle and Chen 1993a) and wholesale
sales tax (Pope, Fayle and Chen 1993b). The compliance costs of these federal taxes
were estimated at A$7,873 million in 1990/91,23 representing 11.9 percent of the total
tax revenue from those federal taxes and 2.1 percent of GDP (Pope 1995, p. 103). A
review of all five studies by Pope et al. indicates that compliance costs in Australia are
significant, regressive and politically sensitive in nature, especially towards smaller
23 A$1 = RM2.84 (1 July 2009, Bank Negara Malaysia).

35
businesses. These findings in particular have focussed government attention onto the
issue of the compliance burden in Australia (Rimmer and Wilson 1996).
Since a series of studies by Pope et al., a number of studies have been conducted in
Australia, including the comprehensive study of compliance costs by Evans et al.
(1997). This study (often referred to as the ATAX study) provides further evidence on
the regressivity of tax compliance costs on small businesses in particular. In 1994/1995,
tax compliance costs of small business, irrespective of their legal entity, measured per
A$1,000 of turnover, were at least nineteen times greater than for both medium and
large business (Evans et al. 1997, pp.79-80).24 The remainder of the Australian studies
were conducted by Wallschutzky and Gibson (1993), Rametse and Pope (2002), CPA
Australia (2003), Evans (2003a), Tran-Nam and Glover (2002a), Evans, Tran-Nam and
Jordan (2002), Glover and Tran-Nam (2005), and more recently specific studies on
small business (Board of Taxation 2007; Lignier 2008). Evans (2003b, p. 69) observed
that most studies on business operating costs are not specific to any one sector, but take
account of all business segments. However, studies on small businesses tend to focus on
the GST (Wallschutzky and Gibson 1993; Rametse and Pope 2002; Tran-Nam and
Glover 2002a; CPA Australia 2003; Glover and Tran-Nam 2005).
In New Zealand, tax compliance costs of business taxes were estimated to be almost
NZ$1.9 billion, with income tax compliance costs amounting to just over NZ$1.2
billion or 19 percent of tax revenue in 1990–91 (Sandford and Hasseldine 1992, p.
107).25 Recently, Brunton (2005) estimated tax compliance costs for SMEs,26 covering
four types of taxes, i.e. income tax, GST, PAYE and Fringe Benefit Tax (FBT). The
average costs incurred by the SMEs in complying with such taxes were NZ$4,024, with
almost 90 percent related to income tax (51 percent) and the GST (39 percent). Besides
these, an annual survey has also been carried out by Business New Zealand/KPMG
since 2003, covering all business compliance costs, including tax-related, employment-
related and environmental-related costs. Tax compliance costs consistently made up the
24 Refer Evans et al. (1997), Table 5.11 p.79, for details. 25 NZ$1 = RM2.28 (1 July 2009, Bank Negara Malaysia). 26 Only internal time costs and external costs were computed in Brunton (2005).

36
largest share of compliance costs, for example around 40 percent for the years 2005 to
2007 (Business New Zealand/KPMG 2005, 2006, 2007) .
In the Netherlands, total compliance costs to business in 1989 were estimated at Gld7.2
billion27 or four percent of tax revenue (Allers 1994, p. 124).28 The use of a single
question postcard survey to assess the non-response bias is one substantial contribution
made by this author to the methodology of estimating tax compliance costs.
In the US, a number of studies, in particular by Slemrod and his colleagues (Slemrod
and Sorum 1984; Blumenthal and Slemrod 1992; Slemrod and Blumenthal 1996;
Slemrod and Venkatesh 2002) have been undertaken since the mid-1980s. Other US
studies include those by Little (1988), Lassila and Smith (1997), Guyton et al. (2003;
2005), and a recent specific study on small businesses (DeLuca et al. 2005).29
Regarding the US studies, Pope (2005, p. 206) observed that the business compliance
costs studies in the US tend to emphasise larger corporations.30 For overall compliance
costs, few US estimates are available, i.e. by Halls (1993), Slemrod (2004b) and
Moody, Warcholik and Hodge (2005). Slemrod (2004b) estimated that the US federal
tax compliance costs in 2004 amounted to US$125 billion or 13.4 percent of tax
revenue, comprising US$85 billion and US$40 billion (or 11 percent and 24 percent of
corresponding tax revenue) for individuals (including those with a business income) and
other business taxpayers respectively.31
The recent estimates by Moody, Warcholik and Hodge (2005, p. 2), however, indicated
a much higher figure for 2004,32 i.e. US$244 billion or 24 percent of tax revenue.
Vaillancourt and Clemens (2008, pp. 59-60) argue that the differences between these
US estimates are largely methodological, in particular the hourly rate used in valuing
27 The Guilder (Gld) was the national currency at the time of study. Since 1999, the Netherlands, as a member of the European Community (EU) adopted the Euro Dollar (€). 28 Covers all business taxes, including income tax (both individuals and corporations) and VAT. No separate details available for income tax. 29 Findings reported in this conference paper are preliminary in nature. 30 See the latter part of this section for details. 31 US$1 = RM3.52 (1 July 2009, Bank Negara Malaysia). 32 These estimates cover a period of between 1990 and 2015.

37
taxpayer time. Further, the 2004 Slemrod estimates were based on his (and his
colleagues’) prior surveys; on the other hand, Moody, Warcholik and Hodge (2005)
relied on the IRS time estimates that were then converted into dollar values.
Nonetheless, both estimates indicated the same findings regarding an increasing trend of
compliance costs and its distributional effect on low income earners or smaller
businesses.
In Canada, despite a number studies focusing on specific taxes having been conducted
since 1989 (Vaillancourt 1989; Plamondon and Associates Inc 1993; Erard 1997a),
only recently total estimates of all tax compliance costs, including for business taxes,
were available (Charron, Chow and Halbesma 2008; Vaillancourt and Clemens 2008).
The estimated compliance costs of all taxes in 2005 was between C$16.2 billion and
C$25.0 billion, with business tax compliance costs amounted to C$13.0 billion or 1.0%
of GDP (Vaillancourt and Clemens 2008, pp. 73-74).33 Specific ratios relative to
business taxes are not reported separately by the authors, but the overall ratio indicates
that total compliance costs comprise between 3.0 percent and 4.7 percent of all federal,
provincial and local total revenues or between 1.2 percent and 1.8 percent of GDP in
2005 (Vaillancourt and Clemens 2008, p. 78). In 2008, costs for the business sector to
comply with all types of taxes34 amounted to C$12.6 billion or 2.7 percent of total tax
revenue (Charron, Chow and Halbesma 2008, pp. 13-14 and 19-20).
In Asia, a couple of business tax compliance costs studies were conducted in Singapore
(Ariff, Loh and Talib 1995; Ariff, Ismail and Loh 1997), and subsequently followed by
similar studies in Hong Kong (Chan et al. 1999), and Malaysia (Loh et al. 1997;
Hanefah, Ariff and Kasipillai 2001).35 A comparative analysis of these Asian studies
undertaken by Ariff and Pope (2002, p. 25) indicate that compliance costs, as per 1,000
corresponding currency units of turnover, incurred by small companies are almost ten
times higher than for large companies. One noteworthy aspect is that all the Asian
33 C$1 = RM3.03 (1 July 2009, Bank Negara Malaysia). 34 Comprising payroll taxes, business income tax, GST or harmonized sales tax (HST), provincial sales taxes and property taxes. 35 Further analysis of these Asian studies is provided by Ariff and Pope (2002) in a single reference. See subsection 2.3.2 below for details on the Malaysian studies.

38
studies focussed on the corporate sector, with nearly all on public companies and only
one on SMEs. More importantly, all these studies estimated compliance costs at the
company disaggregate level only. In Singapore, Ariff, Ismail and Loh (1997, p. 1258)
provided evidence of a significant decrease of tax compliance costs per public listed
company, from S$78,396 (in 1994) to S$54,615 (in 1995).36 The average tax
compliance costs per public listed company in Hong Kong were estimated at
HK$346,483 for the tax year 1995–1996 (Chan et al. 1999).37 Recently, a couple of
Asian studies were conducted in India (Chattopadhyay and Das-Gupta 2002a, 2002b),
covering both individual and corporate taxpayers. These Indian studies did not report
the overall average compliance costs in monetary terms either for individuals or
companies, but rather expressed it as a percentage of turnover, fixed assets and/or costs
per employee. All these Asian studies have conclusively supported the presence of a
fixed costs effect on smaller firms and ensuing regressivity.
A more detailed account of tax compliance costs studies is not provided in this
chapter;38 interested readers should refer mainly to Sandford (1995), Evans, Pope and
Hasseldine (2001), Ariff and Pope (2002), Evans (2003b) and Pope (2005). One
remarkable aspect is the incidence of a fixed cost effect irrespective of business size.
Nearly all prior studies outlined above indicate that business tax compliance costs fall
heavily to smaller firms when expressed as a percentage of turnover or tax paid. The
same pattern applies for a single type of tax and over all taxes i.e. at the aggregate level
for all types of business taxes. Further, key findings of all major studies, both earlier
and recent studies up to 2002, continue to indicate that the compliance costs are high,
very regressive (especially towards smaller firms and/or in the case of GST) and
increasingly attracting political attention (Pope 2005, p. 210; 2007, pp. 522-523).
36 S$1 = RM2.43 (1 July 2009, Bank Negara Malaysia). 37 HK$1 = RM0.45 (1 July 2009, Bank Negara Malaysia). 38 Other than details and discussion of the relevant international studies on corporate business income taxation (see next paragraph) and all Malaysian studies (see subsection 2.3.2 below).
39
As the current study is confined to SME companies, a summary of compliance costs
studies on corporate taxation in particular is presented in Table 2.3.39 The first UK
study on corporations was conducted for the tax year 1986-87, and indicated that
compliance costs were estimated at £300 million or 2.2 percent of corporate tax revenue
(Sandford, Godwin and Hardwick 1989, p. 140).40 In a later study, but confined to UK
listed corporations, total compliance costs were estimated at £265 million, which
showed an increase of around 34 percent in the period 1991–1996 (KPMG 1996). More
recently, specific estimates on SME companies under the SAS regime conducted by
Kauser et al. (2005, pp. 21-22) indicate that the aggregate compliance costs of SME
companies in the UK amounted to £608 million. This study did not report the average
compliance costs, but analyses compliance costs in percentile terms by business size in
contrast to the 1989 Sandford findings. Their findings indicate that the regressivity of
compliance costs upon small business remains an important concern (Kauser et al.
2005, p. 21).
In Australia, there were two studies on corporate compliance costs—the first on public
companies (Pope, Fayle and Chen 1991) and the second covering all companies (Pope,
Fayle and Chen 1994)—with findings from the former study superseded by the latter
study. The 1990-91 compliance costs of companies’ income taxation were estimated at
A$3,246 million or 22.9 percent of companies’ income tax (Pope, Fayle and Chen 1994,
p. 13), representing the largest compliance costs portion (41 percent) of all income taxes
(Pope 1995, pp. 103-104).41
39 This summary covers studies undertaken since the late 1980s until recently. More details are presented in Appendix D. For earlier studies, including those on corporate businesses, refer Sandford, Godwin and Hardwick (1989, pp. 225 - 230). 40 £1 = RM5.79 (1 July 2009, Bank Negara Malaysia). 41 A$1 = RM2.84 (1 July 2009, Bank Negara Malaysia).
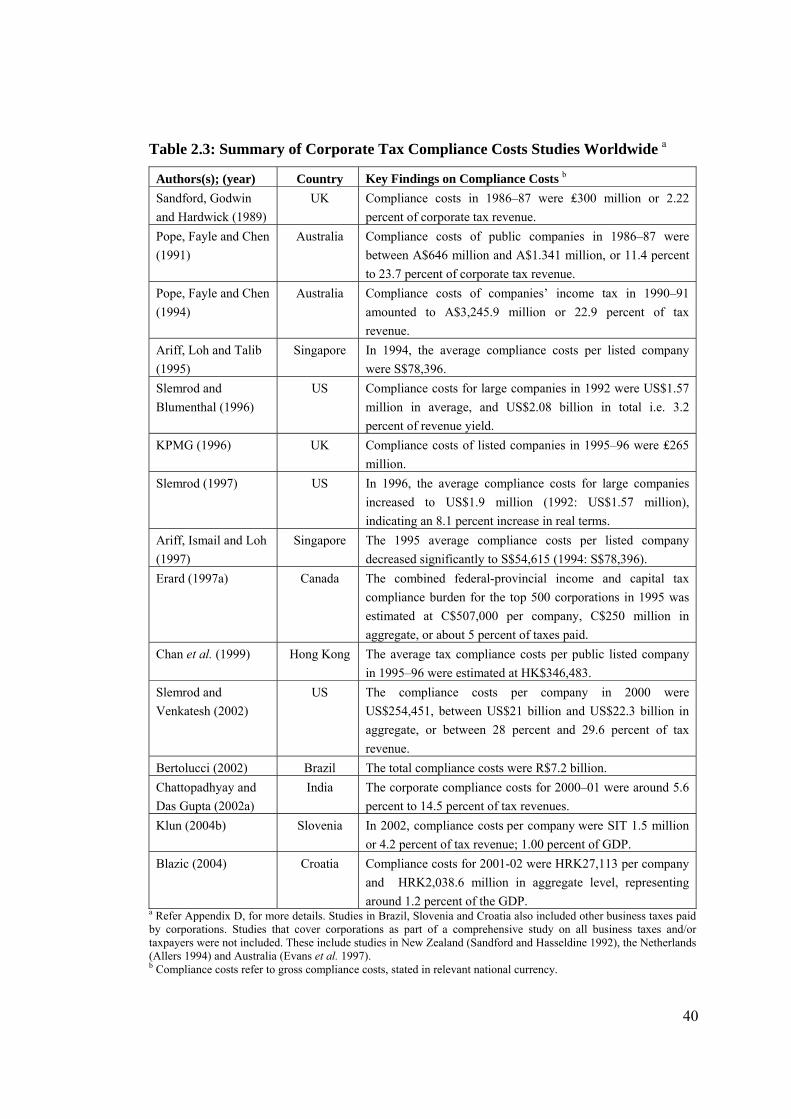
40
Table 2.3: Summary of Corporate Tax Compliance Costs Studies Worldwide a
Authors(s); (year) Country Key Findings on Compliance Costs b
Sandford, Godwin
and Hardwick (1989)
UK Compliance costs in 1986–87 were ₤300 million or 2.22
percent of corporate tax revenue.
Pope, Fayle and Chen
(1991)
Australia Compliance costs of public companies in 1986–87 were
between A$646 million and A$1.341 million, or 11.4 percent
to 23.7 percent of corporate tax revenue.
Pope, Fayle and Chen
(1994)
Australia Compliance costs of companies’ income tax in 1990–91
amounted to A$3,245.9 million or 22.9 percent of tax
revenue.
Ariff, Loh and Talib
(1995)
Singapore In 1994, the average compliance costs per listed company
were S$78,396.
Slemrod and
Blumenthal (1996)
US Compliance costs for large companies in 1992 were US$1.57
million in average, and US$2.08 billion in total i.e. 3.2
percent of revenue yield.
KPMG (1996) UK Compliance costs of listed companies in 1995–96 were ₤265
million.
Slemrod (1997) US In 1996, the average compliance costs for large companies
increased to US$1.9 million (1992: US$1.57 million),
indicating an 8.1 percent increase in real terms.
Ariff, Ismail and Loh
(1997)
Singapore The 1995 average compliance costs per listed company
decreased significantly to S$54,615 (1994: S$78,396).
Erard (1997a) Canada The combined federal-provincial income and capital tax
compliance burden for the top 500 corporations in 1995 was
estimated at C$507,000 per company, C$250 million in
aggregate, or about 5 percent of taxes paid.
Chan et al. (1999) Hong Kong The average tax compliance costs per public listed company
in 1995–96 were estimated at HK$346,483.
Slemrod and
Venkatesh (2002)
US The compliance costs per company in 2000 were
US$254,451, between US$21 billion and US$22.3 billion in
aggregate, or between 28 percent and 29.6 percent of tax
revenue.
Bertolucci (2002) Brazil The total compliance costs were R$7.2 billion.
Chattopadhyay and
Das Gupta (2002a)
India The corporate compliance costs for 2000–01 were around 5.6
percent to 14.5 percent of tax revenues.
Klun (2004b) Slovenia In 2002, compliance costs per company were SIT 1.5 million
or 4.2 percent of tax revenue; 1.00 percent of GDP.
Blazic (2004) Croatia Compliance costs for 2001-02 were HRK27,113 per company
and HRK2,038.6 million in aggregate level, representing
around 1.2 percent of the GDP. a Refer Appendix D, for more details. Studies in Brazil, Slovenia and Croatia also included other business taxes paid by corporations. Studies that cover corporations as part of a comprehensive study on all business taxes and/or taxpayers were not included. These include studies in New Zealand (Sandford and Hasseldine 1992), the Netherlands (Allers 1994) and Australia (Evans et al. 1997). b Compliance costs refer to gross compliance costs, stated in relevant national currency.

41
In the US, the income tax compliance costs of large companies in 1992 were estimated
at US$1.5 million per company, and US$2 billion in aggregate or around 3.2 percent of
tax revenue (Slemrod and Blumenthal 1996, pp. 481, 421).42 In 1996, the compliance
costs of US large companies increased to US$1.9 million per company, which is equal
to 8.1 percent of real increase in average compliance costs (Slemrod 1997, p. 7). In
2000, compliance costs for both large and medium sized-companies were estimated at
US$254,000 per company, around US$22 billion in aggregate terms, i.e. 29 percent of
tax (Slemrod and Venkatesh 2002, pp. 24-27). Thereafter, compliance costs estimates of
corporations take into account partnerships as well, i.e. Slemrod (2004b) and Moody,
Warcholik and Hodge (2005).
Compliance costs for the largest Canadian corporations were estimated to be C$507,000
per company, amounting to C$250 million in aggregate or five percent of tax revenue
(Erard 1997a, pp. 4-5).43 Another Canadian study by Erard (1997b) specifically
considered medium-sized corporations, but was concerned with perceptions about the
compliance burden and thus did not estimate the compliance costs.
The most recent studies on corporations, i.e. for the tax year 2001-02, were conducted
in Croatia (Blazic 2004) and Slovenia (Klun 2004b). For Asian countries, nearly all
studies estimated compliance costs on corporations; with estimates for Singapore, Hong
Kong and India presented in the above section,44 while prior Malaysian estimates are
discussed below.
42 US$1 = RM3.52 (1 July 2009, Bank Negara Malaysia). 43 C$1 = RM3.03 (1 July 2009, Bank Negara Malaysia). 44 For a comprehensive review, refer Ariff and Pope (2002).
42
2.3.2 Malaysian Compliance Costs Studies
Compliance costs studies, in a similar trend to compliance behaviour, also have long
been ignored in Malaysia. Prior literature indicates that, to date, there are only three
published studies on the costs of compliance in Malaysia. The first study, conducted by
Loh et al. (1997) in 1995, examined the income tax compliance costs of public listed
companies in Malaysia. The second study, conducted by Hanefah, Ariff and Kasipillai
(2001) in 2000 focused on SMEs. The third study was conducted by Mansor, Saad and
Ibrahim (2003) in 2001. This study is probably the first study conducted under the SAS
regime. However, it does not measure compliance costs in monetary terms; instead it
focuses on the relative increase in the time spent on various tax compliance activities. In
addition to these three studies, a study by Sapiei and Abdullah (2008) is probably the
first on tax compliance costs of individual taxpayers. However, the study only estimated
tax compliance costs, partially in monetary terms and the remainder in time spent. A
summary of the major findings of these Malaysian compliance costs studies is shown in
Table 2.4.45
45 Additional details are provided in Appendix E.
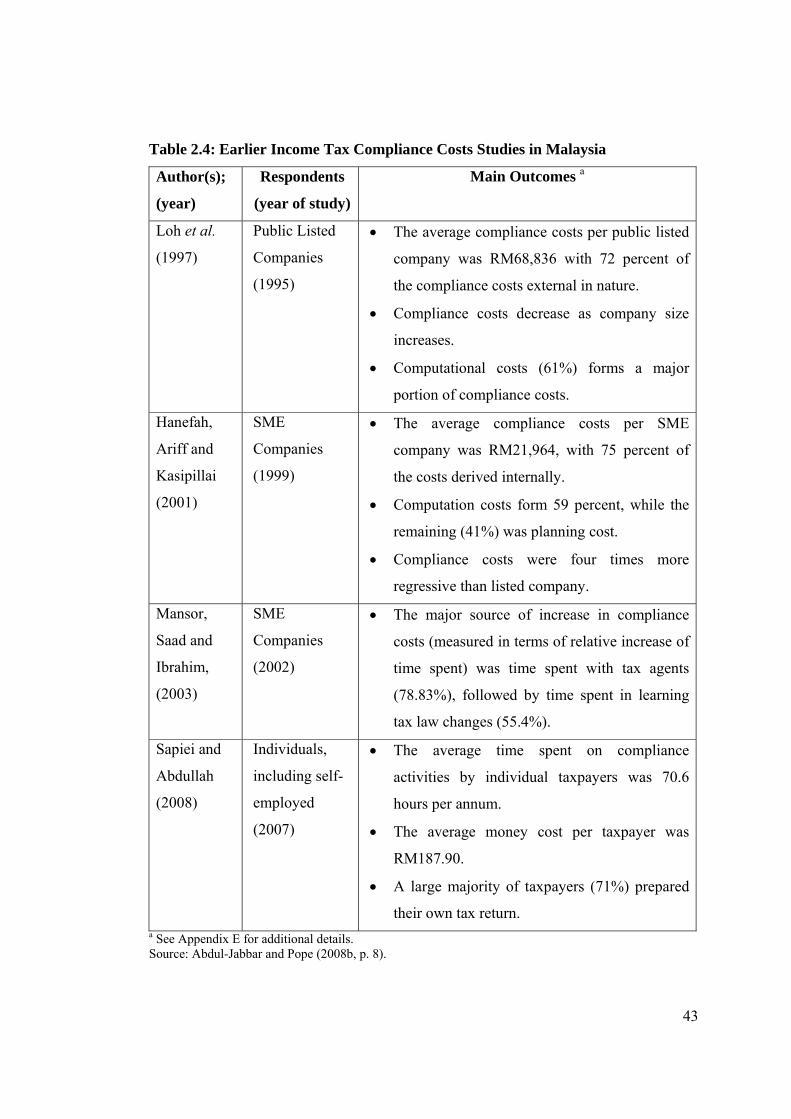
43
Table 2.4: Earlier Income Tax Compliance Costs Studies in Malaysia
Author(s);
(year)
Respondents
(year of study)
Main Outcomes a
Loh et al.
(1997)
Public Listed
Companies
(1995)
The average compliance costs per public listed
company was RM68,836 with 72 percent of
the compliance costs external in nature.
Compliance costs decrease as company size
increases.
Computational costs (61%) forms a major
portion of compliance costs.
Hanefah,
Ariff and
Kasipillai
(2001)
SME
Companies
(1999)
The average compliance costs per SME
company was RM21,964, with 75 percent of
the costs derived internally.
Computation costs form 59 percent, while the
remaining (41%) was planning cost.
Compliance costs were four times more
regressive than listed company.
Mansor,
Saad and
Ibrahim,
(2003)
SME
Companies
(2002)
The major source of increase in compliance
costs (measured in terms of relative increase of
time spent) was time spent with tax agents
(78.83%), followed by time spent in learning
tax law changes (55.4%).
Sapiei and
Abdullah
(2008)
Individuals,
including self-
employed
(2007)
The average time spent on compliance
activities by individual taxpayers was 70.6
hours per annum.
The average money cost per taxpayer was
RM187.90.
A large majority of taxpayers (71%) prepared
their own tax return. a See Appendix E for additional details. Source: Abdul-Jabbar and Pope (2008b, p. 8).
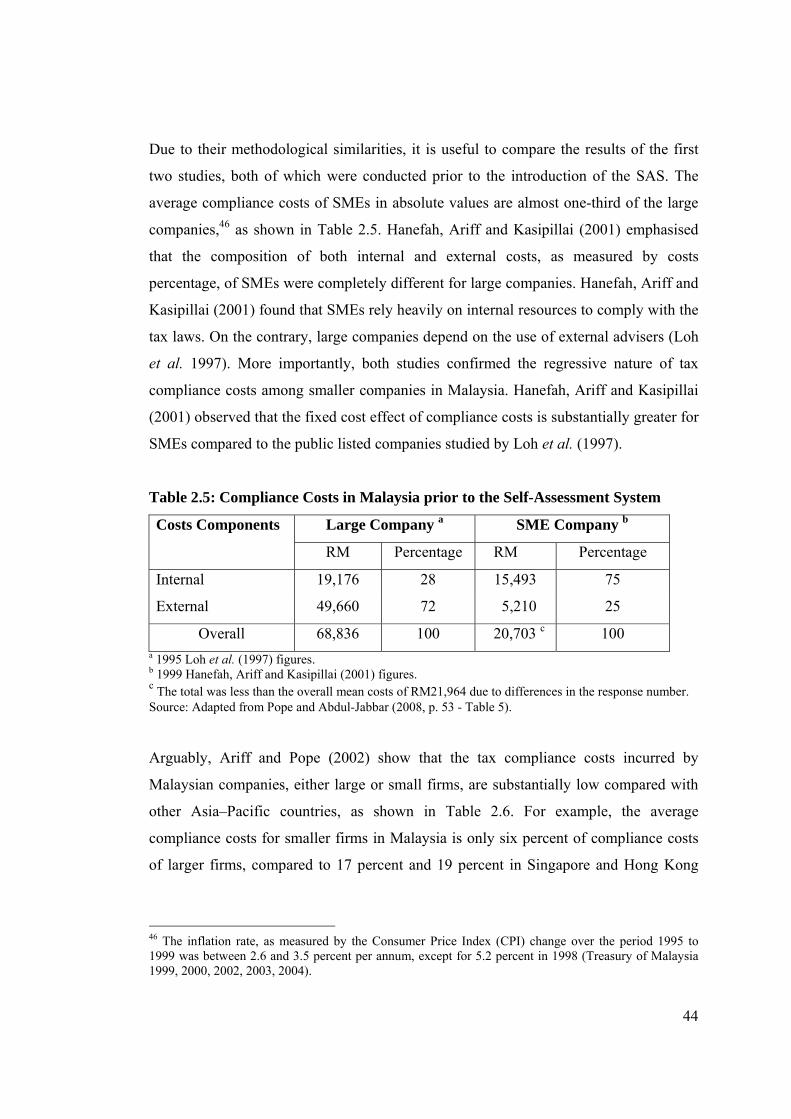
44
Due to their methodological similarities, it is useful to compare the results of the first
two studies, both of which were conducted prior to the introduction of the SAS. The
average compliance costs of SMEs in absolute values are almost one-third of the large
companies,46 as shown in Table 2.5. Hanefah, Ariff and Kasipillai (2001) emphasised
that the composition of both internal and external costs, as measured by costs
percentage, of SMEs were completely different for large companies. Hanefah, Ariff and
Kasipillai (2001) found that SMEs rely heavily on internal resources to comply with the
tax laws. On the contrary, large companies depend on the use of external advisers (Loh
et al. 1997). More importantly, both studies confirmed the regressive nature of tax
compliance costs among smaller companies in Malaysia. Hanefah, Ariff and Kasipillai
(2001) observed that the fixed cost effect of compliance costs is substantially greater for
SMEs compared to the public listed companies studied by Loh et al. (1997).
Table 2.5: Compliance Costs in Malaysia prior to the Self-Assessment System
Costs Components Large Company a SME Company b
RM Percentage RM Percentage
Internal 19,176 28 15,493 75
External 49,660 72 5,210 25
Overall 68,836 100 20,703 c 100 a 1995 Loh et al. (1997) figures. b 1999 Hanefah, Ariff and Kasipillai (2001) figures. c The total was less than the overall mean costs of RM21,964 due to differences in the response number. Source: Adapted from Pope and Abdul-Jabbar (2008, p. 53 - Table 5).
Arguably, Ariff and Pope (2002) show that the tax compliance costs incurred by
Malaysian companies, either large or small firms, are substantially low compared with
other Asia–Pacific countries, as shown in Table 2.6. For example, the average
compliance costs for smaller firms in Malaysia is only six percent of compliance costs
of larger firms, compared to 17 percent and 19 percent in Singapore and Hong Kong
46 The inflation rate, as measured by the Consumer Price Index (CPI) change over the period 1995 to 1999 was between 2.6 and 3.5 percent per annum, except for 5.2 percent in 1998 (Treasury of Malaysia 1999, 2000, 2002, 2003, 2004).
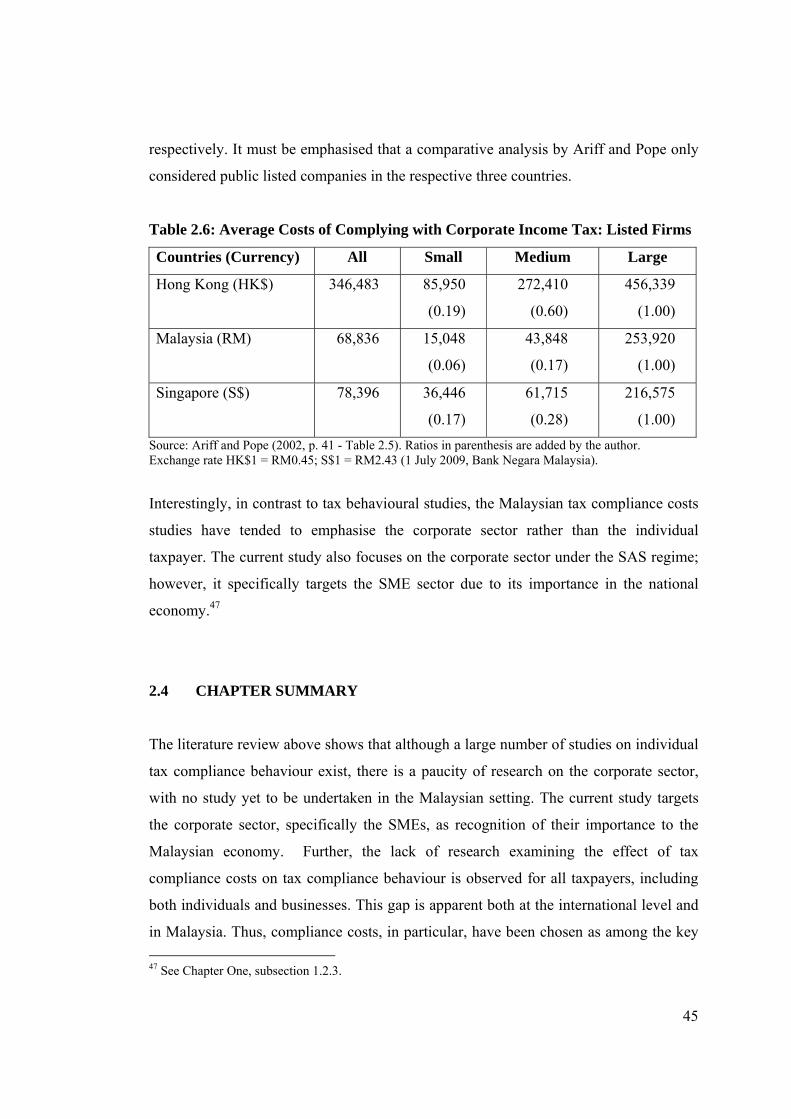
45
respectively. It must be emphasised that a comparative analysis by Ariff and Pope only
considered public listed companies in the respective three countries.
Table 2.6: Average Costs of Complying with Corporate Income Tax: Listed Firms
Countries (Currency) All Small Medium Large
Hong Kong (HK$) 346,483 85,950
(0.19)
272,410
(0.60)
456,339
(1.00)
Malaysia (RM) 68,836 15,048
(0.06)
43,848
(0.17)
253,920
(1.00)
Singapore (S$) 78,396 36,446
(0.17)
61,715
(0.28)
216,575
(1.00)
Source: Ariff and Pope (2002, p. 41 - Table 2.5). Ratios in parenthesis are added by the author. Exchange rate HK$1 = RM0.45; S$1 = RM2.43 (1 July 2009, Bank Negara Malaysia).
Interestingly, in contrast to tax behavioural studies, the Malaysian tax compliance costs
studies have tended to emphasise the corporate sector rather than the individual
taxpayer. The current study also focuses on the corporate sector under the SAS regime;
however, it specifically targets the SME sector due to its importance in the national
economy.47
2.4 CHAPTER SUMMARY
The literature review above shows that although a large number of studies on individual
tax compliance behaviour exist, there is a paucity of research on the corporate sector,
with no study yet to be undertaken in the Malaysian setting. The current study targets
the corporate sector, specifically the SMEs, as recognition of their importance to the
Malaysian economy. Further, the lack of research examining the effect of tax
compliance costs on tax compliance behaviour is observed for all taxpayers, including
both individuals and businesses. This gap is apparent both at the international level and
in Malaysia. Thus, compliance costs, in particular, have been chosen as among the key
47 See Chapter One, subsection 1.2.3.

46
determinants of tax compliance in the current study. Other influences included are
business characteristics (such as business size, sector and the length in business), tax
attitudes and perceptions (such as on complexity, fairness and structure of tax system)
from a business managerial perspective.48
48 See Chapter Four, subsection 4.10.4 and Chapter Six, Section 6.7, for more details on other variables.
47
CHAPTER THREE
TAXATION OF SMALL AND MEDIUM ENTERPRISES
AND MAJOR ISSUES IN MALAYSIA
3.1 INTRODUCTION
This chapter starts with an overview of Malaysian taxation and highlights recent major
income tax changes (including for tax year 2009), with particular emphasis on SME
taxation under the SAS regime. Discussion of the major income tax difficulties and
issues facing the SME sector is the central aim of this chapter. Understanding the tax
issues surrounding SMEs is imperative as it offers some background and motivation
regarding the current study. Unless otherwise stated, this chapter primarily covers
relevant provisions under the ITA 1967 that are applicable to the year of assessment
2006 and onwards.
3.2 MALAYSIAN INCOME TAXATION UNDER SELF-ASSESSMENT
3.2.1 Overview
The Malaysian federal government’s tax revenue comprises direct and indirect taxes.
Direct taxes are under the administration of the IRB. On the other hand, indirect taxes
are administered by the Royal Malaysian Customs Department (RMC). Both tax
authorities are under the responsibility of the Ministry of Finance. The IRB was
established in accordance with the Inland Revenue Board of Malaysia Act 1995, which
allows autonomy in the administration and effectiveness of direct taxes. On the
contrary, the RMC is a government agency. A summary of direct and indirect taxes in
Malaysia is presented in Table 3.1. All the taxes are administered under different Acts
of Parliament. For example, income tax is governed by the ITA 1967, real property
gains tax is under the Real Property Gains Tax Act (RPGTA) 1976, whilst sales tax and
service tax are covered by the Sales Tax Act 1972 and Service Tax Act 1975
respectively.
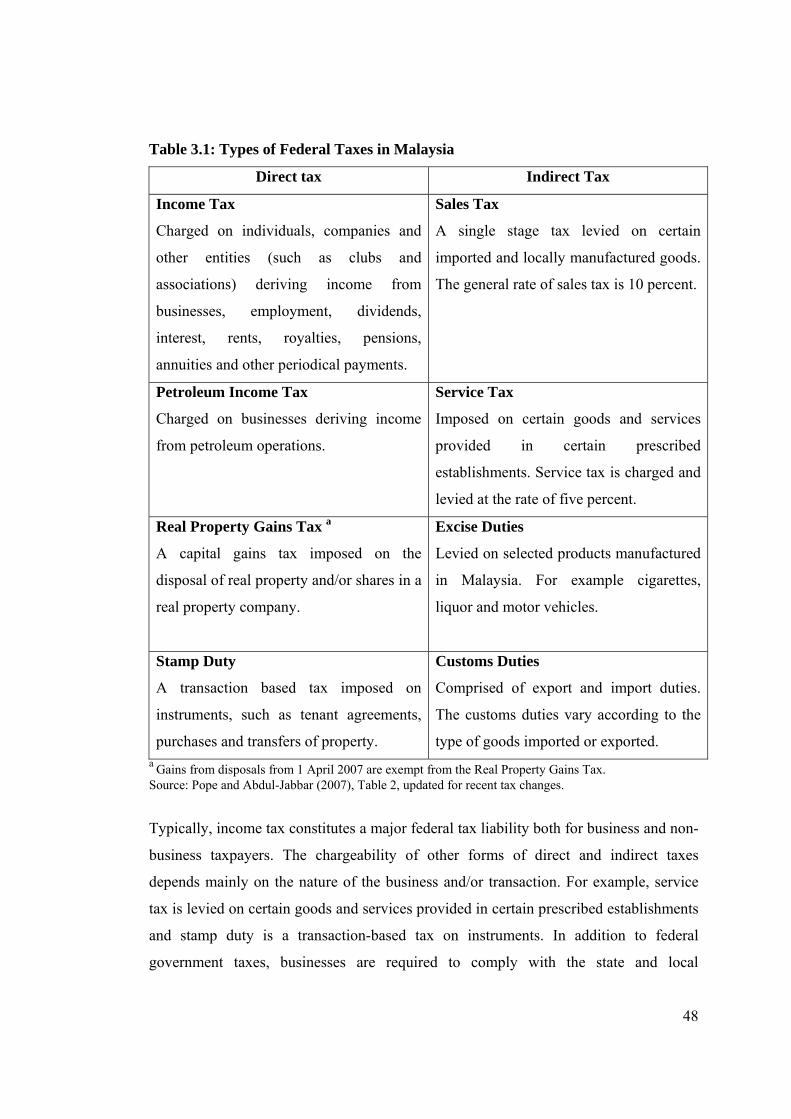
48
Table 3.1: Types of Federal Taxes in Malaysia
Direct tax Indirect Tax
Income Tax
Charged on individuals, companies and
other entities (such as clubs and
associations) deriving income from
businesses, employment, dividends,
interest, rents, royalties, pensions,
annuities and other periodical payments.
Sales Tax
A single stage tax levied on certain
imported and locally manufactured goods.
The general rate of sales tax is 10 percent.
Petroleum Income Tax
Charged on businesses deriving income
from petroleum operations.
Service Tax
Imposed on certain goods and services
provided in certain prescribed
establishments. Service tax is charged and
levied at the rate of five percent.
Real Property Gains Tax a
A capital gains tax imposed on the
disposal of real property and/or shares in a
real property company.
Excise Duties
Levied on selected products manufactured
in Malaysia. For example cigarettes,
liquor and motor vehicles.
Stamp Duty
A transaction based tax imposed on
instruments, such as tenant agreements,
purchases and transfers of property.
Customs Duties
Comprised of export and import duties.
The customs duties vary according to the
type of goods imported or exported. a Gains from disposals from 1 April 2007 are exempt from the Real Property Gains Tax. Source: Pope and Abdul-Jabbar (2007), Table 2, updated for recent tax changes.
Typically, income tax constitutes a major federal tax liability both for business and non-
business taxpayers. The chargeability of other forms of direct and indirect taxes
depends mainly on the nature of the business and/or transaction. For example, service
tax is levied on certain goods and services provided in certain prescribed establishments
and stamp duty is a transaction-based tax on instruments. In addition to federal
government taxes, businesses are required to comply with the state and local
49
government taxes, which include property taxes (assessment tax and land tax) and
various business permits and licensing. This chapter is confined to income taxation of
SMEs.
3.2.2 Duties and Responsibilities of Business Taxpayers
Business taxpayers, regardless of their size, are required by law (i.e. ITA 1967),
essentially, to file an annual tax return (Sections 77 and 77A), and to keep sufficient
records and documentation (Sections 82 and 82A). Corporate taxpayers are required to
observe further additional tax requirements (e.g. Sections 107, 107B, 107C and 108).
Businesses are also required to implement the Schedular Tax Deduction (STD) Scheme
(Section 107(1) and Income Tax–Deduction from Remuneration Rules 1994) and to
furnish certain returns on behalf of their employees (Section 83). Further, in the case of
tax audit, taxpayers are required to provide reasonable assistance and facilities to the
IRB officers (Section 80). Each of these duties is discussed in detail below.
Section 77 of the ITA 1967 requires business taxpayers to give notice of chargeability
of income tax by way of filing an annual tax return. Generally, the filing of tax returns
depends on the category of the taxpayer. Corporate taxpayers (including trust bodies
and co-operative societies) are required to furnish a tax return for each year of
assessment within seven months after the financial year-end (Section 77A). On the
other hand, individuals have to submit their tax returns not later than 30 April in the
year following the relevant year of assessment (Section 77). Non-compliance to this
provision could lead to a penalty of between RM200 and RM2,000 and/or
imprisonment of up to six months (Section 112). Taxpayers are also required to ensure
the correctness of their tax return. Further penalties apply in the case of non-compliance
(Sections 113 and 114).
As for documentation, Section 82 of the ITA 1967 requires every business taxpayer to
keep adequate business records for seven years. For this purpose, records include books
of account recording receipts and payments or income and expenditure, invoices,
vouchers, receipts and other relevant documents to verify the accounting entries
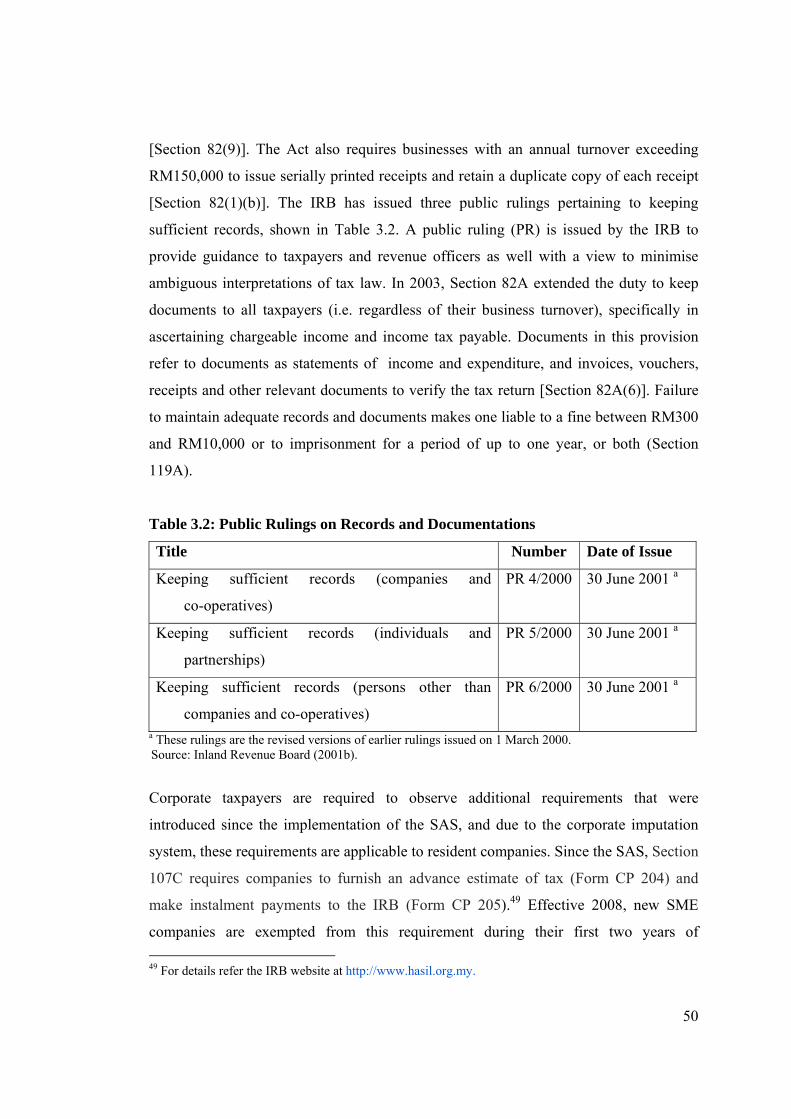
50
[Section 82(9)]. The Act also requires businesses with an annual turnover exceeding
RM150,000 to issue serially printed receipts and retain a duplicate copy of each receipt
[Section 82(1)(b)]. The IRB has issued three public rulings pertaining to keeping
sufficient records, shown in Table 3.2. A public ruling (PR) is issued by the IRB to
provide guidance to taxpayers and revenue officers as well with a view to minimise
ambiguous interpretations of tax law. In 2003, Section 82A extended the duty to keep
documents to all taxpayers (i.e. regardless of their business turnover), specifically in
ascertaining chargeable income and income tax payable. Documents in this provision
refer to documents as statements of income and expenditure, and invoices, vouchers,
receipts and other relevant documents to verify the tax return [Section 82A(6)]. Failure
to maintain adequate records and documents makes one liable to a fine between RM300
and RM10,000 or to imprisonment for a period of up to one year, or both (Section
119A).
Table 3.2: Public Rulings on Records and Documentations
Title Number Date of Issue
Keeping sufficient records (companies and
co-operatives)
PR 4/2000 30 June 2001 a
Keeping sufficient records (individuals and
partnerships)
PR 5/2000 30 June 2001 a
Keeping sufficient records (persons other than
companies and co-operatives)
PR 6/2000 30 June 2001 a
a These rulings are the revised versions of earlier rulings issued on 1 March 2000. Source: Inland Revenue Board (2001b).
Corporate taxpayers are required to observe additional requirements that were
introduced since the implementation of the SAS, and due to the corporate imputation
system, these requirements are applicable to resident companies. Since the SAS, Section
107C requires companies to furnish an advance estimate of tax (Form CP 204) and
make instalment payments to the IRB (Form CP 205).49 Effective 2008, new SME
companies are exempted from this requirement during their first two years of
49 For details refer the IRB website at http://www.hasil.org.my.
51
operation.50 The amount of the tax estimate shall not be less than 85 percent of the
previous year’s tax payable and shall be made in advance (i.e. by no later than 30 days
before the beginning of the basis period for that year of assessment). The estimated tax
shall be paid in 12 equal instalments commencing from the second month of the basis
period (on or before the 10th day). Revision is allowed in the sixth and/or ninth month of
the basis period. Regarding the imputation system, companies will continue to comply
with the relevant provisions under Section 108; for example, maintaining dividend
franking account (Form R) that needs to be furnished together with their annual tax
return (Form C). Though the imputation system was replaced by the single tier system
commencing in 2008,51 it must be emphasised that the current study covers the 2006 tax
year where the imputation system was in effect. Failure to comply with these provisions
may lead to a penalty (between RM200 and RM2,000) and/or imprisonment (up to six
months) for each offence (Section 120).
Apart from specific duties relating to their own business taxation, businesses are further
required to execute additional duties on behalf of their employees (i.e. third party tax).
The STD was introduced in 1995 and is comparable to pay as you earn (PAYE) and pay
as you go (PAYG) in the UK and Australia respectively. Under the STD scheme,
employers are required to deduct monthly tax on behalf of their employees’
employment income and forward the amounts to the IRB by the 10th of the month
following the month when the tax deduction is made. The deduction depends on the
personal circumstances of each employee and requires businesses to keep their
employees’ records up-to-date. Penalties (up to RM1,000 or imprisonment for a period
of up to six months, or both) are imposed on those failing to comply with the
requirements (Rule 17, Income Tax–Deduction from Remuneration Rules 1994).
Businesses are also required to provide the IRB with annual returns (Form E and CP
8A) relating to their employees (Section 83). The return is to be made yearly on all
employment income. Further, the businesses also need to notify the IRB on the
50 See subsection 3.2.3 for details. 51 Refer subsection 3.2.3 for details.

52
appointment of new employees, of employees ceasing employment and/or leaving
Malaysia.52
In the case of a tax audit, a taxpayer must provide reasonable assistance and facilities to
the IRB officers. A public ruling entitled ‘providing reasonable assistance and facilities’
was issued by the IRB (2000a) in this regard (PR 7/2000). Nonconformity to this
provision may mean a taxpayer is liable to a fine between RM1,000 and RM10,000 or
to imprisonment for a term of up to one year, or to both (Section 116).
3.2.3 Recent Major Business Income Tax Changes
In the year 2000, two major reforms took place in Malaysia, namely, the move from the
preceding year assessment (PYA) to current year assessment (CYA) and the
introduction of the SAS. Another recent major reform, a single-tier company income tax
system, was introduced to replace the corporate imputation system in 2008. Besides the
above general and company-specific tax reforms, two particular changes apply to SME
companies only, namely, the introduction of dual corporate tax rates (in 2003) and
exclusion from advance tax estimates and monthly payments (effective in 2008).
The SAS was implemented in stages, starting with companies from the year 2001 and
subsequently to other taxpayers (i.e. individuals, partnerships and co-operatives) in
2004. Prior to years of assessment 2001 (for companies) and 2004 (for personal and
other taxpayers), income tax in Malaysia was assessed under the OAS. Under the OAS
system, taxpayers were required to submit their annual tax returns by a stipulated
period—within 30 days from the issuing date of notice of assessment or within six
months after the business year-end respectively for the individual and corporate
taxpayer. The IRB then issued a notice of assessment, payable within 30 days. Since
2005, income tax in Malaysia has been fully administered under the SAS regime. The
introduction of the SAS involved a substantial shift of responsibility on to the taxpayers
in terms of their compliance obligations. A tax audit will be conducted by the IRB to
52 Details of these requirements and relevant forms are available on the website of the IRB at http://www.hasil.org.my.
53
ensure that taxable income has been duly recognised and expenses properly claimed.
Any understatement of tax will result in heavy penalties being imposed by the IRB.
Generally, in the SAS, taxpayers are required to compute and pay their income tax.
Companies are required to observe additional requirements. These requirements include
an advance estimation of the tax liability and payment of monthly tax instalments (also
in advance) as provided for in the new Section 107C of ITA 1967.53
Following the SAS, a number of significant amendments have been made. A number of
public rulings have also been issued since 2000. The simplification of the business basis
period, re-categorisation of capital expenditure for capital allowance purposes, and the
full capital allowance for small value assets are some of the major income tax
simplifications that have been introduced since the implementation of the SAS.
Regarding simplification of the business basis period, all individual business taxpayers
are required to close their accounting year on 31 December each year. By contrast, a
basis period for a company will follow the financial year-end. Sections 20 and 21 of the
ITA 1967 have been amended and a new section, 21A, has been introduced.
Additionally, three related public rulings were issued in the year 2000 and consequently
superseded by the later version in 2001, shown in Table 3.3.
53 See subsection 3.2.2.

54
Table 3.3: Public Rulings on Basis Period
Subject Number Date of Issue
Basis period for a non-business source PR 1/2000 a 1 March 2000
Basis period for a business source (companies and
co-operatives)
PR 2/2000 a 1 March 2000
Basis period for a business source (individuals and
persons other than companies and co-
operatives)
PR 3/2000 a 1 March 2000
Basis period for a non-business source (individuals
and persons other than companies/co-
operatives)
PR 4/2001 30 April 2001
Basis period for a business source (co-operatives) PR 5/2001 30 April 2001
Basis period for a business source (individuals and
persons other than companies/co-operatives)
PR 6/2001 30 April 2001
Basis period for business and non-business sources
(companies)
PR 7/2001 30 April 2001
a These rulings were superseded by the four subsequent rulings (i.e. PR4/2001–PR7/2001). Sources: Inland Revenue Board (2000b; 2001c).
For capital allowances, the simplification is made by re-classifying 16 capital
expenditures under the plant and machinery category to only three sub-categories, i.e.
heavy machinery and motor vehicles, plant and machinery, and furniture and office
equipment. Accordingly, a large variety of capital allowance rates were reduced to three
rates only. Another simplification of capital allowance took place in 2006, which allows
small value assets of up to RM1,000 each to be given a 100 percent allowance in the
purchased year. Nonetheless, a sum of such allowance is restricted to a maximum of
RM10,000 per year.54 A public ruling entitled ‘special allowances for small value
assets’ was issued on 27 March 2008 (Inland Revenue Board).
54 Starting 2009, this restriction is not applicable to SME companies (Ministry of Finance Malaysia 2008).
55
Effective 2008, the corporate tax imputation system was replaced by a single-tier
company income tax system. Under this single-tier system, the corporate tax is imposed
at the corporate level (and represents a final tax) and the dividends distributed to
shareholders are exempted from tax. The single tier system certainly would simplify the
procedures (Section 108) for effecting dividend distributions and arguably would reduce
both the administrative costs (to the tax authority) and tax compliance costs (to the
taxpayer) that together comprise tax operating costs.
Specifically to the SME sector, but confined to a company, two additional measures
have been introduced. The first is dual corporate tax rates in 2003. Under this structure,
SME companies, with paid-up capital of up to RM2.5 million, are subject to a tax rate
of 20 percent for the first RM500,000 (from 1 January 2004; RM100,000 in 2003) of
taxable income and the remaining income is subject to the normal corporate tax rate of
25 percent (from 1 January 2009; 26 percent in 2008; 27 percent in 2007). The most
recent amendment relates to the estimation of tax payable and payment of a monthly tax
instalment. In order to relieve the cash flow constraints faced by SMEs, in particular
during the initial stages of operation, SME companies are not required to furnish an
estimate of tax payable or make instalment payments for their first two years from
business commencement.

56
3.3 KEY FEATURES OF INCOME TAXATION FOR SMALL AND
MEDIUM ENTERPRISES
Small and Medium Enterprises in Malaysia are subject to income tax, either as
individual (unincorporated businesses) or as corporate taxpayers (incorporated
businesses), depending on the business establishment. The income taxation of both
incorporated and unincorporated businesses are governed by the ITA 1967, with similar
tax provisions. Generally, unincorporated SMEs are treated as individuals, hence
subject to progressive tax rates and eligible for personal reliefs and rebates. On the
contrary, incorporated businesses, either SMEs or large enterprises, are treated in
similar ways, with a few exceptions or incentives. For example, SME companies are
given a deduction for pre-incorporated expenses. A summary of major differences in
income tax treatment for corporate and individual taxpayers is shown in Table 3.4. For
example, an individual taxpayer is subjected to progressive tax rates and eligible for
personal reliefs and rebates. On the other hand, depending on the size of the company,
corporate taxpayers are subject to either a flat rate (for large companies) or dual tax
rates (for SME companies), without any personal reliefs and rebates. SME companies
with paid-up capital of up to RM2.5 million are eligible for the dual corporate tax rates
introduced in 2003.55 Under this structure, SME companies are subject to a tax rate of
20 percent for the first RM500,000 (RM100,000 prior to 2004) of taxable income and
the remaining income is subjected to a normal corporate tax rate.
55 Effective 2009, SME companies that are controlled by another company with a paid-up capital exceeding RM2.5 million do not fall within the meaning of SME companies for tax purposes (Ministry of Finance Malaysia 2008).

57
Table 3.4: Major Differences between Corporate Business and Individual Taxation
Aspects Corporate Individual a Tax rate(s)
Corporate tax rate is 25 percent (from 1 January 2009; 26 percent in 2008; 27 percent in 2007; 28 percent in 2006). A dual rate applies for SME companies since 2003, i.e. the first RM500,000 of taxable income is taxed at 20 percent (from 1 January 2004; RM100,000 in 2003) and the remaining income is subject to the normal corporate tax rate.
Individual is subject to progressive tax rates of between 0 and 28 percent. Non-residents are subject to a flat rate of 28 percent. Starting 2009, the highest tax rate for both resident and non-resident individuals has been reduced from 28 percent to 27 percent.
Basis of assessment
Financial year-end
Calendar year
Availability of reliefs and rebates in ascertaining taxable income
Not eligible
Eligible
Availability of certain tax deductions, including a double deduction under the ITA 1967.
Available to some SME companies
Not applicable
Requirements relating to the imputation system. b
Yes
Not applicable
Requirements with regards to the SAS, specifically to: estimate tax liability make monthly payment submit a tax return
Yes c
Yes c
Yes
Not applicable Not applicable
Yes
Availability of tax incentives, such as pioneer status and investment tax allowance under the Promotion of Investments Act (PIA), 1986.
Available for certain sectors, mainly to manufacturing, agricultural, tourism and high-technology companies.
Not available, except for agricultural sectors
a Applicable to resident individuals only, unless stated otherwise. b The corporate imputation system applies up to year of assessment 2007. A single-tier company income
tax system applies starting from 2008 (see discussion above in subsection 3.2.3). c Starting 2008, SME companies are exempted from this requirements for their first two years from business commencement (see discussion above in subsection 3.2.3). Source: Pope and Abdul-Jabbar (2007), Table 4, updated for recent tax changes.

58
3.4 MAJOR INCOME TAX DIFFICULTIES AND ISSUES FOR SMALL
AND MEDIUM ENTERPRISES
3.4.1 Overall Perspective
The regulatory nature of duties and obligations of taxpayers, more importantly under
the SAS, places an enormous burden and cost upon the business sector, particularly to
SME sectors. The income tax regulatory burden upon businesses, regardless of their
form and/or size, is among key business regulatory concerns for the business sector
globally (Pope 2008). The international experiences often indicate the difficulties faced
by SMEs in managing government laws and regulations (Fernandez and Oats 1998, p.
162), particularly in maintaining proper records for management and taxation purposes
(Small Business Deregulation Task Force 1996, p. 2; Evans, Carlon and Massey 2005,
p. 289). The issues facing small businesses in relation to regulatory costs are a
worldwide phenomena and almost identical globally (Chittenden, Kauser and
Poutziouris 2003) and in Malaysia (Hanefah and Al-Mureshi 1991; Kasipillai and Liew
2004). These include a lack of understanding of the regulatory requirements, frequent
changes in regulations, and high fixed costs (Chittenden, Kauser and Poutziouris 2003,
p. 110).
From an overall business perspective Malaysian SMEs face many problems and
constraints, which mainly include financial, managerial and technological aspects
(Hashim 2007). Adding to this core business concern and also existing business
regulatory requirements, the regular amendments to the various laws, taxation in
particular, the introduction of the SAS and increasing complexities of the tax system
may have further adverse impacts on SMEs. The following subsections highlight the
issues concerning business record keeping, complexity of tax law, legal forms of
business entities, and more importantly, compliance costs arising from tax regulatory
requirements.
59
3.4.2 Record Keeping and Documentation
The difficulties of Malaysian SMEs in managing business laws (Kasipillai and Liew
2004), and specifically in maintaining appropriate records for business and taxation
purposes (Hanefah and Al-Mureshi 1991), are evident. More than 15 years ago,
Hanefah and Al-Mureshi (1991) observed that the predominant services provided by
accounting firms to small business clients are book-keeping and taxation. The lack of
proper records could cause small businesses to fail to comply with business taxation
requirements (Abdul-Jabbar 1996). On the contrary, Hanefah and Al-Mureshi (1991)
hypothesised that medium-scale enterprises may not have as many problems in this
aspect, but to what extent this remains true in the SAS environment has not been
researched.
Prior to the implementation of the SAS to individual taxpayers (i.e. before 2005), a
number of studies had been conducted which included self-employed taxpayers (see for
example Kasipillai et al. 1999; Ramasamy et al. 2003; Palil 2005a), and SMEs
(Hanefah and Al-Mureshi 1991). Overall, these studies showed that the issues relating
to book-keeping and documentation for tax purposes remain relevant. Even a salary
earner with a simple tax situation may have difficulties (Loo and Ho 2005; Palil 2005a),
and particularly self-employed business persons (small business) need to consider
obtaining external tax advice. The same may also apply to medium-sized firms, but not
as much to small firms. Thus, it is anticipated that additional record keeping
requirements (Section 82A) that were introduced since the implementation of the SAS
could further add to the existing record keeping responsibility (Section 82) of the SMEs,
small business in particular. More interestingly, with a government plan to introduce the
GST,56 maintaining additional records and documentation were completely essential.
56 In February 2006, the proposed GST was postponed indefinitely (Ministry of Finance Malaysia 2006b). See also Chapter One, Footnote 10.

60
3.4.3 Tax Complexity
Some degree of tax complexity for individual taxpayers, including those with business
income, was evident in Malaysia under the OAS (Hanefah 1996). Later, immediately
prior to the implementation of the SAS, Hanefah, Ariff and Kasipillai (2001, p. 96)
argued that the Malaysian business tax system appeared to be becoming increasingly
complex. Nonetheless, Ariff and Pope (2002) believed that some tax simplification
measures implemented towards the end of the 1990s and early 2000s had been of some
relief for Malaysian taxpayers, and thus considered the level of tax complexity in
Malaysia (determined by its compliance costs) as very low compared with other Asia–
Pacific countries, such as Australia, Hong Kong and Singapore (Ariff and Pope 2002, p.
9). The extent of tax complexity is yet to be examined under the SAS regime. However,
Kasipillai (2005, p. 26) observed that there is a growing list of deductions for various
forms of relief (such as deduction for reading materials and a relief for education,
serious disease, and parent medical expenses) for individuals, including small business
owners. He raised concern over the possible difficulties faced by taxpayers in
interpreting and taking advantage of the amendments.
A number of public rulings have been issued by the IRB since the SAS. Regrettably,
some of the rulings, for example, rulings on the basis period, have been revised and
amended within just a year of their initial introduction. The fact that a growing list of
public rulings may increase the tax complexity should be recognised. Chittenden,
Kauser and Poutziouris (2003, p. 110), in their review of the tax compliance cost studies
within small businesses in the US, the UK, Australia and New Zealand, noted that the
incompetency of small business (in particular) in dealing with complex tax regulations
has affected them more severely than large firms. A straightforward approach to lessen
such tax complexity issues, at least from the business taxpayer’s perspective, is by
outsourcing tax obligations to tax professionals, but this generally increases tax
compliance costs.57 Pope (1993b, p. 70) asserts that high costs of tax compliance are the
product of the complex nature of the tax system and low costs indicate otherwise.
57 See subsection 3.4.5.

61
3.4.4 Business Legal Form
Small and Medium Enterprises in Malaysia take three forms: self employed,
partnerships and companies. However, for income tax purposes, SMEs are treated either
as personal or as corporate taxpayers, depending on the business establishment.
Partnership businesses are not taxed directly, but their individual partners are subject to
personal income tax based on their income portion from the partnership business. A
brief summary of income tax treatment for corporate and personal taxpayers has been
presented earlier in this chapter.58 Arguably, the choice of business form is somewhat
troublesome to the SME sector as they need to consider the best business form to suit
their circumstances (see mainly Freedman 2003; Crawford and Freedman 2008),
particularly during the early stages of business establishment. From a taxation
perspective, consideration may entail two aspects, namely, the effective tax rates and
the investment incentives.
First, the effective tax rate of SME companies with a taxable income up to RM500,000
is 20 percent (2003 onwards). On the other hand, business individuals with a taxable
income (i.e. income after deductions of personal and other reliefs) of more than
RM179,000 will exceed 20 percent (2003 onwards). Secondly, corporate firms are often
entitled to various tax incentives in Malaysia. The incentives are available under the
Promotion of Investments Act (PIA) 1986 (such as pioneer status and investment tax
allowance) and ITA 1967 (such as reinvestment allowance and a deduction for pre-
incorporated expenses). Most of these incentives are not available for unincorporated
businesses, except in the agricultural sectors. The mechanism of incentives vary
depending on a number of factors, e.g. type of incentive, business sector and whether a
small-scale company or not. Regrettably, most of the incentives are mutually exclusive,
thus requiring an analysis of costs and benefits. For example, a company enjoying
pioneer status could not apply for other types of incentives. Businesses need to consider
a number of options that best suit their circumstances. Such numbers of tax incentives
almost certainly increases the complexity of the tax laws and ensuing tax compliance
costs.
58 See Section 3.3—Table 3.4.

62
Despite general tax advantages to personal business taxpayers, in terms of effective tax
rates (when taxable income is less than RM179,000) and to corporate taxpayers, in
terms of both tax rates (when taxable income exceeds RM179,000) and tax incentives, it
must be emphasised that the nature, duties and responsibility of all business taxpayers59
are similar regardless of their business form and size. In Malaysia, SMEs in the form of
companies seem to have relatively more tax advantages. Thus, the favourable tax policy
to corporate businesses is not surprising. In practice, however, the choice of business
form is not solely dependent on tax aspects. A number of business regulations and cost
considerations are probably essential. For example, the Companies Act 1965 requires
financial statements of Malaysian corporate entities, regardless of their size, to be
audited annually, thus incurring compliance costs in terms of financial reporting.
Complicating factors in considering and designing [income] tax provisions for small
businesses have been discussed by a number of authors (see mainly Freedman 2003;
Chittenden and Sloan 2007; Crawford and Freedman 2008). This includes the role and
effect of market failure; size disadvantages (which covers the compliance costs issue);
keeping the small business intact; and political economy considerations (Crawford and
Freedman 2008). They argue that favourable policies for small businesses are
acceptable primarily in the case of market failure, and to some extent due to compliance
costs considerations (Crawford and Freedman 2008). They found that the tax system
has a significant impact on the choice of business form in the UK. The UK experience
also shows that policy makers tend to overlook unincorporated entities (Freedman 2003,
p. 34) in this regard. Overall, a simple tax system (Freedman 2003), which focuses on
minimising tax compliance costs and lowering tax rates for all businesses (Pope 2008,
p. 34), is preferable to too many special provisions, which potentially leads to tax
complexity (Freedman 2003, p. 15) and distortion of the choice of business legal form
(Freedman 2003; Crawford and Freedman 2008).
59 See subsection 3.2.2.
63
3.4.5 Tax Compliance Costs
Malaysian businesses incur costs to comply with all mandatory tax requirements,60 and
related considerations,61 which are additional to their tax liability. The introduction of
the SAS was mainly motivated by the aim of increasing the collection rate, to reduce the
cost of collecting taxes, and to increase voluntary compliance (Kasipillai 2005, pp. 26-
27). The SAS environment involves a substantial shift of responsibility on to taxpayers
in terms of their compliance obligations, with tax professionals expected to play a
significant role in providing services to taxpayers in complying with the tax laws.
Consequently, compliance costs are expected to increase significantly during the early
years of the SAS implementation (Hanefah, Ariff and Kasipillai 2001; Ariff and Pope
2002; Mathieu, Waddams and Antwi 2007). In the longer term, the relative level of
compliance costs will depend upon a range of factors, particularly the complexity of the
tax laws and frequency of tax changes. As discussed in Chapter Two,62 prior to the
SAS, there were only two published studies on the cost of tax compliance in Malaysia
(Loh et al. 1997; Hanefah, Ariff and Kasipillai 2001). More importantly, both
confirmed the regressivity of tax compliance upon smaller business. The effect of the
SAS upon the compliance costs of Malaysian businesses is yet to be investigated. This
study updates compliance costs estimates for SMEs under the SAS regime.
3.5 CHAPTER SUMMARY
This chapter has presented details on income taxation, duties and responsibilities of
business taxpayers under the SAS regime. This covers the overall business perspective
and issues specific to the SME business sector. The burden of tax compliance, in
particular concerning business record keeping, the level of tax complexity, the choice of
legal entity, and more importantly the incidence of tax compliance costs, are among the
major income tax issues that face Malaysian SMEs.
60 See subsections 3.2.2 and 3.4.2. 61 See subsections 3.4.3 and 3.4.4. 62 See Chapter Two, subsection 2.3.2.
64
CHAPTER FOUR
RESEARCH DESIGN AND METHODOLOGY
4.1 INTRODUCTION
This chapter focuses on various features of the research plan and methodology adopted
in this study. As described in Chapter One, this study consists of two parts: the first
estimates the compliance costs of SME companies in Malaysia; the second examines
the determinants of corporate income tax compliance behaviour, with particular
emphasis on income tax compliance costs. The current study followed a positivist
paradigm to research, employing quantitative methods. The paradigm relies on
deductive reasoning, whereby researchers seek knowledge based on observed facts.
Most existing research in taxation has adopted a positivist approach (Abdul-Manaf
2004). The current research was carried out by way of the survey method, employing a
large-scale mail survey (primary survey) and two additional surveys. The next section
provides a brief background on the survey method in the context of social sciences, and
more specifically in the area of tax research. This is followed by a discussion on the
method of data collection adopted in this study. The questionnaire development and the
pilot interviews are then discussed, followed by a detailed explanation of the survey
implementation procedure undertaken. Particulars with regards to population of the
study, the sampling process and the issue of non-response bias are provided also. The
final section outlines the analytical methods adopted in this study.
4.2 SURVEY RESEARCH DESIGN
Survey research is the most widely employed method in the social sciences (Babbie
1989). The major advantage of survey research is the feasibility of obtaining a wide
range of standardized information from a large population, which is cost beneficial
(Babbie 1989, p. 258; Kerlinger and Lee 2000, p. 613). However, survey research does
have some key limitations, which include the lack of in-depth information, the fact that

65
it is demanding in terms of resources (Kerlinger and Lee 2000, pp. 613-614), and that it
may be lacking in realism (Babbie 1989, p. 258). Despite these limitations, the survey
method remains a popular method in the social sciences. Thus, it is not surprising this
method is the most commonly used in business research (Baruch 1999; Griffis, Goldsby
and Cooper 2003, p. 237), including small business (Dennis 2003; Bartholomew and
Smith 2006) and tax research as well. The latter includes studies on tax attitudes and
behaviour (Jackson and Milliron 1986; Richardson and Sawyer 2001) and tax
compliance costs (Sandford, Godwin and Hardwick 1989, p. 52).
In the tax compliance literature, a comprehensive review of Jackson and Milliron
(1986) and Richardson and Sawyer (2001) noted four methods that are mainly
employed in tax compliance studies: surveys, experiments, analytical approaches and
regression modelling. Up to 1985, the survey method was the most frequent method
used in the tax literature (Jackson and Milliron 1986). Thereafter, the trend continued
but with a slight increase in the experimental method. Nevertheless, the survey method
remained a popular method amongst tax compliance researchers (Richardson and
Sawyer 2001). It is possibly still the most popular research design in the tax compliance
literature. A recent publication by Torgler (2007) is also largely based on the survey
research method. During the period 1986 to 1997, the progress in the experimental
method was relatively significant and it became more popular than the survey method
(Richardson and Sawyer 2001). The most significant factor in this growth is the
increased realism in the experimental setting (Richardson and Sawyer 2001, p. 235).63
The methodological issues and the advances made in all four methods since 1985 have
been fully discussed by Richardson and Sawyer (2001, pp. 223-240). It suffices to say
that all four methods remain utilised in tax research and are subject to measurement
difficulties to some extent. The most alarming concerns the honesty and validity of self-
responses (Jackson and Milliron 1986; Richardson and Sawyer 2001).64 Nevertheless,
no empirical support exists to assert that one method is more accurate than the others
63 Realism could be incorporated into survey methods as well via hypothetical tax scenarios. See further discussion in Section 4.4.3. 64 Section 4.4.3 provides a brief discussion of the issue of self-reporting.

66
(Long and Swingen 1991). Likewise, the survey method is largely employed in
researching compliance costs, both internationally (Sandford, Godwin and Hardwick
1989; Pope 1995; Evans et al. 1996) and in the Asia–Pacific countries (Ariff and Pope
2002).
This study has incorporated both the tax compliance costs and tax compliance/non-
compliance issues into one study, although the emphasis is on the former. In view of
this, a survey research method is employed to obtain data on tax compliance costs and
attitudinal information on a number of tax aspects i.e. fairness, complexity and
behaviour. The introduction of the SAS has further influenced this current study to be
undertaken in the form of a large-scale survey. Malaysia is still in the initial phase of
developing compliance costs of taxation as a policy area. Sandford (1995, p. 402)
strongly asserts that, for the process of convincing the government of the importance of
tax compliance costs, a large-scale survey is the best starting point.
4.3 DATA COLLECTION METHOD AND STRATEGY
Survey data can be obtained in different ways, which include interviews (either face-to-
face or telephone), questionnaires (either administered personally, by mail, e-mail or
web) and panel discussion groups. The relative advantages and disadvantages of these
methods in social sciences, in particular the mail questionnaires, and personal and
telephone interviews, are discussed by Babbie (1989, pp. 253-254) and Miller (1991,
pp. 141-167). Broadly, a personal interview is superior to the other methods, but is the
most expensive and, perhaps, a difficult form of securing information (Miller 1991, p.
168; Kerlinger and Lee 2000, p. 601). On the contrary, mail questionnaires have
considerable advantages in terms of cost and ease of getting information (Miller 1991,
p. 140). Arguably, each of these data collection methods has its own advantages and
disadvantages. But evidence shows that surveys are more often carried out by mail than
by other approaches (Dillman 1991; Bartholomew and Smith 2006). As a general guide,
it is recommended that researchers weigh up the advantages and disadvantages of the
67
available methods in relation to their research context and resources (Babbie 1989;
Miller 1991; Sandford 1995, p. 386; Evans et al. 1996, pp. 24-15).
As a result, it is common for researchers to use any method, or a combination of
methods, that fit their specific circumstances and constraints. Numerous survey
approaches have been utilised in tax research, including mail questionnaires
(Wallschutzky 1984; Porcano 1988; Collins, Milliron and Toy 1992; Hite and McGill
1992; Reckers, Sanders and Roark 1994; Wartick 1994; Hasseldine 1999; Wenzel 2002;
Hasseldine and Hite 2003), self administered questionnaires (Song and Yarbrough
1978; Chan, Troutman and O'Bryan 2000; Webley, Cole and Eidjar 2001), face-to-face
interviews (Dornstein 1987), telephone interviews (Hite 1997) or a combination of at
least two approaches (Long and Swingen 1987). However, the use of mail surveys is
predominant. A similar trend is also observable in Malaysia.65 Apart from the coverage,
speed and cost factors, this predominance is also due to the realism of the approach, as
almost all tax authorities worldwide tend to rely on the mail system to communicate
with taxpayers (Wartick 1994; Hasseldine 1999).
As for specific tax compliance costs studies, Sandford, Godwin and Hardwick (1989 p.
52) have discussed the advantages and disadvantages of seven methods of estimating
compliance costs (1989, pp. 52-54): (i) highly structured questionnaires/interview
schedules; (ii) semi-structured or unstructured interviews; (iii) time and motion studies;
(iv) participant observation/action research; (v) other types of case study, e.g. studies of
the comprehensibility of tax forms; (vi) archive research by using records of
government department, tax advisers, etc; and (vii) simulation or modelling exercises.
Largely, tax compliance costs studies also use large-scale mail questionnaire studies
(Sandford, Godwin and Hardwick 1989; Sandford 1995, p. 378; Pope 2000, p. 10;
Evans 2003b, p. 71; Slemrod 2004a, p. 81) and are often supplemented by face-to-face
interviews and/or telephone interviews (Sandford, Godwin and Hardwick 1989, p. 52;
Sandford 1995, p. 404). The advantages and disadvantages of these methods,
65 See Appendix B column three.
68
particularly mail surveys and interview surveys, in tax compliance costs studies are
fully considered by Sandford, Godwin and Hardwick (1989, pp. 52-53) and Sandford
(1995, pp. 378-386).
Suffice it to say, cost-effectiveness is frequently cited as a key advantage of mail
questionnaires over interview surveys (Babbie 1989; Sandford, Godwin and Hardwick
1989; Miller 1991; Sandford 1995; Evans et al. 1996). Moreover, a mail survey adds
more weight in a sensitive area such as taxation, as the approach provides genuine
anonymity and eliminates the bias of the interviewer (Sandford 1995, p. 384; Evans et
al. 1996, p. 24). Additionally, the mail survey is also often preferred given the practical
difficulties of scheduling interviews with geographically scattered business respondents
(Vaillancourt 1989, p. 5). On the contrary, major weaknesses of mail surveys include
that they are distinctly centred on the response rate and the quality of responses (Miller
1991, p. 141; Sandford 1995, p. 378; Evans et al. 1996, p. 24; Kerlinger and Lee 2000,
p. 603). The importance of assessing whether non-respondents could differ in their
responses is largely acknowledged in the behavioural research literature (see for
example Armstrong and Overton 1977; Kerlinger and Lee 2000, p. 603).66 A similar
trend is also observable for both tax compliance (Jackson and Milliron 1986;
Richardson and Sawyer 2001) and tax compliance costs (Sandford, Godwin and
Hardwick 1989; Allers 1994; Pope 1995; Sandford 1995, p. 378; Evans et al. 1996, p.
24) studies. Nonetheless, a number of measures are available to minimise those possible
shortcomings, mainly response-related.
In the social sciences, more specifically in the field of business and organisational
research, the Total Design Method (TDM)67 developed by Dillman (1978) is often used
to gain fully the benefits of a mail survey. The TDM was subsequently expanded and
known as the Tailored Design Method (Dillman 2000). The expansion was made to
adapt the original TDM to different survey situations, including business surveys.
66 The issue of a non-response bias is addressed in Section 4.9. In tax compliance costs study, Allers (1994) is the first to address the issues of non-response statistically. 67 Dillman (2007, Chapter 10, pp. 323-351) discussed a number of differences between individual and business surveys and stressed the importance of placing additional concern on the context of business studies.

69
Dillman (2007, pp. 323-351) discussed a number of differences between individual and
business surveys and stressed the importance of placing additional concern on the
context of business studies. The TDM strategy provides comprehensive guidance
focusing on three major specific survey areas, namely, principles for writing questions
(pp. 32-78), principles for designing the questionnaire (pp. 79-148) and detailed
implementation procedures (pp. 149-193). The approach in general consists of the
following five key elements: (i) a respondent-friendly questionnaire, (ii) repeated
mailings of up to five contacts with the respondent, (iii) an inclusion of stamped return
envelopes, (iv) a personalised correspondence, and (v) a prepaid financial incentive.
In the context of small business, Forsgren (1989) recommends the researcher use
altruistic appeal in the covering letter, consider proper design of the questionnaire and
assure anonymity for a sensitive study as further measures that could possibly increase
the response rate. In another recent development, Dennis (2003) argues that not all
measures had improved the response rate. Dennis recognises only four specific
measures, namely follow-ups and reminders, monetary incentives, university
sponsorship and stamped return envelopes, as consistently improving the response
rates.68
As for specific tax research, strategies to improve response rates and quality are
frequently highlighted in the tax compliance costs literature as compared to tax
compliance research. A review of major international tax compliance costs studies,
mostly undertaken in the late 1980s and early 1990s, by Sandford (1995, pp. 378-379)
highlighted the following 17 considerations as improving the rate and quality of the
responses:
i. Clear wording of the questions.
ii. Careful layout and design of the questionnaire.
iii. Questionnaire length being as short as possible.
iv. Backing of relevant people and organisations.
68 For a detailed list, particularly of the other two categories, refer Table 1 in Dennis (2003, p. 282).

70
v. Personalising the cover letters for the questionnaire.
vi. Providing a reply paid envelope.
vii. Promising confidentiality and anonymity.
viii. Carrying out a pre-pilot test.
ix. Carrying out a pilot survey very carefully.
x. Appropriate timing of the survey.
xi. Sending two reminders, and enclosing a further copy of questionnaire in the
second reminder.
xii. Scrutinizing and validating the responses.
xiii. Selecting an advisory committee.
xiv. Obtaining advance publicity.
xv. Sending photo-montage press cuttings with the reminder.
xvi. Using a telephone reminder.
xvii. Making available a pre-paid telephone help line.
In the Australian context, Pope (1995, pp. 110-111) emphasised a number of other
specific aspects that are worth considering, which include: using a single page
questionnaire of four pages (printed in coloured paper and folded into a booklet format);
discussing the questionnaire with tax experts, tax officials and tax academics;
investigating attitudes and opinions (using a five-point or seven-point Likert scale);
offering respondents an opportunity to express their views (by asking a few open-ended
questions at the end of the questionnaire); and also giving respondents the option of
providing their contact details. Another major recent comprehensive Australian study
by Evans et al. (1996, p. 25) also provide incentives in order to address the issue of
possible low responses.
To a large extent, all the above specific measures in the area of small business and tax
studies are comparable to the TDM strategy. All tax compliance costs studies in
Singapore, Malaysia and Hong Kong tended to benefit from Pope’s approach (Ariff and
Pope 2002). Even a recent study by Rametse (2006) in the Australian GST context
followed Pope’s approach.

71
It is apparent that the above discussions tend to substantiate the use of a large-scale mail
survey in the current study from several research perspectives, namely SMEs, tax
compliance behaviour, and tax compliance costs. Specifically, a mail survey approach
appears to be the most appropriate method, mainly on the ground that the study covers a
large population of SMEs nationwide, which can be achieved within reasonable cost
and speed. Additionally the current study deals with corporate business taxation. A mail
survey approach as recommended by Sandford (1995, p. 385) was therefore adopted.
However, recognising that there are a few major pitfalls to large-scale mail surveys,
additional measures and strategies have become pre-requisites to improving the
response rate, the quality of the response, and to reduce non-responses as well.
Accordingly, this study is conducted with a careful consideration of the measures
highlighted above. Broadly, the following specific measures were adopted in this study:
i. Questions were worded carefully, were kept as short as possible and were easy to
respond to.
ii. Questionnaire layout and design was based on a technique mainly suggested by
Pope (1995) and Dillman (2007), including bold print for questions, light print for
answer choices, and white boxes for answer spaces.
iii. A separate covering letter, which was hand signed, was used in both initial mail
outs and in the second reminders.
iv. The support of SMIDEC was obtained and was stated in the covering letter.
v. The study was conducted with the University Utara Malaysia (UUM) affiliation.
vi. The official stationeries of the UUM (i.e. letter head, outgoing envelopes, and
reply paid envelopes) were used in all mailings, except for postcards, which were
printed using the UUM logo.
vii. Anonymity is assured in both the covering letter and in the questionnaire.
viii. The covering letters and outgoing envelopes are personalised as possible in all
three mailings.
ix. A two reminders system was used, with a further copy of the questionnaire
enclosed in the second reminder.
x. A stamped return envelope was provided.

72
xi. Appropriate timing of the survey was considered.
xii. A pilot survey via personal interviews with tax experts and tax academics was
conducted.
xiii. Contact details of the researcher, both official (telephone, address and e-mail
address) and a personal mobile number were made available for any queries.
xiv. Attitudes and opinions were investigated using a five-point Likert scale.
xv. Respondents were given an opportunity to express their views to a number of
open-ended questions.
xvi. Respondents were given the option of providing their contact details.
xvii. Responses were scrutinized and validated.
More details with regards to the above measures are incorporated in the later three
subsections,69 covering the development of the questionnaire, pilot interviews and
survey implementation. Sandford strongly urged researchers to consider some
interviews, particularly in the initial stage (i.e. before carrying out mail survey), to be
followed by a further interview, mainly to clarify responses (Sandford 1995, p. 404).
Accordingly, this current study also used a personal interview approach during the pilot
stage and a telephone follow-up interview during the data validation stage.
Besides the above mail survey (main survey), a web-survey has been undertaken by an
e-mail invitation to all corporate SMEs with an e-mail address. Having acknowledged
that the web survey could be carried out to increase the sample size, and most
importantly, with no significant additional costs, the additional web survey is employed
in the current study. The findings of the web survey can be used as a measure of the
consistency of the mail survey.70
69 See Sections 4.5, 4.6 and 4.7. 70 See subsection 4.11.1 for further details of the web survey.
73
4.4 MEASUREMENT ISSUES AND APPROACH
4.4.1 Estimating Compliance Costs
Estimating tax compliance costs seems straightforward, perhaps in theory. In a simple
form, the compliance costs of a taxpayer are equal to internal costs plus external costs.71
Unfortunately, this raises a few measurement concerns in practice (Sandford, Godwin
and Hardwick 1989), which are associated with the valuation of internal time, treatment
of overheads or joint costs, the unit of measurement (either physical quantity, monetary
or costs ratio), the validity of survey estimates, measurement of psychological costs,
and the possible offsets and benefits of compliance (Sandford, Godwin and Hardwick
1989, p. 14 and pp. 35-39; Pope 1993a, pp. 43-59; Allers 1994, pp. 51-56; Pope, Fayle
and Chen 1994, pp. 27-28; Sandford 1995, pp. 394-400; Evans et al. 1996, pp. 15-16).72
These issues have been of considerable concern to tax compliance costs researchers,
especially during the early years of modern tax compliance costs research (1980s and
1990s). Currently, the issues are still relevant and perhaps impossible to resolve
completely. However, to a large extent, suggestions made and approaches adopted to
address these issues are now providing clearer direction and guidance in estimating
compliance costs.
The main issues relate to internal time valuations and joint costs (Sandford 1995, p.
394), which are highlighted by almost all key tax compliance costs researchers
(Sandford, Godwin and Hardwick 1989; Allers 1994; Pope, Fayle and Chen 1994;
Evans et al. 1996). The issue of time valuation is noticeably debatable in the case of
personal income tax, including those with business income, but does not arise for
corporate business taxpayers (Pope, Fayle and Chen 1994, p. 27), since the appropriate
wage rate could be imputed in the estimates (Allers 1994; Pope, Fayle and Chen 1994).
Specifically, Pope, Fayle and Chen (1994) and Allers (1994) use respondents’ estimates
of time spent and hourly wage rate (for various personnel levels) to value the internal
time costs, whereas, Evans et al. (1997, pp. 38 - 40) exploit the market rate as a basis
71 See definition of compliance costs in Chapter One, subsection 1.5.2. 72 For a detailed discussion, refer to these references.
74
for their valuation. Both approaches add reliability to the estimates as those rates could
be checked against internal or external information (Sandford and Hasseldine 1992, p.
25; Sandford 1995, p. 398), which consequently permit extreme values adjustment
(Allers 1994, p. 54; Pope 1995, p. 114) as well.
The current study deals with corporate business taxpayers and, thus, for the first issue,
follows a similar approach (respondents’ estimates of time spent and hourly wage rate)
advocated by Pope, Fayle and Chen (1994) in valuing and estimating the internal time
costs spent by companies. The technique was successfully applied in all prior studies in
the Asia–Pacific countries, including Malaysia (Ariff and Pope 2002).
The second issue is associated with the treatment of overhead costs, particularly for
joint costs. Theoretically, the relevant portion of the costs should be included as part of
the compliance costs (Sandford, Godwin and Hardwick 1989, p. 14; Sandford 1995, p.
396). However, a common practice in tax compliance studies is to exclude the overhead
costs. Sandford (1995, p. 396) and Evans et al. (1997, p. 29) assert that excluding
overhead costs is perhaps reasonable to small businesses, given that the effect could be
insignificant. Normally, prior studies excluded the overhead costs, either by requiring
the respondents to exclude the overhead costs and/or by necessitating them to consider
entirely a direct cost on specific activities or taxes (Sandford, Godwin and Hardwick
1989, p. 268; Sandford and Hasseldine 1992, p. 132; Pope, Fayle and Chen 1994; Evans
et al. 1997; Rametse 2006). As for the other costs, i.e. overhead costs, Sandford et al.
(1989, p. 268), Pope et al. (1994, question 14) and more recently Rametse (2006,
question 15), had also asked respondents to state the cost’s nature and the amount
involved. The current study pursued a similar approach to Sandford et al. (1989) and
Pope et al. (1994) in dealing with the joint costs issue. Specifically, the respondent is
asked to exclude the overhead costs while considering their internal time spent on tax
work, but a further question is asked to elicit information on other non-staff (additional)
costs.

75
Other issues, such as measuring psychological costs, though recognised in the literature
(Allers 1994, p. 55; Pope, Fayle and Chen 1994, p. 26; Sandford 1995, p. 400) are
highly debatable and yet to be established. Moreover, psychological costs are
considered as not part of the ‘pure’ compliance costs (Evans et al. 1997, p. 3). Hence,
the current study omitted psychological costs.
4.4.2 Benefits of Tax Compliance
As presented earlier,73 the tax compliance literature recognises three offsetting benefits
of tax compliance: managerial benefits, tax deductibility and cash flow benefits
(Sandford, Godwin and Hardwick 1989, pp. 13-14). Compliance costs were further
broken into gross compliance costs and net compliance costs.74 The approach adopted
with regards to these benefits is discussed next.
Managerial Benefits
Managerial benefits for companies are less considerable, as a company is required to
carry out record keeping activities mainly for financial purposes (Sandford, Godwin and
Hardwick 1989, p. 144). Thus, it is normal to exclude managerial benefits in the
corporate tax compliance costs study (Sandford, Godwin and Hardwick 1989) and even
in the study of other taxes (such as VAT and income tax of business individuals) as well
due to measurement difficulties (Sandford, Godwin and Hardwick 1989, p. 14; Pope,
Fayle and Chen 1994, p. 28; Tran-Nam 2001). Nonetheless, two UK studies (Sandford
et al. 1981; National Audit Office 1994) have estimated the value of managerial
benefits for VAT taxpayers. In Australia, two recent studies (Rametse 2006; Lignier
2008) have also attempted to quantify managerial benefits to their sample of business
taxpayers.75
73 See Chapter One, subsection 1.5.2. 74 See Chapter One, subsection 1.5.2. 75 It must be emphasised that valuation of managerial benefits is not the main aim of their respective studies.
76
Tax Deductibility
Allers (1994) and Evans et al. (1997) highlighted that part of the compliance costs,
which are directly associated with taxable profits, is tax deductible. The deductibility of
external and incidental costs is justified (Allers 1994, p. 40; Evans et al. 1997, p. 12).
On the other hand, the deductibility of internal time costs is somewhat arguable (see
Allers 1994, p. 40), especially in the case of personal taxpayers. As a result, previous
studies normally consider internal time spent as disallowable in the case of personal
taxpayers, including those with business income (Allers 1994; Evans et al. 1997). Allers
adopted a conservative approach by disallowing internal time costs even for a business
taxpayer (1994). Conversely, Evans et al. (1997, p. 12) argue that all tax compliance
costs are tax deductible. In the case of corporate SMEs, it is reasonable to assume that
the work of an owner-manager and/or their employees is often business-related. As
demonstrated by Evans et al. (1997), it is best to treat the internal time costs as tax
deductible. Following this, the current study considered all three tax compliance cost
components (i.e. internal time costs, external tax fees and additional non-staff costs) as
tax deductible. However, similar to Evans et al, (1997) non-taxable SMEs are assumed
to gain only 50 percent of the tax deductibility benefit.
Cash Flow Benefit
Under the SAS, income tax is charged on a current year basis and corporate income tax
is payable in 12 advance monthly instalments plus a final payment (if any) within six
months after the end of the accounting period. It is normal to assume that profits are
accruing evenly throughout the accounting period and the cash flow benefit dates from
when the profit is actually earned (Sandford, Godwin and Hardwick 1989, p. 144; Pope,
Fayle and Chen 1994, p. 70). As such, no cash flow benefits are presumed for a monthly
tax instalment as the instalments are related to their relevant profit period. However, a
cash flow benefit (or loss) may arise if there is a final payment (or a refund situation).
The cash flow benefits value is largely dependent on the amount of final tax payment,
the time interval between profit derivation and tax payment, and the relevant interest
rate. It is important to note that the monthly instalment is dependent on the estimated
tax liability of each company and the amount is allowed to be revised further, either in
77
the sixth or ninth month. The actual tax liability will be available only after the end of
the accounting period, but before the end of a further six months period. Theoretically,
the timing of this study permits the gathering of such information. But, on the other
hand, it is most likely that requiring such detailed information on tax payments could
significantly affect the response rate of the study. Thus, respondents are required only to
estimate their range of tax liability (not the actual amount). As a result, data availability
does not permit estimates of the value of the cash flow benefit (or loss). Even if all
necessary data is available, the value of cash flow benefit (or loss) is most likely to be
very small as the majority of SMEs’ respondents in the current study estimated their tax
level at either nil (24 percent) or up to RM100,000 (60 percent).
4.4.3 Measuring Compliance Behaviour
Measuring tax compliance behaviour is extremely difficult and the most challenging
task in the field of taxation (Long and Swingen 1991, p. 655; Webley et al. 1991, p. 29;
Hasseldine and Li 1999, p. 98). Tax compliance literature largely noted three
approaches in measuring the non-compliance behaviour of an individual taxpayer;
namely, self-reports, experimental and tax audits (Long and Swingen 1991, p. 657;
Elffers, Robben and Hessing 1992, p. 546). The self-report and experimental methods
are taxpayer-oriented, whereas tax auditing is return-oriented. Under the self-report
method, taxpayers are asked to report their filing behaviour, which could be asked
directly (first person) and/or indirectly (third person). The experimental method requires
taxpayers to make compliance decisions in an experimental setting (normally in a lab
setting). On the other hand, tax auditing relies on actual facts and data from the tax
authorities that are available within, and/or compiled through, audit activities (for a
comprehensive discussion refer to Long and Swingen 1991, pp. 657–664).
Self reporting is the most common method in tax research (Webley et al. 1991, p. 30;
Elffers, Robben and Hessing 1992, p. 546; Fischer, Wartick and Mark 1992; Hasseldine
and Li 1999, p. 98) and is relatively easy, less costly, with less ethical concerns, and
most importantly, perhaps the best available practical option (Weigel, Hessing and
Elffers 1987, p. 217). On the contrary, Collins, Milliron and Toy (1992, p. 6)

78
acknowledged the fact that no single approach is superior to others. Despite some
methodological limitations, for example, some form of distortion and social desirability
bias (Long and Swingen 1991; Webley et al. 1991; Elffers, Robben and Hessing 1992),
self-reporting has been extensively used in measuring tax non-compliance, both
internationally and in Malaysia. It is often operationalised either by requiring responses
to past evasion behaviours and/or hypothetical or experimental tax scenarios. Kirchler
and Maciejovsky (2001, p. 181) assumed that the use of a scenario describing possible
actions of a third party (indirect measure) can reduce the possible social desirability
bias. A summary of prior studies of individual taxpayers who had used the self-
reporting method, either relating to taxpayers’ past evasion behaviour, hypothetical tax
behaviour, or both, is presented in Table 4.1.
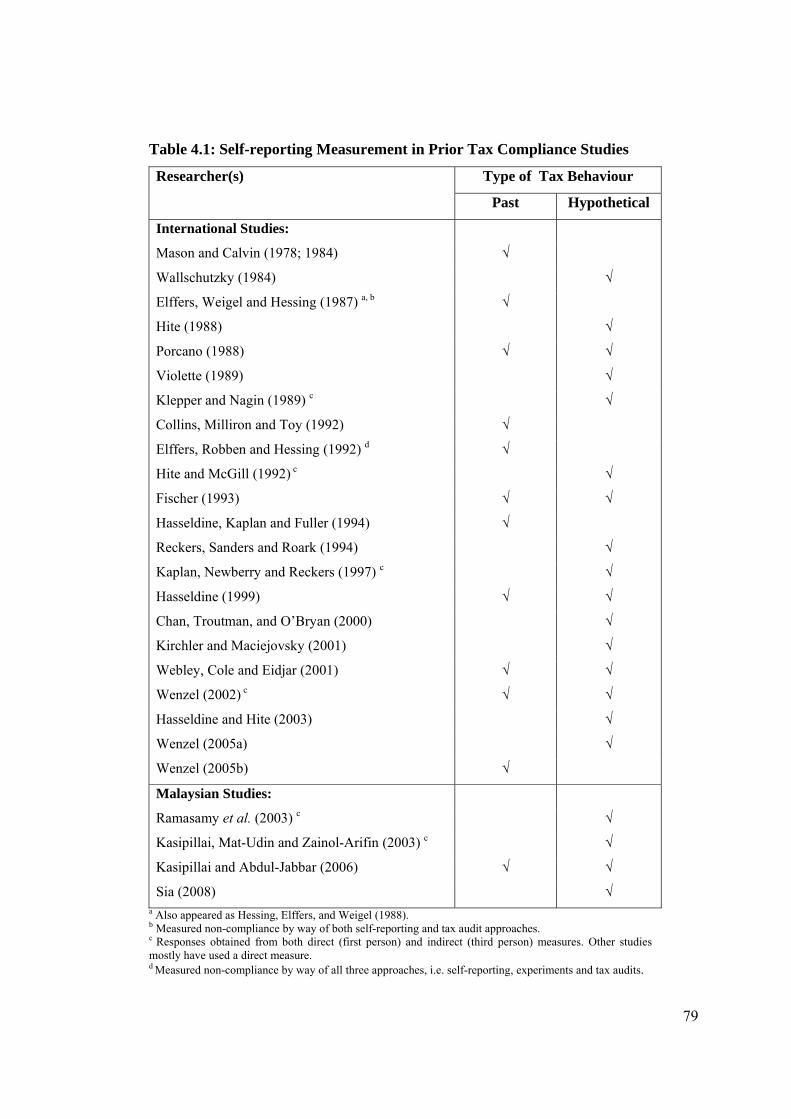
79
Table 4.1: Self-reporting Measurement in Prior Tax Compliance Studies
Researcher(s) Type of Tax Behaviour
Past Hypothetical
International Studies:
Mason and Calvin (1978; 1984) √
Wallschutzky (1984) √
Elffers, Weigel and Hessing (1987) a, b √
Hite (1988) √
Porcano (1988) √ √
Violette (1989) √
Klepper and Nagin (1989) c √
Collins, Milliron and Toy (1992) √
Elffers, Robben and Hessing (1992) d √
Hite and McGill (1992) c √
Fischer (1993) √ √
Hasseldine, Kaplan and Fuller (1994) √
Reckers, Sanders and Roark (1994) √
Kaplan, Newberry and Reckers (1997) c √
Hasseldine (1999) √ √
Chan, Troutman, and O’Bryan (2000) √
Kirchler and Maciejovsky (2001) √
Webley, Cole and Eidjar (2001) √ √
Wenzel (2002) c √ √
Hasseldine and Hite (2003) √
Wenzel (2005a) √
Wenzel (2005b) √
Malaysian Studies:
Ramasamy et al. (2003) c √
Kasipillai, Mat-Udin and Zainol-Arifin (2003) c √
Kasipillai and Abdul-Jabbar (2006) √ √
Sia (2008) √ a Also appeared as Hessing, Elffers, and Weigel (1988). b Measured non-compliance by way of both self-reporting and tax audit approaches. c Responses obtained from both direct (first person) and indirect (third person) measures. Other studies mostly have used a direct measure. d Measured non-compliance by way of all three approaches, i.e. self-reporting, experiments and tax audits.

80
As for corporate taxpayers, an earlier discussion on corporate compliance behaviour76
highlighted five studies that targeted the corporate sector (Rice 1992; Kamdar 1997;
Mills 1998; Joulfaian 2000; Hanlon, Mills and Slemrod 2005). All those five studies
were conducted in the US, and mainly using data from the IRS to measure corporate tax
behaviour.
In Malaysia, no micro data is available publicly for either individual or corporate
taxpayers. Generally, tax data is published by the IRB (by way of an annual report) and
the Treasury or Central Bank (by way of economic reports). Other government
agencies, particularly the Department of Statistics, normally reproduce this general data.
Thus, the audit-based approach is almost impossible without the full cooperation of the
IRB. Up until now, perhaps only two studies have used the IRB official data, but
confined to individual taxpayers. Both studies were carried out by IRB officers (Abdul
2003; Sia et al. 2008). Therefore, researchers are left with a taxpayer-oriented approach,
either the self-report or experimental methods. To what extent these options could be
applied to the context of the company as a taxpayer is debatable. Slemrod (2004a, p. 83)
argued that the tax situation of both companies and owners is closely related,
particularly in small business. Along the same lines, Joulfaian (2000, p. 698) drew the
conclusion that non-compliant firms are more likely to be managed by executives who
have failed to comply with personal income tax (measured using TCMP data) than are
compliant firms. He has urged tax researchers to incorporate managerial preferences
into the study of corporate tax compliance (Joulfaian 2000, p. 701).
The concept of managerial preferences assumes that the corporate behaviour of SMEs is
influenced by actions and preferences made by their executives. Following suggestions
by Joulfaian (2000) and Slemrod (2004a), this study utilised the concept of managerial
preferences as a proxy to measure corporate compliance behaviour. However, as
discussed earlier,77 a large-scale mail survey was considered from several possible
research and methodological perspectives. An experimental method was not employed
76 Refer Chapter Two, subsection 2.2.1. 77 See Section 4.3.
81
as all previous studies have tended to use students as experimental subjects, which
solely relates to individual taxpayers. Accordingly, self-reporting is considered the most
appropriate technique as the current study focused exclusively on the corporate tax
behaviour of Malaysian SMEs. It is important to note that the use of hypothetical tax
scenarios in the survey increased realism by incorporating one of the key elements of
the experimental method, to some extent. Indeed, Hasseldine and Hite (2003, p. 522)
described this approach as a mail field experiment.
Having decided to measure non-compliance behaviour via the self-reporting method,
the specific types of non-compliance to be measured and the hypothetical scenarios to
be given are considered next. The tax literature strongly emphasised the need for a
separate analysis of the various forms of non-compliance (Long and Swingen 1991, p.
664; Richardson and Sawyer 2001, p. 224). There are relatively more studies that have
measured both understatement of income and overstatement of deductions in a single
study, as shown in Table 4.2. The Malaysian studies, though very few in number, show
a similar pattern.

82
Table 4.2: Specific Types of Non-compliance in Prior Tax Compliance Studies
Researcher(s) Specific Behaviour Measured
Understatement
of Income
Overstatement
of Deductions
International Studies:
Mason and Calvin (1978; 1984) a √ √
Wallschutzky (1984) √
Elffers, Weigel and Hessing (1987) √ √
Hite (1988) √
Porcano (1988) a √ √
Klepper and Nagin (1989) √ √
Violette (1989) √
Collins, Milliron and Toy (1992) √ √
Elffers, Robben and Hessing (1992) √ √
Hite and McGill (1992) √
Fischer (1993) √ √
Hasseldine, Kaplan and Fuller (1994) √ √
Reckers, Sanders and Roark (1994) √
Kaplan, Newberry and Reckers (1997) √
Hasseldine (1999) √ √
Chan, Troutman and O’Bryan (2000) √ √
Kirchler and Maciejovsky (2001) √ √
Webley, Cole and Eidjar (2001) √ √
Wenzel (2002) √ √
Hasseldine and Hite (2003) √
Wenzel (2005a) √
Wenzel (2005b) √ √
Malaysian Studies:
Ramasamy et al. (2003) a √ √
Kasipillai, Mat-Udin and Zainol-Arifin (2003) a √ √
Kasipillai and Abdul-Jabbar (2006) √ √ a The study also measured failure to submit a tax return as specific non-compliance behaviour.
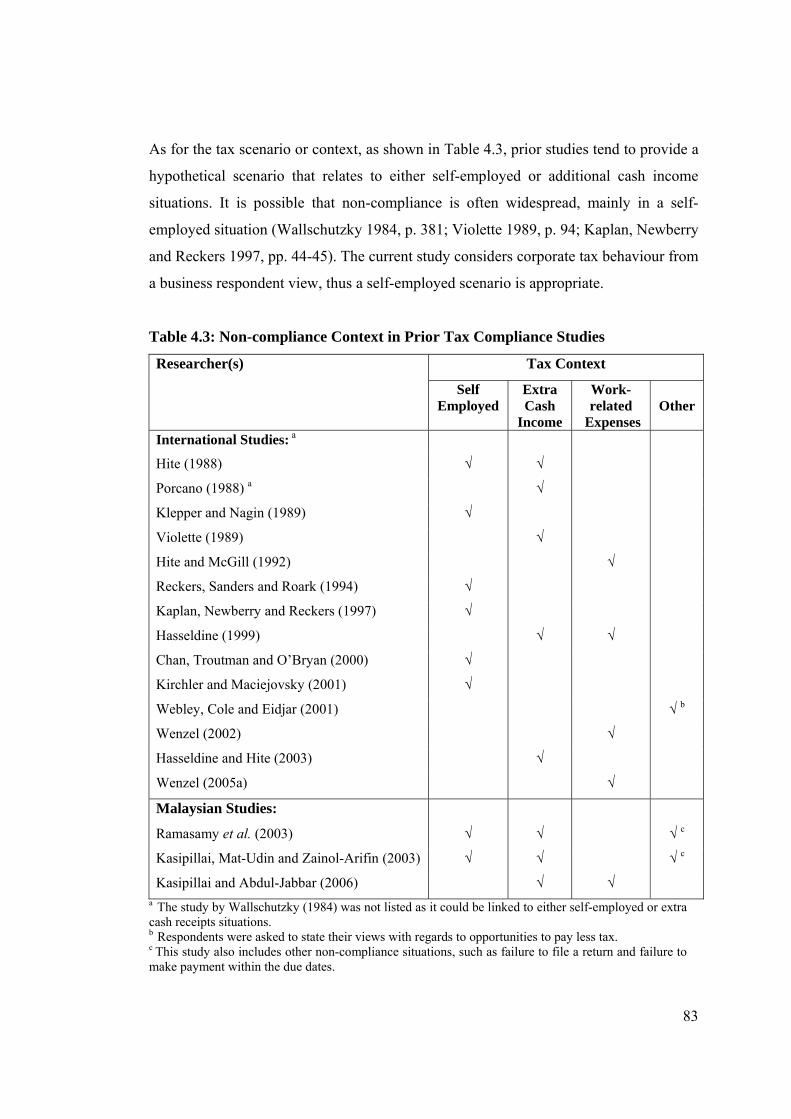
83
As for the tax scenario or context, as shown in Table 4.3, prior studies tend to provide a
hypothetical scenario that relates to either self-employed or additional cash income
situations. It is possible that non-compliance is often widespread, mainly in a self-
employed situation (Wallschutzky 1984, p. 381; Violette 1989, p. 94; Kaplan, Newberry
and Reckers 1997, pp. 44-45). The current study considers corporate tax behaviour from
a business respondent view, thus a self-employed scenario is appropriate.
Table 4.3: Non-compliance Context in Prior Tax Compliance Studies
Researcher(s) Tax Context
Self Employed
Extra Cash
Income
Work- related
Expenses
Other
International Studies: a
Hite (1988) √ √
Porcano (1988) a √
Klepper and Nagin (1989) √
Violette (1989) √
Hite and McGill (1992) √
Reckers, Sanders and Roark (1994) √
Kaplan, Newberry and Reckers (1997) √
Hasseldine (1999) √ √
Chan, Troutman and O’Bryan (2000) √
Kirchler and Maciejovsky (2001) √
Webley, Cole and Eidjar (2001) √ b
Wenzel (2002) √
Hasseldine and Hite (2003) √
Wenzel (2005a) √
Malaysian Studies:
Ramasamy et al. (2003) √ √ √ c
Kasipillai, Mat-Udin and Zainol-Arifin (2003) √ √ √ c
Kasipillai and Abdul-Jabbar (2006) √ √ a The study by Wallschutzky (1984) was not listed as it could be linked to either self-employed or extra cash receipts situations. b Respondents were asked to state their views with regards to opportunities to pay less tax. c This study also includes other non-compliance situations, such as failure to file a return and failure to make payment within the due dates.
84
4.5 QUESTIONNAIRE DESIGN
This section discusses the survey instrument used in the current study. To a large extent,
the advice and suggestions made by a number of authors in the field of survey methods
(mainly Dillman 1978; Fowler 1995, pp. 78-103; Dillman 2007) and tax compliance
costs research (mainly Pope 1993a; Sandford 1995; Evans et al. 1997) were considered
in writing and designing the questionnaire. Additionally, a number of available
questionnaires (in part or in full) from both tax compliance (Christensen, Weihrich and
Gerbing 1994; Roberts 1994; Hanefah 1996; Hasseldine 1999; Ramasamy et al. 2003;
Abdul-Manaf 2004) and compliance costs (Sandford and Hasseldine 1992; Hanefah,
Ariff and Kasipillai 2001; Slemrod and Venkatesh 2002) studies were also considered
carefully. A copy of the survey questionnaire used is available in Appendices F (the
English version) and G (the Malay version). The final survey questionnaire was divided
into four sections, referred to as Sections A to D.
Section A of the questionnaire (questions 1 to 8) was designed to obtain the
characteristics of an SME company, which among other things includes the company’s
sector, size (by both sales and staff criteria) and the estimated tax liability. Section B
(questions 9 to 13) was designed to obtain information that was used to estimate the
income tax compliance costs. Respondents were required to estimate their compliance
costs to all three cost components, i.e. internal time spent (and appropriate wages rate
by staff category), additional non-staff costs, and external tax fees. This section also
elicited information with regards to tax-related difficulties faced by the company, the
main reason for using external tax professionals and the approximate proportion of
income tax routine and planning work. The section mainly drew on the prior business
income tax compliance costs surveys, in particular studies by Pope, Fayle and Chen
(1994) and Hanefah, Ariff and Kasipillai (2001). The Pope et al. study was considered
as an important reference since it is a specific compliance cost study on companies. The
study by Hanefah et al. is confined to Malaysian SME companies. All requested
information, for both Sections A and B, is related to the financial year and/or tax year
2006.
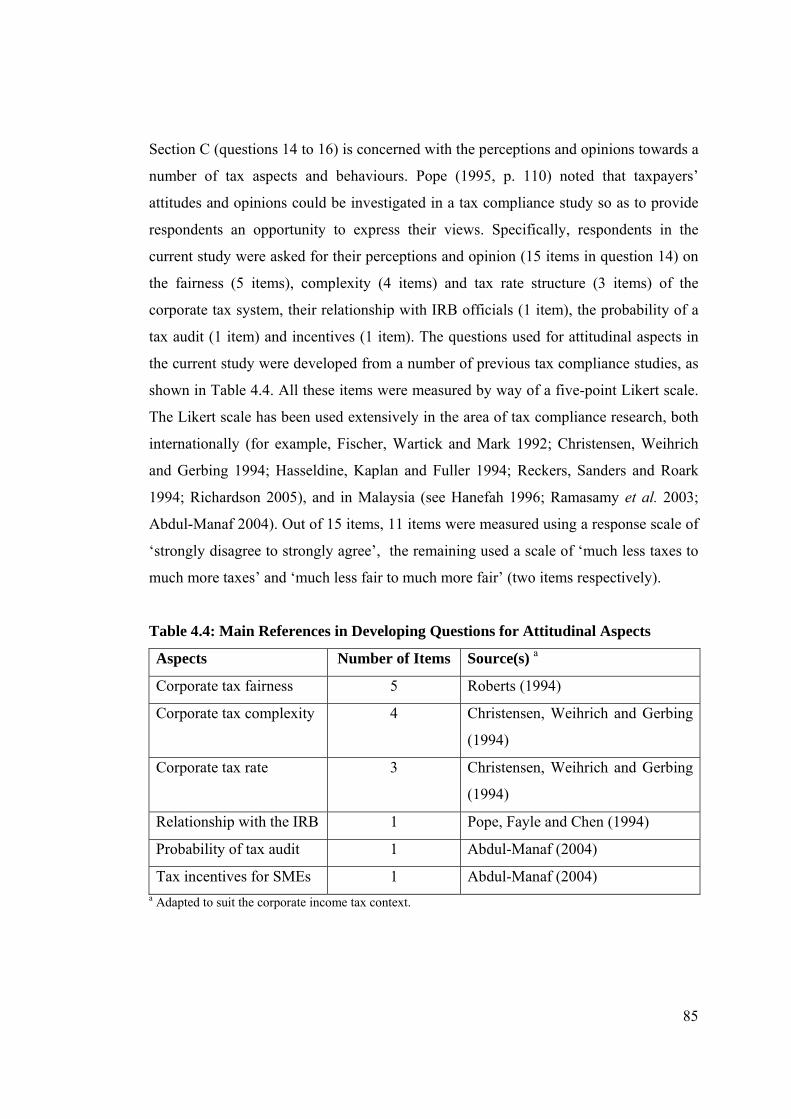
85
Section C (questions 14 to 16) is concerned with the perceptions and opinions towards a
number of tax aspects and behaviours. Pope (1995, p. 110) noted that taxpayers’
attitudes and opinions could be investigated in a tax compliance study so as to provide
respondents an opportunity to express their views. Specifically, respondents in the
current study were asked for their perceptions and opinion (15 items in question 14) on
the fairness (5 items), complexity (4 items) and tax rate structure (3 items) of the
corporate tax system, their relationship with IRB officials (1 item), the probability of a
tax audit (1 item) and incentives (1 item). The questions used for attitudinal aspects in
the current study were developed from a number of previous tax compliance studies, as
shown in Table 4.4. All these items were measured by way of a five-point Likert scale.
The Likert scale has been used extensively in the area of tax compliance research, both
internationally (for example, Fischer, Wartick and Mark 1992; Christensen, Weihrich
and Gerbing 1994; Hasseldine, Kaplan and Fuller 1994; Reckers, Sanders and Roark
1994; Richardson 2005), and in Malaysia (see Hanefah 1996; Ramasamy et al. 2003;
Abdul-Manaf 2004). Out of 15 items, 11 items were measured using a response scale of
‘strongly disagree to strongly agree’, the remaining used a scale of ‘much less taxes to
much more taxes’ and ‘much less fair to much more fair’ (two items respectively).
Table 4.4: Main References in Developing Questions for Attitudinal Aspects
Aspects Number of Items Source(s) a
Corporate tax fairness 5 Roberts (1994)
Corporate tax complexity 4 Christensen, Weihrich and Gerbing
(1994)
Corporate tax rate 3 Christensen, Weihrich and Gerbing
(1994)
Relationship with the IRB 1 Pope, Fayle and Chen (1994)
Probability of tax audit 1 Abdul-Manaf (2004)
Tax incentives for SMEs 1 Abdul-Manaf (2004) a Adapted to suit the corporate income tax context.
86
As for compliance behaviour, two types of non-compliance behaviour, namely
understatement of income (question 15) and overstatement of deductions (question 16),
were measured by presenting an independent hypothetical tax scenario respectively.
Both tax scenarios deal with a self-employed business situation and required three
responses (i.e. sub questions a, b and c) for each scenario. Indirect (third person)
responses were required for sub-questions (a) and (c). On the other hand, sub-question
(b) necessitated a direct (first person) response. A combination of both direct and
indirect measures was recommended by Kaplan, Newberry and Reckers (1997) to
mitigate the sensitive nature of the study. As for an indirect response, respondents were
asked to judge the probability of non-compliance behaviour of the person (third person)
described in the scenario. The probability ranges from zero to 100 percent, with a 10
percent interval for each, and adapted from prior studies (Violette 1989; Hasseldine and
Kaplan 1992; Kaplan, Newberry and Reckers 1997). For a direct (first person) answer,
the respondents were asked to indicate their extent of agreement and/or disagreement by
way of a five-point Likert scale between strongly disagree (1) and strongly agree (5) to
the possible action of non-compliance behaviour of the person described in the scenario.
The earlier Malaysian studies also used a similar response category (Kasipillai, Mat-
Udin and Zainol-Arifin 2003; Ramasamy et al. 2003).
Section D covers general comments and suggestions with regards to the tax compliance
burden. This section solicited respondents’ views on the relative level of compliance
costs (mainly to test non-response bias),78 given the possible amount of the claim from
government that could compensate compliance costs incurred by the their companies,
and also specific suggestions to reduce SMEs’ tax preparation work, plus other
comments and/or suggestions relating to the taxation of SME companies. This section
also requested respondents to indicate their position in the company. This procedure has
enabled the researcher to make follow-up phone calls in the process of data validation.79
78 The issue of non-response bias was addressed specifically in Section 4.9. 79 See Appendix P.
87
A respondent-friendly questionnaire is one of the five elements of the TDM method.
Dillman had stressed the importance of questionnaire design, in particular with regards
to a self-administered questionnaire (2007, p. 95). He urged researchers to consider a
number of principles with regards to writing (pp. 50-77) and designing the
questionnaire (pp. 96-134). Major writing principles that have been adopted in the
current study include the use of simple words, question wordings similar to previous
studies (but modified to suit the current study), use of a five-point Likert scale,
emphasis on specific time referents (i.e. tax year 2006), and eliminating respondents
from making unnecessary calculations. As for questionnaire design, among major
principles that have been employed are the use of bold print for questions, light print for
answer choices, white colour box for answer spaces, background colours (either shaded
or otherwise), blank spacing between questions and answer choices, providing
instructions in the appropriate section of the questions, and most importantly the use of
a consistent format throughout the questionnaire.
Having considered the above factors, the final survey questionnaire was prepared in
English and another translated version was made available in the Malay language. It is
common in Malaysia to make available both versions, mostly in a single printout.
Generally, for business-related surveys, the main language is English, which is visible
in a normal font. The Malay language is included as an italic font (for example in
Abdul-Manaf and Abdul-Jabbar 2006; Kasipillai and Abdul-Jabbar 2006). However, a
review of Malaysian tax studies 80 revealed that only studies by Hanefah (1996) and
Abdul-Manaf (2004) reported the use of two separate sets of questionnaires, one in
English, the other in Malay language. The current study employed two separate versions
of the questionnaire. The dual version was considered necessary to substantially reduce
the length of the questionnaire and, most importantly, to obtain a reasonable response
rate. The printing of background colour differentiated the English (printed in orange)
and the Malay (printed in blue) versions of the questionnaire. The respondents were
given the option of responding to either version. This option was clearly stated in the
covering letter. A single-page of questionnaire, more specifically A3 size paper folded
80 A list of studies reviewed is provided in Appendix B.

88
into A4 size paper, was among the main design layouts recommended by Dillman
(1978; 2007) to increase the response rate. The single page design was successfully
implemented in nearly all of Pope et al.’s studies (1990; 1993a; 1993b; 1994) and
recently by Rametse (2006).
4.6 PILOT INTERVIEWS
Initially, two phases of the pilot study were conducted to ensure the questionnaire was
well understood. The first phase involved a personal interview with three tax
professionals and five tax academics in the northern region and four universities
respectively. The view of both tax professionals and tax academics are essential to add
validity to the survey instruments. Prior to the actual interview, structured interview
questions, together with a covering letter emphasising the importance of the study, were
distributed. The approach was considered as a way of preparing the experts for the
interview. The draft instrument was built upon earlier tax compliance costs and
behavioural studies.81 Secondly, a pilot study was conducted by way of a personal
interview among a small sample of SME companies in the northern region of Malaysia.
The interview was conducted with the help of the SME Bank of Malaysia (SME Bank).
Similar to a pilot interview of tax experts, the structured interview questions and the
covering letter highlighting the value of the study were distributed in advance to 18
SMEs. The covering letter was addressed to managing directors of those SMEs and was
personally delivered by the SME Bank. A week after, a follow-up call was made to seek
their appointment to the study. However, only 11 SMEs agreed to participate in the
study. The remaining seven SMEs were unable to participate due to either their head
office being located elsewhere, not having commenced their operations, or refusing to
take part. The final interview was conducted successfully with only nine SMEs due to
the busy schedule of the other two SMEs.
81 See Section 4.5.

89
Following pilot interviews, two key modifications plus a few adjustments were made to
ensure that the questionnaire was easily understood by the respondents. The main
alterations were related to internal time spent and wages (question 9), and to both tax
scenarios (question 15 and 16). Firstly, in relation to the internal time spent and wages,
the basis for responses was standardised to a monthly basis. The pilot interview
questions asked respondents to estimate their internal time spent on income tax
activities on a yearly basis and the appropriate average wage rate on an hourly basis.
During the interview, the author noted that a number of SMEs had to compute the
hourly wage rate for relevant staff categories, as the basis of employment-related
payment in Malaysia is on a monthly basis. The change was crucial so as to avoid
respondents making unnecessary computations (Dillman 2007, pp. 77-78). As a
measure of consistency, the basis for time spent was also changed from a yearly to a
monthly basis. Secondly, simplifications to the tax scenarios were essential so as to
make them short and straightforward. Additionally, following the tax experts’ views,
the amount involved in each scenario was increased from RM5,000 to RM10,000. The
other adjustments made were mainly on the presentation and layout of the questionnaire
for ease of response.
Additionally, during the pilot study, both tax professionals and tax academics
highlighted the importance of the tax professional’s role in the Malaysian SME context.
Evidence also indicates that at least 91 percent of Malaysian SMEs employ tax
professionals to manage their tax affairs (Hanefah, Ariff and Kasipillai 2001, p. 91;
Mansor, Saad and Ibrahim 2003). Thus it would be useful to examine whether there is
any difference between tax professionals and SMEs with regards to both tax attitudinal
and behavioural aspects. As such, a supplementary survey was carried out among the
tax professionals.82
82 See subsection 4.11.2 for further details of the survey of tax professionals.

90
4.7 SURVEY IMPLEMENTATION
The importance of the implementation procedure is demonstrated in research on
business (Dillman 2007), small business (Forsgren 1989; Dennis 2003) and even
taxation (Pope 1995; Sandford 1995; Evans et al. 1996). In fact, almost all suggestions
made by them for improving mail survey weaknesses are implementation-related. For
example, four out of five TDM elements and 11 out of 17 of Sandford’s suggestions are
implementation-related.83 Accordingly, the current study places a greater emphasis on
the implementation procedures by integrating many of these suggestions. However, this
study was able to adapt four key elements of TDM and 12 elements of Sandford. A few
other options, though considered, were not implemented due to mainly financial
constraints.
The actual survey was carried out with the support of SMIDEC and relates to the tax
year 2006. The data collection period spanned three months, between July 2007 and
September 2007. The survey period was considered the most appropriate as all SMEs
were expected to have completed their corporate income tax submission for the tax year
2006. The deadline for corporate tax returns in Malaysia varies according to their
financial year-end, specifically within six months after the financial year-end. For
example, a company that ends their financial year on the 31 December 2006 is required
to furnish their tax return by 30 June 2007.
The survey questionnaire was mailed to 1,300 targeted respondents in SME companies
in peninsular Malaysia. A survey of this nature is possibly best answered by the owner-
manager or a person most responsible for the financial affairs of the SME. However, it
is most likely that the financial role in SMEs may not be linked to a specific post due to
its characteristics. Accordingly the survey targeted a chief executive officer or
managing director. The survey package was personalised with their name and position
in the company appearing on both the cover letter and outgoing envelope. However, not
all SMEs in the sample had such details. Accordingly, the survey was personalised to
83 Refer Section 4.3 for more details.

91
the next available name on the sample list by stating their post as well, provided that it
had some link to an accounting-related function. For the remaining SMEs without
specific contact details, or contact details that were not related to an accounting role, the
survey was addressed to ‘Manager/Accountant’. As shown in Table 4.5, the large
majority of the sample (71 percent) was personalised, with almost 58 percent either
addressed to a chief executive officer or managing director.
Table 4.5: Mail-out Personalisation
Number of SMEs Percentage
Personalised a
Chief Executive Officer 153 11.8
Managing Director 594 45.7
Director/Executive Director 18 1.4
Accountant, Finance Manager or Equivalent 44 3.4
General Manager/Manager 112 8.6
Sub-total 921 70.8
Non-personalised
Manager/Accountant 379 29.2
Overall 1,300 100.0 a Both name and position of respondent appears in all outgoing mails.
As shown in Table 4.6, three mailings have been used in the current study. The initial
mailing was made on 5 July 2007, followed by a postcard reminder three weeks later
and a final reminder four weeks after the first reminder. These intervals are a bit longer
than recommended by Evans et al. (1996), but considered appropriate in the Malaysian
context.84
84 All mailings were based in Kedah. It is important to allow for different working days in seven (out of nine) states in peninsular Malaysia. The weekend in Kedah, Kelantan and Terengganu is on Friday, while in other states the weekend is on Sunday.

92
Table 4.6: Mailing Pattern of the Study
Mailing Pattern Mailing Date Mailing Number
Initial Mailing 5 July 2007 1,300
First Reminder a 26 July 2007 1,174 b
Final Reminder a 22 August 2007 1,124 b a Reminders were sent to the entire sample. b Less than 1,300 due to the exclusion of undelivered mailings during the earlier mail out.
The initial mailing included a personalised covering letter, the questionnaire in both
English and Malay versions, and a stamped return envelope. The covering letter
explained the purpose of the study, emphasised that the study was independent and
conducted with the support of SMIDEC. The letter was printed on the original
stationery of UUM and was hand-signed by the researcher.85 UUM stationery was also
used for both the outgoing and reply envelope. Although the use of original stationery is
costly, it was important to obtain a good response rate. No identification number was
made on all outgoing mail as taxation is a sensitive area and, most importantly, in order
to offer complete anonymity. As a result, both reminders were sent to the entire sample,
but excluded a number of undelivered mailings, mainly due to change of address.86
The first reminder was sent via a postcard.87 The postcard thanked those who had
already responded and called for a reply from those who had not responded. The final
reminder88 was sent together with a further copy of the full questionnaire,89 a single
question survey,90 so as to determine any non-response bias, with a new stamped reply
envelope. The size of the reply envelope sent with the second reminder was slightly
different from the initial mailing in order to allow for better monitoring of response
waves. Similar to the first mailing, the reminder letter sent was personalised.91
85 See Appendix H. 86 See Chapter Five, Table 5.2. 87 See Appendix I. 88 See Appendix J. 89 See Appendix F. 90 See Appendix K. 91 See paragraph above Table 4.5.

93
4.8 POPULATION AND SAMPLE OF THE STUDY
The study focused on corporate income taxation, but was confined to small and
medium-sized companies in peninsular Malaysia. There is no comprehensive list of
taxpayers publicly available in Malaysia. The current study used the SME directory
available via the SME information portal managed by the Secretariat to the National
SME Development Council. The portal was recently launched in early 2006 and is
publicly accessible via http://www.smeinfo.com.my. The directory was considered as
the most suitable list of population as it is based on the new national definition of
SMEs. As at 15 June 2007, there were 14,388 SMEs registered with the NSDC. The
gross population of the current study was derived at 9,912 companies after excluding
SMEs in Eastern Malaysia, namely in Sabah, Sarawak and the Federal Territory of
Labuan, and non-corporate SMEs, as shown in Table 4.7. Further, recognising a low
number of representations in the primary agriculture and mining sectors, the net
population of the study was further reduced to 9,669.
Table 4.7: Gross and Net Population of the Study
Number of SMEs
Gross Population as at 15 June 2006 14,388
Less : SMEs in Eastern Malaysia a
Sabah 570
Sarawak 601
Federal Territory of Labuan 40 (1,211)
Less: Non-corporate SMEs (3,265)
Total SMEs in peninsular Malaysia 9,912
Less: Sectors with low numbers
Primary agriculture 215
Mining 28 (243)
Net Population 9,669 a Inclusive of non-corporate SMEs.

94
Having decided on the population for the study, the sampling size and selection are
considered next. Hair et al. (1998, p. 12) advised researchers to be fully aware of the
impact of sample size on the statistical test. From a different perspective, Garson (n.d.)
noted that the sample size does not depend on the population size and contended that a
sample size over 1,500 is hardly ever needed. Nonetheless, Krejcie and Morgan (1970),
developed a scientific table for determining sample size by taking into account
population size. The table suggests a sample size of 370 and 375 for a given population
of 10,000 and 15,000 respectively. Roscoe (1975), for instance, argues that a sample
size of more than 30 and less than 500 is appropriate for most research.
The views presented above suggest that a sample size of anywhere between 372 and
1,500 is adequate. However, in the specialist field of tax compliance costs studies,
particularly for business taxpayers, many studies use greater sample sizes—for
example, 1,870 public companies (Pope, Fayle and Chen 1991), 9,094 Value Added
Tax traders in the UK (Sandford et al. 1981), 9,541 GST/business taxpayers (Sandford
and Hasseldine 1992), 3,000 companies (Pope, Fayle and Chen 1994), 1,329 companies
(Slemrod and Blumenthal 1996) and 2,500 companies in the US (Slemrod and
Venkatesh 2002), 8,039 business taxpayers in Evans et al. (1997), and more recently,
4,000 small businesses in Rametse and Pope (2002). It is important to note that most of
these studies, to varying extents, received funding from external organisations; for
example, the Australian Tax Research Foundation (for Pope et al. studies), the
Economic and Social Research Council (for the UK studies) and the Tax Foundation
and Inland Revenue Services (for the US studies).
In view of mainly financial constraints,92 the current study considered a sample size of
around 1,000 (i.e. 10 percent of the net population) to be reasonable. Nevertheless, the
final sample size was increased to 1,300 so as to allow for the possibility of returned or
undelivered mail. This study used a stratified proportionate sampling technique and
random selection respectively to obtain a representative sample. A proportionate sample
92 Financial assistance sought from a number of research institutes in Malaysia failed, mainly due to the doctoral nature of the study.

95
was drawn from each category of the business sector. The population and sampling
frame of the current study is presented in Table 4.8.
Table 4.8: Population and Sample Size by Stratified Proportionate Sampling
Sector
Number of
Companies
Percentage of
Population
Sample
Size
Manufacturing 5,239 54 702
Services 2,158 22 286
Manufacturing-related services 848 9 117
Construction 734 8 104
Others 690 7 91
Overall 9,669 100 1,300
4.9 NON-RESPONSE BIAS
Having recognised the typically low response rate in mail surveys, it is imperative to
examine the possibility of non-response bias. Researchers in the social sciences,
including business, accounting and economics, normally investigate the presence of
non-response bias by comparing responses received from early and late respondents
(Armstrong and Overton 1977; Wallace and Mellor 1988; Graham and Harvey 2001;
Nelson, Elliott and Tarpley 2002; Beattie, Goodacre and Thomson 2006; Brau and
Fawcett 2006). If repeated mailings are used, wave analysis is used to compare
responses between mailings or waves (Armstrong and Overton 1977). Under this
approach, the late respondents are assumed to be proxies for non-respondents.
The approach is also adopted by a number of tax compliance researchers (for example
in Abdul-Manaf 2004; Lai, Sheikh-Obid and Meera 2004; Evans, Tran-Nam and
Andrew 2007). However, in the specific field of tax compliance costs studies, the use of
a single question survey in a postcard, as introduced by Allers (1994), is the most
common practice nowadays (for example, Evans et al. 1997; Rametse and Pope 2002;
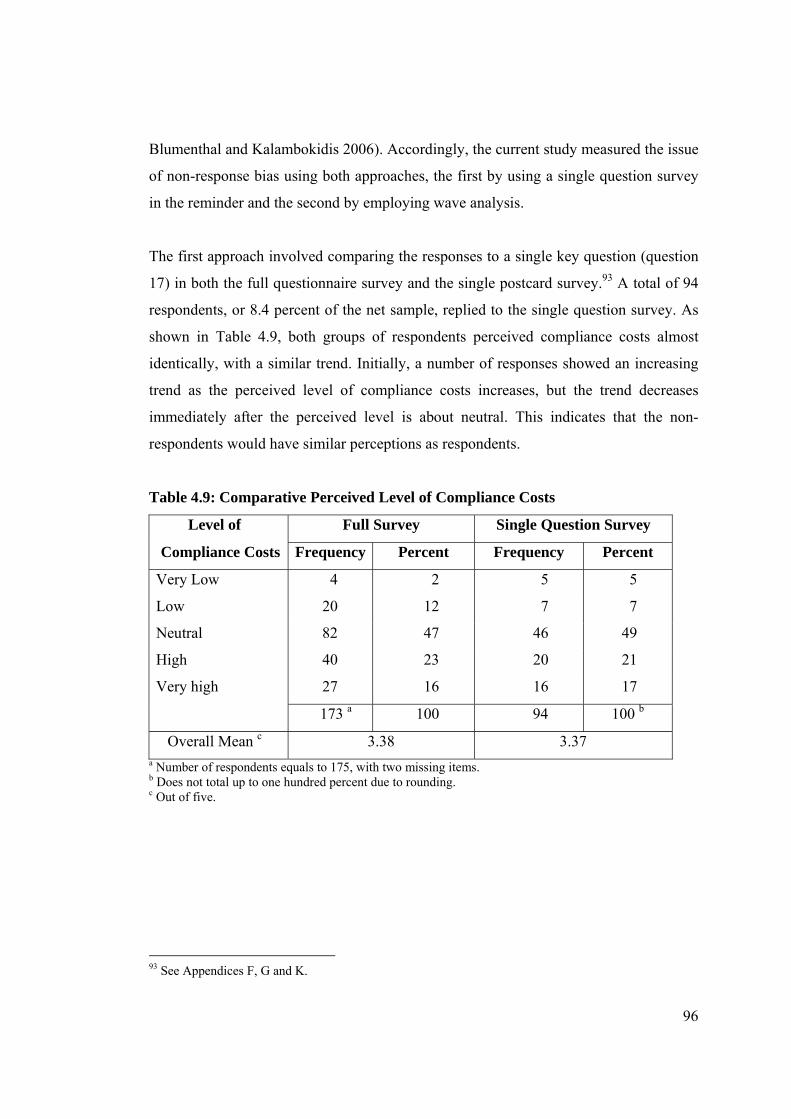
96
Blumenthal and Kalambokidis 2006). Accordingly, the current study measured the issue
of non-response bias using both approaches, the first by using a single question survey
in the reminder and the second by employing wave analysis.
The first approach involved comparing the responses to a single key question (question
17) in both the full questionnaire survey and the single postcard survey.93 A total of 94
respondents, or 8.4 percent of the net sample, replied to the single question survey. As
shown in Table 4.9, both groups of respondents perceived compliance costs almost
identically, with a similar trend. Initially, a number of responses showed an increasing
trend as the perceived level of compliance costs increases, but the trend decreases
immediately after the perceived level is about neutral. This indicates that the non-
respondents would have similar perceptions as respondents.
Table 4.9: Comparative Perceived Level of Compliance Costs
Level of Full Survey Single Question Survey
Compliance Costs Frequency Percent Frequency Percent
Very Low 4 2 5 5
Low 20 12 7 7
Neutral 82 47 46 49
High 40 23 20 21
Very high 27 16 16 17
173 a 100 94 100 b
Overall Mean c 3.38 3.37 a Number of respondents equals to 175, with two missing items. b Does not total up to one hundred percent due to rounding. c Out of five.
93 See Appendices F, G and K.

97
For the purpose of wave analysis, responses received were divided into three waves:
those who responded after the initial mailing but before a first reminder, those who
responded after the first reminder but before a second reminder was sent, and those who
responded after the second reminder. A comparison is made between the waves on a
number of key variables to determine whether responses changed significantly between
those periods. The variables are the sector (question 2), number of staff (question 4),
annual turnover (question 6), the perceived level of compliance costs (question 17),
possible behaviour of underreporting (question 15b) and possible behaviour of
overstating deductions (question 16b). The variables include both categorical (questions
2, 4 and 6) and ratio (questions 15b, 16b and 17). Chi-square and one-way analysis of
Variance (ANOVA) tests were conducted for three categorical variables and three ratio
variables respectively. No significant differences were found for all six variables,
suggesting no bias was present in all three waves of responses.
Thus, both approaches suggest fairly similar responses between respondents and non-
respondents, thereby removing the possibility of significant non-response bias in this
study.
4.10 METHOD OF DATA ANALYSIS
4.10.1 Overall Approach
Data are analysed mainly using descriptive statistics, correlation and regression
analyses. For this purpose, all data were entered into the Statistical Package for the
Social Sciences (SPSS). Frequency and means analysis were used mainly in analysing
the profile of the responding SMEs and compliance costs estimation respectively. Mean
analysis was also used in analysing perceptions and opinions towards a number of tax
attitudinal aspects and tax behaviours. The next subsections explain specific methods of
data analysis by type of research questions.94
94 See Chapter One, Section 1.3.

98
4.10.2 Compliance Costs Estimation
The compliance costs of taxation (research question one) was estimated and analysed,
mainly following methodology established by Sandford, the ‘grandfather’95 of tax
compliance cost studies and consequently adapted in the pioneering work of Pope et al.
(1991–1994) in Australia, and later further advanced by Evans et al. (1997) in Australia.
It is important to note that the current study also benefited from other tax compliance
research as well (e.g. Allers 1994, Hanefah Ariff and Kasipillai 2001). Recognising this
study targeting corporate taxpayers, more specific consideration was given to a study by
Pope, Fayle and Chen (1994) on companies’ income taxation. Some of the major
measurement difficulties were discussed earlier.96
Apart from those, one noteworthy aspect to consider in the Malaysian context is with
regards to size of measure to be used. In Malaysia, the size of SMEs is based on a
mixture of both turnover and staff measures.97 However, the NSDC definition varies
between sectors and measures too, which possibly could lead to distortion. Almost all
major prior studies analyse business compliance costs mainly in terms of firm size,
mostly proxies by turnover level (Sandford, Godwin and Hardwick 1989; Sandford and
Hasseldine 1992; Allers 1994; Pope, Fayle and Chen 1994; Evans et al. 1997). The
other proxies used are category of annual tax remittance (Pope, Fayle and Chen 1994),98
and employment size (Allers 1994). Almost a similar trend was observed in the Asia-
Pacific studies as well (Ariff, Loh and Talib 1995; Ariff, Ismail and Loh 1997; Chan et
al. 1999; Hanefah, Ariff and Kasipillai 2001). Despite various measures, the firm size
was found to be strongly and consistently related to the level of tax compliance burden
of business taxpayers (Allers 1994; Slemrod and Blumenthal 1996; Evans et al. 1997;
95 As acknowledged by Tran-Nam and Evans (2002) in recognition of Sandford’s scholarly contribution to the tax compliance costs discipline. See also Evans, Pope and Hasseldine (2001). 96 See subsection 4.4.1. 97 See Chapter One, subsection 1.5.3. 98 The primary analysis of Pope, Fayle and Chen (1994, p. 54) uses annual tax remittance categories being a proxy for firm size, as the measure corresponded to published Australian Taxation Office (ATO) statistics.
99
Slemrod and Venkatesh 2002; Hanlon, Mills and Slemrod 2005).99 The same holds true
even within small business taxpayers (DeLuca et al. 2005, p. 80).
Accordingly, the turnover level is considered of primary interest, and it is also
comparable to previous studies. Additionally, compliance costs are analysed in terms of
alternative size measures, namely number of staff employed and the NSDC definition.
The compliance costs were further analysed in terms of other SMEs’ characteristics,
such as business sector and business length. Apart from analysing compliance costs at
the total company level, compliance costs distribution was analysed in terms of its type
(either computational or planning), and their sources (either internal or external).
Additionally, the aggregate compliance costs of SME companies in Malaysia are
estimated by multiplying the average compliance costs to SME populations. Due to data
availability on the population of SME companies, the current study assumed that the
average compliance costs are the same, regardless of their specific sizes, either micro,
small and medium companies. Further details are presented in Chapter Five.100
This study also estimated the possible values of offsetting benefits of tax compliance,
namely tax deductibility.101 Subsequently, compliance costs, after allowing for
offsetting benefits of tax compliance, were computed, both at the firm and overall
levels.
4.10.3 Relationship between Compliance Costs and Compliance Behaviour
Having outlined tax compliance costs estimation, it would be useful to examine the
effects of compliance costs on corporate tax behaviour. The current study measured two
types of non-compliance behaviour, namely underreporting of income and
overstatement of deductions. As presented earlier,102 it is important to remember that
99 The US studies tend to conduct a statistical analysis/test to establish the relationship between firm size and the tax compliance burden, whereas researchers in other parts of the world (with the exception of Allers in the Netherlands) generally carry out comparisons with firm size to investigate the regressive nature of tax compliance costs. Nonetheless, the ultimate idea remains the same, namely that firm size relates to the tax compliance burden. 100 See Chapter Five, Section 5.9. 101 See Chapter Five, Section 5.10. 102 See subsection 4.4.3.
100
both tax behaviours were measured by way of two independent hypothetical tax
scenarios. The relationship between compliance costs and both types of compliance
behaviour (research question two) was analysed descriptively and by way of correlation
analysis, as well as employing other comparative analysis (mainly t-tests or ANOVA).
Additionally, in a similar way, a relationship between compliance costs and other tax
attitudinal tax aspects, namely fairness, tax complexity, and other structural features of
tax systems was carried out as well.
4.10.4 Determinants of Compliance Behaviour
And finally, factors influencing non-compliance behaviour of SME companies (research
question three) was carried out by way of multivariate regressions. A number of prior
studies in tax compliance had used regression (for example Mason and Calvin 1984;
Hasseldine, Kaplan and Fuller 1994; Webley, Cole and Eidjar 2001; Wenzel 2002) in
their analysis. Details of the model specification in the current study, covering both
dependent and independent variables, and findings are presented in Chapter Six.103
4.11 ADDITIONAL SURVEYS
4.11.1 Web Survey
As presented earlier,104 the main survey questionnaire was also carried out by way of a
web survey. The web survey considered almost 42 percent of the net population105 or
4,033 SMEs having an e-mail address. The web survey follows a similar approach to
the mail survey,106 except that a slightly different questionnaire layout,107 and additional
number of contacts are used. A different layout of the questionnaire was considered to
suit the web survey context. In terms of contact, advanced e-mail notification,108 and
three reminders (as compared to two in the mail survey) were adopted in the web 103 See Chapter Six, Section 6.7. 104 Refer end of Section 4.3. 105 See Table 4.7 in Section 4.8. 106 Refer Sections 4.5 to 4.7. 107 See a print copy of the web questionnaire in Appendix L. 108 Advance e-mail notifications are sent through an email group created for the purpose of the current study.

101
survey.109 The third and the final reminder requested respondents to complete a single
question web survey.110 These two additional reminders are considered essential in
order to address a comparatively low response rate in a web survey, and more
importantly no additional costs were involved.
The web survey was conducted by an e-mail invitation to 3,535 SME companies. This
sample frame is derived after excluding a number of duplicate email addresses111 and
SMEs that had been selected in the mail survey. The web sampling frame by sector is
shown in Table 4.10.
Table 4.10: Sample Size of Web Survey
Sector Number of Companies Percentage
Manufacturing 708 20.0
Services 1,396 39.5
Manufacturing-related services 581 16.4
Construction 387 10.9
Others 463 13.1
Overall 3,535 100.0 a a Does not total up to one hundred percent due to rounding.
The survey was implemented five weeks after the initial mail-out of the postal survey
with the assistance of the Computer Centre of UUM. The e-mailing pattern of a web
survey is summarised in Table 4.11. The intervals of web-contacts of between one and
two weeks were shorter than the mail survey as no lead time is required in a web-
survey.
109 See the content of the advanced e-mail notification, initial email and reminders in Appendix M. 110 The single question in the web survey is the same as for the primary postal survey (refer Appendix K). 111 See Appendix N, Table N.1 for details.
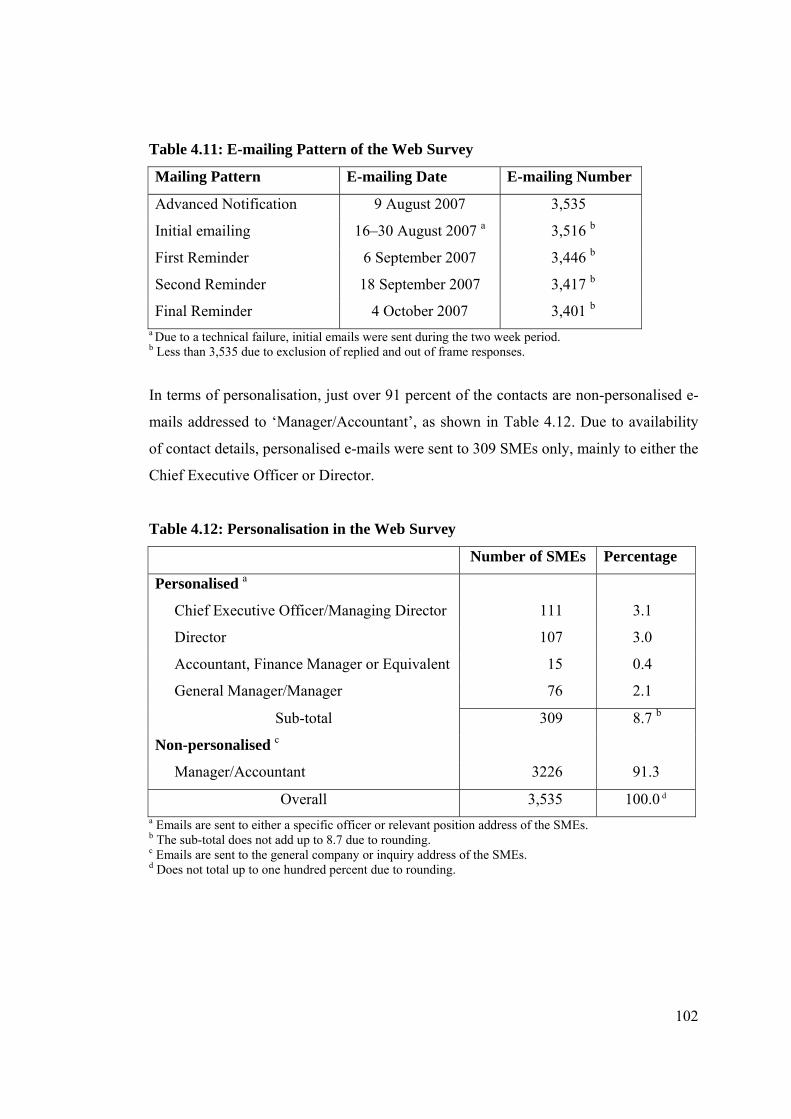
102
Table 4.11: E-mailing Pattern of the Web Survey
Mailing Pattern E-mailing Date E-mailing Number
Advanced Notification 9 August 2007 3,535
Initial emailing 16–30 August 2007 a 3,516 b
First Reminder 6 September 2007 3,446 b
Second Reminder 18 September 2007 3,417 b
Final Reminder 4 October 2007 3,401 b a Due to a technical failure, initial emails were sent during the two week period. b Less than 3,535 due to exclusion of replied and out of frame responses.
In terms of personalisation, just over 91 percent of the contacts are non-personalised e-
mails addressed to ‘Manager/Accountant’, as shown in Table 4.12. Due to availability
of contact details, personalised e-mails were sent to 309 SMEs only, mainly to either the
Chief Executive Officer or Director.
Table 4.12: Personalisation in the Web Survey
Number of SMEs Percentage
Personalised a
Chief Executive Officer/Managing Director 111 3.1
Director 107 3.0
Accountant, Finance Manager or Equivalent 15 0.4
General Manager/Manager 76 2.1
Sub-total 309 8.7 b
Non-personalised c
Manager/Accountant 3226 91.3
Overall 3,535 100.0 d a Emails are sent to either a specific officer or relevant position address of the SMEs. b The sub-total does not add up to 8.7 due to rounding. c Emails are sent to the general company or inquiry address of the SMEs. d Does not total up to one hundred percent due to rounding.
103
A non-response test, similar to the primary mail survey112 and conducted through a
single questionnaire survey and wave analysis, indicates similar findings between
respondents and non-respondents.113 The findings are presented in Chapters Five and
Six.114
4.11.2 Survey of Tax Professionals
As briefly discussed earlier,115 considering tax professionals’ views is important with
regards to corporate SME taxation. A survey of tax professionals was carried out to
validate and support corporate SME respondents’ views on some tax attitudinal and
behavioural aspects. The questionnaires were mailed to 300 tax professionals who are
members of the Malaysian Institute of Taxation (MIT). As at early August 2007, there
were 2,504 MIT members in Malaysia.116 As the MIT members’ details are not
available publicly, the random selection of 300 tax professionals and the mailings were
carried out by the MIT personnel. The survey questionnaire, together with a reply
stamped envelope, was distributed by the MIT in their third quarterly correspondence
(second week of September) to members. A lack of correspondence details does not
allow any follow up procedure to be carried out.
Similar to the main mail survey, a single page questionnaire, folded into booklet form,
was adopted. The covering letter explaining the purpose of the study was printed on the
top of the first page of the questionnaire. The survey questionnaire was divided into
four sections, referred to as Sections A to D.117 Section A was designed to obtain brief
demographics and background information of tax professionals; Sections B and C relate
to external tax fees and perceptions on tax attitudes and behaviour of tax professionals
respectively; and finally Section D covers comments and suggestions. This
questionnaire survey was built upon the main postal SME survey questionnaire,
112 See Section 4.9. 113 A comparative analysis of the perceived level of compliance costs in a full and single question is provided in Appendix N, Table N.10. 114 See Sections 5.12 and 6.8. 115 See Section 4.6. 116 Personal communication with the Malaysian Institute of Taxation, 16 August, 2007. 117 The survey questionnaire is provided in Appendix O.
104
discussed earlier,118 but modified to suit the tax professional context. This survey
questionnaire was prepared in the English version only as the English language is
widely used in the business of tax professionals. The survey findings are reported in
Chapter Six.119
4.12 CHAPTER SUMMARY
This chapter has presented the various aspects of research design and methodology
adopted in this study. The strengths and weaknesses of each design and method have
been compared succinctly, both in the context of social sciences and specific tax
research. A number of measurement issues and approaches adopted pertaining to both
tax compliance costs and compliance behaviour have been discussed. Questionnaire
development, pilot interviews, and the actual survey implementation undertaken have
been described in detail. These cover the main SME postal survey, and two additional
surveys—the SME web survey and the tax professionals’ survey. Information with
regard to population, sampling process, and non-response bias has been addressed as
well. Finally, the methods of data analysis employed in this study have been explained.
The findings and analysis are presented in the next two chapters.
118 See Section 4.5. 119 See Section 6.9.
105
CHAPTER FIVE
COMPLIANCE COSTS ESTIMATES
OF SMALL AND MEDIUM ENTERPRISES
5.1 INTRODUCTION
This chapter presents the findings of the analysis obtained through the postal survey, the
primary survey instrument. The analyses start with overall responses and outline the
profile of the sample SMEs. The main part of this chapter presents compliance costs
estimates of Malaysian SMEs for the survey year 2006. The estimates cover both gross
and net compliance costs, conducted mainly at firm level, but also aggregate level.
Overall, the chapter covers analyses of Sections A and B of the survey questionnaire.
An analysis of Section C is presented in Chapter Six. Additionally, the compliance costs
estimates of the web survey and relevant analysis, conducted using the same survey
instrument,120 are presented to add support to compliance costs estimates from the main
postal survey.
5.2 RESPONSES AND RATE
Out of 1,300 questionnaire sent, a total of 175 useable questionnaires were returned,
which represents an overall response rate of 15.7 percent of the net sampling frame.
Detailed information of responses, taking into consideration the gross sample, out of
frame, useable and unusable responses, is presented in Table 5.1.
120 See Section 4.11.

106
Table 5.1: Sample Frame and Response Rate for Postal Survey
Number of SMEs
Gross Sample Frame 1,300
(-) Out of Frame a 176
(-) Unusable Responses 8
Net Sample Frame 1,116
Useable Responses 175
Useable Response Rate (%) 15.7 a See Table 5.2 for details.
The net sample frame, as shown in Table 5.1, totalled up to 1,116 SMEs, after allowing
for out of frame and unusable replies. A total of eight responses were discarded due to
incompleteness (four cases), non-SMEs’ response (three cases) and an extreme outlier
(one case). The out of frame replies were largely due to change of business addresses
(82 percent) and/or invalid addresses (9 percent). Further details are shown in Table 5.2.
Table 5.2: Out of Frame Responses
Number of SMEs Percentage
Change of address 145 82.4
Invalid address 15 8.5
Refused to participate 9 5.1
Dormant/ceased business 6 3.4
Large company 1 0.6
Total 176 100.0

107
Out of 175 useable responses, the large majority of SMEs responded to the English
version (142 responses or 81 percent) and the remaining to the Malay version (33
responses or 19 percent). Nearly half of the respondents are either Chief Executive
Officers or Managing Directors of SMEs, followed by Managers at just more than one-
quarter, as shown in Table 5.3.
Table 5.3: Respondents’ Position
Number of Respondents Percentage
Chief Executive Officer 18 10.3
Managing Director/Director 59 33.7
Manager 46 26.3
Accountant 15 8.6
Other 37 21.1
Total 175 100.0
The majority of responses received from Chief Executive Officers and Managing
Directors is not surprising as almost 60 percent of the survey is addressed personally to
them.121 Responses from Accountants comprised nearly nine percent. The remaining
one-fifth fall within the ‘other’ category; a detailed breakdown is shown in Table 5.4.
Table 5.4: Position of ‘Other’ Respondents
Number of Respondents Percentage
Accounting Staff 17 46.0
Non-Accounting Staff 15 40.5
Not Mentioned 5 13.5
Total 37 100.0
Seventeen and fifteen respondents are accounts-related staff (i.e. accounting or finance
clerks, executives or supervisors) and non-accounting staff (i.e. administrative clerks,
executives or officers) respectively. Unfortunately, another five respondents did not
121 See Section 4.7, Table 4.5.

108
disclose their positions. Overall, it is reasonable to assume that the survey was
predominantly completed by a person who has some financial knowledge of their
respective business.
All responses were scrutinised for validity and a number of telephone follow-up calls
were made (to respondents with telephone numbers) to address the issue of possible
incorrect or extreme responses, and to address any missing items (see Appendix P).
5.3 PROFILE OF RESPONDING SMALL AND MEDIUM ENTERPRISES
This section presents a business profile of the responding SMEs, both by general
business and specific size measures. General business profile includes financial year-
end, business sector, and business length. Business size measures consist of staff,
turnover and the National SME Development Council (NSDC) criteria. Additionally,
the way the SMEs manage their corporate income tax affairs, either internally,
externally or both, is presented. Nearly 70 percent of the SMEs end their business either
on the 31 December (55 percent) or 30 June (14 percent), as shown in Table 5.5. The
remainder, 30 percent, end their accounts on dates other than 31 December and 30 June.
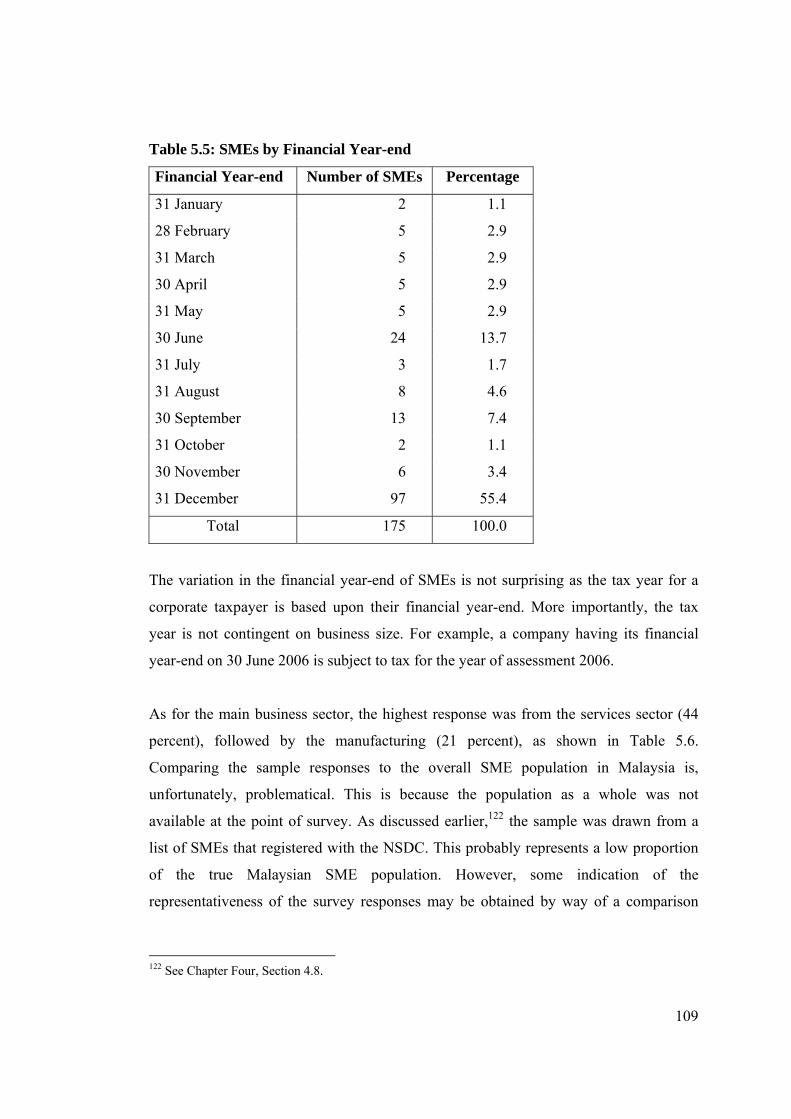
109
Table 5.5: SMEs by Financial Year-end
Financial Year-end Number of SMEs Percentage
31 January 2 1.1
28 February 5 2.9
31 March 5 2.9
30 April 5 2.9
31 May 5 2.9
30 June 24 13.7
31 July 3 1.7
31 August 8 4.6
30 September 13 7.4
31 October 2 1.1
30 November 6 3.4
31 December 97 55.4
Total 175 100.0
The variation in the financial year-end of SMEs is not surprising as the tax year for a
corporate taxpayer is based upon their financial year-end. More importantly, the tax
year is not contingent on business size. For example, a company having its financial
year-end on 30 June 2006 is subject to tax for the year of assessment 2006.
As for the main business sector, the highest response was from the services sector (44
percent), followed by the manufacturing (21 percent), as shown in Table 5.6.
Comparing the sample responses to the overall SME population in Malaysia is,
unfortunately, problematical. This is because the population as a whole was not
available at the point of survey. As discussed earlier,122 the sample was drawn from a
list of SMEs that registered with the NSDC. This probably represents a low proportion
of the true Malaysian SME population. However, some indication of the
representativeness of the survey responses may be obtained by way of a comparison
122 See Chapter Four, Section 4.8.
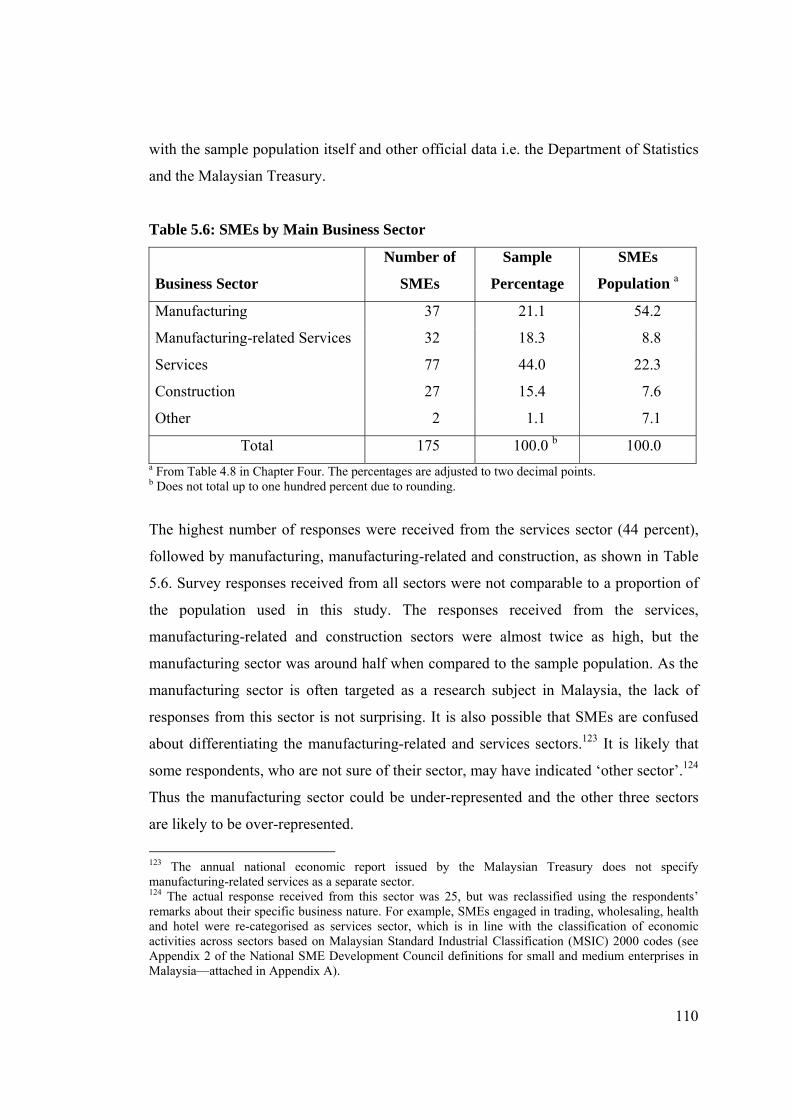
110
with the sample population itself and other official data i.e. the Department of Statistics
and the Malaysian Treasury.
Table 5.6: SMEs by Main Business Sector
Business Sector
Number of
SMEs
Sample
Percentage
SMEs
Population a
Manufacturing 37 21.1 54.2
Manufacturing-related Services 32 18.3 8.8
Services 77 44.0 22.3
Construction 27 15.4 7.6
Other 2 1.1 7.1
Total 175 100.0 b 100.0 a From Table 4.8 in Chapter Four. The percentages are adjusted to two decimal points. b Does not total up to one hundred percent due to rounding.
The highest number of responses were received from the services sector (44 percent),
followed by manufacturing, manufacturing-related and construction, as shown in Table
5.6. Survey responses received from all sectors were not comparable to a proportion of
the population used in this study. The responses received from the services,
manufacturing-related and construction sectors were almost twice as high, but the
manufacturing sector was around half when compared to the sample population. As the
manufacturing sector is often targeted as a research subject in Malaysia, the lack of
responses from this sector is not surprising. It is also possible that SMEs are confused
about differentiating the manufacturing-related and services sectors.123 It is likely that
some respondents, who are not sure of their sector, may have indicated ‘other sector’.124
Thus the manufacturing sector could be under-represented and the other three sectors
are likely to be over-represented.
123 The annual national economic report issued by the Malaysian Treasury does not specify manufacturing-related services as a separate sector. 124 The actual response received from this sector was 25, but was reclassified using the respondents’ remarks about their specific business nature. For example, SMEs engaged in trading, wholesaling, health and hotel were re-categorised as services sector, which is in line with the classification of economic activities across sectors based on Malaysian Standard Industrial Classification (MSIC) 2000 codes (see Appendix 2 of the National SME Development Council definitions for small and medium enterprises in Malaysia—attached in Appendix A).

111
From an overall population perspective, the Department of Statistics (2007, p. 9)
reported that the services sector is the largest SME sector (representing 86.6 percent) in
Malaysia, followed by the manufacturing sector (7.2 percent). Both the services and the
manufacturing sectors also have been significant contributors to Malaysian economic
growth. For example, in 2007, the national GDP growth was recorded at 6.3 percent,
with the services and manufacturing sectors contributing 5.0 and 1.0 percentage points
respectively (Treasury of Malaysia 2008, p. 38, Table 3.1). The data also shows that the
contribution from the services sector is gradually increasing. Over the period of
between 2002 and 2007, except for 2003 and 2004, the services sector registered higher
growth compared to manufacturing (Treasury of Malaysia 2003, 2004, 2005, 2006,
2007, 2008). The gradual shift in the structure of the Malaysian economy in recent years
from manufacturing to services is acknowledged (Treasury of Malaysia 2007, p. 25).
The services sector is expected to contribute significantly to the national economy in
2008 and 2009 (Treasury of Malaysia 2008, p. 38). It is therefore reasonable to assume
that the proportion of responses received in the current study is broadly representative
of the Malaysian SME population.
Regarding business length, Table 5.7 reveals that almost 95 percent of responding
SMEs have been in business for at least two years, with 78 percent of them for more
than five years. This indicates that the responding SMEs have had tax-related
experience for some time.
Table 5.7: SMEs by Length of Business
Business Length Number of SMEs Percentage
Less than 2 years a 8 4.6
2 to 5 years a 30 17.1
More than 5 years 137 78.3
Total 175 100.0 a These categories are combined into a single category of up to five years throughout the remainder of this thesis.

112
As for business size, the newly approved definition of Malaysian SMEs is based on
either the number of employees or annual sales turnover. The SME profiles, based on
these individual measures, are presented in Tables 5.8 and 5.9 respectively, and later by
NSDC definition in Table 5.10.
Table 5.8: SMEs by Number of Staff Employed
Number of Staff Number of SMEs Percentage
4 or less 35 20.0
5 to 19 85 48.6
20 to 50 40 22.9
51 to 150 14 8.0
151 or more 1 0.6
Total 175 100.0 a
a Does not total up to one hundred percent due to rounding.
In terms of employment size, as shown in Table 5.8, 92 percent of respondent
companies have up to 50 personnel employed, with almost 49 percent of all companies
having staff in the ‘5 to 19’ category. As for turnover level, Table 5.9 shows that almost
75 percent of the respondents are from the first three categories, with about the same
number of respondents for each category. The remaining respondents are in the next
three levels of turnover, with about equal representation in each category. More
importantly, responses in the last three levels of turnover are small. Hence, primary
compliance costs analysis throughout this thesis is carried out by combining all these
responses (n = 44) into a turnover level of between RM5 million and above.

113
Table 5.9: SMEs by Turnover Level
Turnover Level Number of SMEs Percentage
Less than RM250,000 37 21.1
RM250,000 to RM999,999 48 27.4
RM1,000,000 to RM4,999,999 46 26.3
RM5,000,000 to RM9,999,999 a 17 9.7
RM10,000,000 to RM24,999,999 a 14 8.0
RM25,000,000 or more a 13 7.4
Total 175 100.0 b a These categories are combined into a single category of RM5 million or more throughout the remainder of this thesis. b Does not total up to one hundred percent due to rounding.
Having analysed SMEs on the basis of both staff and turnover measures separately, it is
important to classify them into the NSDC classification of SMEs. However, technical
difficulties arise as different criteria (by staff and/or turnover) apply for manufacturing
and manufacturing-related sectors on the one hand, and the non-manufacturing sector
(services, construction and others) on the other. For example, a SME company with
between 20 and 50 personnel would be classified as a small business in the
manufacturing sector, but as a medium business in the non-manufacturing sector. Even
within the same sector, different criteria may result in different sized SMEs. For
example, a company could be categorised as micro-sized by staff criteria and as small-
sized by turnover criteria. In such cases, the lower criterion is employed, as adapted by
the NSDC (personal communication, 16 October 2007). Table 5.10 presents responses
from SMEs based on the NSDC classification.
Table 5.10: Size of Business by the NSDC Definition
Business Size Number of SMEs Percentage
Micro 54 30.9
Small 98 56.0
Medium 23 13.1
Total 175 100.0
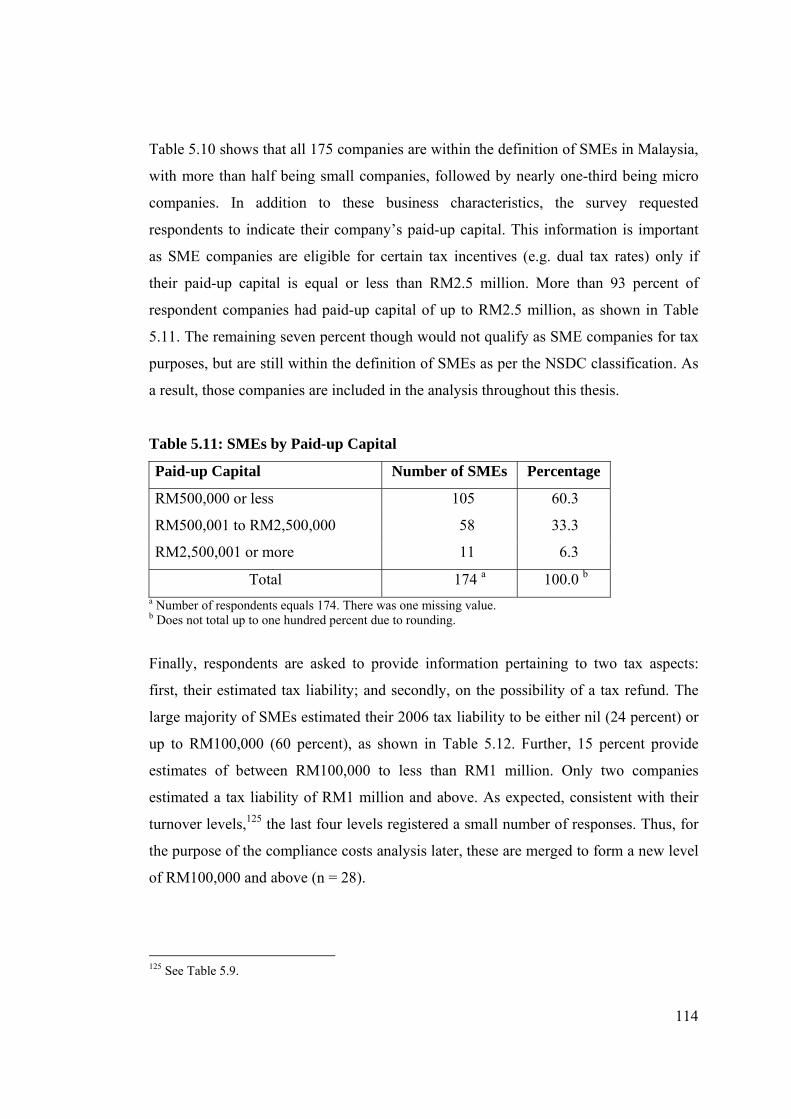
114
Table 5.10 shows that all 175 companies are within the definition of SMEs in Malaysia,
with more than half being small companies, followed by nearly one-third being micro
companies. In addition to these business characteristics, the survey requested
respondents to indicate their company’s paid-up capital. This information is important
as SME companies are eligible for certain tax incentives (e.g. dual tax rates) only if
their paid-up capital is equal or less than RM2.5 million. More than 93 percent of
respondent companies had paid-up capital of up to RM2.5 million, as shown in Table
5.11. The remaining seven percent though would not qualify as SME companies for tax
purposes, but are still within the definition of SMEs as per the NSDC classification. As
a result, those companies are included in the analysis throughout this thesis.
Table 5.11: SMEs by Paid-up Capital
Paid-up Capital Number of SMEs Percentage
RM500,000 or less 105 60.3
RM500,001 to RM2,500,000 58 33.3
RM2,500,001 or more 11 6.3
Total 174 a 100.0 b a Number of respondents equals 174. There was one missing value. b Does not total up to one hundred percent due to rounding.
Finally, respondents are asked to provide information pertaining to two tax aspects:
first, their estimated tax liability; and secondly, on the possibility of a tax refund. The
large majority of SMEs estimated their 2006 tax liability to be either nil (24 percent) or
up to RM100,000 (60 percent), as shown in Table 5.12. Further, 15 percent provide
estimates of between RM100,000 to less than RM1 million. Only two companies
estimated a tax liability of RM1 million and above. As expected, consistent with their
turnover levels,125 the last four levels registered a small number of responses. Thus, for
the purpose of the compliance costs analysis later, these are merged to form a new level
of RM100,000 and above (n = 28).
125 See Table 5.9.
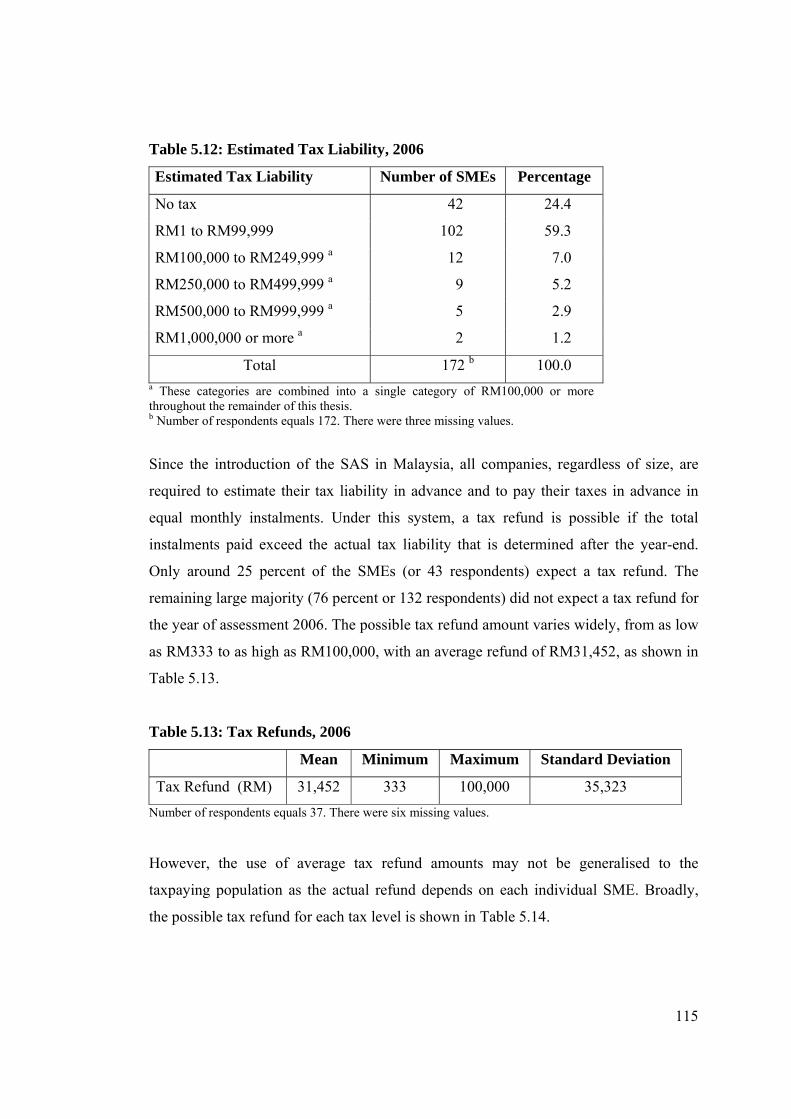
115
Table 5.12: Estimated Tax Liability, 2006
Estimated Tax Liability Number of SMEs Percentage
No tax 42 24.4
RM1 to RM99,999 102 59.3
RM100,000 to RM249,999 a 12 7.0
RM250,000 to RM499,999 a 9 5.2
RM500,000 to RM999,999 a 5 2.9
RM1,000,000 or more a 2 1.2
Total 172 b 100.0 a These categories are combined into a single category of RM100,000 or more throughout the remainder of this thesis. b Number of respondents equals 172. There were three missing values.
Since the introduction of the SAS in Malaysia, all companies, regardless of size, are
required to estimate their tax liability in advance and to pay their taxes in advance in
equal monthly instalments. Under this system, a tax refund is possible if the total
instalments paid exceed the actual tax liability that is determined after the year-end.
Only around 25 percent of the SMEs (or 43 respondents) expect a tax refund. The
remaining large majority (76 percent or 132 respondents) did not expect a tax refund for
the year of assessment 2006. The possible tax refund amount varies widely, from as low
as RM333 to as high as RM100,000, with an average refund of RM31,452, as shown in
Table 5.13.
Table 5.13: Tax Refunds, 2006
Mean Minimum Maximum Standard Deviation
Tax Refund (RM) 31,452 333 100,000 35,323
Number of respondents equals 37. There were six missing values.
However, the use of average tax refund amounts may not be generalised to the
taxpaying population as the actual refund depends on each individual SME. Broadly,
the possible tax refund for each tax level is shown in Table 5.14.

116
Table 5.14: Tax Refunds by Tax Liability, 2006
Estimated Tax Liability Number of SMEs Average Tax Refund (RM)
Nil (No tax) 6 18,083
RM1 to RM99,999 18 14,946
RM100,000 or more a 12 57,182
Overall 36 b 29,548 c a This is a merged category. For details refer Table 5.12. b Number of respondents equals 37. There was one missing value. c Due to the missing value (note b), the amount is lower than RM31,452 as cited in Table 5.13.
Finally, in terms of sources of income tax work, a specific question (question 13) was
asked on the usage of external advisors. As for internal tax work, this is implied from
their responses towards internal time spent on tax activities (question 9). Nonetheless, it
is fortunate that respondents specifically stated they had outsourced their tax affairs in
the space provided. An analysis of these two questions into source of income tax work
is summarised in Table 5.15.
Table 5.15: Source of Income Tax Work in 2006
Number of SMEs Percentage
Internal and External 159 90.9
No External (i.e. internal only) 10 5.7
No Internal (i.e. external only) 6 3.4
Total 175 100.0
Nearly 91 percent of the SMEs performed their income tax work by using both their
internal resources and paid external advisors, as shown in Table 5.15. The remaining
nine percent revealed that no income tax work is conducted either internally (six
companies) or externally (ten companies). This small proportion is realistic as there
may be some SMEs who fully outsourced their tax-related work. On the contrary, some
other SMEs who have expertise in this regard can conduct their own tax affairs.

117
5.4 INTERNAL COSTS OF COMPLIANCE
5.4.1 Tax Difficulties faced by the Small and Medium Enterprises
As presented earlier,126 respondents were asked to indicate tax-related difficulties in
complying with corporate income taxation. Respondents were given the option to select
more than one area. The most highly ranked difficult areas are ‘estimating income tax
payable’ (17 percent), ‘understanding the income tax legislation’ (14 percent), and the
‘increasing burden of record keeping requirements for tax purposes’ (14 percent), as
shown in Table 5.16. The least ranked difficult area is ‘dealing with external tax
professionals’ (five percent). Surprisingly, ‘maintaining records for income tax
purposes’ is ranked eight (out of nine). It seems that maintaining records was not
perceived as a major problem for SMEs. But concern on the increasing burden of record
keeping requirements is evident. Specific responses for each of the problem areas are
shown in Table 5.16 (right column). For example, 65 percent of the SMEs indicate
having problems pertaining to estimating their income tax payable.
126 See Chapter Four, Section 4.5.

118
Table 5.16: Tax-related Difficulties for SMEs in 2006
Number of Overall Percent
Responses Percent of Cases
Estimating Income Tax payable 106 16.8 65.0
Understanding Income Tax legislation 87 13.8 53.4
Increasing burden of record keeping for tax
purposes 87 13.8 53.4
Implementing the Income Tax changes 81 12.9 49.7
Cash flow position to pay monthly tax
instalments 78 12.4 47.9
Short period of time to lodge the tax return 58 9.2 35.6
Dealing with the tax authority 53 8.4 32.5
Maintaining records for Income Tax purpose 49 7.8 30.1
Dealing with external tax advisers 31 4.9 19.0
Total 630 a 100.0 - a Total responses exceed 175 as each respondent was allowed to select more than one aspect.
5.4.2 Internal Staff Time
Respondents were required to estimate their monthly average time spent in relation to
four different categories of personnel on tax activities and their corresponding wage
rates. However, for the purpose of analysis, monthly hours are converted to a yearly
basis and adopted throughout this thesis. A summary of yearly hours spent on tax
activities is shown in Table 5.17.

119
Table 5.17: Yearly Hours Spent on Tax Activities by Staff Categories, 2006
Staff Categories Mean Minimum a Maximum Standard Deviation
Manager/Accountant 126 0 552 129
Accounting Staff 229 0 1,200 266
Administrative Staff 133 0 1,200 225
Other Staff 87 0 1,008 178
Overall 575 0 3,000 511 a Six respondents spent no internal time (see Table 5.15). Around 75 percent of respondents estimated time spent as a combination of staff, namely, two (28 percent), three (14 percent) and four (33 percent) categories.
The average internal time spent on income tax activities for the tax year 2006 is 575
hours, as shown in Table 5.17. At the firm level, time spent ranges from zero time (i.e.
no internal time) to 3,000 hours. Specifically, time spent by ‘manager/accountant’
ranges from none to 552 hours per annum, while accounting and administrative staff
spend up to 1,200 yearly hours respectively, and the other staff spend up to 1,008 yearly
hours.
5.4.3 Time Valuation
Appropriate wage rates of relevant staff categories are presented in Table 5.18. This
information is crucial in converting total time spent to internal time cost. The average
monthly wage rate for ‘manager/accountant’ is almost RM3,500, which ranges widely
between RM1,000 and RM7,000, as shown in Table 5.18. The variation may relate to
their business characteristics. It is also possible that some respondents, particularly
owner-managers, may be responsible for several functions in their company. For
example, in addition to their general management function, owner-managers may
perform an accounting role as well. As for accounting staff, the average rate is just over
RM1,500, specifically ranging between RM400 and RM3,200. The remaining two
categories of staff receive an average of almost RM1,000 and RM750 respectively. The
actual rate for both of these categories ranges between RM300 and RM1,600.
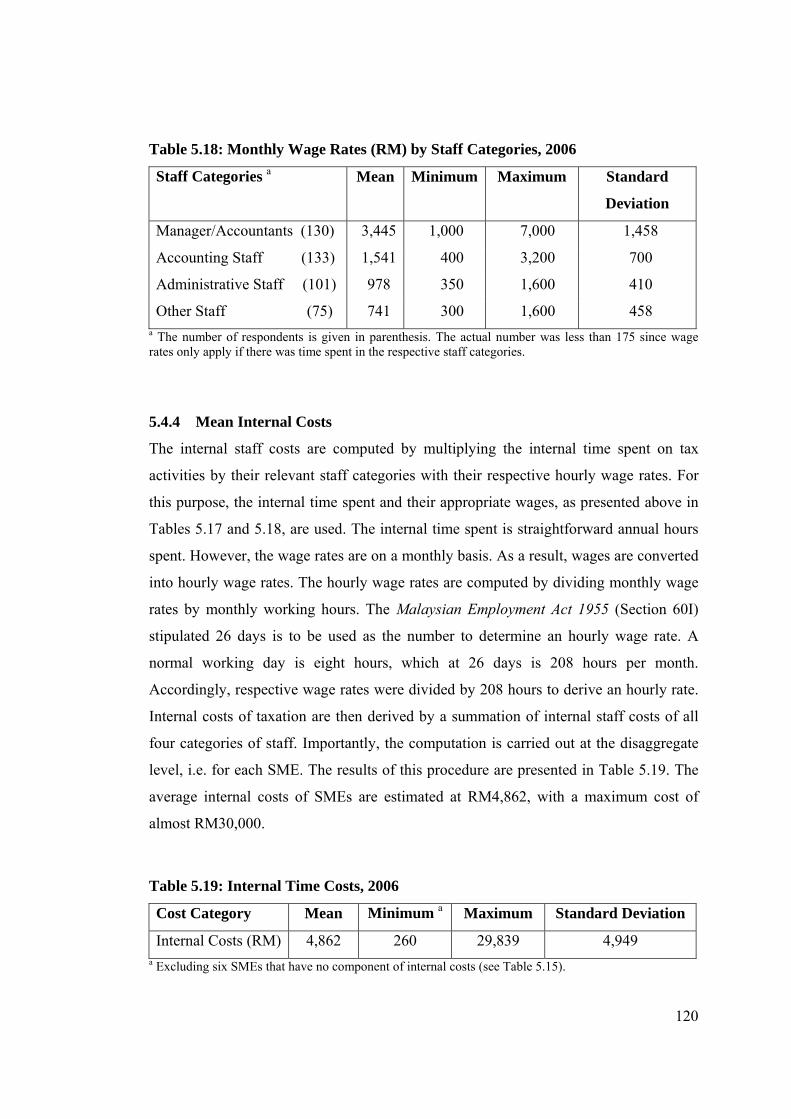
120
Table 5.18: Monthly Wage Rates (RM) by Staff Categories, 2006
Staff Categories a Mean Minimum Maximum Standard
Deviation
Manager/Accountants (130) 3,445 1,000 7,000 1,458
Accounting Staff (133) 1,541 400 3,200 700
Administrative Staff (101) 978 350 1,600 410
Other Staff (75) 741 300 1,600 458 a The number of respondents is given in parenthesis. The actual number was less than 175 since wage rates only apply if there was time spent in the respective staff categories.
5.4.4 Mean Internal Costs
The internal staff costs are computed by multiplying the internal time spent on tax
activities by their relevant staff categories with their respective hourly wage rates. For
this purpose, the internal time spent and their appropriate wages, as presented above in
Tables 5.17 and 5.18, are used. The internal time spent is straightforward annual hours
spent. However, the wage rates are on a monthly basis. As a result, wages are converted
into hourly wage rates. The hourly wage rates are computed by dividing monthly wage
rates by monthly working hours. The Malaysian Employment Act 1955 (Section 60I)
stipulated 26 days is to be used as the number to determine an hourly wage rate. A
normal working day is eight hours, which at 26 days is 208 hours per month.
Accordingly, respective wage rates were divided by 208 hours to derive an hourly rate.
Internal costs of taxation are then derived by a summation of internal staff costs of all
four categories of staff. Importantly, the computation is carried out at the disaggregate
level, i.e. for each SME. The results of this procedure are presented in Table 5.19. The
average internal costs of SMEs are estimated at RM4,862, with a maximum cost of
almost RM30,000.
Table 5.19: Internal Time Costs, 2006
Cost Category Mean Minimum a Maximum Standard Deviation
Internal Costs (RM) 4,862 260 29,839 4,949 a Excluding six SMEs that have no component of internal costs (see Table 5.15).

121
5.5 EXTERNAL COSTS OF COMPLIANCE
5.5.1 Mean External Tax Fees
As presented earlier,127 almost 95 percent of SMEs have used external tax professionals
in managing their corporate tax affairs for the year of assessment 2006. External costs
of compliance are a straightforward monetary cost charged by external tax professionals
solely on tax activities. It is common in Malaysia to have tax fees charged separately
from financial audit or other fees. However, it is possible that some SMEs may refuse to
indicate their actual tax fees. Thus, respondents were asked to provide or estimate their
external tax fees for the financial year 2006. The average tax fee paid by SME
companies in 2006 is RM3,786, with the lowest and highest fee being RM150 and
RM15,000 respectively, as shown in Table 5.20.
Table 5.20: A Summary of External Tax Professional Fees, 2006
Cost Category Mean Minimum a Maximum Standard Deviation
Tax Fees (RM) 3,786 150 15,000 3,945 a Excluding ten SMEs that have no component of external costs (see Table 5.15).
5.5.2 Reasons for Using External Services
The respondents were asked to indicate the main reason for using a paid external tax
professional. As it is possible that there could be a number of reasons, respondents were
given a choice to select more than one response. The most stated reason is the lack of
technical knowledge internally (28 percent), followed by the complexity of the tax laws
(23 percent) as shown in Table 5.21. Specifically, almost 81 percent and 67 percent of
the respondents indicate a lack of technical knowledge and tax law complexity
respectively as their main reason for using tax professionals. The lowest response is for
the purpose of income tax planning, where just over 39 percent have identified this
reason.
127 See Table 5.15.

122
Table 5.21: Main Reason for using External Tax Professionals in 2006
Main Reason Number of Overall Percent
Responses Percent of Cases
Technical knowledge is not readily available
internally 129 28.1 80.6
Income tax matters are too complicated 105 22.9 65.6
External opinion was required 86 18.7 53.8
It is more cost-effective to use external tax
professionals 76 16.6 47.5
For income tax planning 63 13.7 39.4
Total 459 a 100.0 - a Total responses exceed 175 as each respondent was allowed to select more than one aspect.
5.6 ADDITIONAL COSTS OF COMPLIANCE
5.6.1 Mean Additional Costs
Broadly, additional non-staff costs are incurred both within a company and by external
professionals. In Malaysia, it is common for tax professionals to reimburse those costs
from their tax clients. The amount is included in the tax invoice, but shown separately
from tax fees. A similar approach is practiced in the context of financial auditing. Just
over 37 percent of the respondents (or 65 respondents) incurred other non-staff
additional costs in meeting their corporate income tax requirements. The remaining
large majority (63 percent or 110 respondents) did not spend any amount of additional
costs in 2006. Additional non-staff costs range widely from RM20 to RM6,000, as
shown in Table 5.22.

123
Table 5.22: A Summary of Estimated Additional Non-staff Costs, 2006
Cost Category Mean Minimum a Maximum Standard
Deviation
Additional Costs (RM) 646 20 6,000 1,583 a Excluding 110 SMEs that spent no additional costs.
5.6.2 Nature of Additional Costs
As for the nature of costs, 60 respondents (out of 65) provided details to an open-ended
question on the nature of their non-staff additional costs. The respondents stated
between one and four cost items. Four cost items, namely postage and courier,
stationery, travelling and printing, comprise more than 90 percent of responses, as
shown in Table 5.23. Specifically, for individual cost items, the most stated cost is
postage and courier (57 percent), followed by stationery (52 percent), travelling cost (47
percent) and printing and documentation (25 percent).
Table 5.23: Nature of Additional Costs in 2006
Number of Overall Percent
Cost Description Responses Percent of Cases
Postage and Courier 34 28.6 56.7
Stationery 31 26.1 51.7
Travelling 28 23.5 46.7
Printing & Documentation 15 12.6 25.0
Communication (Telephone/Fax) 3 2.5 5.0
Software-related 1 0.8 1.7
Miscellaneous 7 5.9 11.7
Total 119 a 100.0 - a Number of respondents equals 60. Another five have missing values. Total responses exceed 60 as respondents were allowed to select more than one aspect.
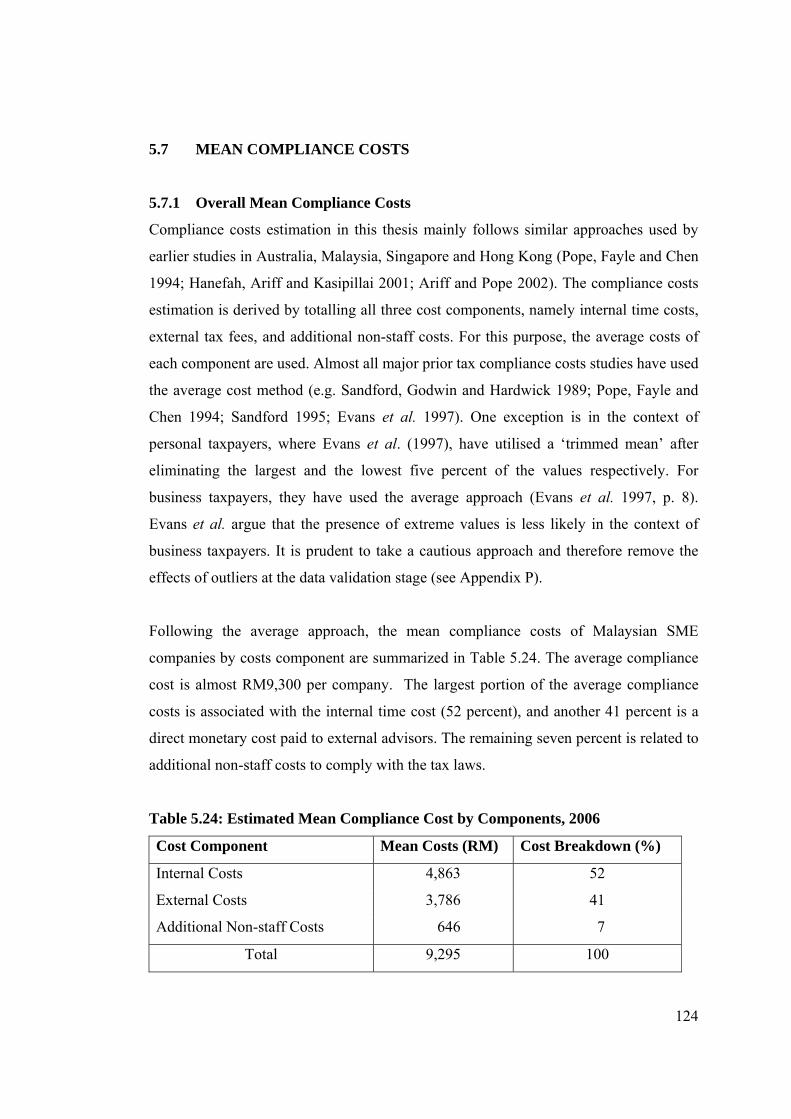
124
5.7 MEAN COMPLIANCE COSTS
5.7.1 Overall Mean Compliance Costs
Compliance costs estimation in this thesis mainly follows similar approaches used by
earlier studies in Australia, Malaysia, Singapore and Hong Kong (Pope, Fayle and Chen
1994; Hanefah, Ariff and Kasipillai 2001; Ariff and Pope 2002). The compliance costs
estimation is derived by totalling all three cost components, namely internal time costs,
external tax fees, and additional non-staff costs. For this purpose, the average costs of
each component are used. Almost all major prior tax compliance costs studies have used
the average cost method (e.g. Sandford, Godwin and Hardwick 1989; Pope, Fayle and
Chen 1994; Sandford 1995; Evans et al. 1997). One exception is in the context of
personal taxpayers, where Evans et al. (1997), have utilised a ‘trimmed mean’ after
eliminating the largest and the lowest five percent of the values respectively. For
business taxpayers, they have used the average approach (Evans et al. 1997, p. 8).
Evans et al. argue that the presence of extreme values is less likely in the context of
business taxpayers. It is prudent to take a cautious approach and therefore remove the
effects of outliers at the data validation stage (see Appendix P).
Following the average approach, the mean compliance costs of Malaysian SME
companies by costs component are summarized in Table 5.24. The average compliance
cost is almost RM9,300 per company. The largest portion of the average compliance
costs is associated with the internal time cost (52 percent), and another 41 percent is a
direct monetary cost paid to external advisors. The remaining seven percent is related to
additional non-staff costs to comply with the tax laws.
Table 5.24: Estimated Mean Compliance Cost by Components, 2006
Cost Component Mean Costs (RM) Cost Breakdown (%)
Internal Costs 4,863 52
External Costs 3,786 41
Additional Non-staff Costs 646 7
Total 9,295 100
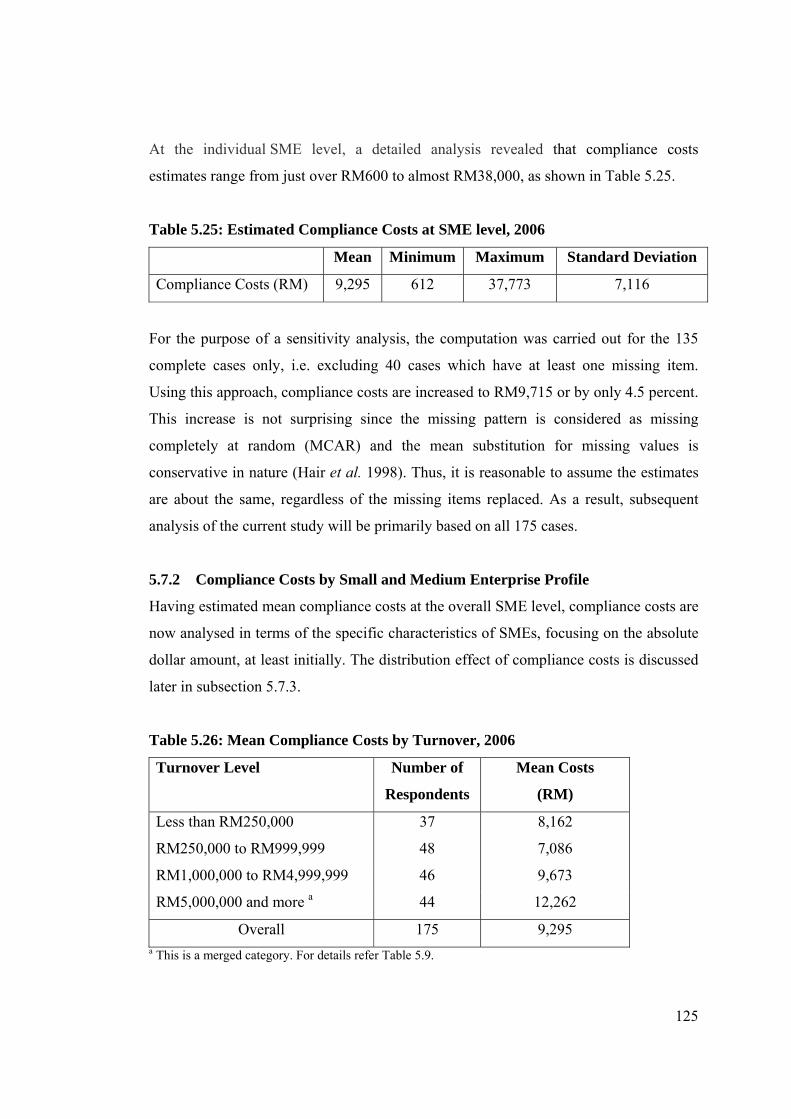
125
At the individual SME level, a detailed analysis revealed that compliance costs
estimates range from just over RM600 to almost RM38,000, as shown in Table 5.25.
Table 5.25: Estimated Compliance Costs at SME level, 2006
Mean Minimum Maximum Standard Deviation
Compliance Costs (RM) 9,295 612 37,773 7,116
For the purpose of a sensitivity analysis, the computation was carried out for the 135
complete cases only, i.e. excluding 40 cases which have at least one missing item.
Using this approach, compliance costs are increased to RM9,715 or by only 4.5 percent.
This increase is not surprising since the missing pattern is considered as missing
completely at random (MCAR) and the mean substitution for missing values is
conservative in nature (Hair et al. 1998). Thus, it is reasonable to assume the estimates
are about the same, regardless of the missing items replaced. As a result, subsequent
analysis of the current study will be primarily based on all 175 cases.
5.7.2 Compliance Costs by Small and Medium Enterprise Profile
Having estimated mean compliance costs at the overall SME level, compliance costs are
now analysed in terms of the specific characteristics of SMEs, focusing on the absolute
dollar amount, at least initially. The distribution effect of compliance costs is discussed
later in subsection 5.7.3.
Table 5.26: Mean Compliance Costs by Turnover, 2006
Turnover Level
Number of
Respondents
Mean Costs
(RM)
Less than RM250,000 37 8,162
RM250,000 to RM999,999 48 7,086
RM1,000,000 to RM4,999,999 46 9,673
RM5,000,000 and more a 44 12,262
Overall 175 9,295 a This is a merged category. For details refer Table 5.9.

126
There is a trend of increasing compliance costs as the turnover level increases, as shown
in Table 5.26.128 An exception is noted for SMEs with a turnover level of between
RM250,000 and RM1 million, with this category having the lowest compliance costs.
Although this exception may suggest a U-shaped trend, this is not supported
statistically. Specifically, a post hoc test reveals that significant differences exist
between SMEs in the first two turnover levels (up to RM1 million) and the last turnover
level (at least RM5 million).
An alternative measure of size is the number of staff employed. Compliance costs (in
absolute value) increase as the size (measured by staff) becomes larger, as shown in
Table 5.27. However, the ANOVA test did not reveal any significant differences (f =
2.341, p = 0.057) in terms of staff levels.
Table 5.27: Mean Compliance Costs by Staff Level, 2006
Number of Staff a
Number of
Respondents
Mean Costs
(RM)
4 or less 35 7,466
5 to 19 85 8,981
20 to 50 40 10,609
51 to 150 14 10,937
Overall 174 a 9,295 a Number of respondents equals 175. A respondent with more than 151 staff was excluded.
Compliance costs are further analysed by business sector, length in business and paid-
up capital. For the business sector (Table 5.28), compliance costs for the manufacturing
and construction sectors are relatively higher compared to the other sectors. However,
an ANOVA test did not reveal any significant mean differences within business sectors.
128 The compliance costs differences among turnover levels are supported by an ANOVA test (f = 4.734, p = 0.003).
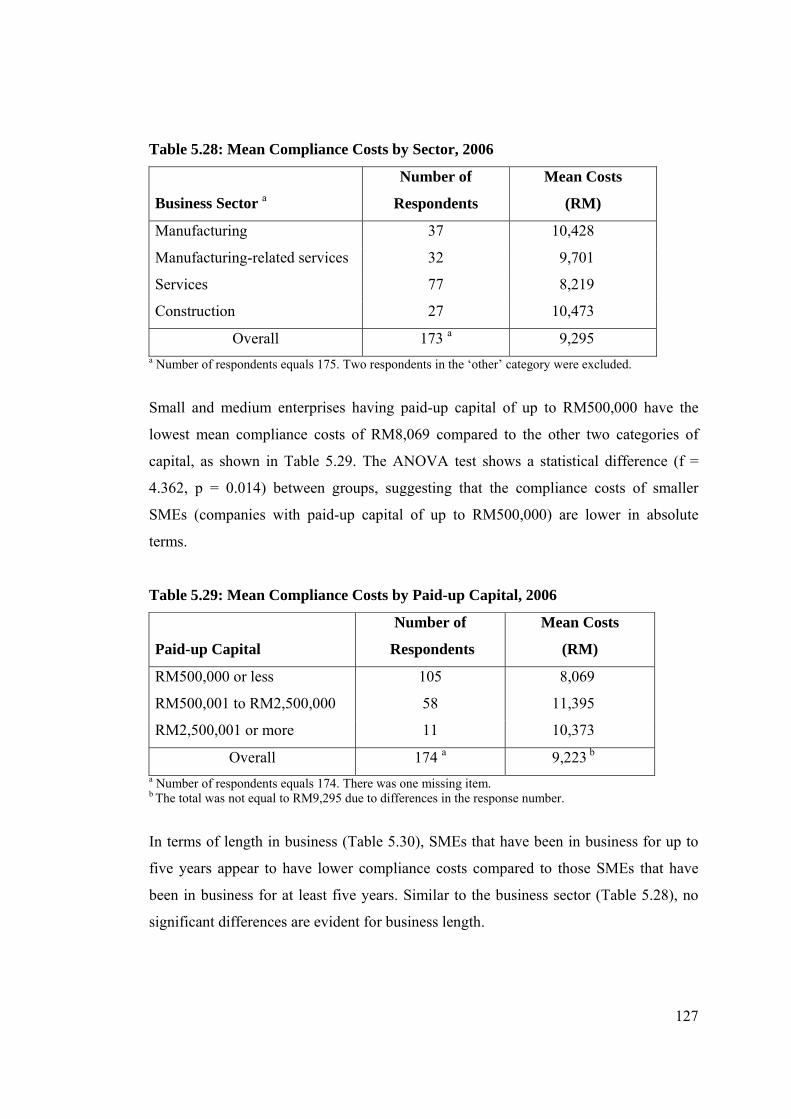
127
Table 5.28: Mean Compliance Costs by Sector, 2006
Business Sector a
Number of
Respondents
Mean Costs
(RM)
Manufacturing 37 10,428
Manufacturing-related services 32 9,701
Services 77 8,219
Construction 27 10,473
Overall 173 a 9,295 a Number of respondents equals 175. Two respondents in the ‘other’ category were excluded.
Small and medium enterprises having paid-up capital of up to RM500,000 have the
lowest mean compliance costs of RM8,069 compared to the other two categories of
capital, as shown in Table 5.29. The ANOVA test shows a statistical difference (f =
4.362, p = 0.014) between groups, suggesting that the compliance costs of smaller
SMEs (companies with paid-up capital of up to RM500,000) are lower in absolute
terms.
Table 5.29: Mean Compliance Costs by Paid-up Capital, 2006
Paid-up Capital
Number of
Respondents
Mean Costs
(RM)
RM500,000 or less 105 8,069
RM500,001 to RM2,500,000 58 11,395
RM2,500,001 or more 11 10,373
Overall 174 a 9,223 b a Number of respondents equals 174. There was one missing item. b The total was not equal to RM9,295 due to differences in the response number.
In terms of length in business (Table 5.30), SMEs that have been in business for up to
five years appear to have lower compliance costs compared to those SMEs that have
been in business for at least five years. Similar to the business sector (Table 5.28), no
significant differences are evident for business length.

128
Table 5.30: Mean Compliance Costs by Length in Business, 2006
Years in Business
Number of
Respondents
Mean Costs
(RM)
Up to 5 years a 38 7,980
More than 5 years 137 9,659
Overall 175 9,295 a This is a merged category. For details refer Table 5.7.
Compliance costs were then analysed by size as per NSDC criteria. Similar to the other
size measures, tax compliance costs increase as the size of SMEs increase, as shown in
Table 5.31. Unfortunately, the ANOVA test did not reveal any significant differences in
terms of the NSDC size.
Table 5.31: Mean Compliance Costs by SMEs as per NSDC Criteria, 2006
Business Size
Number of
Respondents
Mean Costs
(RM)
Micro 54 7,741
Small 98 9,777
Medium 23 10,888
Overall 175 9,295
As noted earlier,129 compliance costs by size (that is measured by turnover groups)
indicate a significant statistical difference between turnover levels, but not by size as
per the NSDC classification. The results are not surprising since the NSDC
classification of a SME into micro, small and medium is somewhat mixed with both
turnover and staff criteria, and more importantly different specific levels apply among
different sectors.130
129 See paragraph below Table 5.26. 130 See Chapter One, subsection 1.5.3.

129
5.7.3 Distribution of Compliance Costs
The distribution of compliance costs of Malaysian SMEs by size, expressed as a
percentage of turnover, follow the usual regressive pattern, as shown in Table 5.32. Tax
compliance costs as a percentage of turnover for SMEs in a less than RM250,000 level
are 6.5 percent, followed by about one percent of those in the turnover level of
RM250,000 to RM1 million, and 0.32 percent for those in the RM1 million to RM5
million turnover category. Compliance costs for SMEs having turnover of at least RM5
million are only 0.08 percent. It is apparent that the relative costs, as a percentage of
turnover, fall significantly as the turnover level increases. As an extreme comparison,
the compliance costs percentage for SMEs in the lowest turnover level is as much as 82
times higher than for the highest level of turnover. The compliance costs for SME
companies, taken as a single category, are estimated to be around 0.19 percent of their
average weighted turnover level.
Table 5.32: Mean Compliance Costs as Percentage of Turnover, 2006
Turnover Level a, b Compliance Costs
Mean (RM) Percentage of Turnover
Less than RM250,000 (37) 8,162 6.53
RM250,000 to RM999,999 (48) 7,086 1.13
RM1,000,000 to RM4,999,999 (46) 9,673 0.32
RM5,000,000 and more (44) 12,262 0.08
Overall (175) 9,295 0.19 c a The number of respondents is given in parentheses. b The denominator used is the midpoint of the turnover category, except for the largest, where RM15 million is used, because the actual mean size of the turnover is not available. c The denominator used for the overall SME turnover category is RM5 million. This denominator is derived by weighting all the midpoints of the turnover level, rounded to the nearest million. Weighting using the original turnover levels (see Table 5.9) also results in a similar figure.
A similar trend is evident even when compliance costs distributions are analysed in
terms of all three cost components (internal, external and additional costs), as presented
in Tables 5.33, 5.34 and 5.35. The internal costs for SMEs in the less than RM250,000
turnover level are as much as six times higher in percentage terms as the next level
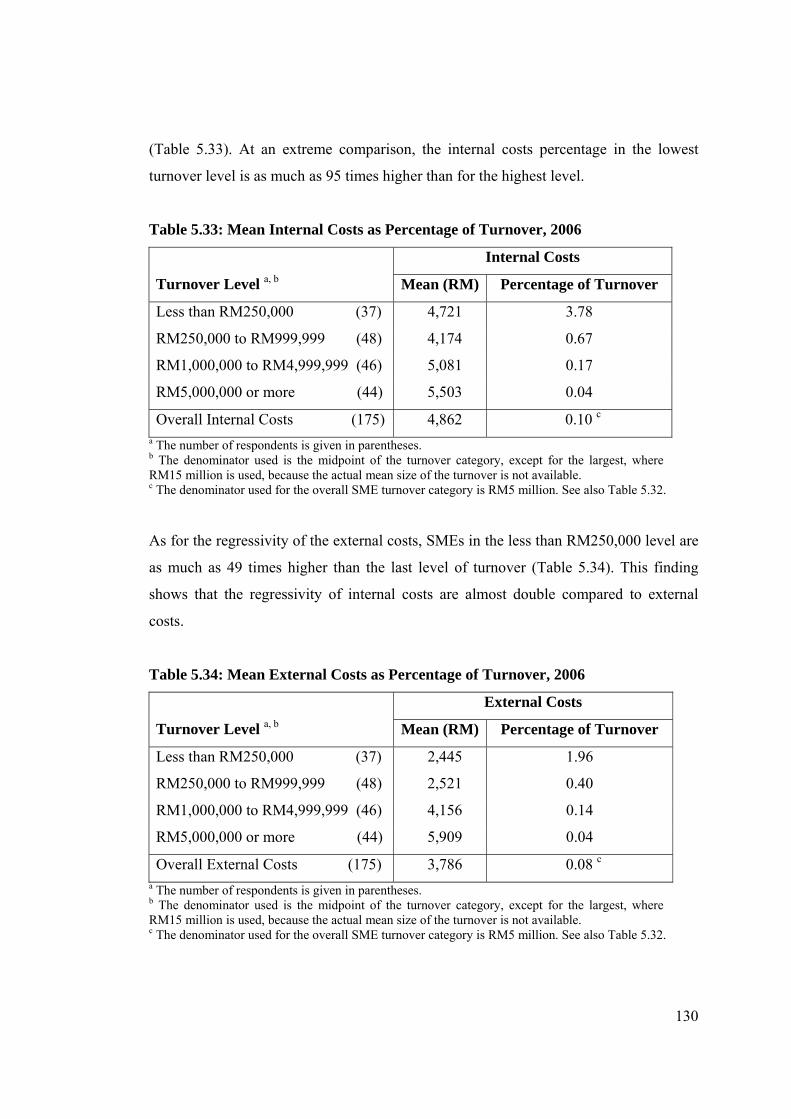
130
(Table 5.33). At an extreme comparison, the internal costs percentage in the lowest
turnover level is as much as 95 times higher than for the highest level.
Table 5.33: Mean Internal Costs as Percentage of Turnover, 2006
Internal Costs
Turnover Level a, b Mean (RM) Percentage of Turnover
Less than RM250,000 (37) 4,721 3.78
RM250,000 to RM999,999 (48) 4,174 0.67
RM1,000,000 to RM4,999,999 (46) 5,081 0.17
RM5,000,000 or more (44) 5,503 0.04
Overall Internal Costs (175) 4,862 0.10 c a The number of respondents is given in parentheses. b The denominator used is the midpoint of the turnover category, except for the largest, where RM15 million is used, because the actual mean size of the turnover is not available. c The denominator used for the overall SME turnover category is RM5 million. See also Table 5.32.
As for the regressivity of the external costs, SMEs in the less than RM250,000 level are
as much as 49 times higher than the last level of turnover (Table 5.34). This finding
shows that the regressivity of internal costs are almost double compared to external
costs.
Table 5.34: Mean External Costs as Percentage of Turnover, 2006
External Costs
Turnover Level a, b Mean (RM) Percentage of Turnover
Less than RM250,000 (37) 2,445 1.96
RM250,000 to RM999,999 (48) 2,521 0.40
RM1,000,000 to RM4,999,999 (46) 4,156 0.14
RM5,000,000 or more (44) 5,909 0.04
Overall External Costs (175) 3,786 0.08 c a The number of respondents is given in parentheses. b The denominator used is the midpoint of the turnover category, except for the largest, where RM15 million is used, because the actual mean size of the turnover is not available. c The denominator used for the overall SME turnover category is RM5 million. See also Table 5.32.

131
Finally, a similar regressive pattern towards smaller SMEs is also evident for additional
costs percentage, as shown in Table 5.35. Overall, as expected, compliance costs as a
percentage of turnover, either measured by overall costs, internal costs, external costs or
additional costs, shared one major similarity, which is the incidence of the fixed costs
effect.
Table 5.35: Mean Additional Costs as Percentage of Turnover, 2006
Additional Costs
Turnover Level a, b Mean (RM) Percentage of Turnover
Less than RM250,000 (37) 996 0.800
RM250,000 to RM999,999 (48) 391 0.060
RM1,000,000 to RM4,999,999 (46) 436 0.014
RM5,000,000 or more (44) 850 0.006
Overall Additional Costs (175) 646 0.013 c a The number of respondents is given in parentheses. b The denominator used is the midpoint of the turnover category, except for the largest, where RM15 million is used, because the actual mean size of the turnover is not available. c The denominator used for the overall SME turnover category is RM5 million. See also Table 5.32.
In terms of absolute value, only the external costs increase as the turnover level
increases. The significant mean difference between turnover levels was confirmed by
way of an ANOVA test (f = 8.405, p = 0.000). A further examination with a post hoc
test reveals that considerable differences exist between SMEs in the first two turnover
levels (up to RM1 million) and the last turnover levels (at least RM5 million). On the
other hand, both the internal and additional costs are found to be similar, regardless of
the turnover levels. Though a direct comparison indicates a possible U-shaped trend, the
ANOVA tests suggest no statistical mean differences among turnover levels to both
internal costs (f = 0.591, p = 0.622) and additional costs (f = 1.661, p = 0.177)
respectively. Analysis with regards to overall compliance costs was discussed earlier.131
131 See previous subsection 5.7.2.
132
5.7.4 Compliance Costs Analysis by Internal-External Ratio
The internal-external compliance costs ratio is computed by dividing the means of
internal and external costs respectively to derive an overall mean for compliance costs.
The approach adapted was similar to that used in earlier studies (Pope, Fayle and Chen
1994; Ariff, Ismail and Loh 1997; Hanefah, Ariff and Kasipillai 2001). For analysis
purposes, as in all previous studies, additional costs are considered to be incurred
internally. In Malaysia, broadly, additional costs are incurred mainly within the
company and to some extent by the external professional. The current study did not
attempt to measure this specifically as it is too demanding to obtain such detailed
information via a survey.
Overall, the internal and external component of compliance costs is 59 and 41 percent
respectively, suggesting relatively more tax compliance activities were conducted
internally. It is useful to scrutinize the internal-external costs ratio by turnover and other
key SME profiles. The internal-external compliance costs ratio analysed by turnover
level, as shown in Table 5.36, indicates that the internal costs (external costs) ratio is
decreasing (increasing) as the turnover level increases. The internal costs ratio of SMEs
in the lowest turnover level (less than RM250,000) is six, 13 and 18 percent higher than
the second, third and the highest turnover levels respectively, or 11 percent higher than
the overall internal costs ratio of 59 percent. An ANOVA test reveals that the mean
differences are significant at the five percent significant level (f = 2.715, p = 0.022).
The findings suggest that the smaller the SMEs, the higher their internal costs ratio and
the lower the external costs respectively, suggesting a considerable reliance on the
internal costs component.
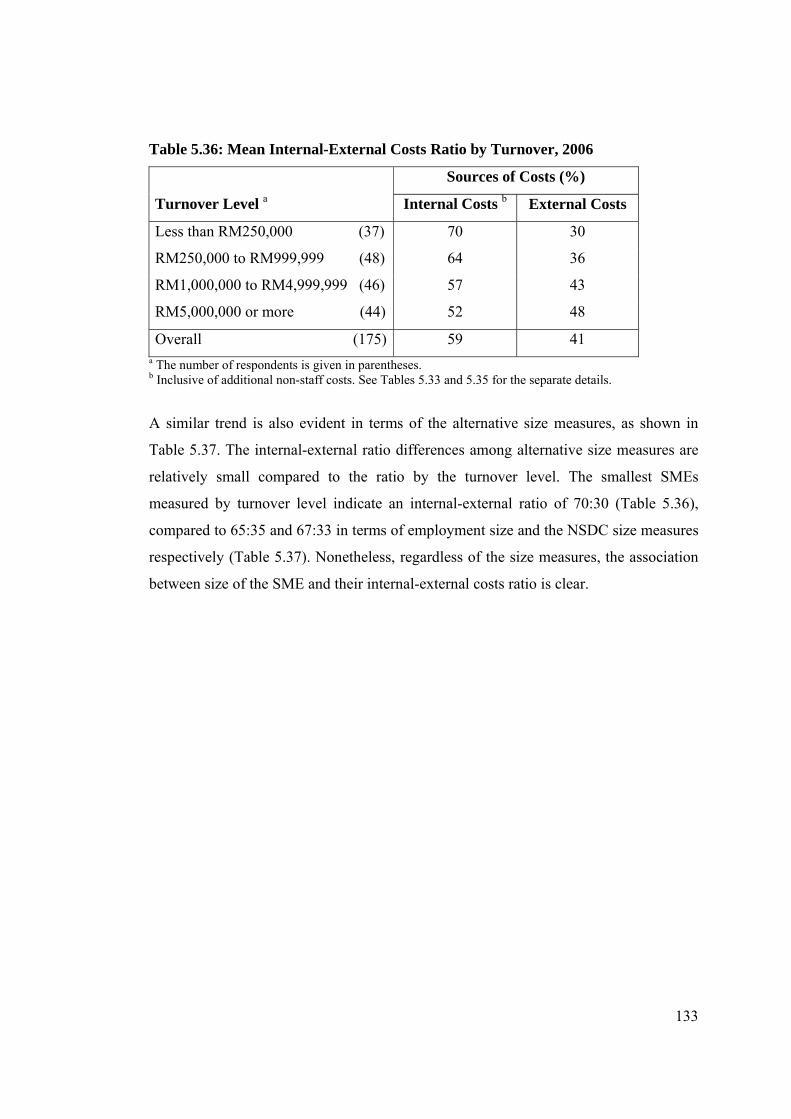
133
Table 5.36: Mean Internal-External Costs Ratio by Turnover, 2006
Sources of Costs (%)
Turnover Level a Internal Costs b External Costs
Less than RM250,000 (37) 70 30
RM250,000 to RM999,999 (48) 64 36
RM1,000,000 to RM4,999,999 (46) 57 43
RM5,000,000 or more (44) 52 48
Overall (175) 59 41 a The number of respondents is given in parentheses. b Inclusive of additional non-staff costs. See Tables 5.33 and 5.35 for the separate details.
A similar trend is also evident in terms of the alternative size measures, as shown in
Table 5.37. The internal-external ratio differences among alternative size measures are
relatively small compared to the ratio by the turnover level. The smallest SMEs
measured by turnover level indicate an internal-external ratio of 70:30 (Table 5.36),
compared to 65:35 and 67:33 in terms of employment size and the NSDC size measures
respectively (Table 5.37). Nonetheless, regardless of the size measures, the association
between size of the SME and their internal-external costs ratio is clear.
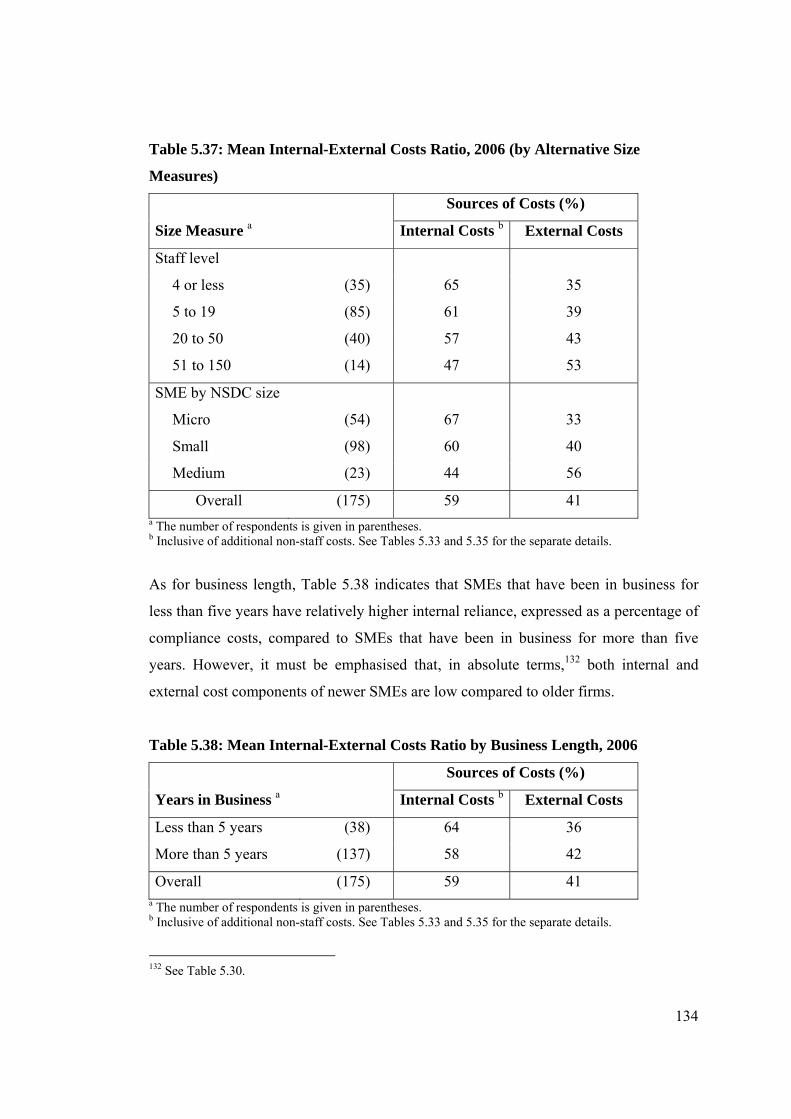
134
Table 5.37: Mean Internal-External Costs Ratio, 2006 (by Alternative Size
Measures)
Sources of Costs (%)
Size Measure a Internal Costs b External Costs
Staff level
4 or less (35) 65 35
5 to 19 (85) 61 39
20 to 50 (40) 57 43
51 to 150 (14) 47 53
SME by NSDC size
Micro (54) 67 33
Small (98) 60 40
Medium (23) 44 56
Overall (175) 59 41 a The number of respondents is given in parentheses. b Inclusive of additional non-staff costs. See Tables 5.33 and 5.35 for the separate details.
As for business length, Table 5.38 indicates that SMEs that have been in business for
less than five years have relatively higher internal reliance, expressed as a percentage of
compliance costs, compared to SMEs that have been in business for more than five
years. However, it must be emphasised that, in absolute terms,132 both internal and
external cost components of newer SMEs are low compared to older firms.
Table 5.38: Mean Internal-External Costs Ratio by Business Length, 2006
Sources of Costs (%)
Years in Business a Internal Costs b External Costs
Less than 5 years (38) 64 36
More than 5 years (137) 58 42
Overall (175) 59 41 a The number of respondents is given in parentheses. b Inclusive of additional non-staff costs. See Tables 5.33 and 5.35 for the separate details.
132 See Table 5.30.
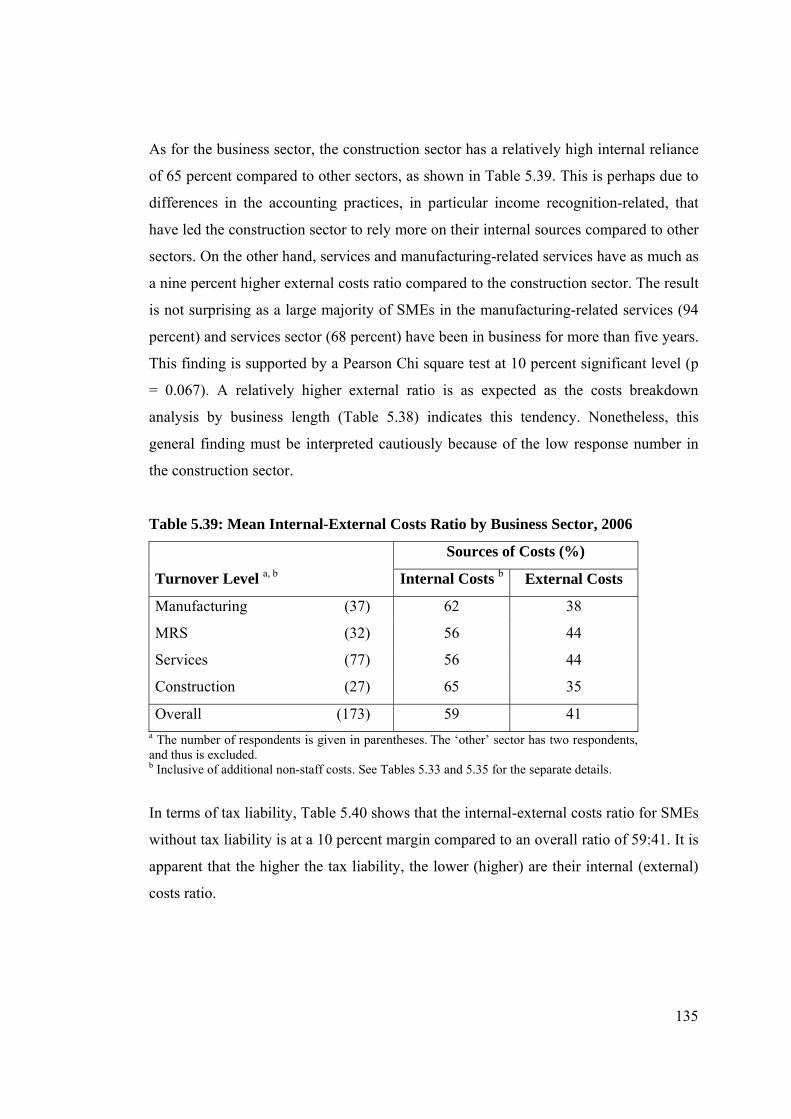
135
As for the business sector, the construction sector has a relatively high internal reliance
of 65 percent compared to other sectors, as shown in Table 5.39. This is perhaps due to
differences in the accounting practices, in particular income recognition-related, that
have led the construction sector to rely more on their internal sources compared to other
sectors. On the other hand, services and manufacturing-related services have as much as
a nine percent higher external costs ratio compared to the construction sector. The result
is not surprising as a large majority of SMEs in the manufacturing-related services (94
percent) and services sector (68 percent) have been in business for more than five years.
This finding is supported by a Pearson Chi square test at 10 percent significant level (p
= 0.067). A relatively higher external ratio is as expected as the costs breakdown
analysis by business length (Table 5.38) indicates this tendency. Nonetheless, this
general finding must be interpreted cautiously because of the low response number in
the construction sector.
Table 5.39: Mean Internal-External Costs Ratio by Business Sector, 2006
Sources of Costs (%)
Turnover Level a, b Internal Costs b External Costs
Manufacturing (37) 62 38
MRS (32) 56 44
Services (77) 56 44
Construction (27) 65 35
Overall (173) 59 41 a The number of respondents is given in parentheses. The ‘other’ sector has two respondents, and thus is excluded. b Inclusive of additional non-staff costs. See Tables 5.33 and 5.35 for the separate details.
In terms of tax liability, Table 5.40 shows that the internal-external costs ratio for SMEs
without tax liability is at a 10 percent margin compared to an overall ratio of 59:41. It is
apparent that the higher the tax liability, the lower (higher) are their internal (external)
costs ratio.
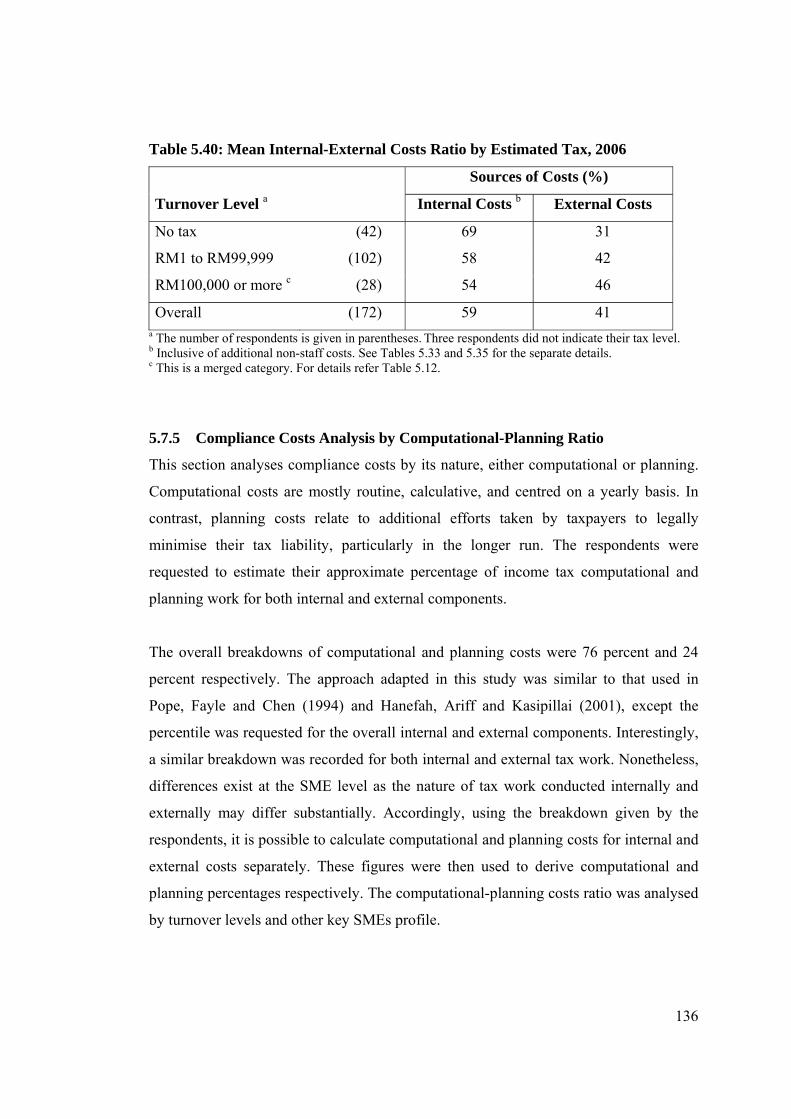
136
Table 5.40: Mean Internal-External Costs Ratio by Estimated Tax, 2006
Sources of Costs (%)
Turnover Level a Internal Costs b External Costs
No tax (42) 69 31
RM1 to RM99,999 (102) 58 42
RM100,000 or more c (28) 54 46
Overall (172) 59 41 a The number of respondents is given in parentheses. Three respondents did not indicate their tax level. b Inclusive of additional non-staff costs. See Tables 5.33 and 5.35 for the separate details. c This is a merged category. For details refer Table 5.12.
5.7.5 Compliance Costs Analysis by Computational-Planning Ratio
This section analyses compliance costs by its nature, either computational or planning.
Computational costs are mostly routine, calculative, and centred on a yearly basis. In
contrast, planning costs relate to additional efforts taken by taxpayers to legally
minimise their tax liability, particularly in the longer run. The respondents were
requested to estimate their approximate percentage of income tax computational and
planning work for both internal and external components.
The overall breakdowns of computational and planning costs were 76 percent and 24
percent respectively. The approach adapted in this study was similar to that used in
Pope, Fayle and Chen (1994) and Hanefah, Ariff and Kasipillai (2001), except the
percentile was requested for the overall internal and external components. Interestingly,
a similar breakdown was recorded for both internal and external tax work. Nonetheless,
differences exist at the SME level as the nature of tax work conducted internally and
externally may differ substantially. Accordingly, using the breakdown given by the
respondents, it is possible to calculate computational and planning costs for internal and
external costs separately. These figures were then used to derive computational and
planning percentages respectively. The computational-planning costs ratio was analysed
by turnover levels and other key SMEs profile.

137
The computational-planning costs ratio, analysed by turnover level, is shown in Table
5.41. The computational (planning) costs range between 69 percent (31 percent) and 76
percent (24 percent) of the compliance costs of SMEs. Overall, the computational-
planning costs ratio is about the same regardless of the turnover levels. An exception is
observed for the SMEs with a turnover level of less than RM250,000. However, the fact
that this turnover level has only 23 responses must be treated with some caution.
Table 5.41: Mean Computational-Planning Costs Ratio by Turnover, 2006
Types of Costs
Turnover Level a Computational Planning
RM Percent RM Percent
Less than RM250,000 (23) 5,941 69 2,684 31
RM250,000 to RM999,999 (37) 5,302 75 1,769 25
RM1,000,000 to RM4,999,999 (40) 7,666 75 2,496 25
RM5,000,000 or more b (44) 9,638 76 3,074 24
Overall (134) 7,217 74 2,474 26 a The number of respondents is given in parentheses. Forty-one respondents did not indicate their estimated percentage for at least one of their computational or planning costs. b This is a merged category. For details refer Table 5.9.
Computational-planning costs ratio, analysed by staff number and the NSDC definition
(Table 5.42), indicate a slight increase (decrease) in the computational (planning) ratio
as the size becomes larger, particularly over the smallest SMEs. Some caution is
necessary in interpreting this overall trend as a few categories, particularly the highest
level, have less than 30 responses.

138
Table 5.42: Mean Computational-Planning Costs Ratio by Other Size Measures,
2006
Types of Costs
Size Measure a Computational Planning
RM Percent RM Percent
Staff level b
4 or less (21) 5,005 71 2,011 29
5 to 19 (65) 6,668 74 2,302 26
20 to 50 (33) 9,110 77 2,731 23
51 to 150 (14) 8,195 75 2,742 25
SME by NSDC size
Micro (32) 5,395 69 2,382 31
Small (80) 7,586 76 2,425 24
Medium (22) 8,528 75 2,787 25
Overall (134) 7,217 74 2,474 26 a The number of respondents is given in parentheses. Forty-one respondents did not indicate their estimated percentage for at least one of their computational or planning costs. b One respondent with more than 151 staff was excluded.
By business sector (Table 5.43), the services sector has the highest computational cost
breakdown (79 percent) and the ratio was significantly different from other sectors
(between 71 and 74 percent).133 This partly could be explained by the business length. It
was found that almost one-third of the respondents in the services sector were less than
five years old.134 On the other hand, manufacturing and construction sectors have as
much as an eight percent higher planning costs ratio compared to the services sector.
Similar to findings with regards to internal-external costs ratio, income recognition
policy may have led the construction sector to focus more on tax planning aspects
compared to other sectors. As for the manufacturing sector, a large number of
respondents (86 percent) have been in business for more than five years. It is likely that
older businesses might pay more attention to tax planning aspects rather than to the
133 Supported by ANOVA test at the five percent significant level (f = 2.646, p = 0.036). 134 Chi-square was significant at 10 percent level (p = 0.067).
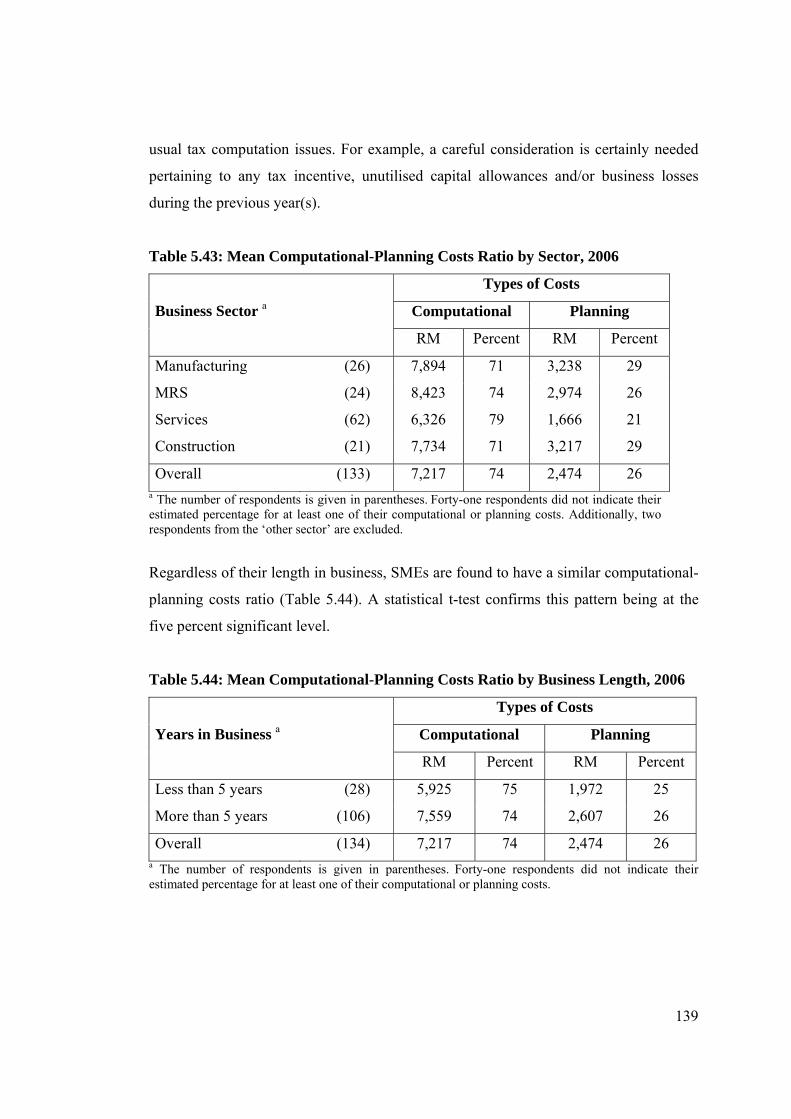
139
usual tax computation issues. For example, a careful consideration is certainly needed
pertaining to any tax incentive, unutilised capital allowances and/or business losses
during the previous year(s).
Table 5.43: Mean Computational-Planning Costs Ratio by Sector, 2006
Types of Costs
Business Sector a Computational Planning
RM Percent RM Percent
Manufacturing (26) 7,894 71 3,238 29
MRS (24) 8,423 74 2,974 26
Services (62) 6,326 79 1,666 21
Construction (21) 7,734 71 3,217 29
Overall (133) 7,217 74 2,474 26 a The number of respondents is given in parentheses. Forty-one respondents did not indicate their estimated percentage for at least one of their computational or planning costs. Additionally, two respondents from the ‘other sector’ are excluded.
Regardless of their length in business, SMEs are found to have a similar computational-
planning costs ratio (Table 5.44). A statistical t-test confirms this pattern being at the
five percent significant level.
Table 5.44: Mean Computational-Planning Costs Ratio by Business Length, 2006
Types of Costs
Years in Business a Computational Planning
RM Percent RM Percent
Less than 5 years (28) 5,925 75 1,972 25
More than 5 years (106) 7,559 74 2,607 26
Overall (134) 7,217 74 2,474 26 a The number of respondents is given in parentheses. Forty-one respondents did not indicate their estimated percentage for at least one of their computational or planning costs.
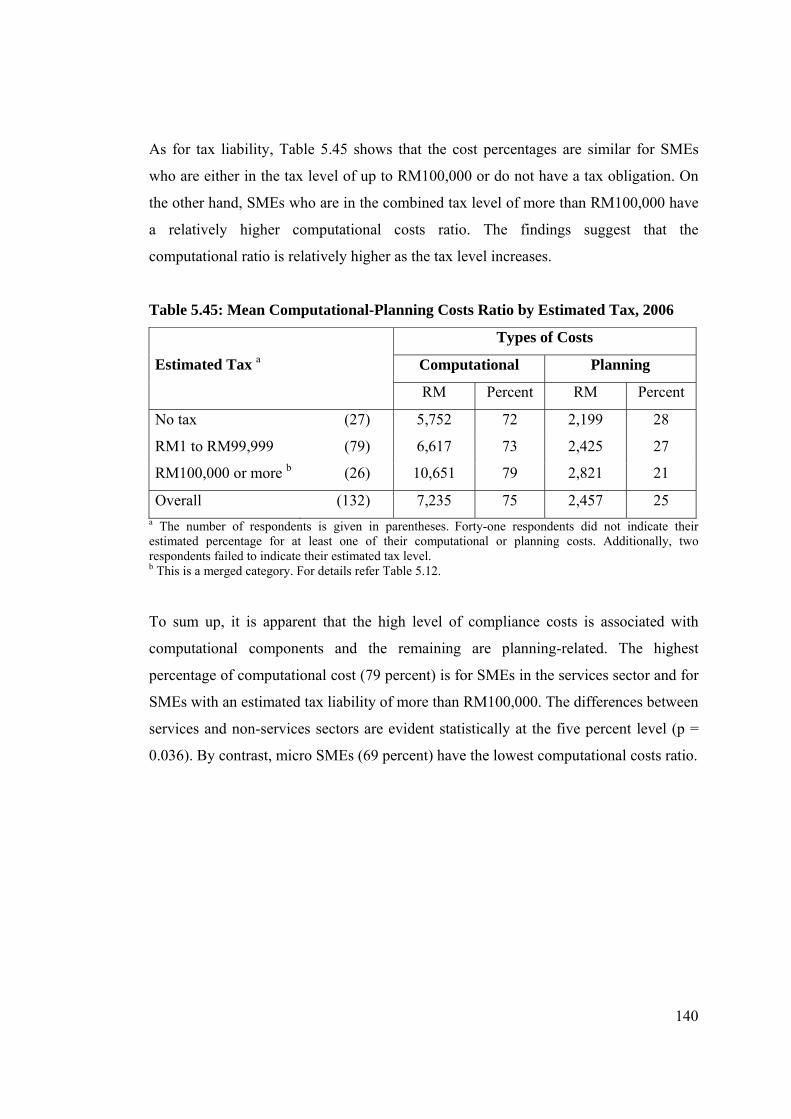
140
As for tax liability, Table 5.45 shows that the cost percentages are similar for SMEs
who are either in the tax level of up to RM100,000 or do not have a tax obligation. On
the other hand, SMEs who are in the combined tax level of more than RM100,000 have
a relatively higher computational costs ratio. The findings suggest that the
computational ratio is relatively higher as the tax level increases.
Table 5.45: Mean Computational-Planning Costs Ratio by Estimated Tax, 2006
Types of Costs
Estimated Tax a Computational Planning
RM Percent RM Percent
No tax (27) 5,752 72 2,199 28
RM1 to RM99,999 (79) 6,617 73 2,425 27
RM100,000 or more b (26) 10,651 79 2,821 21
Overall (132) 7,235 75 2,457 25 a The number of respondents is given in parentheses. Forty-one respondents did not indicate their estimated percentage for at least one of their computational or planning costs. Additionally, two respondents failed to indicate their estimated tax level. b This is a merged category. For details refer Table 5.12.
To sum up, it is apparent that the high level of compliance costs is associated with
computational components and the remaining are planning-related. The highest
percentage of computational cost (79 percent) is for SMEs in the services sector and for
SMEs with an estimated tax liability of more than RM100,000. The differences between
services and non-services sectors are evident statistically at the five percent level (p =
0.036). By contrast, micro SMEs (69 percent) have the lowest computational costs ratio.
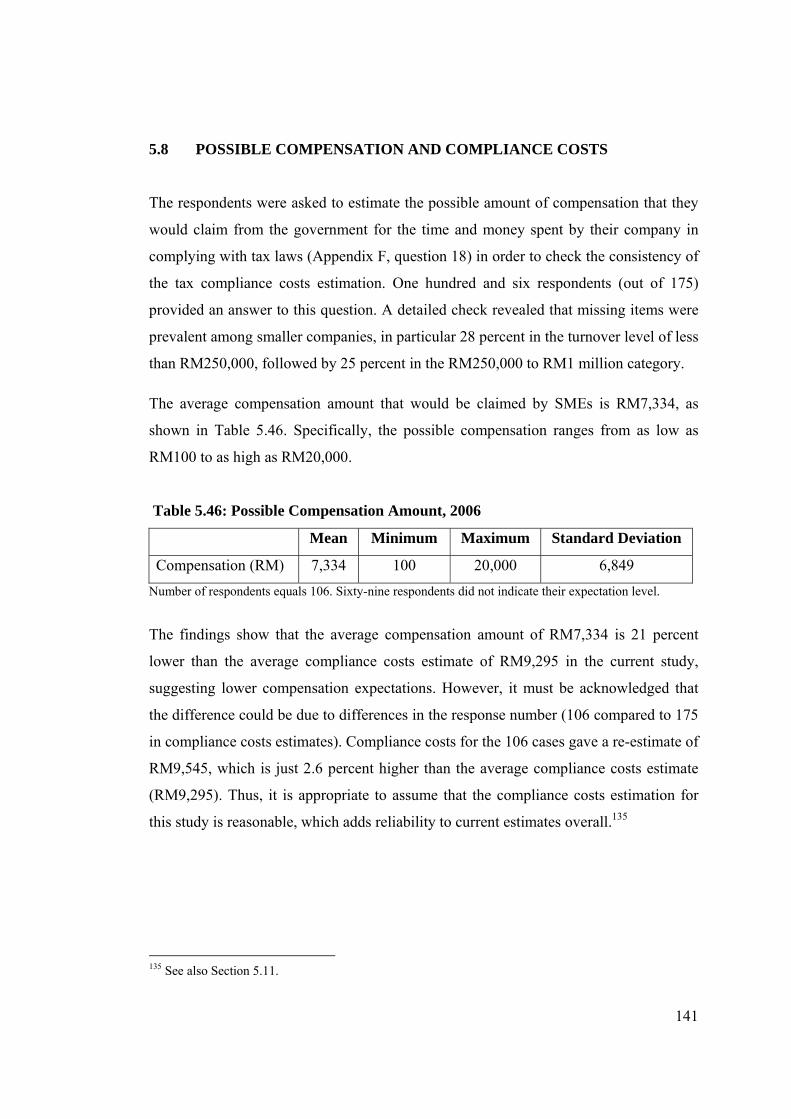
141
5.8 POSSIBLE COMPENSATION AND COMPLIANCE COSTS
The respondents were asked to estimate the possible amount of compensation that they
would claim from the government for the time and money spent by their company in
complying with tax laws (Appendix F, question 18) in order to check the consistency of
the tax compliance costs estimation. One hundred and six respondents (out of 175)
provided an answer to this question. A detailed check revealed that missing items were
prevalent among smaller companies, in particular 28 percent in the turnover level of less
than RM250,000, followed by 25 percent in the RM250,000 to RM1 million category.
The average compensation amount that would be claimed by SMEs is RM7,334, as
shown in Table 5.46. Specifically, the possible compensation ranges from as low as
RM100 to as high as RM20,000.
Table 5.46: Possible Compensation Amount, 2006
Mean Minimum Maximum Standard Deviation
Compensation (RM) 7,334 100 20,000 6,849
Number of respondents equals 106. Sixty-nine respondents did not indicate their expectation level.
The findings show that the average compensation amount of RM7,334 is 21 percent
lower than the average compliance costs estimate of RM9,295 in the current study,
suggesting lower compensation expectations. However, it must be acknowledged that
the difference could be due to differences in the response number (106 compared to 175
in compliance costs estimates). Compliance costs for the 106 cases gave a re-estimate of
RM9,545, which is just 2.6 percent higher than the average compliance costs estimate
(RM9,295). Thus, it is appropriate to assume that the compliance costs estimation for
this study is reasonable, which adds reliability to current estimates overall.135
135 See also Section 5.11.
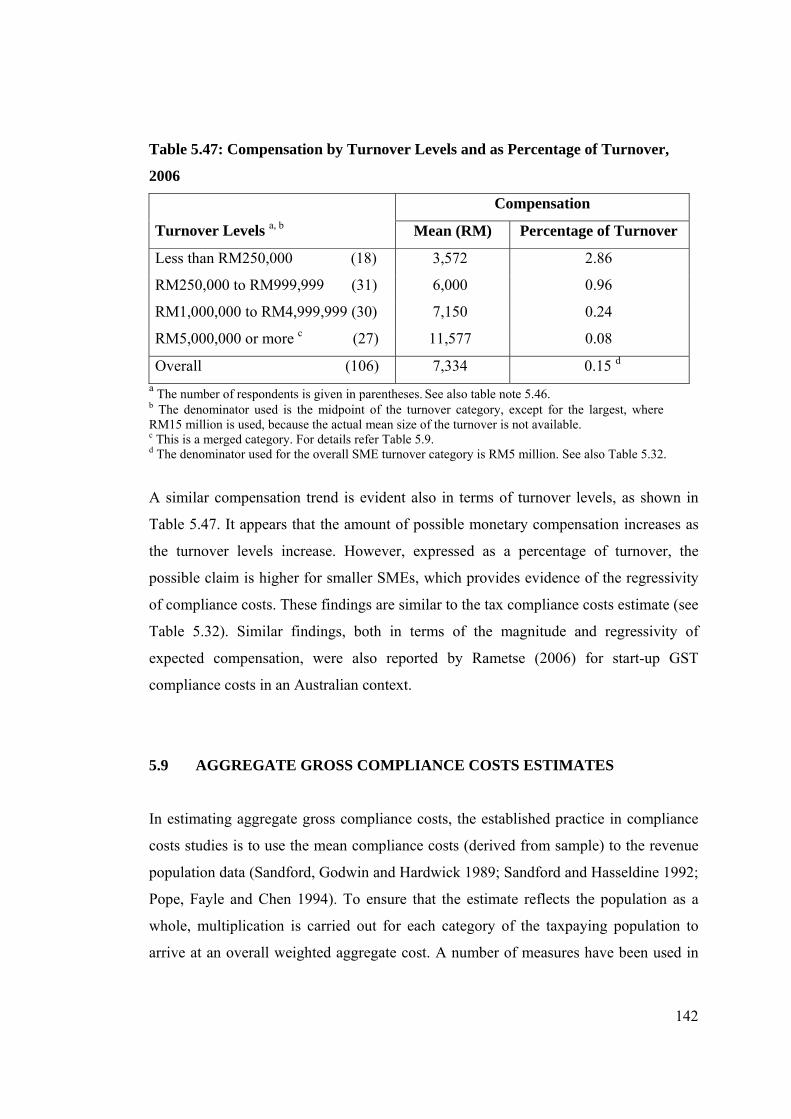
142
Table 5.47: Compensation by Turnover Levels and as Percentage of Turnover,
2006
Compensation
Turnover Levels a, b Mean (RM) Percentage of Turnover
Less than RM250,000 (18) 3,572 2.86
RM250,000 to RM999,999 (31) 6,000 0.96
RM1,000,000 to RM4,999,999 (30) 7,150 0.24
RM5,000,000 or more c (27) 11,577 0.08
Overall (106) 7,334 0.15 d a The number of respondents is given in parentheses. See also table note 5.46. b The denominator used is the midpoint of the turnover category, except for the largest, where RM15 million is used, because the actual mean size of the turnover is not available. c This is a merged category. For details refer Table 5.9. d The denominator used for the overall SME turnover category is RM5 million. See also Table 5.32.
A similar compensation trend is evident also in terms of turnover levels, as shown in
Table 5.47. It appears that the amount of possible monetary compensation increases as
the turnover levels increase. However, expressed as a percentage of turnover, the
possible claim is higher for smaller SMEs, which provides evidence of the regressivity
of compliance costs. These findings are similar to the tax compliance costs estimate (see
Table 5.32). Similar findings, both in terms of the magnitude and regressivity of
expected compensation, were also reported by Rametse (2006) for start-up GST
compliance costs in an Australian context.
5.9 AGGREGATE GROSS COMPLIANCE COSTS ESTIMATES
In estimating aggregate gross compliance costs, the established practice in compliance
costs studies is to use the mean compliance costs (derived from sample) to the revenue
population data (Sandford, Godwin and Hardwick 1989; Sandford and Hasseldine 1992;
Pope, Fayle and Chen 1994). To ensure that the estimate reflects the population as a
whole, multiplication is carried out for each category of the taxpaying population to
arrive at an overall weighted aggregate cost. A number of measures have been used in

143
categorising the business taxpaying population, and include taxable turnover (Sandford,
Godwin and Hardwick 1989), turnover (Sandford and Hasseldine 1992), annual tax
remittance (Pope, Fayle and Chen 1994), and gross income category by business size
and legal form (Evans et al. 1997). In the case of data unavailability, researchers
normally make assumptions about and/or adjustments to taxpaying population based on
the best available data. For example, Sandford, Godwin and Hardwick (1989, p. 138)
and Sandford and Hasseldine (1992, p. 85) adjusted the available GST population to
arrive at the business income tax and corporation tax population respectively. Having
succinctly discussed the practice of estimating aggregate compliance costs, the
following paragraph highlights the approach adopted in the current study.
In 2005, there were 116,650 or 21.3 percent SME companies in Malaysia (Department
of Statistics Malaysia 2007). Thereafter, no updates are available, including those of the
total number of SMEs in Malaysia. Even the recent 2007 SME annual report, published
by the NSDC (2008), referred to the earlier 2005 figure. Due to data availability, the
current study assumes that the number of SME companies in 2005 and 2006 are the
same.136 It is recognised that there is a possibility that both new companies and
deceased (or insolvent) companies would affect the total number of SME companies.
However, it is less likely there will be significant changes in just one year. Thus, for the
purpose of estimation, the figure of 116,650 companies is assumed as the total
population.
Having established a population figure for SME companies in 2006, it is crucial to have
the appropriate percentage of SME companies by any size measure. Unfortunately, such
details are not available. The IRB, through their annual report, only provide monetary
data in terms of tax revenue by types of taxes. Thus, further distinction in terms of
company size is not achievable. The researcher is left with the assumption that all
116,650 SME companies are a single category.137 Following this assumption, the
136 Malaysia’s economy growth rate, as measured by the Gross Domestic Product (GDP) change, in 2005 and 2006 was 5.2 and 5.8 percent respectively (Treasury of Malaysia 2006). 137 Another alternative is to use the sample proportion of business size (as shown earlier in Table 5.9). However, this possibility is not considered further, because the extent to which the sample proportion
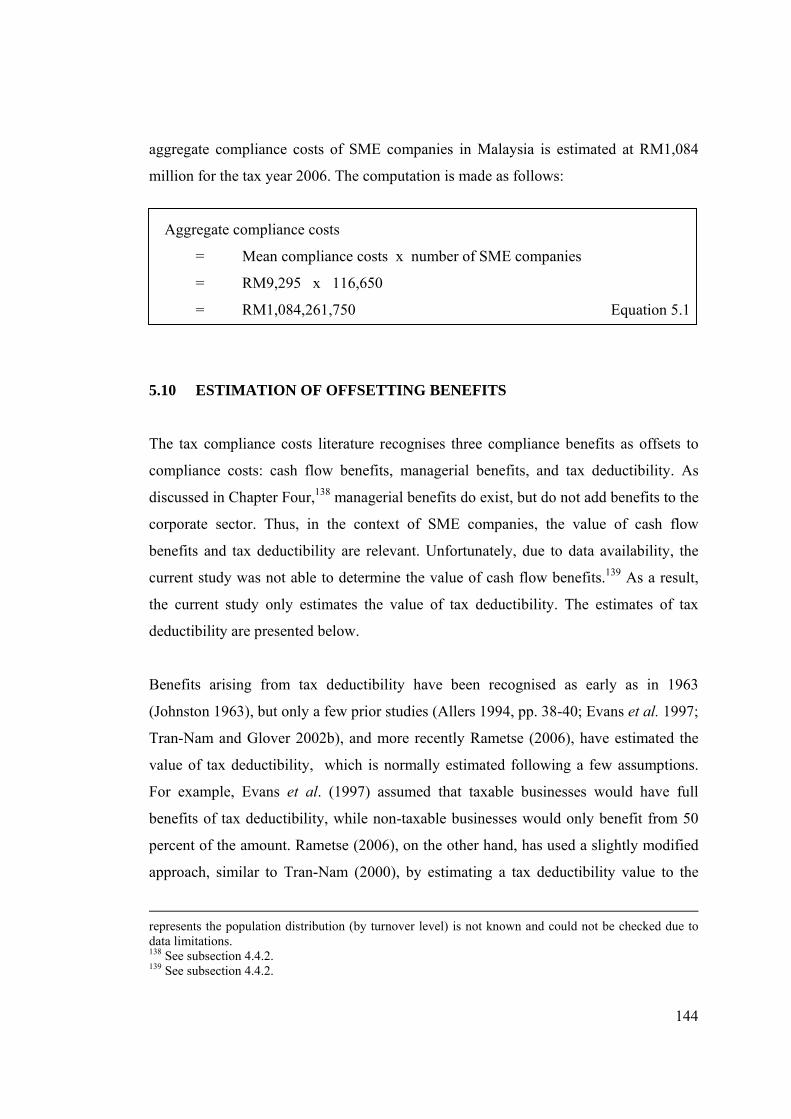
144
aggregate compliance costs of SME companies in Malaysia is estimated at RM1,084
million for the tax year 2006. The computation is made as follows:
Aggregate compliance costs
= Mean compliance costs x number of SME companies
= RM9,295 x 116,650
= RM1,084,261,750 Equation 5.1
5.10 ESTIMATION OF OFFSETTING BENEFITS
The tax compliance costs literature recognises three compliance benefits as offsets to
compliance costs: cash flow benefits, managerial benefits, and tax deductibility. As
discussed in Chapter Four,138 managerial benefits do exist, but do not add benefits to the
corporate sector. Thus, in the context of SME companies, the value of cash flow
benefits and tax deductibility are relevant. Unfortunately, due to data availability, the
current study was not able to determine the value of cash flow benefits.139 As a result,
the current study only estimates the value of tax deductibility. The estimates of tax
deductibility are presented below.
Benefits arising from tax deductibility have been recognised as early as in 1963
(Johnston 1963), but only a few prior studies (Allers 1994, pp. 38-40; Evans et al. 1997;
Tran-Nam and Glover 2002b), and more recently Rametse (2006), have estimated the
value of tax deductibility, which is normally estimated following a few assumptions.
For example, Evans et al. (1997) assumed that taxable businesses would have full
benefits of tax deductibility, while non-taxable businesses would only benefit from 50
percent of the amount. Rametse (2006), on the other hand, has used a slightly modified
approach, similar to Tran-Nam (2000), by estimating a tax deductibility value to the
represents the population distribution (by turnover level) is not known and could not be checked due to data limitations. 138 See subsection 4.4.2. 139 See subsection 4.4.2.
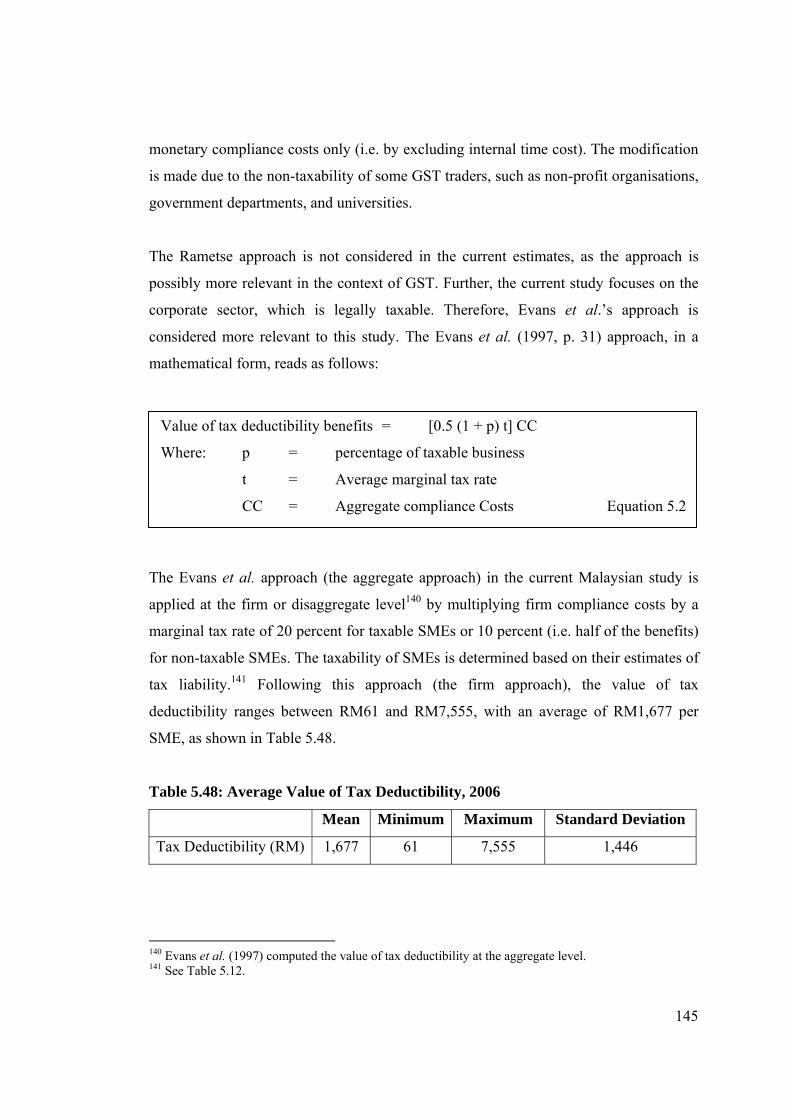
145
monetary compliance costs only (i.e. by excluding internal time cost). The modification
is made due to the non-taxability of some GST traders, such as non-profit organisations,
government departments, and universities.
The Rametse approach is not considered in the current estimates, as the approach is
possibly more relevant in the context of GST. Further, the current study focuses on the
corporate sector, which is legally taxable. Therefore, Evans et al.’s approach is
considered more relevant to this study. The Evans et al. (1997, p. 31) approach, in a
mathematical form, reads as follows:
Value of tax deductibility benefits = [0.5 (1 + p) t] CC
Where: p = percentage of taxable business
t = Average marginal tax rate
CC = Aggregate compliance Costs Equation 5.2
The Evans et al. approach (the aggregate approach) in the current Malaysian study is
applied at the firm or disaggregate level140 by multiplying firm compliance costs by a
marginal tax rate of 20 percent for taxable SMEs or 10 percent (i.e. half of the benefits)
for non-taxable SMEs. The taxability of SMEs is determined based on their estimates of
tax liability.141 Following this approach (the firm approach), the value of tax
deductibility ranges between RM61 and RM7,555, with an average of RM1,677 per
SME, as shown in Table 5.48.
Table 5.48: Average Value of Tax Deductibility, 2006
Mean Minimum Maximum Standard Deviation
Tax Deductibility (RM) 1,677 61 7,555 1,446
140 Evans et al. (1997) computed the value of tax deductibility at the aggregate level. 141 See Table 5.12.
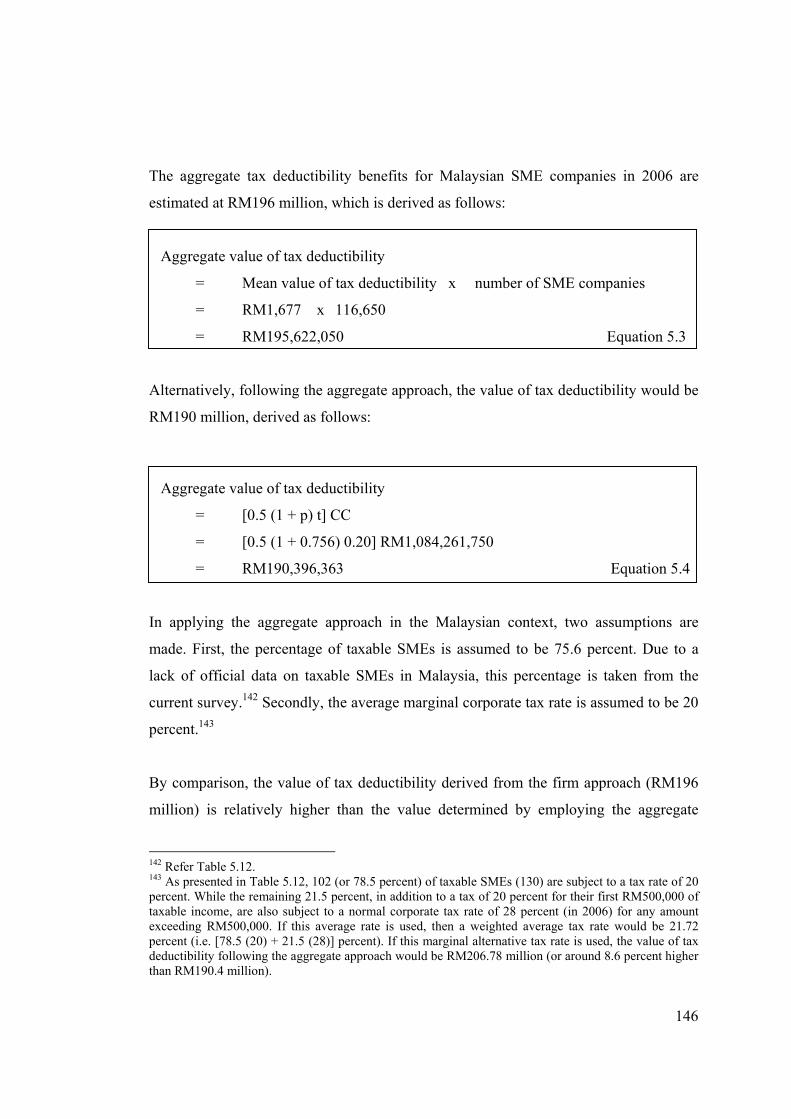
146
The aggregate tax deductibility benefits for Malaysian SME companies in 2006 are
estimated at RM196 million, which is derived as follows:
Aggregate value of tax deductibility
= Mean value of tax deductibility x number of SME companies
= RM1,677 x 116,650
= RM195,622,050 Equation 5.3
Alternatively, following the aggregate approach, the value of tax deductibility would be
RM190 million, derived as follows:
Aggregate value of tax deductibility
= [0.5 (1 + p) t] CC
= [0.5 (1 + 0.756) 0.20] RM1,084,261,750
= RM190,396,363 Equation 5.4
In applying the aggregate approach in the Malaysian context, two assumptions are
made. First, the percentage of taxable SMEs is assumed to be 75.6 percent. Due to a
lack of official data on taxable SMEs in Malaysia, this percentage is taken from the
current survey.142 Secondly, the average marginal corporate tax rate is assumed to be 20
percent.143
By comparison, the value of tax deductibility derived from the firm approach (RM196
million) is relatively higher than the value determined by employing the aggregate
142 Refer Table 5.12. 143 As presented in Table 5.12, 102 (or 78.5 percent) of taxable SMEs (130) are subject to a tax rate of 20 percent. While the remaining 21.5 percent, in addition to a tax of 20 percent for their first RM500,000 of taxable income, are also subject to a normal corporate tax rate of 28 percent (in 2006) for any amount exceeding RM500,000. If this average rate is used, then a weighted average tax rate would be 21.72 percent (i.e. [78.5 (20) + 21.5 (28)] percent). If this marginal alternative tax rate is used, the value of tax deductibility following the aggregate approach would be RM206.78 million (or around 8.6 percent higher than RM190.4 million).

147
approach (RM190 million). The small difference of around 2.7 percent is technically
not surprising due to the slight measurement difference. As a measure of consistency, a
similar approach is adopted in estimating aggregate compliance costs of SME
companies (i.e. firm approach),144 so the value of tax deductibility is estimated at
RM195.62 million. Specifically, these estimates are multiplied by the average dollar
value/costs to the SME population number.
5.11 NET AGGREGATE COMPLIANCE COSTS ESTIMATES
The net corporate tax compliance costs for the tax year 2006, both at the company and
aggregate level, is estimated at RM7,618 and RM889 million respectively, as shown in
Table 5.49. Specifically, the tax deductibility benefits for Malaysian SME companies
comprised around 18 percent of total compliance costs in 2006. At the SME level, it is
apparent that the net compliance costs of RM7,618 is similar to the possible
compensation amount of RM7,334,145 which adds consistency to the overall estimates
of the current study. As discussed earlier,146 it must be emphasised that these estimates
do not take into account the possible cash flow benefits for SME companies due to data
availability and the insignificance of the amount.
Table 5.49: Estimated Compliance Costs of SME Companies, 2006
Per SME
(RM)
Aggregate
(RM million)
Gross Compliance Costs 9,295 1,084.3
(-) Tax Deductibility 1,677 195.6
Net Compliance Costs 7,618 888.7
144 See Section 5.9. 145 See Table 5.46. 146 See Section 5.10. See also Chapter Four, subsection 4.4.2.
148
5.12 THE WEB SURVEY
5.12.1 Overall Responses and Business Profile
A total of 75 useable questionnaires were returned, which represents an extremely low
response rate of around two percent of the net sampling frame. Relevant details of the
sampling frame and responses are presented in Appendix N, Table N.1. This subsection
highlights the key profile of the responding SMEs in the web survey. Also highlighted
are the tax-related difficulties faced by the SMEs and their reason for engaging tax
professionals. Details of these responses are summarised in Appendix N, Tables N.2 to
N.6.
For the general business profile (Table N.3), two-thirds of the SMEs end their business
on 31 December, followed by 12 percent on 30 June. The most frequently stated sector
is service (54 percent), followed by manufacturing (20 percent) and manufacturing-
related (18 percent). The vast majority of respondents have been in business for more
than five years (64 percent), or at least for two years (22 percent). Almost 78 percent of
the responding companies carried out income tax work both internally and externally.
As for business size (Table N.4), almost half and one-third of the respondents are in the
category of between ‘five and 19’ and ‘four or less’ categories of employees
respectively. A large majority of the responding sample (87 percent) estimated their
2006 tax liability as either none (30 percent) or up to RM100,000 (57 percent).
The most highly ranked tax difficulty area is ‘estimating income tax payable’ (19
percent), with 70 percent of the SMEs indicating they have problems pertaining to
estimating their income tax payable, as shown in Table N.5, Appendix N. Difficulties
with regard to cash flow (17 percent) is ranked second, followed by ‘increasing burden
of record keeping requirements for tax purpose’ (13 percent), and ‘maintaining tax
records’ (12 percent). The least ranked difficult aspects are ‘dealing with the tax
authority’, ‘deadlines for submitting tax return’, and ‘dealing with tax professionals’.
Finally, the main reason for SMEs employing tax professionals (Table N.6) is the lack
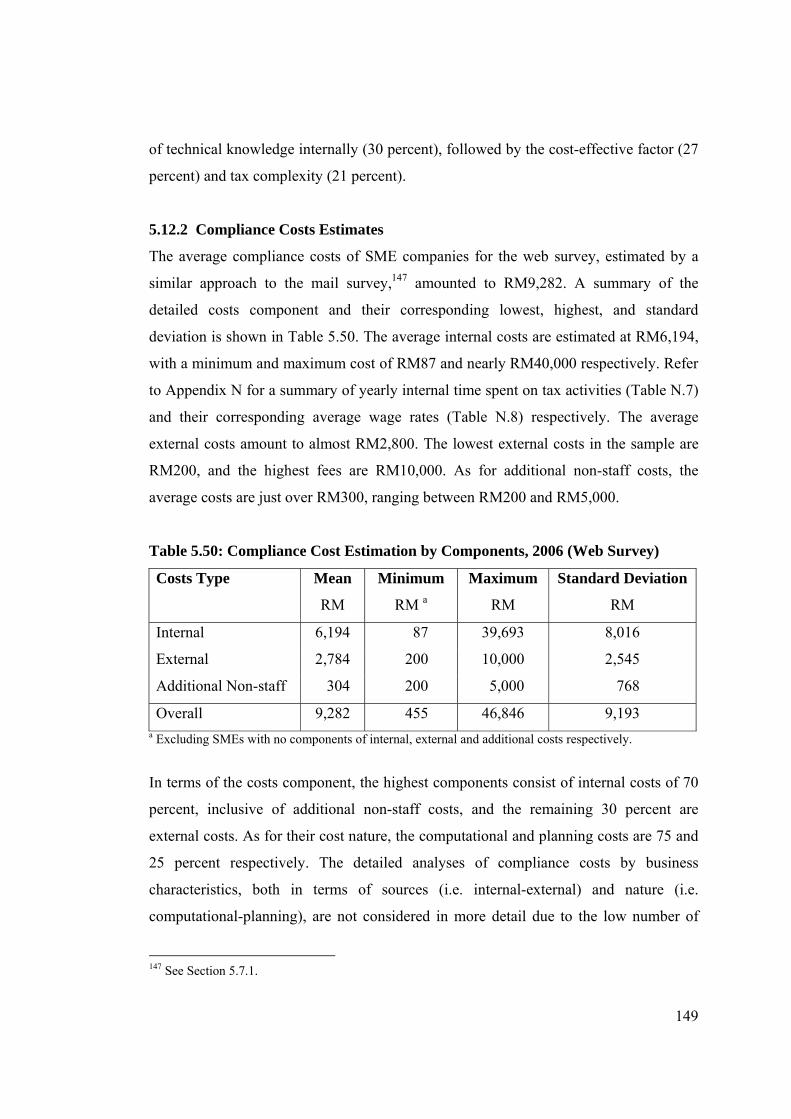
149
of technical knowledge internally (30 percent), followed by the cost-effective factor (27
percent) and tax complexity (21 percent).
5.12.2 Compliance Costs Estimates
The average compliance costs of SME companies for the web survey, estimated by a
similar approach to the mail survey,147 amounted to RM9,282. A summary of the
detailed costs component and their corresponding lowest, highest, and standard
deviation is shown in Table 5.50. The average internal costs are estimated at RM6,194,
with a minimum and maximum cost of RM87 and nearly RM40,000 respectively. Refer
to Appendix N for a summary of yearly internal time spent on tax activities (Table N.7)
and their corresponding average wage rates (Table N.8) respectively. The average
external costs amount to almost RM2,800. The lowest external costs in the sample are
RM200, and the highest fees are RM10,000. As for additional non-staff costs, the
average costs are just over RM300, ranging between RM200 and RM5,000.
Table 5.50: Compliance Cost Estimation by Components, 2006 (Web Survey)
Costs Type Mean
RM
Minimum
RM a
Maximum
RM
Standard Deviation
RM
Internal 6,194 87 39,693 8,016
External 2,784 200 10,000 2,545
Additional Non-staff 304 200 5,000 768
Overall 9,282 455 46,846 9,193 a Excluding SMEs with no components of internal, external and additional costs respectively.
In terms of the costs component, the highest components consist of internal costs of 70
percent, inclusive of additional non-staff costs, and the remaining 30 percent are
external costs. As for their cost nature, the computational and planning costs are 75 and
25 percent respectively. The detailed analyses of compliance costs by business
characteristics, both in terms of sources (i.e. internal-external) and nature (i.e.
computational-planning), are not considered in more detail due to the low number of
147 See Section 5.7.1.
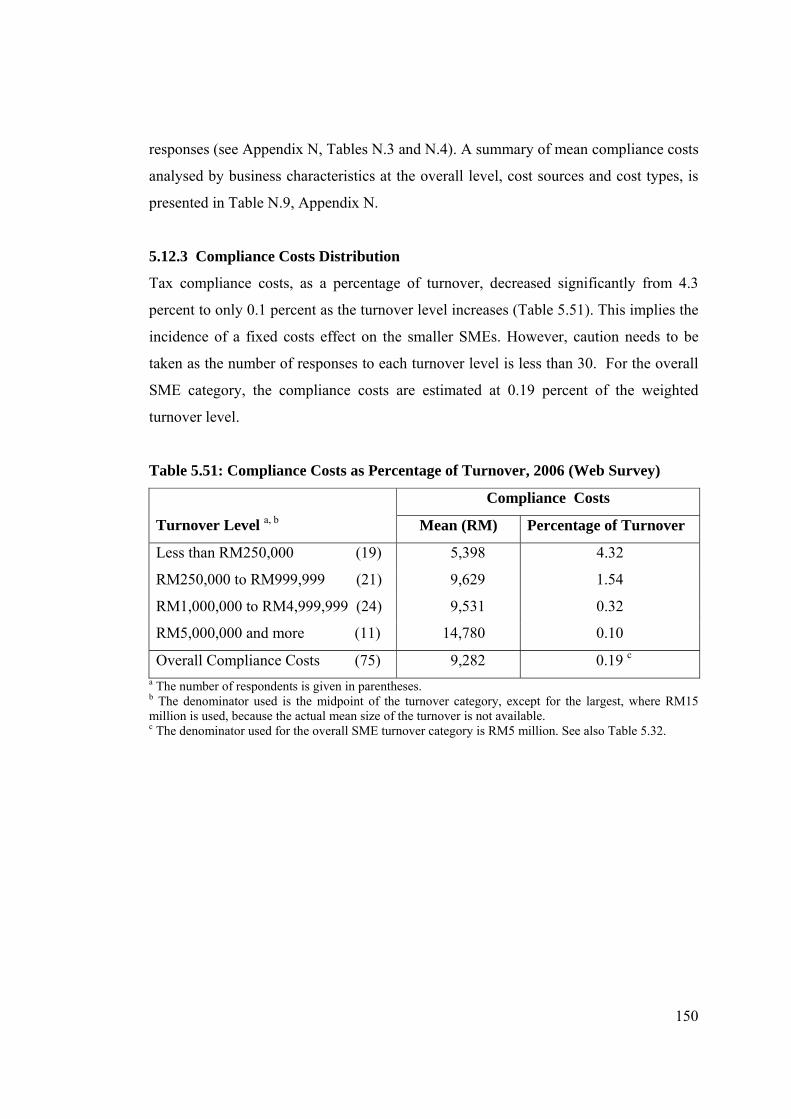
150
responses (see Appendix N, Tables N.3 and N.4). A summary of mean compliance costs
analysed by business characteristics at the overall level, cost sources and cost types, is
presented in Table N.9, Appendix N.
5.12.3 Compliance Costs Distribution
Tax compliance costs, as a percentage of turnover, decreased significantly from 4.3
percent to only 0.1 percent as the turnover level increases (Table 5.51). This implies the
incidence of a fixed costs effect on the smaller SMEs. However, caution needs to be
taken as the number of responses to each turnover level is less than 30. For the overall
SME category, the compliance costs are estimated at 0.19 percent of the weighted
turnover level.
Table 5.51: Compliance Costs as Percentage of Turnover, 2006 (Web Survey)
Compliance Costs
Turnover Level a, b Mean (RM) Percentage of Turnover
Less than RM250,000 (19) 5,398 4.32
RM250,000 to RM999,999 (21) 9,629 1.54
RM1,000,000 to RM4,999,999 (24) 9,531 0.32
RM5,000,000 and more (11) 14,780 0.10
Overall Compliance Costs (75) 9,282 0.19 c a The number of respondents is given in parentheses. b The denominator used is the midpoint of the turnover category, except for the largest, where RM15 million is used, because the actual mean size of the turnover is not available. c The denominator used for the overall SME turnover category is RM5 million. See also Table 5.32.

151
Similar findings are also observed for all three components of compliance costs, as
shown in Table 5.52.
Table 5.52: Costs Component as Percentage of Turnover, 2006 (Web Survey)
Turnover Level a
Costs Component
As a Percentage of Turnover Internal External Additional
Less than RM250,000 2.72 1.34 0.26
RM250,000 to RM999,999 1.08 0.41 0.04
RM1,000,000 to RM4,999,999 0.21 0.11 0.005
RM5,000,000 or more 0.07 0.03 0.005
Overall b 0.12 0.06 0.01 a The denominator used is the midpoint of the turnover category, except for the largest, where RM15 million is used, because the actual mean size of the turnover is not available. b The denominator used for the overall SME turnover category is RM5 million. See also Table 5.32.
5.12.4 Possible Compensation and Compliance Costs
The average compensation amount that could be claimed by SMEs in the web sample is
RM7,042 (Table 5.53). The amount of possible compensation increases as the turnover
levels increase, but the difference is statistically not significant. Further, the amount of
expected compensation is around 24 percent less than the overall compliance cost
estimates of RM9,282 for the web survey. A similar trend is reported by Rametse
(2006, p. 143) in the Australian GST start-up costs context.
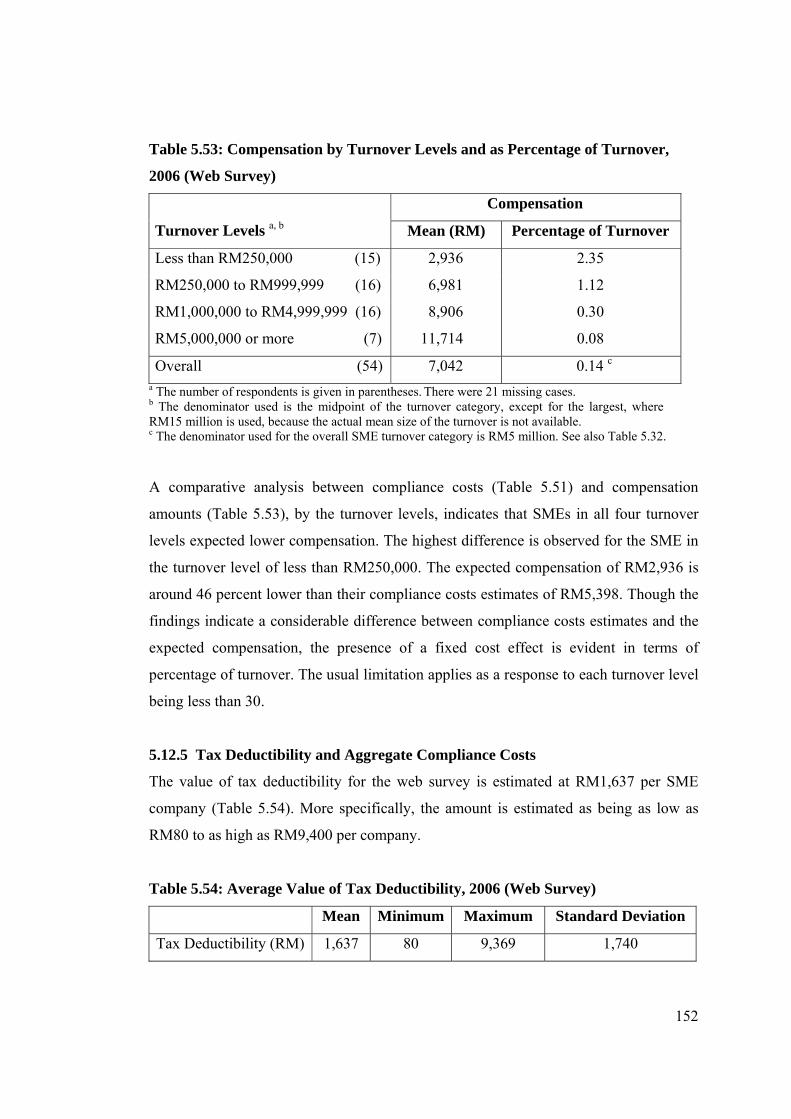
152
Table 5.53: Compensation by Turnover Levels and as Percentage of Turnover,
2006 (Web Survey)
Compensation
Turnover Levels a, b Mean (RM) Percentage of Turnover
Less than RM250,000 (15) 2,936 2.35
RM250,000 to RM999,999 (16) 6,981 1.12
RM1,000,000 to RM4,999,999 (16) 8,906 0.30
RM5,000,000 or more (7) 11,714 0.08
Overall (54) 7,042 0.14 c a The number of respondents is given in parentheses. There were 21 missing cases. b The denominator used is the midpoint of the turnover category, except for the largest, where RM15 million is used, because the actual mean size of the turnover is not available. c The denominator used for the overall SME turnover category is RM5 million. See also Table 5.32.
A comparative analysis between compliance costs (Table 5.51) and compensation
amounts (Table 5.53), by the turnover levels, indicates that SMEs in all four turnover
levels expected lower compensation. The highest difference is observed for the SME in
the turnover level of less than RM250,000. The expected compensation of RM2,936 is
around 46 percent lower than their compliance costs estimates of RM5,398. Though the
findings indicate a considerable difference between compliance costs estimates and the
expected compensation, the presence of a fixed cost effect is evident in terms of
percentage of turnover. The usual limitation applies as a response to each turnover level
being less than 30.
5.12.5 Tax Deductibility and Aggregate Compliance Costs
The value of tax deductibility for the web survey is estimated at RM1,637 per SME
company (Table 5.54). More specifically, the amount is estimated as being as low as
RM80 to as high as RM9,400 per company.
Table 5.54: Average Value of Tax Deductibility, 2006 (Web Survey)
Mean Minimum Maximum Standard Deviation
Tax Deductibility (RM) 1,637 80 9,369 1,740

153
Following a similar approach to the primary survey,148 the gross and net aggregate tax
compliance costs amounted to RM1,083 million and RM892 million respectively, as
shown in Table 5.55. At the firm level, the net compliance costs are estimated to be
RM7,645. Overall, tax deductibility covers around 18 percent of gross tax compliance
costs of SME companies.
Table 5.55: Compliance Costs Estimates, 2006 (Web Survey)
Per SME
(RM)
Aggregate
(RM million)
Gross Compliance Costs 9,282 1,082.7
(-) Tax Deductibility 1,637 191,0
Net Compliance Costs 7,645 891.7
5.13 CHAPTER SUMMARY
This chapter has presented an analysis of the response and compliance costs estimates
for the main postal survey questionnaire. The estimated average income tax compliance
costs for the tax year 2006 are almost RM9,300 per SME company. Fifty two percent of
the average compliance costs are internal time costs, forty one percent tax fees paid to
external professionals, and additional costs (non-staff) accounts for seven percent.
Computational and planning costs ratios account for 74 and 26 percent of all costs
respectively. The usual regressive nature of compliance costs for Malaysian SMEs has
been confirmed. As for the offsetting benefits, the value of tax deductibility is estimated
to be almost RM1,700 per SME company. At the aggregate level, the compliance costs
of SME companies in Malaysia are estimated to be RM1,084 million for the tax year
2006. The estimated total value of tax deductibility amounts to RM196 million,
representing approximately 18 percent of the gross compliance costs. Overall, SME
companies incurred net aggregate compliance costs of RM888 million in 2006. Analysis
148 See Sections 5.9 to 5.11.
154
of a separate web survey confirms the reliability of the estimates made in the main
postal survey. A further comparative analysis is made in Chapter Seven.

155
CHAPTER SIX
TAX ATTITUDES AND COMPLIANCE BEHAVIOUR
OF SMALL AND MEDIUM ENTERPRISES
6.1 INTRODUCTION
This section mainly draws on Sections C and D of the survey questionnaire.
Additionally, compliance costs estimates (derived from Section B of the
questionnaire)149 are used in measuring the association between compliance costs and
both tax attitudes and the likely tax behaviour. Tax attitudes and behaviour of corporate
SMEs are measured from a business managerial or respondent perspective. Similar to
the previous chapter, the primary analysis of this chapter is obtained from the postal
survey. Additionally, findings from both the SME web survey and the tax professionals’
postal survey are presented.
6.2 TAX ATTITUDES OF SMALL AND MEDIUM ENTERPRISES
6.2.1 Assessment of Reliability and Validity
As presented in Chapter Four,150 respondents were asked to state their perceptions
towards 15 tax attitudinal statements. All these statements are grouped into six aspects:
tax complexity, tax rate structure, tax law fairness, relationship with IRB officials,
probability of a tax audit, and incentives to SMEs. As the measurements of tax
complexity, tax rate structure and tax law fairness involved more than one item for each
aspect, both a reliability and validity test was performed.
The measurements used in this study are considered reliable and consistent as the alpha
coefficients were above the acceptable value of 0.7 (Nunnally 1978; Hair et al. 1998;
Sekaran 2003), as shown in Table 6.1.
149 See Chapter Five, Section 5.7. 150 See Chapter Four, Section 4.5. See also Table 4.4.
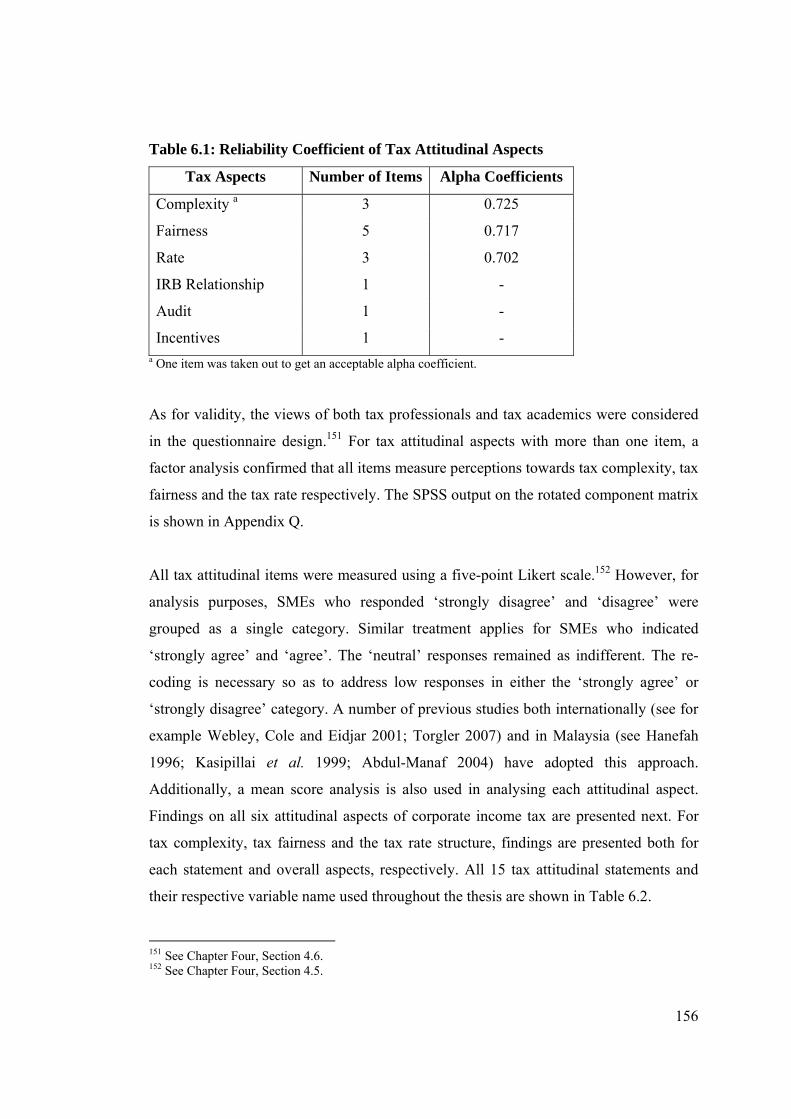
156
Table 6.1: Reliability Coefficient of Tax Attitudinal Aspects
Tax Aspects Number of Items Alpha Coefficients
Complexity a 3 0.725
Fairness 5 0.717
Rate 3 0.702
IRB Relationship 1 -
Audit 1 -
Incentives 1 - a One item was taken out to get an acceptable alpha coefficient.
As for validity, the views of both tax professionals and tax academics were considered
in the questionnaire design.151 For tax attitudinal aspects with more than one item, a
factor analysis confirmed that all items measure perceptions towards tax complexity, tax
fairness and the tax rate respectively. The SPSS output on the rotated component matrix
is shown in Appendix Q.
All tax attitudinal items were measured using a five-point Likert scale.152 However, for
analysis purposes, SMEs who responded ‘strongly disagree’ and ‘disagree’ were
grouped as a single category. Similar treatment applies for SMEs who indicated
‘strongly agree’ and ‘agree’. The ‘neutral’ responses remained as indifferent. The re-
coding is necessary so as to address low responses in either the ‘strongly agree’ or
‘strongly disagree’ category. A number of previous studies both internationally (see for
example Webley, Cole and Eidjar 2001; Torgler 2007) and in Malaysia (see Hanefah
1996; Kasipillai et al. 1999; Abdul-Manaf 2004) have adopted this approach.
Additionally, a mean score analysis is also used in analysing each attitudinal aspect.
Findings on all six attitudinal aspects of corporate income tax are presented next. For
tax complexity, tax fairness and the tax rate structure, findings are presented both for
each statement and overall aspects, respectively. All 15 tax attitudinal statements and
their respective variable name used throughout the thesis are shown in Table 6.2.
151 See Chapter Four, Section 4.6. 152 See Chapter Four, Section 4.5.
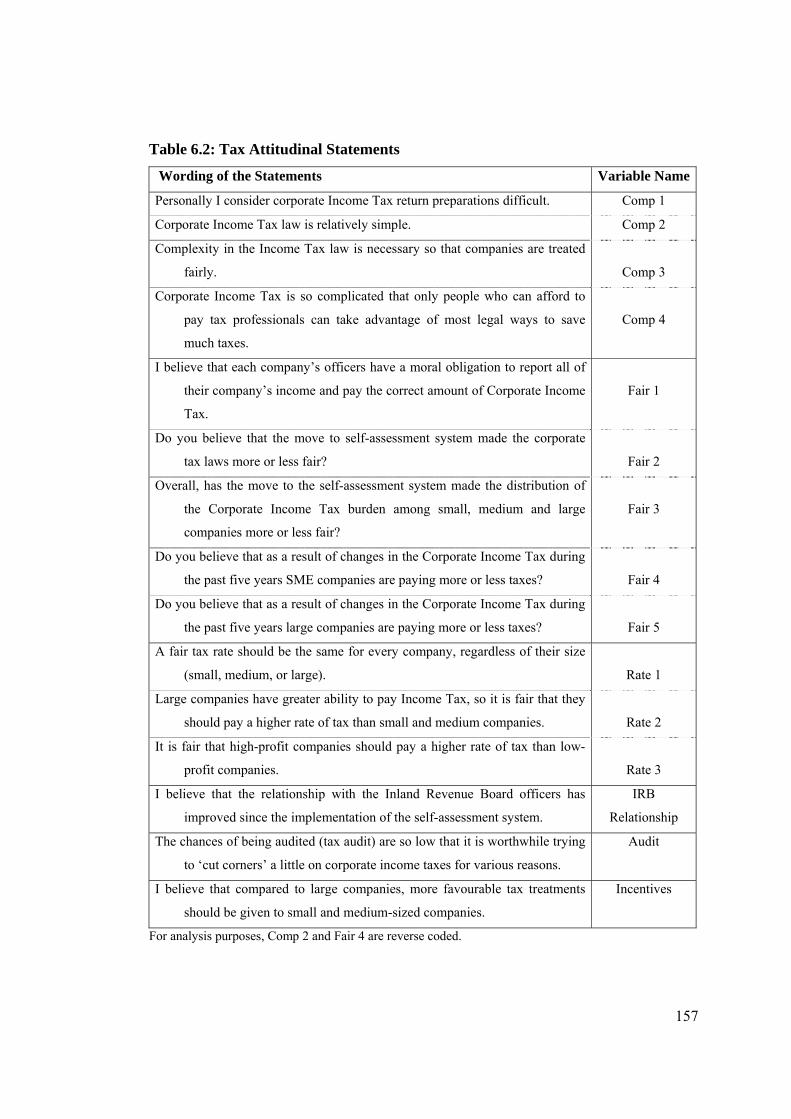
157
Table 6.2: Tax Attitudinal Statements
Wording of the Statements Variable Name
Personally I consider corporate Income Tax return preparations difficult. Comp 1
Corporate Income Tax law is relatively simple. Comp 2
Complexity in the Income Tax law is necessary so that companies are treated
fairly.
Comp 3
Corporate Income Tax is so complicated that only people who can afford to
pay tax professionals can take advantage of most legal ways to save
much taxes.
Comp 4
I believe that each company’s officers have a moral obligation to report all of
their company’s income and pay the correct amount of Corporate Income
Tax.
Fair 1
Do you believe that the move to self-assessment system made the corporate
tax laws more or less fair?
Fair 2
Overall, has the move to the self-assessment system made the distribution of
the Corporate Income Tax burden among small, medium and large
companies more or less fair?
Fair 3
Do you believe that as a result of changes in the Corporate Income Tax during
the past five years SME companies are paying more or less taxes?
Fair 4
Do you believe that as a result of changes in the Corporate Income Tax during
the past five years large companies are paying more or less taxes?
Fair 5
A fair tax rate should be the same for every company, regardless of their size
(small, medium, or large).
Rate 1
Large companies have greater ability to pay Income Tax, so it is fair that they
should pay a higher rate of tax than small and medium companies.
Rate 2
It is fair that high-profit companies should pay a higher rate of tax than low-
profit companies.
Rate 3
I believe that the relationship with the Inland Revenue Board officers has
improved since the implementation of the self-assessment system.
IRB
Relationship
The chances of being audited (tax audit) are so low that it is worthwhile trying
to ‘cut corners’ a little on corporate income taxes for various reasons.
Audit
I believe that compared to large companies, more favourable tax treatments
should be given to small and medium-sized companies.
Incentives
For analysis purposes, Comp 2 and Fair 4 are reverse coded.

158
6.2.2 Tax Complexity
This subsection presents respondents’ views on corporate income tax law complexity. A
summary of findings is shown in Table 6.3. The first statement relates to corporate
income tax return preparation (Comp 1). Nearly 55 percent of the respondents indicated
that a corporate income tax return preparation is difficult, compared to less than eight
percent who indicated otherwise, while the remaining 38 percent indicated a neutral
view. As for the second statement, nearly half of the respondents disagreed that
corporate income tax law is relatively simple (Comp 2), another two-thirds and one-
tenth indicated a neutral and in agreement view respectively. The third item claims that
the complexity in the income tax law is necessary so that companies are treated fairly
(Comp 3). More respondents (42 percent) regarded the complex nature of tax law as
being necessary than otherwise (24 percent), and another 34 percent indicated a neutral
view. For the fourth and last statement, just over 58 percent of the respondents agreed
that only people who can pay for tax professionals can exploit tax benefits legally
(Comp 4), followed by another 12 percent who disagreed, with another 30 percent being
indifferent.
Table 6.3: Attitudes towards Corporate Income Tax Complexity
Mean
Median
Standard Deviation
Disagree/ Strongly Disagree
Neutral
Agree/ Strongly
Agree Comp 1 3.59 4.00 0.82 13
(7.4)
66
(37.7)
96
(54.9)
Comp 2 2.51 2.0 0.80 88
(50.3)
69
(39.4)
18
(10.3)
Comp 3 3.15 3.00 0.99 42
(24.0)
60
(34.3)
73
(41.7)
Comp 4 3.60 4.00 0.91 21
(12.0)
52
(29.7)
102
(58.3)
Complexity a 3.56 3.67 0.68 - - -
Number of respondents equals 175. The percentage of responses is given in parentheses. a Comp 3 was taken out to get an acceptable alpha (see Table 6.1). Comp 2 is reverse coded. The reversed mean is 3.49.
159
All statements, except ‘Comp 3’, have a mean score of between 3.49 and 3.60, which
reveals a strong agreement towards the presence of tax complexity. The overall mean
score for tax complexity is 3.56, which demonstrates the complex nature of corporate
income tax as perceived by the respondents. Tax complexity analysed by respondents’
business characteristics reveal that a significant mean difference is observed only in
terms of the estimated tax levels. A relatively lower complexity level is perceived by
SMEs without tax liability (3.32) compared to those who are subjected to tax (3.61).
6.2.3 Tax Fairness
Respondents’ perceptions toward corporate income tax fairness is summarised in Table
6.4. To the first statement on fairness (Fair 1), a large majority of the respondents (76
percent) agreed that each company’s officers have a moral obligation to report all of
their company’s income and pay the correct amount of corporate income tax. The
second (Fair 2) and third (Fair 3) statements relate specifically to the SAS. More than
half of the respondents indicated a neutral view with regards to both corporate tax laws
fairness (57 percent) and corporate income tax burden among small, medium and large
companies (59 percent). The last two statements (Fair 4 and 5) also relate indirectly to
the SAS. The fourth statement asked respondents as to whether SME companies are
paying more or less taxes (Fair 4), and the fifth statement asked a similar question in the
context of large companies (Fair 5). The majority of respondents indicated a neutral
view to both statements. The remaining respondents were roughly divided between
respondents who agreed or disagreed.

160
Table 6.4: Attitudes towards Corporate Tax Fairness
Mean
Median
Standard Deviation
Disagree/ Strongly
Disagree a
Neutral
Agree/ Strongly Agree a
Fair 1 3.86 4.00 0.88 12
(6.9)
30
(17.1)
133
(76.0)
Fair 2 3.12 3.00 0.74 28
(16.0)
99
(56.6)
48
(27.4)
Fair 3 3.06 3.00 0.81 32
(18.3)
103
(58.9)
40
(22.9)
Fair 4 2.94 3.00 0.77 46
(26.4)
95
(54.6)
33
(19.0)
Fair 5 3.01 3.00 0.72 33
(19.1)
105
(60.7)
35
(20.2)
Fairness b 3.22 3.20 0.53 - - -
Number of respondents equals 175. Total responses of less than 175 are due to missing value(s). The percentage of responses is given in parentheses. Total percentage for Fair 3 is not equal to 100 due to rounding. a Slightly different response category was used for Fair 2 and 3 (much less fair to much more fair) and Fair 4 and 5 (much less taxes to much more taxes) respectively. b Fair 4 is reversed coded. The reversed mean equals 3.06.
The overall mean score of 3.22 indicates that the corporate tax system is perceived to be
relatively fair. A further analysis in terms of all business characteristics reveals no
statistical difference between the respondents.
6.2.4 Tax Rate
Respondents’ views regarding fairness of the corporate tax rate were obtained on three
tax rate structures: flat (Rate 1), proportional (Rate 2) and progressive (Rate 3). A
summary of responses is presented in Table 6.5. Just over 45 percent agreed to a flat
rate structure (Rate 1) compared to 55 percent who indicated agreement on both the
proportional (Rate 2) and progressive rate (Rate 3) structures. A mean comparison
indicates that the proportional (Rate 2) and progressive (Rate 3) tax rates are perceived
to be fairer than a flat rate (Rate 1), which has rather a neutral view.

161
Table 6.5: Attitudes towards Corporate Tax Rate Structure
Mean Median Standard Deviation
Disagree/ Strongly Disagree
Neutral
Agree/ Strongly
Agree Rate 1 3.13 3.00 1.16 60
(34.3)
36
(20.6)
79
(45.1)
Rate 2 3.41 4.00 1.14 42
(24.0)
37
(21.1)
96
(54.9)
Rate 3 3.48 4.00 1.05 36
(20.6)
42
(24.0)
97
(55.4)
Tax Rate 3.34 3.33 0.88 - - -
Number of respondents equals 175. The percentage of responses is given in parentheses.
An overall mean average of 3.34 indicates that the corporate tax rate structure is
perceived to be relatively fair. Further, analysis of the mean reveals a similar
perception, regardless of their specific business characteristics.
6.2.5 Other Attitudinal Aspects
In addition to the above three aspects of corporate income tax, respondents were asked
for their perceptions on three other tax attitudinal aspects, namely, their relationship
with IRB officials, the probability of a tax audit, and finally tax incentives to SMEs.
Almost half of the respondents indicated a neutral view as to whether to their
relationship with the IRB officers has improved since the introduction of the SAS, as
shown in Table 6.6. Just over one-third of the respondents agreed about the improved
relationship with the IRB officers and the remaining one-fifth disagreed. Overall, a
mean score of 3.15 indicates a relatively better relationship with the IRB under the SAS
regime.

162
Table 6.6: Other Tax Attitudinal Aspects
Mean
Median
Standard Deviation
Disagree/ Strongly Disagree
Neutral
Agree/ Strongly
Agree IRB
Relationship
3.15 3.00 0.90 32
(18.3)
84
(48.0)
59
(33.7)
Audit 2.75 3.00 0.98 72
(41.1)
63
(36.0)
40
(22.9)
Incentives 4.15 4.00 0.75 5
(2.9)
19
(10.9)
151
(86.3)
Number of respondents equals 175. The percentage of responses is given in parentheses. For tax incentives, the total percentage does not equal 100 due to rounding.
As for tax audits, relatively more respondents (41 percent) disagree that the probability
of a tax audit is low, compared to those who demonstrate agreement (23 percent) or an
indifferent view (36 percent). Broadly, a mean score of 2.75 indicates that the
respondents were somewhat uncertain with regards to the probability of their company
being subjected to a tax audit. Regarding tax incentives, a large majority of respondents
(86 percent) believed that more favourable tax treatments should be given to SME
companies. A mean score of 4.15 is the highest mean score in the current study,
suggesting respondents’ very strong agreement about more tax incentives to SMEs. For
all three aspects, ANOVA tests fail to indicate any significant mean differences,
suggesting similar perceptions regardless of their business profile.
163
6.3 TAX COMPLIANCE BEHAVIOUR OF SMALL AND MEDIUM
ENTERPRISES
As discussed in Chapter Four,153 two types of non-compliance behaviour, namely
understatement of income and overstatement of deductions, are measured by way of
both indirect and direct responses for each hypothetical scenario. Nonetheless, the direct
response was primarily used in the current study.154 Similar to tax attitudinal aspects,
responses to a five-point Likert scale were simplified into three categories: those who
are in agreement (strongly agree and agree), those who are in disagreement (strongly
disagree and disagree), and neutral responses (remain indifferent).
Nearly 60 percent of the respondents indicated disagreement to the possible action of
underreporting behaviour, as shown in Table 6.7, suggesting more compliant behaviour.
Another 23 percent were indifferent. Overall, respondents were inclined towards
compliance. As for overstating deductions, around 41 percent of the respondents
indicated disagreement to the possible action of overstating deductions, suggesting
compliant behaviour. About 29 percent were indifferent. The remaining 30 percent
tended to support overstating deductions. Broadly, relatively more respondents (60
percent) were compliant towards underreporting behaviour as compared to
overstatement of deductions (41 percent).
153 See subsection 4.4.3. See also Section 4.5 154 See Chapter Four, Section 4.5.

164
Table 6.7: Respondents’ Views towards Non-compliance Behaviour
Mean
Median
Standard Deviation
Disagree/ Strongly Disagree
Neutral
Agree/ Strongly
Agree Understatement
of Income
2.28 2.00 1.22 102
(59.3)
39
(22.7)
31
(18.0)
Overstatement
of Deductions
2.76 3.00 1.31 71
(41.3)
50
(29.1)
51
(29.6)
Both Non-
compliance a
2.52
2.50 1.11 - - -
Number of respondents equals 172. The percentage of responses is given in parentheses. a This refers to the combined category of both understatement of income and overstatement of deductions.
In terms of income reporting, an overall mean score of 2.28 indicates that the
respondent leans towards tax compliance. However, for overstating behaviour, an
overall mean score of 2.76 indicates that the large majority of SMEs are likely to show
compliant or neutral behaviour. Comparatively, compliance in terms of income
reporting is better than tax deductions. The median scores of 2.00 and 3.00 for income
reporting and tax deductions demonstrate this trend as well. At the firm level, a
combined mean score of 2.52 for both non-compliance situations indicates likely
compliance behaviour too.
Further, respondents were asked to indicate their view on the possibility of not
complying to only part of the RM10,000 stated for both scenarios. The specific amount
is not stated but left to the respondent to judge, which mathematically could be worth
less than RM10,000. Respondents were given three options (yes, no, unsure) on the
likely non-compliance of the person stated in the scenario. The results of the possible
partial non-compliance are shown in Table 6.8.
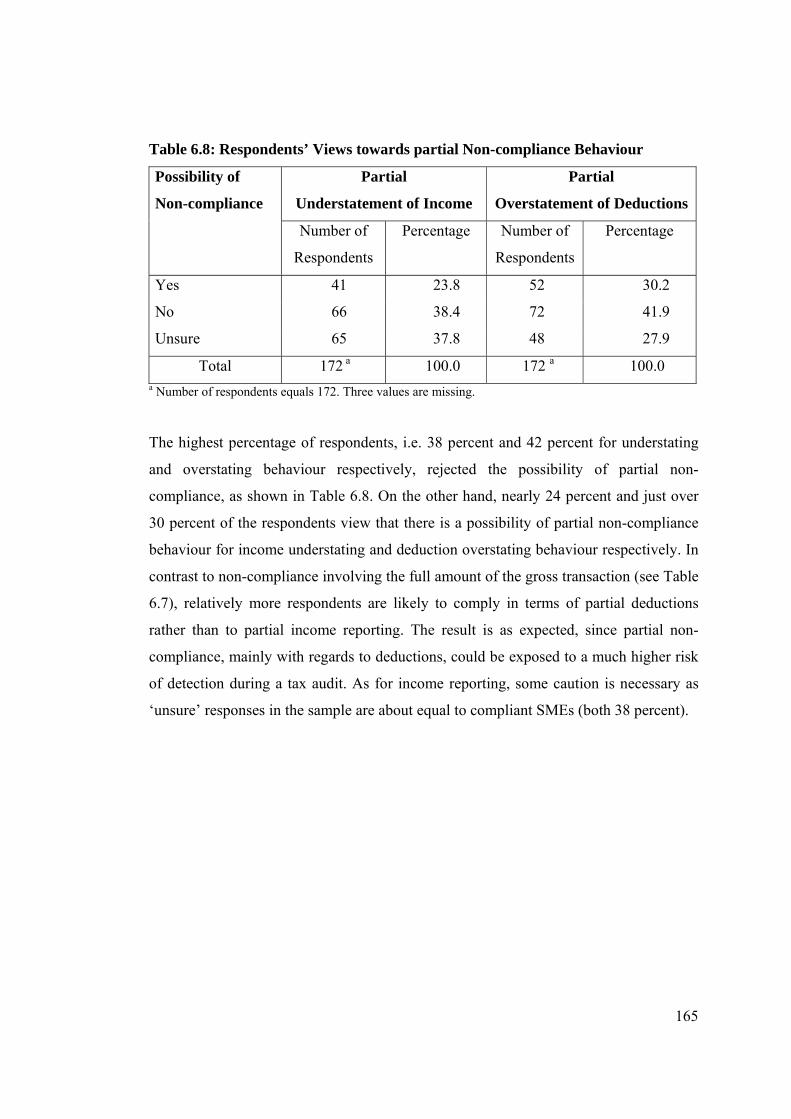
165
Table 6.8: Respondents’ Views towards partial Non-compliance Behaviour
Possibility of
Non-compliance
Partial
Understatement of Income
Partial
Overstatement of Deductions
Number of
Respondents
Percentage
Number of
Respondents
Percentage
Yes 41 23.8 52 30.2
No 66 38.4 72 41.9
Unsure 65 37.8 48 27.9
Total 172 a 100.0 172 a 100.0 a Number of respondents equals 172. Three values are missing.
The highest percentage of respondents, i.e. 38 percent and 42 percent for understating
and overstating behaviour respectively, rejected the possibility of partial non-
compliance, as shown in Table 6.8. On the other hand, nearly 24 percent and just over
30 percent of the respondents view that there is a possibility of partial non-compliance
behaviour for income understating and deduction overstating behaviour respectively. In
contrast to non-compliance involving the full amount of the gross transaction (see Table
6.7), relatively more respondents are likely to comply in terms of partial deductions
rather than to partial income reporting. The result is as expected, since partial non-
compliance, mainly with regards to deductions, could be exposed to a much higher risk
of detection during a tax audit. As for income reporting, some caution is necessary as
‘unsure’ responses in the sample are about equal to compliant SMEs (both 38 percent).
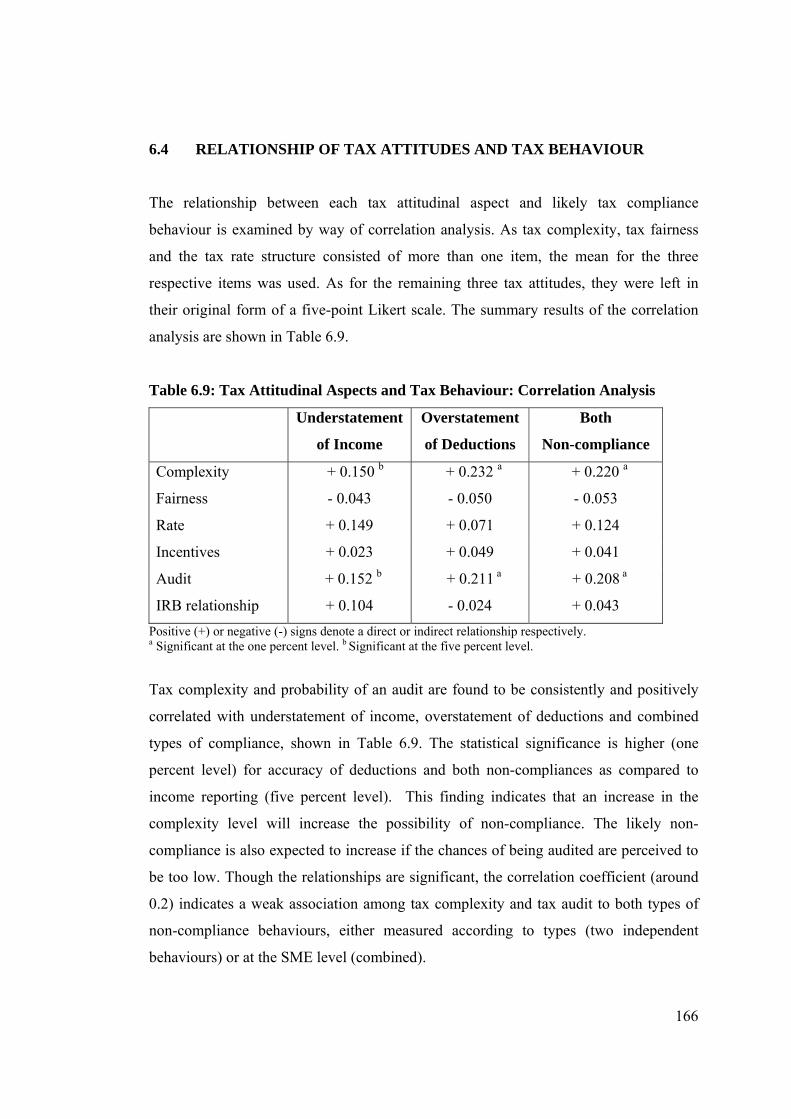
166
6.4 RELATIONSHIP OF TAX ATTITUDES AND TAX BEHAVIOUR
The relationship between each tax attitudinal aspect and likely tax compliance
behaviour is examined by way of correlation analysis. As tax complexity, tax fairness
and the tax rate structure consisted of more than one item, the mean for the three
respective items was used. As for the remaining three tax attitudes, they were left in
their original form of a five-point Likert scale. The summary results of the correlation
analysis are shown in Table 6.9.
Table 6.9: Tax Attitudinal Aspects and Tax Behaviour: Correlation Analysis
Understatement
of Income
Overstatement
of Deductions
Both
Non-compliance
Complexity + 0.150 b + 0.232 a + 0.220 a
Fairness - 0.043 - 0.050 - 0.053
Rate + 0.149 + 0.071 + 0.124
Incentives + 0.023 + 0.049 + 0.041
Audit + 0.152 b + 0.211 a + 0.208 a
IRB relationship + 0.104 - 0.024 + 0.043
Positive (+) or negative (-) signs denote a direct or indirect relationship respectively. a Significant at the one percent level. b Significant at the five percent level.
Tax complexity and probability of an audit are found to be consistently and positively
correlated with understatement of income, overstatement of deductions and combined
types of compliance, shown in Table 6.9. The statistical significance is higher (one
percent level) for accuracy of deductions and both non-compliances as compared to
income reporting (five percent level). This finding indicates that an increase in the
complexity level will increase the possibility of non-compliance. The likely non-
compliance is also expected to increase if the chances of being audited are perceived to
be too low. Though the relationships are significant, the correlation coefficient (around
0.2) indicates a weak association among tax complexity and tax audit to both types of
non-compliance behaviours, either measured according to types (two independent
behaviours) or at the SME level (combined).

167
The finding also shows that both understatement of income and overstatement of
deductions are highly correlated (correlation coefficient equal to 0.535); more
importantly, both are at the 99 percent confidence level. This suggests that those who
are compliant in terms of income reporting (or tax deductions) would probably be
compliant with regards to tax deductions (or income reporting).
Overall, the direction of the associations between the compliance types and all six
attitudinal aspects are similar, except for the perceived IRB relationship. A direct
association is observed between the perceived IRB relationship and income reporting
behaviour, indicating the better the perceived relationship between respondents and the
IRB, the more likely this is to increase the possibility of non-compliance. On the other
hand, an indirect relationship is evident for tax deductions behaviour (and combined tax
behaviours), suggesting the better the perceived relationship with the IRB, the lower the
likelihood of the overstatement of deductions (and combined non-compliance).
As for tax fairness and tax incentives, their relationship to likely compliance behaviour
is in the expected direction. A better perceived fairness is likely to decrease the
possibility of non-compliance and vice versa. As for tax incentives, the stronger
anticipation of tax incentives is likely to increase the possibility of non-compliance. It is
possible that a few available incentives during the survey period were not sufficient. As
such, the respondents may compensate themselves by performing non-compliant
activities. However, an unanticipated direction is noted for the tax rate structure. A
positive perception on the tax rate structure is likely to increase the possibility of non-
compliance, which is supposed to be to the contrary. Nonetheless, perceptions towards
tax fairness, the tax rate, tax incentives and the IRB relationship are not statistically
associated with the likely compliance behaviour.
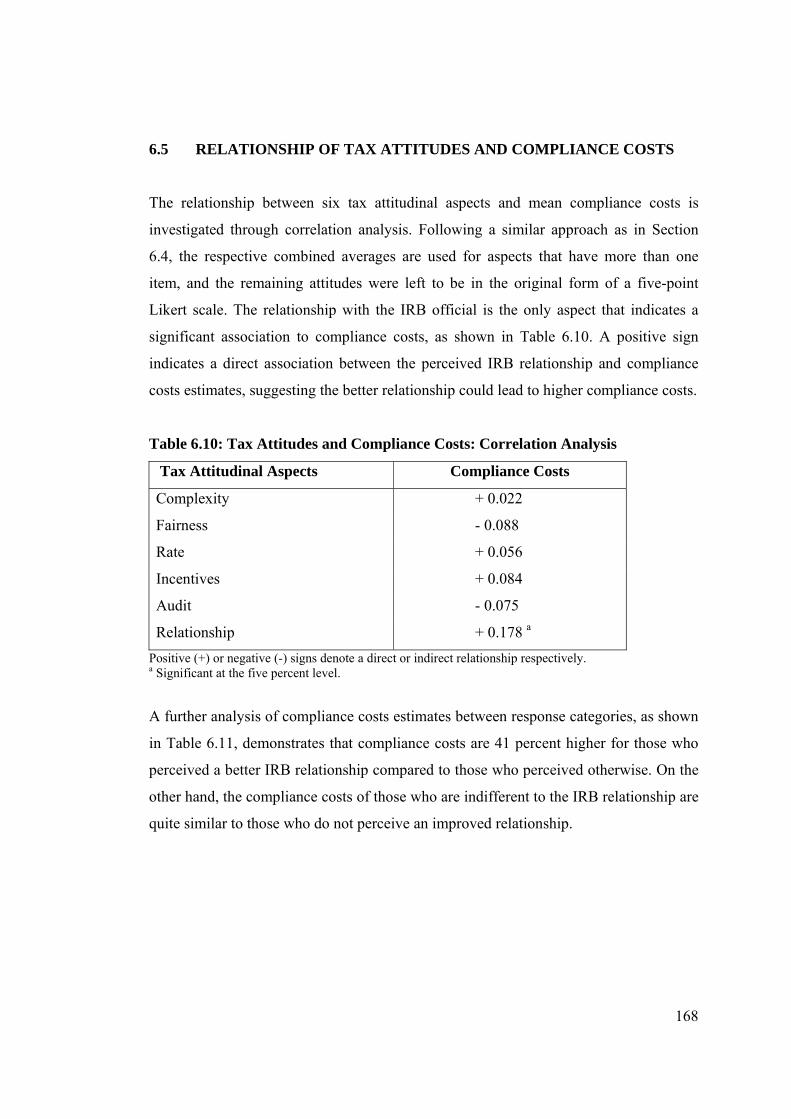
168
6.5 RELATIONSHIP OF TAX ATTITUDES AND COMPLIANCE COSTS
The relationship between six tax attitudinal aspects and mean compliance costs is
investigated through correlation analysis. Following a similar approach as in Section
6.4, the respective combined averages are used for aspects that have more than one
item, and the remaining attitudes were left to be in the original form of a five-point
Likert scale. The relationship with the IRB official is the only aspect that indicates a
significant association to compliance costs, as shown in Table 6.10. A positive sign
indicates a direct association between the perceived IRB relationship and compliance
costs estimates, suggesting the better relationship could lead to higher compliance costs.
Table 6.10: Tax Attitudes and Compliance Costs: Correlation Analysis
Tax Attitudinal Aspects Compliance Costs
Complexity + 0.022
Fairness - 0.088
Rate + 0.056
Incentives + 0.084
Audit - 0.075
Relationship + 0.178 a
Positive (+) or negative (-) signs denote a direct or indirect relationship respectively. a Significant at the five percent level.
A further analysis of compliance costs estimates between response categories, as shown
in Table 6.11, demonstrates that compliance costs are 41 percent higher for those who
perceived a better IRB relationship compared to those who perceived otherwise. On the
other hand, the compliance costs of those who are indifferent to the IRB relationship are
quite similar to those who do not perceive an improved relationship.
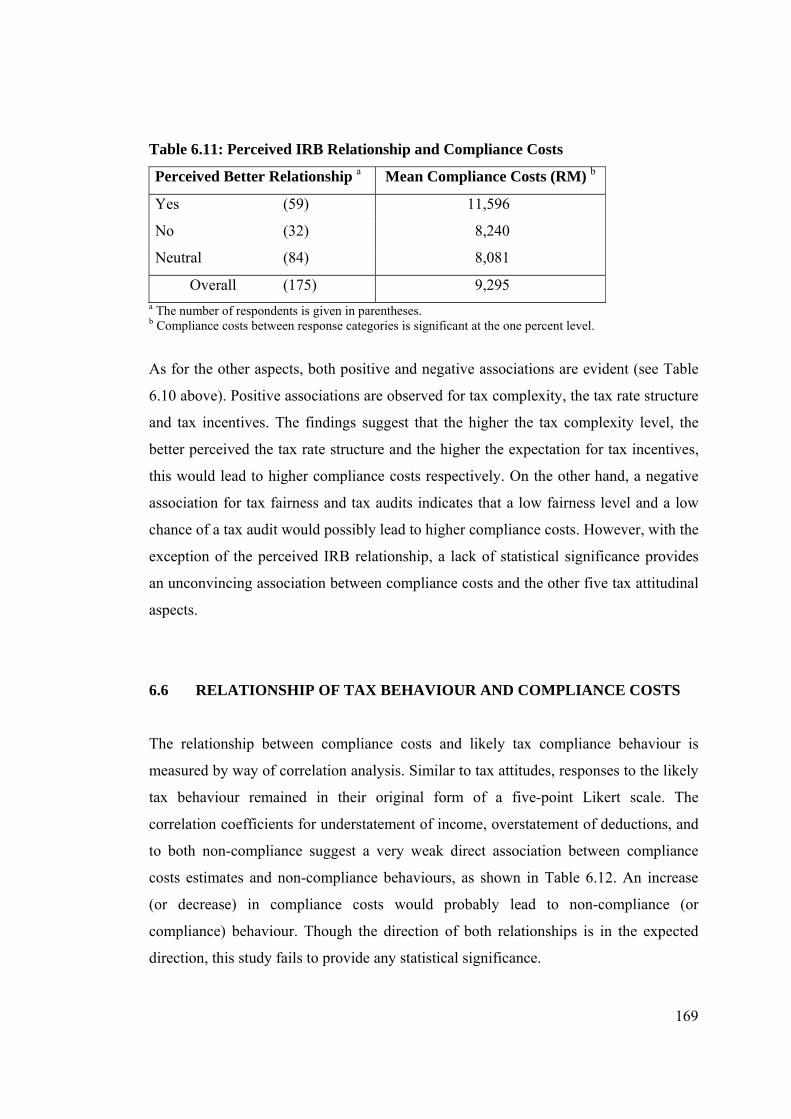
169
Table 6.11: Perceived IRB Relationship and Compliance Costs
Perceived Better Relationship a Mean Compliance Costs (RM) b
Yes (59) 11,596
No (32) 8,240
Neutral (84) 8,081
Overall (175) 9,295 a The number of respondents is given in parentheses. b Compliance costs between response categories is significant at the one percent level.
As for the other aspects, both positive and negative associations are evident (see Table
6.10 above). Positive associations are observed for tax complexity, the tax rate structure
and tax incentives. The findings suggest that the higher the tax complexity level, the
better perceived the tax rate structure and the higher the expectation for tax incentives,
this would lead to higher compliance costs respectively. On the other hand, a negative
association for tax fairness and tax audits indicates that a low fairness level and a low
chance of a tax audit would possibly lead to higher compliance costs. However, with the
exception of the perceived IRB relationship, a lack of statistical significance provides
an unconvincing association between compliance costs and the other five tax attitudinal
aspects.
6.6 RELATIONSHIP OF TAX BEHAVIOUR AND COMPLIANCE COSTS
The relationship between compliance costs and likely tax compliance behaviour is
measured by way of correlation analysis. Similar to tax attitudes, responses to the likely
tax behaviour remained in their original form of a five-point Likert scale. The
correlation coefficients for understatement of income, overstatement of deductions, and
to both non-compliance suggest a very weak direct association between compliance
costs estimates and non-compliance behaviours, as shown in Table 6.12. An increase
(or decrease) in compliance costs would probably lead to non-compliance (or
compliance) behaviour. Though the direction of both relationships is in the expected
direction, this study fails to provide any statistical significance.

170
Table 6.12: Tax Behaviour and Compliance Costs: Correlation Analysis
Non-compliance Type Compliance Costs
Understatement of Income + 0.002
Overstatement of Deductions + 0.009
Both Non-compliance a + 0.007
Positive (+) sign denotes a direct relationship. a This refers to the combined category of both understatement of income and overstatement of deductions.
Further, compliance costs are analysed by way of the three response categories, i.e.
SMEs with compliant, non-compliant and neutral views. This analysis is carried out to
get an impression on the magnitude of compliance costs towards compliance behaviour.
The mean compliance costs by both the underreporting of income and overstating of
deductions respectively are presented in Table 6.13.
Table 6.13: Understatement of Income and Mean Compliance Costs
Tax Behaviour a Mean Compliance Cost (RM)
Complying SMEs (102) 9,620
Non-complying SMEs (31) 10,269
Neutral (39) 7,424
Overall (172) 9,239 b a The number of respondents is given in parentheses.
b The costs are less than the reported mean compliance costs of RM9,295 due to differences in the response number.
Complying SMEs with likely reporting behaviour tend to have relatively lower
compliance costs (RM9,620) than those with likely non-complying behaviour
(RM10,269), as shown in Table 6.13. Those with neutral responses have the lowest
costs (RM7,424). The results seem to suggest that SMEs with higher compliance costs
possibly tend to not comply in terms of income reporting. However, mean comparisons
by way of the statistical t-test did not indicate any significant association between
compliance costs and understatement of income, at the five percent significant level.
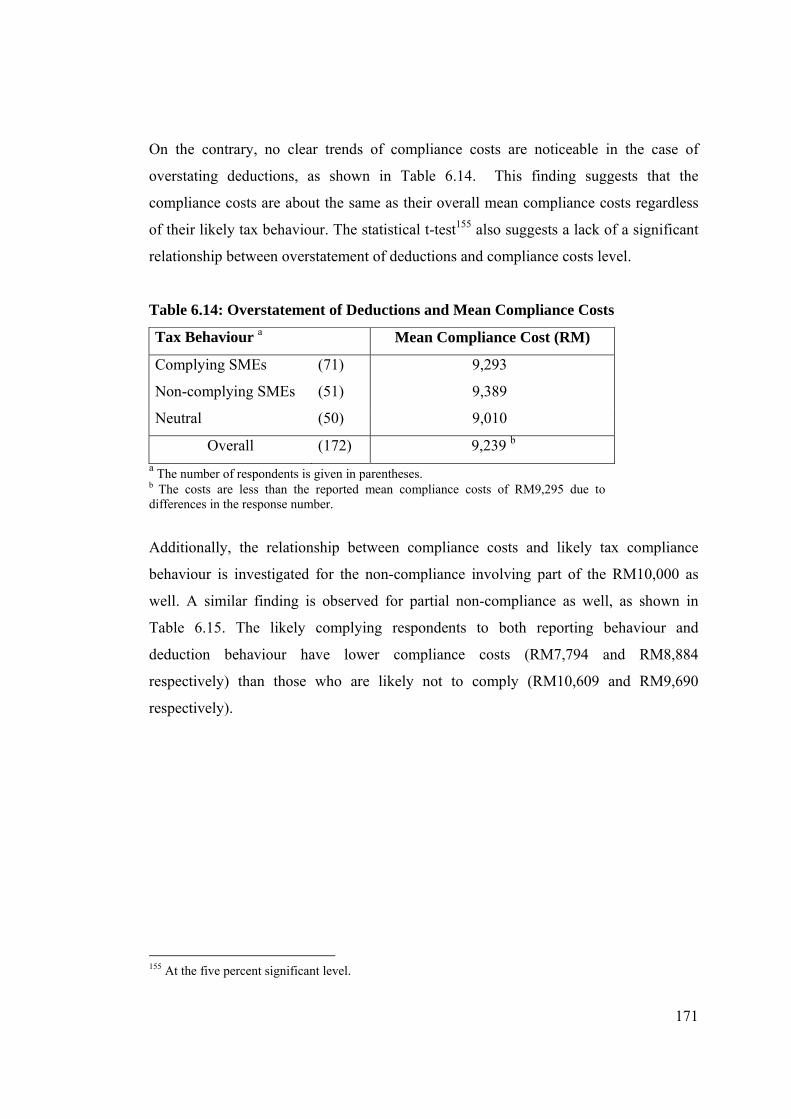
171
On the contrary, no clear trends of compliance costs are noticeable in the case of
overstating deductions, as shown in Table 6.14. This finding suggests that the
compliance costs are about the same as their overall mean compliance costs regardless
of their likely tax behaviour. The statistical t-test155 also suggests a lack of a significant
relationship between overstatement of deductions and compliance costs level.
Table 6.14: Overstatement of Deductions and Mean Compliance Costs
Tax Behaviour a Mean Compliance Cost (RM)
Complying SMEs (71) 9,293
Non-complying SMEs (51) 9,389
Neutral (50) 9,010
Overall (172) 9,239 b a The number of respondents is given in parentheses. b The costs are less than the reported mean compliance costs of RM9,295 due to differences in the response number.
Additionally, the relationship between compliance costs and likely tax compliance
behaviour is investigated for the non-compliance involving part of the RM10,000 as
well. A similar finding is observed for partial non-compliance as well, as shown in
Table 6.15. The likely complying respondents to both reporting behaviour and
deduction behaviour have lower compliance costs (RM7,794 and RM8,884
respectively) than those who are likely not to comply (RM10,609 and RM9,690
respectively).
155 At the five percent significant level.

172
Table 6.15: Partial Non-compliance Behaviour and Mean Compliance Costs
Tax Behaviour
Understatement
of Income a
Overstatement
of Deductions a
Mean (RM) Mean (RM)
Complying SMEs 7,794 (66) 8,884 (72)
Non-complying SMEs 10,609 (41) 9,690 (52)
Neutral 8,760 (65) 8,948 (48)
Overall b 9,239 (172) 9,239 (172) a The number of respondents is given in parentheses. b The costs are less than the reported overall mean compliance costs of RM9,295 due to differences in the response number.
Overall, having observed a lack of a statistical relationship between compliance costs
and possible compliance behaviour independently, for both compliance situations
(whether measured for the full RM10,000 and/or part of the amount for each tax
situation), it is important to analyse non-compliance behaviour at the SME level. For
this purpose, only respondents with likely compliance behaviour to both underreporting
and overstating situations are categorised as complying SMEs. Non-complying SMEs
are those respondents with non-compliance to one or both situations. Additionally, there
were also SMEs that chose to be indifferent for both non-compliance situations.
Compliance costs by these classifications are summarised and presented in Table 6.16.
Although complying SMEs seem to have relatively higher compliance costs (RM9,776)
than non-complying SMEs (RM9,233), the margin is reasonably small, i.e. less than six
percent. The statistical t-test also failed to indicate an association between compliance
costs and compliance behaviour at the SME level.156
156 At the five percent significant level.
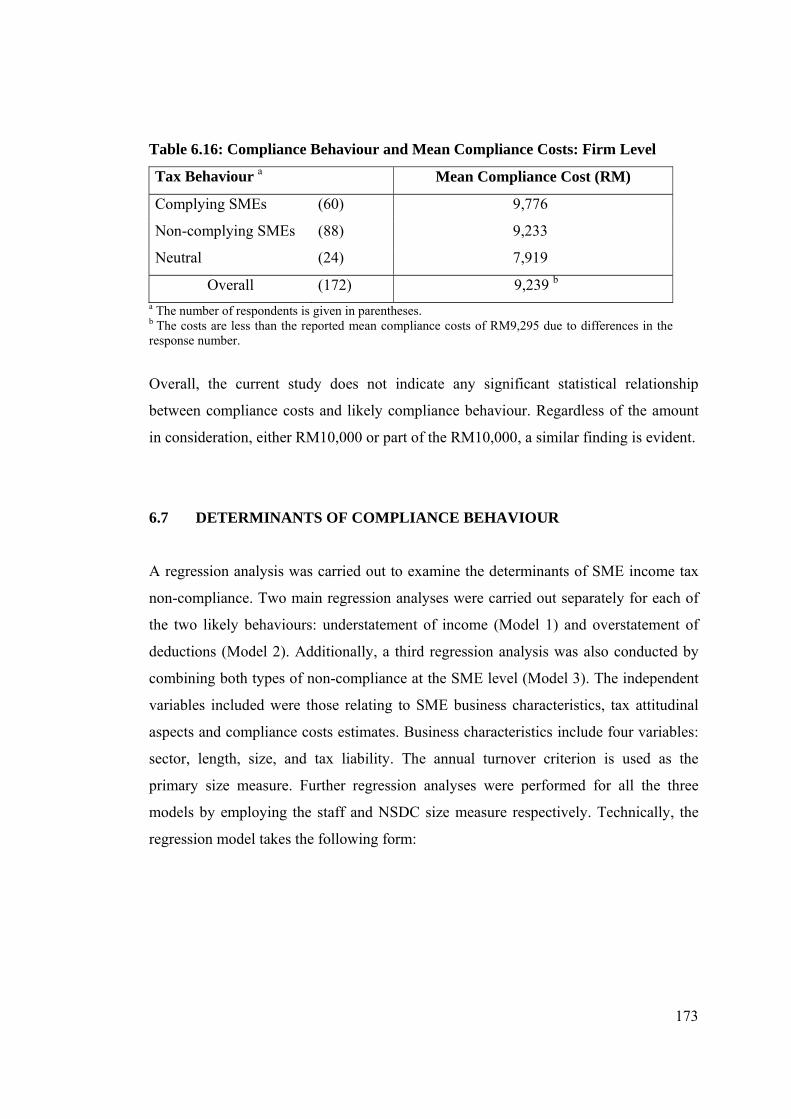
173
Table 6.16: Compliance Behaviour and Mean Compliance Costs: Firm Level
Tax Behaviour a Mean Compliance Cost (RM)
Complying SMEs (60) 9,776
Non-complying SMEs (88) 9,233
Neutral (24) 7,919
Overall (172) 9,239 b a The number of respondents is given in parentheses. b The costs are less than the reported mean compliance costs of RM9,295 due to differences in the response number.
Overall, the current study does not indicate any significant statistical relationship
between compliance costs and likely compliance behaviour. Regardless of the amount
in consideration, either RM10,000 or part of the RM10,000, a similar finding is evident.
6.7 DETERMINANTS OF COMPLIANCE BEHAVIOUR
A regression analysis was carried out to examine the determinants of SME income tax
non-compliance. Two main regression analyses were carried out separately for each of
the two likely behaviours: understatement of income (Model 1) and overstatement of
deductions (Model 2). Additionally, a third regression analysis was also conducted by
combining both types of non-compliance at the SME level (Model 3). The independent
variables included were those relating to SME business characteristics, tax attitudinal
aspects and compliance costs estimates. Business characteristics include four variables:
sector, length, size, and tax liability. The annual turnover criterion is used as the
primary size measure. Further regression analyses were performed for all the three
models by employing the staff and NSDC size measure respectively. Technically, the
regression model takes the following form:
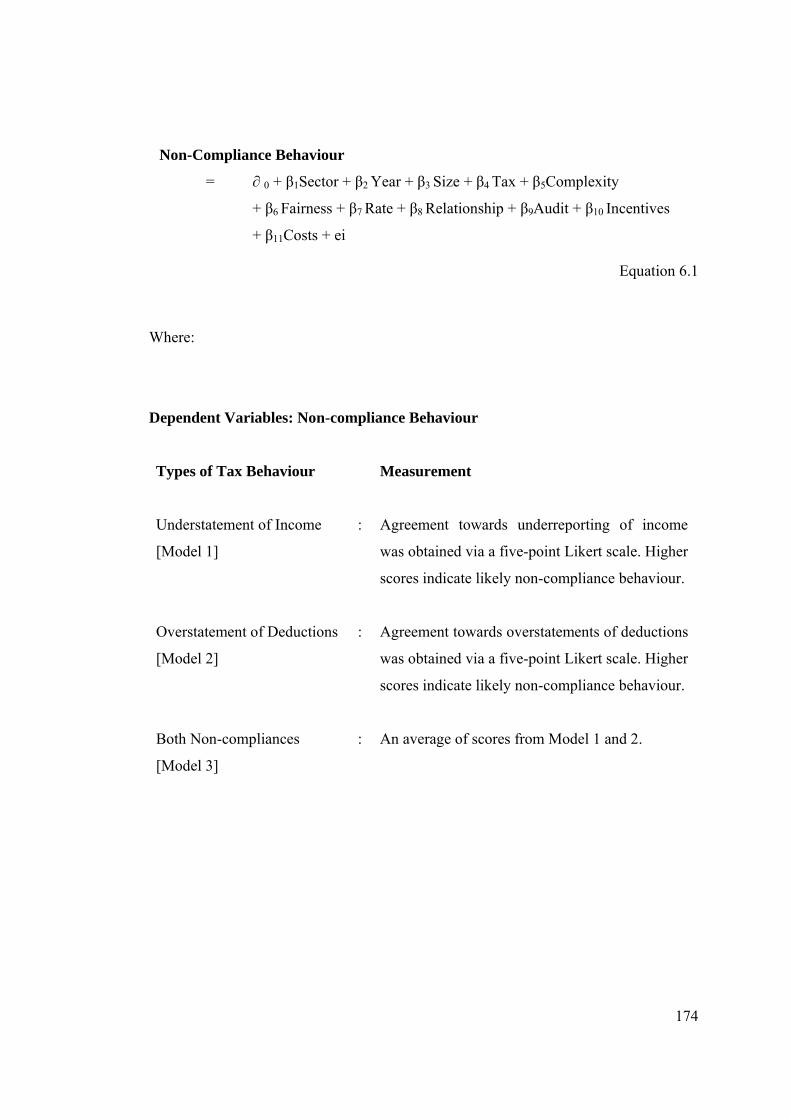
174
Where:
Dependent Variables: Non-compliance Behaviour
Types of Tax Behaviour Measurement
Understatement of Income
[Model 1]
: Agreement towards underreporting of income
was obtained via a five-point Likert scale. Higher
scores indicate likely non-compliance behaviour.
Overstatement of Deductions
[Model 2]
: Agreement towards overstatements of deductions
was obtained via a five-point Likert scale. Higher
scores indicate likely non-compliance behaviour.
Both Non-compliances
[Model 3]
: An average of scores from Model 1 and 2.
Non-Compliance Behaviour
= ∂ 0 + β1Sector + β2 Year + β3 Size + β4 Tax + β5Complexity
+ β6 Fairness + β7 Rate + β8 Relationship + β9Audit + β10 Incentives
+ β11Costs + ei
Equation 6.1

175
Independent Variables:
Business Sector
[Sector]
: There are five sectors: manufacturing, manufacturing-related
services, services, construction, and other. The ‘other’ sector
had two respondents and thus were excluded. For the
purpose of regression analysis, three dummy variables were
used with the services sector as the reference sector.
Business Length
[Year]
: Business length was reclassified into two categories: up to
five years and more than five years. A category of less than
two years in the actual survey was merged due to low
responses.
Business Size : (to use one proxy at one time)
Annual Turnover [Turnover], or
The original six levels of turnover were classified into four
levels due to the low number of responses in the last three
categories. For regression purposes, three dummy variables
were created with a turnover level of between RM250,000
and RM1 million as the reference level.
Number of Staff [Staff], or
Only four levels of staff are considered. The fifth level was
excluded since it has only one response. For regression
purposes, three dummy variables were used with number of
staff between five and nineteen as the reference staff group.
Size NSDC [NSDC]
Responding companies were re-classified into micro, small
and medium enterprises following the NSDC definition. For
the purposes of regression analysis, two dummy variables
were created with small enterprises as a reference category.

176
Estimated Tax
[Tax]
: The original six levels of the estimated tax were reduced to
three so as to recognise a low number of responses in the last
four levels. For the purpose of regression analysis, two
dummy variables were used with the tax level of between
RM1 and RM100,000 as a reference level.
Tax Complexity
[Complexity]
: Three statements were used to measure tax complexity via a
five-point Likert scale. Higher scores indicate higher tax
complexity.
Tax Fairness
[Fairness]
: Five statements were used to measure tax fairness via a five-
point Likert scale. Three types of response scale were
employed: strongly agree to strongly disagree; much less fair
to much more fair; and much less taxes to much more taxes.
Higher scores indicate higher tax fairness.
Tax Rate
[Rate]
: Three statements were used to measure the tax rate
perception via a five-point Likert scale. Higher scores
indicate higher tax rate fairness.
IRB Relationship
[Relationship]
: The perceived relationship with the IRB was measured via a
five-point Likert scale to a single statement. Higher scores
indicate a better relationship with the IRB official.
Tax Audit
[Audit]
: A single statement was used on the probability of tax audit
via a five-point Likert scale. The higher the scores, the
greater the likelihood of tax auditing.
Tax Incentives
[Incentives]
: A single statement was used to measure views related to tax
incentives via a five-point Likert scale. Higher scores
indicate agreement towards further incentives.

177
Compliance Costs
[Costs]
: Compliance costs estimation was made up of internal staff
costs, external tax fees and other non-staff costs on tax
activities. The compliance costs range from RM612 to
RM37,773 (see Chapter Five, Table 5.25). For regression
purposes, compliance costs estimates were transformed into
log10 to reduce the skewness of the variable (skewness).
Assessments of the assumptions underlying regression analysis revealed that all the four
assumptions, i.e. normality, linearity, multicollinearity, and heteroscedasticity, were not
violated. Further details are presented in Appendix R. A summary result of regressions
analysis, by using turnover as a primary business size proxy, is presented in Table 6.17.
Detailed results are presented in Appendix S, Table S.1.
Table 6.17: Summary of Results of Multiple Regressions
Understatement
of Income
(Model 1)
Overstatement
of Deductions
(Model 2)
Both
Non-compliance
(Model 3)
Results:
R2 0.122 0.176 0.172
Adjusted R2 0.029 0.089 0.084
Standard Error 1.204 1.250 1.059
F-value 1.315 2.016 1.958
P-value 0.195 0.015 a 0.019 a a Significant at the five percent level.
The regression models were statistically significant (at the five percent level) in relation
to overstatement of deductions and to both types of non-compliance, as shown in Table
6.17. Around nine percent of the variability of overstatement of deductions is accounted
for by the independent variables in Model 2. Three variables, namely sector, tax
complexity, and tax audit, were found to be significant determinants of overstating
behaviour. The results suggest that SMEs with a high perceived complexity level, low
178
likelihood of tax audit, and SMEs in the construction sector were likely to be non-
compliant in terms of accuracy of tax deductions.
As for the combined non-compliant model (Model 3), the same three variables
(business sector, level of tax complexity, and likelihood of tax audit) are found to be
determinants of both types of non-compliance behaviour. Additionally, business length
is found to be a significant determinant, suggesting that SMEs with less than five years
in business were likely to demonstrate non-compliant behaviour. As for understatement
of income (Model 1), similar variables (tax complexity, tax audit and business length)
are found to be among significant indicators of income reporting behaviour as well.
Nonetheless, the income reporting model (Model 1) is not significant at the five percent
level
Similar findings are also observed for the alternative business size measures.
Additionally, business length is also found to be a significant determinant of overstating
behaviour in terms of the NSDC size measure. A detailed result of multiple regressions
by the alternate size measure (staff and NSDC) is presented in Appendix S, Table S.2.
Overall, regressions analyses suggest that tax complexity, probability of tax audits,
business sector and business length have a significant influence on the accuracy of tax
deductions and overall tax reporting behaviour at the SME level.
6.8 FINDINGS OF THE WEB SURVEY
6.8.1 Introduction
The attitudinal aspects of corporate income tax and the likely compliance behaviour of
the respondents in a web survey are presented at the overall mean scores. All analysis
presented in this section follows a similar approach to the postal survey, except with
regard to each specific response. Analysis for each attitudinal aspect and behavioural
item is not considered in more detail as recognition of the low number of responses in
the specific response category. Details of responses are presented in Appendix N, Table

179
N.11. Similar to the postal survey, the measurements used are considered adequate, both
in terms of reliability and validity.
6.8.2 Tax Attitudes
Key findings on all six attitudinal aspects are shown in Table 6.18. For tax complexity,
a mean score of 3.60 illustrates the perceived complex nature of corporate income
taxation. In terms of tax structure, mean scores of 3.45 demonstrate the corporate tax
rate is perceived to be relatively fair. A similar finding is observed in terms of tax law
fairness. For tax incentives, a mean score of more than four indicates a high expectation
of tax incentives for SMEs. However, a neutral view is evident for the relationship
between the IRB and SMEs. Similarly, a mean score of 2.90 indicates an almost neutral
view with regards to the probability of a company being selected for a tax audit.
Table 6.18: Tax Attitudes in the Web Survey
Tax Aspects Mean Median Standard Deviation
Complexity 3.60 3.67 0.80
Fairness 3.34 3.40 0.67
Rate 3.45 3.67 1.11
Incentives 4.12 5.00 1.28
Audit 2.90 3.00 1.42
IRB Relationship 3.04 3.00 1.09
Number of respondents equals 75.
Additionally, analysis of tax attitudes by respondents’ business characteristics reveals
no statistical difference between respondents, except for tax fairness at the ten percent
significant level. Small and Medium Enterprises that are subjected to a tax of more than
RM100,000 perceived corporate income taxation as fair (3.67) compared to those not
subjected to tax (3.12).

180
6.8.3 Tax Behaviour
Analysis of mean scores indicates that respondents lean towards compliance in terms of
income reporting, but are indifferent for deduction of expenses, as shown in Table 6.19.
A combined mean score of 2.78 for both non-compliance situations demonstrates that
SMEs are prone to compliant behaviour.
Table 6.19: Respondents’ Views towards Non-compliance Behaviour (Web Survey)
Non-compliance Type Mean Median Standard Deviation
Understatement of Income 2.48 3.00 1.35
Overstatement of Deductions 3.06 3.00 1.33
Both Non-compliance a 2.78 3.00 1.20
Number of respondents equals 72. Three values are missing. a This refers to the combined category of both understatement of income and overstatement of deductions.
In terms of non-compliance for part of the RM10,000, the highest response received
(nearly 39 percent, as shown in Table 6.20) indicates an indifferent view for both
situations, followed by compliant behaviour. However, caution needs to be taken as all
the three response categories had less than 30 responses each.
Table 6.20: Respondents’ Views towards Partial Non-compliance Behaviour (Web
Survey)
Possibility of
Non-compliance
Partial
Understatement of Income
Partial
Overstatement of Deductions
Number of
Respondents
Percentage
Number of
Respondents
Percentage
Yes 18 25.0 20 28.6
No 26 36.1 23 32.9
Unsure 28 38.9 27 38.6
Total 72 a 100.0 70 a 100.0 a Number of respondents less than 75 due to missing cases.

181
6.8.4 Relationship of Tax Attitudes, Behaviour and Compliance Costs
The relationship between tax attitudes and likely tax behaviour is presented first,
followed by the relationship of both tax attitudinal and behavioural aspects towards
compliance costs. The tax rate structure and tax audits are significantly associated with
each and both types of non-compliance behaviour in a positive direction, as shown in
Table 6.21. Additionally, tax complexity and tax incentives are associated with
understatement of income and overstatement of deductions respectively. Tax incentives
are also positively correlated to combined non-compliance behaviour. A significant
correlation is observed as well between the two types of tax behaviour, suggesting
compliance in terms of one aspect is very likely to influence the other behaviour, as
shown in Table 6.21.
Table 6.21: Tax Attitudes and Behaviour: Correlation Analysis (Web Survey)
Understatement
of Income
Overstatement
of Deductions
Both
Non-compliance
Tax Attitudes:
Complexity - 0.280 b - 0.24 - 0.197
Fairness - 0.29 + 0.13 + 0.002
Rate + 0.296 b + 0.268 b + 0.321 a
Incentives + 0.183 + 0.305 b + 0.257 a
Audit + 0.407 a + 0.265 b + 0.394 a
IRB relationship + 0.085 + 0.050 + 0.075
Tax Behaviour:
Understatement of Income - + 0.566 a + 0.893 a
Overstatement of Deductions + 0.566 a - + 0.884 a
Positive (+) or negative (-) signs denote a direct or indirect relationship respectively. a Significant at the one percent level. b Significant at the five percent level.
On the contrary, all tax attitudinal aspects and tax behaviour (by each type and
combined non-compliance) are found to be not statistically associated to compliance
costs of taxation, as shown in Table 6.22. This finding fails to provide the relevancy of
compliance costs in the context of tax attitudes and likely tax behaviour of SMEs.

182
Table 6.22: Tax Attitudes, Behaviour and Compliance Costs:
Correlation Analysis (Web Survey)
Compliance Costs
Tax Attitudes:
- Complexity + 0.092
- Fairness + 0.006
- Rate - 0.086
- Incentives - 0.061
- Audits + 0.078
- IRB Relationship - 0.063
Tax Behaviour:
- Understatement of Income + 0.006
- Overstatement of deduction + 0.072
- Both Non-compliance a + 0.039
Positive (+) or negative (-) signs denote a direct or indirect relationship respectively. a This refers to the combined category of both understatement of income and overstatement of deductions.
6.8.5 Determinants of Compliance Behaviour
Regression analysis indicates that all three models (i.e. understatement of income,
overstatement of deductions, both non-compliances) are significant; however, at a
different statistical level, as shown in Table 6.23. The adjusted R2 suggest that 21
percent, 17 percent and 25 percent of the variations are explained by the independent
variables in the Models 1, 2 and 3 respectively. Probability of tax audits and perception
towards the tax rate are the two variables found to be significant in all three models.
Further, tax complexity and tax incentives are also significant in Model 2 and the other
two models (1 and 3) respectively. Detailed results are presented in Appendix N, Table
N.12.
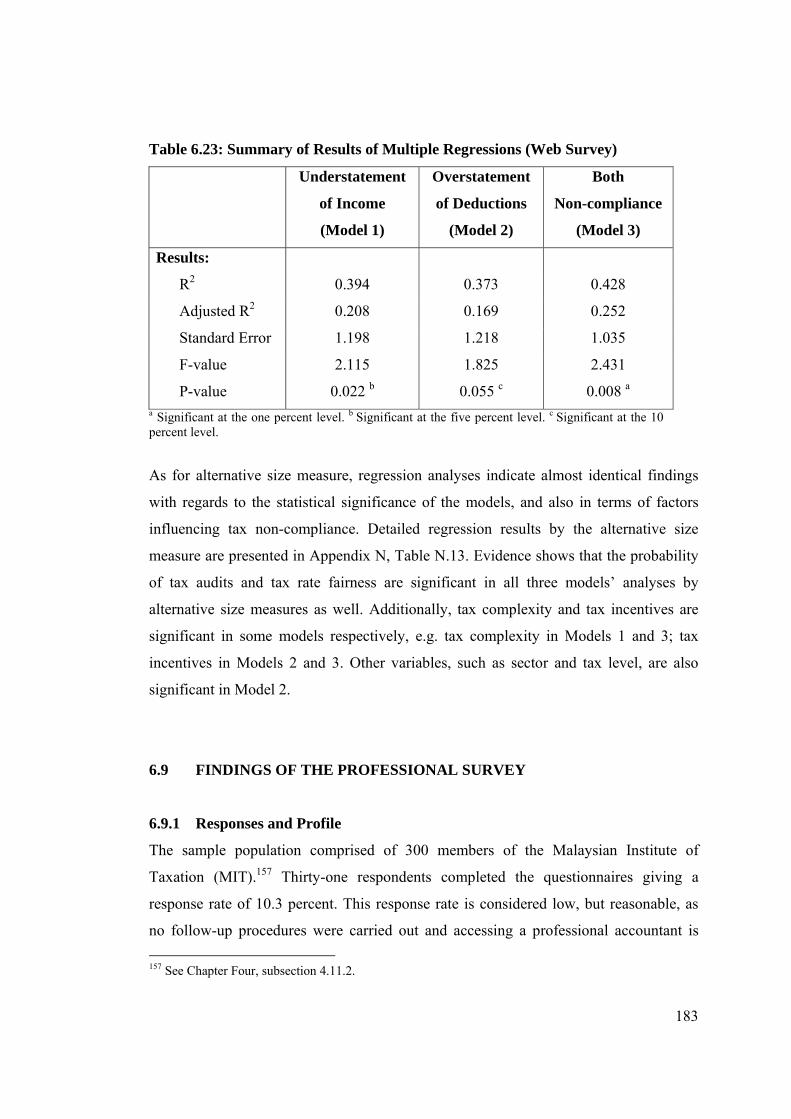
183
Table 6.23: Summary of Results of Multiple Regressions (Web Survey)
Understatement
of Income
(Model 1)
Overstatement
of Deductions
(Model 2)
Both
Non-compliance
(Model 3)
Results:
R2 0.394 0.373 0.428
Adjusted R2 0.208 0.169 0.252
Standard Error 1.198 1.218 1.035
F-value 2.115 1.825 2.431
P-value 0.022 b 0.055 c 0.008 a a Significant at the one percent level. b Significant at the five percent level. c Significant at the 10 percent level.
As for alternative size measure, regression analyses indicate almost identical findings
with regards to the statistical significance of the models, and also in terms of factors
influencing tax non-compliance. Detailed regression results by the alternative size
measure are presented in Appendix N, Table N.13. Evidence shows that the probability
of tax audits and tax rate fairness are significant in all three models’ analyses by
alternative size measures as well. Additionally, tax complexity and tax incentives are
significant in some models respectively, e.g. tax complexity in Models 1 and 3; tax
incentives in Models 2 and 3. Other variables, such as sector and tax level, are also
significant in Model 2.
6.9 FINDINGS OF THE PROFESSIONAL SURVEY
6.9.1 Responses and Profile
The sample population comprised of 300 members of the Malaysian Institute of
Taxation (MIT).157 Thirty-one respondents completed the questionnaires giving a
response rate of 10.3 percent. This response rate is considered low, but reasonable, as
no follow-up procedures were carried out and accessing a professional accountant is
157 See Chapter Four, subsection 4.11.2.
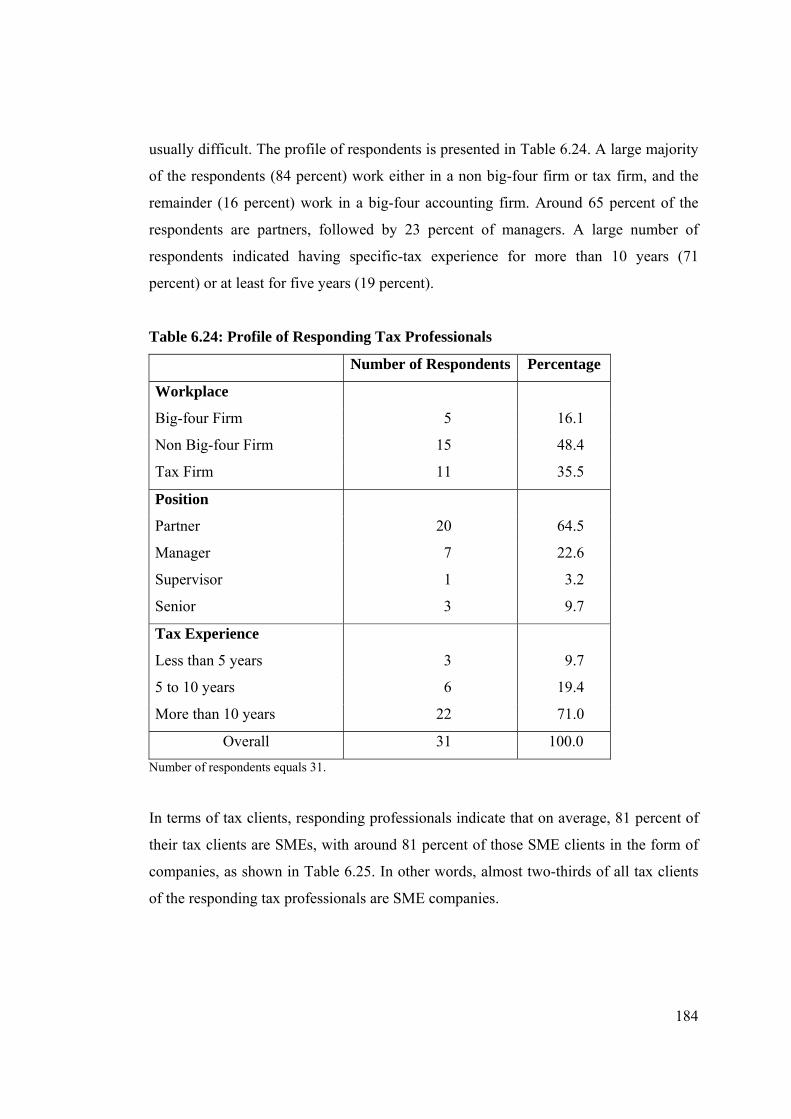
184
usually difficult. The profile of respondents is presented in Table 6.24. A large majority
of the respondents (84 percent) work either in a non big-four firm or tax firm, and the
remainder (16 percent) work in a big-four accounting firm. Around 65 percent of the
respondents are partners, followed by 23 percent of managers. A large number of
respondents indicated having specific-tax experience for more than 10 years (71
percent) or at least for five years (19 percent).
Table 6.24: Profile of Responding Tax Professionals
Number of Respondents Percentage
Workplace
Big-four Firm 5 16.1
Non Big-four Firm 15 48.4
Tax Firm 11 35.5
Position
Partner 20 64.5
Manager 7 22.6
Supervisor 1 3.2
Senior 3 9.7
Tax Experience
Less than 5 years 3 9.7
5 to 10 years 6 19.4
More than 10 years 22 71.0
Overall 31 100.0
Number of respondents equals 31.
In terms of tax clients, responding professionals indicate that on average, 81 percent of
their tax clients are SMEs, with around 81 percent of those SME clients in the form of
companies, as shown in Table 6.25. In other words, almost two-thirds of all tax clients
of the responding tax professionals are SME companies.
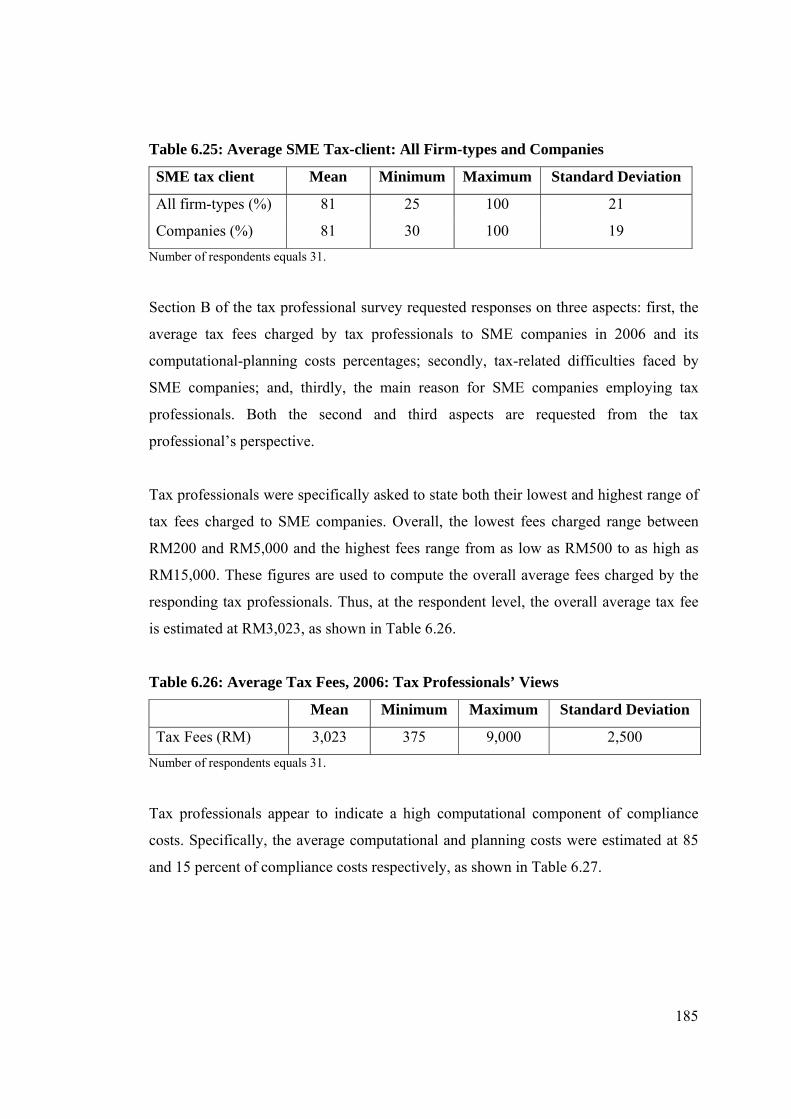
185
Table 6.25: Average SME Tax-client: All Firm-types and Companies
SME tax client Mean Minimum Maximum Standard Deviation
All firm-types (%) 81 25 100 21
Companies (%) 81 30 100 19
Number of respondents equals 31.
Section B of the tax professional survey requested responses on three aspects: first, the
average tax fees charged by tax professionals to SME companies in 2006 and its
computational-planning costs percentages; secondly, tax-related difficulties faced by
SME companies; and, thirdly, the main reason for SME companies employing tax
professionals. Both the second and third aspects are requested from the tax
professional’s perspective.
Tax professionals were specifically asked to state both their lowest and highest range of
tax fees charged to SME companies. Overall, the lowest fees charged range between
RM200 and RM5,000 and the highest fees range from as low as RM500 to as high as
RM15,000. These figures are used to compute the overall average fees charged by the
responding tax professionals. Thus, at the respondent level, the overall average tax fee
is estimated at RM3,023, as shown in Table 6.26.
Table 6.26: Average Tax Fees, 2006: Tax Professionals’ Views
Mean Minimum Maximum Standard Deviation
Tax Fees (RM) 3,023 375 9,000 2,500
Number of respondents equals 31.
Tax professionals appear to indicate a high computational component of compliance
costs. Specifically, the average computational and planning costs were estimated at 85
and 15 percent of compliance costs respectively, as shown in Table 6.27.

186
Table 6.27: Tax Fees Composition into Computational and Planning Costs: Tax
Professionals’ Views
Cost Nature Mean Minimum Maximum Standard Deviation
Computational (%) 85 50 100 15
Planning (%) 15 0 50 15
Number of respondents equals 31.
Estimating income tax payable and understanding income tax legislation are ranked as
the main tax-related difficulties faced by the SME companies, with almost 78 percent of
the respondents indicating those possibilities respectively, as shown in Table 6.28. The
third difficulty is expanding the record keeping requirements for tax purposes (61
percent). The least ranked difficulty, as expected, is dealing with external advisors.
Table 6.28: Tax-related Difficulties for SMEs: Tax Professionals’ Views
Number of Overall Percent
Responses Percent of Cases
Estimating Income Tax payable 24 16.1 77.4
Understanding Income Tax legislation 24 16.1 77.4
Increasing burden of record keeping for
tax purposes 19 12.8 61.3
Cash flow position to pay monthly tax
instalments 19 12.8 61.3
Implementing the Income Tax changes 18 12.1 58.1
Dealing with the tax authority 18 12.1 58.1
Maintaining records for Income Tax purpose 17 11.4 54.8
Short period of time to lodge the tax return 8 5.4 25.8
Dealing with external tax advisers 2 1.3 6.5
Total 149 a 100.0 - a Number of respondents equals 31. Total responses are higher as respondents were allowed to select more than one aspect.
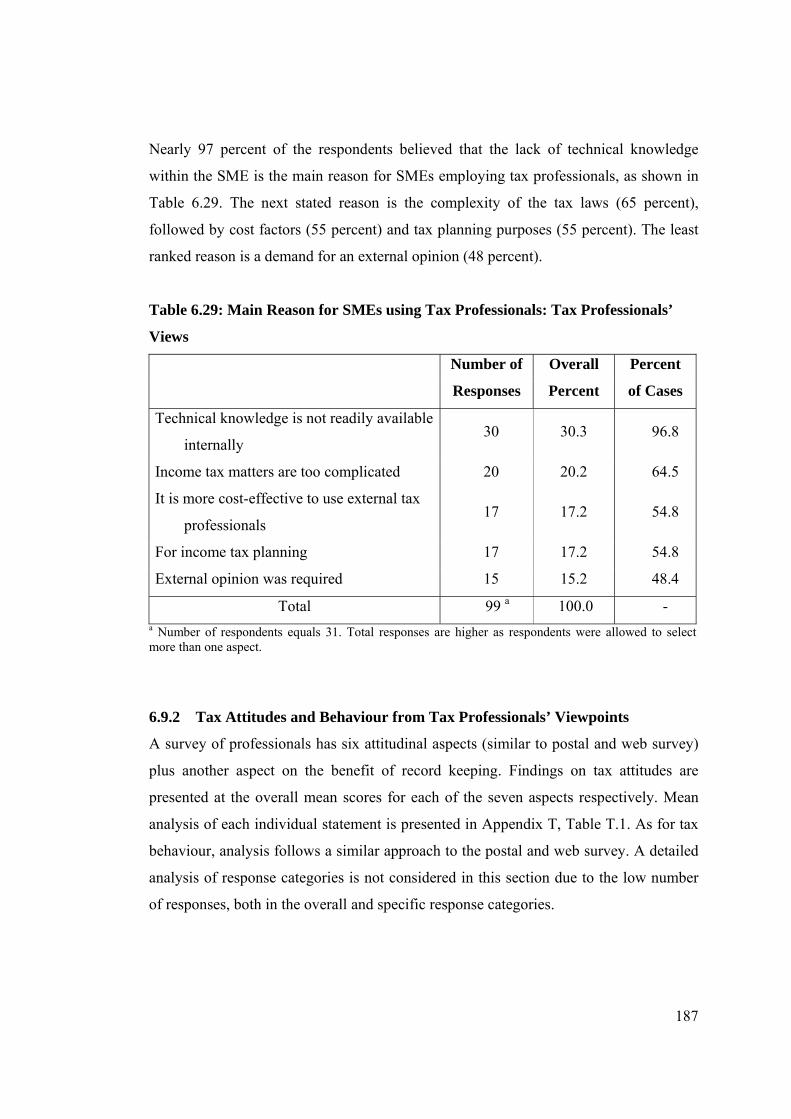
187
Nearly 97 percent of the respondents believed that the lack of technical knowledge
within the SME is the main reason for SMEs employing tax professionals, as shown in
Table 6.29. The next stated reason is the complexity of the tax laws (65 percent),
followed by cost factors (55 percent) and tax planning purposes (55 percent). The least
ranked reason is a demand for an external opinion (48 percent).
Table 6.29: Main Reason for SMEs using Tax Professionals: Tax Professionals’
Views
Number of Overall Percent
Responses Percent of Cases
Technical knowledge is not readily available
internally 30 30.3 96.8
Income tax matters are too complicated 20 20.2 64.5
It is more cost-effective to use external tax
professionals 17 17.2 54.8
For income tax planning 17 17.2 54.8
External opinion was required 15 15.2 48.4
Total 99 a 100.0 - a Number of respondents equals 31. Total responses are higher as respondents were allowed to select more than one aspect.
6.9.2 Tax Attitudes and Behaviour from Tax Professionals’ Viewpoints
A survey of professionals has six attitudinal aspects (similar to postal and web survey)
plus another aspect on the benefit of record keeping. Findings on tax attitudes are
presented at the overall mean scores for each of the seven aspects respectively. Mean
analysis of each individual statement is presented in Appendix T, Table T.1. As for tax
behaviour, analysis follows a similar approach to the postal and web survey. A detailed
analysis of response categories is not considered in this section due to the low number
of responses, both in the overall and specific response categories.
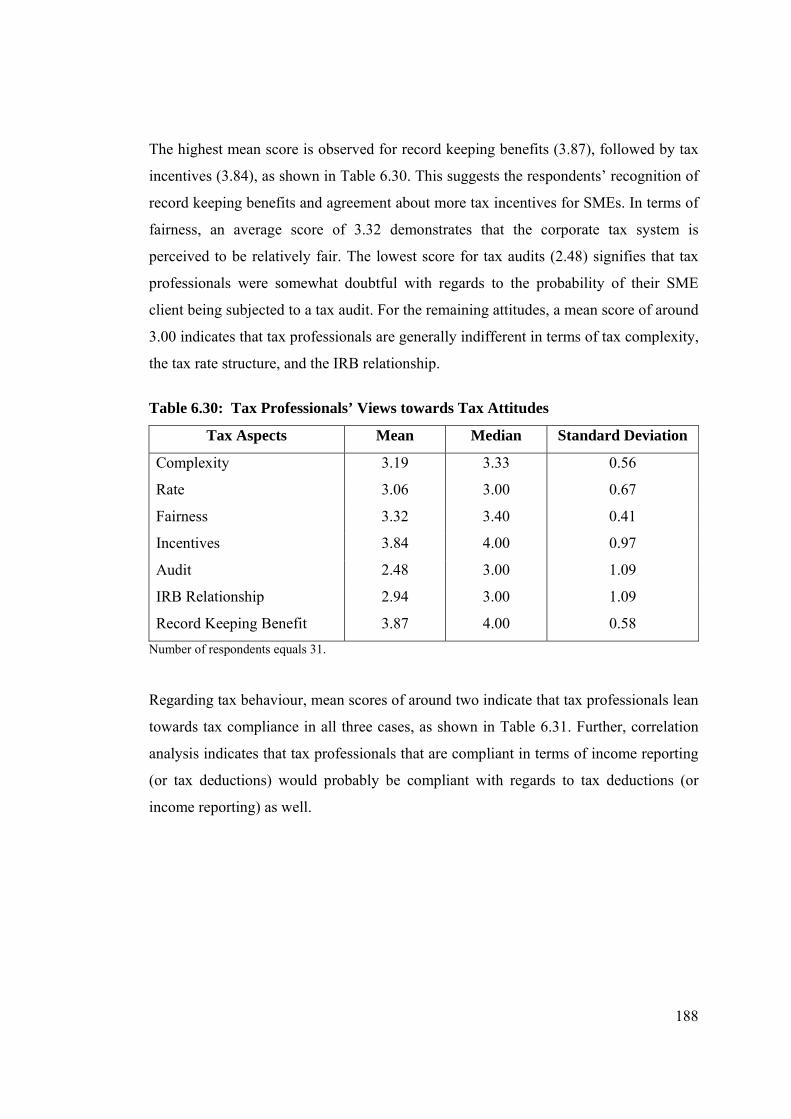
188
The highest mean score is observed for record keeping benefits (3.87), followed by tax
incentives (3.84), as shown in Table 6.30. This suggests the respondents’ recognition of
record keeping benefits and agreement about more tax incentives for SMEs. In terms of
fairness, an average score of 3.32 demonstrates that the corporate tax system is
perceived to be relatively fair. The lowest score for tax audits (2.48) signifies that tax
professionals were somewhat doubtful with regards to the probability of their SME
client being subjected to a tax audit. For the remaining attitudes, a mean score of around
3.00 indicates that tax professionals are generally indifferent in terms of tax complexity,
the tax rate structure, and the IRB relationship.
Table 6.30: Tax Professionals’ Views towards Tax Attitudes
Tax Aspects Mean Median Standard Deviation
Complexity 3.19 3.33 0.56
Rate 3.06 3.00 0.67
Fairness 3.32 3.40 0.41
Incentives 3.84 4.00 0.97
Audit 2.48 3.00 1.09
IRB Relationship 2.94 3.00 1.09
Record Keeping Benefit 3.87 4.00 0.58
Number of respondents equals 31.
Regarding tax behaviour, mean scores of around two indicate that tax professionals lean
towards tax compliance in all three cases, as shown in Table 6.31. Further, correlation
analysis indicates that tax professionals that are compliant in terms of income reporting
(or tax deductions) would probably be compliant with regards to tax deductions (or
income reporting) as well.
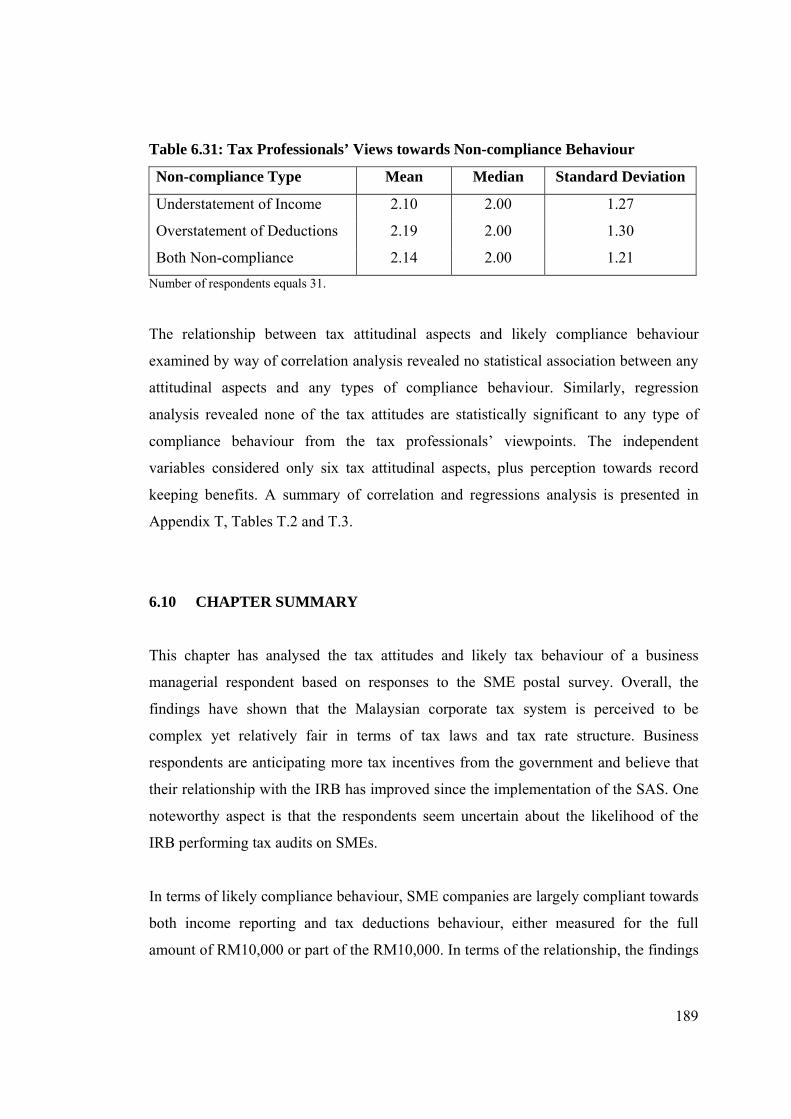
189
Table 6.31: Tax Professionals’ Views towards Non-compliance Behaviour
Non-compliance Type Mean Median Standard Deviation
Understatement of Income 2.10 2.00 1.27
Overstatement of Deductions 2.19 2.00 1.30
Both Non-compliance 2.14 2.00 1.21
Number of respondents equals 31.
The relationship between tax attitudinal aspects and likely compliance behaviour
examined by way of correlation analysis revealed no statistical association between any
attitudinal aspects and any types of compliance behaviour. Similarly, regression
analysis revealed none of the tax attitudes are statistically significant to any type of
compliance behaviour from the tax professionals’ viewpoints. The independent
variables considered only six tax attitudinal aspects, plus perception towards record
keeping benefits. A summary of correlation and regressions analysis is presented in
Appendix T, Tables T.2 and T.3.
6.10 CHAPTER SUMMARY
This chapter has analysed the tax attitudes and likely tax behaviour of a business
managerial respondent based on responses to the SME postal survey. Overall, the
findings have shown that the Malaysian corporate tax system is perceived to be
complex yet relatively fair in terms of tax laws and tax rate structure. Business
respondents are anticipating more tax incentives from the government and believe that
their relationship with the IRB has improved since the implementation of the SAS. One
noteworthy aspect is that the respondents seem uncertain about the likelihood of the
IRB performing tax audits on SMEs.
In terms of likely compliance behaviour, SME companies are largely compliant towards
both income reporting and tax deductions behaviour, either measured for the full
amount of RM10,000 or part of the RM10,000. In terms of the relationship, the findings

190
indicate that the complexity of the corporate tax law and the probability of tax audits are
statistically associated with both types of tax behaviour. The possibility of non-
compliance behaviour increases as the tax complexity level increases and the
probability of tax audits decreases. Further, non-compliance in terms of income
reporting (or tax deductions) could possibly affect the accuracy of the deductions (or
income reporting). However, no statistical relationship is evident between tax
compliance costs and the compliance behaviour of SMEs, measured both in terms of
income reporting, tax deductions and at the SME level. Analysis of findings from a
separate SME web survey and tax professionals’ postal survey have also been
presented. Overall, both surveys support findings of the main SME postal survey. A
further comparative analysis is made in Chapter Seven.

191
CHAPTER SEVEN
COMPARISON OF FINDINGS AND DISCUSSION
7.1 INTRODUCTION
This chapter compares key findings of the main SME postal survey and the SME web
survey. A comparison is also made to the relevant findings in the tax professionals’
surveys. This chapter mainly focuses on the similarities and differences within the two
SME surveys and with the tax professionals’ survey. This chapter also compares current
findings with prior relevant findings, both in Malaysia and from an overall international
perspective.
7.2 COMPLIANCE COSTS ESTIMATES
7.2.1 Comparison with Web Survey
The compliance costs in both the SME postal and web surveys resulted in almost
similar estimates of RM9,300 per SME company, as shown in Table 7.1. This
comparable finding adds reliability to compliance costs estimates in the current study.
The computational and planning costs percentages were also comparable between the
surveys. However, the internal costs (or external tax fees) percentage in the postal
survey was 11 percent lower (or higher) than the web survey. This difference may be
partly due to the amount of tax expertise or knowledge available within the firm’s
personnel.
Evidence shows that more tax works were conducted by the Manager/Accountant in the
web survey. The average internal time spent in the web survey (616 hours) is 41 hours
higher than in the postal survey (575 hours),158 with relatively more hours (on average
37 hours) spent by either the Manager or Accountant. Internal time costs in such
occurrences are definitely high (as higher wage rates apply) compared to companies that 158 See Table 5.17 and Appendix N, Table N.7.

192
rely on other staff categories. The average wage rates are also relatively higher in the
web survey in all four staff categories. For example, the average hourly wage rate for
the Manager/Accountant in the web survey (RM3,591) was RM146 higher than the
postal survey (RM3,445).159 At the same time, external tax fees are likely to be lower as
more tax works, particularly computational in nature, are performed internally. It is
important to note that the average wage rate used in the current study is based on the
respondents’ figures (similar to Pope, Fayle and Chen 1994), thus varying between
companies in the survey sample. The current study was mainly interested in the
compliance costs estimates at the firm level. Thus, a standard wage rate approach,
similar to the study by Evans et al. (1997) and Rametse (2006), was not employed.
Table 7.1: Compliance Costs Estimation by Survey Method, 2006
Postal Survey Web Survey
Tax Compliance Cost (RM) a
- Average per Firm
9,295
9,282
Component of Costs (RM) a
- Computational 7,217 b (74) 7,362 b (75)
- Planning 2,474 b (26) 2,409 b (25)
Sources of Costs (RM) a
- Internal c 5,509 (59) 6,498 (70)
- External 3,786 (41) 2,784 (30) a All monetary values are in current year prices. The percentage is given in parentheses. b Total costs were not equal to average compliance costs due to differences in the response number. c Inclusive of non-staff additional costs.
A comparable finding is evident as well in terms of costs distribution. The usual
regressive pattern of compliance costs is confirmed, in both the postal and web survey,
as shown in Table 7.2. The regressive nature of compliance costs upon small businesses
is revealed with the lowest turnover level being around two percent more severe in the
postal survey. Nonetheless, it must be noted that all turnover categories in the web
159 See Table 5.18 and Appendix N, Table N.8.
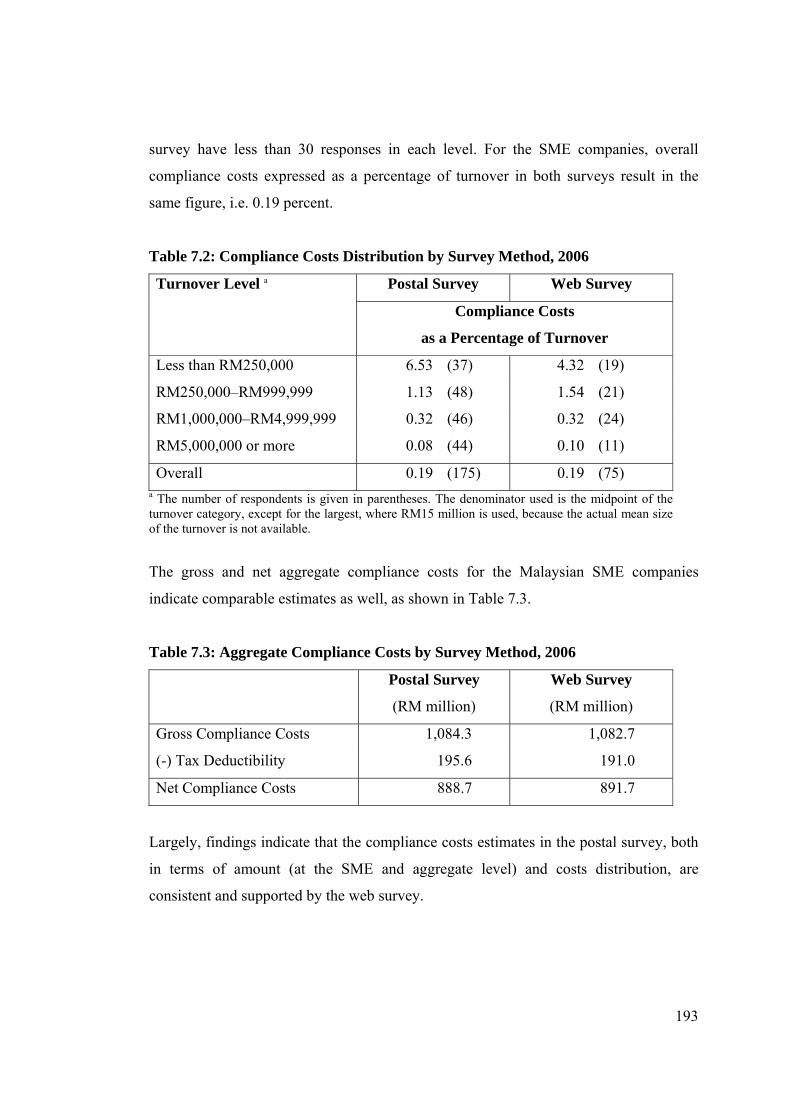
193
survey have less than 30 responses in each level. For the SME companies, overall
compliance costs expressed as a percentage of turnover in both surveys result in the
same figure, i.e. 0.19 percent.
Table 7.2: Compliance Costs Distribution by Survey Method, 2006
Turnover Level a Postal Survey Web Survey
Compliance Costs
as a Percentage of Turnover
Less than RM250,000 6.53 (37) 4.32 (19)
RM250,000–RM999,999 1.13 (48) 1.54 (21)
RM1,000,000–RM4,999,999 0.32 (46) 0.32 (24)
RM5,000,000 or more 0.08 (44) 0.10 (11)
Overall 0.19 (175) 0.19 (75) a The number of respondents is given in parentheses. The denominator used is the midpoint of the turnover category, except for the largest, where RM15 million is used, because the actual mean size of the turnover is not available.
The gross and net aggregate compliance costs for the Malaysian SME companies
indicate comparable estimates as well, as shown in Table 7.3.
Table 7.3: Aggregate Compliance Costs by Survey Method, 2006
Postal Survey
(RM million)
Web Survey
(RM million)
Gross Compliance Costs 1,084.3 1,082.7
(-) Tax Deductibility 195.6 191.0
Net Compliance Costs 888.7 891.7
Largely, findings indicate that the compliance costs estimates in the postal survey, both
in terms of amount (at the SME and aggregate level) and costs distribution, are
consistent and supported by the web survey.
194
7.2.2 Comparison with Prior Malaysian Studies
This section compares compliance costs estimates to the Malaysian SME companies
under the SAS regime (i.e. current study) with an earlier pre-SAS study by Hanefah,
Ariff and Kasipillai (2001). The comparison is realistic as a similar approach was
adopted in both studies,160 which was mainly based on Pope, Fayle and Chen (1994) in
Australia, especially in terms of methodology.
The average compliance costs of RM9,295 in the current study is almost 58 percent
lower than the RM21,964 in the pre-SAS study, as shown in Table 7.4. The 16 percent
increase in the proportion of external work demonstrates that tax professionals, as
expected, play a significant role in the SAS regime. The increasing nature of routine or
computational income tax work, from 59 percent to 74 percent, also corroborates the
current estimate.
160 The main difference is with regard to SME definitions. The pre-SAS study defines SMEs as companies with employees not exceeding 150 and with annual sales turnover not exceeding RM250 million. The current study adopts the newly standardised national definition (see Chapter One, subsection 1.5.3).

195
Table 7.4: Compliance Costs of Malaysian Small and Medium Enterprises
Prior Study a Current Study b
Tax year 1999 2006
Scope Corporate Income Tax Corporate Income Tax
Coverage Northern region of
Peninsular Malaysia
Peninsular Malaysia
Tax Compliance Cost (RM) c
- Average per Firm
21,964
9,295
Component of Costs (RM) c
- Computational 12,960 (59) 7,217 d (74)
- Planning 9,004 (41) 2,474 d (26)
Sources of Costs (RM) c
- Internal 15,493 d (75) 5,509 (59) e
- External 5,210 d (25) 3,786 (41) a Source: Hanefah, Ariff and Kasipillai (2001). The useable responses equal 67. b Data from the current study. The useable responses equal 175. c All monetary values are in current year prices. The percentage is given in parentheses. d This total is not equal to overall mean costs due to differences in the response number. e Inclusive of non-staff additional costs. Source: Adapted from Abdul-Jabbar and Pope (2008a, p. 305 - Table 9).
A relatively high proportion of both external tax fees and computational costs is
theoretically and practically reasonable in the SAS regime. However, the overall
decrease in the compliance costs is contrary to the presumed expectation. To some
extent, these cost decreases may be because it has been more than six years since the
implementation of the SAS in Malaysia. The previous study related to the tax year 1999
and the data was collected in 2000. It is important to highlight that there were two major
tax changes announced in 1999 (Ministry of Finance Malaysia), namely the introduction
of the SAS and the application of a current year basis to replace the existing preceding
year basis.161 Another possible explanation for the compliance costs decline may relate
to the economic climate when the previous study was conducted. A major Asian
financial crisis during the period of the prior study by Hanefah, Ariff and Kasipillai
161 See Chapter Three, subsection 3.2.3 for details.

196
(2001) may have encouraged Malaysian SMEs to grossly overstate their compliance
costs. The timing of the current study is perhaps suitable given that no major income tax
changes took place during the study period, i.e. 2007 or tax year 2006. Moreover, the
possibilities of high initial costs or start-up effects have been removed as the SAS has
been in place for more than six years in 2007.
A similar trend was evident in Australia. Evans et al. (1997) indicates that compliance
costs (on the basis of tax revenue and gross domestic product) were found to be
relatively lower, either at individual, business or overall levels, as compared to a series
of studies lead by Pope (Pope, Fayle and Duncanson 1990; Pope, Fayle and Chen 1991,
1993a, 1993b; Pope, Fayle and Chen 1994) prior to the SAS in Australia. However,
methodological differences should be observed when comparing these studies in
Australia.162 The fact that studies led by Pope were conducted prior to the SAS which
began in 1992, and the study by Evans et al. (1997) was carried out during the SAS, is
often overlooked and not highlighted in the literature (Mathieu, Waddams and Antwi
2007, p. 2). As a result, and citing several other key compliance costs studies
internationally, Mathieu, Waddams and Antwi (2007, pp. 2-3) emphasised the
possibility of high total tax compliance costs in countries where the SAS is well
established, low costs where the SAS is not implemented, and of intermediary costs for
countries where the SAS has recently been introduced. The compliance costs level from
these theoretical points of view and the current study is illustrated in Table 7.5.163 From
this perspective, compliance costs estimates in the current study should be relatively
higher than the pre-SAS study, at least initially.
162 For example, Evans et al. (1997) did not make comparison, either at the disaggregate level or in absolute terms, but rather expressed compliance costs at the aggregate level both as a percentage of tax revenue and GDP. 163 Compliance costs expressed in different terms, i.e. to tax revenue or GDP, may result in a different interpretation, especially in terms of costs distribution (Ariff and Pope 2002, p. 42).
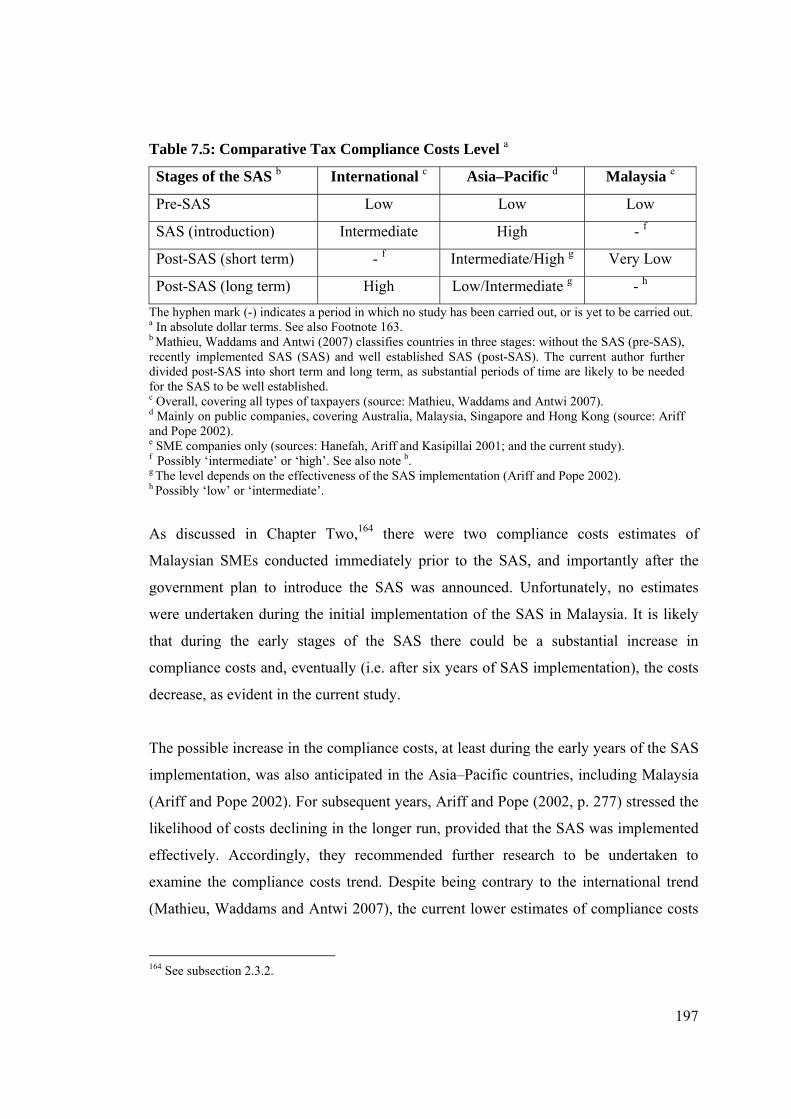
197
Table 7.5: Comparative Tax Compliance Costs Level a
Stages of the SAS b International c Asia–Pacific d Malaysia e
Pre-SAS Low Low Low
SAS (introduction) Intermediate High - f
Post-SAS (short term) - f Intermediate/High g Very Low
Post-SAS (long term) High Low/Intermediate g - h
The hyphen mark (-) indicates a period in which no study has been carried out, or is yet to be carried out. a In absolute dollar terms. See also Footnote 163. b Mathieu, Waddams and Antwi (2007) classifies countries in three stages: without the SAS (pre-SAS), recently implemented SAS (SAS) and well established SAS (post-SAS). The current author further divided post-SAS into short term and long term, as substantial periods of time are likely to be needed for the SAS to be well established. c Overall, covering all types of taxpayers (source: Mathieu, Waddams and Antwi 2007). d Mainly on public companies, covering Australia, Malaysia, Singapore and Hong Kong (source: Ariff and Pope 2002). e SME companies only (sources: Hanefah, Ariff and Kasipillai 2001; and the current study). f Possibly ‘intermediate’ or ‘high’. See also note b. g The level depends on the effectiveness of the SAS implementation (Ariff and Pope 2002). h Possibly ‘low’ or ‘intermediate’.
As discussed in Chapter Two,164 there were two compliance costs estimates of
Malaysian SMEs conducted immediately prior to the SAS, and importantly after the
government plan to introduce the SAS was announced. Unfortunately, no estimates
were undertaken during the initial implementation of the SAS in Malaysia. It is likely
that during the early stages of the SAS there could be a substantial increase in
compliance costs and, eventually (i.e. after six years of SAS implementation), the costs
decrease, as evident in the current study.
The possible increase in the compliance costs, at least during the early years of the SAS
implementation, was also anticipated in the Asia–Pacific countries, including Malaysia
(Ariff and Pope 2002). For subsequent years, Ariff and Pope (2002, p. 277) stressed the
likelihood of costs declining in the longer run, provided that the SAS was implemented
effectively. Accordingly, they recommended further research to be undertaken to
examine the compliance costs trend. Despite being contrary to the international trend
(Mathieu, Waddams and Antwi 2007), the current lower estimates of compliance costs
164 See subsection 2.3.2.

198
provide support to the possible decreasing trend as anticipated by Ariff and Pope
(2002).
The significant decline is likely due to the effectiveness of the SAS implementation,
mainly as a result of numerous simplification measures taken by the IRB. The most
important of these include the substantial reduction of capital expenditure categories for
capital allowance purposes, the simplification of the business basis period, the
introduction of dual tax rates for SMEs, and permitting 100 percent capital allowance
for small value assets during the relevant purchased year (effective from years of
assessment 2000, 2002, 2003 and 2006 respectively).165 A similar trend is evident in
Singapore. Ariff, Ismail and Loh (1997, p. 1258) found a significant decrease of 30
percent in the tax compliance costs was evident just one year (1994 to 1995). They
strongly believed that the decrease was primarily attributable to the simplification
measures taken by the Inland Revenue Authority of Singapore (IRAS). Therefore, it is
most likely that the numerous efforts taken by the IRB have resulted in significant
benefits for the business community in Malaysia, SMEs in particular. Despite the low
compliance costs finding in the current study, the regressive nature of compliance costs
for SME business is even greater in the current estimates, as shown in Table 7.6.
165 See Chapter Three, subsection 3.2.3.

199
Table 7.6: Compliance Costs Distribution of Malaysian Small and Medium
Enterprises
Prior Study a Current Study b
Turnover
(RM Million)
Compliance Costs
as a Percentage of
Turnover c
Turnover
(RM Million)
Compliance Costs
as a Percentage of
Turnover d
Less than 0.25 6.53
Less than 5 1.20 0.25 – 1 1.13
1- 5 0.32
5 or more 0.08
5–50 0.07
More than 50 0.02
Overall 0.10 Overall 0.19 a 1999 figures from Hanefah, Ariff and Kasipillai (2001). b 2006 data from the current main postal survey. c Computed using a similar approach to the current study as the information is not available in the previous study. These figures, however, should be treated cautiously. The denominator used is the midpoint of the turnover category, except for a category of more than RM50 million, where RM55 million was used. For the overall category, RM23 million is used, which is derived by weighting the midpoints of the turnover level, rounded to the nearest million. d The denominator used is the midpoint of the turnover category, except for the largest, where RM15 million is used. The denominator used for the overall category is RM5 million (see Table 5.32).
Tax compliance costs expressed as a percentage of tax revenue also suggested a similar
concern, as shown in Table 7.7. Compliance costs relative to tax liability have possibly
grown slightly from almost eight percent during the OAS to just over nine percent under
the SAS. However, these figures, which are derived under certain assumptions,166
should be treated cautiously as the corresponding actual tax revenue is not available in
both studies. A simple direct comparison, even within the same country, could be
misleading (Evans et al. 1998, p. 110); thus a number of companies in the previous
study (i.e. SME with turnover of over RM50 million), which certainly would not be
considered as SMEs under the current definitions, were excluded in deriving the 1999
166 Refer note a, Table 7.7.

200
figures.167 Further, it must be emphasised that a lower tax rate applied in 2006 due to a
tax rate deduction and the formation of dual tax rates for corporate SMEs.168
Table 7.7: Compliance Costs Relative to Tax Liability a
Tax Year Compliance
Costs
(RM)
Tax
Liability b
(RM)
Compliance Costs
as a percentage of
Tax Liability
1999 c 1,400,787 18,038, 015 7.77
2006 d 1,626,593 17,325,000 9.39 a Based on sample companies. b Actual tax liability is not available. Data for 1999 refers to estimated tax as declared by the respondents. The tax liability in the current study is the sum of the midpoints of the estimated tax level as reported by the 172 respondents (see Table 5.12). For the tax level of RM1 million and above, RM1.5 million is used as a midpoint. c Figures from Hanefah, Ariff and Kasipillai (2001, p. 93 - Table 8), adjusted by excluding figures from respondents with turnover of over RM50 million. Some respondents in the turnover level between RM5 million and RM50 million that may have exceeded RM25 million are not excluded due to lack of details. d Data from the current study.
Despite a significant decline (58 percent) in average tax compliance costs in absolute
terms, the regressive nature of compliance costs upon Malaysian small businesses
remains an important area in tax policy considerations. Tax compliance costs as a
percentage of tax liability raised further concern. The IRB is expected to continue its
efforts in introducing further tax simplification measures to all business taxpayers. This
policy is in line with recommendations made by Freedman (2009). The IRB may want
to consider a specific policy on the compliance costs of SMEs in addressing their
regressive nature in a more systematic and comprehensive approach.169
167 Refer note b, Table 7.7. 168 In 1999, the corporate tax rate was 28 percent. In 2006, SME companies with a taxable income of up to RM500,000 were subject to a tax rate of 20 percent, and 25 percent to the remainder. See also Chapter Three, subsection 3.2.3. Compliance costs percentage is sensitive to factors affecting tax revenue, particularly tax rates (Sandford and Hasseldine 1992, p. 111). 169 See Chapter Eight, Section 8.3.
201
7.2.3 Comparison with International Studies
Despite many differences, both in terms of taxation (e.g. structure, types and rates) and
methodology (e.g. data quality, sample frame, response rates and timing of survey),
international comparisons of the compliance costs estimates are useful to support the
overall findings between countries (see especially Sandford 1995, pp. 405 - 408) and
also within the same country (Evans et al. 1998, p. 109). A direct comparison of
estimates may not be useful, thus researchers often employ compliance costs as
proportions of tax revenue (Sandford 1995, p. 406) and/or GDP (Pope, Fayle and Chen
1994, p. 85). The former is common in almost all international comparisons, but the
latter has been suggested as a better measure (Pope 1994, p. 100; 2003, p. 70). Overall,
tax compliance costs studies undertaken between the early 1980s and 2002 imply that
compliance costs of a specific tax, e.g. personal income tax, corporate income tax, GST,
are normally between two percent and 10 percent of the revenue yield from those taxes,
or up to 2.5 percent of GDP (Evans 2003b, p. 71).
Comparison of the Malaysian SME compliance costs estimates with relevant earlier
international findings is useful in this context. Unfortunately, no previous international
study focuses specifically on estimating tax compliance costs of SME companies,170 but
mostly targets listed companies, with one study also including medium-sized
companies.171 The earlier Malaysian study (Hanefah, Ariff and Kasipillai 2001) was the
first to consider SME companies and the current study is probably the second.172 As
such, a comparison is carried for relevant studies on corporate income taxation. Other
major international studies that include corporations as part of their comprehensive
studies on business income taxation, for example, those of New Zealand (Sandford and
Hasseldine 1992) and Australia (Evans et al. 1997) though useful to some extent, are
not considered in detail in this comparison.
170 A Canadian study by Erard (1997b), although focused on SMEs, was concerned with SME perceptions about the compliance burden and did not estimate compliance costs. 171 See Chapter Two, subsection 2.3.1. See also Appendix E. 172 See earlier subsection 7.2.2 for comparison of these two Malaysian studies.

202
For this purpose, all prior studies in other Asian countries (Hong Kong, Singapore and
India) are included as illustrative of developing countries, with only India adopting the
SAS. Studies in Australia, the UK, the US and Canada represent corporate compliance
costs in developed countries, with the US and Canada adopting the SAS since the early
1940s, Australia in 1992, and more recently the UK implementing the SAS in
1996/1997. All three Asian countries, Australia, the UK and Canada are
Commonwealth Countries (and formerly part of the British Empire), which shared
similar income tax provisions, particularly during the early years of their independence.
Studies in Slovenia and Croatia are also compared in lieu of transitional countries. A
summary of the key findings on corporate compliance costs in the current study in a
comparison between selected countries is shown in Table 7.8.
Overall, the current Malaysian study shows that computational components (in contrast
to planning costs) are high compared to others corporate compliance costs studies, with
two exceptions, namely Hong Kong and Australia. This finding is expected as the
current Malaysian study is undertaken in the SAS regime. In terms of sources, an
internal component also shows a similar trend, with a comparable high percentage
observed in the US and transition countries. Under the SAS regime, the high trend of
internal costs is expected, especially within SME companies. Nonetheless, a high
internal component in the 1992 US study (Slemrod and Blumenthal 1996) is surprising
as this study was confined to big corporations.
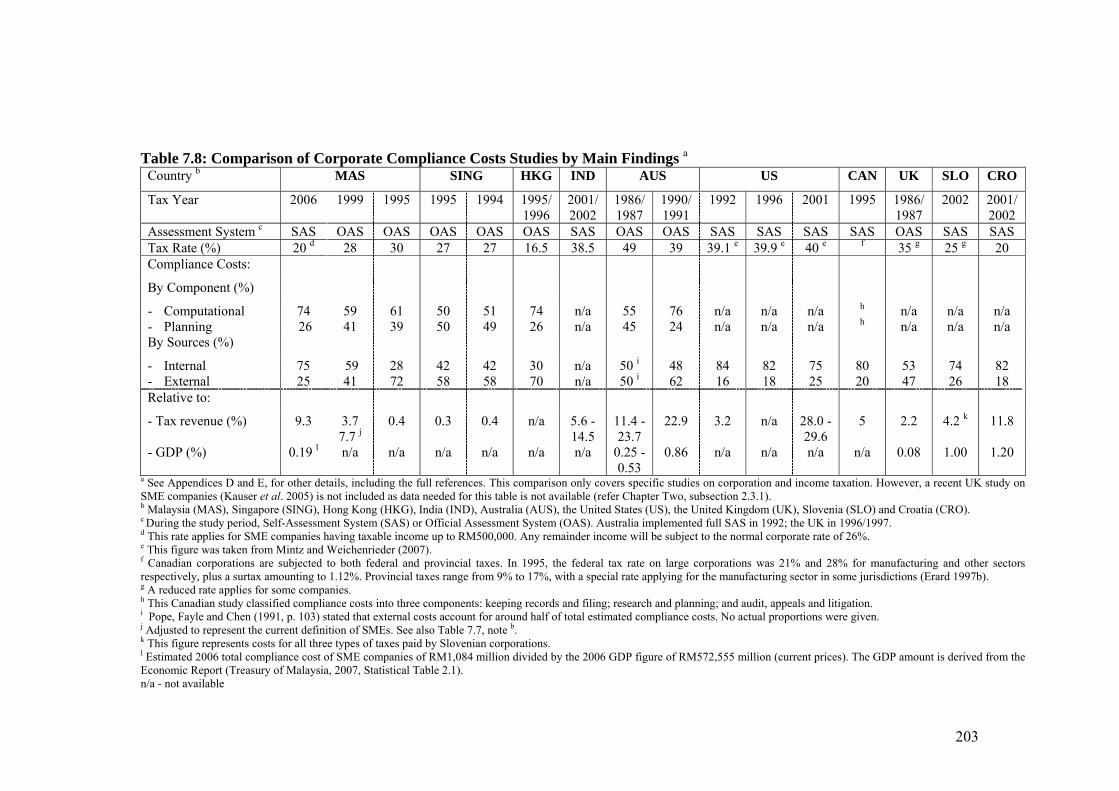
203
Table 7.8: Comparison of Corporate Compliance Costs Studies by Main Findings a
Country b MAS SING HKG IND AUS US CAN UK SLO CRO
Tax Year 2006 1999 1995 1995 1994 1995/ 1996
2001/ 2002
1986/ 1987
1990/ 1991
1992 1996 2001 1995 1986/1987
2002 2001/ 2002
Assessment System c SAS OAS OAS OAS OAS OAS SAS OAS OAS SAS SAS SAS SAS OAS SAS SAS Tax Rate (%) 20 d 28 30 27 27 16.5 38.5 49 39 39.1 e 39.9 e 40 e f 35 g 25 g 20 Compliance Costs:
By Component (%)
- Computational 74 59 61 50 51 74 n/a 55 76 n/a n/a n/a h n/a n/a n/a - Planning 26 41 39 50 49 26 n/a 45 24 n/a n/a n/a h n/a n/a n/a By Sources (%)
- Internal 75 59 28 42 42 30 n/a 50 i 48 84 82 75 80 53 74 82 - External 25 41 72 58 58 70 n/a 50 i 62 16 18 25 20 47 26 18 Relative to:
- Tax revenue (%) 9.3 3.7 7.7 j
0.4 0.3 0.4 n/a 5.6 - 14.5
11.4 - 23.7
22.9 3.2 n/a 28.0 -29.6
5 2.2 4.2 k 11.8
- GDP (%) 0.19 l n/a n/a n/a n/a n/a n/a 0.25 - 0.53
0.86 n/a n/a n/a n/a 0.08 1.00 1.20
a See Appendices D and E, for other details, including the full references. This comparison only covers specific studies on corporation and income taxation. However, a recent UK study on SME companies (Kauser et al. 2005) is not included as data needed for this table is not available (refer Chapter Two, subsection 2.3.1). b Malaysia (MAS), Singapore (SING), Hong Kong (HKG), India (IND), Australia (AUS), the United States (US), the United Kingdom (UK), Slovenia (SLO) and Croatia (CRO). c During the study period, Self-Assessment System (SAS) or Official Assessment System (OAS). Australia implemented full SAS in 1992; the UK in 1996/1997. d This rate applies for SME companies having taxable income up to RM500,000. Any remainder income will be subject to the normal corporate rate of 26%. e This figure was taken from Mintz and Weichenrieder (2007). f Canadian corporations are subjected to both federal and provincial taxes. In 1995, the federal tax rate on large corporations was 21% and 28% for manufacturing and other sectors respectively, plus a surtax amounting to 1.12%. Provincial taxes range from 9% to 17%, with a special rate applying for the manufacturing sector in some jurisdictions (Erard 1997b). g A reduced rate applies for some companies. h This Canadian study classified compliance costs into three components: keeping records and filing; research and planning; and audit, appeals and litigation. i Pope, Fayle and Chen (1991, p. 103) stated that external costs account for around half of total estimated compliance costs. No actual proportions were given. j Adjusted to represent the current definition of SMEs. See also Table 7.7, note b. k This figure represents costs for all three types of taxes paid by Slovenian corporations. l Estimated 2006 total compliance cost of SME companies of RM1,084 million divided by the 2006 GDP figure of RM572,555 million (current prices). The GDP amount is derived from the Economic Report (Treasury of Malaysia, 2007, Statistical Table 2.1). n/a - not available
204
The Malaysian SME compliance costs expressed in terms of a percentage of tax
revenue (nine percent) seems relatively high compared to almost all studies, with the
exceptions of Australia at 23 percent (Pope, Fayle and Chen 1994) and Croatia at 12
percent (Blazic 2004), and the recent US 2001 study at 28–30 percent (Slemrod and
Venkatesh 2002). The fact that tax compliance costs of Australian companies were
highly significant compared with other countries (as shown in Table 7.8) is not
surprising as an international comparison on corporate compliance costs (Pope, Fayle
and Chen 1994, pp. 99-100) and business compliance costs (Evans et al. 1997, pp. 75-
76) indicated such a trend earlier. Comparison with the US 2001 study should be treated
more cautiously as this study included a sample population that pays no taxes,173 which
elevated the compliance costs ratio as a result of lower tax revenue (i.e. the
denominator).174
The tax compliance costs relative to tax revenue in the earlier US study (Slemrod and
Blumenthal 1996) was 3.2 percent. As a useful comparison, income tax compliance
costs of all businesses—including corporations—as a percentage of tax revenue, ranged
from as low as 2.8 percent in the UK (Sandford, Godwin and Hardwick 1989), four
percent in the Netherlands (Allers 1994) to as high as 15.8 percent in Australia (Evans
et al 1997) and 19.6 percent in New Zealand (Sandford and Hasseldine 1992). Overall,
the current Malaysian estimate of around nine percent, although it could be of some
concern, is within the international range of between two percent and 10 percent of tax
revenue as observed by Evans (2003b, p. 71).
In terms of GDP, with the exception of the UK study, the 2006 Malaysian corporate
SME compliance costs of nearly 0.2 percent is the lowest when compared to companies
in Australia (0.9 percent), Slovenia (one percent) and Croatia (1.2 percent). Comparison
with earlier Asian studies unfortunately is not possible, as the current study is the first to
estimate total compliance costs in Malaysia. In terms of all businesses, including
corporations, an international comparison of major studies in the UK (Sandford,
173 Slemrod and Venkatesh (2002) referred to this firm as ‘a pass-through entity’ and argued that the costs portion would be significantly lower if the effects of these entities are excluded. 174 See Slemrod and Venkatesh (2002, p. 27) for full details.

205
Godwin and Hardwick 1989),175 New Zealand (Sandford and Hasseldine 1992), the
Netherlands (Allers 1994) and Australia (Evans et al 1997) indicates a ratio of income
tax compliance costs of between one and two percent of corresponding GDP.
Despite some similarities among these studies, especially for companies, analysis
should be made cautiously due to differences in company size, tax features and
methodology. More importantly, the considerable lag between those studies should be
noted. For example, the lag between the current study and the 1986/1987 UK (Sandford,
Godwin and Hardwick 1989) and 1986/1987 Australian (Pope, Fayle and Chen 1991)
studies is over 20 years, and over 10 years for most of the other studies. It seems that
only four studies have been conducted since 2000, including the current study. It is
observed that most of the recent international compliance costs studies (with the
exception of Asian studies) tend to focus on VAT/GST payers (see for example,
Hasseldine and Hansford 2002; Rametse and Pope 2002; Yesegat 2009). This trend is
not surprising due to the introduction of GST/VAT in many countries and, more
importantly, as a result of high compliance costs and its regressivity towards GST/VAT
payers (Sandford 1995, p. 5). The GST is yet to be introduced in Malaysia. As
discussed in Chapter One,176 the current study emphasises corporations, as tax revenue
from this sector is highly significant in Malaysia.
175 The percentage for the UK was cited in Pope (1994, p. 100 - Table 9). 176 See Chapter One, subsection 1.2.1.

206
7.3 TAX ATTITUDES
7.3.1 Comparison with Web Survey
Tax attitudes of respondents in both SME surveys largely illustrated similar perceptions,
as shown in Table 7.9. Comparatively, mean scores are slightly higher for tax attitudinal
aspects in the web survey, except for tax incentives and the IRB relationship. The
ranking of mean scores also indicated similar patterns in both surveys. The highest
score for the web survey is recorded for tax incentives (4.12) and the lowest mean for
tax audit (2.90). Despite some small variations, the overall findings show that corporate
income tax laws are complex, but relatively fair in terms of both tax law and tax rate
structure. More tax incentives are anticipated to the SME sector. The SME relationship
with the IRB is perceived to be somewhat neutral since the implementation of the SAS.
Finally, respondents are leaning towards disagreement or an almost neutral view about
the low chances of tax auditing in the SMEs.
Table 7.9: Tax Attitudes by Survey Method
Tax Aspects Postal Survey Web Survey
Mean Median Mean Median
Tax Complexity 3.56 3.67 3.60 3.67
Tax Rate 3.34 3.33 3.45 3.67
Tax Fairness 3.22 3.20 3.34 3.40
Tax Incentives 4.15 4.00 4.12 5.00
IRB Relationship 3.15 3.00 3.04 3.00
Tax Audit 2.75 3.00 2.90 3.00

207
7.3.2 Comparison with Tax Professionals’ Survey
Perceptions of SME respondents regarding all tax attitudinal aspects differ slightly from
the responding tax professionals. Mean scores in the tax professionals’ survey (see
Table 7.10) are relatively lower, except for fairness of tax law. Despite this trend, the
order of mean scores indicated a similar pattern, with the highest and lowest score
recorded for tax incentives (3.84) and tax audits (2.48) respectively. The lower score in
a few aspects has resulted in different interpretations. SME respondents perceived
corporate income taxation as complex but relatively fair in terms of both tax law and the
tax rate structure. Comparatively, tax professionals perceived corporate taxation to be
less complex, fairer, but neutral with regards to the tax rate structure. Recognising their
knowledge and expertise in the area of taxation, a lower tax complexity level and higher
tax fairness as perceived by the tax professionals is not surprising. A neutral view on the
tax rate structure is comprehensible as tax professionals may not be concerned too much
about the tax rate of their client. Perhaps the amount of tax paid, or more importantly
tax savings, is more relevant to their role as an advisor.
In terms of tax audits, professionals are more inclined towards disagreeing with the
likely low chances of tax auditing in SMEs compared to SME respondents who disagree
but lean slightly to an indifferent view. Tax professionals are regularly in touch with the
IRB officers on behalf of their SME clients. Thus, practically, they might have more
knowledge with regards to tax auditing data from the IRB.
Table 7.10: Tax Attitudes of SMEs and Tax Professionals
Tax Aspects Postal Survey Professional Survey
Mean Median Mean Median
Tax Complexity 3.56 3.67 3.19 3.33
Tax Rate 3.34 3.33 3.06 3.00
Tax Fairness 3.22 3.20 3.32 3.40
Tax Incentives 4.15 4.00 3.84 4.00
IRB Relationship 3.15 3.00 2.94 3.00
Tax Audit 2.75 3.00 2.48 3.00
208
However, acknowledging the role of tax professionals, a few differences in tax
attitudinal aspects are in the expected direction. Thus, perceptions towards all six tax
attitudinal aspects in the current study (i.e. main postal survey) have been reasonably
supported in the survey of tax professionals.
7.3.3 Comparison with Prior Malaysian Studies
As discussed in Chapter Two,177 all prior Malaysian tax compliance studies focussed on
individual taxpayers, with only one study entirely confined to self-employed business
individuals and a few others that included some self-employed business respondents. As
a result, a straightforward comparison of findings is not possible. However, some
comparison to prior studies with some business respondents is valuable in the context of
the current study of SME corporate taxpayers.
The finding of the current study with regards to the complexity of corporate tax laws is
as anticipated. The perceived complexity of the income tax laws has been evident in
Malaysia even before the commencement of the SAS. Hanefah (1996) provided
evidence on the presence of some degree of tax complexity of personal taxpayers in
Malaysia. In 2001, Hanefah, Ariff and Kasipillai (2001) judged that the level of tax
complexity in Malaysia was on an increasing trend following major amendments being
made to existing income tax law or the introduction of a SAS. The difficulties or
uncertainties faced by taxpayers in interpreting and taking advantage of the
amendments are among the indicators of tax complexity (Kasipillai 2005, p. 26). The
current study shows that almost 95 percent of SMEs employed tax professionals in
complying with corporate tax laws in 2006.178 An examination of respondents’ reasons
for using paid external tax professionals shows that almost 81 percent and 66 percent of
them indicated lack of technical knowledge and tax law complexity as their main
reasons for employing tax professionals respectively.179 Thus, the presence of tax
complexity is supported from this perspective as well.
177 See subsection 2.2.2. 178 See Chapter Five, Table 5.15. 179 See Chapter Five, Table 5.21.

209
Regarding tax fairness, the current study shows that respondents’ perceptions towards
tax law are inclined towards fairness, suggesting optimistic perceptions in this regard.
Findings of prior Malaysian studies are somewhat mixed, nonetheless sound and
realistic, considering the assessment system used during the study period. Hanefah
(1996) observed that tax law was perceived to be unfair during the pre-SAS era.
However, recent studies conducted during the SAS regime demonstrated a moderate
view (Che Azmi and Perumal 2008) and a rather neutral view (Sia et al. 2008). From
this trend (i.e. from unfair to a moderate or neutral view), the findings of the current
study (i.e. prone towards fairness) are considered reasonable. Interestingly, both studies
used a similar measurement for fairness, i.e. adapted from the original work of Gerbing
(1988), and subsequently used in a number of international studies (see for example
Christensen, Weihrich and Gerbing 1994; Richardson 2006). Some of the questions
used in the Hanefah study were also adapted from Gerbing. On the other hand, the
measurement used in the current study was adopted from Roberts (1994). This and other
methodological differences between these three prior studies and the current studies
should be noted.
In terms of tax rate structure, the current study shows that respondents are prone
towards fairness. This finding is similar to prior studies (Che Azmi and Perumal 2008;
Sia et al. 2008), both conducted during the SAS regime. One noteworthy aspect is that
the measurement used for tax rate fairness in all three studies in the SAS regime,
including the current study, was adapted from the work of Gerbing (1988). Nonetheless,
other methodological differences between the studies should be noted. A comparison
with the pre-SAS study is not possible, as Hanefah (1996) did not examine tax rate
fairness separately.
The view of SMEs in regard to tax incentives is as expected, as tax incentives will offer
some balance in facing business and financial challenges and constraints. A similar
finding is reported by Abdul Manaf (2004), however in the context of individual land
taxpayers. It is acknowledged that tax authorities worldwide are often willing to provide
incentives to SMEs, particularly to small businesses (Freedman 2003, 2006).
210
Small and Medium Enterprises perceive that their relationship with the IRB has fairly
improved during the SAS. No straightforward comparison is possible as previous
studies focused either on the effectiveness of the tax administration (Hanefah 1996) or
the IRB (Ramasamy et al. 2003) and not on the perceived relationship between taxpayer
and tax officers. Both studies were carried out under the previous OAS system. Hanefah
(1996) demonstrated that the Malaysian tax administration is fairly efficient, and thus
suggested that the SAS be implemented so as to further improve the efficiency of the
Malaysian tax system. However, a study by Ramasamy et al. (2003) failed to provide
evidence of the influence of IRB effectiveness on tax compliance decisions made by
individual business taxpayers. More recently, though, Loo (2006a) included a question
on IRB relationships, but it was merely part of a series of questions that measure
attitudes toward taxation, and thus it was not reported as a specific item. Under the SAS
regime, the current researcher believes that taxpayer perceptions of their relationship
with the IRB is an important aspect in enhancing attitudes towards the effectiveness of
the IRB, which subsequently could lead to higher voluntary compliance.
In terms of the issue of a tax audit arising in the SAS environment, findings of the
current study suggest that respondents are unsure about the probability of their SME
business facing tax auditing. Since the introduction of the SAS, Loo (2006a; 2006b)
was probably the first to consider tax audits as amongst tax structure features that could
determine tax compliance behaviour. Unfortunately, the study does not report the level
of perceptions on tax audits specifically (the effect of tax audit on tax compliance
behaviour is discussed later).180 The low score on tax audits is possibly due to tax audit
information not being publicly available. Currently, there are some details in the annual
report of the IRB on the number of tax audit cases and the corresponding amount
recovered from audit activities. However, the probability of taxpayers being selected for
audit purposes is not publicly available or highlighted. The IRB may want to consider
appropriate measures to change this perception. A further discussion and related
specific recommendations are presented in Chapter Eight.181
180 See subsections 7.6.1 and 7.6.3. See also Chapter Six, Section 6.7. 181 See subsection 8.3.3.
211
7.3.4 Comparison with International Studies
As discussed in Chapter Two,182 a study by Joulfaian (2000) was among the first to
adapt a framework of tax compliance study on individuals into the corporate sector.
The understatement of personal income tax by managers was used as a proxy of
managerial preferences of corporations. On the other hand, the remaining limited
number of international studies on corporate taxation normally assesses the influence of
corporate characteristics, such as business size, tax rates and audit coverage on
corporate tax compliance. The current study is among the first to consider corporate tax
attitudes from a business managerial perspective.
To some extent, it is possible to compare previous international findings on individual
taxpayers, but this approach is not adopted here mainly due to the structural differences
of tax systems between countries (such as assessment system and the tax rate structure)
and/or methodological differences among studies (measurement-related in particular).
The effect of the latter is often emphasised in the tax compliance literature—see
especially Long and Swingen (1991)—and the former is also regarded as an important
concern (Gilligan and Richardson 2005). Gilligan and Richardson were probably the
first to compare perceptions of individuals (regarding tax fairness) in two different tax
jurisdictions, Australia and Hong Kong. A similar instrument for measuring tax fairness
(adopted from Gerbing 1988) was adopted in their study. Their findings indicate that
perceptions of Hong Kong individuals are slightly better than the Australian, with
significant differences being observed, particularly in terms of general fairness and
personal fairness. The fact that a different tax system applies in both countries (i.e. SAS
in Australia and OAS in Hong Kong) was believed to be the main reason for their
findings (Gilligan and Richardson 2005).
Given the above methodological concern, the international comparison of tax attitudinal
aspects is not pursued here, but these attitudes are discussed later within the overall
research objective of the current study, i.e. to establish whether tax attitudes from a
business managerial point of view could be linked to corporate tax behaviour.
182 See subsection 2.2.1.

212
7.4 COMPLIANCE BEHAVIOUR
7.4.1 Comparison with Web Survey
Mean scores of the respective tax behaviour are slightly higher in the web survey, as
shown in Table 7.11. A similar trend is observed for tax attitudes in the web survey as
well (see Table 7.9). The likely non-compliance behaviour, measured at both the non-
compliance type or at the SME level, broadly indicates a similar view, with one
exception. Respondents in the web survey are noticeably indifferent with regards to
overstatement of deductions.
Table 7.11: Tax Behaviour by Survey Method
Likely Tax Behaviour Postal Survey Web Survey
Mean Median Mean Median
Understatement of Income 2.28 2.00 2.48 3.00
Overstatement of Deductions 2.76 3.00 3.06 3.00
Both Non-compliance a 2.52 2.50 2.78 3.00 a This refers to the combined category of both understatement of income and overstatement of deductions.
7.4.2 Comparison with Tax Professionals’ Survey
Tax professionals have relatively better compliance behaviour than SME respondents,
as shown by lower mean scores in the tax professionals’ survey, as shown in Table 7.12.
The compliance behaviour among tax professionals is rather obvious in relation to
overstatement of deductions.
Table 7.12: Tax Behaviour of SMEs and Tax Professionals
Likely Tax Behaviour Postal Survey Professional Survey
Mean Median Mean Median
Understatement of Income 2.28 2.00 2.10 2.00
Overstatement of Deductions 2.76 3.00 2.19 2.00
Both Non-compliance a 2.52 2.50 2.14 2.00 a This refers to the combined category of both understatement of income and overstatement of deductions.
213
Overall, the above finding is practically appropriate as tax professionals are expected to
provide tax advice with reasonable care. They are subjected to a penal structure in the
case of assisting their tax clients in the understatement of tax liability. In such cases, tax
professionals may be liable to a fine of between RM2,000 and RM20,000, or to
imprisonment of up to three years, or to both [Section 114 (1A)].
7.4.3 Comparison with Prior Malaysian Studies
The current study shows that the respondents are inclining towards tax compliance, in
terms of income reporting, but are likely to register between compliant and neutral
behaviour for tax deductions. These findings are consistent with prior studies in
Malaysia, which largely indicated compliance behaviour in most tax situations
(Kasipillai, Aripin and Amran 2003; Kasipillai, Mat-Udin and Zainol-Arifin 2003;
Kasipillai and Abdul-Jabbar 2006) and a neutral view in some other cases (Kasipillai
and Abdul-Jabbar 2006). It must be emphasised that a number of studies have examined
tax compliance behaviour and some determinants of individual taxpayers in
Malaysia.183 However, most studies have tended to focus their discussion on the
determinants of compliance behaviour (see for example Ramasamy et al. 2003; Loo
2006a). Regrettably, only a few studies reported their findings on both the level of
compliance and its determinants (Kasipillai, Aripin and Amran 2003; Kasipillai, Mat-
Udin and Zainol-Arifin 2003; Kasipillai and Abdul-Jabbar 2006). Even a study by Loo
(2006a) in the SAS regime did not report the level of tax compliance separately.
More recently, despite the fact that a study by Sia et al. (2008) relates to tax
compliance, tax compliance behaviour is not measured. Instead, they assumed that those
who are subjected to tax audits were non-compliers, and non-audited taxpayers were
compliers. As such, a comparison is only possible with those former three studies (i.e.
studies by Kasipillai, Aripin and Amran 2003; Kasipillai, Mat-Udin and Zainol-Arifin
2003; Kasipillai and Abdul-Jabbar 2006), which were carried out prior to SAS, but are
subject to some methodological differences within the studies; for example, the nature
of tax scenarios, their measurement, and the amount of consideration used are different.
183 See Chapter Two, subsection 2.2.2.

214
7.4.4 Comparison with International Studies
Similar to tax attitudes,184 comparing the level of tax compliance among countries
would be misleading. All prior studies on US corporations measured ‘actual’ non-
compliance by employing the IRS audit data, especially the TCMP.185 On the other
hand, the current study employs the survey approach to hypothetical tax scenarios,186
which merely measures ‘possible’ non-compliance behaviour of corporate SMEs from a
managerial perspective and not the actual.187 Nonetheless, the determinants of corporate
tax compliance, both in Malaysia and internationally, are useful for tax policy
consideration and are thus discussed latter.188
7.5 THE RELATIONSHIP AMONG TAX ATTITUDES, BEHAVIOUR AND
COMPLIANCE COSTS
A comparative analysis of the relationships among tax attitudes, tax behaviour and
compliance costs mainly in the SMEs surveys and some relevant findings of the tax
professionals’ survey are presented in this section. The survey of tax professionals
concerned external compliance costs only, thus the relationship between part of the
compliance costs and tax attitudes or tax behaviour is not analysed further. Out of six
attitudinal items, the perceived IRB relationship is the only aspect that was found to
have a very weak direct association with compliance costs in the postal survey, as
shown in Table 7.13. The current study also fails to confirm the directions of the
relationships as the findings are mostly contradicted among both SME surveys. Taken
as a whole, the findings of both the postal and web surveys did not signify a statistical
association between tax attitudes and compliance costs. Similarly, compliance costs are
also not statistically associated with tax behaviours in both surveys.189
184 See subsection 7.3.4. 185 See Chapter Two, Section 2.2.1. 186 See Chapter Four, subsection 4.4.3. 187 See Chapter Eight, Section 8.4, for details on this and other limitations. 188 See subsections 7.6.3. and 7.6.4 189 See Chapter Six, Tables 6.12 and 6.22.

215
Table 7.13: Tax Attitudes and Compliance Costs: Correlation Analysis
Tax Attitudinal Aspects Postal Survey Web Survey
Complexity - -
Fairness - -
Rate - -
Incentives - -
Audit - -
IRB Relationship √ a (+) - a Significant at the five percent level. Positive (+) sign denotes a direct relationship.
As for the relationship between tax attitudes and tax behaviour, Table 7.14 shows
similar survey findings with regards to tax audit and tax fairness. A tax audit is the only
aspect that was found to be positively associated with both types of tax behaviour in
both forms of surveys and, more importantly, in similar directions. On the other hand,
tax fairness has no correlation to tax behaviours. Further, tax complexity is also largely
associated with tax behaviour, with one exception in the web survey for the
overstatement of deductions.
Table 7.14: Tax Attitudes and Tax Behaviour: Correlation Analysis
Tax Attitudes Understatement of Income Overstatement of Deductions
Postal Survey Web survey Postal Survey Web survey
Complexity √ b (+) √ b (-) √ a (+) -
Fairness - - - -
Rate - √ b (+) - √ b (+)
Incentives - - - √ b (+)
Audit √ b (+) √ a (+) √ a (+) √ b (+)
IRB relationship - - - - a Significant at the one percent level. b Significant at the five percent level. Positive (+) or negative (-) signs denote a direct or indirect significant relationship respectively.
216
Overall, findings of the main postal survey are generally supported by the web survey,
although some variation is noted in the web survey. However, from the perspective of
tax professionals, all six tax attitudinal aspects are found to have no statistical
relationship with likely tax behaviour.190 It must be emphasised that the survey of tax
professionals had 31 responses only. This finding should be treated as tentative subject
to a further study. Regarding prior studies, the combined effect of a number of variables
(i.e. multivariate analysis) is essential, and it is often emphasised in previous studies
that just the relationship among two variables (i.e. bivariate relationship) is insufficient.
Comparative findings and discussion with regards to multivariate analysis is presented
in Section 7.6 below.
7.6 DETERMINANTS OF COMPLIANCE BEHAVIOUR
7.6.1 Comparison with Web Survey
The importance of each independent variable in the respective three models, in both
surveys, is presented in Table 7.15. The tax audit is the only variable that constantly
influences the likely tax behaviour of SME respondents in all three models in both
postal and web surveys. Another five variables, namely business size, estimated tax
level, amount of compliance costs, perceived fairness and perceived IRB relationship
consistently indicated otherwise (i.e. non-determinants). In most cases, tax complexity
also influences tax complying behaviour. Despite the above similarities, a few
inconsistent findings are observed between the postal and web surveys. Business length
and business sector (i.e. construction) are also found to be a significant determinant in
some models in the postal survey. On the other hand, in the web survey the tax rate and
tax incentives influenced tax behaviour in all three models and two of the models
respectively.
190 See Appendix T, Table T.2.

217
Table 7.15: Significance of Independent Variables in the Regression Models
Likely Tax Behaviour
Understatement
of Income
Overstatement
of Deductions
Both
Non-compliance a
Survey Type Postal Web Postal Web Postal Web
Variables:
Audit √ d √ b √ b √ c √ b √ b
Complexity √ c √ b √ b - √ b √ c
Rate - √ c - √ c - √ c
Length √ d - - - √ d -
Sector: Construction - - √ c - √ d -
Incentives - - - √ c - √ c
Size - - - - - -
Tax - - - - - -
Compliance Costs - - - - - -
Fairness - - - - - -
IRB Relationship - - - - - - a This refers to the combined category of both understatement of income and overstatement of deductions. b Significant at the one percent level. c Significant at the five percent level. d Significant at the ten percent level.
Overall, the findings of the web survey, to a large extent, add consistency to the postal
survey. The current study provides evidence that two aspects (tax audits and tax
complexity) have an influence on tax complying behaviour, that five variables (business
size, tax level, compliance costs, fairness and IRB relationship) do not, and that the
effect of the remaining four variables (length, sector, rate and incentives) is
unfortunately indeterminate.

218
7.6.2 Comparison with Tax Professionals’ Survey
From the tax professionals’ perspective, none of the tax attitudinal aspects influence
their tax compliance behaviour. The fact that the survey of tax professionals has just 31
responses, and the regression analysis considered tax attitudinal items only, limits the
value of these findings.
7.6.3 Comparison with Prior Malaysian Studies
The current study is the first to consider corporate tax compliance behaviour in
Malaysia; thus, this section discusses relevant current findings with previous studies on
individuals that include a number of business respondents.191 Although findings of a
postal survey are a central concern in this study, it is useful to consider the determinants
of tax behaviour in both postal and web surveys. Overall findings of both surveys have
shown that two factors, i.e. tax complexity and tax audit, consistently influence likely
tax behaviour; five factors, i.e. business size, tax level, compliance costs, tax fairness
and the perceived IRB relationship, do not; and the remaining four factors, i.e. business
length, business sector, tax rate and tax incentives, vary between the surveys and types
of non-compliance.192
A straightforward comparison of the current study to previous Malaysian studies is of
limited use. This is due to the differences in the assessment system (either OAS or SAS)
and/or the methodology in particular, including factors that have been subjected to
examination. Even within the previous studies, only four equivalent factors, i.e. tax
knowledge, tax fairness, compliance of other taxpayers’ and the perceived IRB
administration have been examined in at least in two studies, with tax fairness often
being investigated, as shown in Table 7.16. The current study replaces individual
demographics with corporate SME characteristics. Compliance costs estimates and tax
incentives are the new two variables, with the former investigated for the first time,
while the latter has been employed earlier in a Malaysian land tax study by Abdul
Manaf (2004).
191 See Chapter Two, subsection 2.2.2. For a list of studies see Table 2.2. 192 See subsection 7.6.1.
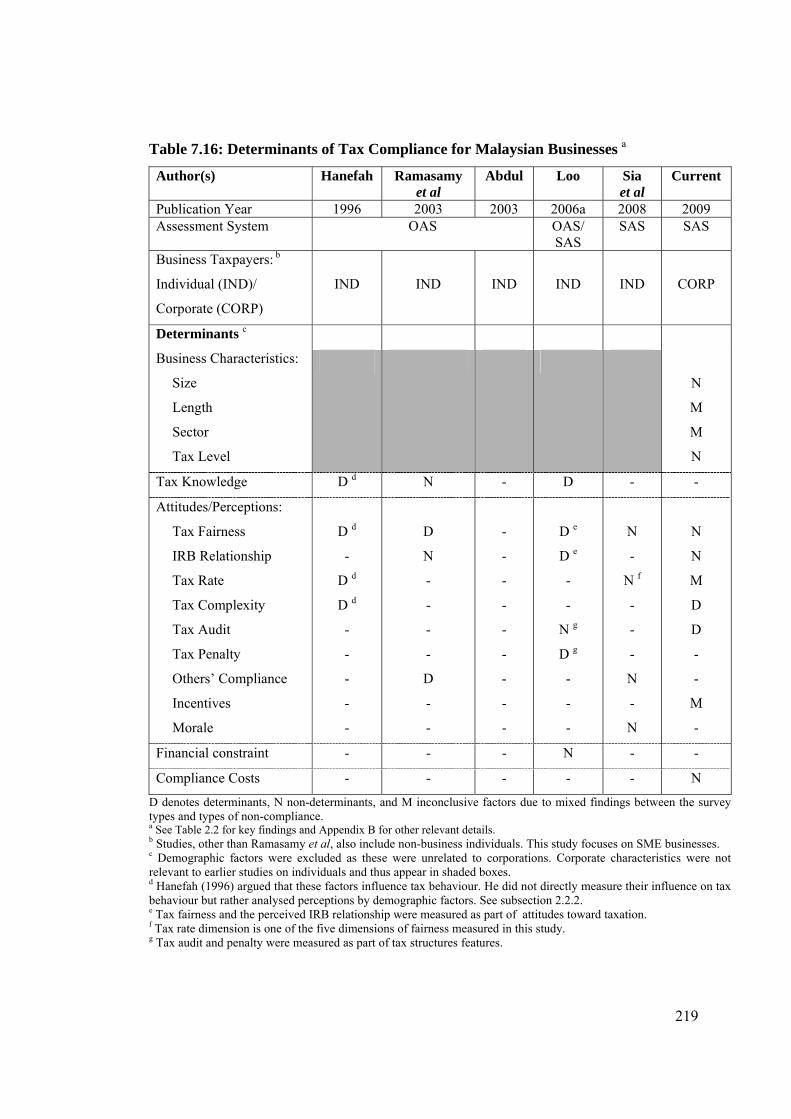
219
Table 7.16: Determinants of Tax Compliance for Malaysian Businesses a
Author(s)
Hanefah Ramasamy et al
Abdul
Loo
Sia et al
Current
Publication Year 1996 2003 2003 2006a 2008 2009 Assessment System OAS OAS/
SAS SAS SAS
Business Taxpayers: b
Individual (IND)/
Corporate (CORP)
IND
IND
IND
IND
IND
CORP
Determinants c
Business Characteristics:
Size
Length
Sector
Tax Level
N
M
M
N
Tax Knowledge D d N - D - -
Attitudes/Perceptions:
Tax Fairness
IRB Relationship
Tax Rate
Tax Complexity
Tax Audit
Tax Penalty
Others’ Compliance
Incentives
Morale
D d
-
D d
D d
-
-
-
-
-
D
N
-
-
-
-
D
-
-
-
-
-
-
-
-
-
-
-
D e
D e
-
-
N g
D g
-
-
-
N
-
N f
-
-
-
N
-
N
N
N
M
D
D
-
-
M
-
Financial constraint - - - N - -
Compliance Costs - - - - - N
D denotes determinants, N non-determinants, and M inconclusive factors due to mixed findings between the survey types and types of non-compliance. a See Table 2.2 for key findings and Appendix B for other relevant details. b Studies, other than Ramasamy et al, also include non-business individuals. This study focuses on SME businesses. c Demographic factors were excluded as these were unrelated to corporations. Corporate characteristics were not relevant to earlier studies on individuals and thus appear in shaded boxes. d Hanefah (1996) argued that these factors influence tax behaviour. He did not directly measure their influence on tax behaviour but rather analysed perceptions by demographic factors. See subsection 2.2.2. e Tax fairness and the perceived IRB relationship were measured as part of attitudes toward taxation. f Tax rate dimension is one of the five dimensions of fairness measured in this study. g Tax audit and penalty were measured as part of tax structures features.

220
Out of 11 variables examined in the current corporate study, only five are comparable to
previous studies, i.e. tax fairness, tax complexity, the tax rate, tax audits, and the
perceived IRB relationship. A comparative analysis indicates consistent findings
regarding tax complexity, contrary results concerning tax audits, and mixed results for
the remaining three factors, i.e. tax fairness, the tax rate and the IRB relationship.
Similar to personal income taxation (Hanefah 1996), the current findings indicate that
complexity is also an important concern within corporate tax compliance. A
contradictory finding for tax audits is probably justified, as the concept of a tax audit is
rather new to individual taxpayers during the study period, but not to corporate
taxpayers.193
The findings regarding tax fairness contradict three earlier studies (Hanefah 1996;
Ramasamy et al. 2003; Loo 2006a), but are consistent with the most recent study (Sia et
al. 2008). Apart from fundamental differences between corporate and individual
taxation, and also other methodological differences, this inconsistent result is probably
linked to the type of tax assessment system. Two of the three former studies were
conducted during the previous OAS regime, with the remaining study during the
transitional period. On the other hand, studies by Sia et al. (2008) and the current
researcher were conducted under the SAS regime.
On the tax rate structure, inconclusive findings are not surprising, for this seems to
support previous contradictory findings on individuals (Hanefah 1996; compared to
Loo 2006a). The differences in the tax rate structure between corporate and individual
taxation may also have contributed to this outcome. Findings about the perceived IRB
relationship are similar to Ramasamy et al. (2003) in the pre-SAS study, but contradict
Loo’s (2006a) in the conversion period. However, the fact that the perceived IRB
relationship forms part of the measurement of overall tax attitudes in the Loo (2006a)
193 The concept of a tax audit is an important aspect in the SAS implementation. The SAS was introduced first to companies in 2001 and subsequently to individuals in 2005 (tax year 2004).
221
study must be noted. It is also possible that perceptions on the tax rate structure depend
on specific types of non-compliance.
The current study, in general, provides evidence on the effect of the above five
factors—complexity, audits, fairness, the tax rate structure, and the IRB relationship—
in the context of corporation taxation, SMEs in particular. Some inconsistency observed
in the current study is not surprising as it is often evident in the context of individual
taxpayers internationally (Jackson and Milliron 1986; Richardson and Sawyer 2001)
and even within Malaysian studies. For example, tax knowledge is found to be a
significant factor in two previous studies (Hanefah 1996; Loo 2006a), but otherwise in
the Ramasamy et al. (2003) study. This demonstrates the importance of a few key
determinants of tax compliance in the context of Malaysian corporate SMEs. Despite
some basic differences between individual and corporate taxation, it is fully
acknowledged that methodological differences, in particular, should always be an
important concern in evaluating tax compliance studies.
7.6.4 Comparison with International Studies
As discussed in Chapter Two, all five corporate tax compliance studies were conducted
in the US,194 and more importantly in a developed economy. The current Malaysian
study is probably the first in developing countries. Despite this and other key tax
structural and methodological differences, discussion regarding determinants of
corporate tax compliance internationally is valuable in policy considerations. For this
purpose, similar to a comparison of Malaysian studies,195 the overall findings of both
postal and web surveys are considered.
The current study indicates that the managerial perceptions about tax complexity and
tax audits influence corporate tax compliance. Unfortunately, the former was not
considered empirically (at least as a determinant of corporate compliance) in the prior
studies and the latter was measured in terms of audit rates and not perceptions. Despite
194 Subsection 2.2.1. 195 Subsection 7.6.3.
222
this, some evidence of the possible association between complexity and corporate tax
compliance is discussed below.
In the context of individuals, including businesses, the negative impact of complexity
upon tax compliance is commonly acknowledged (Cuccia and Carnes 2001; McKerchar
2002a). Several studies on corporations have investigated the problem areas of tax
compliance (Erard 1997a, 1997b) and their specific sources of complexity (Slemrod and
Blumenthal 1996; Slemrod and Venkatesh 2002). The Canadian studies, on both SMEs
(Erard 1997b) and large (Erard 1997a) corporations, found that tax complexity is among
the frequently cited compliance problems by businesses of all sizes (large and SMEs).
The US study on large and medium corporations (Slemrod and Blumenthal 1996, p.
428; Slemrod and Venkatesh 2002, p. 30) found that the depreciation rules and the
alternative minimum tax provisions were the most frequently cited areas that increase
tax complexity and the compliance burden. The impact of tax complexity is also
believed to be among the major problems of small businesses in the US (Ashby 2000;
Slemrod 2004a).
Regarding the remaining ten variables, only two factors examined in the current
Malaysian study are comparable to the previous US studies, i.e. business size and
business sector, as shown in Table 7.17. A number of other business features, such as
public/private, national/multinational, domestic/foreign ownership, are likely to be
relevant to large corporations in Malaysia but not to corporate SMEs. Business size is
not an influencing factor in the current study. This result is similar to the earliest study
on corporations (Rice 1992), but contradicts two later studies (Joulfaian 2000; Hanlon,
Mills and Slemrod 2005). Focusing on a specific group of business taxpayers and on
differences in the proxies used to measure business size may contribute to this variation.

223
Table 7.17: Determinants of Corporate Tax Compliance Internationally a
Author(s) Rice
Kamdar
Mills
Joulfaian
Hanlon Mills & Slemrod
Current
Publication year 1992 1997 1998 2000 2005 2009
Country US Malaysia
Determinants:
Business Characteristics:
Size b
Profit/Income
Marginal tax rate
Tax level
Foreign ownership
Industry/Sector
Public/Private
Multi-Nationality
Length of Business
N
D
D
-
-
-
-
-
-
-
D
-
-
-
-
-
-
-
-
-
-
-
-
-
-
-
-
D
D
D
-
N
-
-
-
-
D
-
-
-
D
D
D
D
-
N
-
-
N
- c
M
- c
- c
M
Audit Rate - D - D - -
Public Disclosure D - - - - -
Book-tax difference - - D - - -
Managerial Preferences:
Non-compliance manager
Managerial Attitudes:
Complexity
Fairness
Tax Rate
Audit
Relationship tax authority
Incentives
-
-
-
-
-
-
-
-
-
-
-
-
-
-
-
-
-
-
-
-
-
D
-
-
-
-
-
-
-
-
-
-
-
-
-
-
D
N
M
D
N
M
Compliance Costs - - - - - N
D denotes determinants, N non-determinants, and M inconclusive factors due to mixed findings between the survey types and types of non-compliance. a See Table 2.1 for key findings and the full sources. b Various size proxies were employed; assets and/or sales in the US and three alternatives, i.e. turnover, staff number, and a combination of both, in the Malaysian study. c These factors are not likely to be relevant to corporate SMEs in Malaysia.

224
A study by Rice (1992) was confined to medium-sized corporations, i.e. assets between
US$1 million and US$10 million; Joulfaian (2000) covers both small and medium-sized
corporations, i.e. assets of US$10 million or less; on the other hand, Hanlon, Mills and
Slemrod (2005) focus on large and medium-sized corporations, i.e. assets between
US$10 million and over US$5 billion.196 For a size proxy, Rice (1992) considered total
value of assets; Joulfaian (2000) employed annual sales level; Hanlon, Mills and
Slemrod (2005) considered both assets and sales measures; and the current study
examined this in terms of three alternatives, i.e. turnover, staff number, and a
combination of both criteria, as established by the NSDC.
Regarding business sectors, the current findings provide some evidence of the influence
of business sectors on overstatement of deductions, but not of the understatement of
income or the overall compliance at the firm level. These findings, especially the effect
of the business sector on the overall tax compliance (firm level) contradict earlier
findings by Hanlon, Mills and Slemrod (2005). Apart from fundamental differences
between these studies and the size of corporations, differences in the classification of
business sector between the Malaysian and the US study could be a reason. The current
Malaysian study categorised businesses into four main sectors compared to eight sectors
in the US study.
7.7 CHAPTER SUMMARY
This chapter has shown similar estimates of compliance costs of RM9,300 per SME
company in both postal and web surveys. The computational-planning costs breakdown
is also similar, but a slight difference has been observed in terms of the internal-external
costs proportion. However, overall, the current 2006 estimates have shown that the
income tax compliance costs of SMEs have decreased significantly compared to earlier
1999 estimates during the pre-SAS regime. One noteworthy aspect is that the regressive
nature of compliance costs on small businesses remains an important area in tax policy
196 US$1 = RM3.52 (1 July 2009, Bank Negara Malaysia).

225
considerations, as evident in both pre-SAS (1999 estimates) and post-SAS (the current
2006 estimates) surveys. As for international comparisons, the Malaysian corporate
SME compliance costs of nine percent and 0.2 percent relative to tax revenue and GDP
respectively are within the international range in both terms.
In terms of tax attitudes and the likely compliance behaviour, overall, both the primary
SME postal and web surveys demonstrated similar perceptions, while perceptions of tax
professionals are slightly better, as would be expected. Findings regarding determinants
of tax non-compliance are also comparable in both surveys, with the following overall
patterns: tax complexity and tax audits as determinants; business size, tax level,
compliance costs, tax fairness and the perceived IRB relationship as non-determinants;
and, the length in business, sector, the tax rate and tax incentives as inconclusive.
However, compared to earlier Malaysian studies on individuals, the current corporate
SME study provides support for the influence of tax complexity, indicating to some
extent conflicting results concerning tax audits, and demonstrating mixed results in
terms of perceptions of tax fairness, the tax rate and the IRB relationship. In terms of
international comparisons, the effect of business size is uncertain, as the current
findings are similar to Rice (1992), but contradict studies by Joulfaian (2000) and
Hanlon, Mills and Slemrod (2005). On the other hand, this thesis contradicts the study
by Hanlon, Mills and Slemrod (2005) that finds the business sector as a determinant of
tax compliance. Overall, the current study offers preliminary evidence in the context of
Malaysian corporations, SMEs in particular. Conclusions and policy recommendations
arising from this study, together with major limitations, are presented in Chapter Eight.

226
CHAPTER EIGHT
CONCLUSIONS AND POLICY RECOMMENDATIONS
8.1 INTRODUCTION
This chapter presents conclusions on the overall corporate SME income tax compliance
costs estimates and corporate SME business managerial perceptions about tax attitudes
and likely tax compliance behaviour. The overall objective of this study is to examine
the determinants of non-compliance behaviour of corporate SMEs, with particular
emphasis on income tax compliance costs under the SAS regime. For this purpose, a
review of the key findings is discussed by reference to three research questions.197
Policy recommendations arising from the compliance costs estimates, in particular, and
other key findings, are then presented. Major limitations of this research are discussed
next. This is followed by suggestions for future research. The final section presents the
author’s concluding remarks on this thesis.
8.2 THE SUMMARY OF KEY FINDINGS
8.2.1 Compliance Costs Estimates
The first research question of this study is to estimate the corporate income tax
compliance costs for Malaysian SMEs under the SAS regime. This study has shown that
the average income tax compliance costs are RM9,295 per SME company, amounting
to RM1,084 million in aggregate for the tax year 2006. The ratios of internal-external
costs and computational-planning costs are 59:41 percent and 74:26 percent of
compliance costs respectively. In terms of costs distribution, measured as a percentage
of business turnover, the usual regressive nature of compliance costs for Malaysian
SMEs has been confirmed under the SAS regime. The compliance costs percentage for
SMEs in the lowest turnover level is as much as six times, 20 times and 82 times higher
197 See Chapter One, Section 1.3.
227
than the second, third and fourth levels respectively, and over 43 times higher than the
overall SME compliance costs distribution of 0.19 percent.
The average 2006 estimate of RM9,295 per company shows that compliance costs of
SME companies are around 58 percent lower compared to the 1999 pre-SAS figure of
RM21,964. The income tax simplification measures taken by the IRB, a period of
relative stability in both the economic climate and tax system for the past six years or
so, and the likely removal of high start-up compliance costs are among major possible
reasons for the significant decline in the compliance costs in this study.
Notwithstanding the above, the ratios of both external to internal costs and
computational to planning costs increased, as would be expected under a SAS regime.
Despite a significant reduction in compliance costs, compliance costs expressed as a
percentage of tax revenue indicate a slight increase from eight percent in 1999 to nine
percent in 2006. Thus, compliance costs relative to tax revenue before and after the SAS
are considered about equivalent. In terms of GDP, income tax compliance costs for
corporate SMEs are estimated to be around 0.2 percent in 2006. Unfortunately,
comparison is not possible with prior studies as the current study is the first to estimate
aggregate compliance costs in Malaysia, and probably even in Asia as whole.
For international comparison, the current estimates of tax compliance costs of around
nine percent to tax revenue and nearly 0.2 percent to GDP are within the international
range, i.e. two to 10 percent of tax revenue and up to 2.5 percent of GDP respectively as
pointed out by Evans (2003b, p. 71). Within the Asian countries, having acknowledged
the differences in the targeted company size and the other usual methodological and
structural concerns, the fact that the Malaysian SME cost-ratio to tax revenue is high
compared to Hong Kong and Singapore, and within the Indian estimates, is not
surprising. This is because both Hong Kong and Singapore continue to adopt the OAS,
while India has moved to the SAS. But the fact that Malaysian costs estimates (relative
to tax revenue) were previously higher, even in the pre-SAS regime, should be
recognised. However, in terms of GDP, the compliance costs of Malaysian SME
228
companies of around 0.2 percent is considered low compared to the overall international
ratio of less than two percent. As an overall comparison, the 2006 Malaysian corporate
SME compliance costs, expressed in GDP terms, are high compared to the 1986/87 UK
estimates, but the lowest when compared to ratios in Australia, Slovenia, and Croatia.
Tax compliance costs relative to GDP for other countries, including Asian and
developed countries, i.e. Canada, and the US, unfortunately are not available.
Two forms of offsetting benefits of tax compliance are recognised for Malaysian
corporate SMEs, i.e. tax deductibility and cash flow benefits, but the availability of data
only allows estimation of the former. The estimated value of tax deductibility is almost
RM1,700 per SME company or 18 percent of tax compliance costs, amounting to
RM196 million for the corporate SMEs in 2006. Taking into account this benefit, the
average net compliance costs per SME company are almost RM7,600, amounting to
RM888 million in aggregate. A comparison between net compliance costs estimates
(RM7,600) and the compensation amount that is expected by the respondents
(RM7,300) demonstrates comparable results that add reliability to the estimates.
Further, an analysis of a separate web survey also confirms the consistency of the
estimates made in the primary postal survey.
Overall, the current estimates demonstrate that compliance costs at the SME level have
decreased substantially in current value terms, are identical in relation to tax revenue,
and the effect of fixed costs remains an important concern.
8.2.2 The Relationship between Compliance Costs and Compliance Behaviour
The second research question addresses the extent to which tax compliance costs
influence the likely compliance behaviour of corporate SMEs. Compliance costs are
estimated to address research question one. As for compliance behaviour, this study, as
measured by two independent hypothetical tax scenarios from a business managerial
perspective, shows that SME companies are largely compliant towards both income
reporting and tax deductions behaviour, either measured for the full amount of
RM10,000 or part thereof.
229
For the full amount of RM10,000, relatively more SME companies (59 percent) are
compliant towards reporting behaviour than to the correctness of their deductions (41
percent). This finding suggests that non-compliance through overstatement of
deductions probably needs further attention in the Malaysian SME context, particularly
in selecting companies for a tax audit. On the contrary, for partial consideration, more
respondents are compliant in terms of deductibility of expenses (42 percent) as
compared to income reporting (38 percent). The outcome is not surprising given that the
much higher risk of detection is possibly recognised by the respondents in case of
partial non-compliance.
Theoretically, tax compliance costs are expected to influence the complying behaviour
of taxpayers. The findings of this study show that the relationship is in the expected
direction, i.e. higher compliance costs may lead to non-compliance. This is applicable
either to understatement of income, overstatement of deductions, or the combined non-
compliance at the SME level. Unfortunately, both the mean comparison and the
correlation analysis failed to indicate a statistically significant relationship between tax
compliance costs and the likely compliance behaviour of SMEs, and more importantly,
regardless of the amount involved. The same conclusion is drawn from the separate
analysis in the web survey. The effect of compliance costs on tax compliance, taken
together with other factors, is discussed in the next section.198
A lack of a relationship between compliance costs and the likely compliance behaviour
is possibly due to the fact that the current study focuses on homogeneous business size.
In corporate tax compliance studies, significant differences in tax behaviour were
evident when researchers covered all business sizes (Hanlon, Mills and Slemrod 2005),
and contrary findings were identified when a specific business size was targeted (Rice
1992). From this perspective, it is possible that there may be a significant association
between compliance costs and compliance behaviour among different business sizes i.e.
small, medium and large.
198 Subsection 8.2.3.
230
8.2.3 Determinants of Tax Compliance Behaviour
The third research question examines the influence of tax compliance costs on
compliance behaviour, taken together with corporate SME characteristics and business
managerial attitudes regarding corporate taxation. Eleven determinants are examined in
this study, with business characteristics comprising four factors—size, sector, length in
business and estimated tax amount, and managerial perceptions—obtained for six tax
attitudinal aspects, namely complexity, fairness, rate structure, incentives, audits and the
IRB relationship. For business size, three alternative measures, i.e. turnover level,
number of staff employed and the combined criteria under the NSDC definition are
used, with the turnover criteria as the primary size measure. Three main regression
analyses were carried out separately for each of the three compliance behaviour, i.e.
understatement of income (Model 1), overstatement of deductions (Model 2) and the
combined non-compliance (Model 3), with further regressions undertaken by using the
other two alternative size proxies for all three dependent variables.
Overall, the current study provides evidence that tax complexity and tax audits
influence the likely tax compliance behaviour of SMEs, with the possibility of non-
compliance increasing as the perceived tax complexity increases and the probability of
tax audit decreases. Five factors, i.e. business size, tax level, fairness, IRB relationship,
and more importantly, compliance costs, have no effect on tax behaviour. The effect of
the remaining four variables (length, sector, rate and incentives) is inconclusive due to
mixed findings between types of compliance and surveys. It is also evident that non-
compliance in terms of income reporting (or tax deductions) possibly affects the
accuracy of the deductions (or income reporting).
Findings in the context of individual businesses are considered for comparative
purposes as there is no previous study on corporate businesses. For this purpose, only
five out of eleven factors are comparable to prior studies, i.e. tax fairness, tax
complexity, the tax rate, tax audits, and the perceived IRB relationship. Overall, the
effect of tax complexity is supported fully; the contradictory effect of a tax audits is
fairly supported; and there are mixed effects for the remaining three factors, i.e. tax
231
fairness, the tax rate, and the IRB relationship. The mixed effects are, to some extent,
sensible as contradictory findings are often evident in tax compliance research
internationally (Jackson and Milliron 1986; Richardson and Sawyer 2001).
For international comparison of compliance research, analysis within the limited
number of corporate tax compliance studies suggests that only two factors examined in
the current study are equivalent to the previous US studies, i.e. business size and
business sector. In the Malaysian corporate SME context, the former is found not to
influence tax behaviour, and the effect of the latter is somewhat mixed. The finding
regarding business size is similar to the first study on corporate tax compliance (Rice
1992), but is contradicted by two recent studies (Joulfaian 2000; Hanlon, Mills and
Slemrod 2005). Targeting different company sizes and, more importantly, adopting
different size measures may partly explain these diverse findings. As for business
sectors, differences in the classification of sectors between Malaysia and the US could
be among possible justifications. Above all, it is recognised that the fundamental
differences in the tax system and methodology may have contributed to this trend.
Notwithstanding this, the current study offers preliminary evidence in the context of
corporate Malaysian SMEs. Further research in this area of corporate tax compliance is
needed, both in Malaysia and internationally.
8.2.4 Other Key Findings
This study also assessed the business managerial attitudes about corporate SME
taxation regarding complexity, fairness, rate structure, audits, incentives and the IRB
under the SAS regime. Corporate taxation for SMEs is perceived to be complex and fair
both in terms of tax laws and the tax rate structure. Corporate SMEs are expecting more
tax incentives, are uncertain about the likelihood of audit, and consider that their
relationship with the IRB improved to some extent during the SAS regime.
In terms of the relationship between tax attitudes and compliance, the correlation
analysis shows that only complexity of the corporate tax law and probability of a tax
audit are statistically connected to both types of non-compliance, either measured
232
separately or jointly. This suggests that the possibility of non-compliance increases as
the perceived level of tax complexity increases and the chances of a tax audit decreases.
Regarding compliance costs, only the perceived IRB relationship indicates a significant
association. Unfortunately, the direction of the relationship is not conclusive due to
contradictory findings in the postal and web surveys.
8.3 MAJOR POLICY RECOMMENDATIONS
8.3.1 Institutional and Policy Recognition of Tax Compliance Costs
The importance of SMEs has been evident in Malaysia, particularly over the last five
years, and this has led to the establishment of the NSDC in 2004 and, more recently, the
transformation of SMIDEC into the SME Corp.199 Unfortunately, the issue of
compliance burden, particularly the tax burden surrounding SMEs and even large
businesses in Malaysia, is yet to be recognised fully or explicitly.
On 7 February 2007, the Special Taskforce to Facilitate Business (STFB, or known as
PEMUDAH) was established to address the issue of bureaucracy in business-
government dealings, including taxation.200 The aim of the STFB is to improve
Malaysia’s competitive position internationally (The Special Taskforce to Facilitate
Business 2008), and this demonstrates the early recognition of business regulatory
concerns at the national level. In terms of its membership, the STFB comprises 23
members from both the private and public sectors, including the chief executive officer
of SMIDEC,201 but the absence of SME business involvement is noteworthy.
In earlier developments specifically applying to taxation, the establishment of the Tax
Review Panel, or TRP, (Ministry of Finance Malaysia 2004) seems to have been mainly
199 See Chapter One, Footnote 6. 200 Focus Group on Paying Taxes is one of the five focus groups (2007; six in 2008) under the Working Group on Efficiency Issues (The Special Taskforce to Facilitate Business 2008, 2009). The membership of this focus group, unfortunately, is not available. 201 The membership of the Taskforce and other details, are available at http://www.pemudah.gov.my.
233
directed towards the proposed GST,202 with the absence of SME participation being
notable. The IRB’s recognition of the extent of the small business compliance burden
may be considered rather limited, especially at the time of the initial stages of the
current study (mid-2006). For example, the Small Traders’ Support Service Unit
provides assistance and advice on taxation issues to small traders that are not
represented by tax professionals, i.e. the self-employed. On the other hand, a number of
preferential tax treatments have been introduced to corporate SMEs, including dual tax
rates and, more recently, the exclusion of advance tax estimation provisions during the
first two years from business commencement.203
One of the IRB objectives is to collect taxes without imposing an excessive burden
(compliance costs) on the public with a minimal cost to the government. The average
tax administrative costs (known as management costs in Malaysia) per year just exceed
one percent of the direct tax collection, as shown in Table 8.1. This ratio is comparable
to those of Australia and the UK, but more than two times higher than the US (OECD
2004, p. 65). The ratios need to be interpreted with caution due to significant
differences between countries, for example, differences in tax rates, tax structure and
the nature of taxes administered by tax authorities. As for private sector costs, such
yearly estimates of tax compliance costs are practically impossible. No country
estimates yearly tax compliance costs, but the practice of tax authorities elsewhere
(such as in Australia, the UK, the US) indicates that they normally require a Tax Impact
Statement prior to any major tax changes.
202 Since the postponement of the proposed GST, unfortunately the current status and progress of TRP is not available publicly (Singh 2007). 203 See Chapter Three, subsection 3.2.3.
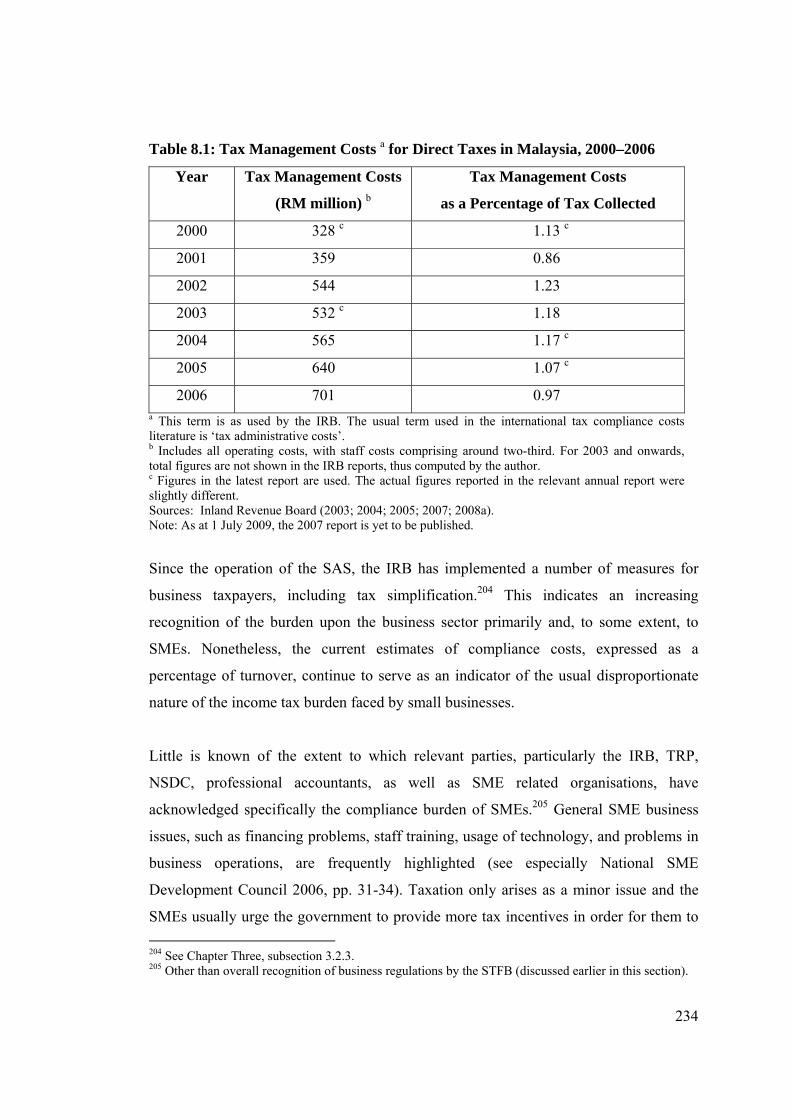
234
Table 8.1: Tax Management Costs a for Direct Taxes in Malaysia, 2000–2006
Year Tax Management Costs
(RM million) b
Tax Management Costs
as a Percentage of Tax Collected
2000 328 c 1.13 c
2001 359 0.86
2002 544 1.23
2003 532 c 1.18
2004 565 1.17 c
2005 640 1.07 c
2006 701 0.97 a This term is as used by the IRB. The usual term used in the international tax compliance costs literature is ‘tax administrative costs’. b Includes all operating costs, with staff costs comprising around two-third. For 2003 and onwards, total figures are not shown in the IRB reports, thus computed by the author. c Figures in the latest report are used. The actual figures reported in the relevant annual report were slightly different. Sources: Inland Revenue Board (2003; 2004; 2005; 2007; 2008a). Note: As at 1 July 2009, the 2007 report is yet to be published.
Since the operation of the SAS, the IRB has implemented a number of measures for
business taxpayers, including tax simplification.204 This indicates an increasing
recognition of the burden upon the business sector primarily and, to some extent, to
SMEs. Nonetheless, the current estimates of compliance costs, expressed as a
percentage of turnover, continue to serve as an indicator of the usual disproportionate
nature of the income tax burden faced by small businesses.
Little is known of the extent to which relevant parties, particularly the IRB, TRP,
NSDC, professional accountants, as well as SME related organisations, have
acknowledged specifically the compliance burden of SMEs.205 General SME business
issues, such as financing problems, staff training, usage of technology, and problems in
business operations, are frequently highlighted (see especially National SME
Development Council 2006, pp. 31-34). Taxation only arises as a minor issue and the
SMEs usually urge the government to provide more tax incentives in order for them to
204 See Chapter Three, subsection 3.2.3. 205 Other than overall recognition of business regulations by the STFB (discussed earlier in this section).
235
remain competitive in the market (National SME Development Council 2006, p. 34).
There needs to be a much greater specific focus on taxation issues and on ensuring the
SME tax compliance burden is minimised. The above background suggests that explicit
recognition of the ‘real’ tax compliance burden to businesses, SMEs in particular, is
essential for policy consideration.
Theoretically, Sandford, Hardwick and Godwin (1989, p. 209) stressed the importance
of tax compliance costs for government in four areas: to recognise the importance of
compliance costs explicitly; not to reduce the administrative costs at the expense of
compliance costs; to minimise compliance costs, especially for small business; and
finally, to compensate for compliance costs. However, convincing the government to
consider the tax compliance burden as a policy area is not simple in practice. Pope
(1993b, pp. 71-73) identified six stages in the development of the compliance costs of
taxation as a policy area: non-recognition or lack of interest in the subject area (stage 1);
qualitative recognition by the professionals (stage 2); estimation and evaluation (stage
3); policy recognition (stage 4); effective policy measures (stage 5); and continual
monitoring of compliance costs (stage 6). From this perspective, Malaysia is possibly in
stage one, with some development in stages two and three having taken place during the
late 1990s.
The current compliance costs estimates in the SAS regime contribute mainly to stage
three, which is valuable for government policy consideration (stage 4). As the current
study is confined to corporate SMEs, further studies on compliance costs are possibly
essential to convince the IRB in this regard. Currently, the IRB does not have a specific
policy on the compliance costs of SMEs. However, it is acknowledged that tax
simplification measures taken by the IRB do reduce compliance costs, in absolute value,
as is evident in this study. At this stage, it is recommended that the first and most
important policy area that should be addressed is to recognise fully the compliance
burden of the SMEs at the national level.
236
Accordingly, the establishment of a relevant investigative committee to undertake a
comprehensive review of SME income taxation in Malaysia is recommended. This is
similar to the Beddall Committee (1990) or the Small Business Deregulation Task
Force, the SBDTF (1996),206 in Australia. In the context of Malaysian SMEs, the
establishment of a committee with a composition similar to that of the SBDTF is
probably much better.207 It should be emphasised that having greater consultation with
small business organisations in the process of tax reform is among key
recommendations (No. 25) made in the Beddall Report (1990). As such, the proposed
committee in Malaysia should be comprised of members mainly from the SME business
sector, with appropriate representation by industry groups and organisations, and the
chairman or a representative from the NSDC, SME Corp, TRP, STFB and the Small
and Medium Industry Association of Malaysia. The committee should also include
representatives from tax professionals, including the Malaysian Institute of
Accountants, the Malaysian Institute of Taxation, lawyers, and academics with
expertise in the taxation of SMEs. The proposed committee would be expected to
provide a list of specific policy recommendations for SMEs.
Subsequently, the potential impact of any tax reforms or changes, particularly to SMEs,
is worth assessing by requiring a government TIS, similar to that which has been
implemented in OECD countries decades ago (Evans and Walpole 1999). Even
presently, tax compliance costs remain as an important consideration in tax policy
development (Hansford, Hasseldine and Howorth 2003, p. 489). The recent Malaysian
experience on the GST postponement demonstrated the importance of TIS in tax policy
debate. At this point of time, an impact study could be problematic due to data
availability. The proposed committee would be a significant development in this regard.
8.3.2 Tax Simplification and Compliance Costs Minimisation
The current findings are evidence of the effects of tax complexity and tax audits on the
likely non-compliance behaviour of corporate SMEs. Thus, measures to improve the
206 Also referred to as the Bell Committee. 207 The members of the SBDTF were mostly from the business sector, including accountants and lawyers. On the other hand, the Beddall Committee was comprised only of Members of Parliament.
237
voluntary tax compliance of corporate SMEs should address these two aspects. This
section presents a discussion of the overall policy and provides specific
recommendations regarding tax complexity. Policy suggestions on tax audits are
presented in the next subsection.208
Tax complexity is ‘a mirror image’ of tax simplicity (Tran-Nam 1999), with the high
costs of compliance demonstrating a complex tax system and vice-versa (Slemrod 1992,
p. 53; Pope 1993b, p. 70). Kasipillai (2005, p. 26) insists that tax law should be
systematically simplified for three reasons, namely, to lower both compliance costs and
administrative costs, to reduce uncertainty faced by taxpayers (tax complexity), and to
improve the level of voluntary compliance. Tax simplification measures are likely to
minimise tax compliance costs (Pope 1993b, p. 81), improve voluntary tax compliance
behaviour, and ensure higher tax revenue (Pope 1993a, p. 284).
Various tax simplification measures, largely based on overseas practice, have been
introduced since the year 2000.209 These simplification measures are likely to contribute
to lower tax compliance costs based on the current compliance costs estimates.210 The
most recent income tax change for companies, i.e. from the imputation tax system to a
single tier tax system,211 will remove the corporate SMEs’ burden substantially. Apart
from this recent measure, further income tax simplification is needed to lessen the tax
compliance burden of SMEs.
Until recently, Malaysia seems to have adopted an incremental approach to tax
simplification. This trend is not surprising as the tax compliance burden is yet to be
recognised fully. Sandford (1993, pp. 201-205) provides a comprehensive discussion on
the advantages and disadvantages of the incremental and package approaches, but
asserts that the success of tax reform is more likely to be achieved by way of the latter
approach (p. 228). Thus, further income tax simplification for Malaysian businesses in a
208 See subsection 8.3.3. 209 See Chapter Three, subsection 3.2.3. 210 See Chapter Seven, subsection 7.2.2 211 See Chapter Three, subsections 3.2.2 and 3.2.3.
238
more comprehensive and systematic manner, preferably involving all business sizes,212
is strongly recommended.
Future tax simplification measures should take account of the views of business
taxpayers, past experiences in Malaysia, the lessons learnt from other tax regimes (both
developed and developing countries) and, more importantly, specific suggestions to be
made by the proposed national investigative committee.213 These considerations are
expected to benefit all business taxpayers, regardless of business sector or size.
Effective measures to improve tax compliance should take into account the level of tax
complexity and tax compliance costs simultaneously; therefore, a package approach is
highly recommended.
Overall, the current study has highlighted the importance of considering the tax
compliance burden of the SME sector in tax policy development. A full list of
suggestions and recommendations would be provided following a comprehensive
review by the proposed committee. Some of the suggestions made by the respondents in
this survey include simplification of the tax form, further tax incentives and a reduction
in tax rates.214 This and other areas for consideration through income tax simplification
(preferably in the near future) for corporate SMEs are as follows:
Standardisation of the Small and Medium Enterprise Definition for Tax Purposes
and Extension of Incentives
Since 2005, Malaysia has adopted a national definition for SMEs.215 Regarding income
tax, currently there are at least three definitions that are in force for different purposes
covering companies only, with three different proxies used to measure the size of the
company: paid-up capital, shareholder’s fund and authorised capital, as shown in Table
8.2. 212 A similar suggestion has been recently made by Freedman (2006; 2009). 213 See subsection 8.3.1. 214 Respondents were asked, by way of two open-ended questions, to provide specific suggestions on how to reduce the tax preparation work of SMEs (Question 19–Appendix F) and to provide overall comments on the taxation of SMEs as a whole (Question 20–Appendix F). Unfortunately, only a few responded to these questions, as shown in Appendix U. 215 See Chapter One, subsection 1.5.3.
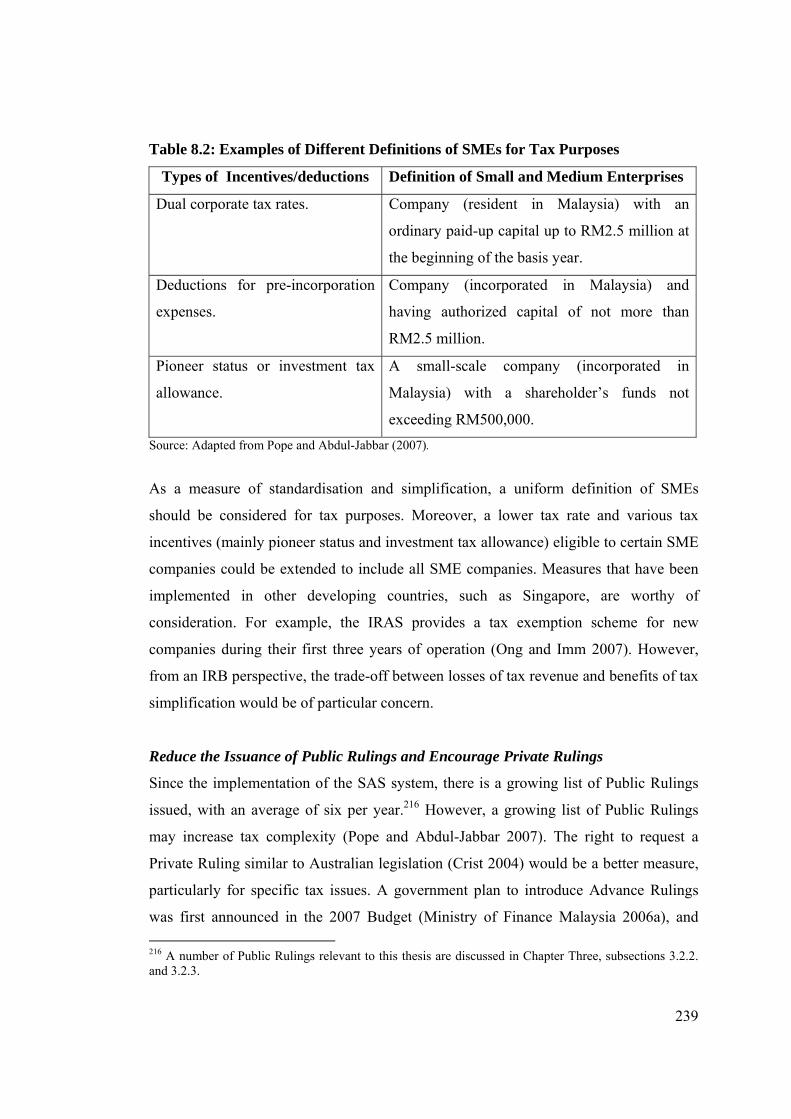
239
Table 8.2: Examples of Different Definitions of SMEs for Tax Purposes
Types of Incentives/deductions Definition of Small and Medium Enterprises
Dual corporate tax rates. Company (resident in Malaysia) with an
ordinary paid-up capital up to RM2.5 million at
the beginning of the basis year.
Deductions for pre-incorporation
expenses.
Company (incorporated in Malaysia) and
having authorized capital of not more than
RM2.5 million.
Pioneer status or investment tax
allowance.
A small-scale company (incorporated in
Malaysia) with a shareholder’s funds not
exceeding RM500,000.
Source: Adapted from Pope and Abdul-Jabbar (2007).
As a measure of standardisation and simplification, a uniform definition of SMEs
should be considered for tax purposes. Moreover, a lower tax rate and various tax
incentives (mainly pioneer status and investment tax allowance) eligible to certain SME
companies could be extended to include all SME companies. Measures that have been
implemented in other developing countries, such as Singapore, are worthy of
consideration. For example, the IRAS provides a tax exemption scheme for new
companies during their first three years of operation (Ong and Imm 2007). However,
from an IRB perspective, the trade-off between losses of tax revenue and benefits of tax
simplification would be of particular concern.
Reduce the Issuance of Public Rulings and Encourage Private Rulings
Since the implementation of the SAS system, there is a growing list of Public Rulings
issued, with an average of six per year.216 However, a growing list of Public Rulings
may increase tax complexity (Pope and Abdul-Jabbar 2007). The right to request a
Private Ruling similar to Australian legislation (Crist 2004) would be a better measure,
particularly for specific tax issues. A government plan to introduce Advance Rulings
was first announced in the 2007 Budget (Ministry of Finance Malaysia 2006a), and
216 A number of Public Rulings relevant to this thesis are discussed in Chapter Three, subsections 3.2.2. and 3.2.3.
240
almost one and half years later, the Guidelines on Advance Rulings were issued by the
IRB (2008b). The IRB commitment to the issuing of an advance ruling within sixty
days from the date of application is encouraging, but the imposition of fees (RM500 for
application and reimbursement for external advice and other costs), could be
burdensome to SMEs in particular. Charging a fee for a private ruling is a normal
practice in most countries, including Canada, New Zealand, the US (The Australian
Treasury 2004b, p. 6) and Singapore, with the exception of Australia (The Australian
Treasury 2004a, p. 23). The Australian approach not to charge fees is worth considering
for Malaysian SME businesses.
Simplify the Record Keeping Requirements for Small Businesses
Simplifying record keeping for small business would allow businesses to allocate more
resources to doing business. This includes a substantial reduction in the length of tax-
related forms and all accompanying supporting documents. For example, in Singapore,
the IRAS has simplified income tax returns for all business taxpayers by reducing the
number of pages; income tax returns for companies were reduced from eight to five
pages in 2004 (Ong and Imm 2007, p. 7).
Apart from the above, the IRB in particular, and relevant business authorities in
Malaysia, should continuously and actively encourage small businesses to maintain
good record keeping (Singh 2002, p. 277). The positive side of tax compliance, such as
managerial benefits arising from tax compliance, needs to be repeatedly emphasised.
8.3.3 Publicising Tax Audit Information
The current study provides evidence that the possibility of non-compliance increases as
the probability of a tax audit decreases. Overall, the respondents were somewhat
uncertain about the possibility of their company being subjected to a tax audit as
probably no information is available in this regard. There are some details in the annual
report of the IRB on the number of tax audit cases and the corresponding amount
241
recovered from audit activities.217 However, the probability of taxpayers being selected
for audit purposes is not publicly available or highlighted.
During the initial years of SAS, the IRB has emphasised preparing both taxpayers and
tax officials to the new system by way of education and training respectively. It has
been more than eight years since the implementation of the SAS to the corporate sector
in Malaysia, so it is now the right timing for the IRB to highlight some general details
of their audit activities publicly. Available academic data suggest that the current
corporate tax audit rate appears to be rather low, i.e. less than half of one percent for the
year 2007 (Pope and Mohd Isa 2009). It is likely that the IRB will increase gradually
the corporate audit rate. At this stage, the IRB may want to publicise (including using
the website effectively) more of their audit activities and, to some extent, their basic
data at the aggregate level, including the number of audit cases and the amount of
revenue recovered from their audit activities. This measure is expected to effectively
inform taxpayers (Singh 2007) if undertaken on a timely basis (Singh 2008) and, more
importantly, increase the level of tax audit awareness among businesses, which is
important as a deterrent to non-compliance.
8.3.4 Overall Tax Administration in Malaysia
Apart from income tax simplification, changes to tax administrative processes are
among the ten main lessons identified by Ariff and Pope (2002, pp. 279-289) as a policy
guide for developing countries. Modernisation of tax administration must take place
primarily with a view to simplifying the tax rules, making them taxpayer-friendly, and
reducing both administrative and compliance costs, with a particular emphasis on the
small business sector (Ariff and Pope 2002).
Currently, administration of direct taxes and indirect taxes are governed by two
government authorities, i.e. the IRB and RCM respectively, with both bodies responsible
to the Ministry of Finance.218 It is timely that the government should consider seriously a
217 See Chapter One, Table 1.3. 218 See Chapter Three, subsection 3.2.1.
242
suggestion made by Kasipillai and Baldry (2004) regarding merging the administration
of both direct and indirect tax administrations into a single agency. This has been a
common practice in most countries, including Australia, New Zealand, Singapore, the
US, and recently, the UK. Kasipillai and Baldry (2004) believed that the compliance
task of business will be simplified and, for tax authorities, the compliance enforcement
tasks can be carried out more efficiently. The TRP in particular could lead the initial
move towards a single tax authority in Malaysia.
Probably, a specific national committee on tax administration, preferably similar to the
UK O’Donnell Committee (2004), should be considered to conduct a detailed study and
provide recommendations accordingly. Relevant parties, such as the IRB, RMC, and
representatives from business sectors and professionals (such as accountants and
lawyers) as well as other national bodies, including the STFB and NSDC, should take
part in the process. Further, the proposed committee may consider the fundamental
features of leading modern tax administrations, as recently outlined by Hasseldine
(2008, p. 16). This includes concern over cost efficiency and effectiveness, engagement
with stakeholders, introduction of technology applications, and factors that influence the
behaviour of both taxpayers and tax professionals.
8.4 LIMITATIONS OF THE STUDY
This study provides empirical evidence and has contributed to the body of tax
knowledge in the context of corporate income taxation. This covers both areas of tax
compliance behaviour and compliance costs in a single study, with particular attention
to the SME sector. Despite this, the results of the current study should be interpreted as
being subject to several limitations.
First, this study has obtained an effective response rate of 16 percent in the primary
postal survey. Despite many recommendations, especially by Sandford (1995), Pope
243
(1995) and Dillman (2007), being adopted into the current study,219 the number of
responses received is considered low in the context of international tax studies, which
typically have a rate of around 25 percent to 30 percent. Nonetheless, it is broadly
comparable to a response rate of around 14 percent to 26 percent, and about 10 percent
to 20 percent in a number of Asian tax and business studies respectively (Abdul-Jabbar
and Pope 2008a, p. 297). It is also comparable to the average response rate of just over
21 percent for the 16 international corporate tax compliance costs studies reviewed in
this thesis,220 with five studies having a response rate of less than 16 percent. Further,
analyses of non-response bias suggest fairly similar responses between respondents and
non-respondents, thereby removing the possibility of significant non-response bias in
this study.221
Secondly, it is acknowledged that evaluating the sample responses to the overall SME
population in Malaysia is difficult due to availability of data, but the representation of
the sample is reasonably supported by reference to a sample population and available
government data.222 Thus, the generalisation of the current findings to Malaysian
corporate SME taxation is satisfactory. However, the generalisation into SME
companies in other tax jurisdictions may be subject to further study; more importantly,
additional caution is necessary as different measures apply in defining the SME sector.
Thirdly, compliance costs are derived based on estimates gathered through self-
reporting surveys. The external costs and additional costs are straightforward monetary
costs to estimate as compared to valuation of internal time, which is a possible area of
concern. This study categorises staff into four groups: manager/accountant, accounting
staff, administrative staff, and other staff. The borderline between income tax
compliance work and other work may not be easily understood by respondents. Further,
it is possible that respondents were not able to recall their internal time spent accurately.
The fact that compliance costs estimates are merely a measure of the magnitude of
219 See Chapter Four, Section 4.3. 220 See Appendix D. 221 See Chapter Four, Section 4.9. 222 See Chapter Five, Section 5.2, paragraphs below Table 5.6.
244
compliance costs (Sandford, Godwin and Hardwick 1989; Sandford 1995) is fully
acknowledged.
Fourthly, the tax attitudes and non-compliance of SME companies are measured from
the managerial or respondent perspectives, which are assumed to indicate tax attitudes
and likely compliance/non-compliance of corporate SMEs. In practice, corporate tax
returns are mostly lodged by tax professionals on behalf of their corporation clients.
Overall, the separate survey of tax professionals indicates comparable perceptions to
SME respondents. The survey of tax professionals in the current study has been carried
out for a small sample size of 300, with only 31 responses. Thus, comparable
perceptions between SME respondents and tax professionals should be treated as
tentative.
Fifthly, the current study measured tax non-compliance by way of hypothetical tax
scenarios. It is acknowledged that the actual judgment of the respondents may vary.
Further, the scenario is restricted to two specific types of non-compliance behaviour,
more specifically involving two single transactions of RM10,000 each. Further, the
scenarios were stated in the context of self-employment. The findings therefore should
be treated with caution with regard to other types of non-compliance and/or other
specific amounts for consideration.
Finally, other usual self-reporting mail survey limitations are to be recognised,
especially in the sensitive area of tax compliance. Apart from the honesty of the
respondents, it is possible that the survey questionnaire may be interpreted differently
by the respondents.
8.5 RECOMMENDATIONS FOR FUTURE RESEARCH
The current study is likely to act as a base for future tax compliance research, involving
corporations and covering both compliance costs and compliance behaviour. However

245
due to constraints discussed above,223 it is strongly recommended that future research
take the following points into consideration.
In the future, researchers may select samples from the actual population of business
taxpayers. Such an approach would provide valuable comparison findings. Another
prospect of examining this area lies in the context of analysing compliance costs
estimates and managerial perceptions of actual compliant and non-compliant business
taxpayers, similar to Sia et al. (2008), but confined to individuals. However, the fact
that the true population and the actual compliant/non-compliant taxpayers are not
publicly available means that this would not be possible without the full cooperation of
the tax authority. For example, a review of prior Malaysian studies undertaken in this
thesis, indicates that there are only three studies that have used the IRB data, all of these
having been carried out by staff/former staff of the IRB (i.e. Che-Ayub 1994; Abdul
2003; Sia et al. 2008). Nonetheless, a more recent development indicates that the IRB
has started allowing other researchers (i.e. Pope and Mohd Isa 2009) to use their tax
data, to some extent. This trend is motivation for tax academics to undertake further tax
research in Malaysia.
This study has focussed on two types of hypothetical tax behaviour—understatement of
income and overstatement of income—specifically in the context of the self-employed.
Measuring non-compliance through other alternative approaches, such as using official
data and experimentation, is strongly recommended. Future studies may include other
specific types of non-compliance behaviour as well. If hypothetical tax scenarios are to
be used, other business contexts and, more importantly, a sensitivity analysis involving
different amounts, are also worth considering. Further, investigating a specific area of
taxation that is complex for the SME sector is also recommended, and this would be in
alignment with studies in Australia and the US (e.g. McKerchar 2005; McKerchar,
Ingraham and Karlinsky 2005; Tran-Nam and Karlinsky 2008). Similar studies could
also include other business taxpayers, such as the self-employed, partnerships and large
companies, with considerable attention towards tax compliance costs.
223 See Section 8.4.
246
Finally, more studies of corporate tax compliance in other tax jurisdictions are needed.
Replication or several extensions of this study—taking into account limitations and
suggestions above—to both developed and developing countries could make further
contributions to corporate tax knowledge, tax administration and practices.
8.6 CONCLUDING REMARKS
This study has been among the first to integrate tax compliance costs, tax attitudes and
the likely compliance behaviour of corporations, Malaysian SMEs in particular, and
this, more importantly, from a business managerial perspective. The usual regressivity
of tax compliance costs is evident, with both tax complexity and tax audit found to
influence corporate tax behaviour. Thus, at this stage, the IRB is urged to continue tax
simplification measures that would be expected to significantly minimise the
compliance burden of all taxpayers, including businesses of all sizes. The magnitude of
tax audit activities should be increased substantially, and important information derived
from such activities should be utilised effectively to enhance the awareness of business
taxpayers.
To sum up, it is hoped that the issue of the income tax compliance burden of businesses
will be recognised fully at the national level and, at a later stage, be considered as an
important element for any future tax policy decision-making in Malaysia, especially
involving the SME sector.
247
REFERENCES Abdul-Jabbar, H 1996, The Implementation of Schedular Monthly Tax Deduction: The
Case of Small and Medium Industries in Kedah Darul Aman, Master Thesis, University Utara Malaysia.
Abdul-Jabbar, H & Pope, J 2008a, 'The Effects of the Self-Assessment System on the
Tax Compliance Costs of Small and Medium Enterprises in Malaysia', Australian Tax Forum, vol. 23, no. 3, pp. 289-307.
Abdul-Jabbar, H & Pope, J 2008b, 'Exploring the Relationship between Tax
Compliance Costs and Compliance Issues in Malaysia', Journal of Applied Law and Policy, vol. 1, no. 1, pp. 1-20.
Abdul-Jabbar, H & Pope, J 2009 (Forthcoming), 'Tax Attitudes and Compliance among
Small and Medium Enterprises in Malaysia', New Zealand Journal of Taxation Law and Policy, vol. 13, no. 3.
Abdul-Manaf, NA 2004, Land Tax Administration and Compliance Attitudes in
Malaysia, PhD Thesis, Nottingham University. Abdul-Manaf, NA & Abdul-Jabbar, H 2006, 'A Survey of Perception towards Tax
Evasion as a Crime', in M Walpole & M McKerchar (eds), Further Global Challenges in Tax Administration, Fiscal Publications, Birmingham, pp. 183-99.
Abdul-Manaf, NA, Hasseldine, J & Hodges, R 2005, 'The Determinants of Malaysian
Land Taxpayers' Compliance Attitudes', eJournal of Tax Research, vol. 3, no. 2, pp. 206-21.
Abdul, M 2003, Income Tax Non-compliance in Malaysia, Prentice Hall, Petaling Jaya. Abdul, M & Sheehan, P 2003, 'Estimating the Extent of Income Tax Non-compliance in
Malaysia and Australia using the Gap Approach (part I)', Tax Nasional, vol. 12, no. 4th Quarter, pp. 22-34.
Ahmad, MAR, Hanefah, M & Mohd Noor, MA 2007, 'The Effects of Knowledge on
Tax Compliance Behaviours among Malaysian Taxpayers', in International Conference on Business and Information, Tokyo, 11-13 July.
Allers, M 1994, Administrative and Compliance Costs of Taxation and Public Transfers
in the Netherlands, Woltersgroep Gronigen. Allingham, MG & Sandmo, A 1972, 'Income Tax Evasion: A Theoretical Analysis',
Journal of Public Economics, vol. 1, pp. 323-38.
248
Andreoni, J, Erard, B & Feinstein, J 1998, 'Tax Compliance', Journal of Economic Literature, vol. 36, no. 2, pp. 818-60.
Ariff, M, Ismail, Z & Loh, A 1997, 'Compliance Costs of Corporate Income Taxation in
Singapore', Journal of Business Finance and Accounting, vol. 24, no. 9 & 10, pp. 1253-68.
Ariff, M, Loh, A & Talib, A 1995, 'Compliance Costs of Corporate Income Taxation in
Singapore, 1994', Accounting Research Journal, vol. 8, no. 2, pp. 75-87. Ariff, M & Pope, J 2002, Taxation & Compliance Costs in Asia Pacific Economies,
University Utara Malaysia Press, Sintok. Armstrong, S & Overton, T 1977, 'Estimating Nonresponse Bias in Mail Surveys',
Journal of Marketing Research, vol. 14, pp. 396-402. Ashby, CM 2000, IRS' Effort to Serve Small Business Taxpayers: Testimony of the
General Accounting Office before the Senate Committee on Small Business, General Accounting Office, GAO/T-GGD-00-138.
Babbie, E 1989, The Practice of Social Research, 5th edn, Wadsworth Publishing
Company, Belmont: CA. Baldry, J & Kasipillai, J 1996, 'Malaysia: Income Tax Enforcement', Asia-Pacific Tax
Bulletin, vol. 2, no. 9, pp. 268-72. Bank Negara Malaysia 2004, 'Conclusion of the Second National SME Development
Council Meeting', Press Release, 2 December. Bank Negara Malaysia 2009, Ringgit Foreign Exchange Rates. Retrieved 1 July, from
http://www.bnm.gov.my/statistics/exchangerates.php Bartholomew, S & Smith, A 2006, 'Improving Survey Response Rates from Chief
Executive Officers in Small Firms: The Importance of Social Networks', Entrepreneurship Theory and Practice, vol. 30, no. 1, pp. 83-96.
Baruch, Y 1999, 'Response Rate in Academic Studies - A Comparative Analysis',
Human Relations, vol. 52, no. 4, pp. 421-38. Beattie, V, Goodacre, A & Thomson, SJ 2006, 'Corporate Financing Decisions: UK
Survey Evidence', Journal of Business Finance & Accounting, vol. 33, no. 9 & 10, pp. 1402-34.
Becker, GS 1968, 'Crime and Punishment: An Economic Approach', The Journal of
Political Economy, vol. 76, no. 2, pp. 169-217.
249
Beddall Report 1990, Small Business in Australia: Challenges, Problems and Opportunities AGPS, Canberra, Report of the House of Representatives Standing Committee on Industry, Science and Technology.
Bertolucci, A 2002, The Compliance Costs of Taxation in Brazil: A Survey of Costs in
Brazilian Public Companies', University of Sao Paulo, cited in Evans (2003b). Blazic, H 2004, 'Tax Compliance Costs of Companies in Croatia', Ekonomický časopis,
vol. 6, pp. 723-38. Blumenthal, M & Kalambokidis, L 2006, 'The Compliance Costs of Maintaining Tax
Exempt Status', National Tax Journal, vol. 59, no. 2, pp. 235-52. Blumenthal, M & Slemrod, J 1992, 'The Compliance Cost of the U.S. Individual
Income Tax System: A Second Look after Tax Reform', National Tax Journal, vol. 45, no. 2, pp. 185-202.
Board of Taxation 2007, Scoping Study of Small Business Tax Compliance Costs: A
Report to the Treasurer, Commonwealth of Australia, Canberra. Brau, J & Fawcett, S 2006, 'Initial Public Offerings: An Analysis of Theory and
Practice', The Journal of Finance, vol. 61, no. 1, pp. 399-436. Brunton, C 2005, Measuring the Tax Compliance Costs of Small and Medium-sized
Businesses – A Benchmark Survey: Final Report, Wellington, Report prepared for Inland Revenue Department New Zealand.
BT Online 1996, Malaysia's SMIDEC: Making SMEs the Main Engine of Growth.
Retrieved 11 Jun 2006, from http://www.asia1.com/bizcentre/Enterprise50/supp32_1.html
Business New Zealand/KPMG 2005, Summary Report of the Business New Zealand –
KPMG Compliance Cost Survey, Wellington. Business New Zealand/KPMG 2006, Summary Report of the Business New Zealand –
KPMG Compliance Cost Survey, Wellington. Business New Zealand/KPMG 2007, Summary Report of the Business New Zealand –
KPMG Compliance Cost Survey, Wellington. Chan, CW, Troutman, CS & O'Bryan, D 2000, 'An Expanded Model of Taxpayer
Compliance: Empirical Evidence from the United States and Hong Kong', Journal of International Accounting, Auditing and Taxation, vol. 9, no. 2, pp. 83-103.

250
Chan, S, Cheung, D, Ariff, M & Loh, A 1999, 'Compliance Costs of Corporate Taxation in Hong Kong', International Tax Journal, vol. 25, no. 4, pp. 42-68.
Charron, L, Chow, G & Halbesma, J 2008, The Hidden Tax Burden: A Business
Perspective on the Cost of Complying with Taxes, Canadian Federation of Independent Business (CFIB).
Chattopadhyay, S & Das-Gupta, A 2002a, The Income Tax Compliance Cost of Indian
Corporations, National Institute of Public Finance and Policy, New Delhi. Chattopadhyay, S & Das-Gupta, A 2002b, The Personal Income Tax in India:
Compliance Costs and Compliance Behaviour of Taxpayers, National Institute of Public Finance and Policy, New Delhi.
Che-Ayub, SM 1994, Tax Administration Reform for the Malaysian Inland Revenue
Department with an Adaptation of the Voluntary Compliance Function, DPA Dissertation Thesis, Golden Gate University.
Che Azmi, A & Perumal, K 2008, 'Tax Fairness Dimensions in an Asian Context: The
Malaysian Perspective', International Review of Business Research Papers, vol. 4, no. 5, pp. 11-9.
Chittenden, F, Kauser, S & Poutziouris, P 2003, 'Tax Regulation and Small Business in
the USA, UK, Australia and New Zealand', International Small Business Journal, vol. 21, no. 1, pp. 93-115.
Chittenden, F, Kauser, S & Poutziouris, P 2005, 'PAYE-NIC Compliance Costs:
Empirical Evidence from the UK SME Economy', International Small Business Journal, vol. 23, no. 6, pp. 635-56.
Chittenden, F, Poutziouris, P, Kauser, S & Shamutkova, M 2005, 'Income Tax Self-
assessment Compliance Costs: Empirical Evidence from the UK', in C Gray & G Bannock (eds), Government Regulation and the Small Firm, Institute for Small Business and Entrepreneurship, Milton Keynes, pp. 27-39.
Chittenden, F & Sloan, B 2007, 'Taxation and Public Policy Towards Small Firms: A
Review', Australian Tax Forum, vol. 22, no. 4, pp. 31-45. Christensen, AL, Weihrich, SG & Gerbing, MD 1994, 'The Impact of Education on
Perceptions of Tax Fairness', Advances in Taxation, vol. 6, pp. 63-94. Collins, JH, Milliron, V & Toy, DR 1992, 'Determinants of Tax Compliance: A
Contingency Approach', The Journal of the American Taxation Association, vol. 14, no. Fall, pp. 1-29.

251
CPA Australia 2003, Small Business Survey Program: Compliance Burden CPA Australia, Melbourne.
Crawford, C & Freedman, J 2008, Small Business Taxation: A Special Study of the
Structural Issues Surrounding the Taxation of Business Profits of Owner Managed Firms, The Institute for Fiscal Studies, London, Prepared for the Report of a Commission on Reforming the Tax System for the 21st Century, Chaired by Sir James Mirrlees.
Crist, N 2004, 'Review of Tax Regime Plain, Simple Outcome is Expected', The Star,
15 September 2004. Cuccia, AD 1994, 'The Economics of Tax Compliance: What Do We Know and Where
Do We Go?' Journal of Accounting Literature, vol. 13, pp. 81-116. Cuccia, AD & Carnes, GA 2001, 'A Closer look at the Relation between Tax
Complexity and Tax Equity Perceptions', Journal of Economic Psychology, vol. 22, no. 2, pp. 113-40.
DeLuca, D, Greenland, A, Guyton, J, Hennessy, S & Kindlon, A 2005, 'Measuring the
Tax Compliance Burden of Small Businesses', in IRS Research Conference, Washington DC, 7-8 June.
Dennis, W 2003, 'Raising Response Rates in Mail Surveys of Small Business Owners:
Results of an Experiment', Journal of Small Business Management, vol. 41, no. 3, pp. 278-95.
Department of Statistics Malaysia 2005, The General Report of the Population and
Housing Census 2000, Kuala Lumpur 2005. Department of Statistics Malaysia 2007, Census of Establishments and Enterprises
2005: Profile of Small and Medium Enterprises, Kuala Lumpur. Department of Statistics Malaysia 2008, Population (updated 5 September 2008)
Retrieved 23 June 2009, from http://www.statistics.gov.my/eng/index.php?option=com_content&view=article&id=50:population&catid=38:kaystats&Itemid=11
Dillman, D 1978, Mail and Telephone Surveys: The Total Design Method, John Wiley
& Sons, New York. Dillman, D 1991, 'The Design and Administration of Mail Surveys', Annual Review of
Sociology, vol. 17, pp. 225-49. Dillman, D 2007, Mail and Internet Surveys: The Tailored Design Method 2007, 2nd
edn, John Wiley and Sons, New York.
252
Dornstein, M 1987, 'Taxes: Attitudes and Perceptions and their Social Bases', Journal of
Economic Psychology, vol. 8, pp. 55-76. Elffers, H, Robben, HJ & Hessing, DJ 1992, 'On Measuring Tax Evasion', Journal of
Economic Psychology, vol. 13, pp. 545-67. Elffers, H, Weigel, RH & Hessing, DJ 1987, 'The Consequences of Different Strategies
for Measuring Tax Evasion Behavior', Journal of Economic Psychology, vol. 8, no. 3, pp. 311-37.
Embong, AR 1996, 'Social Transformation, the State and the Middle Classes in Post-
independence Malaysia ', Southeast Asian Studies, vol. 34, no. 3, pp. 524-47. Employment Act (Act 265) 1955, International Law Book Services, Petaling Jaya. Erard, B 1997a, The Income Tax Compliance Burden on Canadian Big Business,
Department of Finance, Ottawa, Working paper 97-2, prepared for the Technical Committee on Business Taxation.
Erard, B 1997b, The Income Tax Compliance Burden on Small and Medium-sized
Canadian Businesses, Department of Finance, Ottawa, Working Paper 97-12, Prepared for the Technical Committee on Business Taxation.
Evans, C 2003a, The Operating Costs of Taxing the Capital Gains of Individuals: A
Comparative Study of Australia and the UK, with Particular Reference to the Compliance Costs of Certain Tax Design Features, PhD Thesis, University of New South Wales.
Evans, C 2003b, 'Studying the Studies: An Overview of Recent Research into Taxation
Operating Costs', eJournal of Tax Research, vol. 1, no. 1, pp. 64-92. Evans, C, Carlon, S & Massey, D 2005, 'Record Keeping Practices and Tax Compliance
of SMEs', eJournal of Tax Research, vol. 3, no. 2, pp. 288-334. Evans, C, Pope, J & Hasseldine, J (eds.) 2001, Taxation Compliance Costs: A
Festschrift for Cedric Sandford, Prospect Media Pty Ltd, Sydney. Evans, C, Ritchie, K, Tran-Nam, B & Walpole, M 1996, A Report into the Incremental
Costs of Taxpayer Compliance, Australian Government Publishing Service, Canberra.
Evans, C, Ritchie, K, Tran-Nam, B & Walpole, M 1997, A Report into Taxpayer Costs
of Compliance, Australian Government Publishing Service, Canberra.

253
Evans, C, Ritchie, K, Tran-Nam, B & Walpole, M 1998, 'Taxation Compliance Costs: Some Recent Empirical Work and International Comparisons', Australian Tax Forum, vol. 14, no. 1, pp. 93-122.
Evans, C, Tran-Nam, B & Andrew, B 2007, 'Towards Systemic Reform of the
Australian Personal Income Tax: Developing a Sustainable Model for the Future', Australian Tax Forum, vol. 22, no. 2, pp. 15-47.
Evans, C, Tran-Nam, B & Jordan, B 2002, 'Assessing the Potential Compliance
Costs/Benefits of the Tax Value Method', Australian Tax Forum, vol. 17, no. 1, pp. 33-58.
Evans, C & Walpole, M 1999, Compliance Cost Control: A Review of Tax Impact
Statements in the OECD, Australian Tax Research Foundation, Sydney, Research Study No. 27.
Federation of Malaysian Manufacturers 2007, Annual Salary, Benefits and Employment
Conditions Survey of the Manufacturing Sector 2006, Kuala Lumpur. Fernandez, P & Oats, L 1998, 'The Small Business under a Goods and Services Tax
Regime', in C Evans & A Greenbaum (eds), Tax Administration: Facing the Challenges of the Future, Prospect Media Pty Ltd, Sydney, pp. 159-76.
Fischer, CM 1993, Perceived Detection Probability and Taxpayer Compliance: A
Conceptual and Empirical Examination (Detection Probability), PhD Thesis, Pennsylvania University.
Fischer, CM, Wartick, M & Mark, MM 1992, 'Detection Probability and Taxpayer
Compliance: A Review of the Literature', Journal of Accounting Literature, vol. 11, pp. 1-46.
Forsgren, R 1989, 'Increasing Mail Survey Response Rates: Methods for Small
Business Researchers', Journal of Small Business Management, vol. 27, no. 4, pp. 61-6.
Fowler, FJ 1995, Improving Survey Questions: Design and Evaluation, SAGE
Publications, Thousand Oaks. Freedman, J 2003, 'Small Business Taxation: Policy Issues and the UK', in N Warren
(ed.), Taxing Small Business: Developing Good Tax Policies, Australian Tax Research Foundation.
Freedman, J 2006, 'Why Taxing the Micro-business is Not Simple - A Cautionary Tale
from the "Old World" ', Journal of the Australasian Tax Teachers Association, vol. 2, no. 1, pp. 58-77.

254
Freedman, J 2009, 'Reforming the Business Tax System: Does Size Matter? Fundamental Issues in Small Business Taxation ', in C Evans & R Krever (eds), Australian Business Tax Reform in Retrospect and Prospect, Thomson Reuters, Pyrmont, pp. 153-78.
Garson, D n.d., Statnotes: Topics in Multivariate Analysis. Retrieved 21 August 2006,
from http://www2.chass.ncsu.edu/garson/pa765/statnote.htm Gerbing, MD 1988, An Empirical Study of Taxpayer Perceptions of Fairness, PhD
Thesis, University of Texas. Gilligan, G & Richardson, G 2005, 'Perceptions of Tax Fairness and Tax Compliance in
Australia and Hong Kong - A Preliminary Study', Journal of Financial Crime, vol. 12, no. 4, pp. 331-43.
Glover, J & Tran-Nam, B 2005, 'The GST Recurrent Compliance Costs/Benefits of
Small Business in Australia: A Case Study Approach', Journal of the Australasian Tax Teachers Association, vol. 1, no. 2, pp. 237-58.
Graetz, M & Wilde, L 1985, 'The Economics of Tax Compliance: Fact and Fantasy',
National Tax Journal, vol. 38, no. 3, pp. 355-63. Graham, J & Harvey, C 2001, 'The Theory and Practice of Corporate Finance: Evidence
from the Field', Journal of Financial Economics, vol. 60, pp. 187-243. Griffis, S, Goldsby, T & Cooper, M 2003, 'Web-based and Mail Surveys: A
Comparison of Response, Data and Cost', Journal of Business Logistics, vol. 24, no. 3, pp. 237-58.
Guyton, JL, Korobow, AK, Lee, PS & Toder, EJ 2005, 'The Effects of Tax Software
and Paid Preparers on Compliance Costs', National Tax Journal, vol. 58, no. 3, pp. 439-48.
Guyton, JL, O’Hare, JF, Stavrianos, MP & Toder, EJ 2003, 'Estimating the Compliance
Cost of the U.S. Individual Income Tax', National Tax Journal, vol. 56, no. 3, pp. 673-88.
Haig, RM 1935, 'The Cost to Business Concerns of Compliance with Tax Laws',
Management Review, vol. 24, no. 11, pp. 323-33. Hair, J, Anderson, R, Tatham, R & Black, W 1998, Multivariate Data Analysis, 5th edn,
Prentice-Hall International, New Jersey. Hall, A 1993, The High Cost of Tax Compliance for US Business, Tax Foundation,
Washington, Special Report No 25.
255
Hanefah, M 1996, An Evaluation of the Malaysian Tax Administrative System and Taxpayers Perceptions towards Assessment System, Tax Law Fairness and Tax Law Complexity PhD Thesis, University Utara Malaysia.
Hanefah, M & Al-Mureshi, A 1991, 'Accounting in Small and Medium Enterprises',
Akauntan Nasional, Jan, pp. 14-5. Hanefah, M, Ariff, M & Kasipillai, J 2001, 'Compliance Costs of Small and Medium
Enterprises', Journal of Australian Taxation, vol. 4, no. 1, pp. 73-97. Hanefah, M, Hassan, H & Othman, Z 2008, 'E-commerce Implication: Potential
Problems and Challenges in Malaysia', International Business Research, vol. 1, no. 1, pp. 43-57.
Hanlon, M, Mills, L & Slemrod, J 2005, An Empirical Examination of Corporate Tax
Non-compliance, University of Michigan, Working Paper No.1025. Hansford, A, Hasseldine, J & Howorth, C 2003, 'Factors Affecting the Costs of UK
VAT Compliance for Small and Medium-sized Enterprises', Environment and Planning C: Government and Policy, vol. 21, no. 4, pp. 479-92.
Hashim, MK 2007, SMEs in Malaysia: A Brief Handbook, August Publishing, Petaling
Jaya. Hasseldine, J 1999, 'Gender Differences in Tax Compliance', Asia-Pacific Journal of
Taxation, vol. 3, no. 2, pp. 73-89. Hasseldine, J 2001, 'Linkages between Compliance Costs and Taxpayer Compliance
Research', in C Evans, J Pope & J Hasseldine (eds), Taxation Compliance Costs: A Festschrift for Cedric Sandford, Prospect Media Pty Ltd, Sydney, pp. 3-14.
Hasseldine, J 2008, 'The Search for Best Practice in Tax Administration', in M Walpole
& C Evans (eds), Tax Administration: Safe Harbours and New Horizons, Fiscal Publications, Birmingham, pp. 7-18.
Hasseldine, J & Hansford, A 2002, 'The Compliance Burden of VAT: Further Evidence
from the UK', Australian Tax Forum, vol. 17, no. 4, pp. 367-85. Hasseldine, J & Hite, P 2003, 'Framing, Gender and Tax Compliance', Journal of
Economic Psychology, vol. 24, no. 4, pp. 517-33. Hasseldine, J & Kaplan, S 1992, 'The Effect of Different Sanction Communications on
Hypothetical Taxpayer Compliance: Policy Implication from New Zealand', Public Finance, vol. 47, no. 1, pp. 45-60.
256
Hasseldine, J, Kaplan, S & Fuller, L 1994, 'Characteristics of New Zealand Tax Evaders: A Note', Accounting and Finance, vol. 34, no. 2, pp. 79-93.
Hasseldine, J & Li, Z 1999, 'More Tax Evasion Research Required in New Millennium',
Crime, Law & Social Change, vol. 31, no. 2, pp. 91-104. Hessing, DJ, Elffers, H & Weigel, RH 1988, 'Exploring the Limit of Self-reports and
Reasoned Action: An Investigation of the Psychology of Tax Evasion Behaviour', Journal of Personality and Social Psychology, vol. 54, no. 3, pp. 405-13.
Hite, P 1988, 'The Effect of Peer Reporting Behaviour on Taxpayer Compliance', The
Journal of the American Taxation Association, vol. 9, no. 2, pp. 47-64. Hite, P 1997, 'Identifying and Mitigating Taxpayer Non-compliance', Australian Tax
Forum, vol. 13, no. 2, pp. 155-81. Hite, P & McGill, G 1992, 'An Examination of Taxpayer Preference for Aggressive Tax
Advice', National Tax Journal, vol. 45, no. 4, pp. 389-403. Income Tax Act (Act 53) 1967, International Law Book Services, Petaling Jaya. Inland Revenue Board 2000a, Public Ruling No. 7/2000. Retrieved 7 March 2009, from
http://www.hasil.org.my/english/eng_NO4_5_2_11.asp Inland Revenue Board 2000b, Public Rulings No. 1/2000 - 3/2000. Retrieved 7 March
2009, from http://www.hasil.org.my/english/eng_NO4_5_2.asp Inland Revenue Board 2001a, Annual Report 2000, Inland Revenue Board of Malaysia. Inland Revenue Board 2001b, Public Rulings No. 4/2000 - 6/2000 (revised). Retrieved
7 March 2009, from http://www.hasil.org.my/english/eng_NO4_5_2.asp Inland Revenue Board 2001c, Public Rulings No. 4/2001 - 7/2001. Retrieved 7 March
2009, from http://www.hasil.org.my/english/eng_NO4_5_2.asp Inland Revenue Board 2002, Annual Report 2001, Inland Revenue Board of Malaysia. Inland Revenue Board 2003, Annual Report 2002, Inland Revenue Board of Malaysia. Inland Revenue Board 2004, Annual Report 2003, Inland Revenue Board of Malaysia. Inland Revenue Board 2005, Annual Report 2004, Inland Revenue Board of Malaysia. Inland Revenue Board 2007, Annual Report 2005, Inland Revenue Board of Malaysia.
257
Inland Revenue Board 2008a, Annual Report 2006, Inland Revenue Board of Malaysia. Inland Revenue Board 2008b, Guidelines on Advance Rulings, Inland Revenue Board
of Malaysia, Kuala Lumpur. http://www.hasil.org.my/english/pdf/Guide_LinesAR.pdf.
Inland Revenue Board 2008c, Public Ruling No. 1/2008 Retrieved 7 March 2009, from
http://www.hasil.org.my/english/pdf/PR012008.pdf International Monetary Fund 2009, World Economic Outlook, April 2009: Crisis and
Recovery. http://www.imf.org/external/pubs/ft/weo/2009/01/pdf/text.pdf. Jackson, BR & Milliron, VC 1986, 'Tax Compliance Research: Findings, Problems, and
Prospects', Journal of Accounting Literature, vol. 5, pp. 125-65. Johnston, KS 1963, Corporations' Federal Income Tax Compliance Costs: A Study of
Small, Medium-size, and Large Corporations, Bureau of Business Research, College of Commerce and Administration, Ohio State University, Columbus, Monograph 110.
Joulfaian, D 2000, 'Corporate Income Tax Evasion and Managerial Preferences', The
Review of Economics and Statistics, vol. 82, no. 4, pp. 698-701. Kamdar, N 1997, 'Corporate Income Tax Compliance: A Time Series Analysis',
Atlantic Economic Journal, vol. 25, no. 1, pp. 37-49. Kaplan, SE, Newberry, KJ & Reckers, PMJ 1997, 'The Effect of Moral Reasoning and
Educational Communications on Tax Evasion Intentions', The Journal of the American Taxation Association, vol. 19, no. 2, pp. 38-54.
Kasipillai, J 1997, Aspects of the Hidden Economy and Tax Non-compliance in
Malaysia, PhD Thesis, The University of New England. Kasipillai, J 1999, 'Overview of Malaysian Tax System: An Examination of Deliberate
Non-compliance', Akauntan Nasional, June, pp. 44-51. Kasipillai, J 2003, Malaysian Income Tax System: Policy Options and Considerations
for the Future, University Utara Malaysia Press, Sintok. Kasipillai, J 2005, A Comprehensive Guide to Malaysian Taxation: Current Year
Assessment, McGraw-Hill, Kuala Lumpur. Kasipillai, J & Abdul-Jabbar, H 2006, 'Gender and Ethnicity Differences in Tax
Compliance', Asian Academy of Management Journal, vol. 11, no. 2, pp. 75-90.

258
Kasipillai, J, Aripin, N & Amran, NA 2003, 'The Influence of Education on Tax Avoidance and Tax Evasion', eJournal of Tax Research, vol. 1, no. 2, pp. 134-46.
Kasipillai, J & Baldry, J 2004, 'Getting the GST Right', The Chartered Secretary,
November, pp. 18-20. Kasipillai, J, Baldry, J & Prasada-Rao, DS 2000, 'Estimating the Size and Determinants
of Hidden Income and Tax Evasion in Malaysia', Asian Review of Accounting, vol. 8, no. 2, pp. 25-41.
Kasipillai, J & Hanefah, M 2000, 'Tax Professionals' Views on Self Assessment
System', Analisis, vol. 7, no. 1 & 2, pp. 107-22. Kasipillai, J, Hanefah, M, Mat-Udin, N & Marimuthu, M 1999, 'Are Malaysian
Taxpayers' Prepared for the Self Assessment System?' Tax Nasional, September, pp. 9-17.
Kasipillai, J & Liew, R 2004, 'The Small and Medium Enterprise under a GST Regime',
Accountants Today, November. Kasipillai, J, Mat-Udin, N & Zainol-Arifin, Z 2003, 'How Do Moral Values Influence
Tax Compliance Behaviour? Findings from a Survey', The Chartered Secretary Malaysia, June, pp. 10-5.
Kauser, S, Chittenden, F, Poutziouris, P & Sloan, B 2005, 'Corporation Tax Self-
assessment Compliance Costs: Empirical Evidence from the UK', in C Gray & G Bannock (eds), Government Regulation and the Small Firm, Institute for Small Business and Entrepreneurship Milton Keynes, pp. 15-26.
Kerlinger, FN & Lee, HB 2000, Foundations of Behavioral Research, 4th edn, Harcourt
College Publishers, Orlando: FL. Kinsey, KA 1984, Survey Data on Tax Compliance: A Compendium and Review,
American Bar Association, Chicago, Taxpayer Compliance Project Working Paper 84-2.
Kirchler, E & Maciejovsky, B 2001, 'Tax Compliance within the Context of Gain and
Loss Situations, Expected and Current Asset Position, and Profession', Journal of Economic Psychology, vol. 22, no. 2, pp. 173-94.
Klepper, S & Nagin, D 1989, 'Tax Compliance and Perceptions of the Risks of
Detection and Criminal Prosecution', Law & Society Review, vol. 23, no. 2, pp. 209-40.

259
Klun, M 2004a, 'Compliance Costs for Personal Income Tax in a Transition Country: The Case of Slovenia', Fiscal Studies, vol. 25, no. 1, pp. 93-104.
Klun, M 2004b, 'Taxation Compliance Costs for Companies in Slovenia ', Economic
and Business Review for Central and South - Eastern Europe, vol. 6, no. 4, pp. 325-36.
KPMG 1996, Tax Simplification: A Survey of UK Listed Companies, KPMG, London,
cited in Evans (2003b). Krejcie, R & Morgan, D 1970, 'Determining Sample Size for Research Activities',
Educational and Psychological Measurement, vol. 30, pp. 607 - 10. Cited in Sekaran (2003, pp. 293-294).
Kreutzer, D & Lee, DR 1986, 'On Taxation & Understated Monopoly Profits', National
Tax Journal, vol. 39, no. 2, pp. 241-3. Kreutzer, D & Lee, DR 1988, 'Tax Evasion and Monopoly Output Decisions: A Reply',
National Tax Journal, vol. 41, no. 4, pp. 583-4. Lai, M-L, Sheikh-Obid, S-N & Meera, AK 2004, 'Towards an Electronic Filing System:
A Malaysian Survey', eJournal of Tax Research, vol. 2, no. 1, pp. 100-12. Lassila, D & Smith, M 1997, 'Tax Complexity and Compliance Costs of US
Multinational Corporations', Advances in International Accounting, vol. 10, pp. 207-37.
Lee, K 1998, 'Tax Evasion, Monopoly, and Nonneutral Profit Taxes', National Tax
Journal, vol. 51, no. 2, pp. 333-8. Lignier, P 2008, Identification and Evaluation of the Managerial Benefits Derived by
Small Businesses as a Result of Complying with the Australian Tax System, PhD Thesis, University of New South Wales.
Little, A 1988, Development of Methodology for Estimating the Taxpayer Paperwork
Burden, Washington D.C., Final report to the Department of the Treasury, Internal Revenue Service.
Loh, A, Ariff, M, Ismail, Z, Shamsher, M & Ali, M 1997, 'Compliance Costs of
Corporate Income Taxation in Malaysia, 1995', Pacific Accounting Review, vol. 9, no. 1, pp. 27-42.
Long, SB & Swingen, JA 1987, 'An Approach to the Measurement of Tax Law
Complexity', The Journal of the American Taxation Association, vol. 8, no. 2, pp. 22-36.
260
Long, SB & Swingen, JA 1991, 'Taxpayer Compliance: Setting New Agendas for Research', Law and Society Review, vol. 25, no. 3, pp. 637-84.
Loo, EC 2006a, 'Determinants of Individual Taxpayers' Compliance Behaviour:
Experience of the Transition from the Pre to Post Self Assessment in Malaysia', in M Walpole & M McKerchar (eds), Further Global Challenges in Tax Administration, Fiscal Publications, Birmingham, pp. 201-26.
Loo, EC 2006b, 'Tax Knowledge, Tax Structure and Compliance: A Report on a Quasi-
experiment', New Zealand Journal of Taxation Law and Policy, vol. 12, no. 2, pp. 117-40.
Loo, EC & Ho, JK 2005, 'Competency of Malaysian Salaried Individuals in Relation to
Tax Compliance under Self Assessment', eJournal of Tax Research, vol. 3, no. 1, pp. 47-64.
Malaysian Employers Federation 2007, Salary and Fringe Benefits Survey 2006,
Petaling Jaya. Mansor, M, Saad, N & Ibrahim, I 2003, 'The Self-assessment System and its
Compliance Costs', National Accounting Research Journal, vol. 2, no. 1, pp. 1-15.
Marrelli, M 1984, 'On Indirect Tax Evasion', Journal of Public Economics, vol. 25, pp.
181-96. Mason, R & Calvin, D 1978, 'A Study of Admitted Tax Evasion', Law & Society
Review, vol. 13, no. 1, pp. 73-89. Mason, R & Calvin, D 1984, 'Public Confidence and Admitted Tax Evasion', National
Tax Journal, vol. 37, no. 4, pp. 489-96. Mathieu, L, Waddams, C & Antwi, F 2007, 'The Distribution of UK Personal Income
Tax Compliance Costs', Applied Economics, vol. iFirst, no. 1, pp. 1-18. Retrieved 2 June 2008, from http://www.informaworld.com/10.1080/00036840701604370.
McKerchar, M 2002a, 'The Effects of Complexity on Unintentional Noncompliance for
Personal Taxpayers in Australia', Australian Tax Forum, vol. 17, no. 1, pp. 3-26. McKerchar, M 2002b, The Impact of Complexity upon Unintentional Noncompliance
for Australian Personal Income Taxpayers, PhD Thesis, University of New South Wales.
McKerchar, M 2005, 'The Impact of Income Tax Complexity on Practitioners in
Australia', Australian Tax Forum, vol. 20, no. 4, pp. 529-54.
261
McKerchar, M, Ingraham, L & Karlinsky, S 2005, 'Tax Complexity and Small
Business: A Comparison of the Perceptions of Tax Agents in the United States and Australia', Journal of Australian Taxation, vol. 8, no. 2, pp. 289-327.
McManus, J & Warren, N 2006, 'The Case for Measuring Tax Gap', eJournal of Tax
Research, vol. 4, no. 1, pp. 61-79. Miller, DC 1991, Handbook of Research Design and Social Measurement, 5th edn,
SAGE Publications, Newbury Park: CA. Mills, L 1996, 'Corporate Tax Compliance and Financial Reporting', National Tax
Journal, vol. 49, no. 3, pp. 421-35. Mills, L 1998, 'Book-tax Differences and Internal Revenue Service Adjustment',
Journal of Accounting Research, vol. 36, no. 2, pp. 343-56. Ministry of Finance Malaysia 1999, 'The 2000 Budget Speech', 29 October. Ministry of Finance Malaysia 2004, 'The 2005 Budget Speech', 10 September. Ministry of Finance Malaysia 2006a, 'The 2007 Budget Speech', 1 September. Ministry of Finance Malaysia 2006b, 'GST Postponement', Media Release, 22 February. Ministry of Finance Malaysia 2008, 'The 2009 Budget Speech', 29 August. Mintz, JM & Weichenrieder, A 2007, 'The Indirect Side of Direct Investment:
Multinational Company Finance and Taxation', in Manuscript prepared for the CESifo Series at MIT Press. Cambridge MA, Corporate tax rates have been taken from Appendix, available at http://www.wiwi.uni-frankfurt.de/profs/weichenrieder/2009_Appendix_tax-rates.pdf.
Moody, JS, Warcholik, PW & Hodge, AS 2005, The Rising Costs of Complying with
the Federal Income Tax, Tax Foundation, Washington, Special Report No. 138. Myers, RH 1990, Classical and Modern Regression with Applications, 2 edn, PWS-
KENT, Boston. National Audit Office 1994, HM Customs and Excise: Cost to Business of Complying
with VAT Requirements, Her Majesty Stationery Office, London. National SME Development Council 2005, Definition for Small and Medium
Enterprises in Malaysia, Bank Negara Malaysia, Kuala Lumpur.
262
National SME Development Council 2006, Small and Medium Enterprise (SME) Annual Report 2005, Bank Negara Malaysia, Kuala Lumpur.
National SME Development Council 2008, Small and Medium Enterprise (SME)
Annual Report 2007, Bank Negara Malaysia, Kuala Lumpur. Nelson, M, Elliott, J & Tarpley, R 2002, 'Evidence from Auditors about Managers’ and
Auditors’ Earnings Management Decisions', The Accounting Review, vol. 77, no. supplement, pp. 175-202.
Nunnally, J 1978, Psychometric Theory, McGraw-Hill, New York. O'Donnell Report 2004, Financing Britain's Future: Review of the Revenue
Departments, HM Treasury, UK, cm 6163. OECD 2004, Compliance Risk Management: Managing and Improving Tax
Compliance, Centre for Tax Policy and Administration. Ong, W & Imm, L 2007, 'Taxation of Small and Medium Enterprises (SMEs) in
Singapore', in ITD Global Conference on Taxation of Small and Medium Enterprises, Buenos Aires, Argentina, 17–19 October.
Osman, I & Hashim, MK 2003, 'An Evaluation of the Business Practices in Malaysian
SMEs', Malaysian Management Review, vol. 38, no. 2, available at http://mgv.mim.edu.my/MMR/0312/031202.htm.
Othman, Z & Hanefah, M 2006, 'Taxation, E-commerce and Determination of
Permanent Establishment', Malaysian Accounting Review, vol. 5, no. 2, pp. 1-12. Palil, R 2004, 'The Effect of E-commerce on Malaysian Tax System: An Empirical
Evidence from Academicians and Malaysian Tax Practitioners', Jurnal Akuntansi & Keuangan, vol. 6, no. 1, pp. 1-9.
Palil, R 2005a, 'Does Tax Knowledge Matters in Self-assessment Systems? Evidence
from Malaysian Tax Administrative', The Journal of American Academy of Business, Cambridge, vol. 6, no. 2, pp. 80-4.
Palil, R 2005b, 'Taxpayers Knowledge: A Descriptive Evidence on Demographic
Factors in Malaysia', Jurnal Akuntansi & Keuangan, vol. 7, no. 1, pp. 11-21. Plamondon and Associates Inc 1993, GST Compliance Costs for Small Business in
Canada: A Study for the Department of Finance Tax Policy, Department of Finance, Ottawa.
Pope, J 1993a, The Compliance Costs of Major Commonwealth Taxes in Australia, PhD
Thesis, Curtin University of Technology.

263
Pope, J 1993b, 'The Compliance Costs of Taxation in Australia and Tax Simplification:
The Issues', Australian Journal of Management, vol. 18, no. 1, pp. 69-89. Pope, J 1994, 'Compliance Costs of Taxation: Policy Implications', Australian Tax
Forum, vol. 11, no. 1, pp. 85-121. Pope, J 1995, 'The Compliance Costs of Major Taxes in Australia', in C Sandford (ed.),
Tax Compliance Costs Measurements and Policy, Fiscal Publications, Bath: UK, pp. 101-25.
Pope, J 2000, The Administrative and Compliance Costs of International Taxation: An
Introduction for Research Students, Curtin Business School, Perth, Working Paper 2000.42.
Pope, J 2003, 'Research Methodology for Estimating the Compliance Costs of the
Goods and Services Tax in Australia', in A Lymer & D Salter (eds), Contemporary Issues in Taxation Research, Ashgate Publishing, Aldershot, pp. 69-86.
Pope, J 2005, 'Tax Compliance Costs', in M Lamb, A Lymer, J Freedman & S James
(eds), Taxation: An Interdisciplinary Approach to Research, Oxford University Press, Oxford, UK, pp. 203-16.
Pope, J 2007, 'Taxation Compliance Costs', in P O'Hara (ed.), International
Encyclopedia of Public Policy, vol. 2, Global Political Economy Research Unit (GPERU), Perth, pp. 521-34.
Pope, J 2008, 'Favourable Small Business Taxation: To What Extent is it Justified from
a Tax Policy Perspective?' Journal of Applied Law and Policy, vol. 1, no. 1, pp. 21-34.
Pope, J & Abdul-Jabbar, H 2007, 'Tax Simplicity and Small Business in Malaysia: Past
Developments and the Future', in 19th Annual Conference of Australasian Tax Teachers Association, Brisbane, 22- 24 January.
Pope, J & Abdul-Jabbar, H 2008, 'Small and Medium-sized Enterprises and Tax
Compliance Burden in Malaysia: Issues and Challenges for Tax Administration', Small Enterprise Research: The Journal of SEAANZ, vol. 16, no. 1, pp. 47-60.
Pope, J, Fayle, R & Chen, DL 1991, The Compliance Costs of Public Companies'
Income Taxation in Australia, 1986/87, Australian Tax Research Foundation, Sydney, Research Study No. 13.
Pope, J, Fayle, R & Chen, DL 1993a, The Compliance Costs of Employment Related
Taxation in Australia, Australian Tax Research Foundation, Sydney.

264
Pope, J, Fayle, R & Chen, DL 1993b, The Compliance Costs of Wholesale Sales Tax in
Australia, Australian Tax Research Foundation, Sydney, Research Study No 19. Pope, J, Fayle, R & Chen, DL 1994, The Compliance Costs of Companies’ Income Tax
in Australia, Australian Tax Research Foundation, Sydney, Research Study No 23.
Pope, J, Fayle, R & Duncanson, M 1990, The Compliance Costs of Personal Income
Taxation in Australia, 1986/87, Australian Tax Research Foundation, Sydney, Research Study No 9.
Pope, J & Mohd Isa, K 2009, 'Tax Audit Programs: What can Malaysia Learn from
Other Countries?' 21st Australasian Tax Teachers Association Conference, Christchurch.
Porcano, TM 1988, 'Correlates of Tax Evasion', Journal of Economic Psychology, vol.
9, no. 1, pp. 47-67. Promotion of Investments Act (Act 327) 1986, International Law Book Services,
Petaling Jaya. Pyle, DJ 1989, Tax Evasion and the Black Economy, Macmillan, Houndmills: UK. Ramasamy, M, Thurasamy, R, Haron, H & Ang, J 2003, 'Factors Influencing
Compliance Behaviour of Small Business Entrepreneurs', Tax Nasional, vol. 12, no. 1, pp. 20-6.
Rametse, N 2006, Start-up Compliance Costs of the Goods and Services Tax (GST) for
Small Businesses in Australia, PhD Thesis, Curtin University of Technology. Rametse, N & Pope, J 2002, 'Start-up Tax Compliance Costs of the GST: Empirical
Evidence from Western Australian Small Businesses', Australian Tax Forum, vol. 17, no. 4, pp. 407-22.
Reckers, PMJ, Sanders, DL & Roark, SJ 1994, 'The Influence of Ethical Attitudes on
Taxpayer Compliance', National Tax Journal, vol. 47, no. 4, pp. 825-6. Rice, EM 1992, 'The Corporate Tax Gap: Evidence on Tax Compliance by Small
Corporations', in J Slemrod (ed.), Why People Pay Taxes: Tax Compliance and Enforcement, The University of Michigan Press, Ann Arbor, pp. 125-66.
Richardson, G 2005, 'A Preliminary Study of the Impact of Tax Fairness Dimensions on
Tax Compliance Behaviour in Australia', Australian Tax Forum, vol. 20, no. 3, pp. 407-34.

265
Richardson, G 2006, 'Determinants of Tax Evasion: A Cross-country Investigation', Journal of International Accounting, Auditing and Taxation, vol. 15, no. 2, pp. 150-69.
Richardson, M & Sawyer, A 2001, 'A Taxonomy of the Tax Compliance Literature:
Further Findings, Problems and Prospects', Australian Tax Forum, vol. 16, pp. 137-320.
Rimmer, S & Wilson, S 1996, Compliance Costs of Taxation in Australia, Office of
Regulation Review, Productivity Commission, Canberra, Staff Information Paper.
Roberts, ML 1994, 'An Experimental Approach to Changing Taxpayers' Attitudes
towards Fairness and Compliance via Television ', The Journal of The American Taxation Association, vol. 16, no. 1, pp. 67-86.
Roscoe, JT 1975, Fundamental Research Statistics for the Behavioural Sciences, 2 edn,
Holt, Rinehart and Winston, New York, Cited in Sekaran (2003, p. 295). Roth, JA, Scholz, JT & Witte, AD 1989, Taxpayer Compliance: An Agenda for
Research, University of Pennsylvania, Philadelphia. Sandford, C 1973, Hidden Costs of Taxation, Institute for Fiscal Studies, Bath: UK. Sandford, C 1993, Successful Tax Reform: Lessons from an Analysis of Tax Reform in
Six Countries, Fiscal Publication, Bath: U.K. Sandford, C (ed.) 1995, Tax Compliance Costs Measurement and Policy, Fiscal
Publications, Bath: U.K. Sandford, C, Godwin, M & Hardwick, P 1989, Administrative and Compliance Costs of
Taxation, Fiscal Publication, Bath: U.K. Sandford, C, Godwin, M, Hardwick, P & Butterworth, M 1981, Costs and Benefits of
VAT, Heinemann, London. Sandford, C & Hasseldine, J 1992, The Compliance Costs of Business Taxes in New
Zealand, The Institute of Policy Studies, Wellington. Sapiei, N-S & Abdullah, M 2008, 'The Compliance Costs of the Personal Income
Taxation in Malaysia', International Review of Business Research Papers, vol. 4, no. 5, pp. 2219-30.
SBP 2005, Counting the Costs of Red Tape for Business in South Africa, SBP,
Johannesburg.

266
Sekaran, U 2003, Research Methods for Business: A Skill-building Approach, 4th edn, John Wiley & Sons, Inc, New York.
Sia, G-F 2008, Tax Compliance Behaviour of Individuals under Self Assessment System,
PhD Thesis, University Putra Malaysia. Sia, G-F, Salleh, A, Sambasivan, M & Kasipillai, J 2008, 'Determinants of Individual
Tax Compliance: A Comparative Study on Compliant and Non-compliant Taxpayers', 20th Australian Taxation Teachers’ Association Conference, Hobart.
Singh, V 2002, 'Issues relating to Self-assessment', in M Ariff & J Pope (eds), Taxation
& Compliance Costs in Asia Pacific Economies University Utara Malaysia Press, Sintok, pp. 269-77.
Singh, V 2003, Tax Compliance and Ethical Decision-making: A Malaysian
Perspective, Pearson Malaysia, Petaling Jaya. Singh, V 2007, 'A Fluid Undertaking', in Malaysian Business, 1 July. Singh, V 2008, 'Tax Reforms, Simplification and Service Delivery Initiatives - A South-
East Asian Perspective', Asia-Pacific Tax Bulletin, vol. 14, no. 1, pp. 15-22. Slemrod, J 1992, 'Did the Tax Reform Act of 1986 Simplify Tax Matters', Journal of
Economic Perspectives, vol. 6, no. 1, pp. 45-57. Slemrod, J 1997, Measuring Taxpayer Burden and Attitudes for Large Corporations:
1996 and 1992 Survey Results, Office of Tax Policy Research, Michigan, Report to the Coordinated Examination Program of the Internal Revenue Service, Working Paper No. 97-1.
Slemrod, J 2004a, 'Small Business and the Tax System', in HJ Aaron & J Slemrod (eds),
The Crisis in Tax Administration, Brookings Institution Press, Washington, D.C, pp. 69-123.
Slemrod, J 2004b, 'Written Testimony Submitted to the Committee on Ways and Means
'. Subcommittee on Oversight, Hearing on Tax Simplification, Washington D.C, 15 June.
Slemrod, J & Blumenthal, M 1996, 'The Income Tax Compliance Cost of Big Business',
Public Finance Quarterly, vol. 24, no. 4, pp. 411-38. Slemrod, J & Sorum, N 1984, 'The Compliance Cost of the US Individual Income Tax
System', National Tax Journal, vol. 37, no. 4, pp. 461-74.
267
Slemrod, J & Venkatesh, V 2002, The Income Tax Compliance Cost of Large and Mid-size Businesses, Ross School of Business Working Paper Series, University of Michigan, Working Paper No. 914.
Small Business Deregulation Task Force 1996, Time for Business: Report of the Small
Business Deregulation Task Force, Commonwealth of Australia, Canberra. Song, Y-d & Yarbrough, T 1978, 'Tax Ethics and Taxpayer Attitudes: A Survey', Public
Administration Review, vol. 38, pp. 442-52. Tan, G 1993, 'The Next NICs of Asia', Third World Quarterly, vol. 14, no. 1, pp. 57-73. Tan, LM & Chin-Fatt, C 2000, 'The Impact of Tax Knowledge on the Perceptions of
Tax Fairness and Attitudes towards Compliance', Asian Review of Accounting, vol. 8, no. 1, pp. 44-58.
Tayib, M 1998, The Determinants of Assessment Tax Collection: The Malaysian Local
Authority Experience, PhD Thesis, University of Glamorgan. The Australian Treasury 2004a, Report on Aspects of Income Tax Self Assessment,
Commonwealth of Australia, Canberra. The Australian Treasury 2004b, Review of Aspects of Income Tax Self Assessment,
Commonwealth of Australia, Canberra, Discussion Paper. The Special Taskforce to Facilitate Business 2008, Annual Report 2007, PEMUDAH,
Kuala Lumpur. The Special Taskforce to Facilitate Business 2009, Annual Report 2008, PEMUDAH,
Kuala Lumpur. Torgler, B 2007, Tax Compliance and Tax Morale: A Theoretical and Empirical
Analysis, Edward Elgar Publishing Limited, Cheltenham: UK. Tran-Nam, B 1999, 'Tax Reform and Tax Simplification: Some Conceptual Issues and a
Preliminary Assessment', Sydney Law Review, vol. 21, no. 3, pp. 500-22. Tran-Nam, B 2000, 'The Implementation of the GST in Australia: Concepts,
Preliminary Estimates and Implications', Journal of Australian Taxation, vol. 3, no. 5, pp. 331-43.
Tran-Nam, B 2001, 'Tax Compliance Costs Methodology: A Research Agenda for the
Future', in C Evans, J Pope & J Hasseldine (eds), Tax Compliance Costs: A Festschrift for Cedric Sandford, Prospect Media Pty Ltd, Sydney, pp. 51-68.

268
Tran-Nam, B & Evans, C 2002, 'The Impact of Cedric Sandford on the Discipline of Tax Compliance Costs', Australian Tax Forum, vol. 17, no. 4, pp. 389-406.
Tran-Nam, B & Glover, J 2002a, 'Estimating the Transitional Costs of the GST in
Australia: A Case Study Approach', Australian Tax Forum, vol. 17, no. 4, pp. 499-536.
Tran-Nam, B & Glover, J 2002b, 'Tax Reform in Australia: Impacts of Tax Compliance
Costs on Small Business', Journal of Australian Taxation, vol. 5, no. 3, pp. 338-81.
Tran-Nam, B & Karlinsky, S 2008, 'Small Business Tax Law Complexity in Australia',
in M Walpole & C Evans (eds), Tax Administration: Safe Harbours and New Horizons, Fiscal Publications, Birmingham, pp. 321-48.
Treasury of Malaysia 1999, 'Economy Report 1999/2000'. Ministry of Finance. Treasury of Malaysia 2000, 'Economy Report 2000/2001'. Ministry of Finance. Treasury of Malaysia 2001, 'Economy Report 2001/2002'. Ministry of Finance. Treasury of Malaysia 2002, 'Economy Report 2002/2003'. Ministry of Finance. Treasury of Malaysia 2003, 'Economy Report 2003/2004'. Ministry of Finance. Treasury of Malaysia 2004, 'Economy Report 2004/2005'. Ministry of Finance. Treasury of Malaysia 2005, 'Economy Report 2005/2006'. Ministry of Finance. Treasury of Malaysia 2006, 'Economic Report 2006/2007'. Ministry of Finance. Treasury of Malaysia 2007, 'Economic Report 2007/2008'. Ministry of Finance. Treasury of Malaysia 2008, 'Economic Report 2008/2009'. Ministry of Finance. Vaillancourt, F 1989, The Administrative and Compliance Costs of the Personal Income
Tax and Payroll Tax System in Canada, 1986, Canadian Tax Foundation, Ontario.
Vaillancourt, F & Clemens, J 2008, 'Compliance and Administrative Costs of Taxation
in Canada', in J Clemens (ed.), The Impact and Cost of Taxation in Canada: The Case for Flat Tax Reform, The Fraser Institute, Vancouver, pp. 55-102.
Violette, G 1989, 'Effects of Communicating Sanctions on Taxpayer Compliance', The
Journal of the American Taxation Association, vol. 11, no. 1, pp. 92-104.

269
Wallace, O & Mellor, C 1988, 'Nonresponse Bias in Mail Accounting Surveys: A Pedagogical Note', British Accounting Review, vol. 20, pp. 131-9.
Wallschutzky, I 1984, 'Possible Causes of Tax Evasion', Journal of Economic
Psychology, vol. 5, no. 4, pp. 371-84. Wallschutzky, I & Gibson, B 1993, 'Small Business Cost of Compliance ', Australian
Tax Forum, vol. 10, no. 4, pp. 511-43. Wang, LFS & Conant, JL 1988, 'Corporate Tax Evasion and Output Decisions of the
Uncertain Monopolist', National Tax Journal, vol. 41, no. 4, pp. 579-81. Wartick, M 1994, 'Legislative Justification and the Perceived Fairness of Tax Law
Changes: A Referent Cognitions Theory Approach', The Journal of the American Taxation Association, vol. 16, no. 2, pp. 106-23.
Webley, P, Cole, M & Eidjar, O-P 2001, 'The Prediction of Self-reported and
Hypothetical Tax-evasion: Evidence from England, France and Norway', Journal of Economic Psychology, vol. 22, no. 2, pp. 141-55.
Webley, P, Robben, HJ, Elffers, H & Hessing, DJ 1991, Tax Evasion: An Experimental
Approach, Cambridge University Press, Cambridge. Weigel, RH, Hessing, DJ & Elffers, H 1987, 'Tax Evasion Research: A Critical
Appraisal and Theoretical Model', Journal of Economic Psychology, vol. 8, no. 2, pp. 215-35.
Wenzel, M 2002, 'The Impact of Outcome Orientation and Justice Concern on Tax
Compliance: The Role of Taxpayers' Identity', Journal of Applied Psychology, vol. 87, no. 4, pp. 629-45.
Wenzel, M 2005a, 'Misperceptions of Social Norms about Tax Compliance: From
Theory to Intervention', Journal of Economic Psychology, vol. 26, no. 6, pp. 862-83.
Wenzel, M 2005b, 'Motivation or Rationalisation? Causal Relations between Ethics,
Norms and Tax Compliance', Journal of Economic Psychology, vol. 26, no. 4, pp. 491-508.
Yesegat, WA 2009, Value Added Tax in Ethiopia: A Study of Operating Costs and
Compliance, PhD Thesis, University of New South Wales. "Every reasonable effort has been made to acknowledge the owners of copyright material. I would be pleased to hear from any copyright owner who has been omitted or incorrectly acknowledged."

APPENDIX A
Definitions for Small and Medium Enterprises in Malaysia

270
271

272
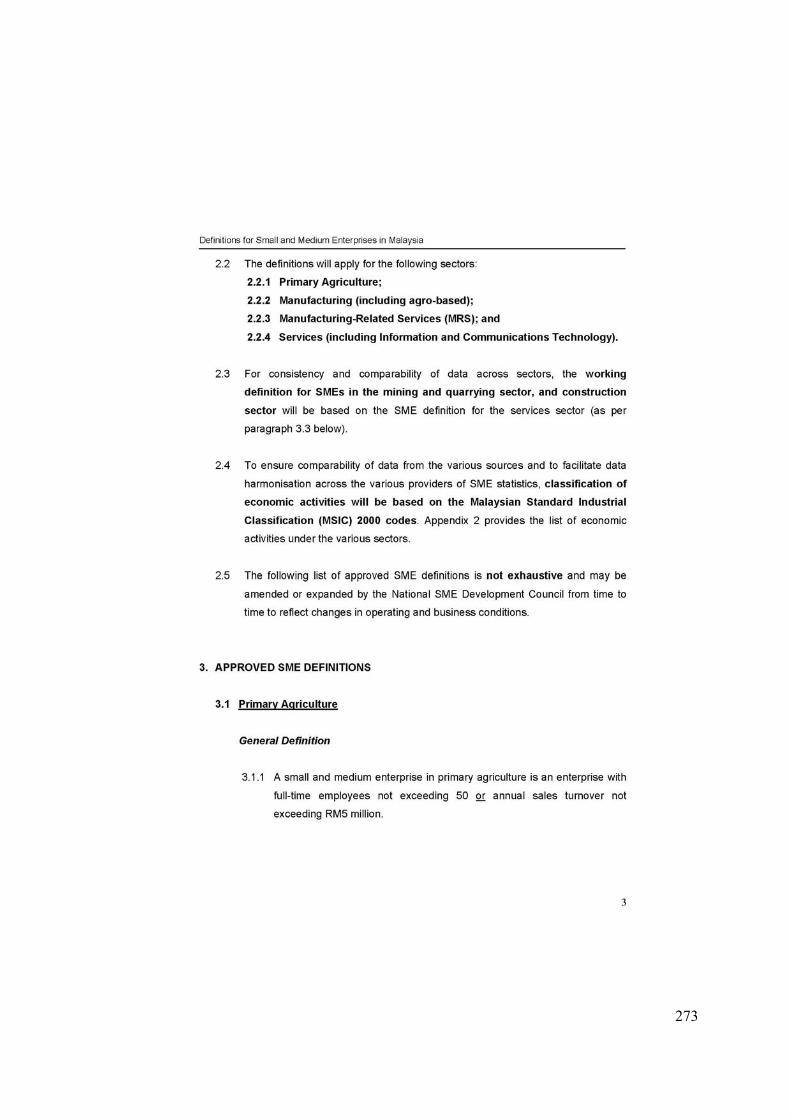
273

274

275

276
277

278

279

280
281
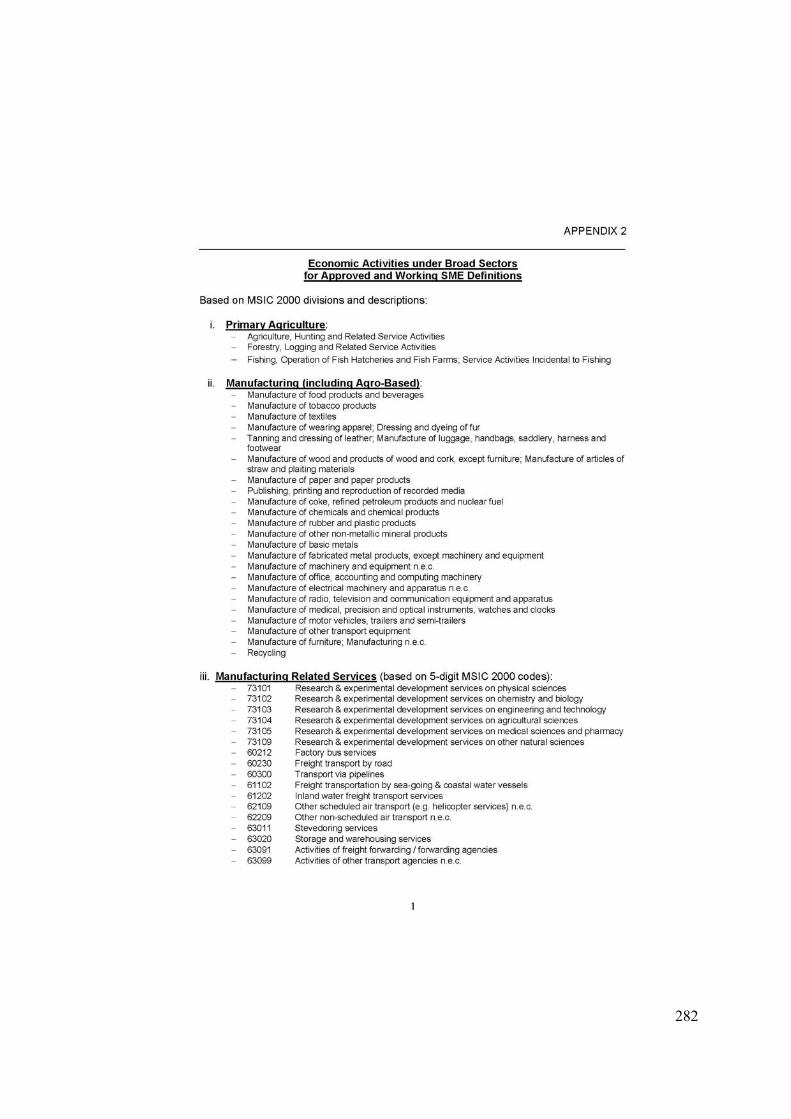
282
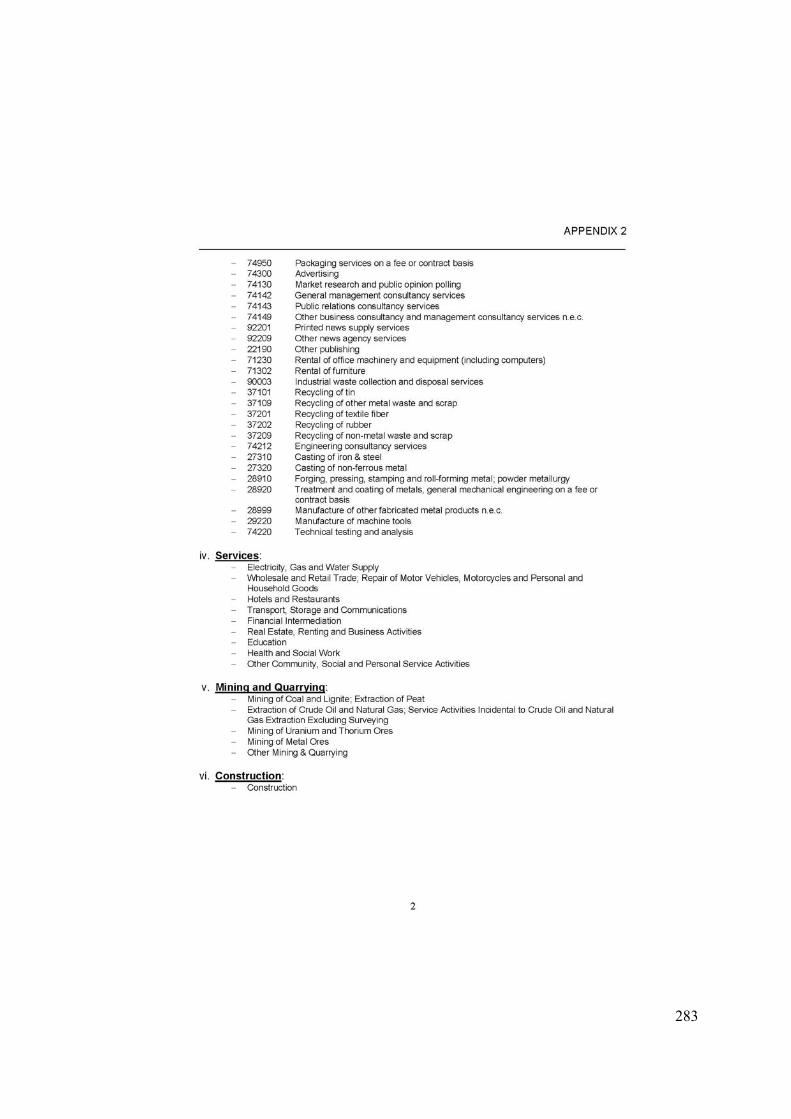
283
APPENDIX B
Summary of Tax Compliance Studies in Malaysia 1994–2008

284
Summary of Tax Compliance Studies in Malaysia 1994–2008
Authors(s); (year)
Subject(s) Method Sample size (sampling method)
Response number (and/or Rate)
Main outcomes (relevant to compliance behaviour)
Che-Ayub (1994)
(i) Tax officers (ii) Tax agents
Survey (mail questionnaire)
(i) 358 (ii) 359 (random)
(i) 307 (85.7%) (ii) 124 (35.0%)
- Tax officers believed tax evasion occurs due to taxpayer attitudes or there is an opportunity for non-compliance
- Tax agents alleged that taxpayers’ lack the ability to comply.
- Tax administrative reform shall be in place to enhance voluntary compliance.
Hanefah (1996)
Individuals
(including business) Survey (personally administered)
300 (stratified)
248 (82.7%) - Malaysian tax administrative system was generally seen as efficient and productive
- Tax law was perceived to be not fair and tax complexity existed.
- Some knowledge and understanding of the tax system would enhance compliance.
- The compliance costs of owner-manager taxpayers are higher than other individual taxpayers.
Kasipillai (1997)
(i) Tax professionals
(ii) Individuals
(i) Survey (mail) (ii) Survey (personally administered)
(i) 80 (convenient) (ii)150 (convenient)
(i) 60 (75%) (ii) 120 (80%)
- Tax evasion was estimated for an average of 20 percent of income tax collection for the period 1971 to 1994.
- Taxpayers generally have a reasonable level of understanding of many aspects of the tax laws.
- Knowledge differences are noted for some group of taxpayers; taxpayers with low education levels and unskilled occupations groups have a relatively low score on tax knowledge.
- Top five sectors generating hidden income were construction sector, professions (doctors, engineers, etc), cuts and kickbacks on contracts, multinational companies and restaurants.
Tayib (1998)b
Individuals
(land taxpayer) Survey (mail) 324
(not reported) 305 (94%) - Financial information disclosure influenced
compliance attitudes.

285
Author(s); (year)
Subject(s) Method Sample size (sampling method)
Response number (and/or Rate)
Main outcomes (relevant to compliance behaviour)
Kasipillai et al. (1999)
Individuals (including business)
Survey (mail) 900 (random)
153 (17%) 147 (16.4%)
- Respondents are able to compute their own taxes provided that minimal guidance is given by the Inland Revenue Board.
Singh (2003)
Accountants Survey (mail) 180 (purposive)
119 (66.1%) [useable 103/62.8%]
- Moral reasoning does play a significant role in the tax compliance decision making process.
- Size of tax deductions is a major explanatory variable in the tax compliance decision making process.
Abdul (2003)
(i) Individuals (including
business)
(ii) Tax officers
(i) File review (ii) Survey (interview)
(i) 507 file (relevant file) (ii) 60 officers (purposive)
(i) 507 file (ii) 60 officers
- Four types of non-compliance were evident, i.e. fail to declare income, under-declaring income, over-claiming deductions and over-claiming expenses.
- Non-compliance is severe in older persons, males with high taxable income levels and those who received non-salary income.
- Tax officers believed that taxpayers’ intention, role of tax agents, taxpayers’ ignorance of tax law and financial strain were the main reason of non-compliance
Kasipillai, Aripin and Amran (2003)
Individuals (Students)
Survey (administered in class)
Stage 1 - 560 Stage 2 390 560 (convenience)
Stage 1 553 (98.8%) Stage 2 551 (98.4%)
- A positive relationship exists between tax knowledge and tax compliance
- Significant perceptions existed in terms of ethnic groups.
Ramasamy et al. (2003)
Individuals (Small business entrepreneurs)
Survey (interview) 500 (non-random)
312 (62.4%) - Attitudes towards others’ compliance and fairness positively related to compliance behaviour.
- Tax knowledge and attitudes towards effectiveness of the IRB has no relationship to compliance behaviour.
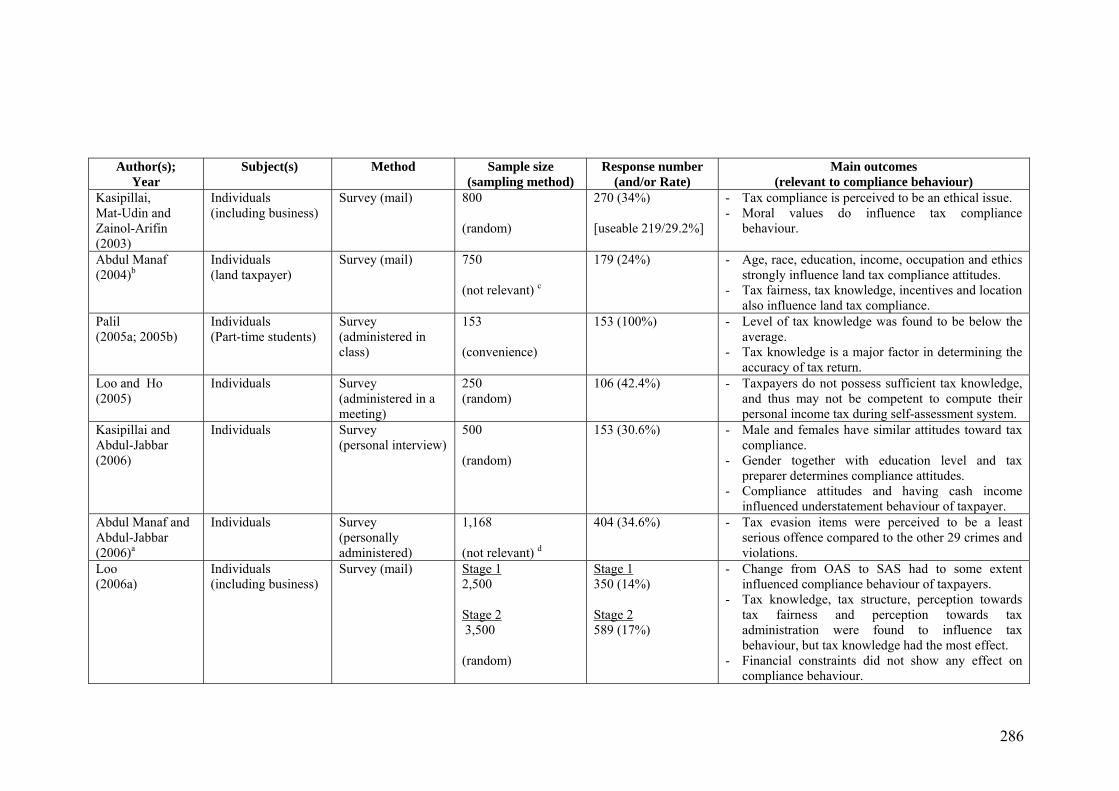
286
Author(s); Year
Subject(s) Method Sample size (sampling method)
Response number (and/or Rate)
Main outcomes (relevant to compliance behaviour)
Kasipillai, Mat-Udin and Zainol-Arifin (2003)
Individuals (including business)
Survey (mail) 800 (random)
270 (34%) [useable 219/29.2%]
- Tax compliance is perceived to be an ethical issue. - Moral values do influence tax compliance
behaviour.
Abdul Manaf (2004)b
Individuals
(land taxpayer) Survey (mail) 750
(not relevant) c
179 (24%) - Age, race, education, income, occupation and ethics strongly influence land tax compliance attitudes.
- Tax fairness, tax knowledge, incentives and location also influence land tax compliance.
Palil (2005a; 2005b)
Individuals (Part-time students)
Survey (administered in class)
153 (convenience)
153 (100%) - Level of tax knowledge was found to be below the average.
- Tax knowledge is a major factor in determining the accuracy of tax return.
Loo and Ho (2005)
Individuals Survey (administered in a meeting)
250 (random)
106 (42.4%) - Taxpayers do not possess sufficient tax knowledge, and thus may not be competent to compute their personal income tax during self-assessment system.
Kasipillai and Abdul-Jabbar (2006)
Individuals Survey (personal interview)
500 (random)
153 (30.6%) - Male and females have similar attitudes toward tax compliance.
- Gender together with education level and tax preparer determines compliance attitudes.
- Compliance attitudes and having cash income influenced understatement behaviour of taxpayer.
Abdul Manaf and Abdul-Jabbar (2006)a
Individuals Survey (personally administered)
1,168 (not relevant) d
404 (34.6%) - Tax evasion items were perceived to be a least serious offence compared to the other 29 crimes and violations.
Loo (2006a)
Individuals (including business)
Survey (mail) Stage 1 2,500 Stage 2 3,500 (random)
Stage 1 350 (14%) Stage 2 589 (17%)
- Change from OAS to SAS had to some extent influenced compliance behaviour of taxpayers.
- Tax knowledge, tax structure, perception towards tax fairness and perception towards tax administration were found to influence tax behaviour, but tax knowledge had the most effect.
- Financial constraints did not show any effect on compliance behaviour.

287
Author(s); year
Subject(s) Method Sample size (sampling method)
Response number (and/or Rate)
Main outcomes (relevant to compliance behaviour)
Loo (2006b) Individuals (students)
Experimental 125 (not reported)
125 - Specific tax knowledge had an influence on tax behaviour of participants.
- Audit rates and tax rates had significant interactions with tax knowledge of the participant.
Ahmad, Hanefah and Mohd Noor (2007)
Individuals (students)
Experimental Experimental group 42 (quota) Control group 46 (stratified random)
41 44
- Tax knowledge had influence on tax compliance behaviour of subjects.
- Subjects with tax knowledge had better compliance behaviour.
Sia et al. (2008)
Individuals (including business)
Survey (mail) 2,500 (not reported)
247 (9.9%) - Compliant and non-compliant taxpayers had similar perceptions toward tax fairness, tax morals and peer influence.
Che Azmi and Perumal (2008)
Individuals (including business)
Survey (administered in the IRB office)
500 (convenience)
390 (78%) - Tax system was perceived to be moderately fair. - Tax fairness is distinguished in three dimensions:
general fairness, tax rate structure and self interest. a The main focus of study is tax evasion. b The study focuses on local government taxes. c All individuals with a complete mailing address from the list of land taxpayers were chosen. d All individuals in the selected organisation were chosen.

APPENDIX C
Other Tax Studies (not compliance-related) in Malaysia
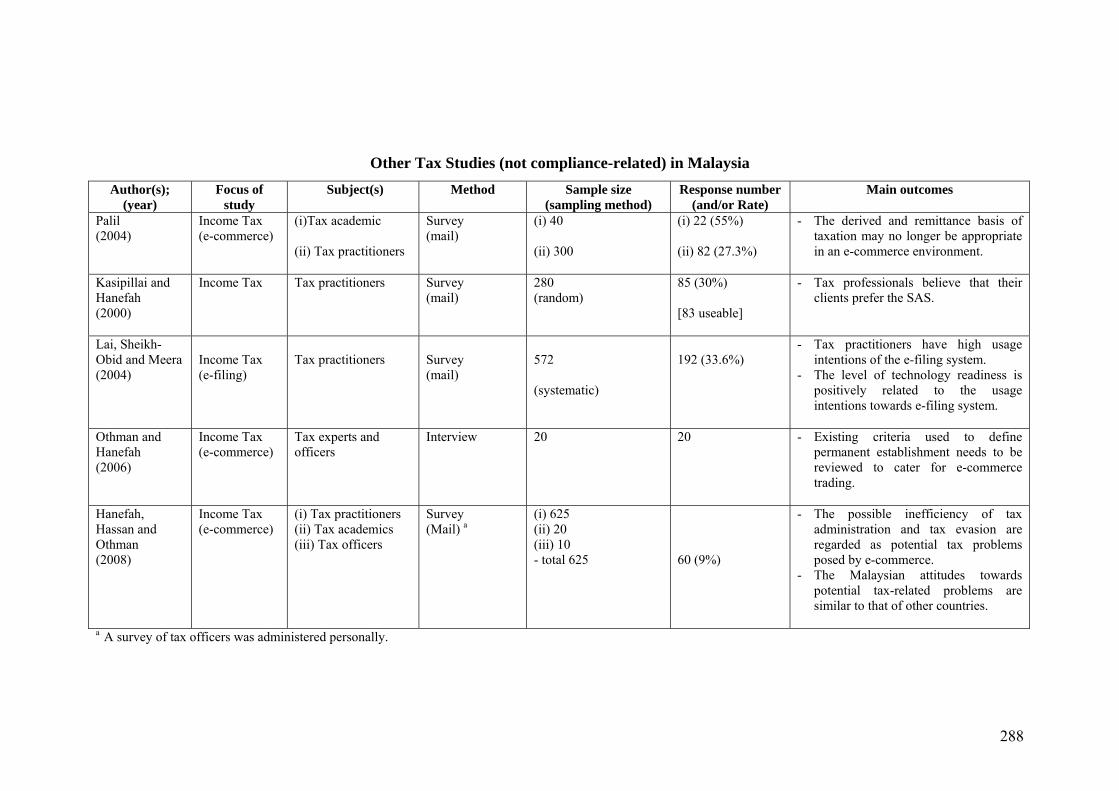
288
Other Tax Studies (not compliance-related) in Malaysia
Author(s); (year)
Focus of study
Subject(s) Method Sample size (sampling method)
Response number (and/or Rate)
Main outcomes
Palil (2004)
Income Tax (e-commerce)
(i)Tax academic (ii) Tax practitioners
Survey (mail)
(i) 40 (ii) 300
(i) 22 (55%) (ii) 82 (27.3%)
- The derived and remittance basis of taxation may no longer be appropriate in an e-commerce environment.
Kasipillai and Hanefah (2000)
Income Tax Tax practitioners Survey (mail)
280 (random)
85 (30%) [83 useable]
- Tax professionals believe that their clients prefer the SAS.
Lai, Sheikh-Obid and Meera (2004)
Income Tax (e-filing)
Tax practitioners
Survey (mail)
572 (systematic)
192 (33.6%)
- Tax practitioners have high usage intentions of the e-filing system.
- The level of technology readiness is positively related to the usage intentions towards e-filing system.
Othman and Hanefah (2006)
Income Tax (e-commerce)
Tax experts and officers
Interview 20 20 - Existing criteria used to define permanent establishment needs to be reviewed to cater for e-commerce trading.
Hanefah, Hassan and Othman (2008)
Income Tax (e-commerce)
(i) Tax practitioners (ii) Tax academics (iii) Tax officers
Survey (Mail) a
(i) 625 (ii) 20 (iii) 10 - total 625
60 (9%)
- The possible inefficiency of tax administration and tax evasion are regarded as potential tax problems posed by e-commerce.
- The Malaysian attitudes towards potential tax-related problems are similar to that of other countries.
a A survey of tax officers was administered personally.
APPENDIX D
Summary of Major Compliance Costs Studies on Corporate Income Taxation
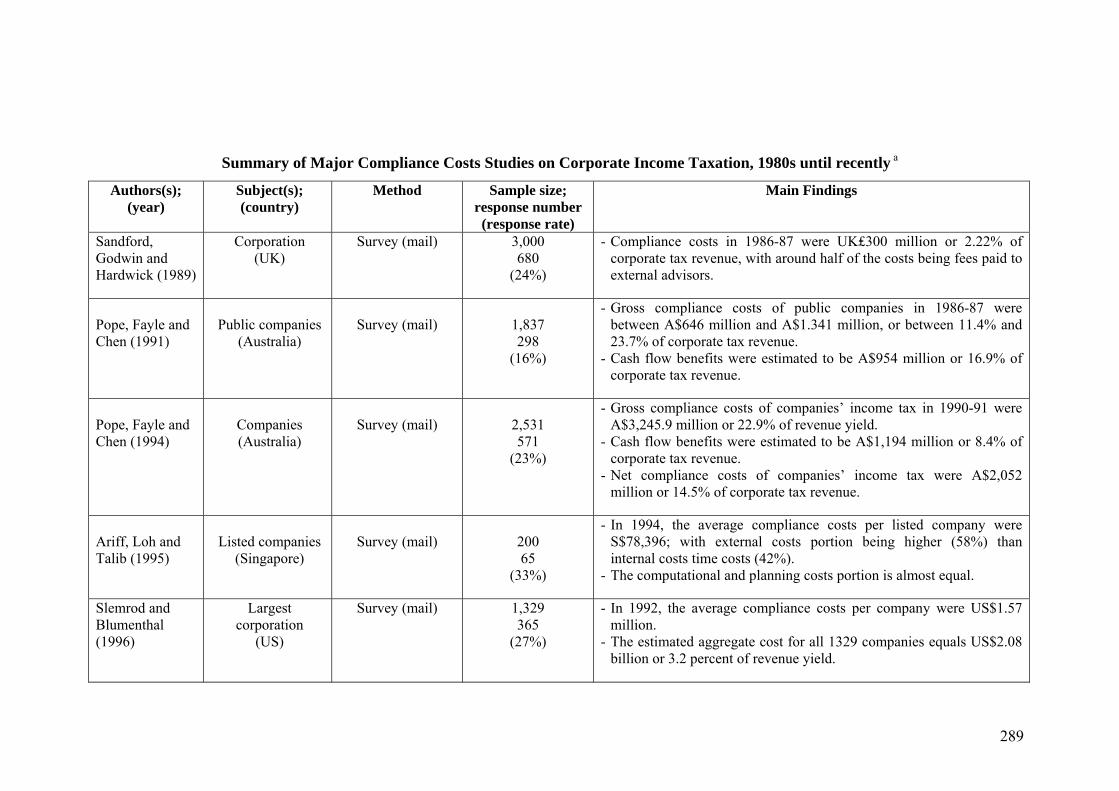
289
Summary of Major Compliance Costs Studies on Corporate Income Taxation, 1980s until recently a
Authors(s); (year)
Subject(s); (country)
Method Sample size; response number (response rate)
Main Findings
Sandford, Godwin and Hardwick (1989)
Corporation (UK)
Survey (mail) 3,000 680
(24%)
- Compliance costs in 1986-87 were UK₤300 million or 2.22% of corporate tax revenue, with around half of the costs being fees paid to external advisors.
Pope, Fayle and Chen (1991)
Public companies
(Australia)
Survey (mail)
1,837 298
(16%)
- Gross compliance costs of public companies in 1986-87 were between A$646 million and A$1.341 million, or between 11.4% and 23.7% of corporate tax revenue.
- Cash flow benefits were estimated to be A$954 million or 16.9% of corporate tax revenue.
Pope, Fayle and Chen (1994)
Companies (Australia)
Survey (mail)
2,531 571
(23%)
- Gross compliance costs of companies’ income tax in 1990-91 were A$3,245.9 million or 22.9% of revenue yield.
- Cash flow benefits were estimated to be A$1,194 million or 8.4% of corporate tax revenue.
- Net compliance costs of companies’ income tax were A$2,052 million or 14.5% of corporate tax revenue.
Ariff, Loh and Talib (1995)
Listed companies
(Singapore)
Survey (mail)
200 65
(33%)
- In 1994, the average compliance costs per listed company were S$78,396; with external costs portion being higher (58%) than internal costs time costs (42%).
- The computational and planning costs portion is almost equal.
Slemrod and Blumenthal (1996)
Largest corporation
(US)
Survey (mail)
1,329 365
(27%)
- In 1992, the average compliance costs per company were US$1.57 million.
- The estimated aggregate cost for all 1329 companies equals US$2.08 billion or 3.2 percent of revenue yield.

290
Authors(s); (year)
Subject(s); (country)
Method Sample size; response number (response rate)
Main Findings
KPMG (1996) Listed companies (UK)
Survey (mail) 1,200 266
(22%)
- Compliance costs of listed companies in 1995-96 were UK₤265 million.
Slemrod (1997)
Largest corporation
(US)
Survey (mail)
1,697 309
(18%)
- The average compliance costs per company in 1996 were US$1.90 million.
- In real terms (i.e. inflation-adjusted), the 1996 estimate is 8.1 percent higher than the 1992 estimates.
Ariff, Ismail and Loh (1997)
Listed companies
(Singapore)
Survey (mail)
234 62
(26%)
- Compared to the earlier estimates in 1994, the 1995 average compliance costs per listed company decreased significantly to S$54,615.
- The decrease was mainly due to income tax simplification measures.
Erard (1997a)
Largest corporation (Canada)
Survey (mail)
250 59
(24%)
- The combined federal-provincial income and capital tax compliance burden for the top 500 Canadian corporations in 1995 was estimated at C$507,000 per company, amounting to C$250 million in aggregate or about 5 percent of taxes paid.
Chan et al. (1999)
Listed companies
(Hong Kong)
Survey (mail)
496 75
(15%)
- The average tax compliance costs per public listed company were estimated at HK$346,483 for tax year 1995-1996.
- A large portion of the average compliance costs (70%) are external fees.
- There is a positive link between business size and its compliance costs.
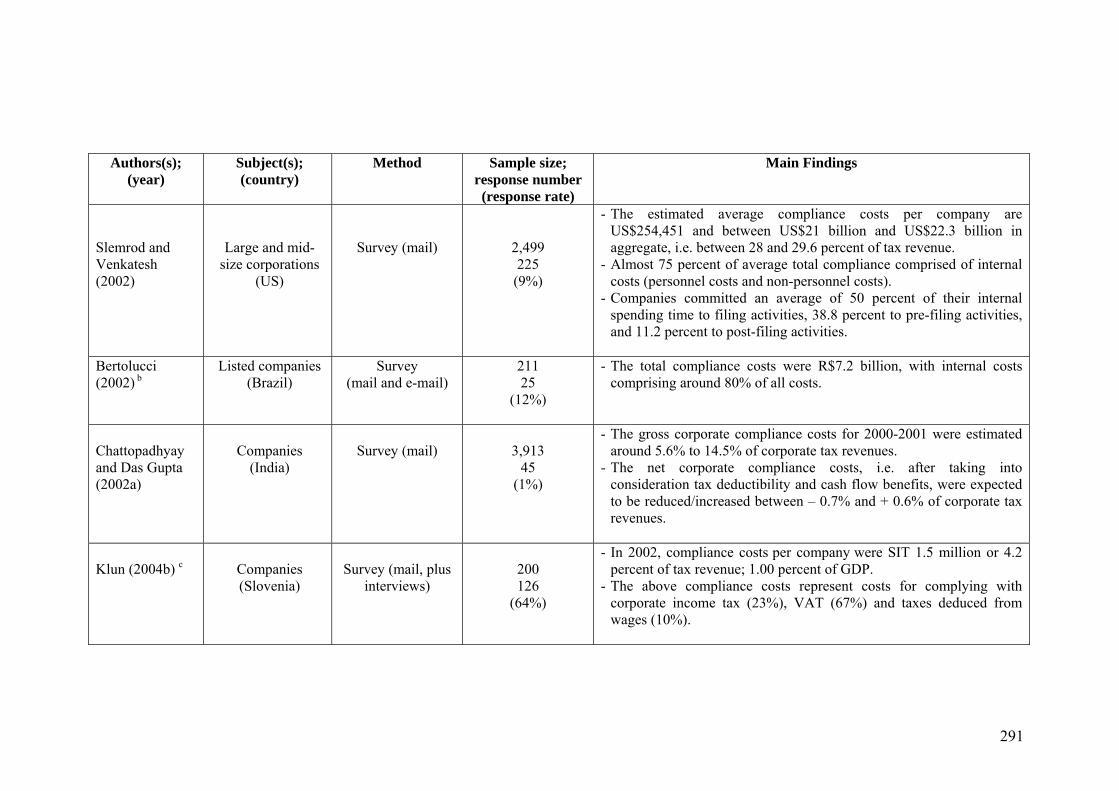
291
Authors(s); (year)
Subject(s); (country)
Method Sample size; response number (response rate)
Main Findings
Slemrod and Venkatesh (2002)
Large and mid-size corporations
(US)
Survey (mail)
2,499 225 (9%)
- The estimated average compliance costs per company are US$254,451 and between US$21 billion and US$22.3 billion in aggregate, i.e. between 28 and 29.6 percent of tax revenue.
- Almost 75 percent of average total compliance comprised of internal costs (personnel costs and non-personnel costs).
- Companies committed an average of 50 percent of their internal spending time to filing activities, 38.8 percent to pre-filing activities, and 11.2 percent to post-filing activities.
Bertolucci (2002) b
Listed companies (Brazil)
Survey (mail and e-mail)
211 25
(12%)
- The total compliance costs were R$7.2 billion, with internal costs comprising around 80% of all costs.
Chattopadhyay and Das Gupta (2002a)
Companies
(India)
Survey (mail)
3,913
45 (1%)
- The gross corporate compliance costs for 2000-2001 were estimated around 5.6% to 14.5% of corporate tax revenues.
- The net corporate compliance costs, i.e. after taking into consideration tax deductibility and cash flow benefits, were expected to be reduced/increased between – 0.7% and + 0.6% of corporate tax revenues.
Klun (2004b) c
Companies
(Slovenia)
Survey (mail, plus
interviews)
200 126
(64%)
- In 2002, compliance costs per company were SIT 1.5 million or 4.2 percent of tax revenue; 1.00 percent of GDP.
- The above compliance costs represent costs for complying with corporate income tax (23%), VAT (67%) and taxes deduced from wages (10%).
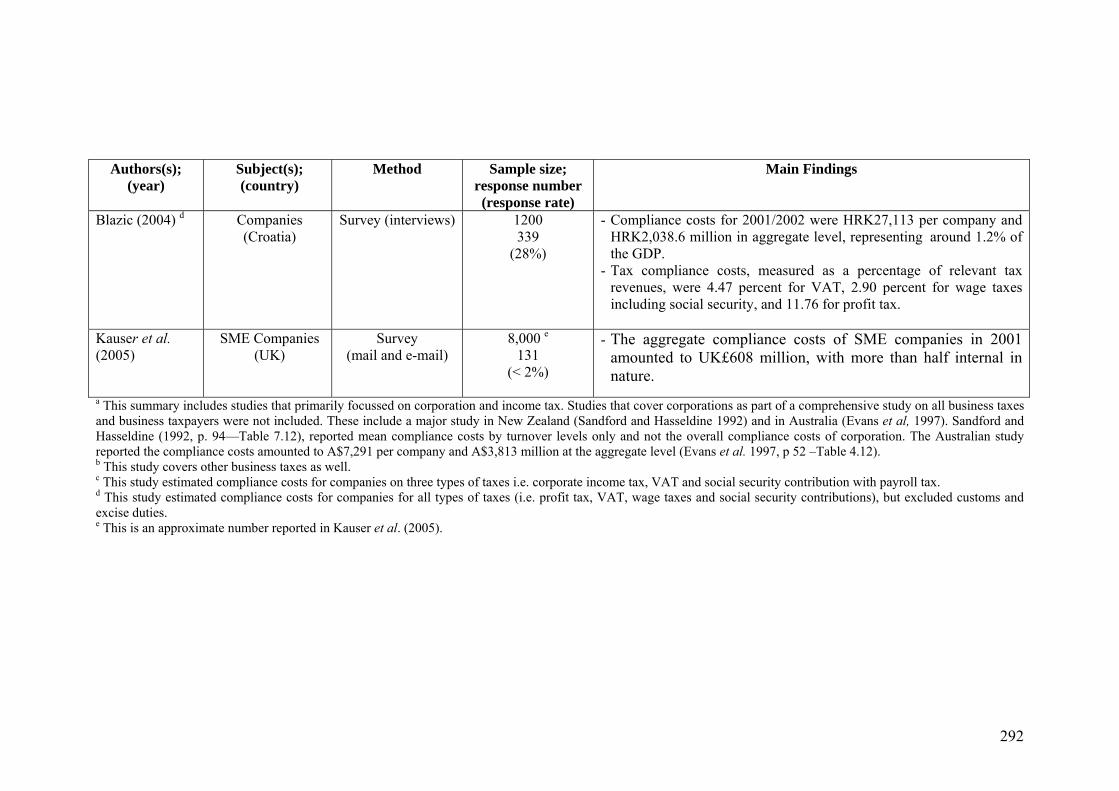
292
Authors(s); (year)
Subject(s); (country)
Method Sample size; response number (response rate)
Main Findings
Blazic (2004) d Companies
(Croatia) Survey (interviews) 1200
339 (28%)
- Compliance costs for 2001/2002 were HRK27,113 per company and HRK2,038.6 million in aggregate level, representing around 1.2% of the GDP.
- Tax compliance costs, measured as a percentage of relevant tax revenues, were 4.47 percent for VAT, 2.90 percent for wage taxes including social security, and 11.76 for profit tax.
Kauser et al. (2005)
SME Companies (UK)
Survey (mail and e-mail)
8,000 e 131
(< 2%)
- The aggregate compliance costs of SME companies in 2001 amounted to UK£608 million, with more than half internal in nature.
a This summary includes studies that primarily focussed on corporation and income tax. Studies that cover corporations as part of a comprehensive study on all business taxes and business taxpayers were not included. These include a major study in New Zealand (Sandford and Hasseldine 1992) and in Australia (Evans et al, 1997). Sandford and Hasseldine (1992, p. 94—Table 7.12), reported mean compliance costs by turnover levels only and not the overall compliance costs of corporation. The Australian study reported the compliance costs amounted to A$7,291 per company and A$3,813 million at the aggregate level (Evans et al. 1997, p 52 –Table 4.12). b This study covers other business taxes as well. c This study estimated compliance costs for companies on three types of taxes i.e. corporate income tax, VAT and social security contribution with payroll tax. d This study estimated compliance costs for companies for all types of taxes (i.e. profit tax, VAT, wage taxes and social security contributions), but excluded customs and excise duties. e This is an approximate number reported in Kauser et al. (2005).

APPENDIX E
Summary of Costs of Compliance Studies in Malaysia

293
Summary of Costs of Compliance Studies in Malaysia (Additional Details a)
Authors (year)
Taxes (focus)
Subject Method Sample Coverage Sample size (sampling method)
Response number (and/or rate)
Loh et al. (1997)
Income Tax (Corporate)
Public Listed Companies
Survey (mail) Nationwide 300 (random)
80 (27%)
[useable 48/16%]
Hanefah, Ariff and Kasipillai (2001)
Income Tax (Corporate)
SME Companies b
Survey (mail) c
Northern Peninsular (Perlis, Kedah and Penang)
300
(random)
67
(22.3%)
Mansor, Saad and Ibrahim (2003)
Income Tax (Corporate)
SME Companies b
Survey (mail) Northern Peninsular (Perlis, Kedah and Penang)
Not reported (convenience
sampling)
56
(not available)
Sapiei and Abdullah (2008)
Income Tax (Individual)
Individuals d Survey (mail) Klang-valley (Selangor and Kuala Lumpur)
500
(not reported)
144
(29%)
a Key Details and findings are presented in Chapter Two, Table 2.4. b Similar SME definition was employed in both studies, i.e. company with employees not exceeding 150 with an annual turnover not exceeding RM250 million. c Plus face-to-face interviews. d Including self-employed business taxpayers.
APPENDIX F
Primary Postal Survey Questionnaire (English Version)

294
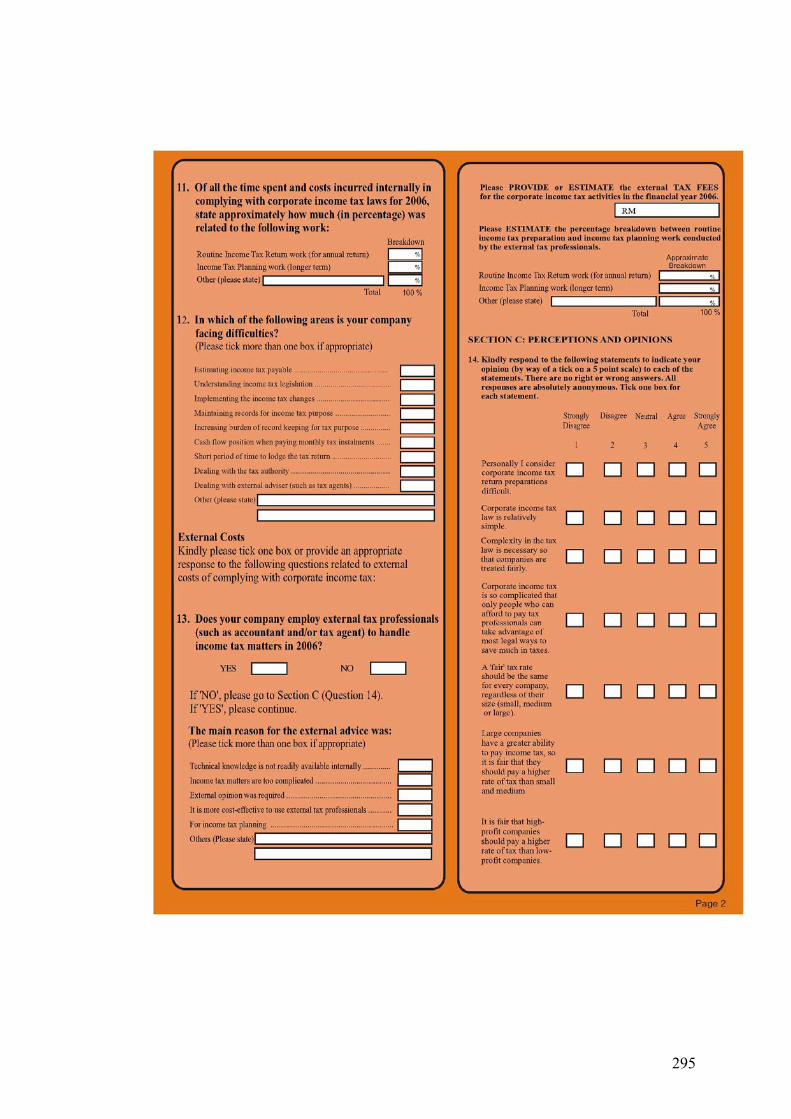
295
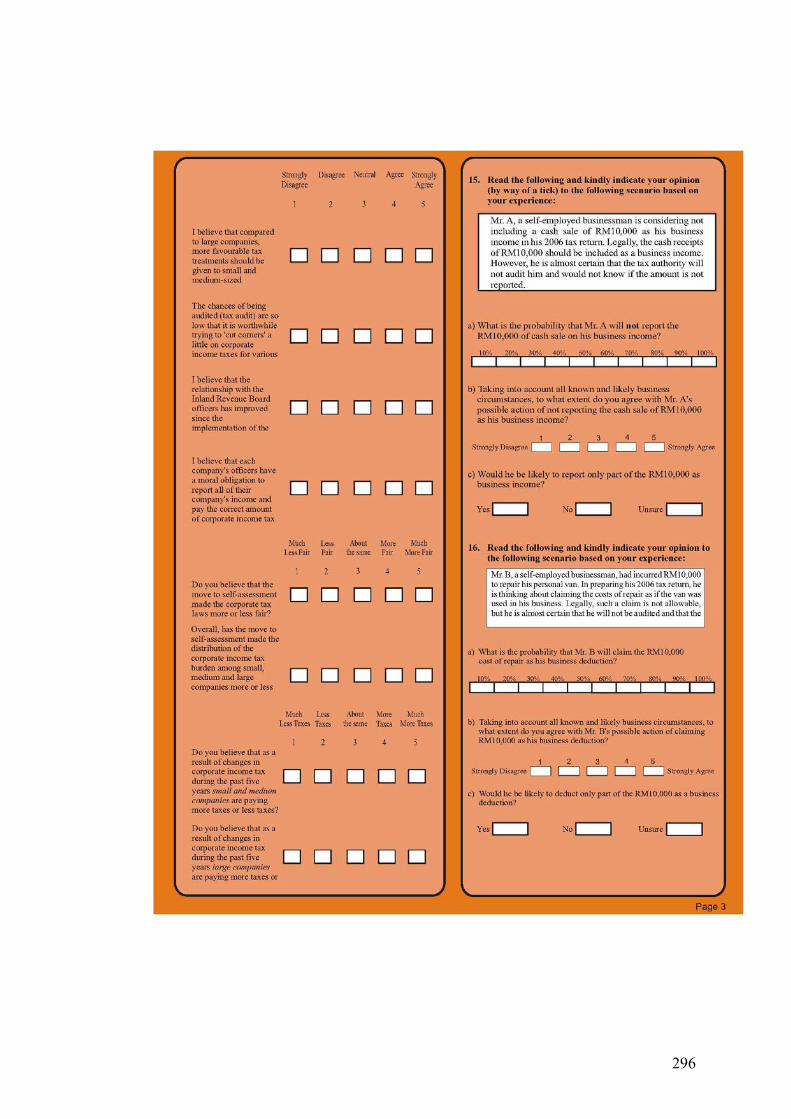
296
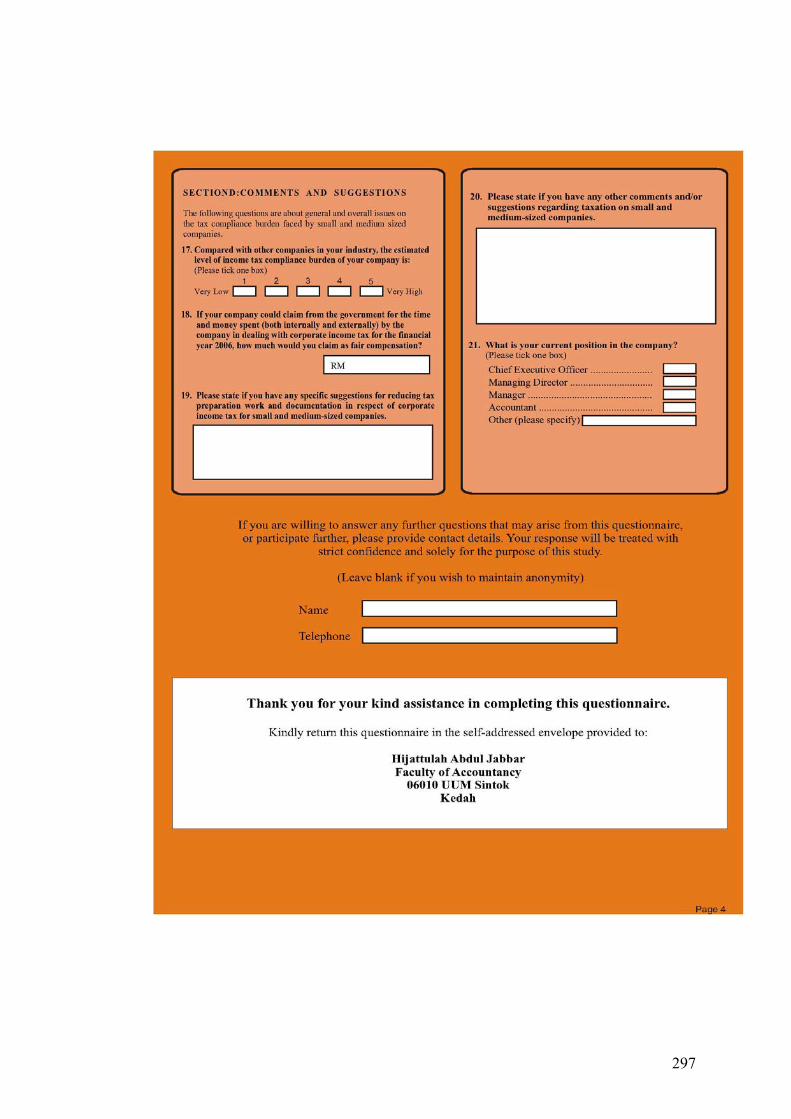
297

APPENDIX G
Primary Postal Survey Questionnaire (Malay Version)

298
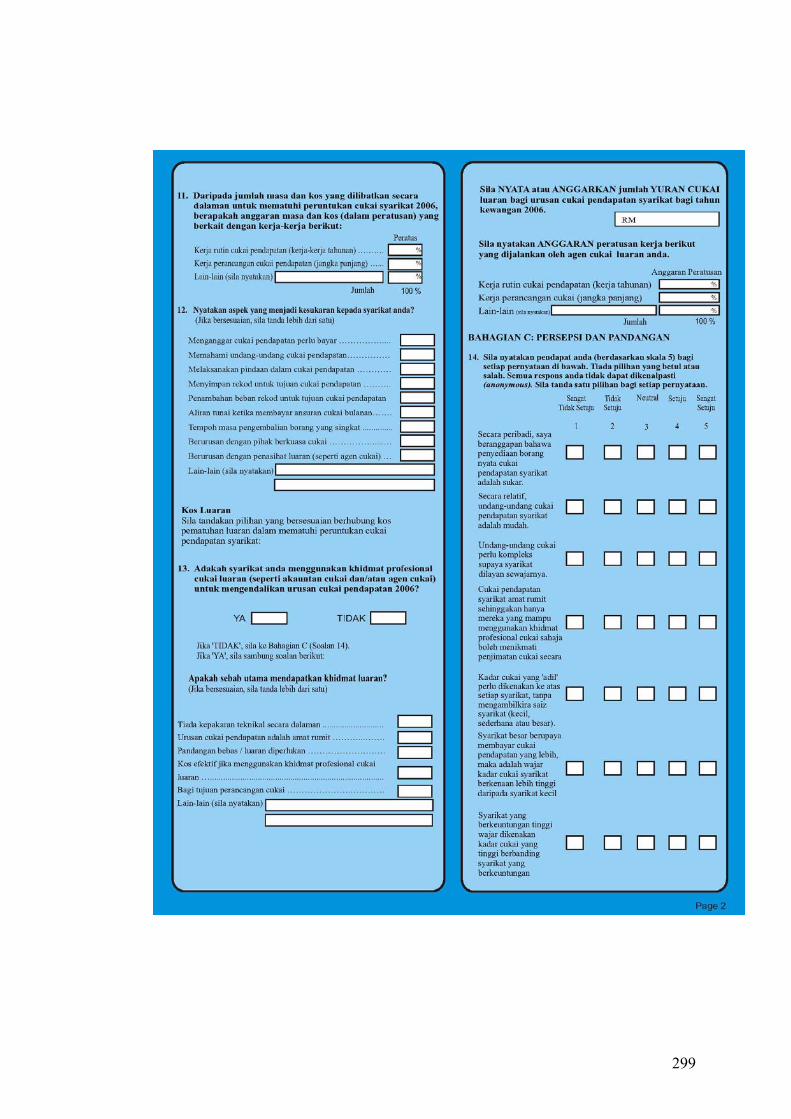
299

300
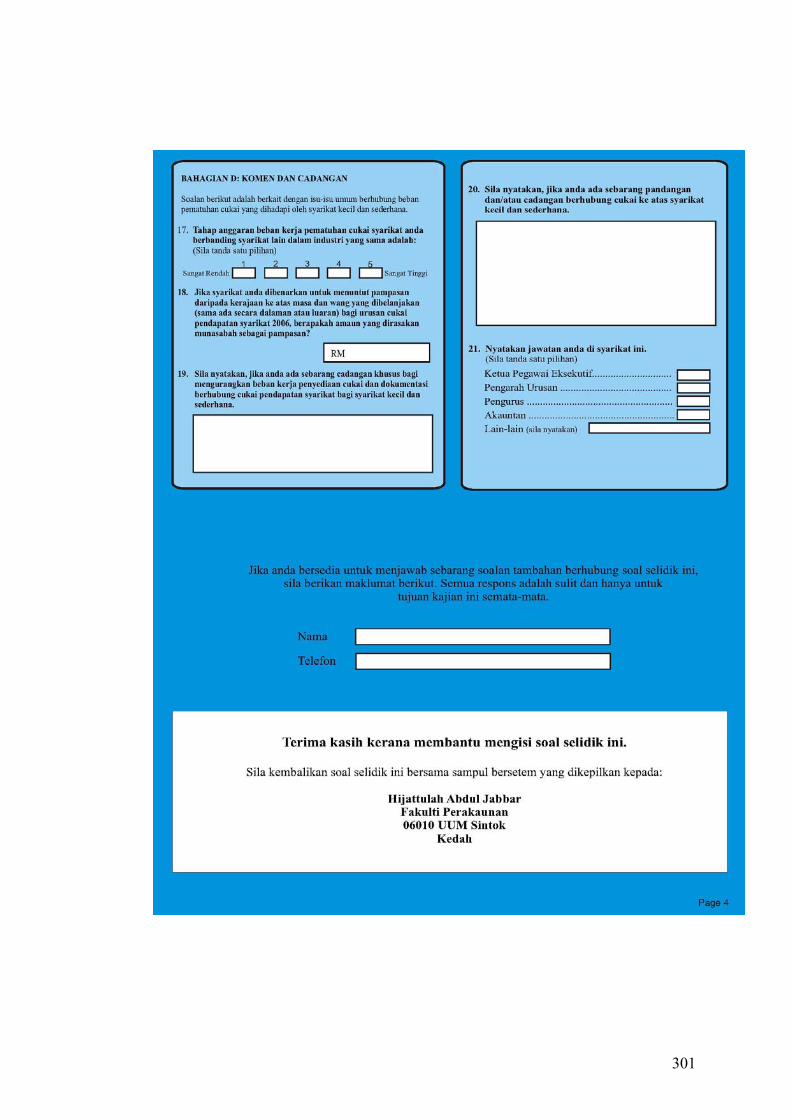
301

APPENDIX H
Covering Letter to Postal Survey

302

APPENDIX I
Postcard First Reminder
303

APPENDIX J
Second Reminder to Postal Survey

304

APPENDIX K
Single Question Postcard Survey
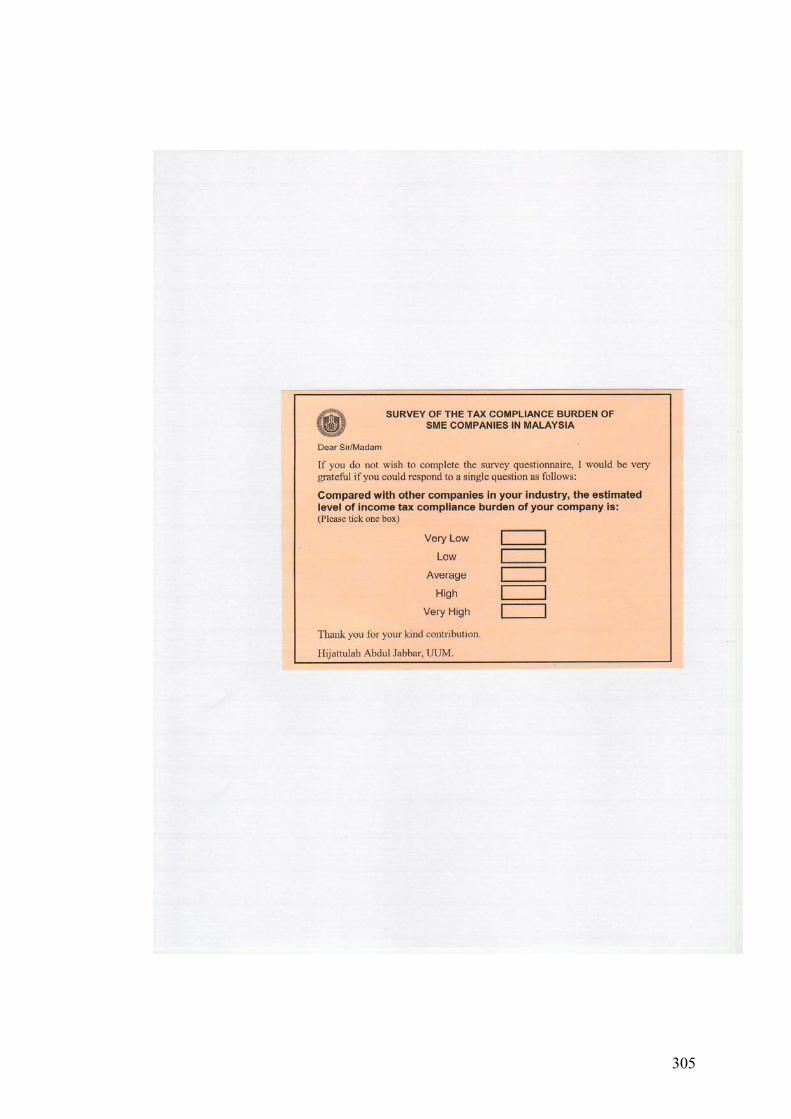
305

APPENDIX L
Questionnaire for Web Survey (printable version)
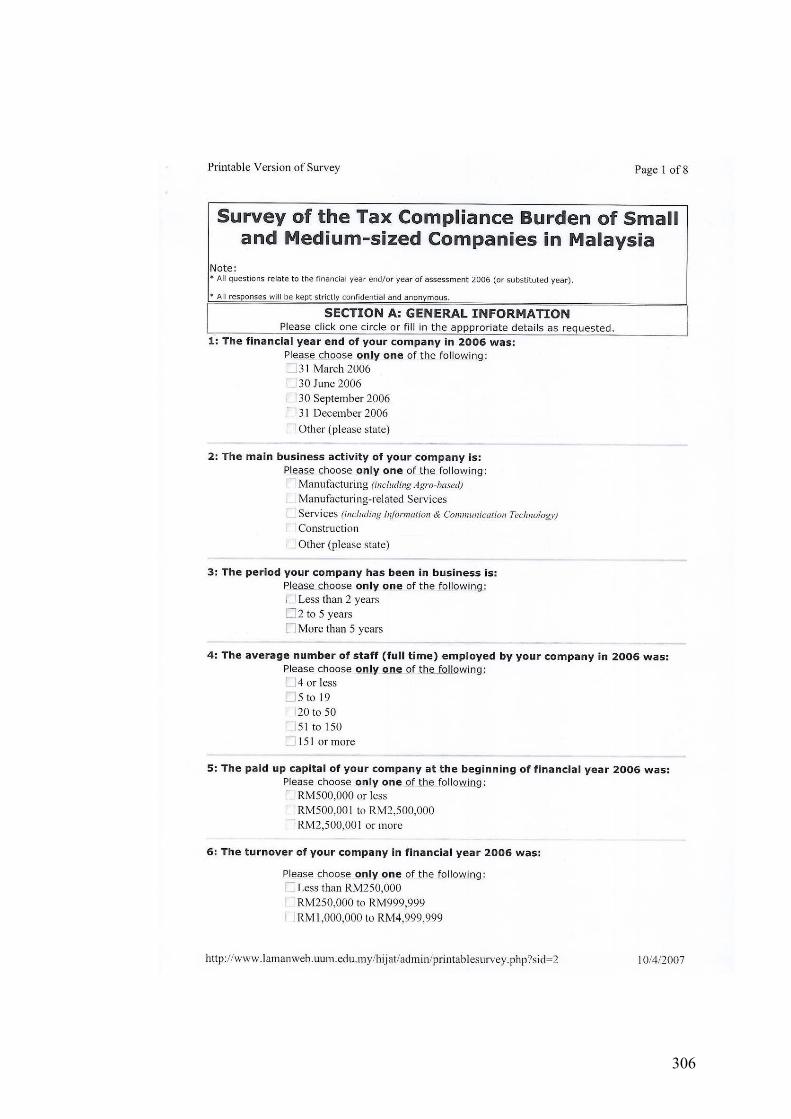
306
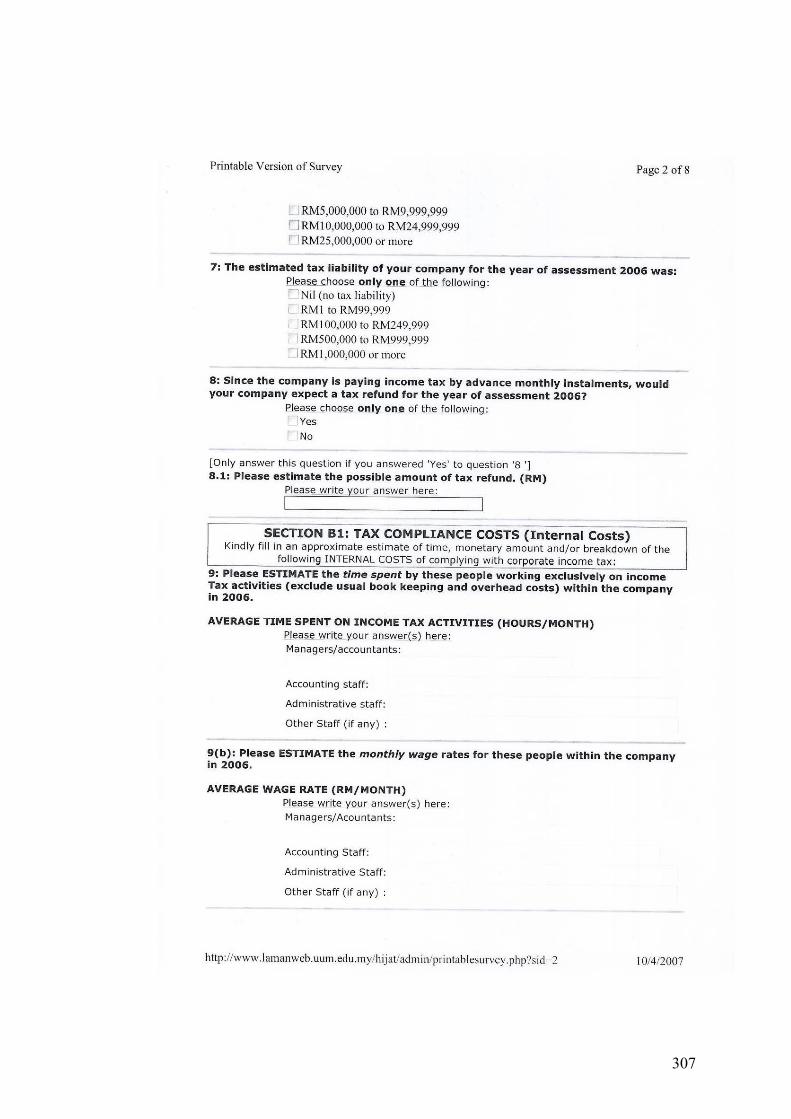
307

308

309

310

311
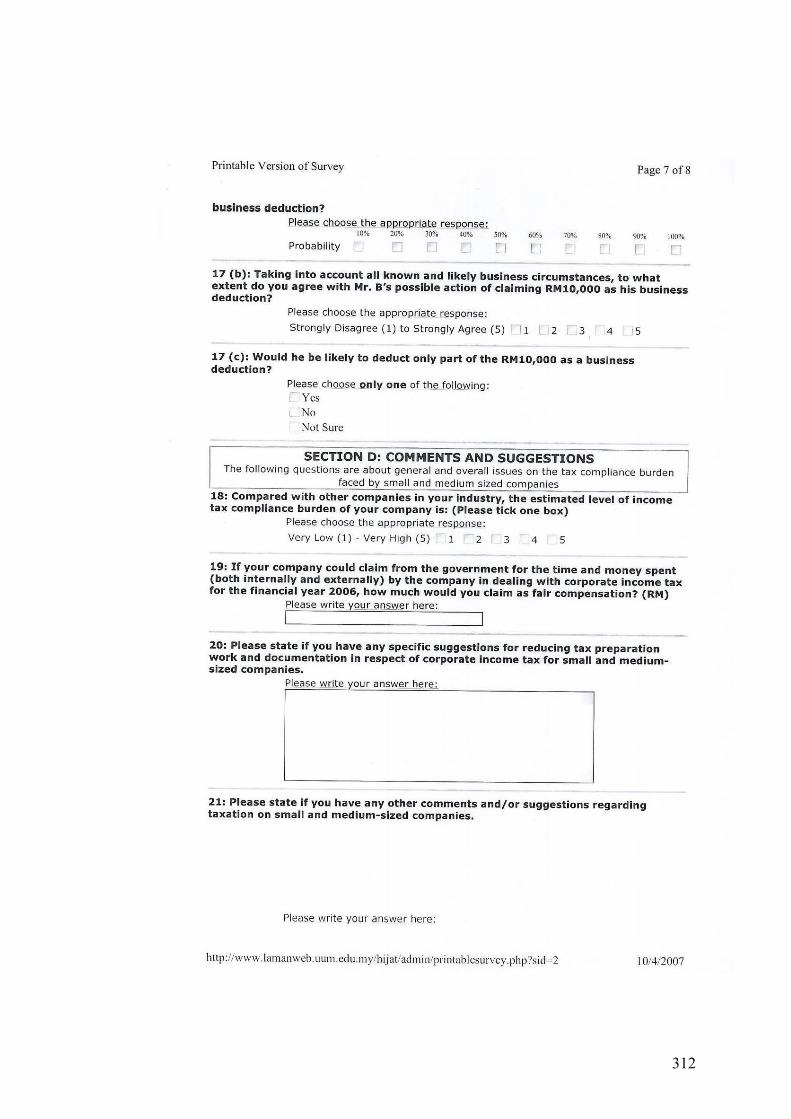
312

313
APPENDIX M
E-mail Correspondence for the Web Survey
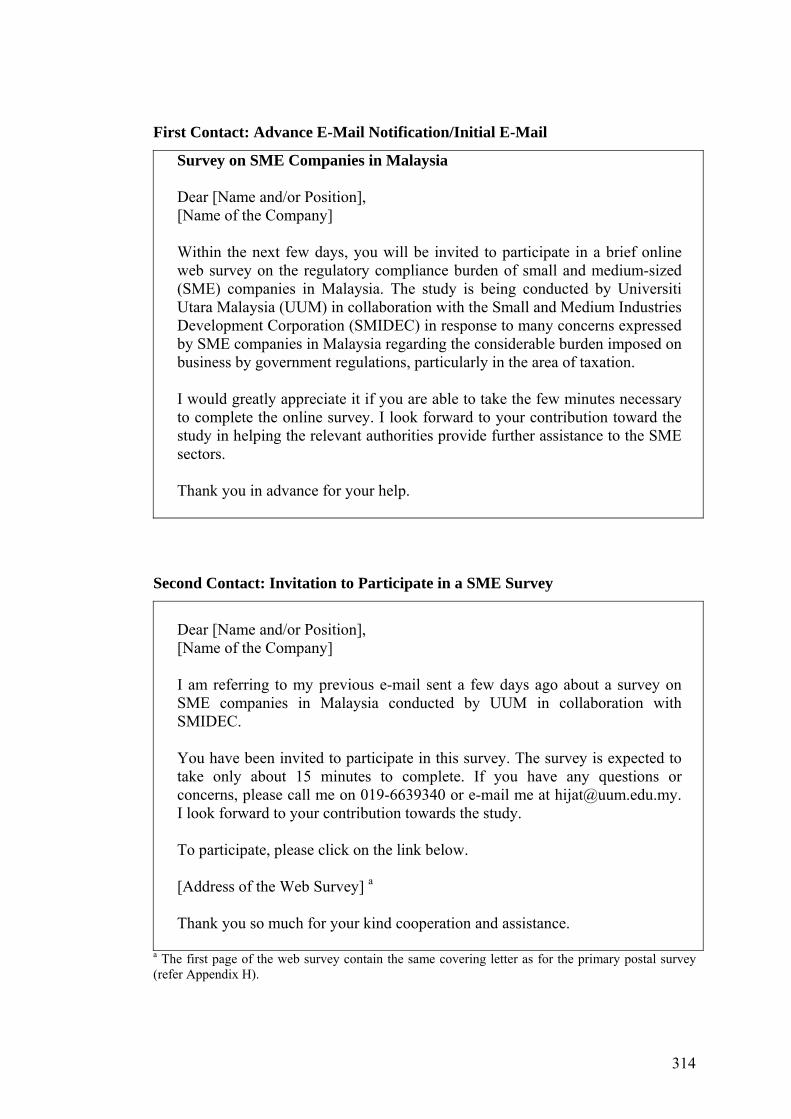
314
First Contact: Advance E-Mail Notification/Initial E-Mail
Survey on SME Companies in Malaysia Dear [Name and/or Position], [Name of the Company] Within the next few days, you will be invited to participate in a brief online web survey on the regulatory compliance burden of small and medium-sized (SME) companies in Malaysia. The study is being conducted by Universiti Utara Malaysia (UUM) in collaboration with the Small and Medium Industries Development Corporation (SMIDEC) in response to many concerns expressed by SME companies in Malaysia regarding the considerable burden imposed on business by government regulations, particularly in the area of taxation. I would greatly appreciate it if you are able to take the few minutes necessary to complete the online survey. I look forward to your contribution toward the study in helping the relevant authorities provide further assistance to the SME sectors. Thank you in advance for your help.
Second Contact: Invitation to Participate in a SME Survey
Dear [Name and/or Position], [Name of the Company] I am referring to my previous e-mail sent a few days ago about a survey on SME companies in Malaysia conducted by UUM in collaboration with SMIDEC. You have been invited to participate in this survey. The survey is expected to take only about 15 minutes to complete. If you have any questions or concerns, please call me on 019-6639340 or e-mail me at [email protected]. I look forward to your contribution towards the study. To participate, please click on the link below. [Address of the Web Survey] a Thank you so much for your kind cooperation and assistance.
a The first page of the web survey contain the same covering letter as for the primary postal survey (refer Appendix H).

315
Third and Fourth Contact: First and Second Reminder about SME Survey
Dear [Name and/or Position], [Name of the Company] Recently I invited you to participate in a survey. As the study is expected to provide valuable input for the government in providing greater assistance to SME companies, your contribution towards the study would be greatly appreciated. If you are yet to complete it, I wish to inform you that the survey is still available should you wish to take part. The survey is titled: "Survey of the Tax Compliance Burden of Small and Medium-sized Companies in Malaysia". To participate, please click on the link below: [Address of the Web Survey] a
a The first page of the web survey contain the same covering letter as for the primary postal survey (refer Appendix H). Fifth Contact: Third Reminder about SME Survey
Dear [Name and/or Position], [Name of the Company] Recently I sent you a questionnaire on SME survey. I note that you have not yet completed the survey. If you do not wish to fill in the form, I would be grateful if you would just respond to ONE question only. Your response is vital in ensuing that the issue of the tax compliance burden of SME companies is properly considered by the government and other SME agencies. Please click here to answer ONE question only. [Address of the Web Survey].a
a The single question in the web survey is the same as for the primary postal survey (refer Appendix K).
APPENDIX N
Respondents’ Profile and Details of Key Findings in the Web Survey
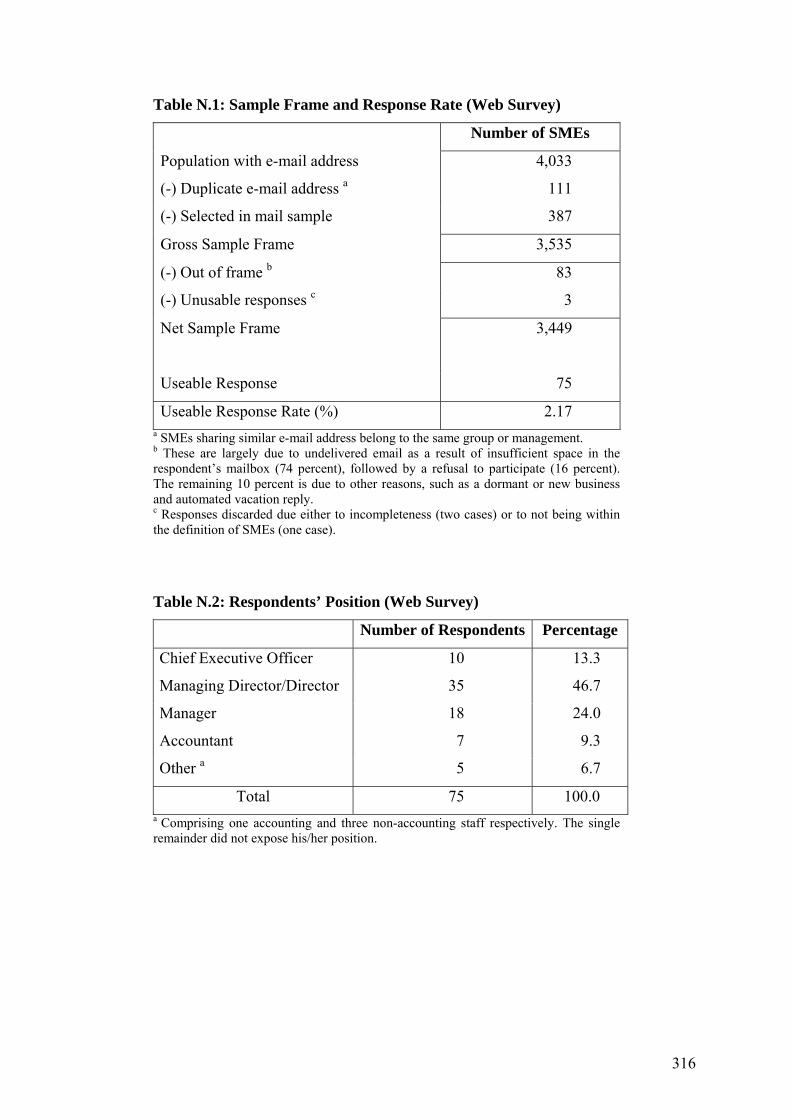
316
Table N.1: Sample Frame and Response Rate (Web Survey)
Number of SMEs
Population with e-mail address 4,033
(-) Duplicate e-mail address a 111
(-) Selected in mail sample 387
Gross Sample Frame 3,535
(-) Out of frame b 83
(-) Unusable responses c 3
Net Sample Frame 3,449
Useable Response 75
Useable Response Rate (%) 2.17 a SMEs sharing similar e-mail address belong to the same group or management. b These are largely due to undelivered email as a result of insufficient space in the respondent’s mailbox (74 percent), followed by a refusal to participate (16 percent). The remaining 10 percent is due to other reasons, such as a dormant or new business and automated vacation reply. c Responses discarded due either to incompleteness (two cases) or to not being within the definition of SMEs (one case).
Table N.2: Respondents’ Position (Web Survey)
Number of Respondents Percentage
Chief Executive Officer 10 13.3
Managing Director/Director 35 46.7
Manager 18 24.0
Accountant 7 9.3
Other a 5 6.7
Total 75 100.0 a Comprising one accounting and three non-accounting staff respectively. The single remainder did not expose his/her position.
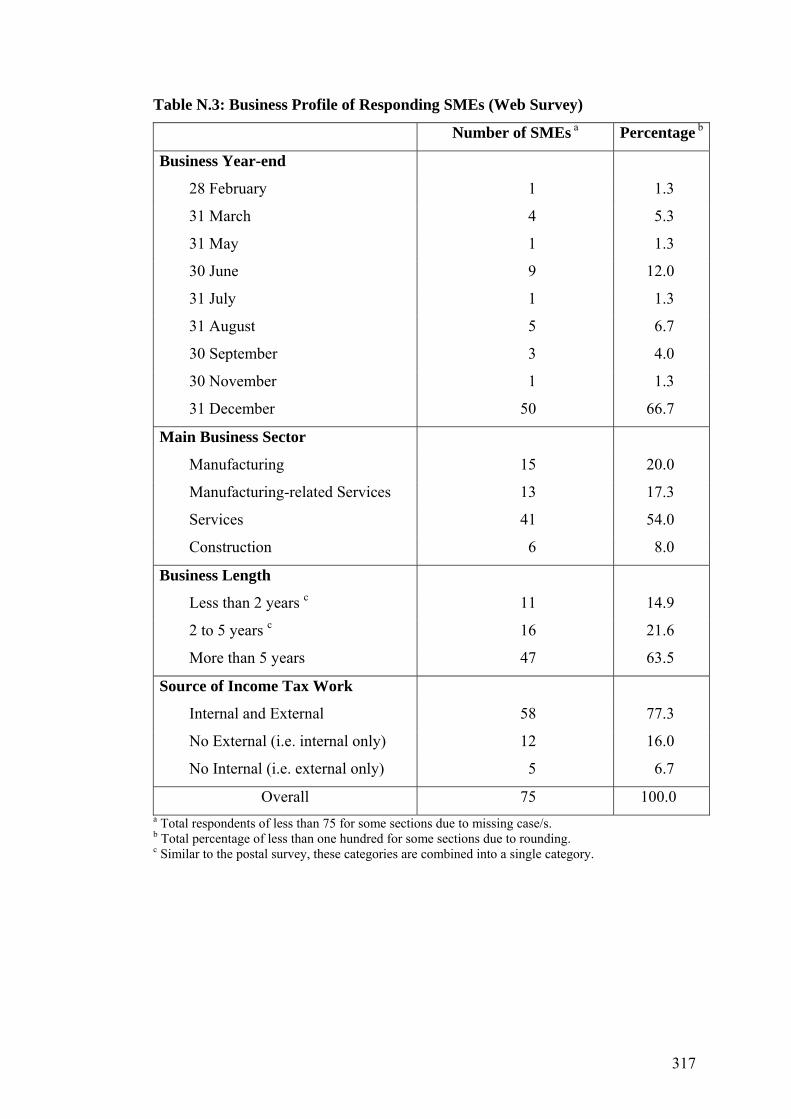
317
Table N.3: Business Profile of Responding SMEs (Web Survey)
Number of SMEs a Percentage b
Business Year-end
28 February 1 1.3
31 March 4 5.3
31 May 1 1.3
30 June 9 12.0
31 July 1 1.3
31 August 5 6.7
30 September 3 4.0
30 November 1 1.3
31 December 50 66.7
Main Business Sector
Manufacturing 15 20.0
Manufacturing-related Services 13 17.3
Services 41 54.0
Construction 6 8.0
Business Length
Less than 2 years c 11 14.9
2 to 5 years c 16 21.6
More than 5 years 47 63.5
Source of Income Tax Work
Internal and External 58 77.3
No External (i.e. internal only) 12 16.0
No Internal (i.e. external only) 5 6.7
Overall 75 100.0 a Total respondents of less than 75 for some sections due to missing case/s. b Total percentage of less than one hundred for some sections due to rounding. c Similar to the postal survey, these categories are combined into a single category.

318
Table N.4: Size of Responding SMEs (Web Survey)
Number of SMEs a Percentage b
Number of Staff Employed
4 or less 21 28.8
5 to 19 34 46.6
20 to 50 11 15.1
51 to 150 7 9.6
Turnover Level
Less than RM250,000 19 25.3
RM250,000 to RM999,999 21 28.0
RM1,000,000 to RM4,999,999 24 32.0
RM5,000,000 and more c 11 14.7
NSDC Size
Micro 26 34.7
Small 38 50.7
Medium 11 14.7
Business Paid-up Capital
RM500,000 or less 52 71.2
RM500,001 to RM2,500,000 17 23.3
RM2,500,001 or more 4 5.5
Estimated Tax liability
No tax 22 29.3
RM1 to RM99,999 43 57.3
RM100,000 and more c 10 13.3
Overall 75 100.0 a Total respondents of less than 75 for some sections due to missing case/s. b Total percentage of less than one hundred for some sections due to rounding. c Similar to the postal survey, this is a combined category.

319
Table N.5: Tax-related Difficulties for SMEs, 2006 (Web Survey)
Number of Overall Percent
Responses Percent of Cases
Estimating Income Tax payable 49 19.2 70.0
Cash flow position to pay monthly tax
instalments 43 16.9 61.4
Increasing burden of record keeping for tax
purposes 32 12.5 45.7
Maintaining records for Income Tax purpose 31 12.2 44.3
Understanding Income Tax legislation 29 11.4 41.4
Implementing the Income Tax changes 24 9.4 34.3
Dealing with external tax advisers 17 6.7 24.3
Short period of time to lodge the tax return 16 6.3 22.9
Dealing with the tax authority 14 5.5 20.0
Total 255 a 100.0 b - a Total responses exceeds 75 as respondents were allowed to select more than one aspect. b Does not total up to one hundred percent due to rounding.
Table N.6: Main Reason for using External Tax Professionals, 2006
(Web Survey)
Number of Overall Percent
Responses Percent of Cases
Technical knowledge is not readily available
internally 47 29.7 75.8
It is more cost-effective to use external tax
professionals 42 26.6 67.7
Income tax matters are too complicated 33 20.9 53.2
External opinion was required 23 14.6 37.1
For income tax planning 13 8.2 21.0
Total 158 a 100.0 - a Total responses exceeds 75 as respondents were allowed to select more than one aspect.
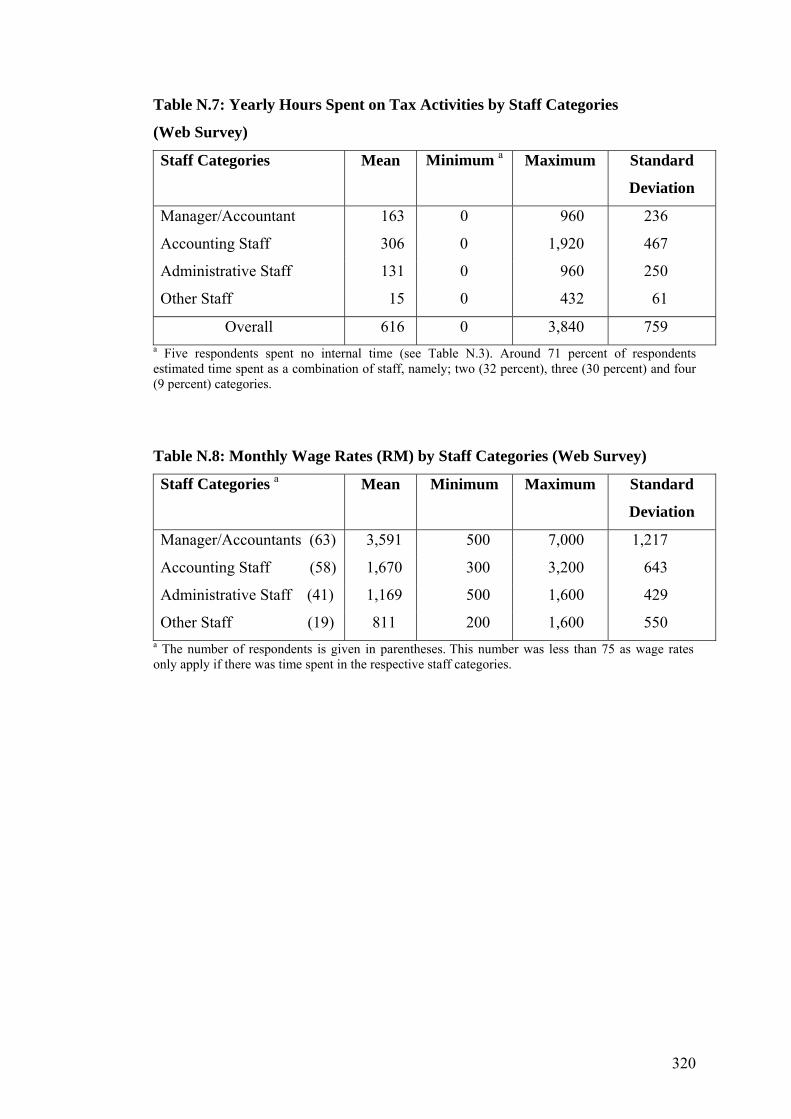
320
Table N.7: Yearly Hours Spent on Tax Activities by Staff Categories
(Web Survey)
Staff Categories Mean Minimum a Maximum Standard
Deviation
Manager/Accountant 163 0 960 236
Accounting Staff 306 0 1,920 467
Administrative Staff 131 0 960 250
Other Staff 15 0 432 61
Overall 616 0 3,840 759 a Five respondents spent no internal time (see Table N.3). Around 71 percent of respondents estimated time spent as a combination of staff, namely; two (32 percent), three (30 percent) and four (9 percent) categories.
Table N.8: Monthly Wage Rates (RM) by Staff Categories (Web Survey)
Staff Categories a Mean Minimum Maximum Standard
Deviation
Manager/Accountants (63) 3,591 500 7,000 1,217
Accounting Staff (58) 1,670 300 3,200 643
Administrative Staff (41) 1,169 500 1,600 429
Other Staff (19) 811 200 1,600 550 a The number of respondents is given in parentheses. This number was less than 75 as wage rates only apply if there was time spent in the respective staff categories.
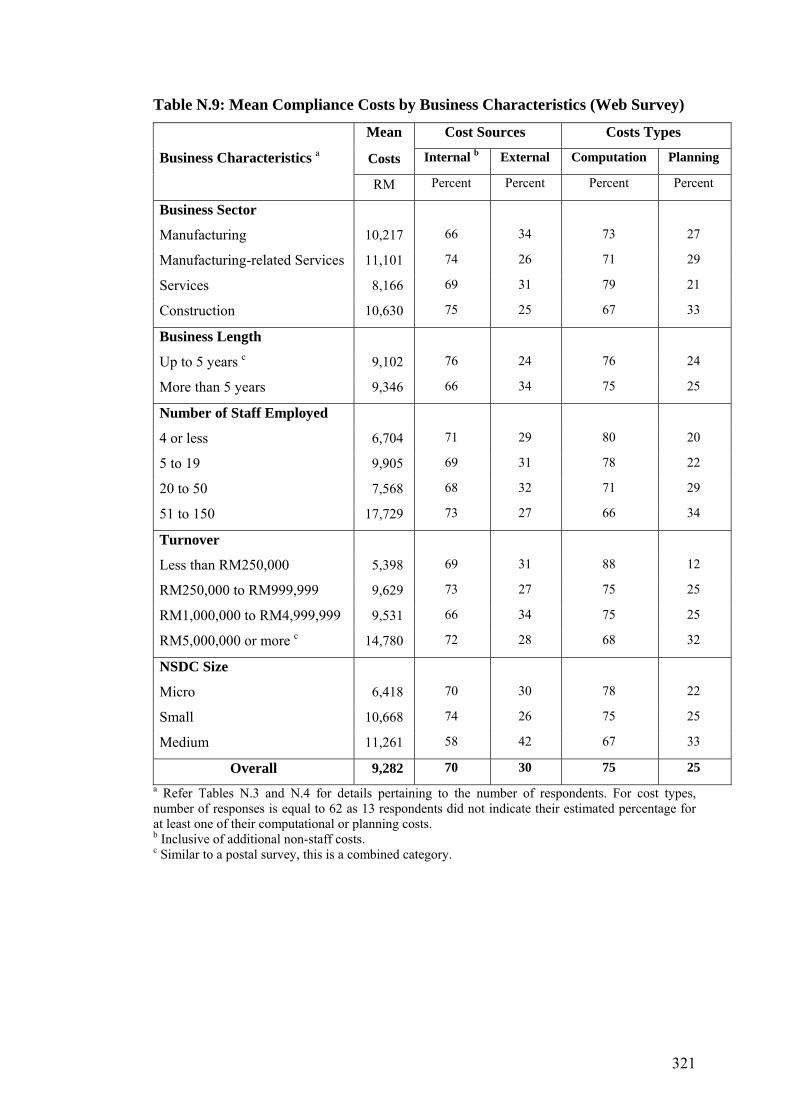
321
Table N.9: Mean Compliance Costs by Business Characteristics (Web Survey)
Mean Cost Sources Costs Types
Business Characteristics a Costs Internal b External Computation Planning
RM Percent Percent Percent Percent
Business Sector
Manufacturing 10,217 66 34 73 27
Manufacturing-related Services 11,101 74 26 71 29
Services 8,166 69 31 79 21
Construction 10,630 75 25 67 33
Business Length
Up to 5 years c 9,102 76 24 76 24
More than 5 years 9,346 66 34 75 25
Number of Staff Employed
4 or less 6,704 71 29 80 20
5 to 19 9,905 69 31 78 22
20 to 50 7,568 68 32 71 29
51 to 150 17,729 73 27 66 34
Turnover
Less than RM250,000 5,398 69 31 88 12
RM250,000 to RM999,999 9,629 73 27 75 25
RM1,000,000 to RM4,999,999 9,531 66 34 75 25
RM5,000,000 or more c 14,780 72 28 68 32
NSDC Size
Micro 6,418 70 30 78 22
Small 10,668 74 26 75 25
Medium 11,261 58 42 67 33
Overall 9,282 70 30 75 25
a Refer Tables N.3 and N.4 for details pertaining to the number of respondents. For cost types, number of responses is equal to 62 as 13 respondents did not indicate their estimated percentage for at least one of their computational or planning costs. b Inclusive of additional non-staff costs. c Similar to a postal survey, this is a combined category.
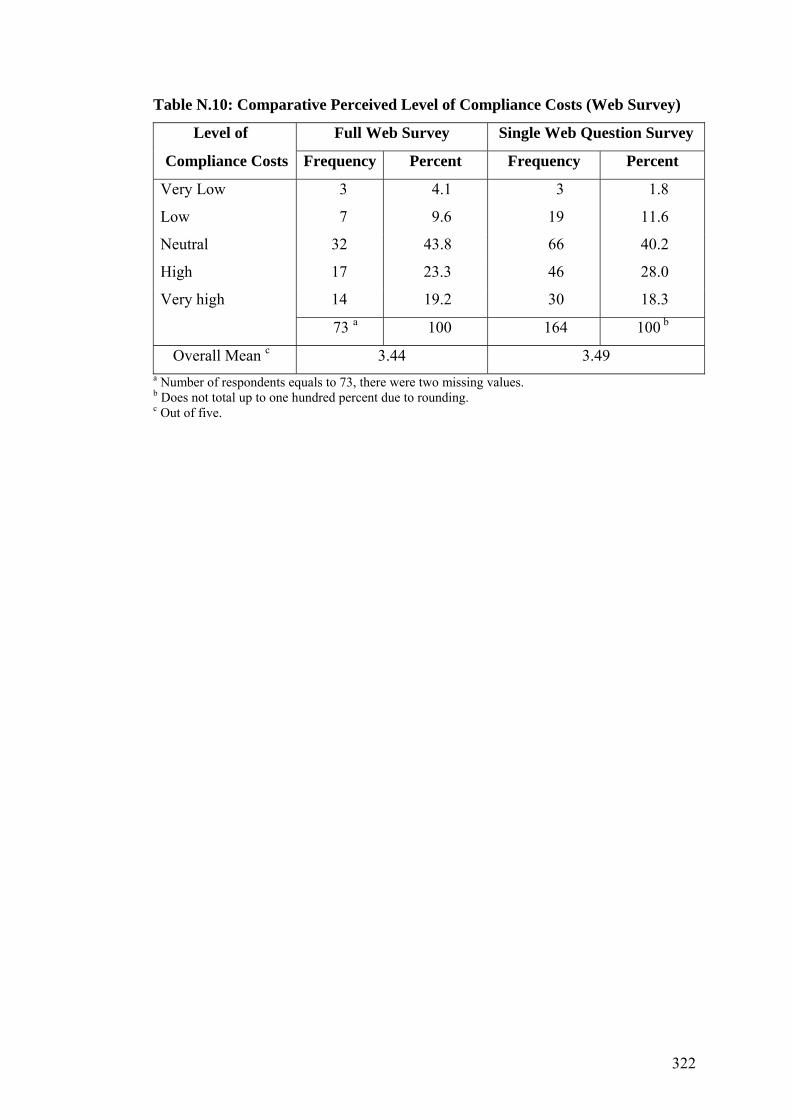
322
Table N.10: Comparative Perceived Level of Compliance Costs (Web Survey)
Level of Full Web Survey Single Web Question Survey
Compliance Costs Frequency Percent Frequency Percent
Very Low 3 4.1 3 1.8
Low 7 9.6 19 11.6
Neutral 32 43.8 66 40.2
High 17 23.3 46 28.0
Very high 14 19.2 30 18.3
73 a 100 164 100 b
Overall Mean c 3.44 3.49 a Number of respondents equals to 73, there were two missing values. b Does not total up to one hundred percent due to rounding. c Out of five.
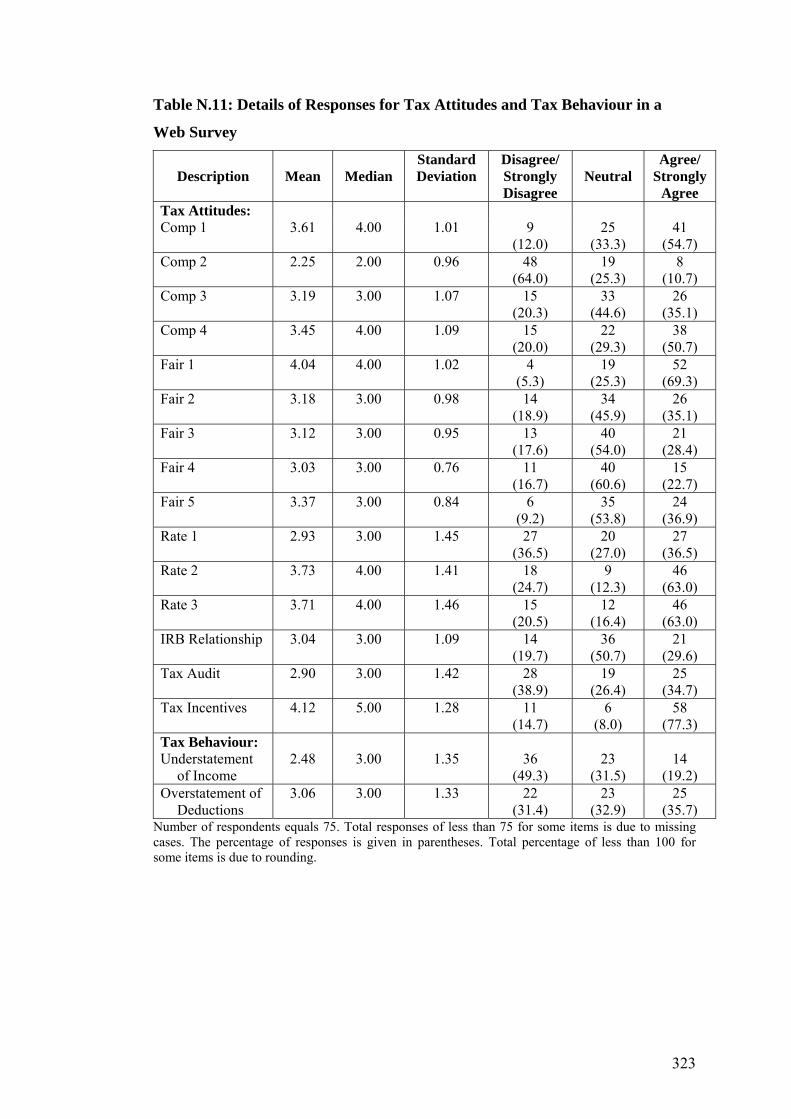
323
Table N.11: Details of Responses for Tax Attitudes and Tax Behaviour in a
Web Survey
Description
Mean
Median
Standard Deviation
Disagree/ Strongly Disagree
Neutral
Agree/ Strongly
Agree Tax Attitudes: Comp 1 3.61 4.00 1.01 9
(12.0) 25
(33.3) 41
(54.7) Comp 2 2.25 2.00 0.96 48
(64.0) 19
(25.3) 8
(10.7) Comp 3 3.19 3.00 1.07 15
(20.3) 33
(44.6) 26
(35.1) Comp 4 3.45 4.00 1.09 15
(20.0) 22
(29.3) 38
(50.7) Fair 1 4.04 4.00 1.02 4
(5.3) 19
(25.3) 52
(69.3) Fair 2 3.18 3.00 0.98 14
(18.9) 34
(45.9) 26
(35.1) Fair 3 3.12 3.00 0.95 13
(17.6) 40
(54.0) 21
(28.4) Fair 4 3.03 3.00 0.76 11
(16.7) 40
(60.6) 15
(22.7) Fair 5 3.37 3.00 0.84 6
(9.2) 35
(53.8) 24
(36.9) Rate 1 2.93 3.00 1.45 27
(36.5) 20
(27.0) 27
(36.5) Rate 2 3.73 4.00 1.41 18
(24.7) 9
(12.3) 46
(63.0) Rate 3 3.71 4.00 1.46 15
(20.5) 12
(16.4) 46
(63.0) IRB Relationship 3.04 3.00 1.09 14
(19.7) 36
(50.7) 21
(29.6) Tax Audit 2.90 3.00 1.42 28
(38.9) 19
(26.4) 25
(34.7) Tax Incentives 4.12 5.00 1.28 11
(14.7) 6
(8.0) 58
(77.3) Tax Behaviour: Understatement
of Income 2.48 3.00 1.35 36
(49.3) 23
(31.5) 14
(19.2) Overstatement of
Deductions 3.06 3.00 1.33 22
(31.4) 23
(32.9) 25
(35.7) Number of respondents equals 75. Total responses of less than 75 for some items is due to missing cases. The percentage of responses is given in parentheses. Total percentage of less than 100 for some items is due to rounding.

324
Table N.12: Detailed Results of Multiple Regressions in a Web Survey
(Turnover as Primary Size Measure)
Model/ Independent Variables
Understatement of Income (Model 1)
Overstatement of Deductions
(Model 2)
Both Non- compliance (Model 3)
Turnover: - Less than RM250,000 - RM1,000,000 – RM4,999,999 - RM5,000,000 or more
0.028
(0.177) 0.018
(0.119) 0.067
(0.444)
- 0.059
(- 0.356) 0.134
(0.844) - 0.079
(- 0.499)
- 0.033
(- 0.215) 0.066
(0.449) - 0.011
(- 0.072) Sector: - Manufacturing - Manufacturing-related - Construction
- 0.099
(- 0.789) - 0.007
(- 0.061) 0.117
(0.881)
- 0.206
(- 1.563) - 0.008
(- 0.067) - 0.003 (- 0.022)
- 0.178
(- 1.456) - 0.012
(- 0.102) 0.034 (0.265)
Year - 0.117 (- 0.825)
- 0.188 (- 1.221)
- 0.189 (- 1.377)
Tax: - No Tax - RM100,000 or more
- 0.029
(- 0.221) - 0.080
(- 0.583)
- 0.071
(- 0.518) - 0.162
(- 1.126)
- 0.030
(- 0.232) - 0.143
(- 1.075) Compliance Costs - 0.023
(- 0.181) 0.122
(0.951) 0.044
(0.360) Complexity - 0.370 a
(- 2.900) - 0.182 (- 1.374)
- 0.319 b (- 2.577)
Fairness - 0.048 (- 0.397)
0.110 (0.860)
0.029 (0.248)
Rate 0.260 b (2.110)
0.280 b (2.091)
0.288 b (2.409)
Incentives 0.200 (1.632)
0.269 b (2.094)
0.248 b (2.083)
Audit 0.418 a (3.630)
0.314 b (2.573)
0.415 a (3.706)
IRB - 0.086 (- 0.673)
- 0.101 (- 0.747)
- 0.115 (- 0.925)
R2 0.394 0.373 0.428 Adjusted R2 0.208 0.169 0.252 Standard Error 1.198 1.218 1.035 F-value 2.115 1.825 2.431 P-value 0.022 b 0.055 c 0.008 b
Number of respondents equals 69, except 66 in Model 2. T-value is given in parenthesis. a Significant at the one percent level. b Significant at the five percent level. c Significant at the 10 percent level.

325
Table N.13: Detailed Results of Multiple Regressions in a Web Survey
(Alternate Size Measure)
Model/ Independent Variables
Understatement of Income (Model 1)
Overstatement of Deductions
(Model 2)
Both Non- compliance (Model 3)
Proxy for Business size Staff NSDC Staff NSDC Staff NSDC Staff: - 4 or less - 20–50 - 51 to 150
- 0.043 (- 0.307) - 0.095
(- 0.734) 0.046
(0.286)
- - 0.098 (- 0.653) - 0.131
(- 0.943) 0.082
(0.479)
- - 0.082 (- 0.608) - 0.131
(- 1.048) 0.071
(0.459)
-
NSDC: - Micro - Medium
- - 0.126 (- 0.858)
0.026 (0.202)
- - 0.076 (- 0.480)
0.138 (1.021)
- - 0.127 (- 0.889)
0.083 (0.676)
Sector: - Manufacturing - Manufacturing-related - Construction
- 0.097
(- 0.756) 0.007
(0.059) 0.121
(0.968)
- 0.113
(- 0.994) - 0.006
(- 0.052) 0.115
(0.920)
- 0.236 c (- 1.744)
0.007 (0.054) 0.038 (0.281)
- 0.232 c
(- 1.823) 0.020
(0.157) 0.026 (0.271)
- 0.190 (1.541) 0.080
(0.071) 0.061 (0.502)
- 0.200 c (- 1.733)
0.004 (0.035) 0.057 (0.469)
Year - 0.125 (- 0.901)
- 0.059 (- 0.421)
- 0.252 (- 1.668)
- 0.194 (- 1.275)
- 0.222 (- 1.655)
- 0.152 (- 1.116)
Tax: - No Tax - RM100,000 or more
- 0.026
(- 0.205) - 0.079
(- 0.513)
- 0.010
(- 0.082) - 0.072
(- 0.556)
- 0.083
(- 0.608) - 0.278 c (- 1.704)
- 0.082
(- 0.607) - 0.282 b (- 2.067)
- 0.043
(- 0.350) - 0.203
(- 1.366)
- 0.028
(- 0.227) - 0.201
(- 1.612) Compliance Costs - 0.040
(- 0.302) - 0.061
(- 0.487) 0.091
(0.667) 0.102
(0.784) 0.024
(0.189) 0.013
(0.108) Complexity - 0.375 a
(- 3.020) - 0.347 a (- 2.847)
- 0.208 (- 1.567)
- 0.165 (- 1.275)
- 0.342 a (- 2.857)
- 0.303 b (2.565)
Fairness - 0.065 (- 0.558)
- 0.034 (- 0.292)
0.026 (0.211)
0.058 (0.476)
- 0.022 (- 0.194)
0.015 (0.138)
Rate 0.276 b (2.194)
0.236 (1.929)
0.296 b
(2.167) 0.261 c
(1.971) 0.312 b (2.565)
0.267 b (2.254)
Incentives 0.201 (1.613)
0.214 c (1.746)
0.284 b
(2.133) 0.273 b (2.092)
0.259 b (2.150)
0.261 b (2.195)
Audit 0.420 a (3.594)
0.412 a (3.695)
0.288 b (2.322)
0.286 b (2.390)
0.406 a (3.601)
0.401 a (3.707)
IRB - 0.096 (- 0.770)
- 0.064 (- 0.517)
- 0.156 (-1.170)
- 0.105 (- 0.796)
- 0.150 (-1.252)
- 0.105 (- 0.878)
R2 0.402 0.401 0.369 0.364 0.444 0.438 Adjusted R2 0.218 0.232 0.163 0.174 0.273 0.279 Standard Error 1.190 1.180 1.222 1.214 1.020 1.016 F-value 2.184 2.366 1.793 1.911 2.598 2.751 P-value 0.018 b 0.011 b 0.060 c 0.045 b 0.005 a 0.003 a
Number of respondents equals 69, except 66 in Model 2. T-value is given in parenthesis. a Significant at the one percent level. b Significant at the five percent level. c Significant at the 10 percent level.
APPENDIX O
Questionnaire for Tax Professionals

326

327

328

329

APPENDIX P
Data Validation
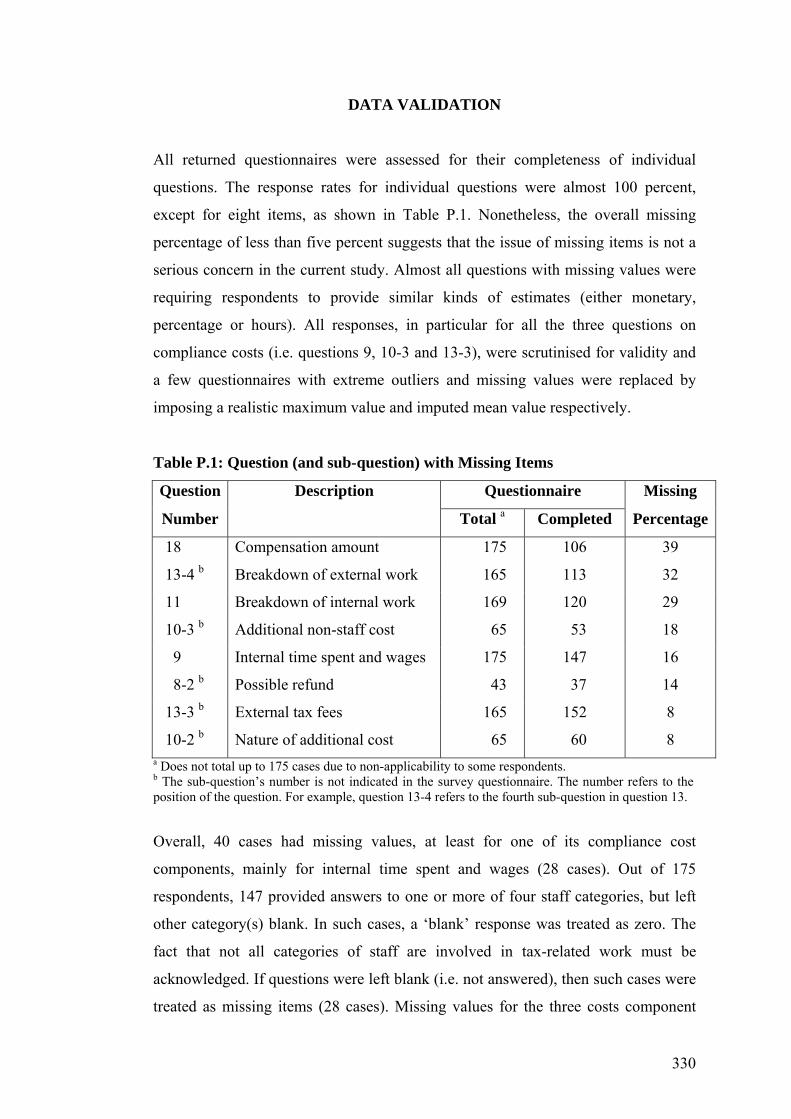
330
DATA VALIDATION
All returned questionnaires were assessed for their completeness of individual
questions. The response rates for individual questions were almost 100 percent,
except for eight items, as shown in Table P.1. Nonetheless, the overall missing
percentage of less than five percent suggests that the issue of missing items is not a
serious concern in the current study. Almost all questions with missing values were
requiring respondents to provide similar kinds of estimates (either monetary,
percentage or hours). All responses, in particular for all the three questions on
compliance costs (i.e. questions 9, 10-3 and 13-3), were scrutinised for validity and
a few questionnaires with extreme outliers and missing values were replaced by
imposing a realistic maximum value and imputed mean value respectively.
Table P.1: Question (and sub-question) with Missing Items
Question Description Questionnaire Missing
Number Total a Completed Percentage
18 Compensation amount 175 106 39
13-4 b Breakdown of external work 165 113 32
11 Breakdown of internal work 169 120 29
10-3 b Additional non-staff cost 65 53 18
9 Internal time spent and wages 175 147 16
8-2 b Possible refund 43 37 14
13-3 b External tax fees 165 152 8
10-2 b Nature of additional cost 65 60 8 a Does not total up to 175 cases due to non-applicability to some respondents. b The sub-question’s number is not indicated in the survey questionnaire. The number refers to the position of the question. For example, question 13-4 refers to the fourth sub-question in question 13.
Overall, 40 cases had missing values, at least for one of its compliance cost
components, mainly for internal time spent and wages (28 cases). Out of 175
respondents, 147 provided answers to one or more of four staff categories, but left
other category(s) blank. In such cases, a ‘blank’ response was treated as zero. The
fact that not all categories of staff are involved in tax-related work must be
acknowledged. If questions were left blank (i.e. not answered), then such cases were
treated as missing items (28 cases). Missing values for the three costs component

331
were replaced by their respective mean value. Following mean substitution, the
average compliance costs are estimated at RM9,295.224
A few questionnaires with extreme outliers were replaced by imposing a realistic
maximum value. The reference value for wages (for relevant equivalent position)
was obtained from the Annual Salary Survey 2006 (Federation of Malaysian
Manufacturers 2007). Broadly, it is also comparable to a Salary and Fringe Benefits
Survey 2006 conducted by the Malaysian Employers Federation (2007). The
reference value for tax fee was obtained from a separate survey of tax professionals
(see Chapter Four, subsection 4.11.2 and Chapter Six, subsection 6.9.1). No
appropriate reference values are available for internal time spent by staff categories
and for non-staff additional costs. Accordingly, the researcher’s best judgment was
used in handling extreme outliers for those variables. This approach is reasonable,
since the main objective of imposing a maximum value is to take out the gross effect
of an extreme value. Replies for the remaining questions (i.e. other than compliance
cost components) have no implication on the compliance cost computation.
Available responses sufficed for general descriptive purposes, provided that the
effects of extreme outliers (if any) are removed. Similar to additional costs, extreme
outliers for tax refund (four cases) and possible compensation claim (five cases)
were replaced. As for breakdown of routine and planning work (for both internal and
external), a few incorrect and/or illogical responses (i.e. a total percentage was not
equal to/more than 100 percent) were re-computed based on the given percentage,
an approach similar to that adopted in Slemrod and Venkatesh (2002).
A similar approach was adopted for the web survey. The case of outliers is less
marked and, broadly, missing percentages are lower in the context of the web
survey. Relative to the mail survey, a higher missing percentage was observed for
two questions, i.e. additional non-staff costs (28 percent—seven cases) and external
fees (11 percent—seven cases). As for additional cost, a detailed check on the nature
of additional cost indicates that six respondents described a non-tax related cost as
an additional cost. Accordingly, these responses were changed to having no
additional cost.
224 If the Expectation-Maximization substitution approach is to be used to impute the missing values, the compliance costs would be reduced to RM9,264 or by only 0.3 percent.

APPENDIX Q
Rotated Component Matrix for Factor Analysis

332
Rotated Component Matrix for Factor Analysis
Tax Attitudinal Aspects Complexity Fairness Rate Personally I consider corporate Income Tax return
preparations difficult. [Comp 1] .807
Corporate Income Tax law is relatively simple. [Comp 2—Reverse Coded]
.745
Complexity in the Income Tax law is necessary so that companies are treated fairly. [Comp 3]
-
Corporate Income Tax is so complicated that only people who can afford to pay tax professionals can take advantage of most legal ways to save much taxes. [Comp 4]
.844
I believe that each company’s officers have a moral obligation to report all of their company’s income and pay the correct amount of Corporate Income Tax. [Fair 1]
.574
Do you believe that the move to self-assessment system made the corporate tax laws more or less fair? [Fair 2]
.776
Overall, has the move to self-assessment system made the distribution of the Corporate Income Tax burden among small, medium and large companies more or less fair? [Fair 3]
.746
Do you believe that as result of changes in the Corporate Income Tax during the past five years SME companies are paying more or less taxes?
[Fair 4—Reverse Coded]
.666
Do you believe that as result of changes in the Corporate Income Tax during the past five years large companies are paying more or less taxes? [Fair 5]
.632
A fair tax rate should be the same for every company, regardless of their size (small, medium, or large). [Rate 1]
.606
Large companies have greater ability to pay Income Tax, so it is fair that they should pay a higher rate of tax than small and medium companies. [Rate 2]
.872
It is fair that high-profit companies should pay a higher rate of tax than low-profit companies. [Rate 3]
.872
Note: Extraction Method: Principal Component Analysis; rotation method: varimax with Kaiser Normalization. Items ‘Comp 2’ and ‘Fair 4’ are reversed coded. The Kaiser-Meyer-Olkin statistic was 0.631, signifying sample size in the current study was reasonable. Bartlett’s Test of Sphericity was significant (p = 0.00), suggesting the survey data were suitable for factor analysis.

APPENDIX R
Regression Analysis: Assessment of Assumptions
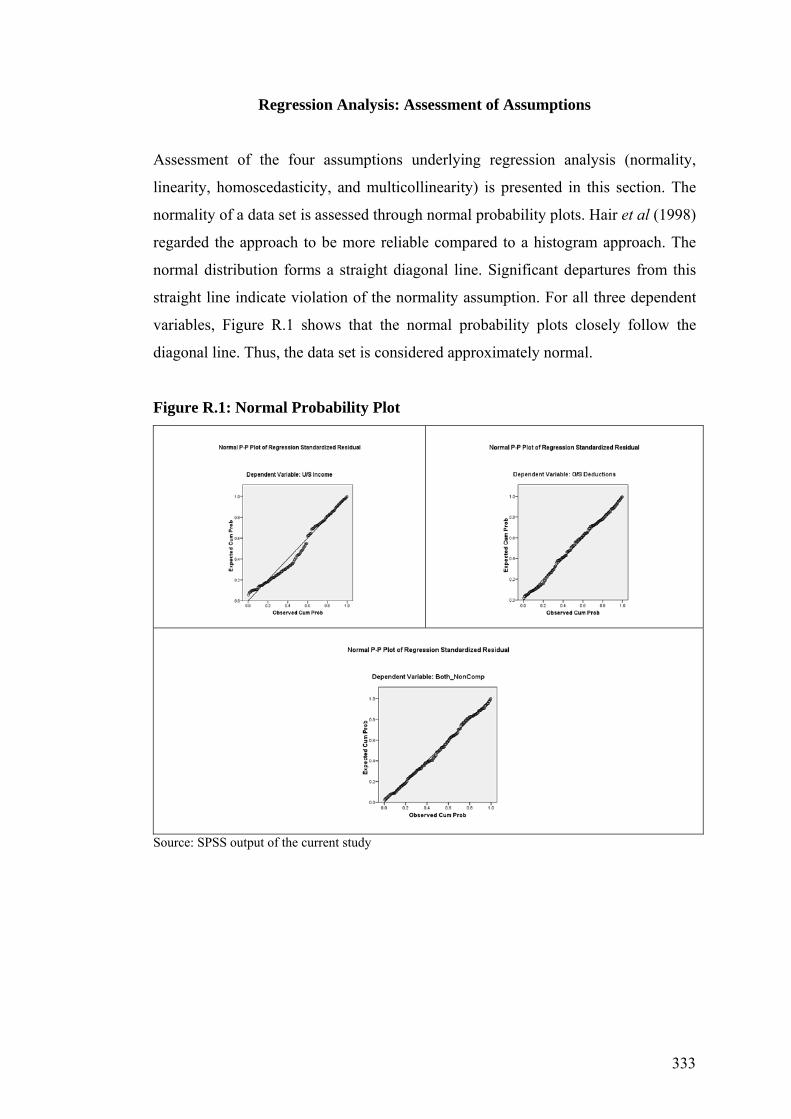
333
Regression Analysis: Assessment of Assumptions
Assessment of the four assumptions underlying regression analysis (normality,
linearity, homoscedasticity, and multicollinearity) is presented in this section. The
normality of a data set is assessed through normal probability plots. Hair et al (1998)
regarded the approach to be more reliable compared to a histogram approach. The
normal distribution forms a straight diagonal line. Significant departures from this
straight line indicate violation of the normality assumption. For all three dependent
variables, Figure R.1 shows that the normal probability plots closely follow the
diagonal line. Thus, the data set is considered approximately normal.
Figure R.1: Normal Probability Plot
Source: SPSS output of the current study

334
The assumption of linearity is examined through a scatterplot diagram between
standardized residual values (ZRESID) and standardized predicted values (ZPRED).
Linearity means that there is a straight line relationship between the independent
variables and the dependent variable. Figure R.2 shows that a scatterplot of residuals
indicates no evidence of non-linearity for all of the three dependent variables.
Figure R.2: Scatter Plot Diagram
Source: SPSS output of the current study
The same scatterplot diagram is used to assess the assumption of homoscedasticity.
Homoscedasticity refers to the assumption that the dependent variable exhibits
similar amounts of variance across the range of values for an independent variable.
Graphical patterns, such as cones or diamonds, exhibit departures of the assumption
of homoscedasticity (Hair et al. 1998). The scatter plot diagrams, as shown in Figure
R.2, show no clear evidence of unequal variances (heteroscedasticity) and thus
exhibit homoscedasticity.
335
Finally, the potential effect of multicollinearity is assessed through the variance
inflation factor (VIF) measure. Multicollinearity occurs when independent variables
in the regression model are more highly correlated with other independent variables
than with the dependent variable. A VIF of more than 10 indicates a high degree of
multicollinearity (Myers 1990; Hair et al. 1998). The VIF recorded in the current
study ranges between one to less than two, thus rejecting the severity of
multicollinearity in this study.
Overall, the researcher is satisfied that all the four underlying assumptions for
multiple regressions were not violated. The above assessment primarily used
turnover as a business size measure. A similar finding is obtained in terms of the
other two size proxies, i.e. by staff number and NSDC definition. Assessments of
assumptions in a web survey indicate similar results.

APPENDIX S
Detailed Results of Multiple Regressions

336
Table S.1: Detailed Results of Multiple Regressions (Turnover as Primary Size
Measure)
Model/ Independent Variables
Understatement of Income (Model 1)
Overstatement of Deductions
(Model 2)
Both Non- compliance (Model 3)
Turnover: - Less than RM250,000 - RM1,000,000–RM4,999,999 - RM5,000,000 or more
- 0.101
(- 1.091) - 0.119
(- 1.272) - 0.110
(- 1.071)
- 0.096
(- 1.067) 0.038
(0.423) - 0.087
(- 0.875)
- 0.113
(- 1.250) - 0.043
(- 0.473) - 0.113
(- 1.126) Sector: - Manufacturing - Manufacturing-related - Construction
0.100
(1.136) 0.069
(0.796) 0.081
(0.952)
0.115
(1.356) 0.140
(1.656) 0.173 b (2.094)
0.123
(1.446) 0.121
(1.430) 0.147 c (1.778)
Year - 0.137 c (- 1.671)
- 0.107 (- 1.346)
- 0.139 c (- 1.744)
Tax: - No Tax - RM100,000 or more
- 0.23
(- 0.267) 0.108
(1.194)
0.80
(0.959) 0.096
(1.094)
0.035
(0.414) 0.116
(1.325) Compliance Costs 0.061
(0.716) 0.072
(0.883) 0.076
(0.928) Complexity 0.168 b
(2.086) 0.267 a (3.416)
0.251 a (3.203)
Fairness - 0.028 (- 0.34)
- 0.002 (- 0.020)
- 0.016 (- 0.205)
Rate 0.114 (1.444)
0.029 (0.380)
0.080 (1.045)
Incentives - 0.043 (- 0.546)
- 0.005 (- 0.067)
- 0.027 (- 0.350)
Audit 0.155 c (1.899)
0.251 a (3.174)
0.234 a (2.953)
IRB 0.065 (0.788)
- 0.071 (- 0.888)
- 0.006 (- 0.076)
R2 0.122 0.176 0.172 Adjusted R2 0.029 0.089 0.090 Standard Error 1.204 1.250 1.059 F-value 1.315 2.016 1.958 P-value 0.195 0.015 b 0.019 b
Number of respondents equals 172, t-value is given in parenthesis. a Significant at the one percent level. b Significant at the five percent level. c Significant at the 10 percent level.
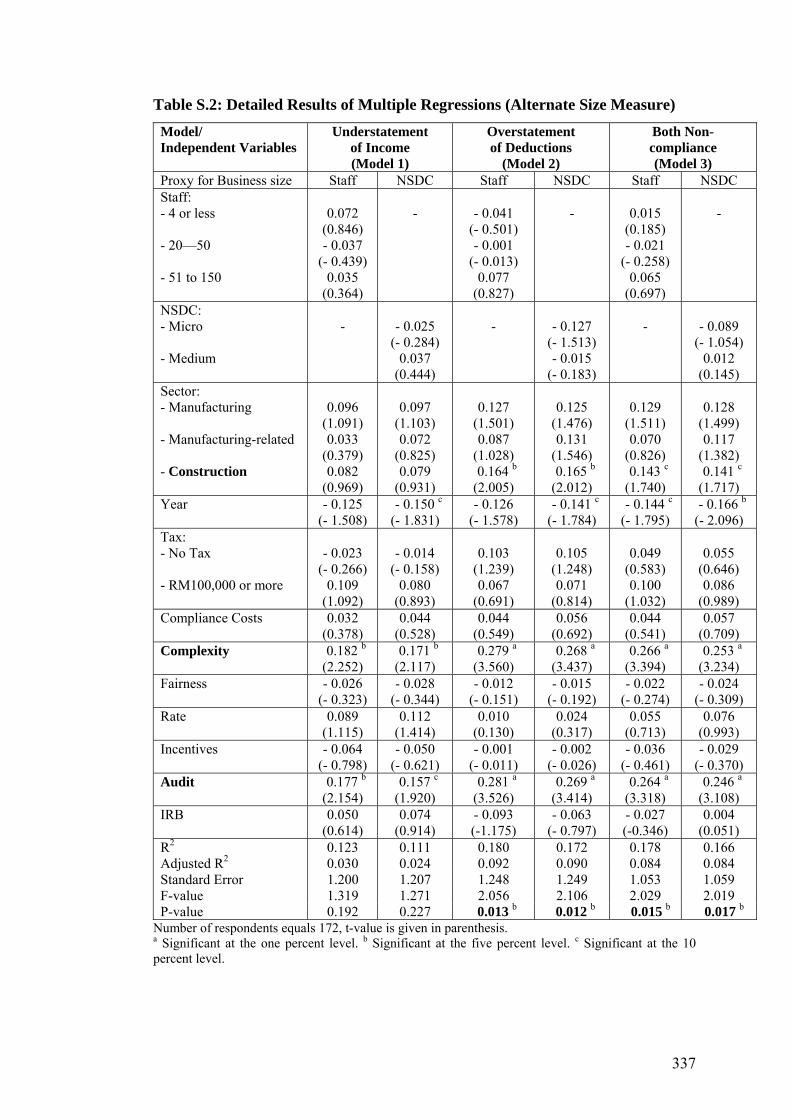
337
Table S.2: Detailed Results of Multiple Regressions (Alternate Size Measure)
Model/ Independent Variables
Understatement of Income (Model 1)
Overstatement of Deductions
(Model 2)
Both Non- compliance (Model 3)
Proxy for Business size Staff NSDC Staff NSDC Staff NSDC Staff: - 4 or less - 20—50 - 51 to 150
0.072
(0.846) - 0.037
(- 0.439) 0.035
(0.364)
-
- 0.041
(- 0.501) - 0.001
(- 0.013) 0.077
(0.827)
-
0.015
(0.185) - 0.021
(- 0.258) 0.065
(0.697)
-
NSDC: - Micro - Medium
-
- 0.025
(- 0.284) 0.037
(0.444)
-
- 0.127
(- 1.513) - 0.015
(- 0.183)
-
- 0.089
(- 1.054) 0.012
(0.145) Sector: - Manufacturing - Manufacturing-related - Construction
0.096
(1.091) 0.033
(0.379) 0.082
(0.969)
0.097
(1.103) 0.072
(0.825) 0.079
(0.931)
0.127
(1.501) 0.087
(1.028) 0.164 b (2.005)
0.125
(1.476) 0.131
(1.546) 0.165 b (2.012)
0.129
(1.511) 0.070
(0.826) 0.143 c (1.740)
0.128
(1.499) 0.117
(1.382) 0.141 c (1.717)
Year - 0.125 (- 1.508)
- 0.150 c (- 1.831)
- 0.126 (- 1.578)
- 0.141 c (- 1.784)
- 0.144 c (- 1.795)
- 0.166 b (- 2.096)
Tax: - No Tax - RM100,000 or more
- 0.023
(- 0.266) 0.109
(1.092)
- 0.014
(- 0.158) 0.080
(0.893)
0.103
(1.239) 0.067
(0.691)
0.105
(1.248) 0.071
(0.814)
0.049
(0.583) 0.100
(1.032)
0.055
(0.646) 0.086
(0.989) Compliance Costs 0.032
(0.378) 0.044
(0.528) 0.044
(0.549) 0.056
(0.692) 0.044
(0.541) 0.057
(0.709) Complexity 0.182 b
(2.252) 0.171 b (2.117)
0.279 a (3.560)
0.268 a (3.437)
0.266 a (3.394)
0.253 a (3.234)
Fairness - 0.026 (- 0.323)
- 0.028 (- 0.344)
- 0.012 (- 0.151)
- 0.015 (- 0.192)
- 0.022 (- 0.274)
- 0.024 (- 0.309)
Rate 0.089 (1.115)
0.112 (1.414)
0.010 (0.130)
0.024 (0.317)
0.055 (0.713)
0.076 (0.993)
Incentives - 0.064 (- 0.798)
- 0.050 (- 0.621)
- 0.001 (- 0.011)
- 0.002 (- 0.026)
- 0.036 (- 0.461)
- 0.029 (- 0.370)
Audit 0.177 b (2.154)
0.157 c (1.920)
0.281 a (3.526)
0.269 a (3.414)
0.264 a (3.318)
0.246 a (3.108)
IRB 0.050 (0.614)
0.074 (0.914)
- 0.093 (-1.175)
- 0.063 (- 0.797)
- 0.027 (-0.346)
0.004 (0.051)
R2 0.123 0.111 0.180 0.172 0.178 0.166 Adjusted R2 0.030 0.024 0.092 0.090 0.084 0.084 Standard Error 1.200 1.207 1.248 1.249 1.053 1.059 F-value 1.319 1.271 2.056 2.106 2.029 2.019 P-value 0.192 0.227 0.013 b 0.012 b 0.015 b 0.017 b
Number of respondents equals 172, t-value is given in parenthesis. a Significant at the one percent level. b Significant at the five percent level. c Significant at the 10 percent level.

APPENDIX T
Details of Key Findings of the Survey of Tax Professionals

338
Table T.1: Tax Professionals’ Views towards each Tax Attitudinal Item
Description Mean Median Standard Deviation
Comp 1 2.68 3.00 0.91
Comp 2 2.61 3.00 0.80
Comp 3 3.19 3.00 0.91
Comp 4 3.52 4.00 1.09
Fair 1 4.13 4.00 0.76
Fair 2 3.16 3.00 0.64
Fair 3 3.16 3.00 0.69
Fair 4 3.10 3.00 0.94
Fair 5 3.26 3.00 0.73
Rate 1 3.06 3.00 1.06
Rate 2 3.26 3.00 1.06
Rate 3 2.87 3.00 1.19
IRB Relationship 2.94 3.00 1.09
Tax Audit 2.48 3.00 1.09
Tax Incentives 3.84 4.00 0.97
Tax Benefit 1 4.16 4.00 0.82
Tax Benefit 2 4.13 4.00 0.67
Tax Benefit 3 3.32 3.00 0.83
Number of respondents equals 31. Description used is similar to postal and web survey but in the context of survey professionals. Refer Appendix O for the exact wording in the questionnaire. An additional three descriptions apply in the survey of professionals: Benefit 1 (I believe that record keeping helps SME companies to manage their businesses more effectively), Benefit 2 (I believe that good record keeping may reduce the compliance costs of SMEs) and Benefit 3 (I believe that good record keeping may reduce the likelihood of the tax audit).

339
Table T.2: Tax Attitudinal Aspects and Tax Behaviour:
Results of Correlation Analysis of Tax Professional Survey
Understatement
of Income a
Overstatement
of Deductions a
Both
Non-compliance a
Tax Complexity - 0.120 - 0.098 - 0.116
Tax Fairness + 0.015 - 0.072 - 0.031
Tax Rate Structure + 0.110 - 0.168 - 0.033
Tax Incentives + 0.094 + 0.184 + 0.149
Tax Audit + 0.253 + 0.307 + 0.299
IRB relationship - 0.139 - 0.108 - 0.132
Tax Benefits - 0.164 - 0.277 - 0.236
Number of respondents equals 31. Positive (+) or negative (-) signs denote a direct or indirect relationship respectively.
Table T.3: Results of Multiple Regressions of Tax Professional Survey Model/ Independent Variables
Understatement of Income (Model 1)
Overstatement of Deductions
(Model 2)
Both Non-compliance
(Model 3) Complexity - 0.230
(- 1.044) - 0.296 (- 1.387)
0.251 (3.203)
Fairness 0.152 (0.728)
0.089 (0.442)
- 0.016 (- 0.205)
Rate 0.130 (0.590)
- 0.257 (- 1.210)
0.080 (1.045)
Incentives 0.078 (0.356)
0.295 (1.393)
- 0.027 (- 0.350)
Audit 0.337 (1.210)
0.171 (0.636)
0.234 (2.953)
IRB - 0.282 (- 1.305)
- 0.218 (- 1.042)
- 0.006 (- 0.076)
Tax Benefits 0.043 (0.154)
- 0.101 (- 0.378)
- 0.006 (- 0.076)
R2 0.169 0.224 0.185 Adjusted R2 0.084 0.012 0.063 Standard Error 1.327 1.309 1.243 F-value 0.667 0.950 0.744 P-value 0.697 0.489 0.638
Number of respondents equals 31; t-value is given in parenthesis.

APPENDIX U
Summary of Suggestions Made by Respondents

340
Table U.1: Respondents’ Suggestions for Reducing Tax Preparation Work
Number Percent
Simplify tax return form 13 50.0
Less documentation to furnish 3 11.5
Reduced record keeping year 3 11.5
Less changes to tax laws 2 7.7
Free tax updates from the IRB 2 7.7
Tax exempt for first three years 2 7.7
Free tax software 1 3.9
Total 26 100.0
Number of respondents equals 23. A number of respondents had more than one suggestion.
Table U.2: Respondents’ Suggestions on Overall SME Taxation
Number Percent
More tax incentives and low tax rates 28 43.1
Abolish advanced tax estimates 7 10.8
Tax relaxation (i.e. later deadline and cash
basis for taxing SMEs)
7
10.8
More free seminars 6 9.2
Lower tax fees 3 4.6
Exempt financial audit on SMEs 3 4.6
Low penalties 4 6.2
Eliminate ambiguous law on deduction 2 3.1
Others (1 each)
More government assistance
Focus on educating and not to punish
More friendly tax officer
Reduce number of indirect taxes
Rebate for good taxpayer
5 7.7
Total 65 100.0 a
Number of respondents equals 33. A number of respondents had more than one suggestion. a Total percentage does not total up to one hundred due to rounding.