income tax department tax data/income-tax... · income tax return statistics assessment year...
TRANSCRIPT
Income Tax Return Statistics Assessment Year 2013-14 Version 1.0
Income Tax Department
Income Tax Return Statistics
Assessment Year 2013-14
Version 1.0
October 2016
Income Tax Return Statistics Assessment Year 2013-14 Version 1.0
1
Document Version Control
Version Month Remarks
1.0 Oct 2016 The statistics were generated from e-filed returns (digitally signed or
where ITRV has been received) and paper returns captured in system
up to31st August 2016.
Income Tax Return Statistics Assessment Year 2013-14 Version 1.0
2
Table of Contents
Overview ............................................................................................................................. 5
Objective ..................................................................................................................................... 5
Methodology Adopted ............................................................................................................. 5
Consistency Rules ................................................................................................................... 5
Status wise distribution of returns and key values ......................................................... 6
Limitations .................................................................................................................................. 7
Disclaimer ................................................................................................................................... 7
1. Income Tax Returns - All Taxpayers....................................................................... 8
1.1 All Taxpayers – Gross Total Income (AY 2013-14) .............................................. 9
1.2 All Taxpayers - Range of Salary Income (AY 2013-14)..................................... 10
1.3 All Taxpayers - Range of House Property Income (AY 2013-14) ................... 11
1.4 All Taxpayers - Range of Business Income (AY 2013-14) ............................... 12
1.5 All Taxpayers - Range of Long Term Capital Gains (AY 2013-14) ................ 13
1.6 All Taxpayers - Range of Short Term Capital Gains(AY 2013-14) ................. 14
1.7 All Taxpayers - Range of Other Sources Income (AY 2013-14) ..................... 15
1.8 All Taxpayers - Range of Interest Income (AY-2012-13) .................................. 16
1.9 All Taxpayers-Range of Brought Forward Loss Set off (AY 2013-14).......... 17
1.10 All Taxpayers - Range of Returned Income (AY 2013-14) ............................... 18
1.11 All Taxpayers - Range of Tax Payable (AY 2013-14) ........................................ 19
2. Income Tax Returns – Individuals ......................................................................... 20
2.1 Individual– Gross Total Income (AY 2013-14) .................................................... 21
2.2 Individual- Range of Salary Income (AY 2013-14) ............................................. 22
2.3 Individual- Range of House Property Income (AY 2013-14) ........................... 23
2.4 Individual- Range of Business Income (AY 2013-14) ....................................... 24
2.5 Individual- Range of Long Term Capital Gains (AY 2013-14) ......................... 25
2.6 Individual- Range of Short Term Capital Gains (AY 2013-14) ........................ 26
2.7 Individual- Range of Other Sources Income (AY 2013-14) ............................. 27
2.8 Individual- Range of Interest Income (AY 2013-14)........................................... 28
2.9 Individual- Range of Brought Forward Loss Set off (AY 2013-14) ................ 29
2.10 Individual- Range of Returned Income (AY 2013-14) ....................................... 30
2.11 Individual- Range of Tax Payable (AY 2013-14) ................................................. 31
Income Tax Return Statistics Assessment Year 2013-14 Version 1.0
3
3. Income Tax Returns - HUF ...................................................................................... 32
3.1 HUF– Gross Total Income (AY 2013-14) .............................................................. 33
3.2 HUF- Range of House Property Income (AY 2013-14) ...................................... 34
3.3 HUF- Range of Business Income (AY 2013-14) .................................................. 35
3.4 HUF- Range of Long Term Capital Gains (AY 2013-14) ................................... 36
3.5 HUF- Range of Short Term Capital Gains (AY 2013-14)................................... 37
3.6 HUF- Range of Other Sources Income (AY 2013-14) ........................................ 38
3.7 HUF- Range of Interest Income (AY 2013-14) ..................................................... 39
3.8 HUF- Range of Brought Forward Loss Set off (AY 2013-14) .......................... 40
3.9 HUF- Range of Returned Income (AY 2013-14) .................................................. 41
3.10 HUF- Range of Tax Payable (AY 2013-14) ........................................................... 42
4. Income Tax Returns - Firms .................................................................................... 43
4.1 Firm – Gross Total Income (AY 2013-14) ............................................................. 44
4.2 Firm- Range of House Property Income (AY 2013-14) ..................................... 45
4.3 Firm- Range of Business Income (AY 2013-14) ................................................. 46
4.4 Firm- Range of Long Term Capital Gains (AY 2013-14) ................................... 47
4.5 Firm- Range of Short Term Capital Gains (AY 2013-14) .................................. 48
4.6 Firm- Range of Other Sources Income (AY 2013-14) ....................................... 49
4.7 Firm- Range of Interest Income (AY 2013-14) .................................................... 50
4.8 Firm- Range of Brought Forward Loss Set off (AY 2013-14) .......................... 51
4.9 Firm- Range of Returned Income (AY 2013-14) ................................................. 52
4.10 Firm- Range of Tax Payable (AY 2013-14) ........................................................... 53
5. Income Tax Returns - AOP/BOI .............................................................................. 54
5.1 AOP/BOI – Gross Total Income (AY 2013-14) ..................................................... 55
5.2 AOP/BOI- Range of House Property Income (AY 2013-14) ............................. 56
5.3 AOP/BOI- Range of Business Income (AY 2013-14) ......................................... 57
5.4 AOP/BOI- Range of Long Term Capital Gains (AY 2013-14) ........................... 58
5.5 AOP/BOI- Range of Short Term Capital Gains (AY 2013-14) .......................... 59
5.6 AOP/BOI- Range of Other Sources Income (AY 2013-14) ............................... 60
5.7 AOP/BOI- Range of Interest Income (AY 2013-14) ............................................ 61
5.8 AOP/BOI- Range of Brought Forward Loss Set off (AY 2013-14) ................. 62
5.9 AOP/BOI- Range of Returned Income (AY 2013-14) ......................................... 63
5.10 AOP/BOI- Range of Tax Payable (AY 2013-14) ................................................... 64
Income Tax Return Statistics Assessment Year 2013-14 Version 1.0
4
6. Income Tax Returns - Company ............................................................................ 65
6.1 Company – Gross Total Income (AY 2013-14) ................................................... 66
6.2 Company- Range of House Property Income (AY 2013-14) ............................ 67
6.3 Company- Range of Business Income (AY 2013-14) ........................................ 68
6.4 Company- Range of Long Term Capital Gains (AY 2013-14) ......................... 69
6.5 Company- Range of Short Term Capital Gains (AY 2013-14) ......................... 70
6.6 Company- Range of Other Sources Income (AY 2013-14) .............................. 71
6.7 Company- Range of Interest Income (AY 2013-14) ........................................... 72
6.8 Company- Range of Brought Forward Loss Set off (AY 2013-14) ................ 73
6.9 Company- Range of Returned Income(AY 2013-14) ......................................... 74
6.10 Company- Range of Tax Payable (AY 2013-14) ................................................. 75
7. Type of Business ....................................................................................................... 76
7.1 Type of Business –Corporate and Non- corporate Taxpayers (AY 2013-14)
77
Income Tax Return Statistics Assessment Year 2013-14 Version 1.0
5
Overview
Objective
The objective of publishing this statistics is to encourage wider use and analysis of Income-tax
data by Departmental personnel and academicians.
Methodology Adopted
The methodology adopted is as under:
i. The template for statistics was prepared on the basis of previous statistics published by
the Department and assessment of information available in various databases of the
Income Tax Department.
ii. The statistics have been generated from e-filed returns (digitally signed or where ITRV
has been received) and paper returns captured in system.
iii. In cases where more than one return is submitted, the values in the latest return have
been considered.
iv. Consistency Rules were defined (given below) to eliminate returns with inconsistent data.
3,64,36,307 returns were checked against consistency rules and 3,60,75,691 returns
meeting the consistency rules were used for statistical analysis
v. Certain statistics have been mentioned in lakh (100 thousand) and crore (10 million).
vi. Various terms used in the statistics have been defined below respective tables.
Consistency Rules
i. Rule 1: Total Capital Gains in Part B TI = STCG (including negative) + LTCG (zero and
positive only)
ii. Rule 2: Income from Other Sources (Part B TI)>=Gross Interest Income (Schedule OS)
iii. Rule 3: Salary income is shown by Individual category of assesses.
iv. Rule 4: Gross Total Income(GTI)>=0
v. Rule 5: Gross Total Income (GTI) = salary + income from house property + non-negative
total income (or calculated) from business/profession + non-negative total capital gain +
non-negative income from other sources + brought forward/current year loss setoff
vi. Rule 6 : Return Income = Gross Total Income (GTI) - Deduction u/s Chapter VIA
vii. Rule 7: Aggregate Tax Liability >=0
viii. Rule 8: Aggregate Tax Liability <= Return-Income
Income Tax Return Statistics Assessment Year 2013-14 Version 1.0
6
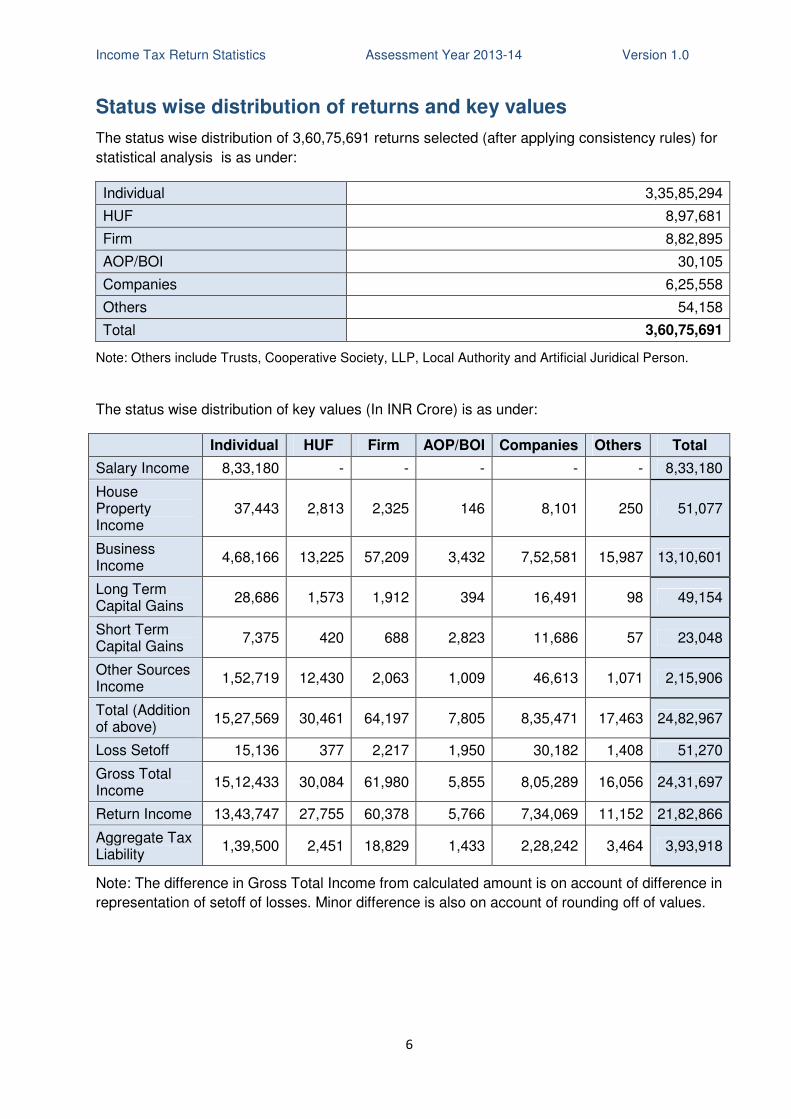
Status wise distribution of returns and key values
The status wise distribution of 3,60,75,691 returns selected (after applying consistency rules) for
statistical analysis is as under:
Individual 3,35,85,294
HUF 8,97,681
Firm 8,82,895
AOP/BOI 30,105
Companies 6,25,558
Others 54,158
Total 3,60,75,691
Note: Others include Trusts, Cooperative Society, LLP, Local Authority and Artificial Juridical Person.
The status wise distribution of key values (In INR Crore) is as under:
Individual HUF Firm AOP/BOI Companies Others Total
Salary Income 8,33,180 - - - - - 8,33,180
House Property Income
37,443 2,813 2,325 146 8,101 250 51,077
Business Income
4,68,166 13,225 57,209 3,432 7,52,581 15,987 13,10,601
Long Term Capital Gains
28,686 1,573 1,912 394 16,491 98 49,154
Short Term Capital Gains
7,375 420 688 2,823 11,686 57 23,048
Other Sources Income
1,52,719 12,430 2,063 1,009 46,613 1,071 2,15,906
Total (Addition of above)
15,27,569 30,461 64,197 7,805 8,35,471 17,463 24,82,967
Loss Setoff 15,136 377 2,217 1,950 30,182 1,408 51,270
Gross Total Income
15,12,433 30,084 61,980 5,855 8,05,289 16,056 24,31,697
Return Income 13,43,747 27,755 60,378 5,766 7,34,069 11,152 21,82,866
Aggregate Tax Liability
1,39,500 2,451 18,829 1,433 2,28,242 3,464 3,93,918
Note: The difference in Gross Total Income from calculated amount is on account of difference in
representation of setoff of losses. Minor difference is also on account of rounding off of values.
Income Tax Return Statistics Assessment Year 2013-14 Version 1.0
7
Limitations
The statistics relating to sources of income have been prepared on the basis of values
mentioned in e-filed returns and values captured from paper returns and the same may contain
data entry errors on the part of the taxpayers/ return filers. Therefore, the accuracy of the
statistics is limited by the accuracy of returns.
Disclaimer
Whilst the Income Tax Statistics have been prepared in good faith, it is not and does not purport
to be comprehensive. Neither Income Tax Department, nor any of its officers or employees
accept any liability or responsibility for the accuracy, reasonableness or completeness of, or for
any errors, omissions or misstatements, negligent or otherwise, relating to the data or any
representation or warranty, express or implied, with respect to the information contained in this
Income Tax Statistics or on the data on which this Statistics is based and liability therefore is
hereby expressly disclaimed.
Income Tax Return Statistics Assessment Year 2013-14 Version 1.0
8
1. Income Tax Returns - All Taxpayers
Income Tax Return Statistics Assessment Year 2013-14 Version 1.0
9
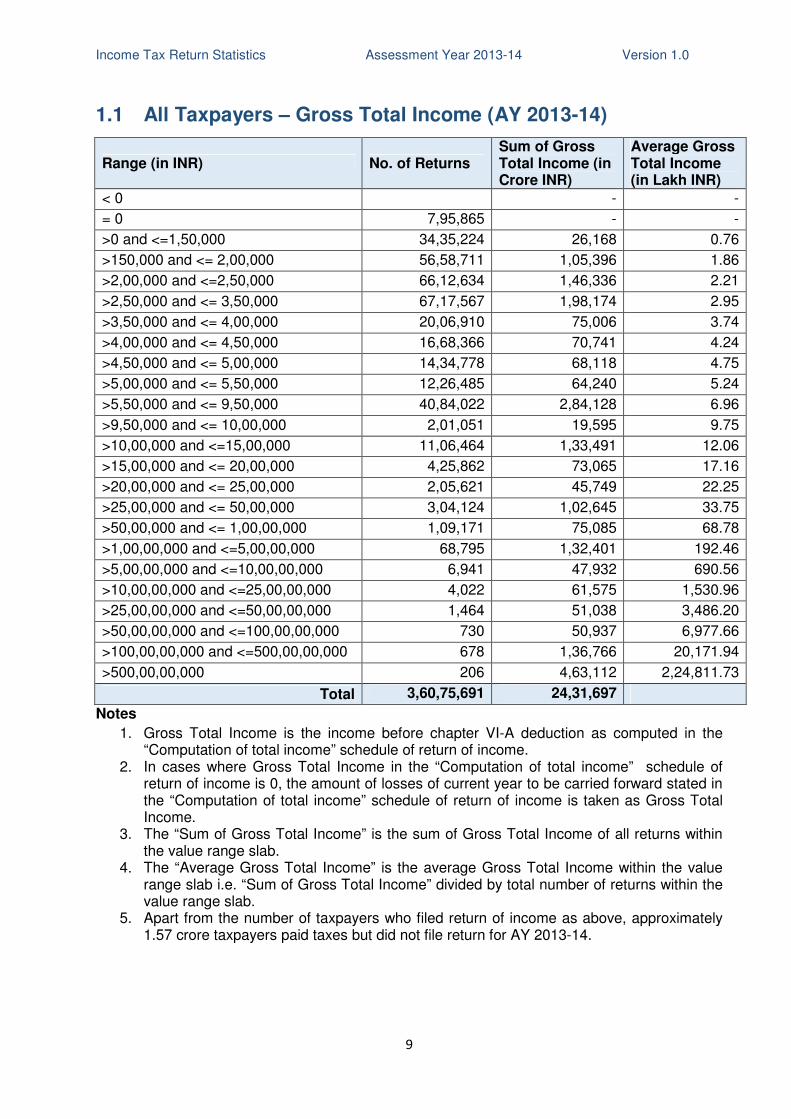
1.1 All Taxpayers – Gross Total Income (AY 2013-14)
Range (in INR) No. of Returns Sum of Gross Total Income (in Crore INR)
Average Gross Total Income (in Lakh INR)
< 0
- -
= 0 7,95,865 - -
>0 and <=1,50,000 34,35,224 26,168 0.76
>150,000 and <= 2,00,000 56,58,711 1,05,396 1.86
>2,00,000 and <=2,50,000 66,12,634 1,46,336 2.21
>2,50,000 and <= 3,50,000 67,17,567 1,98,174 2.95
>3,50,000 and <= 4,00,000 20,06,910 75,006 3.74
>4,00,000 and <= 4,50,000 16,68,366 70,741 4.24
>4,50,000 and <= 5,00,000 14,34,778 68,118 4.75
>5,00,000 and <= 5,50,000 12,26,485 64,240 5.24
>5,50,000 and <= 9,50,000 40,84,022 2,84,128 6.96
>9,50,000 and <= 10,00,000 2,01,051 19,595 9.75
>10,00,000 and <=15,00,000 11,06,464 1,33,491 12.06
>15,00,000 and <= 20,00,000 4,25,862 73,065 17.16
>20,00,000 and <= 25,00,000 2,05,621 45,749 22.25
>25,00,000 and <= 50,00,000 3,04,124 1,02,645 33.75
>50,00,000 and <= 1,00,00,000 1,09,171 75,085 68.78
>1,00,00,000 and <=5,00,00,000 68,795 1,32,401 192.46
>5,00,00,000 and <=10,00,00,000 6,941 47,932 690.56
>10,00,00,000 and <=25,00,00,000 4,022 61,575 1,530.96
>25,00,00,000 and <=50,00,00,000 1,464 51,038 3,486.20
>50,00,00,000 and <=100,00,00,000 730 50,937 6,977.66
>100,00,00,000 and <=500,00,00,000 678 1,36,766 20,171.94
>500,00,00,000 206 4,63,112 2,24,811.73
Total 3,60,75,691 24,31,697
Notes
1. Gross Total Income is the income before chapter VI-A deduction as computed in the “Computation of total income” schedule of return of income.
2. In cases where Gross Total Income in the “Computation of total income” schedule of return of income is 0, the amount of losses of current year to be carried forward stated in the “Computation of total income” schedule of return of income is taken as Gross Total Income.
3. The “Sum of Gross Total Income” is the sum of Gross Total Income of all returns within the value range slab.
4. The “Average Gross Total Income” is the average Gross Total Income within the value range slab i.e. “Sum of Gross Total Income” divided by total number of returns within the value range slab.
5. Apart from the number of taxpayers who filed return of income as above, approximately 1.57 crore taxpayers paid taxes but did not file return for AY 2013-14.
Income Tax Return Statistics Assessment Year 2013-14 Version 1.0
10
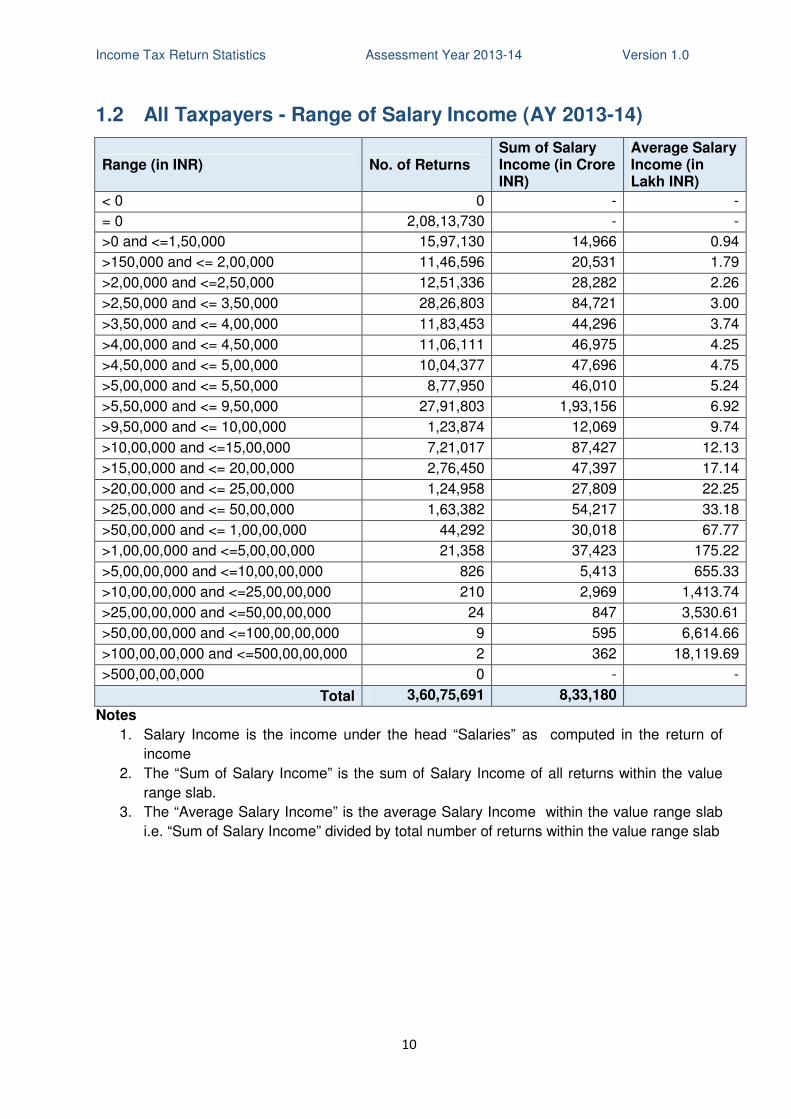
1.2 All Taxpayers - Range of Salary Income (AY 2013-14)
Range (in INR) No. of Returns Sum of Salary Income (in Crore INR)
Average Salary Income (in Lakh INR)
< 0 0 - -
= 0 2,08,13,730 - -
>0 and <=1,50,000 15,97,130 14,966 0.94
>150,000 and <= 2,00,000 11,46,596 20,531 1.79
>2,00,000 and <=2,50,000 12,51,336 28,282 2.26
>2,50,000 and <= 3,50,000 28,26,803 84,721 3.00
>3,50,000 and <= 4,00,000 11,83,453 44,296 3.74
>4,00,000 and <= 4,50,000 11,06,111 46,975 4.25
>4,50,000 and <= 5,00,000 10,04,377 47,696 4.75
>5,00,000 and <= 5,50,000 8,77,950 46,010 5.24
>5,50,000 and <= 9,50,000 27,91,803 1,93,156 6.92
>9,50,000 and <= 10,00,000 1,23,874 12,069 9.74
>10,00,000 and <=15,00,000 7,21,017 87,427 12.13
>15,00,000 and <= 20,00,000 2,76,450 47,397 17.14
>20,00,000 and <= 25,00,000 1,24,958 27,809 22.25
>25,00,000 and <= 50,00,000 1,63,382 54,217 33.18
>50,00,000 and <= 1,00,00,000 44,292 30,018 67.77
>1,00,00,000 and <=5,00,00,000 21,358 37,423 175.22
>5,00,00,000 and <=10,00,00,000 826 5,413 655.33
>10,00,00,000 and <=25,00,00,000 210 2,969 1,413.74
>25,00,00,000 and <=50,00,00,000 24 847 3,530.61
>50,00,00,000 and <=100,00,00,000 9 595 6,614.66
>100,00,00,000 and <=500,00,00,000 2 362 18,119.69
>500,00,00,000 0 - -
Total 3,60,75,691 8,33,180
Notes
1. Salary Income is the income under the head “Salaries” as computed in the return of
income
2. The “Sum of Salary Income” is the sum of Salary Income of all returns within the value
range slab.
3. The “Average Salary Income” is the average Salary Income within the value range slab
i.e. “Sum of Salary Income” divided by total number of returns within the value range slab
Income Tax Return Statistics Assessment Year 2013-14 Version 1.0
11
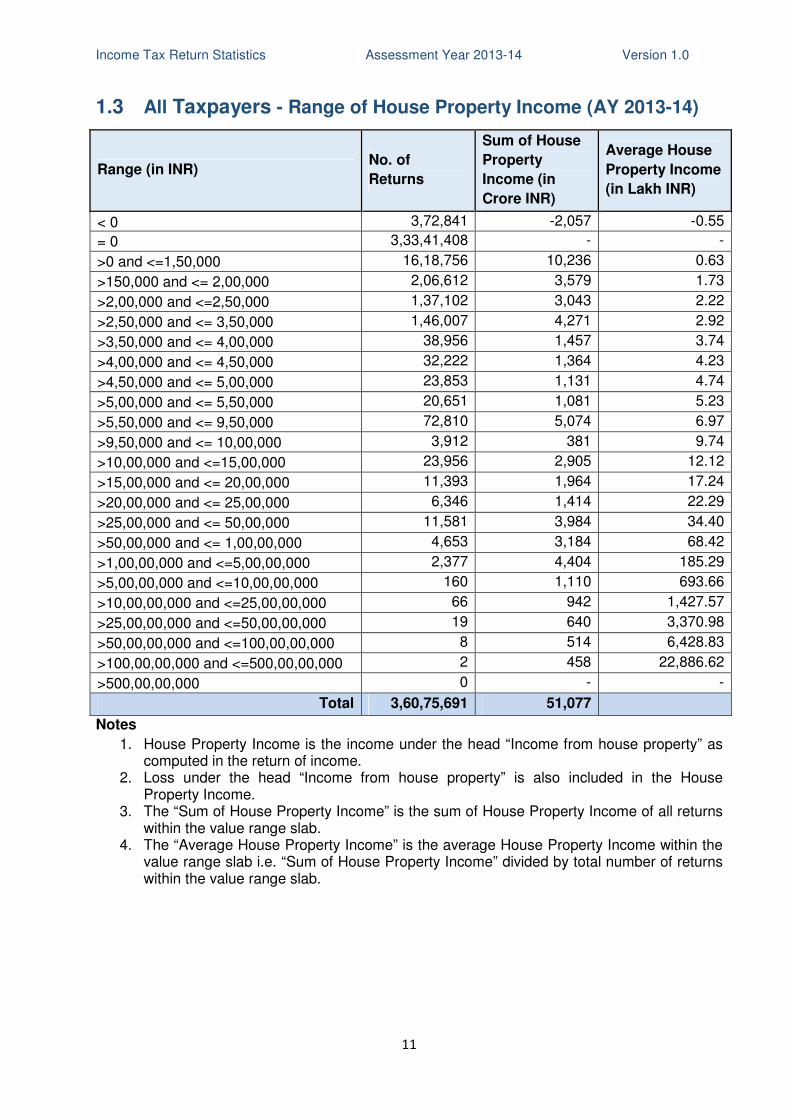
1.3 All Taxpayers - Range of House Property Income (AY 2013-14)
Range (in INR) No. of
Returns
Sum of House
Property
Income (in
Crore INR)
Average House
Property Income
(in Lakh INR)
< 0 3,72,841 -2,057 -0.55
= 0 3,33,41,408 - -
>0 and <=1,50,000 16,18,756 10,236 0.63
>150,000 and <= 2,00,000 2,06,612 3,579 1.73
>2,00,000 and <=2,50,000 1,37,102 3,043 2.22
>2,50,000 and <= 3,50,000 1,46,007 4,271 2.92
>3,50,000 and <= 4,00,000 38,956 1,457 3.74
>4,00,000 and <= 4,50,000 32,222 1,364 4.23
>4,50,000 and <= 5,00,000 23,853 1,131 4.74
>5,00,000 and <= 5,50,000 20,651 1,081 5.23
>5,50,000 and <= 9,50,000 72,810 5,074 6.97
>9,50,000 and <= 10,00,000 3,912 381 9.74
>10,00,000 and <=15,00,000 23,956 2,905 12.12
>15,00,000 and <= 20,00,000 11,393 1,964 17.24
>20,00,000 and <= 25,00,000 6,346 1,414 22.29
>25,00,000 and <= 50,00,000 11,581 3,984 34.40
>50,00,000 and <= 1,00,00,000 4,653 3,184 68.42
>1,00,00,000 and <=5,00,00,000 2,377 4,404 185.29
>5,00,00,000 and <=10,00,00,000 160 1,110 693.66
>10,00,00,000 and <=25,00,00,000 66 942 1,427.57
>25,00,00,000 and <=50,00,00,000 19 640 3,370.98
>50,00,00,000 and <=100,00,00,000 8 514 6,428.83
>100,00,00,000 and <=500,00,00,000 2 458 22,886.62
>500,00,00,000 0 - -
Total 3,60,75,691 51,077
Notes
1. House Property Income is the income under the head “Income from house property” as computed in the return of income.
2. Loss under the head “Income from house property” is also included in the House Property Income.
3. The “Sum of House Property Income” is the sum of House Property Income of all returns within the value range slab.
4. The “Average House Property Income” is the average House Property Income within the value range slab i.e. “Sum of House Property Income” divided by total number of returns within the value range slab.
Income Tax Return Statistics Assessment Year 2013-14 Version 1.0
12
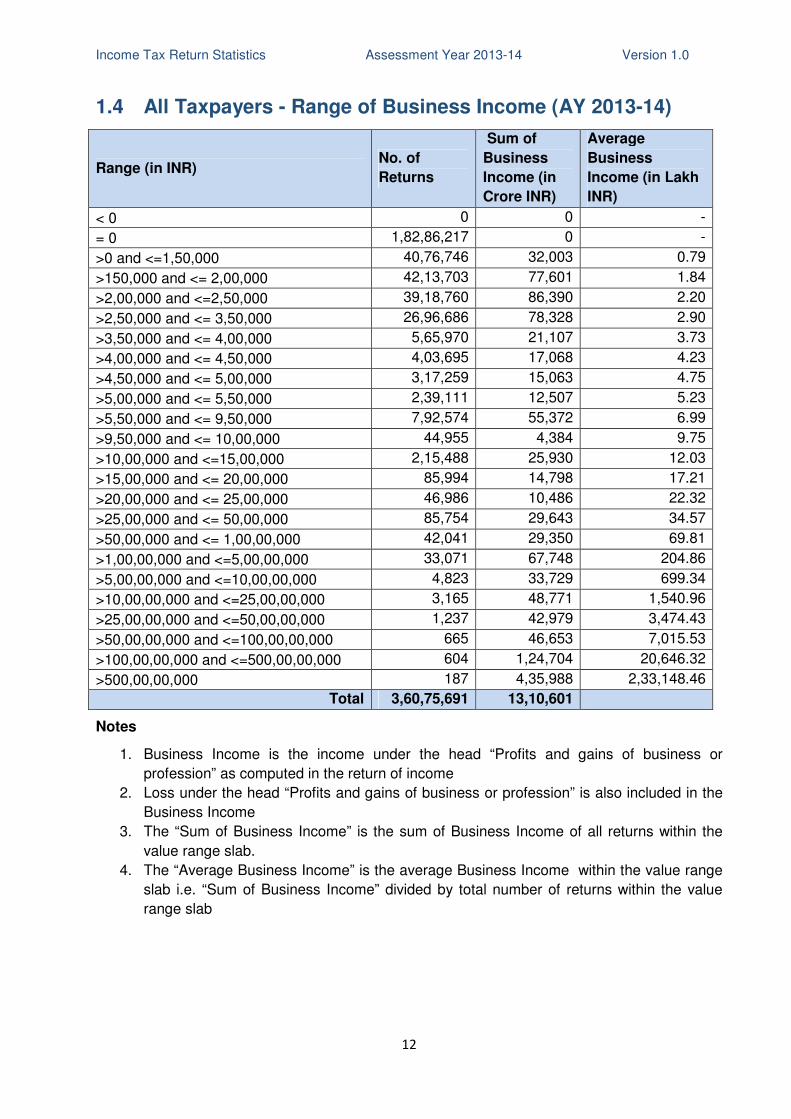
1.4 All Taxpayers - Range of Business Income (AY 2013-14)
Range (in INR) No. of
Returns
Sum of
Business
Income (in
Crore INR)
Average
Business
Income (in Lakh
INR)
< 0 0 0 -
= 0 1,82,86,217 0 -
>0 and <=1,50,000 40,76,746 32,003 0.79
>150,000 and <= 2,00,000 42,13,703 77,601 1.84
>2,00,000 and <=2,50,000 39,18,760 86,390 2.20
>2,50,000 and <= 3,50,000 26,96,686 78,328 2.90
>3,50,000 and <= 4,00,000 5,65,970 21,107 3.73
>4,00,000 and <= 4,50,000 4,03,695 17,068 4.23
>4,50,000 and <= 5,00,000 3,17,259 15,063 4.75
>5,00,000 and <= 5,50,000 2,39,111 12,507 5.23
>5,50,000 and <= 9,50,000 7,92,574 55,372 6.99
>9,50,000 and <= 10,00,000 44,955 4,384 9.75
>10,00,000 and <=15,00,000 2,15,488 25,930 12.03
>15,00,000 and <= 20,00,000 85,994 14,798 17.21
>20,00,000 and <= 25,00,000 46,986 10,486 22.32
>25,00,000 and <= 50,00,000 85,754 29,643 34.57
>50,00,000 and <= 1,00,00,000 42,041 29,350 69.81
>1,00,00,000 and <=5,00,00,000 33,071 67,748 204.86
>5,00,00,000 and <=10,00,00,000 4,823 33,729 699.34
>10,00,00,000 and <=25,00,00,000 3,165 48,771 1,540.96
>25,00,00,000 and <=50,00,00,000 1,237 42,979 3,474.43
>50,00,00,000 and <=100,00,00,000 665 46,653 7,015.53
>100,00,00,000 and <=500,00,00,000 604 1,24,704 20,646.32
>500,00,00,000 187 4,35,988 2,33,148.46
Total 3,60,75,691 13,10,601
Notes
1. Business Income is the income under the head “Profits and gains of business or
profession” as computed in the return of income
2. Loss under the head “Profits and gains of business or profession” is also included in the
Business Income
3. The “Sum of Business Income” is the sum of Business Income of all returns within the
value range slab.
4. The “Average Business Income” is the average Business Income within the value range
slab i.e. “Sum of Business Income” divided by total number of returns within the value
range slab
Income Tax Return Statistics Assessment Year 2013-14 Version 1.0
13
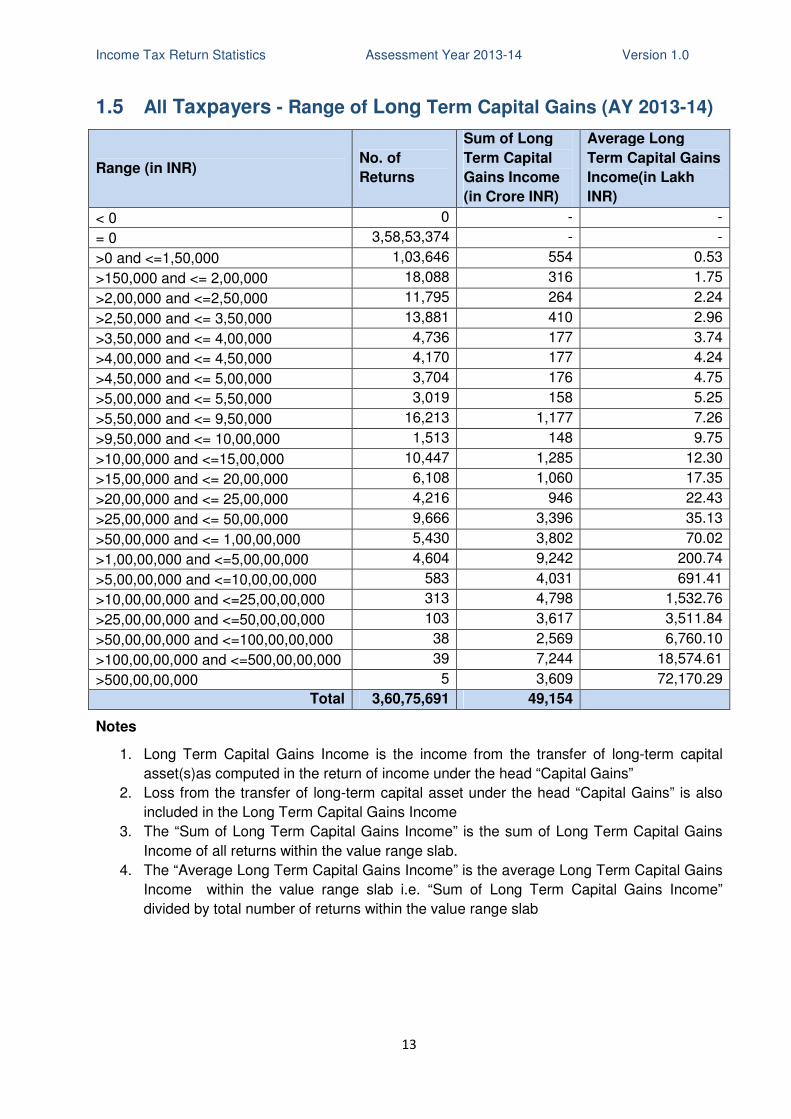
1.5 All Taxpayers - Range of Long Term Capital Gains (AY 2013-14)
Range (in INR) No. of
Returns
Sum of Long
Term Capital
Gains Income
(in Crore INR)
Average Long
Term Capital Gains
Income(in Lakh
INR)
< 0 0 - -
= 0 3,58,53,374 - -
>0 and <=1,50,000 1,03,646 554 0.53
>150,000 and <= 2,00,000 18,088 316 1.75
>2,00,000 and <=2,50,000 11,795 264 2.24
>2,50,000 and <= 3,50,000 13,881 410 2.96
>3,50,000 and <= 4,00,000 4,736 177 3.74
>4,00,000 and <= 4,50,000 4,170 177 4.24
>4,50,000 and <= 5,00,000 3,704 176 4.75
>5,00,000 and <= 5,50,000 3,019 158 5.25
>5,50,000 and <= 9,50,000 16,213 1,177 7.26
>9,50,000 and <= 10,00,000 1,513 148 9.75
>10,00,000 and <=15,00,000 10,447 1,285 12.30
>15,00,000 and <= 20,00,000 6,108 1,060 17.35
>20,00,000 and <= 25,00,000 4,216 946 22.43
>25,00,000 and <= 50,00,000 9,666 3,396 35.13
>50,00,000 and <= 1,00,00,000 5,430 3,802 70.02
>1,00,00,000 and <=5,00,00,000 4,604 9,242 200.74
>5,00,00,000 and <=10,00,00,000 583 4,031 691.41
>10,00,00,000 and <=25,00,00,000 313 4,798 1,532.76
>25,00,00,000 and <=50,00,00,000 103 3,617 3,511.84
>50,00,00,000 and <=100,00,00,000 38 2,569 6,760.10
>100,00,00,000 and <=500,00,00,000 39 7,244 18,574.61
>500,00,00,000 5 3,609 72,170.29
Total 3,60,75,691 49,154
Notes
1. Long Term Capital Gains Income is the income from the transfer of long-term capital
asset(s)as computed in the return of income under the head “Capital Gains”
2. Loss from the transfer of long-term capital asset under the head “Capital Gains” is also
included in the Long Term Capital Gains Income
3. The “Sum of Long Term Capital Gains Income” is the sum of Long Term Capital Gains
Income of all returns within the value range slab.
4. The “Average Long Term Capital Gains Income” is the average Long Term Capital Gains
Income within the value range slab i.e. “Sum of Long Term Capital Gains Income”
divided by total number of returns within the value range slab
Income Tax Return Statistics Assessment Year 2013-14 Version 1.0
14
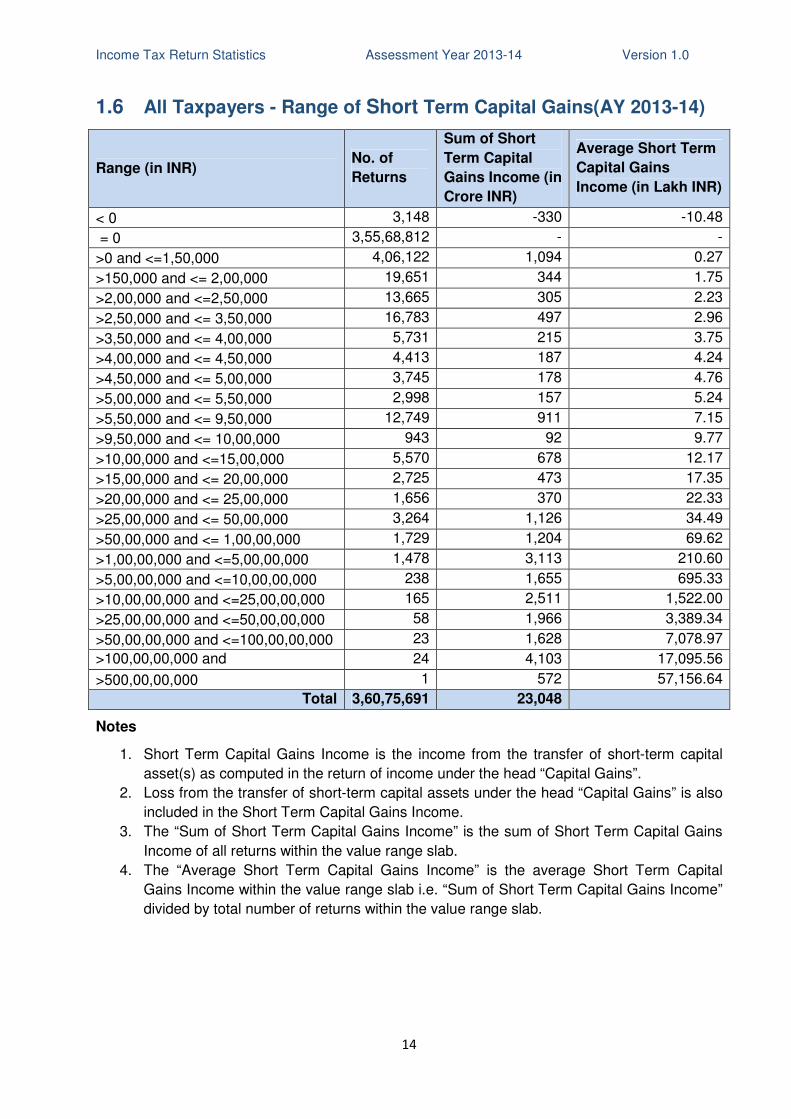
1.6 All Taxpayers - Range of Short Term Capital Gains(AY 2013-14)
Range (in INR) No. of
Returns
Sum of Short
Term Capital
Gains Income (in
Crore INR)
Average Short Term
Capital Gains
Income (in Lakh INR)
< 0 3,148 -330 -10.48
= 0 3,55,68,812 - -
>0 and <=1,50,000 4,06,122 1,094 0.27
>150,000 and <= 2,00,000 19,651 344 1.75
>2,00,000 and <=2,50,000 13,665 305 2.23
>2,50,000 and <= 3,50,000 16,783 497 2.96
>3,50,000 and <= 4,00,000 5,731 215 3.75
>4,00,000 and <= 4,50,000 4,413 187 4.24
>4,50,000 and <= 5,00,000 3,745 178 4.76
>5,00,000 and <= 5,50,000 2,998 157 5.24
>5,50,000 and <= 9,50,000 12,749 911 7.15
>9,50,000 and <= 10,00,000 943 92 9.77
>10,00,000 and <=15,00,000 5,570 678 12.17
>15,00,000 and <= 20,00,000 2,725 473 17.35
>20,00,000 and <= 25,00,000 1,656 370 22.33
>25,00,000 and <= 50,00,000 3,264 1,126 34.49
>50,00,000 and <= 1,00,00,000 1,729 1,204 69.62
>1,00,00,000 and <=5,00,00,000 1,478 3,113 210.60
>5,00,00,000 and <=10,00,00,000 238 1,655 695.33
>10,00,00,000 and <=25,00,00,000 165 2,511 1,522.00
>25,00,00,000 and <=50,00,00,000 58 1,966 3,389.34
>50,00,00,000 and <=100,00,00,000 23 1,628 7,078.97
>100,00,00,000 and <=500,00,00,000
24 4,103 17,095.56
>500,00,00,000 1 572 57,156.64
Total 3,60,75,691 23,048
Notes
1. Short Term Capital Gains Income is the income from the transfer of short-term capital
asset(s) as computed in the return of income under the head “Capital Gains”.
2. Loss from the transfer of short-term capital assets under the head “Capital Gains” is also
included in the Short Term Capital Gains Income.
3. The “Sum of Short Term Capital Gains Income” is the sum of Short Term Capital Gains
Income of all returns within the value range slab.
4. The “Average Short Term Capital Gains Income” is the average Short Term Capital
Gains Income within the value range slab i.e. “Sum of Short Term Capital Gains Income”
divided by total number of returns within the value range slab.
Income Tax Return Statistics Assessment Year 2013-14 Version 1.0
15
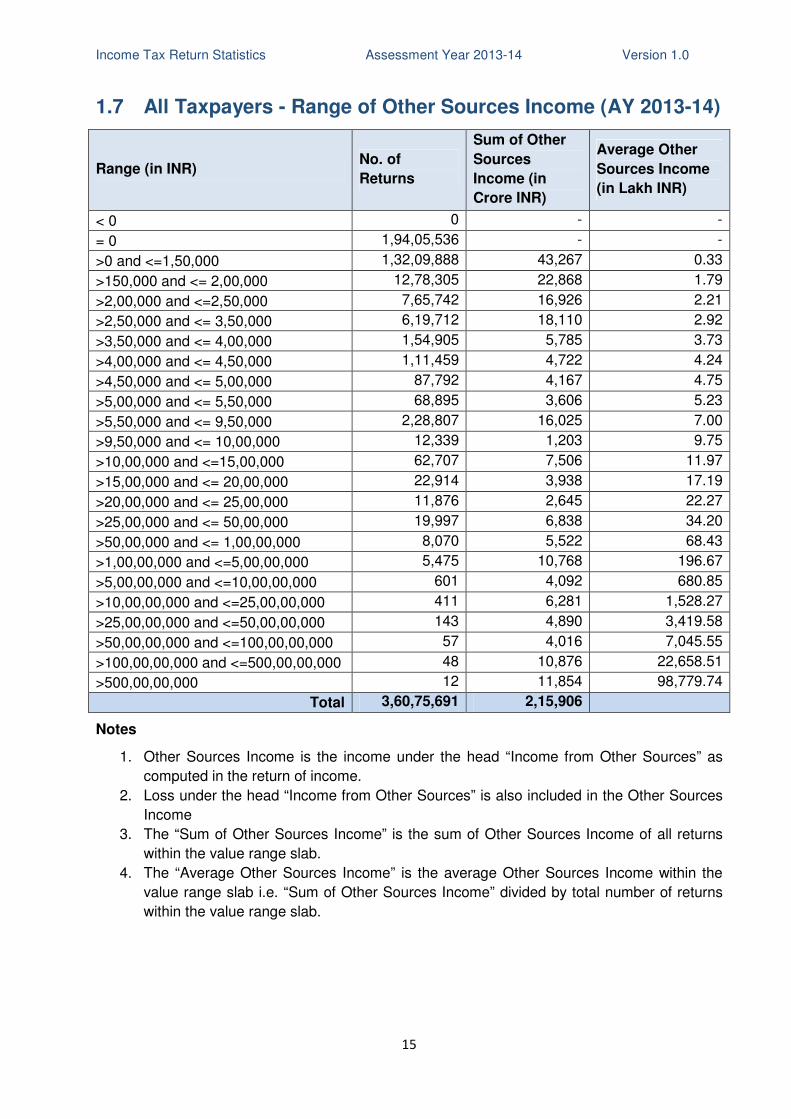
1.7 All Taxpayers - Range of Other Sources Income (AY 2013-14)
Range (in INR) No. of
Returns
Sum of Other
Sources
Income (in
Crore INR)
Average Other
Sources Income
(in Lakh INR)
< 0 0 - -
= 0 1,94,05,536 - -
>0 and <=1,50,000 1,32,09,888 43,267 0.33
>150,000 and <= 2,00,000 12,78,305 22,868 1.79
>2,00,000 and <=2,50,000 7,65,742 16,926 2.21
>2,50,000 and <= 3,50,000 6,19,712 18,110 2.92
>3,50,000 and <= 4,00,000 1,54,905 5,785 3.73
>4,00,000 and <= 4,50,000 1,11,459 4,722 4.24
>4,50,000 and <= 5,00,000 87,792 4,167 4.75
>5,00,000 and <= 5,50,000 68,895 3,606 5.23
>5,50,000 and <= 9,50,000 2,28,807 16,025 7.00
>9,50,000 and <= 10,00,000 12,339 1,203 9.75
>10,00,000 and <=15,00,000 62,707 7,506 11.97
>15,00,000 and <= 20,00,000 22,914 3,938 17.19
>20,00,000 and <= 25,00,000 11,876 2,645 22.27
>25,00,000 and <= 50,00,000 19,997 6,838 34.20
>50,00,000 and <= 1,00,00,000 8,070 5,522 68.43
>1,00,00,000 and <=5,00,00,000 5,475 10,768 196.67
>5,00,00,000 and <=10,00,00,000 601 4,092 680.85
>10,00,00,000 and <=25,00,00,000 411 6,281 1,528.27
>25,00,00,000 and <=50,00,00,000 143 4,890 3,419.58
>50,00,00,000 and <=100,00,00,000 57 4,016 7,045.55
>100,00,00,000 and <=500,00,00,000 48 10,876 22,658.51
>500,00,00,000 12 11,854 98,779.74
Total 3,60,75,691 2,15,906
Notes
1. Other Sources Income is the income under the head “Income from Other Sources” as
computed in the return of income.
2. Loss under the head “Income from Other Sources” is also included in the Other Sources
Income
3. The “Sum of Other Sources Income” is the sum of Other Sources Income of all returns
within the value range slab.
4. The “Average Other Sources Income” is the average Other Sources Income within the
value range slab i.e. “Sum of Other Sources Income” divided by total number of returns
within the value range slab.
Income Tax Return Statistics Assessment Year 2013-14 Version 1.0
16
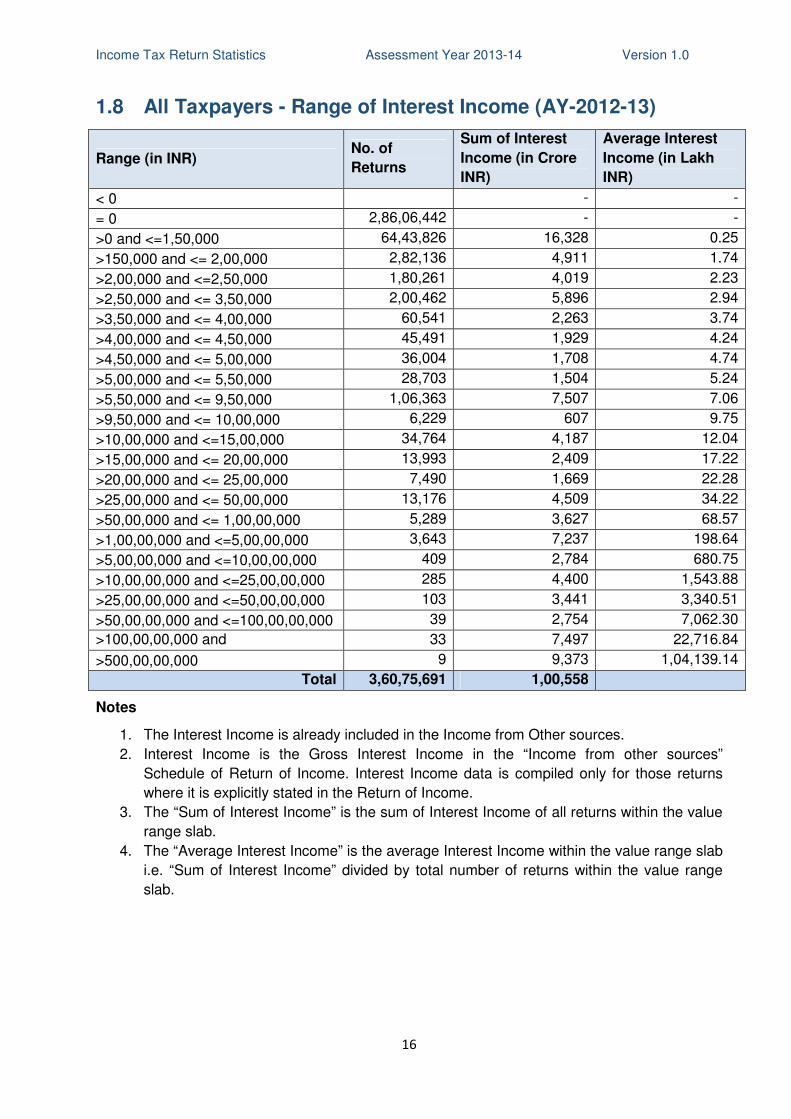
1.8 All Taxpayers - Range of Interest Income (AY-2012-13)
Range (in INR) No. of
Returns
Sum of Interest
Income (in Crore
INR)
Average Interest
Income (in Lakh
INR)
< 0 - -
= 0 2,86,06,442 - -
>0 and <=1,50,000 64,43,826 16,328 0.25
>150,000 and <= 2,00,000 2,82,136 4,911 1.74
>2,00,000 and <=2,50,000 1,80,261 4,019 2.23
>2,50,000 and <= 3,50,000 2,00,462 5,896 2.94
>3,50,000 and <= 4,00,000 60,541 2,263 3.74
>4,00,000 and <= 4,50,000 45,491 1,929 4.24
>4,50,000 and <= 5,00,000 36,004 1,708 4.74
>5,00,000 and <= 5,50,000 28,703 1,504 5.24
>5,50,000 and <= 9,50,000 1,06,363 7,507 7.06
>9,50,000 and <= 10,00,000 6,229 607 9.75
>10,00,000 and <=15,00,000 34,764 4,187 12.04
>15,00,000 and <= 20,00,000 13,993 2,409 17.22
>20,00,000 and <= 25,00,000 7,490 1,669 22.28
>25,00,000 and <= 50,00,000 13,176 4,509 34.22
>50,00,000 and <= 1,00,00,000 5,289 3,627 68.57
>1,00,00,000 and <=5,00,00,000 3,643 7,237 198.64
>5,00,00,000 and <=10,00,00,000 409 2,784 680.75
>10,00,00,000 and <=25,00,00,000 285 4,400 1,543.88
>25,00,00,000 and <=50,00,00,000 103 3,441 3,340.51
>50,00,00,000 and <=100,00,00,000 39 2,754 7,062.30
>100,00,00,000 and <=500,00,00,000
33 7,497 22,716.84
>500,00,00,000 9 9,373 1,04,139.14
Total 3,60,75,691 1,00,558
Notes
1. The Interest Income is already included in the Income from Other sources.
2. Interest Income is the Gross Interest Income in the “Income from other sources”
Schedule of Return of Income. Interest Income data is compiled only for those returns
where it is explicitly stated in the Return of Income.
3. The “Sum of Interest Income” is the sum of Interest Income of all returns within the value
range slab.
4. The “Average Interest Income” is the average Interest Income within the value range slab
i.e. “Sum of Interest Income” divided by total number of returns within the value range
slab.
Income Tax Return Statistics Assessment Year 2013-14 Version 1.0
17
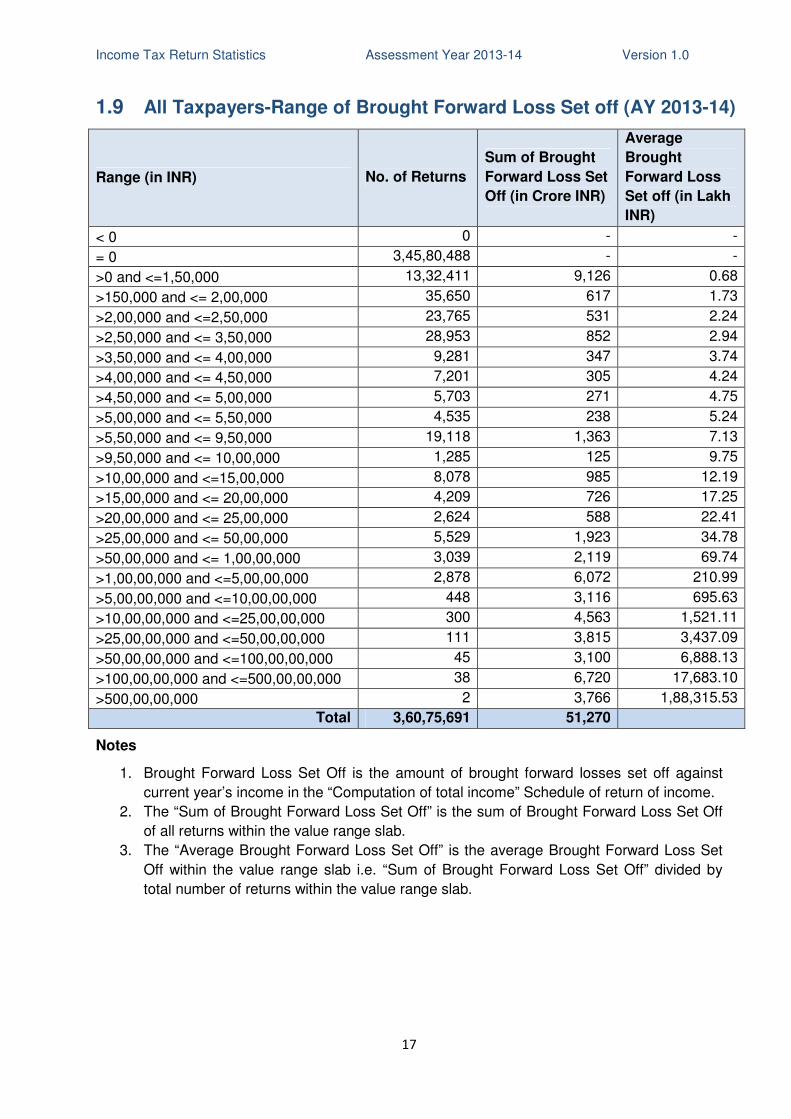
1.9 All Taxpayers-Range of Brought Forward Loss Set off (AY 2013-14)
Range (in INR) No. of Returns
Sum of Brought
Forward Loss Set
Off (in Crore INR)
Average
Brought
Forward Loss
Set off (in Lakh
INR)
< 0 0 - -
= 0 3,45,80,488 - -
>0 and <=1,50,000 13,32,411 9,126 0.68
>150,000 and <= 2,00,000 35,650 617 1.73
>2,00,000 and <=2,50,000 23,765 531 2.24
>2,50,000 and <= 3,50,000 28,953 852 2.94
>3,50,000 and <= 4,00,000 9,281 347 3.74
>4,00,000 and <= 4,50,000 7,201 305 4.24
>4,50,000 and <= 5,00,000 5,703 271 4.75
>5,00,000 and <= 5,50,000 4,535 238 5.24
>5,50,000 and <= 9,50,000 19,118 1,363 7.13
>9,50,000 and <= 10,00,000 1,285 125 9.75
>10,00,000 and <=15,00,000 8,078 985 12.19
>15,00,000 and <= 20,00,000 4,209 726 17.25
>20,00,000 and <= 25,00,000 2,624 588 22.41
>25,00,000 and <= 50,00,000 5,529 1,923 34.78
>50,00,000 and <= 1,00,00,000 3,039 2,119 69.74
>1,00,00,000 and <=5,00,00,000 2,878 6,072 210.99
>5,00,00,000 and <=10,00,00,000 448 3,116 695.63
>10,00,00,000 and <=25,00,00,000 300 4,563 1,521.11
>25,00,00,000 and <=50,00,00,000 111 3,815 3,437.09
>50,00,00,000 and <=100,00,00,000 45 3,100 6,888.13
>100,00,00,000 and <=500,00,00,000 38 6,720 17,683.10
>500,00,00,000 2 3,766 1,88,315.53
Total 3,60,75,691 51,270
Notes
1. Brought Forward Loss Set Off is the amount of brought forward losses set off against
current year’s income in the “Computation of total income” Schedule of return of income.
2. The “Sum of Brought Forward Loss Set Off” is the sum of Brought Forward Loss Set Off
of all returns within the value range slab.
3. The “Average Brought Forward Loss Set Off” is the average Brought Forward Loss Set
Off within the value range slab i.e. “Sum of Brought Forward Loss Set Off” divided by
total number of returns within the value range slab.
Income Tax Return Statistics Assessment Year 2013-14 Version 1.0
18
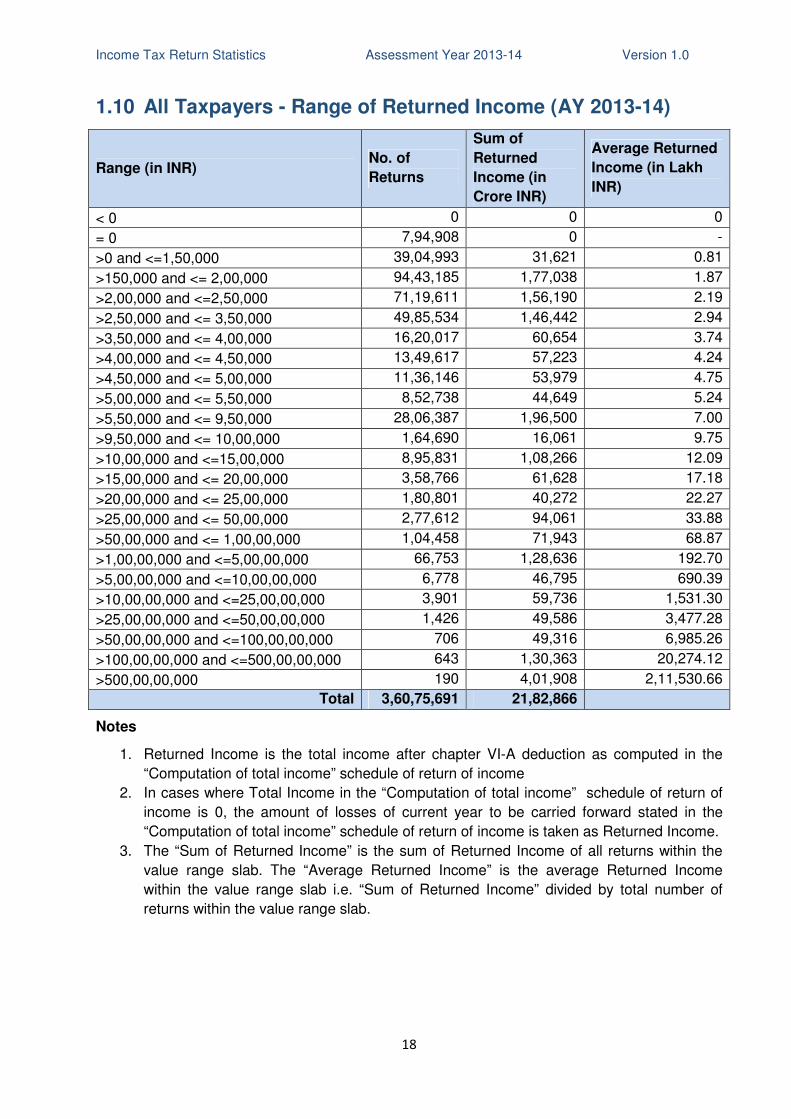
1.10 All Taxpayers - Range of Returned Income (AY 2013-14)
Range (in INR) No. of
Returns
Sum of
Returned
Income (in
Crore INR)
Average Returned
Income (in Lakh
INR)
< 0 0 0 0
= 0 7,94,908 0 -
>0 and <=1,50,000 39,04,993 31,621 0.81
>150,000 and <= 2,00,000 94,43,185 1,77,038 1.87
>2,00,000 and <=2,50,000 71,19,611 1,56,190 2.19
>2,50,000 and <= 3,50,000 49,85,534 1,46,442 2.94
>3,50,000 and <= 4,00,000 16,20,017 60,654 3.74
>4,00,000 and <= 4,50,000 13,49,617 57,223 4.24
>4,50,000 and <= 5,00,000 11,36,146 53,979 4.75
>5,00,000 and <= 5,50,000 8,52,738 44,649 5.24
>5,50,000 and <= 9,50,000 28,06,387 1,96,500 7.00
>9,50,000 and <= 10,00,000 1,64,690 16,061 9.75
>10,00,000 and <=15,00,000 8,95,831 1,08,266 12.09
>15,00,000 and <= 20,00,000 3,58,766 61,628 17.18
>20,00,000 and <= 25,00,000 1,80,801 40,272 22.27
>25,00,000 and <= 50,00,000 2,77,612 94,061 33.88
>50,00,000 and <= 1,00,00,000 1,04,458 71,943 68.87
>1,00,00,000 and <=5,00,00,000 66,753 1,28,636 192.70
>5,00,00,000 and <=10,00,00,000 6,778 46,795 690.39
>10,00,00,000 and <=25,00,00,000 3,901 59,736 1,531.30
>25,00,00,000 and <=50,00,00,000 1,426 49,586 3,477.28
>50,00,00,000 and <=100,00,00,000 706 49,316 6,985.26
>100,00,00,000 and <=500,00,00,000 643 1,30,363 20,274.12
>500,00,00,000 190 4,01,908 2,11,530.66
Total 3,60,75,691 21,82,866
Notes
1. Returned Income is the total income after chapter VI-A deduction as computed in the
“Computation of total income” schedule of return of income
2. In cases where Total Income in the “Computation of total income” schedule of return of
income is 0, the amount of losses of current year to be carried forward stated in the
“Computation of total income” schedule of return of income is taken as Returned Income.
3. The “Sum of Returned Income” is the sum of Returned Income of all returns within the
value range slab. The “Average Returned Income” is the average Returned Income
within the value range slab i.e. “Sum of Returned Income” divided by total number of
returns within the value range slab.
Income Tax Return Statistics Assessment Year 2013-14 Version 1.0
19
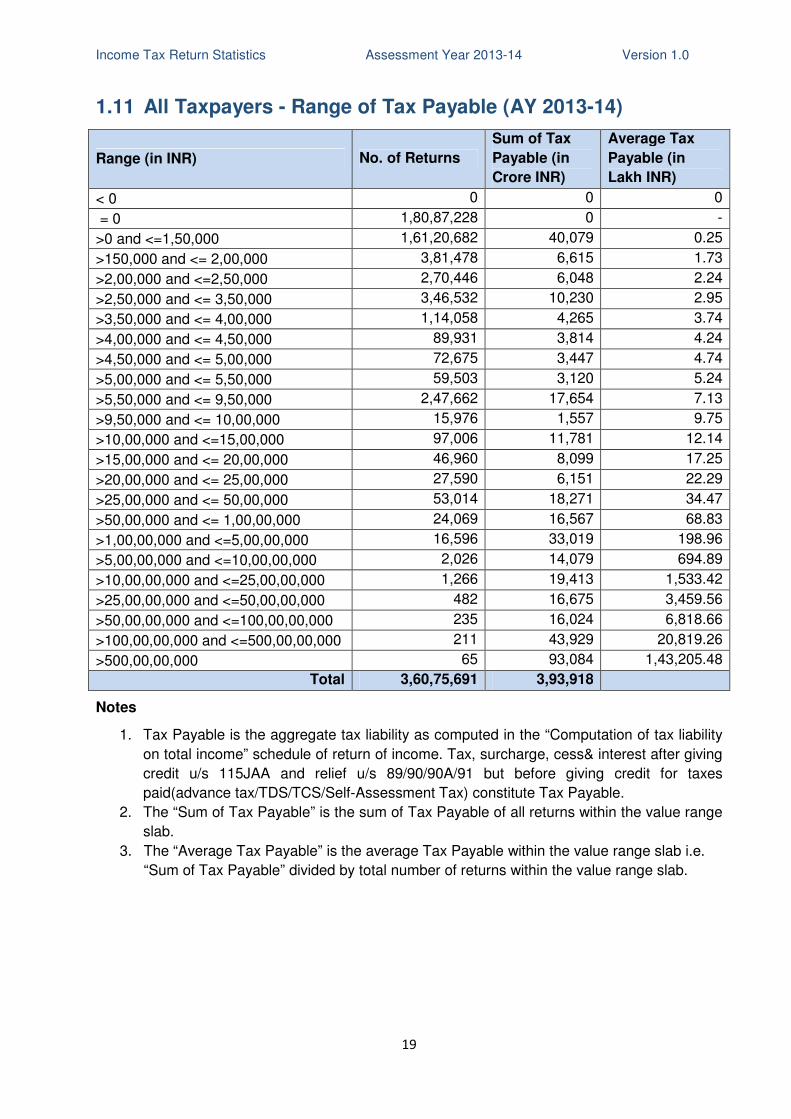
1.11 All Taxpayers - Range of Tax Payable (AY 2013-14)
Range (in INR) No. of Returns
Sum of Tax
Payable (in
Crore INR)
Average Tax
Payable (in
Lakh INR)
< 0 0 0 0
= 0 1,80,87,228 0 -
>0 and <=1,50,000 1,61,20,682 40,079 0.25
>150,000 and <= 2,00,000 3,81,478 6,615 1.73
>2,00,000 and <=2,50,000 2,70,446 6,048 2.24
>2,50,000 and <= 3,50,000 3,46,532 10,230 2.95
>3,50,000 and <= 4,00,000 1,14,058 4,265 3.74
>4,00,000 and <= 4,50,000 89,931 3,814 4.24
>4,50,000 and <= 5,00,000 72,675 3,447 4.74
>5,00,000 and <= 5,50,000 59,503 3,120 5.24
>5,50,000 and <= 9,50,000 2,47,662 17,654 7.13
>9,50,000 and <= 10,00,000 15,976 1,557 9.75
>10,00,000 and <=15,00,000 97,006 11,781 12.14
>15,00,000 and <= 20,00,000 46,960 8,099 17.25
>20,00,000 and <= 25,00,000 27,590 6,151 22.29
>25,00,000 and <= 50,00,000 53,014 18,271 34.47
>50,00,000 and <= 1,00,00,000 24,069 16,567 68.83
>1,00,00,000 and <=5,00,00,000 16,596 33,019 198.96
>5,00,00,000 and <=10,00,00,000 2,026 14,079 694.89
>10,00,00,000 and <=25,00,00,000 1,266 19,413 1,533.42
>25,00,00,000 and <=50,00,00,000 482 16,675 3,459.56
>50,00,00,000 and <=100,00,00,000 235 16,024 6,818.66
>100,00,00,000 and <=500,00,00,000 211 43,929 20,819.26
>500,00,00,000 65 93,084 1,43,205.48
Total 3,60,75,691 3,93,918
Notes
1. Tax Payable is the aggregate tax liability as computed in the “Computation of tax liability
on total income” schedule of return of income. Tax, surcharge, cess& interest after giving
credit u/s 115JAA and relief u/s 89/90/90A/91 but before giving credit for taxes
paid(advance tax/TDS/TCS/Self-Assessment Tax) constitute Tax Payable.
2. The “Sum of Tax Payable” is the sum of Tax Payable of all returns within the value range
slab.
3. The “Average Tax Payable” is the average Tax Payable within the value range slab i.e.
“Sum of Tax Payable” divided by total number of returns within the value range slab.
Income Tax Return Statistics Assessment Year 2013-14 Version 1.0
20
2. Income Tax Returns – Individuals
Income Tax Return Statistics Assessment Year 2013-14 Version 1.0
21
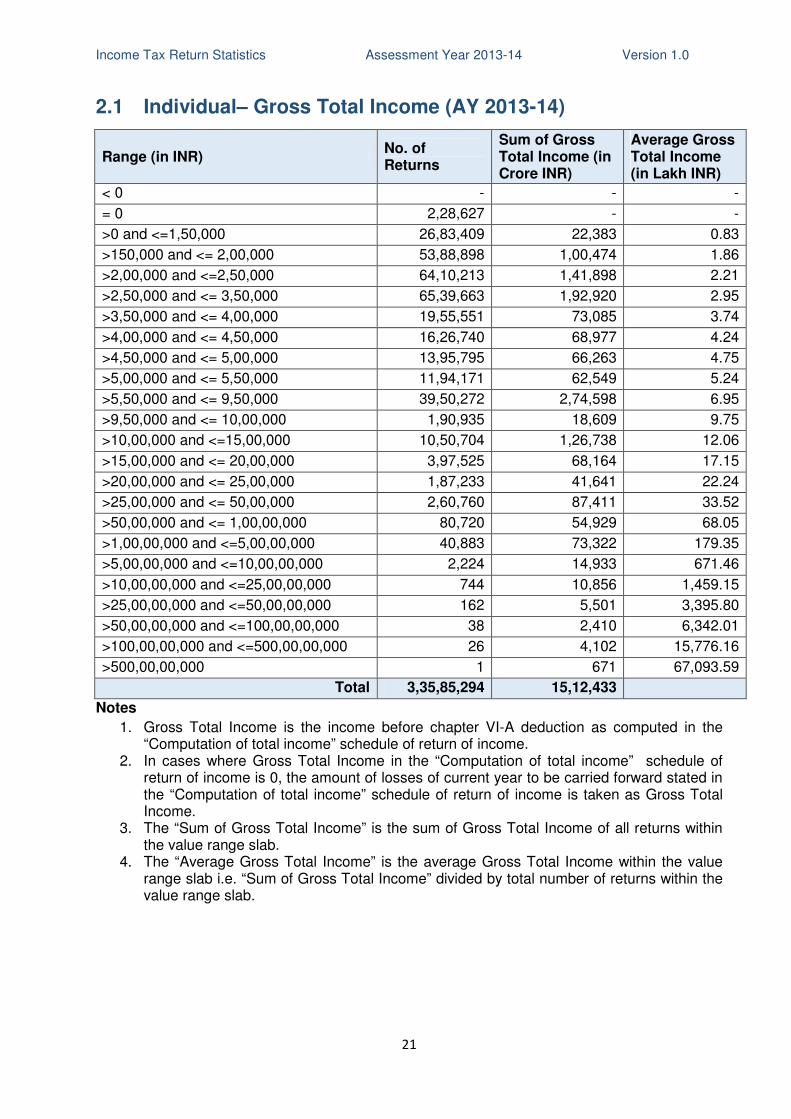
2.1 Individual– Gross Total Income (AY 2013-14)
Range (in INR) No. of Returns
Sum of Gross Total Income (in Crore INR)
Average Gross Total Income (in Lakh INR)
< 0 - - -
= 0 2,28,627 - -
>0 and <=1,50,000 26,83,409 22,383 0.83
>150,000 and <= 2,00,000 53,88,898 1,00,474 1.86
>2,00,000 and <=2,50,000 64,10,213 1,41,898 2.21
>2,50,000 and <= 3,50,000 65,39,663 1,92,920 2.95
>3,50,000 and <= 4,00,000 19,55,551 73,085 3.74
>4,00,000 and <= 4,50,000 16,26,740 68,977 4.24
>4,50,000 and <= 5,00,000 13,95,795 66,263 4.75
>5,00,000 and <= 5,50,000 11,94,171 62,549 5.24
>5,50,000 and <= 9,50,000 39,50,272 2,74,598 6.95
>9,50,000 and <= 10,00,000 1,90,935 18,609 9.75
>10,00,000 and <=15,00,000 10,50,704 1,26,738 12.06
>15,00,000 and <= 20,00,000 3,97,525 68,164 17.15
>20,00,000 and <= 25,00,000 1,87,233 41,641 22.24
>25,00,000 and <= 50,00,000 2,60,760 87,411 33.52
>50,00,000 and <= 1,00,00,000 80,720 54,929 68.05
>1,00,00,000 and <=5,00,00,000 40,883 73,322 179.35
>5,00,00,000 and <=10,00,00,000 2,224 14,933 671.46
>10,00,00,000 and <=25,00,00,000 744 10,856 1,459.15
>25,00,00,000 and <=50,00,00,000 162 5,501 3,395.80
>50,00,00,000 and <=100,00,00,000 38 2,410 6,342.01
>100,00,00,000 and <=500,00,00,000 26 4,102 15,776.16
>500,00,00,000 1 671 67,093.59
Total 3,35,85,294 15,12,433
Notes
1. Gross Total Income is the income before chapter VI-A deduction as computed in the “Computation of total income” schedule of return of income.
2. In cases where Gross Total Income in the “Computation of total income” schedule of return of income is 0, the amount of losses of current year to be carried forward stated in the “Computation of total income” schedule of return of income is taken as Gross Total Income.
3. The “Sum of Gross Total Income” is the sum of Gross Total Income of all returns within the value range slab.
4. The “Average Gross Total Income” is the average Gross Total Income within the value range slab i.e. “Sum of Gross Total Income” divided by total number of returns within the value range slab.
Income Tax Return Statistics Assessment Year 2013-14 Version 1.0
22
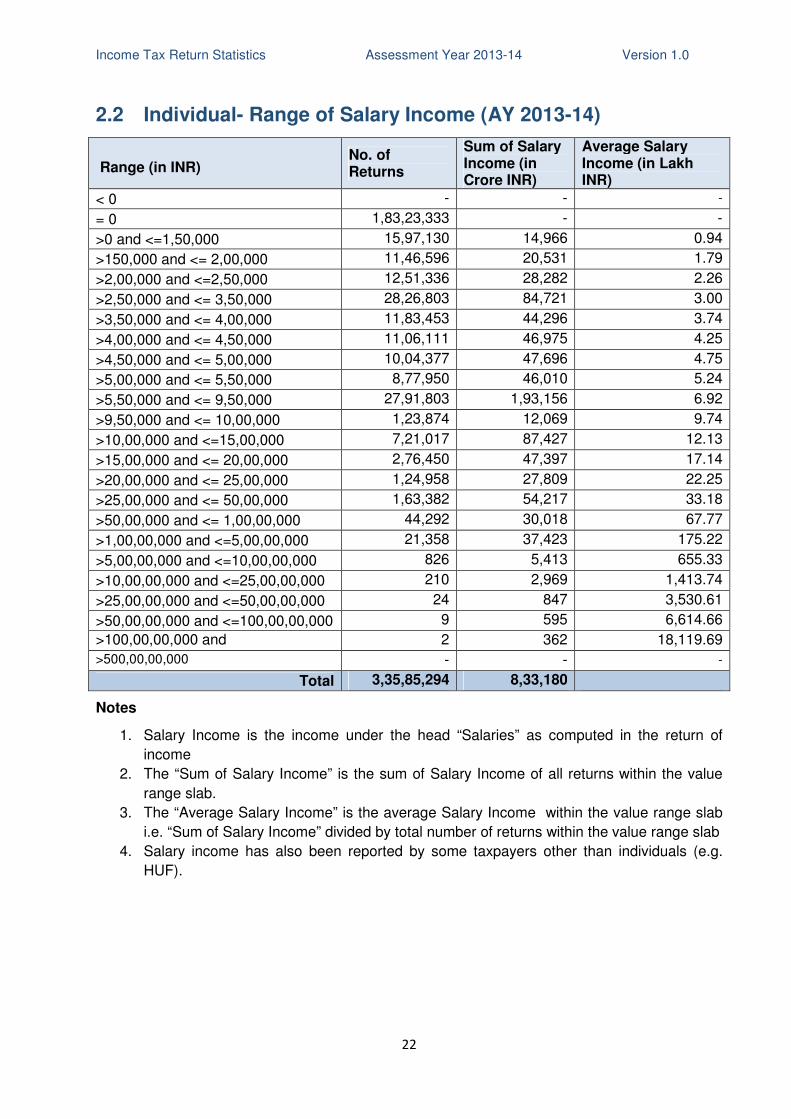
2.2 Individual- Range of Salary Income (AY 2013-14)
Range (in INR) No. of Returns
Sum of Salary Income (in Crore INR)
Average Salary Income (in Lakh INR)
< 0 - - -
= 0 1,83,23,333 - -
>0 and <=1,50,000 15,97,130 14,966 0.94
>150,000 and <= 2,00,000 11,46,596 20,531 1.79
>2,00,000 and <=2,50,000 12,51,336 28,282 2.26
>2,50,000 and <= 3,50,000 28,26,803 84,721 3.00
>3,50,000 and <= 4,00,000 11,83,453 44,296 3.74
>4,00,000 and <= 4,50,000 11,06,111 46,975 4.25
>4,50,000 and <= 5,00,000 10,04,377 47,696 4.75
>5,00,000 and <= 5,50,000 8,77,950 46,010 5.24
>5,50,000 and <= 9,50,000 27,91,803 1,93,156 6.92
>9,50,000 and <= 10,00,000 1,23,874 12,069 9.74
>10,00,000 and <=15,00,000 7,21,017 87,427 12.13
>15,00,000 and <= 20,00,000 2,76,450 47,397 17.14
>20,00,000 and <= 25,00,000 1,24,958 27,809 22.25
>25,00,000 and <= 50,00,000 1,63,382 54,217 33.18
>50,00,000 and <= 1,00,00,000 44,292 30,018 67.77
>1,00,00,000 and <=5,00,00,000 21,358 37,423 175.22
>5,00,00,000 and <=10,00,00,000 826 5,413 655.33
>10,00,00,000 and <=25,00,00,000 210 2,969 1,413.74
>25,00,00,000 and <=50,00,00,000 24 847 3,530.61
>50,00,00,000 and <=100,00,00,000 9 595 6,614.66
>100,00,00,000 and <=500,00,00,000
2 362 18,119.69
>500,00,00,000 - - -
Total 3,35,85,294 8,33,180
Notes
1. Salary Income is the income under the head “Salaries” as computed in the return of
income
2. The “Sum of Salary Income” is the sum of Salary Income of all returns within the value
range slab.
3. The “Average Salary Income” is the average Salary Income within the value range slab
i.e. “Sum of Salary Income” divided by total number of returns within the value range slab
4. Salary income has also been reported by some taxpayers other than individuals (e.g.
HUF).
Income Tax Return Statistics Assessment Year 2013-14 Version 1.0
23
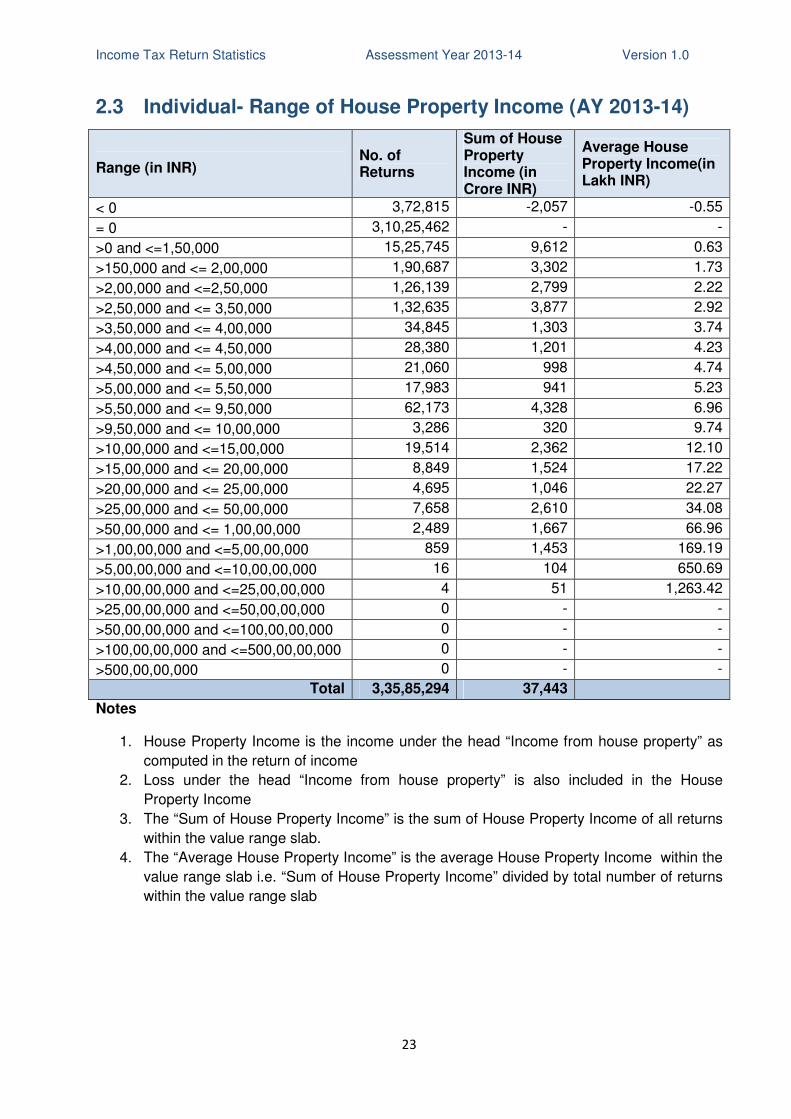
2.3 Individual- Range of House Property Income (AY 2013-14)
Range (in INR) No. of Returns
Sum of House Property Income (in Crore INR)
Average House Property Income(in Lakh INR)
< 0 3,72,815 -2,057 -0.55
= 0 3,10,25,462 - -
>0 and <=1,50,000 15,25,745 9,612 0.63
>150,000 and <= 2,00,000 1,90,687 3,302 1.73
>2,00,000 and <=2,50,000 1,26,139 2,799 2.22
>2,50,000 and <= 3,50,000 1,32,635 3,877 2.92
>3,50,000 and <= 4,00,000 34,845 1,303 3.74
>4,00,000 and <= 4,50,000 28,380 1,201 4.23
>4,50,000 and <= 5,00,000 21,060 998 4.74
>5,00,000 and <= 5,50,000 17,983 941 5.23
>5,50,000 and <= 9,50,000 62,173 4,328 6.96
>9,50,000 and <= 10,00,000 3,286 320 9.74
>10,00,000 and <=15,00,000 19,514 2,362 12.10
>15,00,000 and <= 20,00,000 8,849 1,524 17.22
>20,00,000 and <= 25,00,000 4,695 1,046 22.27
>25,00,000 and <= 50,00,000 7,658 2,610 34.08
>50,00,000 and <= 1,00,00,000 2,489 1,667 66.96
>1,00,00,000 and <=5,00,00,000 859 1,453 169.19
>5,00,00,000 and <=10,00,00,000 16 104 650.69
>10,00,00,000 and <=25,00,00,000 4 51 1,263.42
>25,00,00,000 and <=50,00,00,000 0 - -
>50,00,00,000 and <=100,00,00,000 0 - -
>100,00,00,000 and <=500,00,00,000 0 - -
>500,00,00,000 0 - -
Total 3,35,85,294 37,443
Notes
1. House Property Income is the income under the head “Income from house property” as
computed in the return of income
2. Loss under the head “Income from house property” is also included in the House
Property Income
3. The “Sum of House Property Income” is the sum of House Property Income of all returns
within the value range slab.
4. The “Average House Property Income” is the average House Property Income within the
value range slab i.e. “Sum of House Property Income” divided by total number of returns
within the value range slab
Income Tax Return Statistics Assessment Year 2013-14 Version 1.0
24
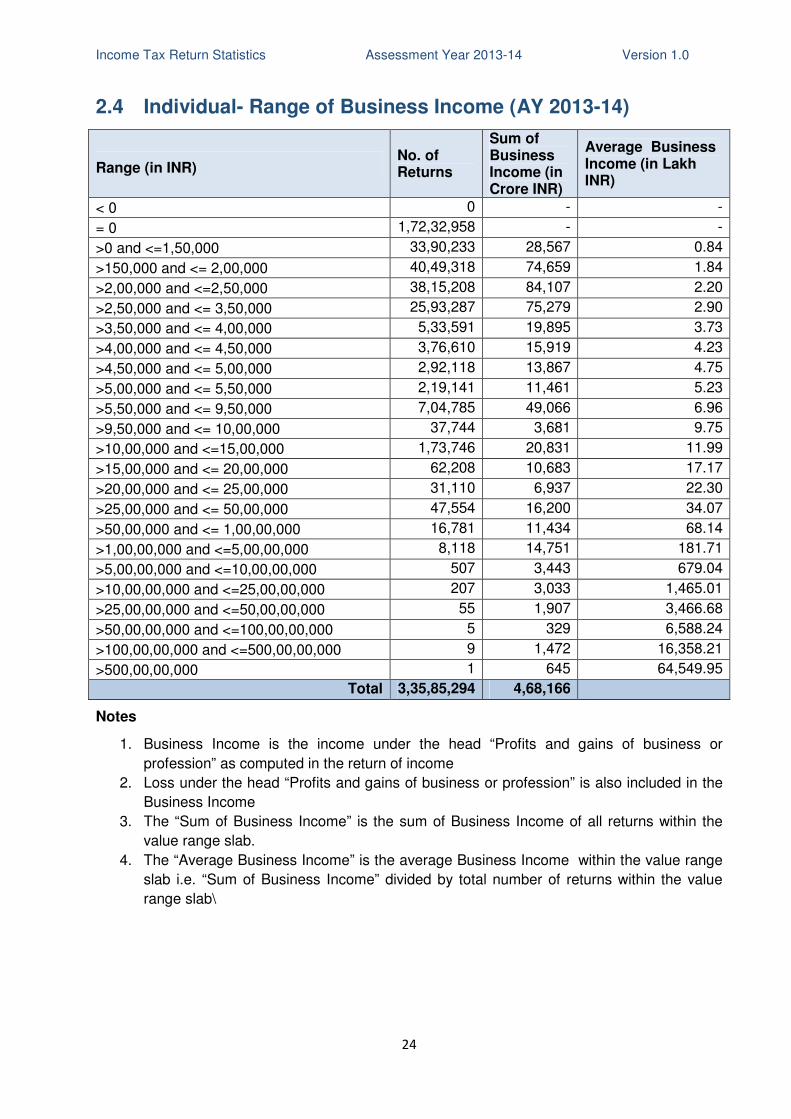
2.4 Individual- Range of Business Income (AY 2013-14)
Range (in INR) No. of Returns
Sum of Business Income (in Crore INR)
Average Business Income (in Lakh INR)
< 0 0 - -
= 0 1,72,32,958 - -
>0 and <=1,50,000 33,90,233 28,567 0.84
>150,000 and <= 2,00,000 40,49,318 74,659 1.84
>2,00,000 and <=2,50,000 38,15,208 84,107 2.20
>2,50,000 and <= 3,50,000 25,93,287 75,279 2.90
>3,50,000 and <= 4,00,000 5,33,591 19,895 3.73
>4,00,000 and <= 4,50,000 3,76,610 15,919 4.23
>4,50,000 and <= 5,00,000 2,92,118 13,867 4.75
>5,00,000 and <= 5,50,000 2,19,141 11,461 5.23
>5,50,000 and <= 9,50,000 7,04,785 49,066 6.96
>9,50,000 and <= 10,00,000 37,744 3,681 9.75
>10,00,000 and <=15,00,000 1,73,746 20,831 11.99
>15,00,000 and <= 20,00,000 62,208 10,683 17.17
>20,00,000 and <= 25,00,000 31,110 6,937 22.30
>25,00,000 and <= 50,00,000 47,554 16,200 34.07
>50,00,000 and <= 1,00,00,000 16,781 11,434 68.14
>1,00,00,000 and <=5,00,00,000 8,118 14,751 181.71
>5,00,00,000 and <=10,00,00,000 507 3,443 679.04
>10,00,00,000 and <=25,00,00,000 207 3,033 1,465.01
>25,00,00,000 and <=50,00,00,000 55 1,907 3,466.68
>50,00,00,000 and <=100,00,00,000 5 329 6,588.24
>100,00,00,000 and <=500,00,00,000 9 1,472 16,358.21
>500,00,00,000 1 645 64,549.95
Total 3,35,85,294 4,68,166
Notes
1. Business Income is the income under the head “Profits and gains of business or
profession” as computed in the return of income
2. Loss under the head “Profits and gains of business or profession” is also included in the
Business Income
3. The “Sum of Business Income” is the sum of Business Income of all returns within the
value range slab.
4. The “Average Business Income” is the average Business Income within the value range
slab i.e. “Sum of Business Income” divided by total number of returns within the value
range slab\
Income Tax Return Statistics Assessment Year 2013-14 Version 1.0
25
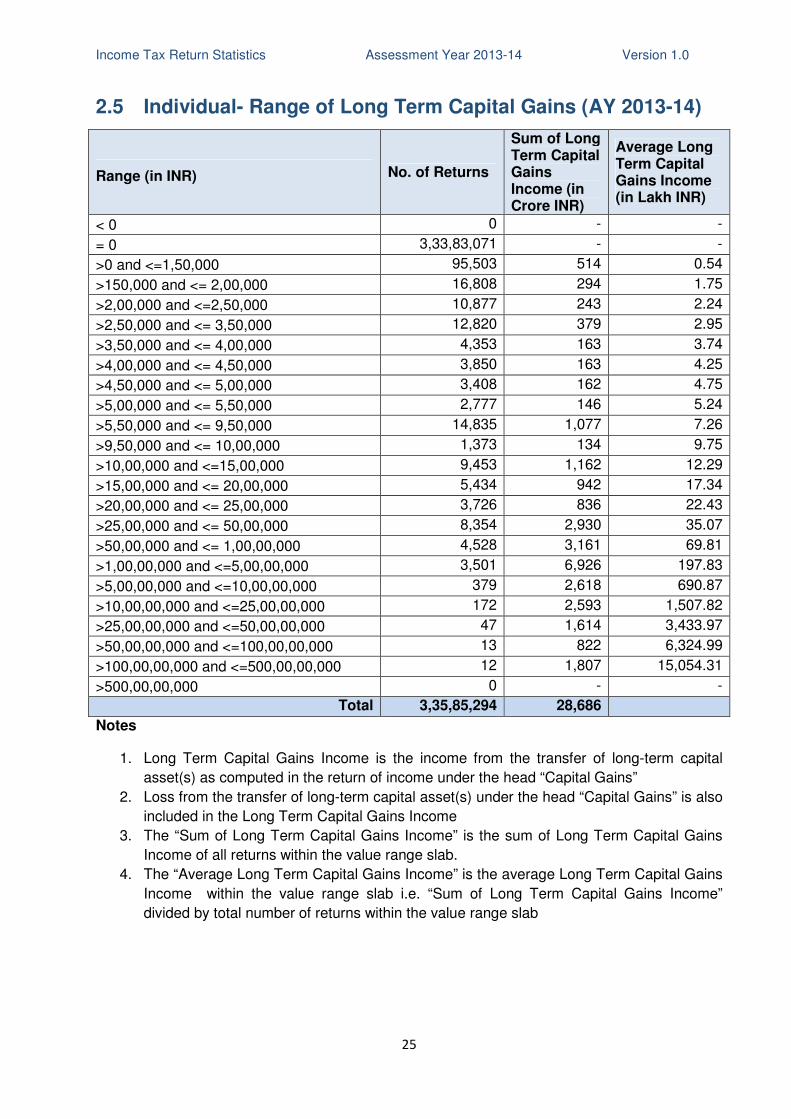
2.5 Individual- Range of Long Term Capital Gains (AY 2013-14)
Range (in INR) No. of Returns
Sum of Long Term Capital Gains Income (in Crore INR)
Average Long Term Capital Gains Income (in Lakh INR)
< 0 0 - -
= 0 3,33,83,071 - -
>0 and <=1,50,000 95,503 514 0.54
>150,000 and <= 2,00,000 16,808 294 1.75
>2,00,000 and <=2,50,000 10,877 243 2.24
>2,50,000 and <= 3,50,000 12,820 379 2.95
>3,50,000 and <= 4,00,000 4,353 163 3.74
>4,00,000 and <= 4,50,000 3,850 163 4.25
>4,50,000 and <= 5,00,000 3,408 162 4.75
>5,00,000 and <= 5,50,000 2,777 146 5.24
>5,50,000 and <= 9,50,000 14,835 1,077 7.26
>9,50,000 and <= 10,00,000 1,373 134 9.75
>10,00,000 and <=15,00,000 9,453 1,162 12.29
>15,00,000 and <= 20,00,000 5,434 942 17.34
>20,00,000 and <= 25,00,000 3,726 836 22.43
>25,00,000 and <= 50,00,000 8,354 2,930 35.07
>50,00,000 and <= 1,00,00,000 4,528 3,161 69.81
>1,00,00,000 and <=5,00,00,000 3,501 6,926 197.83
>5,00,00,000 and <=10,00,00,000 379 2,618 690.87
>10,00,00,000 and <=25,00,00,000 172 2,593 1,507.82
>25,00,00,000 and <=50,00,00,000 47 1,614 3,433.97
>50,00,00,000 and <=100,00,00,000 13 822 6,324.99
>100,00,00,000 and <=500,00,00,000 12 1,807 15,054.31
>500,00,00,000 0 - -
Total 3,35,85,294 28,686
Notes
1. Long Term Capital Gains Income is the income from the transfer of long-term capital
asset(s) as computed in the return of income under the head “Capital Gains”
2. Loss from the transfer of long-term capital asset(s) under the head “Capital Gains” is also
included in the Long Term Capital Gains Income
3. The “Sum of Long Term Capital Gains Income” is the sum of Long Term Capital Gains
Income of all returns within the value range slab.
4. The “Average Long Term Capital Gains Income” is the average Long Term Capital Gains
Income within the value range slab i.e. “Sum of Long Term Capital Gains Income”
divided by total number of returns within the value range slab
Income Tax Return Statistics Assessment Year 2013-14 Version 1.0
26
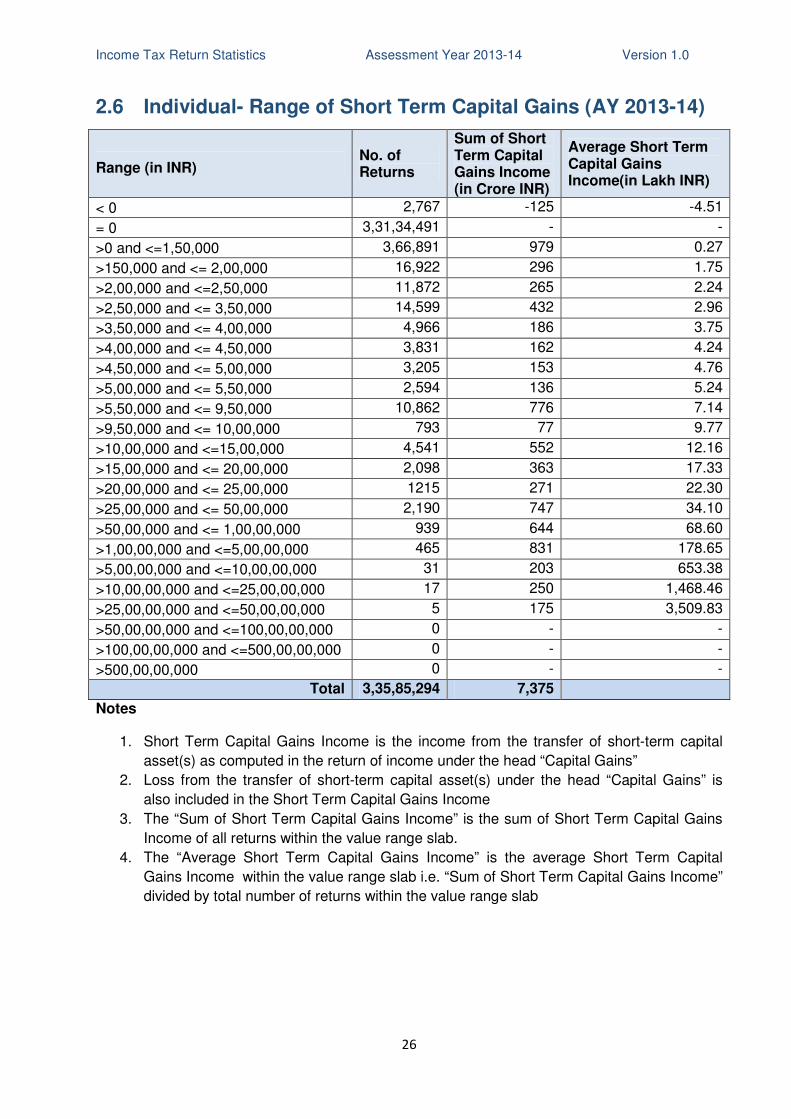
2.6 Individual- Range of Short Term Capital Gains (AY 2013-14)
Range (in INR) No. of Returns
Sum of Short Term Capital Gains Income (in Crore INR)
Average Short Term Capital Gains Income(in Lakh INR)
< 0 2,767 -125 -4.51
= 0 3,31,34,491 - -
>0 and <=1,50,000 3,66,891 979 0.27
>150,000 and <= 2,00,000 16,922 296 1.75
>2,00,000 and <=2,50,000 11,872 265 2.24
>2,50,000 and <= 3,50,000 14,599 432 2.96
>3,50,000 and <= 4,00,000 4,966 186 3.75
>4,00,000 and <= 4,50,000 3,831 162 4.24
>4,50,000 and <= 5,00,000 3,205 153 4.76
>5,00,000 and <= 5,50,000 2,594 136 5.24
>5,50,000 and <= 9,50,000 10,862 776 7.14
>9,50,000 and <= 10,00,000 793 77 9.77
>10,00,000 and <=15,00,000 4,541 552 12.16
>15,00,000 and <= 20,00,000 2,098 363 17.33
>20,00,000 and <= 25,00,000 1215 271 22.30
>25,00,000 and <= 50,00,000 2,190 747 34.10
>50,00,000 and <= 1,00,00,000 939 644 68.60
>1,00,00,000 and <=5,00,00,000 465 831 178.65
>5,00,00,000 and <=10,00,00,000 31 203 653.38
>10,00,00,000 and <=25,00,00,000 17 250 1,468.46
>25,00,00,000 and <=50,00,00,000 5 175 3,509.83
>50,00,00,000 and <=100,00,00,000 0 - -
>100,00,00,000 and <=500,00,00,000 0 - -
>500,00,00,000 0 - -
Total 3,35,85,294 7,375
Notes
1. Short Term Capital Gains Income is the income from the transfer of short-term capital
asset(s) as computed in the return of income under the head “Capital Gains”
2. Loss from the transfer of short-term capital asset(s) under the head “Capital Gains” is
also included in the Short Term Capital Gains Income
3. The “Sum of Short Term Capital Gains Income” is the sum of Short Term Capital Gains
Income of all returns within the value range slab.
4. The “Average Short Term Capital Gains Income” is the average Short Term Capital
Gains Income within the value range slab i.e. “Sum of Short Term Capital Gains Income”
divided by total number of returns within the value range slab
Income Tax Return Statistics Assessment Year 2013-14 Version 1.0
27
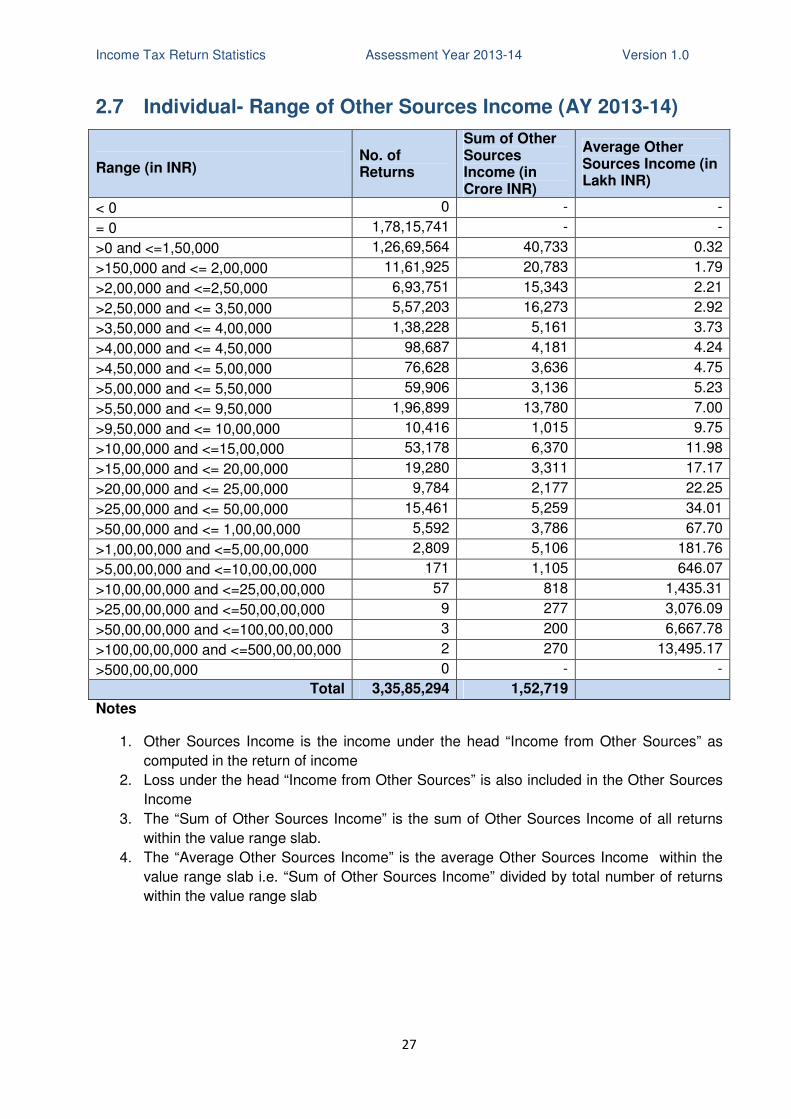
2.7 Individual- Range of Other Sources Income (AY 2013-14)
Range (in INR) No. of Returns
Sum of Other Sources Income (in Crore INR)
Average Other Sources Income (in Lakh INR)
< 0 0 - -
= 0 1,78,15,741 - -
>0 and <=1,50,000 1,26,69,564 40,733 0.32
>150,000 and <= 2,00,000 11,61,925 20,783 1.79
>2,00,000 and <=2,50,000 6,93,751 15,343 2.21
>2,50,000 and <= 3,50,000 5,57,203 16,273 2.92
>3,50,000 and <= 4,00,000 1,38,228 5,161 3.73
>4,00,000 and <= 4,50,000 98,687 4,181 4.24
>4,50,000 and <= 5,00,000 76,628 3,636 4.75
>5,00,000 and <= 5,50,000 59,906 3,136 5.23
>5,50,000 and <= 9,50,000 1,96,899 13,780 7.00
>9,50,000 and <= 10,00,000 10,416 1,015 9.75
>10,00,000 and <=15,00,000 53,178 6,370 11.98
>15,00,000 and <= 20,00,000 19,280 3,311 17.17
>20,00,000 and <= 25,00,000 9,784 2,177 22.25
>25,00,000 and <= 50,00,000 15,461 5,259 34.01
>50,00,000 and <= 1,00,00,000 5,592 3,786 67.70
>1,00,00,000 and <=5,00,00,000 2,809 5,106 181.76
>5,00,00,000 and <=10,00,00,000 171 1,105 646.07
>10,00,00,000 and <=25,00,00,000 57 818 1,435.31
>25,00,00,000 and <=50,00,00,000 9 277 3,076.09
>50,00,00,000 and <=100,00,00,000 3 200 6,667.78
>100,00,00,000 and <=500,00,00,000 2 270 13,495.17
>500,00,00,000 0 - -
Total 3,35,85,294 1,52,719
Notes
1. Other Sources Income is the income under the head “Income from Other Sources” as
computed in the return of income
2. Loss under the head “Income from Other Sources” is also included in the Other Sources
Income
3. The “Sum of Other Sources Income” is the sum of Other Sources Income of all returns
within the value range slab.
4. The “Average Other Sources Income” is the average Other Sources Income within the
value range slab i.e. “Sum of Other Sources Income” divided by total number of returns
within the value range slab

Income Tax Return Statistics Assessment Year 2013-14 Version 1.0
28
2.8 Individual- Range of Interest Income (AY 2013-14)
Range (in INR) No. of Returns
Sum of Interest Income (in Crore INR)
Average Interest Income (in Lakh INR)
< 0 0 - -
= 0 2,67,32,674 - -
>0 and <=1,50,000 60,08,218 14,507 0.24
>150,000 and <= 2,00,000 2,28,207 3,965 1.74
>2,00,000 and <=2,50,000 1,48,440 3,313 2.23
>2,50,000 and <= 3,50,000 1,68,356 4,953 2.94
>3,50,000 and <= 4,00,000 51,315 1,918 3.74
>4,00,000 and <= 4,50,000 38,555 1,635 4.24
>4,50,000 and <= 5,00,000 30,457 1,445 4.74
>5,00,000 and <= 5,50,000 24,254 1,271 5.24
>5,50,000 and <= 9,50,000 89,427 6,309 7.05
>9,50,000 and <= 10,00,000 5,131 500 9.75
>10,00,000 and <=15,00,000 28,696 3,454 12.04
>15,00,000 and <= 20,00,000 11,239 1,933 17.20
>20,00,000 and <= 25,00,000 5,846 1,302 22.27
>25,00,000 and <= 50,00,000 9,546 3,245 33.99
>50,00,000 and <= 1,00,00,000 3,276 2,222 67.83
>1,00,00,000 and <=5,00,00,000 1,559 2,808 180.14
>5,00,00,000 and <=10,00,00,000 75 487 649.27
>10,00,00,000 and <=25,00,00,000 21 279 1,327.48
>25,00,00,000 and <=50,00,00,000 1 25 2,532.96
>50,00,00,000 and <=100,00,00,000 1 65 6,453.80
>100,00,00,000 and <=500,00,00,000 0 - -
>500,00,00,000 0 - -
Total 3,35,85,294 55,636
Notes
1. The Interest Income is already included in the Income from other sources.
2. Interest Income is the Gross Interest Income in the “Income from other sources”
Schedule of Return of Income. Interest Income data is compiled only for those returns
where it is explicitly stated in the Return of Income.
3. The “Sum of Interest Income” is the sum of Interest Income of all returns within the value
range slab.
4. The “Average Interest Income” is the average Interest Income within the value range
slab i.e. “Sum of Interest Income” divided by total number of returns within the value
range slab
Income Tax Return Statistics Assessment Year 2013-14 Version 1.0
29
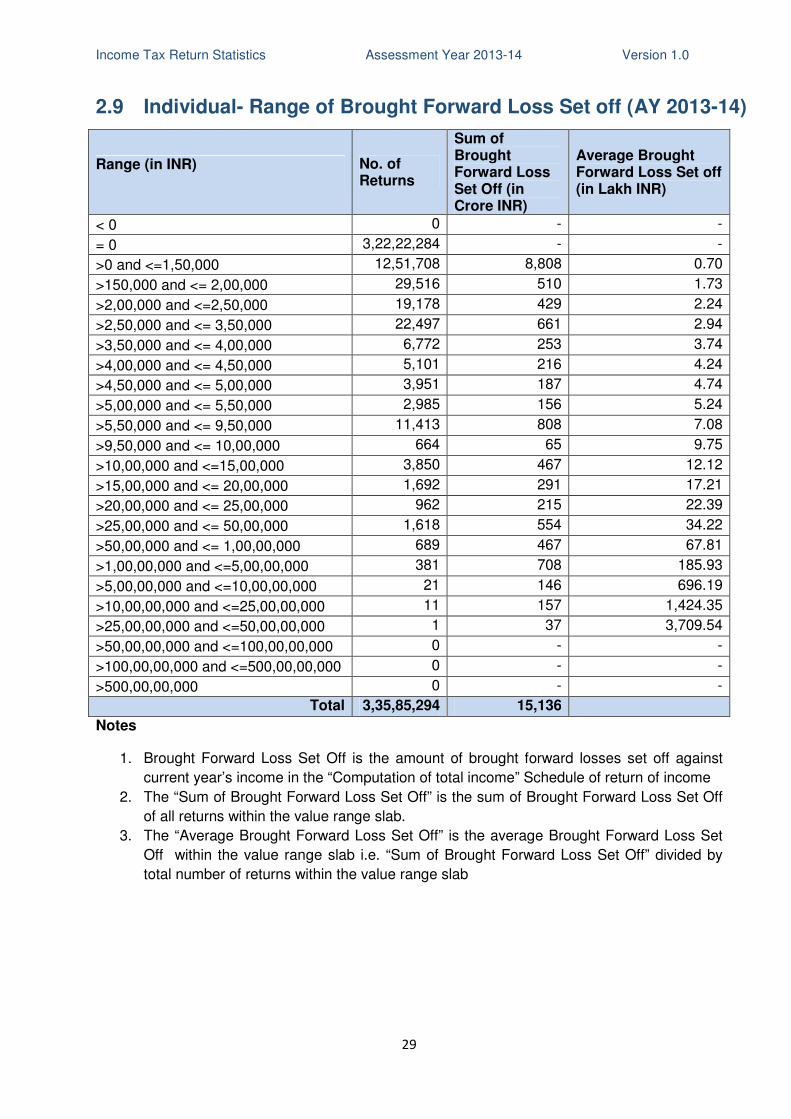
2.9 Individual- Range of Brought Forward Loss Set off (AY 2013-14)
Range (in INR) No. of Returns
Sum of Brought Forward Loss Set Off (in Crore INR)
Average Brought Forward Loss Set off (in Lakh INR)
< 0 0 - -
= 0 3,22,22,284 - -
>0 and <=1,50,000 12,51,708 8,808 0.70
>150,000 and <= 2,00,000 29,516 510 1.73
>2,00,000 and <=2,50,000 19,178 429 2.24
>2,50,000 and <= 3,50,000 22,497 661 2.94
>3,50,000 and <= 4,00,000 6,772 253 3.74
>4,00,000 and <= 4,50,000 5,101 216 4.24
>4,50,000 and <= 5,00,000 3,951 187 4.74
>5,00,000 and <= 5,50,000 2,985 156 5.24
>5,50,000 and <= 9,50,000 11,413 808 7.08
>9,50,000 and <= 10,00,000 664 65 9.75
>10,00,000 and <=15,00,000 3,850 467 12.12
>15,00,000 and <= 20,00,000 1,692 291 17.21
>20,00,000 and <= 25,00,000 962 215 22.39
>25,00,000 and <= 50,00,000 1,618 554 34.22
>50,00,000 and <= 1,00,00,000 689 467 67.81
>1,00,00,000 and <=5,00,00,000 381 708 185.93
>5,00,00,000 and <=10,00,00,000 21 146 696.19
>10,00,00,000 and <=25,00,00,000 11 157 1,424.35
>25,00,00,000 and <=50,00,00,000 1 37 3,709.54
>50,00,00,000 and <=100,00,00,000 0 - -
>100,00,00,000 and <=500,00,00,000 0 - -
>500,00,00,000 0 - -
Total 3,35,85,294 15,136
Notes
1. Brought Forward Loss Set Off is the amount of brought forward losses set off against
current year’s income in the “Computation of total income” Schedule of return of income
2. The “Sum of Brought Forward Loss Set Off” is the sum of Brought Forward Loss Set Off
of all returns within the value range slab.
3. The “Average Brought Forward Loss Set Off” is the average Brought Forward Loss Set
Off within the value range slab i.e. “Sum of Brought Forward Loss Set Off” divided by
total number of returns within the value range slab
Income Tax Return Statistics Assessment Year 2013-14 Version 1.0
30
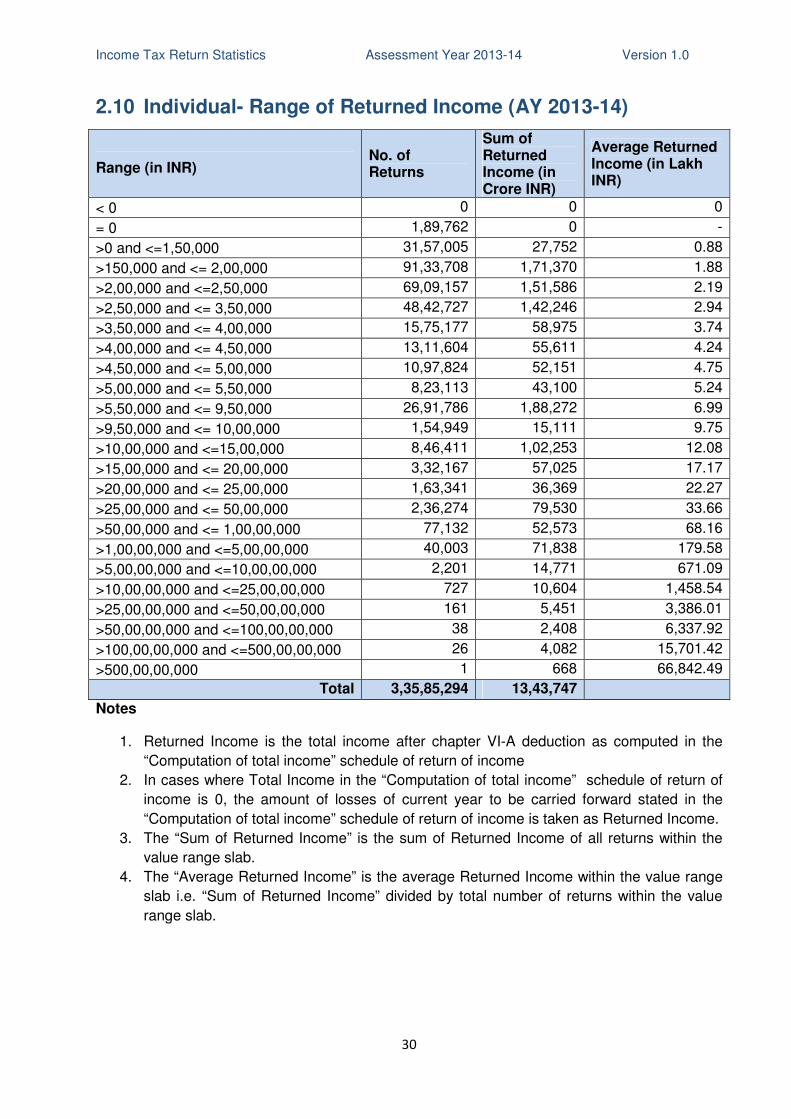
2.10 Individual- Range of Returned Income (AY 2013-14)
Range (in INR) No. of Returns
Sum of Returned Income (in Crore INR)
Average Returned Income (in Lakh INR)
< 0 0 0 0
= 0 1,89,762 0 -
>0 and <=1,50,000 31,57,005 27,752 0.88
>150,000 and <= 2,00,000 91,33,708 1,71,370 1.88
>2,00,000 and <=2,50,000 69,09,157 1,51,586 2.19
>2,50,000 and <= 3,50,000 48,42,727 1,42,246 2.94
>3,50,000 and <= 4,00,000 15,75,177 58,975 3.74
>4,00,000 and <= 4,50,000 13,11,604 55,611 4.24
>4,50,000 and <= 5,00,000 10,97,824 52,151 4.75
>5,00,000 and <= 5,50,000 8,23,113 43,100 5.24
>5,50,000 and <= 9,50,000 26,91,786 1,88,272 6.99
>9,50,000 and <= 10,00,000 1,54,949 15,111 9.75
>10,00,000 and <=15,00,000 8,46,411 1,02,253 12.08
>15,00,000 and <= 20,00,000 3,32,167 57,025 17.17
>20,00,000 and <= 25,00,000 1,63,341 36,369 22.27
>25,00,000 and <= 50,00,000 2,36,274 79,530 33.66
>50,00,000 and <= 1,00,00,000 77,132 52,573 68.16
>1,00,00,000 and <=5,00,00,000 40,003 71,838 179.58
>5,00,00,000 and <=10,00,00,000 2,201 14,771 671.09
>10,00,00,000 and <=25,00,00,000 727 10,604 1,458.54
>25,00,00,000 and <=50,00,00,000 161 5,451 3,386.01
>50,00,00,000 and <=100,00,00,000 38 2,408 6,337.92
>100,00,00,000 and <=500,00,00,000 26 4,082 15,701.42
>500,00,00,000 1 668 66,842.49
Total 3,35,85,294 13,43,747
Notes
1. Returned Income is the total income after chapter VI-A deduction as computed in the
“Computation of total income” schedule of return of income
2. In cases where Total Income in the “Computation of total income” schedule of return of
income is 0, the amount of losses of current year to be carried forward stated in the
“Computation of total income” schedule of return of income is taken as Returned Income.
3. The “Sum of Returned Income” is the sum of Returned Income of all returns within the
value range slab.
4. The “Average Returned Income” is the average Returned Income within the value range
slab i.e. “Sum of Returned Income” divided by total number of returns within the value
range slab.
Income Tax Return Statistics Assessment Year 2013-14 Version 1.0
31
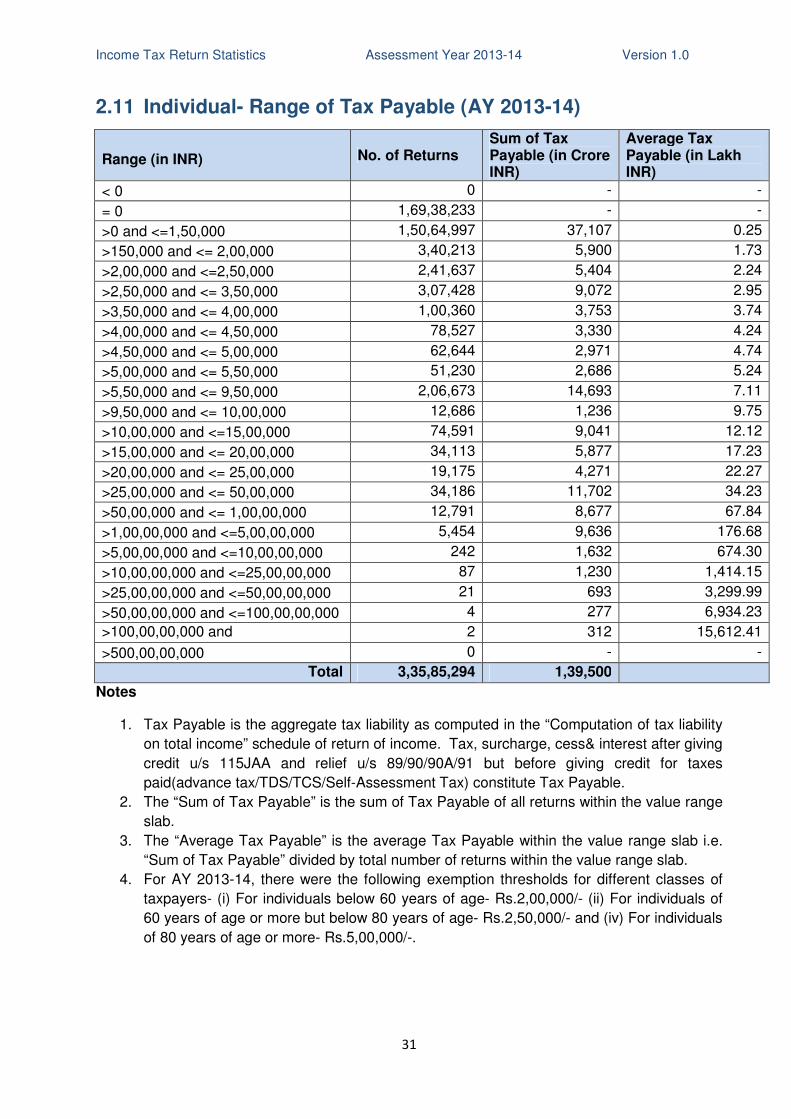
2.11 Individual- Range of Tax Payable (AY 2013-14)
Range (in INR) No. of Returns Sum of Tax Payable (in Crore INR)
Average Tax Payable (in Lakh INR)
< 0 0 - -
= 0 1,69,38,233 - -
>0 and <=1,50,000 1,50,64,997 37,107 0.25
>150,000 and <= 2,00,000 3,40,213 5,900 1.73
>2,00,000 and <=2,50,000 2,41,637 5,404 2.24
>2,50,000 and <= 3,50,000 3,07,428 9,072 2.95
>3,50,000 and <= 4,00,000 1,00,360 3,753 3.74
>4,00,000 and <= 4,50,000 78,527 3,330 4.24
>4,50,000 and <= 5,00,000 62,644 2,971 4.74
>5,00,000 and <= 5,50,000 51,230 2,686 5.24
>5,50,000 and <= 9,50,000 2,06,673 14,693 7.11
>9,50,000 and <= 10,00,000 12,686 1,236 9.75
>10,00,000 and <=15,00,000 74,591 9,041 12.12
>15,00,000 and <= 20,00,000 34,113 5,877 17.23
>20,00,000 and <= 25,00,000 19,175 4,271 22.27
>25,00,000 and <= 50,00,000 34,186 11,702 34.23
>50,00,000 and <= 1,00,00,000 12,791 8,677 67.84
>1,00,00,000 and <=5,00,00,000 5,454 9,636 176.68
>5,00,00,000 and <=10,00,00,000 242 1,632 674.30
>10,00,00,000 and <=25,00,00,000 87 1,230 1,414.15
>25,00,00,000 and <=50,00,00,000 21 693 3,299.99
>50,00,00,000 and <=100,00,00,000 4 277 6,934.23
>100,00,00,000 and <=500,00,00,000
2 312 15,612.41
>500,00,00,000 0 - -
Total 3,35,85,294 1,39,500
Notes
1. Tax Payable is the aggregate tax liability as computed in the “Computation of tax liability
on total income” schedule of return of income. Tax, surcharge, cess& interest after giving
credit u/s 115JAA and relief u/s 89/90/90A/91 but before giving credit for taxes
paid(advance tax/TDS/TCS/Self-Assessment Tax) constitute Tax Payable.
2. The “Sum of Tax Payable” is the sum of Tax Payable of all returns within the value range
slab.
3. The “Average Tax Payable” is the average Tax Payable within the value range slab i.e.
“Sum of Tax Payable” divided by total number of returns within the value range slab.
4. For AY 2013-14, there were the following exemption thresholds for different classes of
taxpayers- (i) For individuals below 60 years of age- Rs.2,00,000/- (ii) For individuals of
60 years of age or more but below 80 years of age- Rs.2,50,000/- and (iv) For individuals
of 80 years of age or more- Rs.5,00,000/-.
Income Tax Return Statistics Assessment Year 2013-14 Version 1.0
32
3. Income Tax Returns - HUF
Income Tax Return Statistics Assessment Year 2013-14 Version 1.0
33
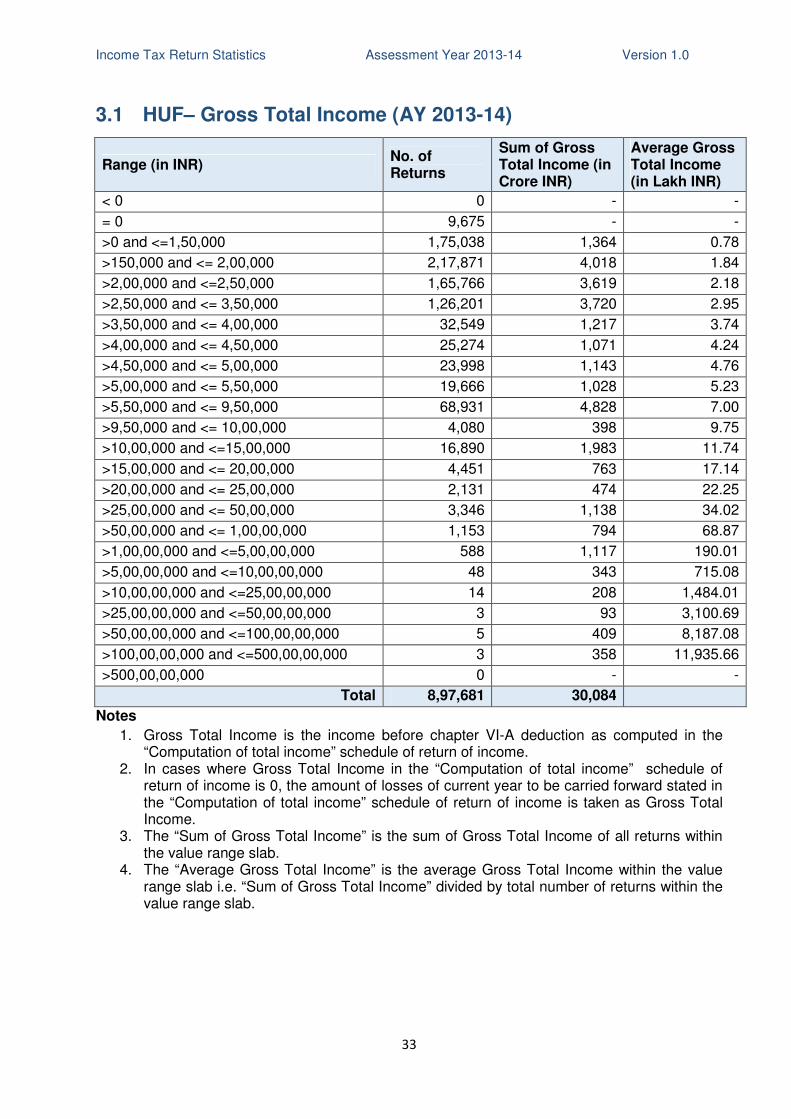
3.1 HUF– Gross Total Income (AY 2013-14)
Range (in INR) No. of Returns
Sum of Gross Total Income (in Crore INR)
Average Gross Total Income (in Lakh INR)
< 0 0 - -
= 0 9,675 - -
>0 and <=1,50,000 1,75,038 1,364 0.78
>150,000 and <= 2,00,000 2,17,871 4,018 1.84
>2,00,000 and <=2,50,000 1,65,766 3,619 2.18
>2,50,000 and <= 3,50,000 1,26,201 3,720 2.95
>3,50,000 and <= 4,00,000 32,549 1,217 3.74
>4,00,000 and <= 4,50,000 25,274 1,071 4.24
>4,50,000 and <= 5,00,000 23,998 1,143 4.76
>5,00,000 and <= 5,50,000 19,666 1,028 5.23
>5,50,000 and <= 9,50,000 68,931 4,828 7.00
>9,50,000 and <= 10,00,000 4,080 398 9.75
>10,00,000 and <=15,00,000 16,890 1,983 11.74
>15,00,000 and <= 20,00,000 4,451 763 17.14
>20,00,000 and <= 25,00,000 2,131 474 22.25
>25,00,000 and <= 50,00,000 3,346 1,138 34.02
>50,00,000 and <= 1,00,00,000 1,153 794 68.87
>1,00,00,000 and <=5,00,00,000 588 1,117 190.01
>5,00,00,000 and <=10,00,00,000 48 343 715.08
>10,00,00,000 and <=25,00,00,000 14 208 1,484.01
>25,00,00,000 and <=50,00,00,000 3 93 3,100.69
>50,00,00,000 and <=100,00,00,000 5 409 8,187.08
>100,00,00,000 and <=500,00,00,000 3 358 11,935.66
>500,00,00,000 0 - -
Total 8,97,681 30,084
Notes
1. Gross Total Income is the income before chapter VI-A deduction as computed in the “Computation of total income” schedule of return of income.
2. In cases where Gross Total Income in the “Computation of total income” schedule of return of income is 0, the amount of losses of current year to be carried forward stated in the “Computation of total income” schedule of return of income is taken as Gross Total Income.
3. The “Sum of Gross Total Income” is the sum of Gross Total Income of all returns within the value range slab.
4. The “Average Gross Total Income” is the average Gross Total Income within the value range slab i.e. “Sum of Gross Total Income” divided by total number of returns within the value range slab.
Income Tax Return Statistics Assessment Year 2013-14 Version 1.0
34
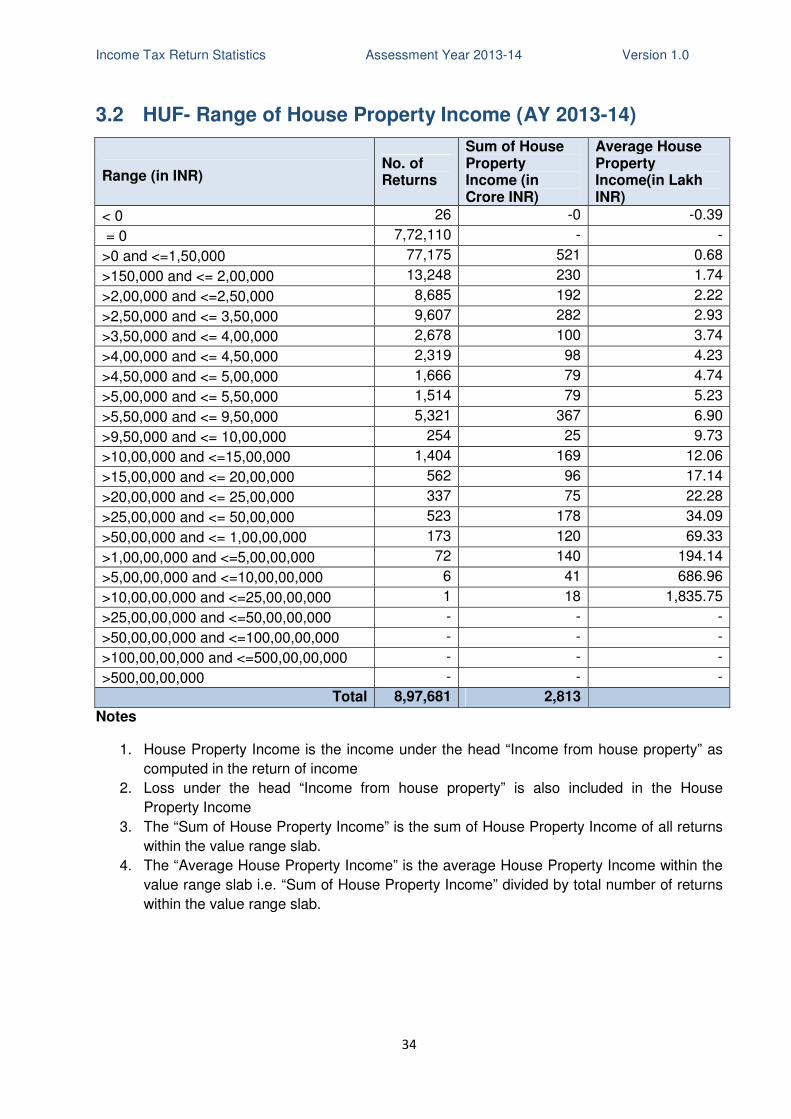
3.2 HUF- Range of House Property Income (AY 2013-14)
Range (in INR) No. of Returns
Sum of House Property Income (in Crore INR)
Average House Property Income(in Lakh INR)
< 0 26 -0 -0.39
= 0 7,72,110 - -
>0 and <=1,50,000 77,175 521 0.68
>150,000 and <= 2,00,000 13,248 230 1.74
>2,00,000 and <=2,50,000 8,685 192 2.22
>2,50,000 and <= 3,50,000 9,607 282 2.93
>3,50,000 and <= 4,00,000 2,678 100 3.74
>4,00,000 and <= 4,50,000 2,319 98 4.23
>4,50,000 and <= 5,00,000 1,666 79 4.74
>5,00,000 and <= 5,50,000 1,514 79 5.23
>5,50,000 and <= 9,50,000 5,321 367 6.90
>9,50,000 and <= 10,00,000 254 25 9.73
>10,00,000 and <=15,00,000 1,404 169 12.06
>15,00,000 and <= 20,00,000 562 96 17.14
>20,00,000 and <= 25,00,000 337 75 22.28
>25,00,000 and <= 50,00,000 523 178 34.09
>50,00,000 and <= 1,00,00,000 173 120 69.33
>1,00,00,000 and <=5,00,00,000 72 140 194.14
>5,00,00,000 and <=10,00,00,000 6 41 686.96
>10,00,00,000 and <=25,00,00,000 1 18 1,835.75
>25,00,00,000 and <=50,00,00,000 - - -
>50,00,00,000 and <=100,00,00,000 - - -
>100,00,00,000 and <=500,00,00,000 - - -
>500,00,00,000 - - -
Total 8,97,681 2,813
Notes
1. House Property Income is the income under the head “Income from house property” as
computed in the return of income
2. Loss under the head “Income from house property” is also included in the House
Property Income
3. The “Sum of House Property Income” is the sum of House Property Income of all returns
within the value range slab.
4. The “Average House Property Income” is the average House Property Income within the
value range slab i.e. “Sum of House Property Income” divided by total number of returns
within the value range slab.
Income Tax Return Statistics Assessment Year 2013-14 Version 1.0
35
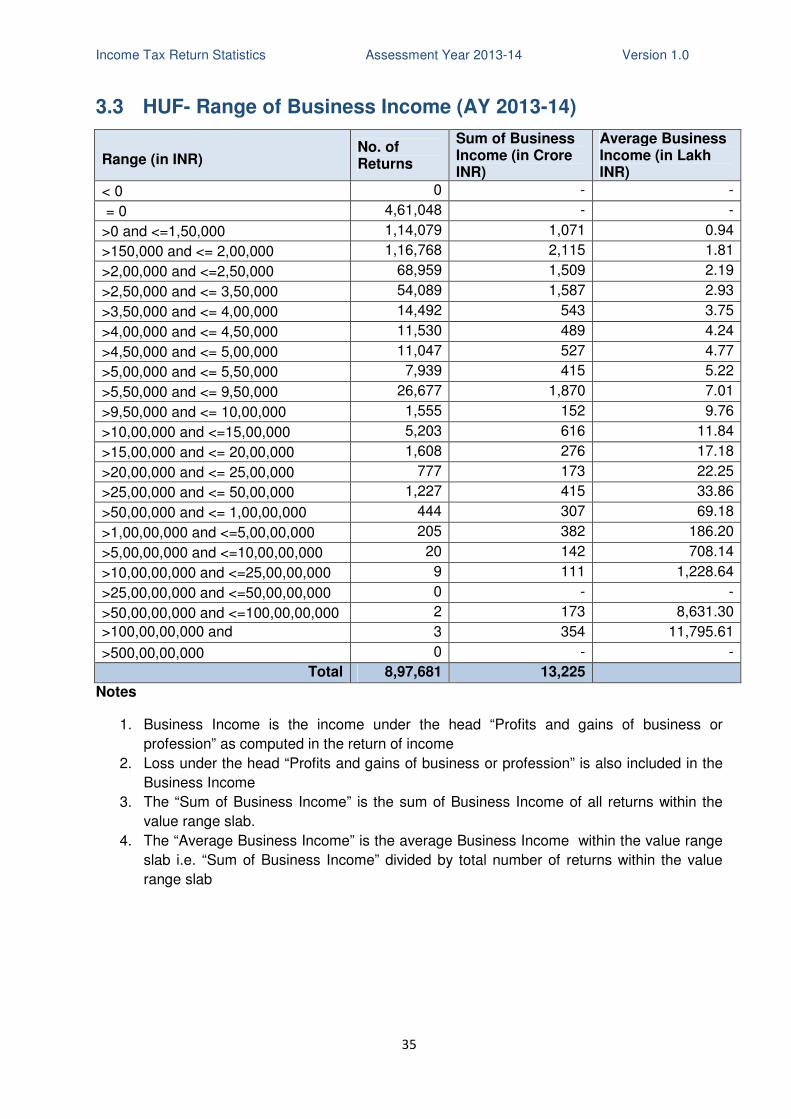
3.3 HUF- Range of Business Income (AY 2013-14)
Range (in INR) No. of Returns
Sum of Business Income (in Crore INR)
Average Business Income (in Lakh INR)
< 0 0 - -
= 0 4,61,048 - -
>0 and <=1,50,000 1,14,079 1,071 0.94
>150,000 and <= 2,00,000 1,16,768 2,115 1.81
>2,00,000 and <=2,50,000 68,959 1,509 2.19
>2,50,000 and <= 3,50,000 54,089 1,587 2.93
>3,50,000 and <= 4,00,000 14,492 543 3.75
>4,00,000 and <= 4,50,000 11,530 489 4.24
>4,50,000 and <= 5,00,000 11,047 527 4.77
>5,00,000 and <= 5,50,000 7,939 415 5.22
>5,50,000 and <= 9,50,000 26,677 1,870 7.01
>9,50,000 and <= 10,00,000 1,555 152 9.76
>10,00,000 and <=15,00,000 5,203 616 11.84
>15,00,000 and <= 20,00,000 1,608 276 17.18
>20,00,000 and <= 25,00,000 777 173 22.25
>25,00,000 and <= 50,00,000 1,227 415 33.86
>50,00,000 and <= 1,00,00,000 444 307 69.18
>1,00,00,000 and <=5,00,00,000 205 382 186.20
>5,00,00,000 and <=10,00,00,000 20 142 708.14
>10,00,00,000 and <=25,00,00,000 9 111 1,228.64
>25,00,00,000 and <=50,00,00,000 0 - -
>50,00,00,000 and <=100,00,00,000 2 173 8,631.30
>100,00,00,000 and <=500,00,00,000
3 354 11,795.61
>500,00,00,000 0 - -
Total 8,97,681 13,225
Notes
1. Business Income is the income under the head “Profits and gains of business or
profession” as computed in the return of income
2. Loss under the head “Profits and gains of business or profession” is also included in the
Business Income
3. The “Sum of Business Income” is the sum of Business Income of all returns within the
value range slab.
4. The “Average Business Income” is the average Business Income within the value range
slab i.e. “Sum of Business Income” divided by total number of returns within the value
range slab
Income Tax Return Statistics Assessment Year 2013-14 Version 1.0
36
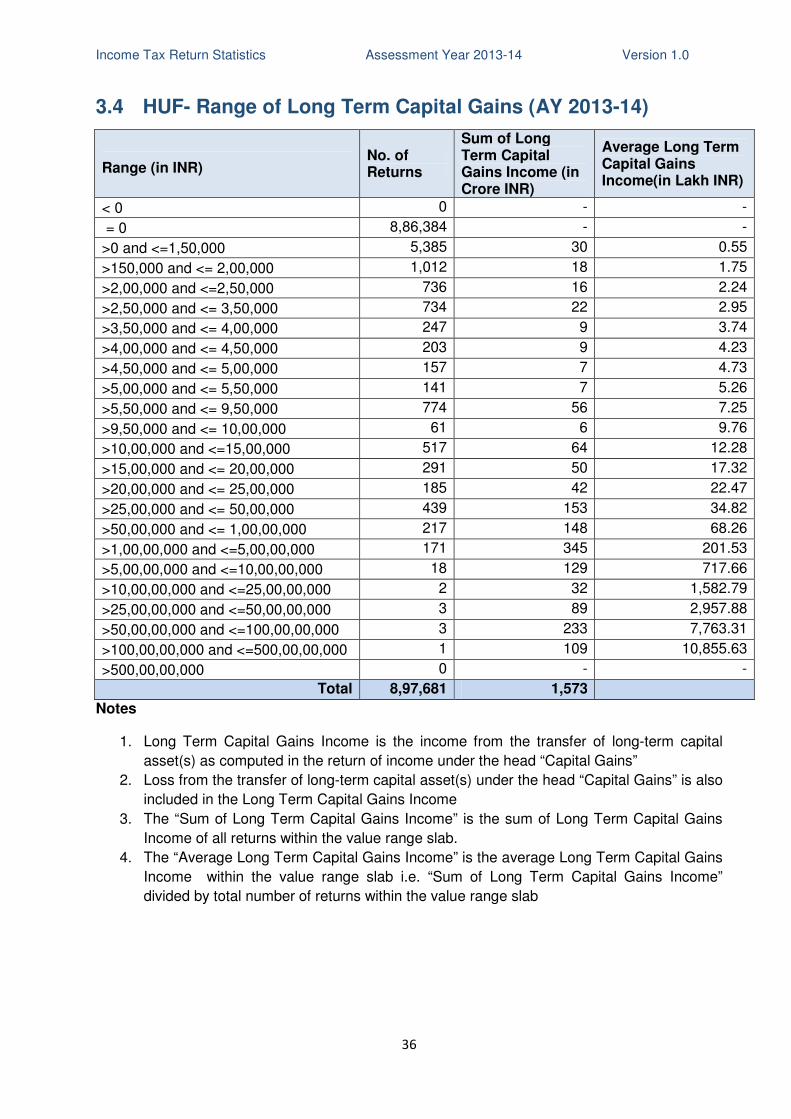
3.4 HUF- Range of Long Term Capital Gains (AY 2013-14)
Range (in INR) No. of Returns
Sum of Long Term Capital Gains Income (in Crore INR)
Average Long Term Capital Gains Income(in Lakh INR)
< 0 0 - -
= 0 8,86,384 - -
>0 and <=1,50,000 5,385 30 0.55
>150,000 and <= 2,00,000 1,012 18 1.75
>2,00,000 and <=2,50,000 736 16 2.24
>2,50,000 and <= 3,50,000 734 22 2.95
>3,50,000 and <= 4,00,000 247 9 3.74
>4,00,000 and <= 4,50,000 203 9 4.23
>4,50,000 and <= 5,00,000 157 7 4.73
>5,00,000 and <= 5,50,000 141 7 5.26
>5,50,000 and <= 9,50,000 774 56 7.25
>9,50,000 and <= 10,00,000 61 6 9.76
>10,00,000 and <=15,00,000 517 64 12.28
>15,00,000 and <= 20,00,000 291 50 17.32
>20,00,000 and <= 25,00,000 185 42 22.47
>25,00,000 and <= 50,00,000 439 153 34.82
>50,00,000 and <= 1,00,00,000 217 148 68.26
>1,00,00,000 and <=5,00,00,000 171 345 201.53
>5,00,00,000 and <=10,00,00,000 18 129 717.66
>10,00,00,000 and <=25,00,00,000 2 32 1,582.79
>25,00,00,000 and <=50,00,00,000 3 89 2,957.88
>50,00,00,000 and <=100,00,00,000 3 233 7,763.31
>100,00,00,000 and <=500,00,00,000 1 109 10,855.63
>500,00,00,000 0 - -
Total 8,97,681 1,573
Notes
1. Long Term Capital Gains Income is the income from the transfer of long-term capital
asset(s) as computed in the return of income under the head “Capital Gains”
2. Loss from the transfer of long-term capital asset(s) under the head “Capital Gains” is also
included in the Long Term Capital Gains Income
3. The “Sum of Long Term Capital Gains Income” is the sum of Long Term Capital Gains
Income of all returns within the value range slab.
4. The “Average Long Term Capital Gains Income” is the average Long Term Capital Gains
Income within the value range slab i.e. “Sum of Long Term Capital Gains Income”
divided by total number of returns within the value range slab
Income Tax Return Statistics Assessment Year 2013-14 Version 1.0
37
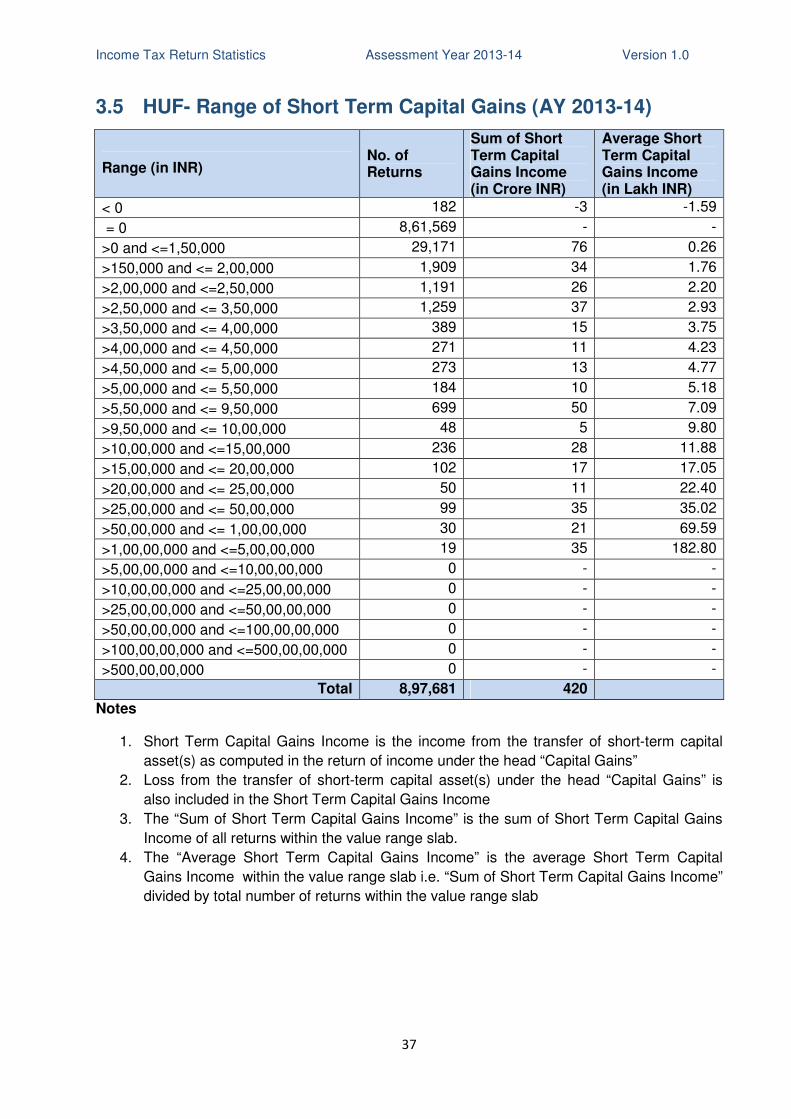
3.5 HUF- Range of Short Term Capital Gains (AY 2013-14)
Range (in INR) No. of Returns
Sum of Short Term Capital Gains Income (in Crore INR)
Average Short Term Capital Gains Income (in Lakh INR)
< 0 182 -3 -1.59
= 0 8,61,569 - -
>0 and <=1,50,000 29,171 76 0.26
>150,000 and <= 2,00,000 1,909 34 1.76
>2,00,000 and <=2,50,000 1,191 26 2.20
>2,50,000 and <= 3,50,000 1,259 37 2.93
>3,50,000 and <= 4,00,000 389 15 3.75
>4,00,000 and <= 4,50,000 271 11 4.23
>4,50,000 and <= 5,00,000 273 13 4.77
>5,00,000 and <= 5,50,000 184 10 5.18
>5,50,000 and <= 9,50,000 699 50 7.09
>9,50,000 and <= 10,00,000 48 5 9.80
>10,00,000 and <=15,00,000 236 28 11.88
>15,00,000 and <= 20,00,000 102 17 17.05
>20,00,000 and <= 25,00,000 50 11 22.40
>25,00,000 and <= 50,00,000 99 35 35.02
>50,00,000 and <= 1,00,00,000 30 21 69.59
>1,00,00,000 and <=5,00,00,000 19 35 182.80
>5,00,00,000 and <=10,00,00,000 0 - -
>10,00,00,000 and <=25,00,00,000 0 - -
>25,00,00,000 and <=50,00,00,000 0 - -
>50,00,00,000 and <=100,00,00,000 0 - -
>100,00,00,000 and <=500,00,00,000 0 - -
>500,00,00,000 0 - -
Total 8,97,681 420
Notes
1. Short Term Capital Gains Income is the income from the transfer of short-term capital
asset(s) as computed in the return of income under the head “Capital Gains”
2. Loss from the transfer of short-term capital asset(s) under the head “Capital Gains” is
also included in the Short Term Capital Gains Income
3. The “Sum of Short Term Capital Gains Income” is the sum of Short Term Capital Gains
Income of all returns within the value range slab.
4. The “Average Short Term Capital Gains Income” is the average Short Term Capital
Gains Income within the value range slab i.e. “Sum of Short Term Capital Gains Income”
divided by total number of returns within the value range slab
Income Tax Return Statistics Assessment Year 2013-14 Version 1.0
38
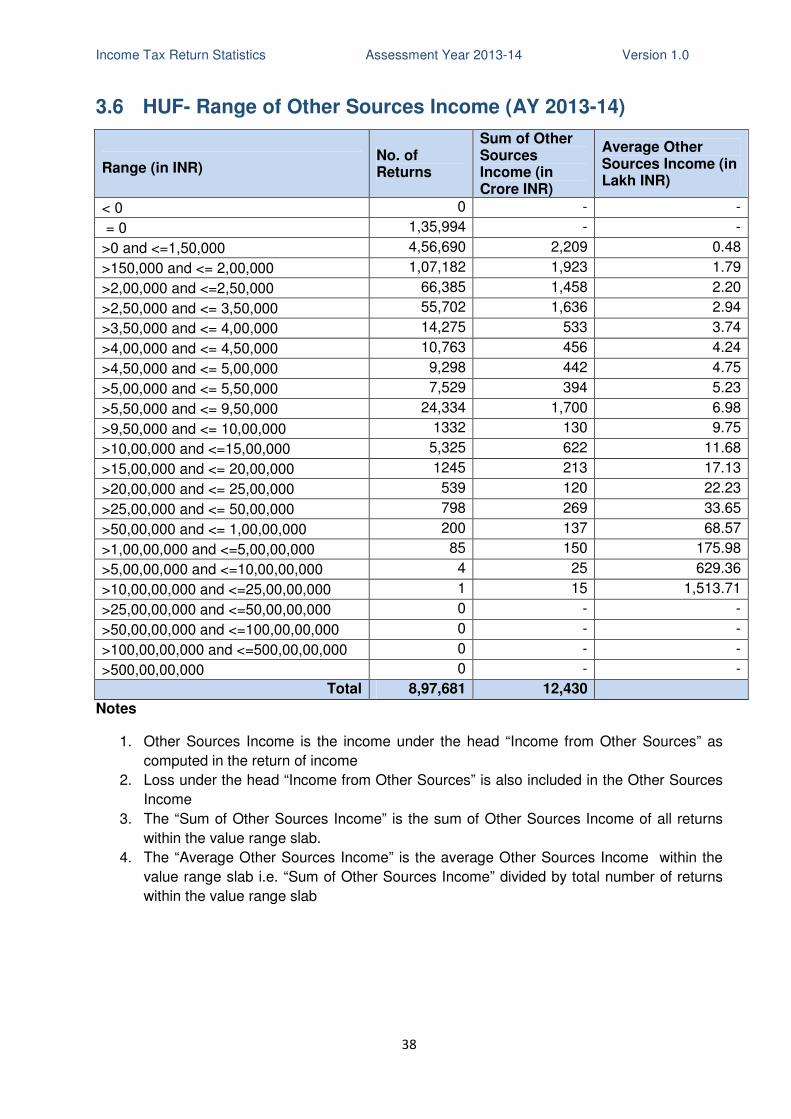
3.6 HUF- Range of Other Sources Income (AY 2013-14)
Range (in INR) No. of Returns
Sum of Other Sources Income (in Crore INR)
Average Other Sources Income (in Lakh INR)
< 0 0 - -
= 0 1,35,994 - -
>0 and <=1,50,000 4,56,690 2,209 0.48
>150,000 and <= 2,00,000 1,07,182 1,923 1.79
>2,00,000 and <=2,50,000 66,385 1,458 2.20
>2,50,000 and <= 3,50,000 55,702 1,636 2.94
>3,50,000 and <= 4,00,000 14,275 533 3.74
>4,00,000 and <= 4,50,000 10,763 456 4.24
>4,50,000 and <= 5,00,000 9,298 442 4.75
>5,00,000 and <= 5,50,000 7,529 394 5.23
>5,50,000 and <= 9,50,000 24,334 1,700 6.98
>9,50,000 and <= 10,00,000 1332 130 9.75
>10,00,000 and <=15,00,000 5,325 622 11.68
>15,00,000 and <= 20,00,000 1245 213 17.13
>20,00,000 and <= 25,00,000 539 120 22.23
>25,00,000 and <= 50,00,000 798 269 33.65
>50,00,000 and <= 1,00,00,000 200 137 68.57
>1,00,00,000 and <=5,00,00,000 85 150 175.98
>5,00,00,000 and <=10,00,00,000 4 25 629.36
>10,00,00,000 and <=25,00,00,000 1 15 1,513.71
>25,00,00,000 and <=50,00,00,000 0 - -
>50,00,00,000 and <=100,00,00,000 0 - -
>100,00,00,000 and <=500,00,00,000 0 - -
>500,00,00,000 0 - -
Total 8,97,681 12,430
Notes
1. Other Sources Income is the income under the head “Income from Other Sources” as
computed in the return of income
2. Loss under the head “Income from Other Sources” is also included in the Other Sources
Income
3. The “Sum of Other Sources Income” is the sum of Other Sources Income of all returns
within the value range slab.
4. The “Average Other Sources Income” is the average Other Sources Income within the
value range slab i.e. “Sum of Other Sources Income” divided by total number of returns
within the value range slab
Income Tax Return Statistics Assessment Year 2013-14 Version 1.0
39
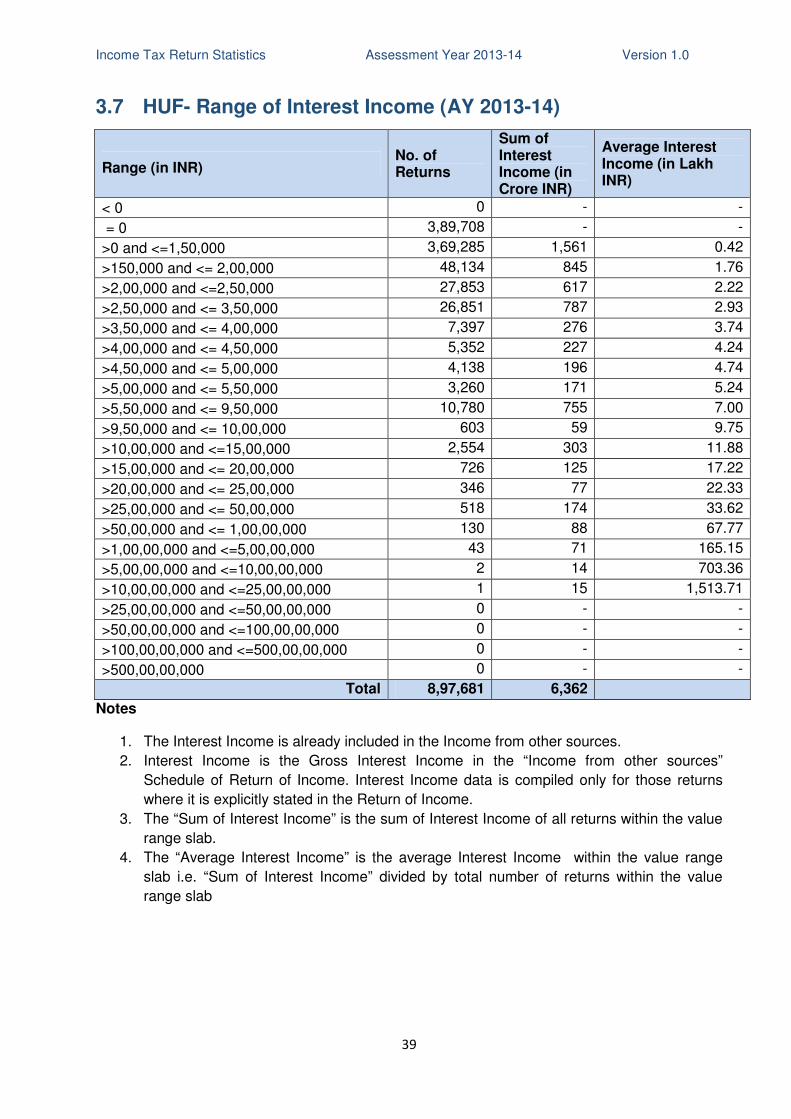
3.7 HUF- Range of Interest Income (AY 2013-14)
Range (in INR) No. of Returns
Sum of Interest Income (in Crore INR)
Average Interest Income (in Lakh INR)
< 0 0 - -
= 0 3,89,708 - -
>0 and <=1,50,000 3,69,285 1,561 0.42
>150,000 and <= 2,00,000 48,134 845 1.76
>2,00,000 and <=2,50,000 27,853 617 2.22
>2,50,000 and <= 3,50,000 26,851 787 2.93
>3,50,000 and <= 4,00,000 7,397 276 3.74
>4,00,000 and <= 4,50,000 5,352 227 4.24
>4,50,000 and <= 5,00,000 4,138 196 4.74
>5,00,000 and <= 5,50,000 3,260 171 5.24
>5,50,000 and <= 9,50,000 10,780 755 7.00
>9,50,000 and <= 10,00,000 603 59 9.75
>10,00,000 and <=15,00,000 2,554 303 11.88
>15,00,000 and <= 20,00,000 726 125 17.22
>20,00,000 and <= 25,00,000 346 77 22.33
>25,00,000 and <= 50,00,000 518 174 33.62
>50,00,000 and <= 1,00,00,000 130 88 67.77
>1,00,00,000 and <=5,00,00,000 43 71 165.15
>5,00,00,000 and <=10,00,00,000 2 14 703.36
>10,00,00,000 and <=25,00,00,000 1 15 1,513.71
>25,00,00,000 and <=50,00,00,000 0 - -
>50,00,00,000 and <=100,00,00,000 0 - -
>100,00,00,000 and <=500,00,00,000 0 - -
>500,00,00,000 0 - -
Total 8,97,681 6,362
Notes
1. The Interest Income is already included in the Income from other sources.
2. Interest Income is the Gross Interest Income in the “Income from other sources”
Schedule of Return of Income. Interest Income data is compiled only for those returns
where it is explicitly stated in the Return of Income.
3. The “Sum of Interest Income” is the sum of Interest Income of all returns within the value
range slab.
4. The “Average Interest Income” is the average Interest Income within the value range
slab i.e. “Sum of Interest Income” divided by total number of returns within the value
range slab
Income Tax Return Statistics Assessment Year 2013-14 Version 1.0
40
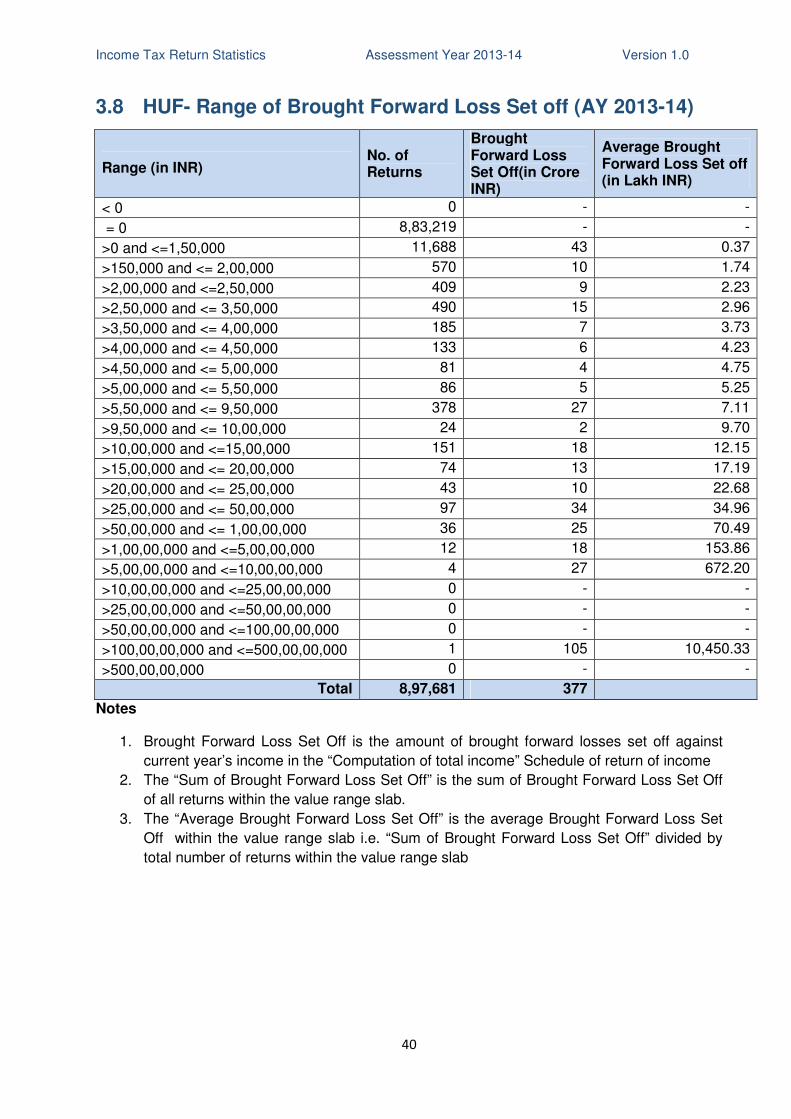
3.8 HUF- Range of Brought Forward Loss Set off (AY 2013-14)
Range (in INR) No. of Returns
Brought Forward Loss Set Off(in Crore INR)
Average Brought Forward Loss Set off (in Lakh INR)
< 0 0 - -
= 0 8,83,219 - -
>0 and <=1,50,000 11,688 43 0.37
>150,000 and <= 2,00,000 570 10 1.74
>2,00,000 and <=2,50,000 409 9 2.23
>2,50,000 and <= 3,50,000 490 15 2.96
>3,50,000 and <= 4,00,000 185 7 3.73
>4,00,000 and <= 4,50,000 133 6 4.23
>4,50,000 and <= 5,00,000 81 4 4.75
>5,00,000 and <= 5,50,000 86 5 5.25
>5,50,000 and <= 9,50,000 378 27 7.11
>9,50,000 and <= 10,00,000 24 2 9.70
>10,00,000 and <=15,00,000 151 18 12.15
>15,00,000 and <= 20,00,000 74 13 17.19
>20,00,000 and <= 25,00,000 43 10 22.68
>25,00,000 and <= 50,00,000 97 34 34.96
>50,00,000 and <= 1,00,00,000 36 25 70.49
>1,00,00,000 and <=5,00,00,000 12 18 153.86
>5,00,00,000 and <=10,00,00,000 4 27 672.20
>10,00,00,000 and <=25,00,00,000 0 - -
>25,00,00,000 and <=50,00,00,000 0 - -
>50,00,00,000 and <=100,00,00,000 0 - -
>100,00,00,000 and <=500,00,00,000 1 105 10,450.33
>500,00,00,000 0 - -
Total 8,97,681 377
Notes
1. Brought Forward Loss Set Off is the amount of brought forward losses set off against
current year’s income in the “Computation of total income” Schedule of return of income
2. The “Sum of Brought Forward Loss Set Off” is the sum of Brought Forward Loss Set Off
of all returns within the value range slab.
3. The “Average Brought Forward Loss Set Off” is the average Brought Forward Loss Set
Off within the value range slab i.e. “Sum of Brought Forward Loss Set Off” divided by
total number of returns within the value range slab

Income Tax Return Statistics Assessment Year 2013-14 Version 1.0
41
3.9 HUF- Range of Returned Income (AY 2013-14)
Range (in INR) No. of Returns
Sum of Returned Income (in Crore INR)
Average Returned Income (in Lakh INR)
< 0 0 - -
= 0 23,700 - -
>0 and <=1,50,000 1,77,493 1,484 0.84
>150,000 and <= 2,00,000 2,58,820 4,786 1.85
>2,00,000 and <=2,50,000 1,74,863 3,808 2.18
>2,50,000 and <= 3,50,000 92,994 2,718 2.92
>3,50,000 and <= 4,00,000 26,776 1,003 3.75
>4,00,000 and <= 4,50,000 22,354 948 4.24
>4,50,000 and <= 5,00,000 23,961 1,145 4.78
>5,00,000 and <= 5,50,000 17,439 910 5.22
>5,50,000 and <= 9,50,000 52,420 3,716 7.09
>9,50,000 and <= 10,00,000 3,922 383 9.77
>10,00,000 and <=15,00,000 12,276 1,453 11.83
>15,00,000 and <= 20,00,000 3,856 663 17.19
>20,00,000 and <= 25,00,000 1,890 421 22.29
>25,00,000 and <= 50,00,000 3,147 1,071 34.04
>50,00,000 and <= 1,00,00,000 1,127 776 68.81
>1,00,00,000 and <=5,00,00,000 572 1,087 190.07
>5,00,00,000 and <=10,00,00,000 47 332 707.25
>10,00,00,000 and <=25,00,00,000 13 194 1,488.55
>25,00,00,000 and <=50,00,00,000 3 93 3,096.92
>50,00,00,000 and <=100,00,00,000 5 406 8,125.66
>100,00,00,000 and <=500,00,00,000 3 357 11,894.79
>500,00,00,000 0 - -
Total 8,97,681 27,755
Notes
1. Returned Income is the total income after chapter VI-A deduction as computed in the
“Computation of total income” schedule of return of income
2. In cases where Total Income in the “Computation of total income” schedule of return of
income is 0, the amount of losses of current year to be carried forward stated in the
“Computation of total income” schedule of return of income is taken as Returned Income.
3. The “Sum of Returned Income” is the sum of Returned Income of all returns within the
value range slab.
4. The “Average Returned Income” is the average Returned Income within the value range
slab i.e. “Sum of Returned Income” divided by total number of returns within the value
range slab.
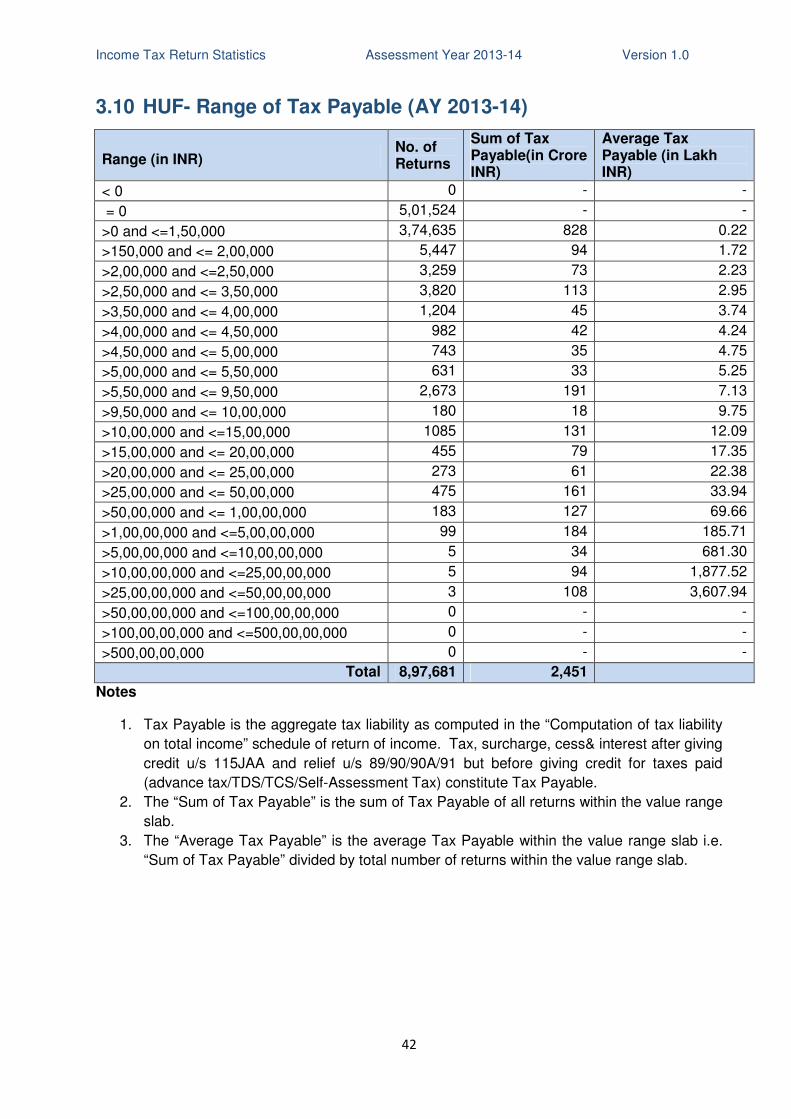
Income Tax Return Statistics Assessment Year 2013-14 Version 1.0
42
3.10 HUF- Range of Tax Payable (AY 2013-14)
Range (in INR) No. of Returns
Sum of Tax Payable(in Crore INR)
Average Tax Payable (in Lakh INR)
< 0 0 - -
= 0 5,01,524 - -
>0 and <=1,50,000 3,74,635 828 0.22
>150,000 and <= 2,00,000 5,447 94 1.72
>2,00,000 and <=2,50,000 3,259 73 2.23
>2,50,000 and <= 3,50,000 3,820 113 2.95
>3,50,000 and <= 4,00,000 1,204 45 3.74
>4,00,000 and <= 4,50,000 982 42 4.24
>4,50,000 and <= 5,00,000 743 35 4.75
>5,00,000 and <= 5,50,000 631 33 5.25
>5,50,000 and <= 9,50,000 2,673 191 7.13
>9,50,000 and <= 10,00,000 180 18 9.75
>10,00,000 and <=15,00,000 1085 131 12.09
>15,00,000 and <= 20,00,000 455 79 17.35
>20,00,000 and <= 25,00,000 273 61 22.38
>25,00,000 and <= 50,00,000 475 161 33.94
>50,00,000 and <= 1,00,00,000 183 127 69.66
>1,00,00,000 and <=5,00,00,000 99 184 185.71
>5,00,00,000 and <=10,00,00,000 5 34 681.30
>10,00,00,000 and <=25,00,00,000 5 94 1,877.52
>25,00,00,000 and <=50,00,00,000 3 108 3,607.94
>50,00,00,000 and <=100,00,00,000 0 - -
>100,00,00,000 and <=500,00,00,000 0 - -
>500,00,00,000 0 - -
Total 8,97,681 2,451
Notes
1. Tax Payable is the aggregate tax liability as computed in the “Computation of tax liability
on total income” schedule of return of income. Tax, surcharge, cess& interest after giving
credit u/s 115JAA and relief u/s 89/90/90A/91 but before giving credit for taxes paid
(advance tax/TDS/TCS/Self-Assessment Tax) constitute Tax Payable.
2. The “Sum of Tax Payable” is the sum of Tax Payable of all returns within the value range
slab.
3. The “Average Tax Payable” is the average Tax Payable within the value range slab i.e.
“Sum of Tax Payable” divided by total number of returns within the value range slab.
Income Tax Return Statistics Assessment Year 2013-14 Version 1.0
43
4. Income Tax Returns - Firms
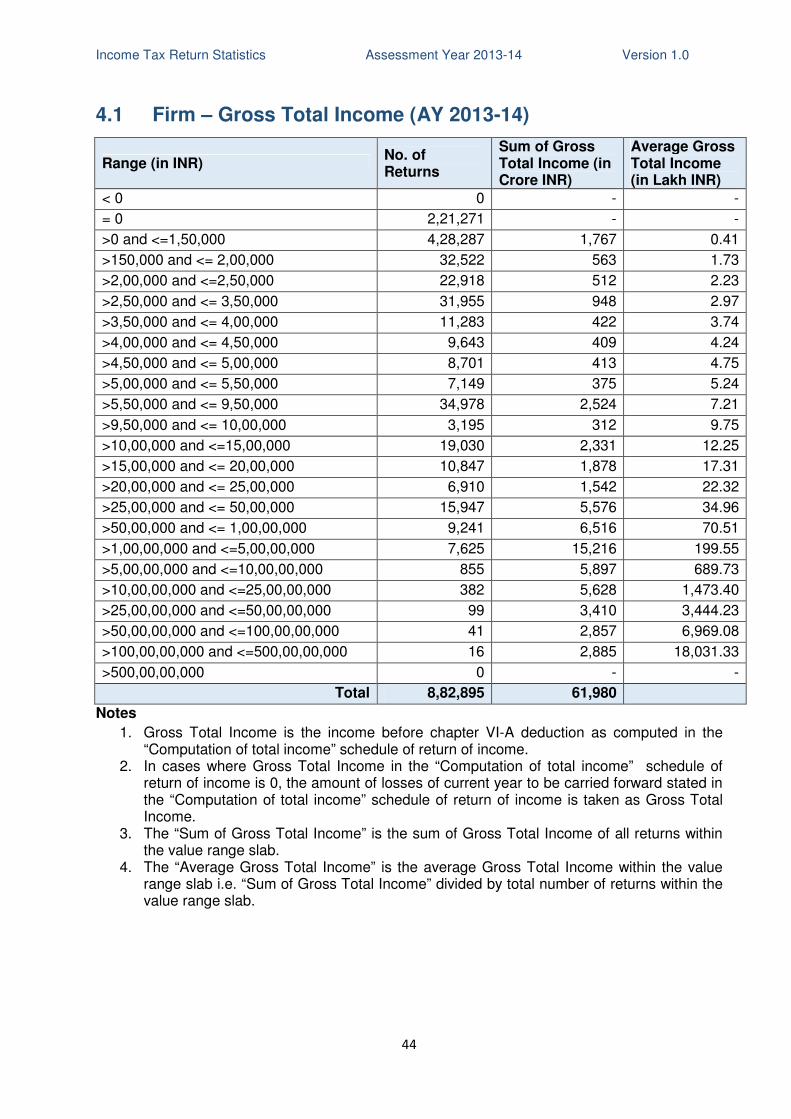
Income Tax Return Statistics Assessment Year 2013-14 Version 1.0
44
4.1 Firm – Gross Total Income (AY 2013-14)
Range (in INR) No. of Returns
Sum of Gross Total Income (in Crore INR)
Average Gross Total Income (in Lakh INR)
< 0 0 - -
= 0 2,21,271 - -
>0 and <=1,50,000 4,28,287 1,767 0.41
>150,000 and <= 2,00,000 32,522 563 1.73
>2,00,000 and <=2,50,000 22,918 512 2.23
>2,50,000 and <= 3,50,000 31,955 948 2.97
>3,50,000 and <= 4,00,000 11,283 422 3.74
>4,00,000 and <= 4,50,000 9,643 409 4.24
>4,50,000 and <= 5,00,000 8,701 413 4.75
>5,00,000 and <= 5,50,000 7,149 375 5.24
>5,50,000 and <= 9,50,000 34,978 2,524 7.21
>9,50,000 and <= 10,00,000 3,195 312 9.75
>10,00,000 and <=15,00,000 19,030 2,331 12.25
>15,00,000 and <= 20,00,000 10,847 1,878 17.31
>20,00,000 and <= 25,00,000 6,910 1,542 22.32
>25,00,000 and <= 50,00,000 15,947 5,576 34.96
>50,00,000 and <= 1,00,00,000 9,241 6,516 70.51
>1,00,00,000 and <=5,00,00,000 7,625 15,216 199.55
>5,00,00,000 and <=10,00,00,000 855 5,897 689.73
>10,00,00,000 and <=25,00,00,000 382 5,628 1,473.40
>25,00,00,000 and <=50,00,00,000 99 3,410 3,444.23
>50,00,00,000 and <=100,00,00,000 41 2,857 6,969.08
>100,00,00,000 and <=500,00,00,000 16 2,885 18,031.33
>500,00,00,000 0 - -
Total 8,82,895 61,980
Notes
1. Gross Total Income is the income before chapter VI-A deduction as computed in the “Computation of total income” schedule of return of income.
2. In cases where Gross Total Income in the “Computation of total income” schedule of return of income is 0, the amount of losses of current year to be carried forward stated in the “Computation of total income” schedule of return of income is taken as Gross Total Income.
3. The “Sum of Gross Total Income” is the sum of Gross Total Income of all returns within the value range slab.
4. The “Average Gross Total Income” is the average Gross Total Income within the value range slab i.e. “Sum of Gross Total Income” divided by total number of returns within the value range slab.
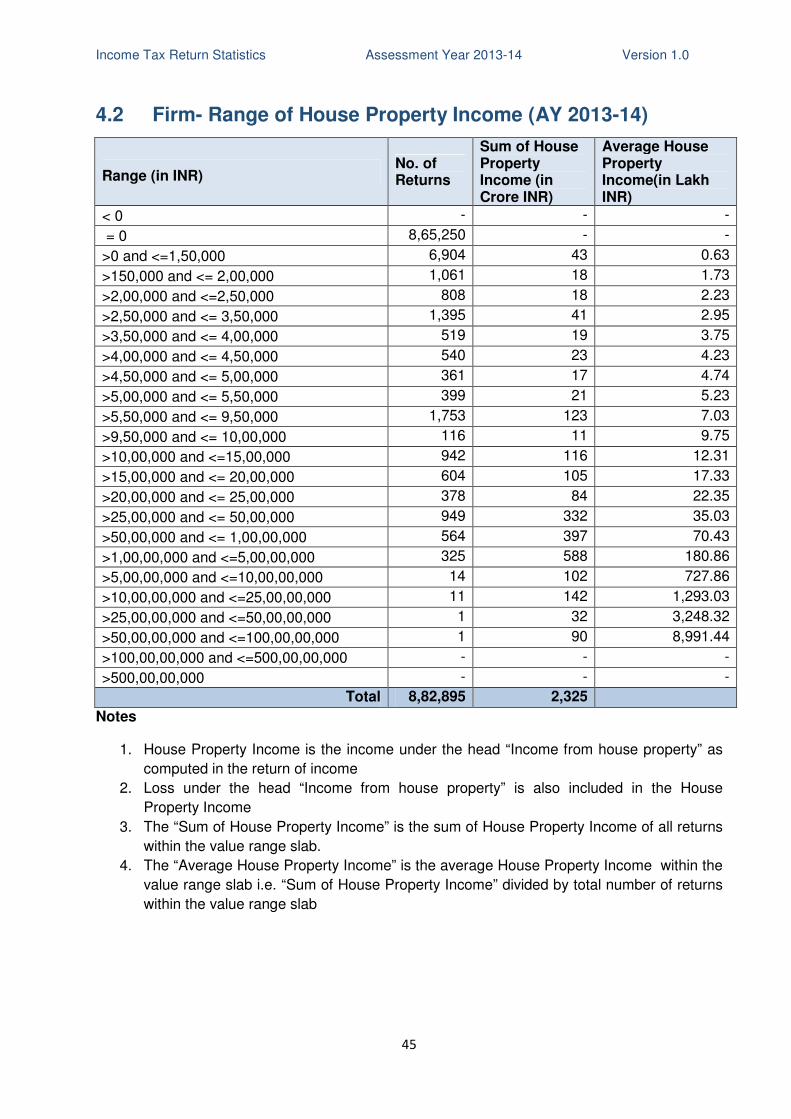
Income Tax Return Statistics Assessment Year 2013-14 Version 1.0
45
4.2 Firm- Range of House Property Income (AY 2013-14)
Range (in INR) No. of Returns
Sum of House Property Income (in Crore INR)
Average House Property Income(in Lakh INR)
< 0 - - -
= 0 8,65,250 - -
>0 and <=1,50,000 6,904 43 0.63
>150,000 and <= 2,00,000 1,061 18 1.73
>2,00,000 and <=2,50,000 808 18 2.23
>2,50,000 and <= 3,50,000 1,395 41 2.95
>3,50,000 and <= 4,00,000 519 19 3.75
>4,00,000 and <= 4,50,000 540 23 4.23
>4,50,000 and <= 5,00,000 361 17 4.74
>5,00,000 and <= 5,50,000 399 21 5.23
>5,50,000 and <= 9,50,000 1,753 123 7.03
>9,50,000 and <= 10,00,000 116 11 9.75
>10,00,000 and <=15,00,000 942 116 12.31
>15,00,000 and <= 20,00,000 604 105 17.33
>20,00,000 and <= 25,00,000 378 84 22.35
>25,00,000 and <= 50,00,000 949 332 35.03
>50,00,000 and <= 1,00,00,000 564 397 70.43
>1,00,00,000 and <=5,00,00,000 325 588 180.86
>5,00,00,000 and <=10,00,00,000 14 102 727.86
>10,00,00,000 and <=25,00,00,000 11 142 1,293.03
>25,00,00,000 and <=50,00,00,000 1 32 3,248.32
>50,00,00,000 and <=100,00,00,000 1 90 8,991.44
>100,00,00,000 and <=500,00,00,000 - - -
>500,00,00,000 - - -
Total 8,82,895 2,325
Notes
1. House Property Income is the income under the head “Income from house property” as
computed in the return of income
2. Loss under the head “Income from house property” is also included in the House
Property Income
3. The “Sum of House Property Income” is the sum of House Property Income of all returns
within the value range slab.
4. The “Average House Property Income” is the average House Property Income within the
value range slab i.e. “Sum of House Property Income” divided by total number of returns
within the value range slab
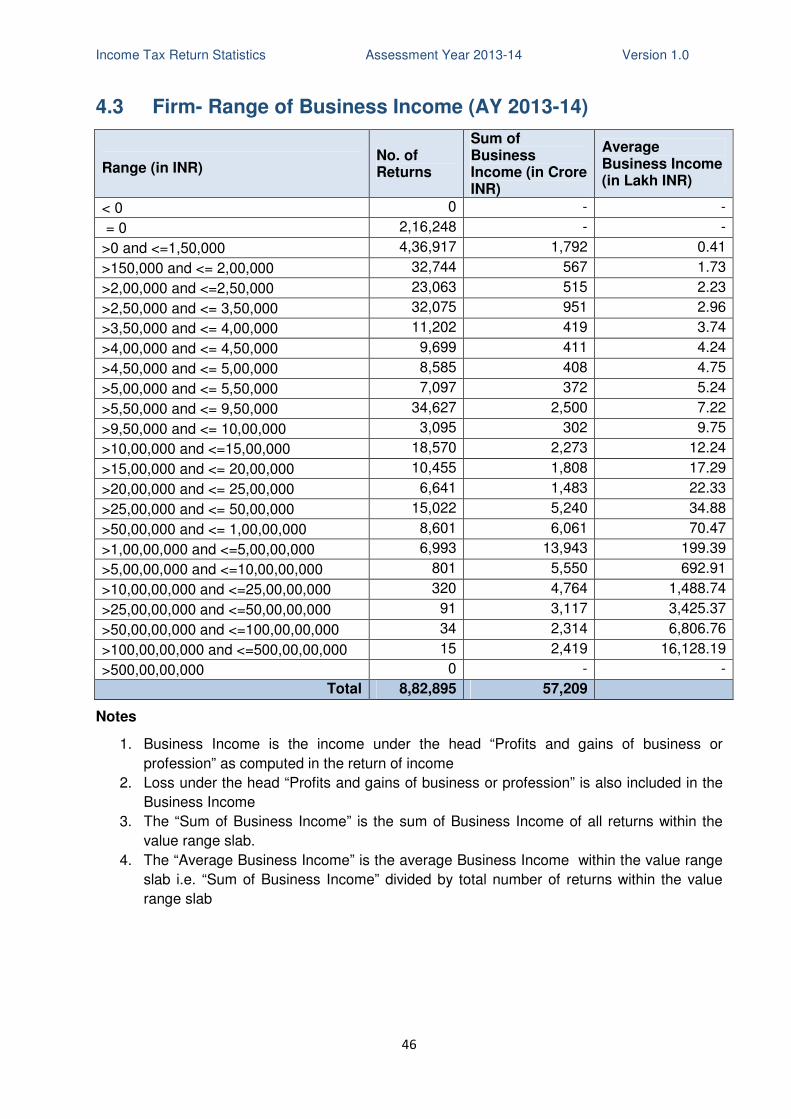
Income Tax Return Statistics Assessment Year 2013-14 Version 1.0
46
4.3 Firm- Range of Business Income (AY 2013-14)
Range (in INR) No. of Returns
Sum of Business Income (in Crore INR)
Average Business Income (in Lakh INR)
< 0 0 - -
= 0 2,16,248 - -
>0 and <=1,50,000 4,36,917 1,792 0.41
>150,000 and <= 2,00,000 32,744 567 1.73
>2,00,000 and <=2,50,000 23,063 515 2.23
>2,50,000 and <= 3,50,000 32,075 951 2.96
>3,50,000 and <= 4,00,000 11,202 419 3.74
>4,00,000 and <= 4,50,000 9,699 411 4.24
>4,50,000 and <= 5,00,000 8,585 408 4.75
>5,00,000 and <= 5,50,000 7,097 372 5.24
>5,50,000 and <= 9,50,000 34,627 2,500 7.22
>9,50,000 and <= 10,00,000 3,095 302 9.75
>10,00,000 and <=15,00,000 18,570 2,273 12.24
>15,00,000 and <= 20,00,000 10,455 1,808 17.29
>20,00,000 and <= 25,00,000 6,641 1,483 22.33
>25,00,000 and <= 50,00,000 15,022 5,240 34.88
>50,00,000 and <= 1,00,00,000 8,601 6,061 70.47
>1,00,00,000 and <=5,00,00,000 6,993 13,943 199.39
>5,00,00,000 and <=10,00,00,000 801 5,550 692.91
>10,00,00,000 and <=25,00,00,000 320 4,764 1,488.74
>25,00,00,000 and <=50,00,00,000 91 3,117 3,425.37
>50,00,00,000 and <=100,00,00,000 34 2,314 6,806.76
>100,00,00,000 and <=500,00,00,000 15 2,419 16,128.19
>500,00,00,000 0 - -
Total 8,82,895 57,209
Notes
1. Business Income is the income under the head “Profits and gains of business or
profession” as computed in the return of income
2. Loss under the head “Profits and gains of business or profession” is also included in the
Business Income
3. The “Sum of Business Income” is the sum of Business Income of all returns within the
value range slab.
4. The “Average Business Income” is the average Business Income within the value range
slab i.e. “Sum of Business Income” divided by total number of returns within the value
range slab

Income Tax Return Statistics Assessment Year 2013-14 Version 1.0
47
4.4 Firm- Range of Long Term Capital Gains (AY 2013-14)
Range (in INR) No. of Returns
Sum of Long Term Capital Gains Income (in Crore INR)
Average Long Term Capital Gains Income (in Lakh INR)
< 0 0 - -
= 0 8,80,046 - -
>0 and <=1,50,000 1156 2 0.20
>150,000 and <= 2,00,000 69 1 1.78
>2,00,000 and <=2,50,000 42 1 2.27
>2,50,000 and <= 3,50,000 76 2 2.97
>3,50,000 and <= 4,00,000 38 1 3.75
>4,00,000 and <= 4,50,000 27 1 4.26
>4,50,000 and <= 5,00,000 44 2 4.81
>5,00,000 and <= 5,50,000 24 1 5.26
>5,50,000 and <= 9,50,000 188 14 7.32
>9,50,000 and <= 10,00,000 30 3 9.78
>10,00,000 and <=15,00,000 153 19 12.62
>15,00,000 and <= 20,00,000 116 20 17.39
>20,00,000 and <= 25,00,000 97 22 22.23
>25,00,000 and <= 50,00,000 297 107 36.09
>50,00,000 and <= 1,00,00,000 195 140 71.93
>1,00,00,000 and <=5,00,00,000 229 471 205.57
>5,00,00,000 and <=10,00,00,000 37 247 666.84
>10,00,00,000 and <=25,00,00,000 24 373 1,554.09
>25,00,00,000 and <=50,00,00,000 3 107 3,572.45
>50,00,00,000 and <=100,00,00,000 3 245 8,180.98
>100,00,00,000 and <=500,00,00,000 1 131 13,121.91
>500,00,00,000 0 - -
Total 8,82,895 1,912
Notes
1. Long Term Capital Gains Income is the income from the transfer of long-term capital
asset(s) as computed in the return of income under the head “Capital Gains”
2. Loss from the transfer of long-term capital asset(s) under the head “Capital Gains” is also
included in the Long Term Capital Gains Income
3. The “Sum of Long Term Capital Gains Income” is the sum of Long Term Capital Gains
Income of all returns within the value range slab.
4. The “Average Long Term Capital Gains Income” is the average Long Term Capital Gains
Income within the value range slab i.e. “Sum of Long Term Capital Gains Income”
divided by total number of returns within the value range slab

Income Tax Return Statistics Assessment Year 2013-14 Version 1.0
48
4.5 Firm- Range of Short Term Capital Gains (AY 2013-14)
Range (in INR) No. of Returns
Sum of Short Term Capital Gains Income (in Crore INR)
Average Short Term Capital Gains Income (in Lakh INR)
< 0 66 -8 -12.55
= 0 8,78,577 - -
>0 and <=1,50,000 2,672 9 0.34
>150,000 and <= 2,00,000 165 3 1.73
>2,00,000 and <=2,50,000 110 2 2.24
>2,50,000 and <= 3,50,000 184 5 2.95
>3,50,000 and <= 4,00,000 72 3 3.75
>4,00,000 and <= 4,50,000 50 2 4.24
>4,50,000 and <= 5,00,000 51 2 4.74
>5,00,000 and <= 5,50,000 42 2 5.24
>5,50,000 and <= 9,50,000 214 15 7.17
>9,50,000 and <= 10,00,000 22 2 9.81
>10,00,000 and <=15,00,000 161 20 12.27
>15,00,000 and <= 20,00,000 89 16 17.55
>20,00,000 and <= 25,00,000 65 14 22.01
>25,00,000 and <= 50,00,000 148 53 35.66
>50,00,000 and <= 1,00,00,000 109 76 70.04
>1,00,00,000 and <=5,00,00,000 78 159 203.34
>5,00,00,000 and <=10,00,00,000 11 82 745.79
>10,00,00,000 and <=25,00,00,000 4 48 1,194.85
>25,00,00,000 and <=50,00,00,000 5 182 3,644.69
>50,00,00,000 and <=100,00,00,000 0 - -
>100,00,00,000 and <=500,00,00,000 0 - -
>500,00,00,000 0 - -
Total 8,82,895 688
Notes
1. Short Term Capital Gains Income is the income from the transfer of short-term capital
asset(s) as computed in the return of income under the head “Capital Gains”
2. Loss from the transfer of short-term capital asset(s) under the head “Capital Gains” is
also included in the Short Term Capital Gains Income
3. The “Sum of Short Term Capital Gains Income” is the sum of Short Term Capital Gains
Income of all returns within the value range slab.
4. The “Average Short Term Capital Gains Income” is the average Short Term Capital
Gains Income within the value range slab i.e. “Sum of Short Term Capital Gains Income”
divided by total number of returns within the value range slab
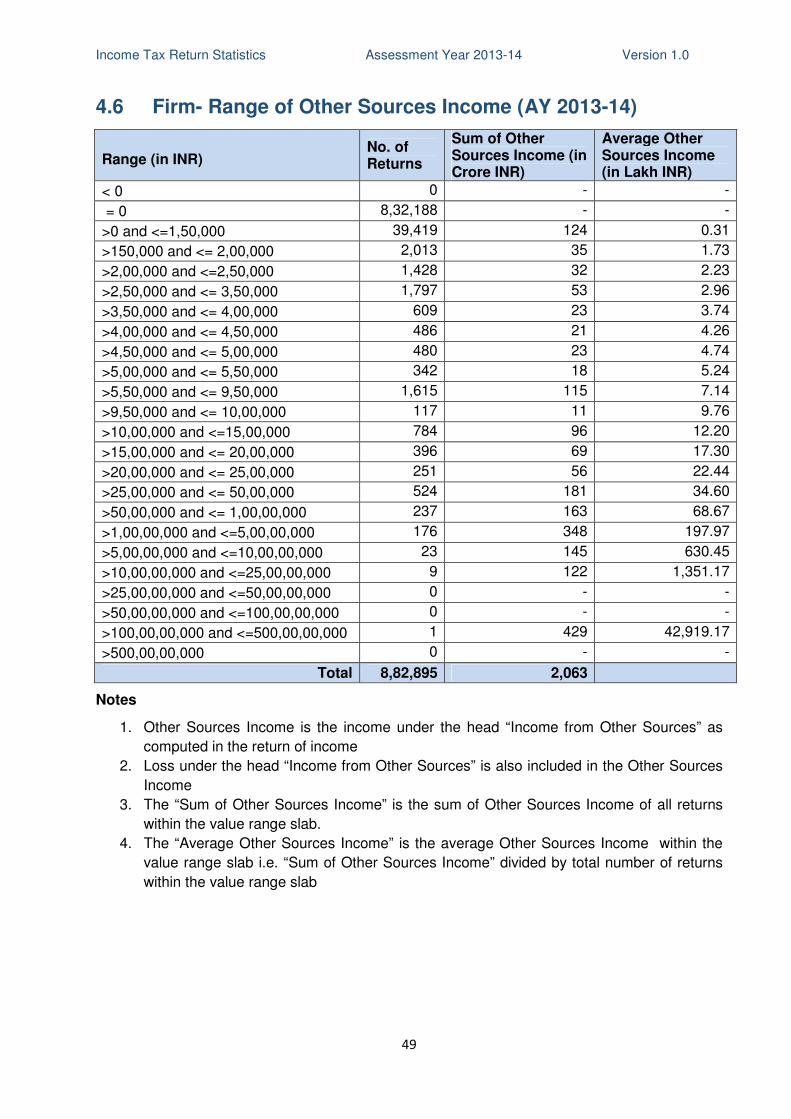
Income Tax Return Statistics Assessment Year 2013-14 Version 1.0
49
4.6 Firm- Range of Other Sources Income (AY 2013-14)
Range (in INR) No. of Returns
Sum of Other Sources Income (in Crore INR)
Average Other Sources Income (in Lakh INR)
< 0 0 - -
= 0 8,32,188 - -
>0 and <=1,50,000 39,419 124 0.31
>150,000 and <= 2,00,000 2,013 35 1.73
>2,00,000 and <=2,50,000 1,428 32 2.23
>2,50,000 and <= 3,50,000 1,797 53 2.96
>3,50,000 and <= 4,00,000 609 23 3.74
>4,00,000 and <= 4,50,000 486 21 4.26
>4,50,000 and <= 5,00,000 480 23 4.74
>5,00,000 and <= 5,50,000 342 18 5.24
>5,50,000 and <= 9,50,000 1,615 115 7.14
>9,50,000 and <= 10,00,000 117 11 9.76
>10,00,000 and <=15,00,000 784 96 12.20
>15,00,000 and <= 20,00,000 396 69 17.30
>20,00,000 and <= 25,00,000 251 56 22.44
>25,00,000 and <= 50,00,000 524 181 34.60
>50,00,000 and <= 1,00,00,000 237 163 68.67
>1,00,00,000 and <=5,00,00,000 176 348 197.97
>5,00,00,000 and <=10,00,00,000 23 145 630.45
>10,00,00,000 and <=25,00,00,000 9 122 1,351.17
>25,00,00,000 and <=50,00,00,000 0 - -
>50,00,00,000 and <=100,00,00,000 0 - -
>100,00,00,000 and <=500,00,00,000 1 429 42,919.17
>500,00,00,000 0 - -
Total 8,82,895 2,063
Notes
1. Other Sources Income is the income under the head “Income from Other Sources” as
computed in the return of income
2. Loss under the head “Income from Other Sources” is also included in the Other Sources
Income
3. The “Sum of Other Sources Income” is the sum of Other Sources Income of all returns
within the value range slab.
4. The “Average Other Sources Income” is the average Other Sources Income within the
value range slab i.e. “Sum of Other Sources Income” divided by total number of returns
within the value range slab
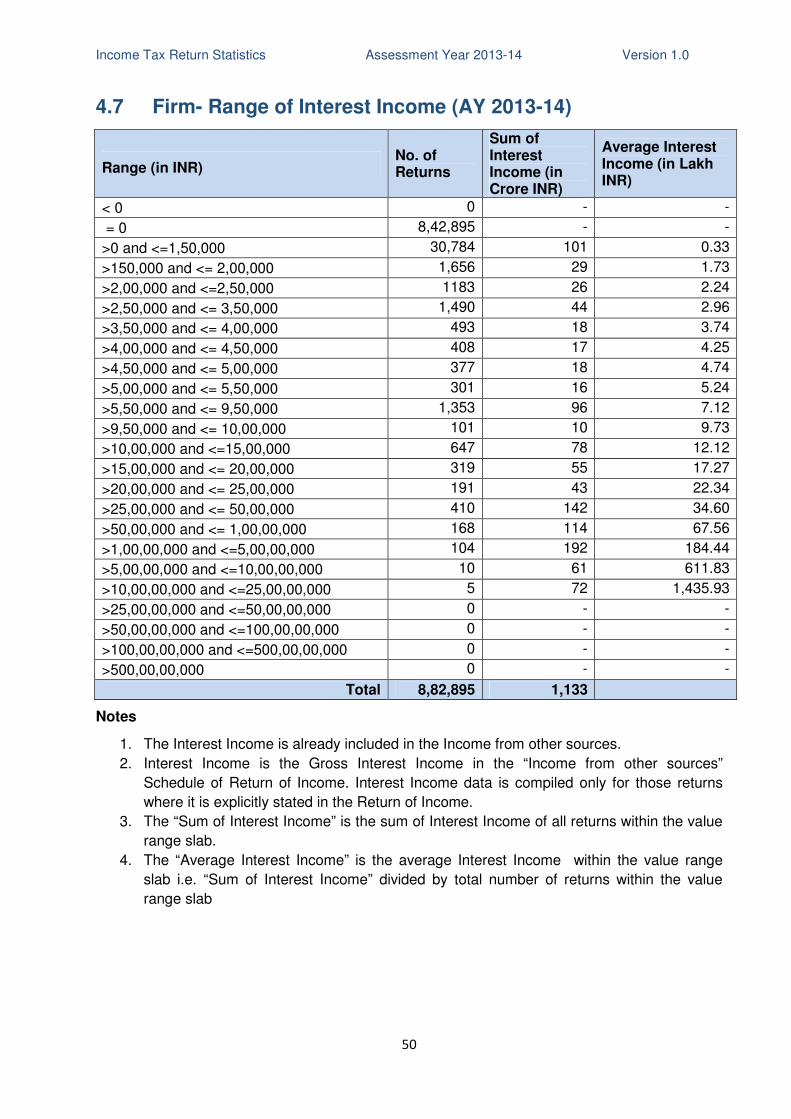
Income Tax Return Statistics Assessment Year 2013-14 Version 1.0
50
4.7 Firm- Range of Interest Income (AY 2013-14)
Range (in INR) No. of Returns
Sum of Interest Income (in Crore INR)
Average Interest Income (in Lakh INR)
< 0 0 - -
= 0 8,42,895 - -
>0 and <=1,50,000 30,784 101 0.33
>150,000 and <= 2,00,000 1,656 29 1.73
>2,00,000 and <=2,50,000 1183 26 2.24
>2,50,000 and <= 3,50,000 1,490 44 2.96
>3,50,000 and <= 4,00,000 493 18 3.74
>4,00,000 and <= 4,50,000 408 17 4.25
>4,50,000 and <= 5,00,000 377 18 4.74
>5,00,000 and <= 5,50,000 301 16 5.24
>5,50,000 and <= 9,50,000 1,353 96 7.12
>9,50,000 and <= 10,00,000 101 10 9.73
>10,00,000 and <=15,00,000 647 78 12.12
>15,00,000 and <= 20,00,000 319 55 17.27
>20,00,000 and <= 25,00,000 191 43 22.34
>25,00,000 and <= 50,00,000 410 142 34.60
>50,00,000 and <= 1,00,00,000 168 114 67.56
>1,00,00,000 and <=5,00,00,000 104 192 184.44
>5,00,00,000 and <=10,00,00,000 10 61 611.83
>10,00,00,000 and <=25,00,00,000 5 72 1,435.93
>25,00,00,000 and <=50,00,00,000 0 - -
>50,00,00,000 and <=100,00,00,000 0 - -
>100,00,00,000 and <=500,00,00,000 0 - -
>500,00,00,000 0 - -
Total 8,82,895 1,133
Notes
1. The Interest Income is already included in the Income from other sources.
2. Interest Income is the Gross Interest Income in the “Income from other sources”
Schedule of Return of Income. Interest Income data is compiled only for those returns
where it is explicitly stated in the Return of Income.
3. The “Sum of Interest Income” is the sum of Interest Income of all returns within the value
range slab.
4. The “Average Interest Income” is the average Interest Income within the value range
slab i.e. “Sum of Interest Income” divided by total number of returns within the value
range slab

Income Tax Return Statistics Assessment Year 2013-14 Version 1.0
51
4.8 Firm- Range of Brought Forward Loss Set off (AY 2013-14)
Range (in INR) No. of Returns
Sum of Brought Forward Loss Set Off(in Crore INR)
Average Brought Forward Loss Set off (in Lakh INR)
< 0 0 - -
= 0 8,37,000 - -
>0 and <=1,50,000 31,238 118 0.38
>150,000 and <= 2,00,000 2,178 38 1.73
>2,00,000 and <=2,50,000 1,658 37 2.24
>2,50,000 and <= 3,50,000 2,309 68 2.96
>3,50,000 and <= 4,00,000 855 32 3.74
>4,00,000 and <= 4,50,000 727 31 4.24
>4,50,000 and <= 5,00,000 559 27 4.76
>5,00,000 and <= 5,50,000 479 25 5.24
>5,50,000 and <= 9,50,000 2,312 166 7.17
>9,50,000 and <= 10,00,000 173 17 9.73
>10,00,000 and <=15,00,000 1,065 130 12.19
>15,00,000 and <= 20,00,000 602 104 17.21
>20,00,000 and <= 25,00,000 353 79 22.41
>25,00,000 and <= 50,00,000 762 260 34.06
>50,00,000 and <= 1,00,00,000 346 241 69.70
>1,00,00,000 and <=5,00,00,000 245 490 200.15
>5,00,00,000 and <=10,00,00,000 24 167 695.85
>10,00,00,000 and <=25,00,00,000 8 122 1,527.86
>25,00,00,000 and <=50,00,00,000 2 66 3,306.38
>50,00,00,000 and <=100,00,00,000 0 - -
>100,00,00,000 and <=500,00,00,000 0 - -
>500,00,00,000 0 - -
Total 8,82,895 2,217
Notes
1. Brought Forward Loss Set Off is the amount of brought forward losses set off against
current year’s income in the “Computation of total income” Schedule of return of income
2. The “Sum of Brought Forward Loss Set Off” is the sum of Brought Forward Loss Set Off
of all returns within the value range slab.
3. The “Average Brought Forward Loss Set Off” is the average Brought Forward Loss Set
Off within the value range slab i.e. “Sum of Brought Forward Loss Set Off” divided by
total number of returns within the value range slab
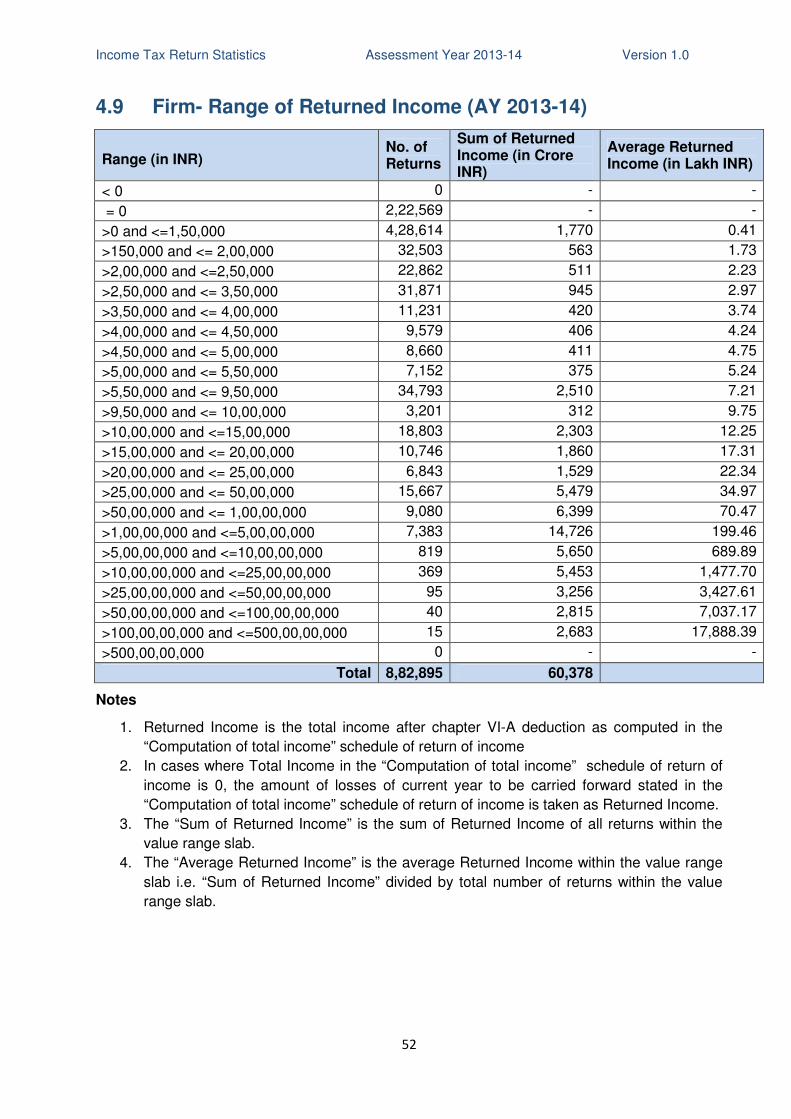
Income Tax Return Statistics Assessment Year 2013-14 Version 1.0
52
4.9 Firm- Range of Returned Income (AY 2013-14)
Range (in INR) No. of Returns
Sum of Returned Income (in Crore INR)
Average Returned Income (in Lakh INR)
< 0 0 - -
= 0 2,22,569 - -
>0 and <=1,50,000 4,28,614 1,770 0.41
>150,000 and <= 2,00,000 32,503 563 1.73
>2,00,000 and <=2,50,000 22,862 511 2.23
>2,50,000 and <= 3,50,000 31,871 945 2.97
>3,50,000 and <= 4,00,000 11,231 420 3.74
>4,00,000 and <= 4,50,000 9,579 406 4.24
>4,50,000 and <= 5,00,000 8,660 411 4.75
>5,00,000 and <= 5,50,000 7,152 375 5.24
>5,50,000 and <= 9,50,000 34,793 2,510 7.21
>9,50,000 and <= 10,00,000 3,201 312 9.75
>10,00,000 and <=15,00,000 18,803 2,303 12.25
>15,00,000 and <= 20,00,000 10,746 1,860 17.31
>20,00,000 and <= 25,00,000 6,843 1,529 22.34
>25,00,000 and <= 50,00,000 15,667 5,479 34.97
>50,00,000 and <= 1,00,00,000 9,080 6,399 70.47
>1,00,00,000 and <=5,00,00,000 7,383 14,726 199.46
>5,00,00,000 and <=10,00,00,000 819 5,650 689.89
>10,00,00,000 and <=25,00,00,000 369 5,453 1,477.70
>25,00,00,000 and <=50,00,00,000 95 3,256 3,427.61
>50,00,00,000 and <=100,00,00,000 40 2,815 7,037.17
>100,00,00,000 and <=500,00,00,000 15 2,683 17,888.39
>500,00,00,000 0 - -
Total 8,82,895 60,378
Notes
1. Returned Income is the total income after chapter VI-A deduction as computed in the
“Computation of total income” schedule of return of income
2. In cases where Total Income in the “Computation of total income” schedule of return of
income is 0, the amount of losses of current year to be carried forward stated in the
“Computation of total income” schedule of return of income is taken as Returned Income.
3. The “Sum of Returned Income” is the sum of Returned Income of all returns within the
value range slab.
4. The “Average Returned Income” is the average Returned Income within the value range
slab i.e. “Sum of Returned Income” divided by total number of returns within the value
range slab.
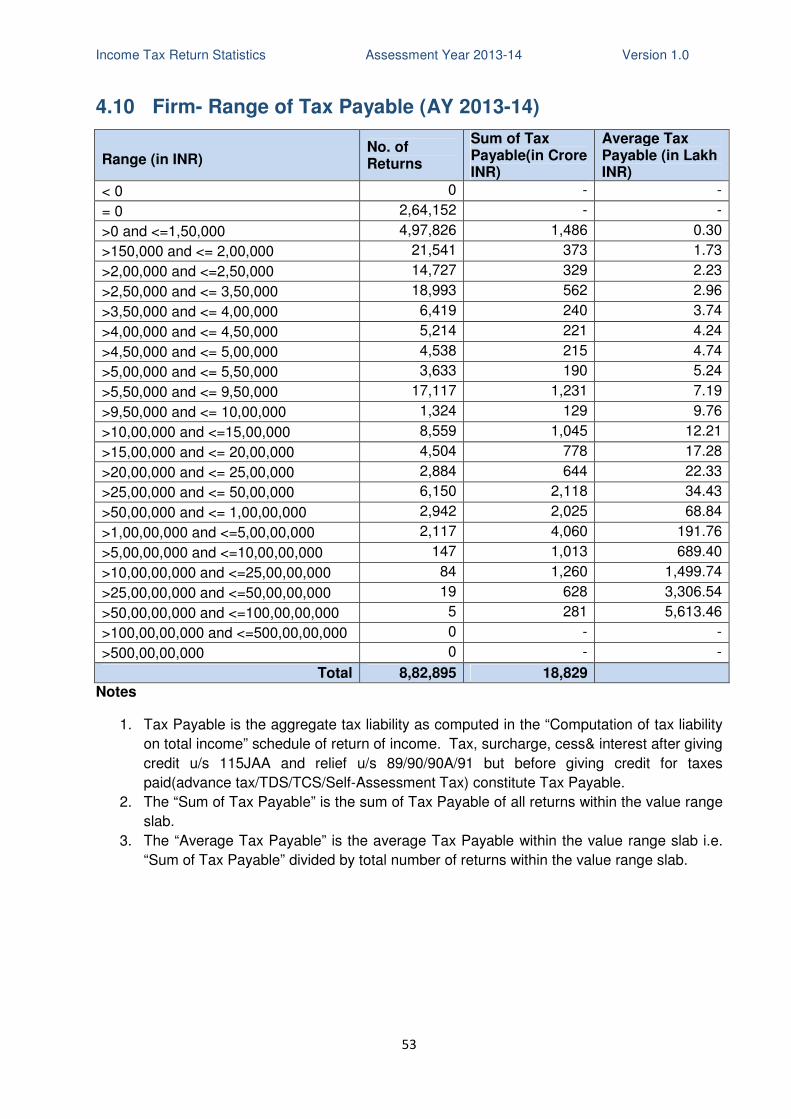
Income Tax Return Statistics Assessment Year 2013-14 Version 1.0
53
4.10 Firm- Range of Tax Payable (AY 2013-14)
Range (in INR) No. of Returns
Sum of Tax Payable(in Crore INR)
Average Tax Payable (in Lakh INR)
< 0 0 - -
= 0 2,64,152 - -
>0 and <=1,50,000 4,97,826 1,486 0.30
>150,000 and <= 2,00,000 21,541 373 1.73
>2,00,000 and <=2,50,000 14,727 329 2.23
>2,50,000 and <= 3,50,000 18,993 562 2.96
>3,50,000 and <= 4,00,000 6,419 240 3.74
>4,00,000 and <= 4,50,000 5,214 221 4.24
>4,50,000 and <= 5,00,000 4,538 215 4.74
>5,00,000 and <= 5,50,000 3,633 190 5.24
>5,50,000 and <= 9,50,000 17,117 1,231 7.19
>9,50,000 and <= 10,00,000 1,324 129 9.76
>10,00,000 and <=15,00,000 8,559 1,045 12.21
>15,00,000 and <= 20,00,000 4,504 778 17.28
>20,00,000 and <= 25,00,000 2,884 644 22.33
>25,00,000 and <= 50,00,000 6,150 2,118 34.43
>50,00,000 and <= 1,00,00,000 2,942 2,025 68.84
>1,00,00,000 and <=5,00,00,000 2,117 4,060 191.76
>5,00,00,000 and <=10,00,00,000 147 1,013 689.40
>10,00,00,000 and <=25,00,00,000 84 1,260 1,499.74
>25,00,00,000 and <=50,00,00,000 19 628 3,306.54
>50,00,00,000 and <=100,00,00,000 5 281 5,613.46
>100,00,00,000 and <=500,00,00,000 0 - -
>500,00,00,000 0 - -
Total 8,82,895 18,829
Notes
1. Tax Payable is the aggregate tax liability as computed in the “Computation of tax liability
on total income” schedule of return of income. Tax, surcharge, cess& interest after giving
credit u/s 115JAA and relief u/s 89/90/90A/91 but before giving credit for taxes
paid(advance tax/TDS/TCS/Self-Assessment Tax) constitute Tax Payable.
2. The “Sum of Tax Payable” is the sum of Tax Payable of all returns within the value range
slab.
3. The “Average Tax Payable” is the average Tax Payable within the value range slab i.e.
“Sum of Tax Payable” divided by total number of returns within the value range slab.
Income Tax Return Statistics Assessment Year 2013-14 Version 1.0
54
5. Income Tax Returns - AOP/BOI
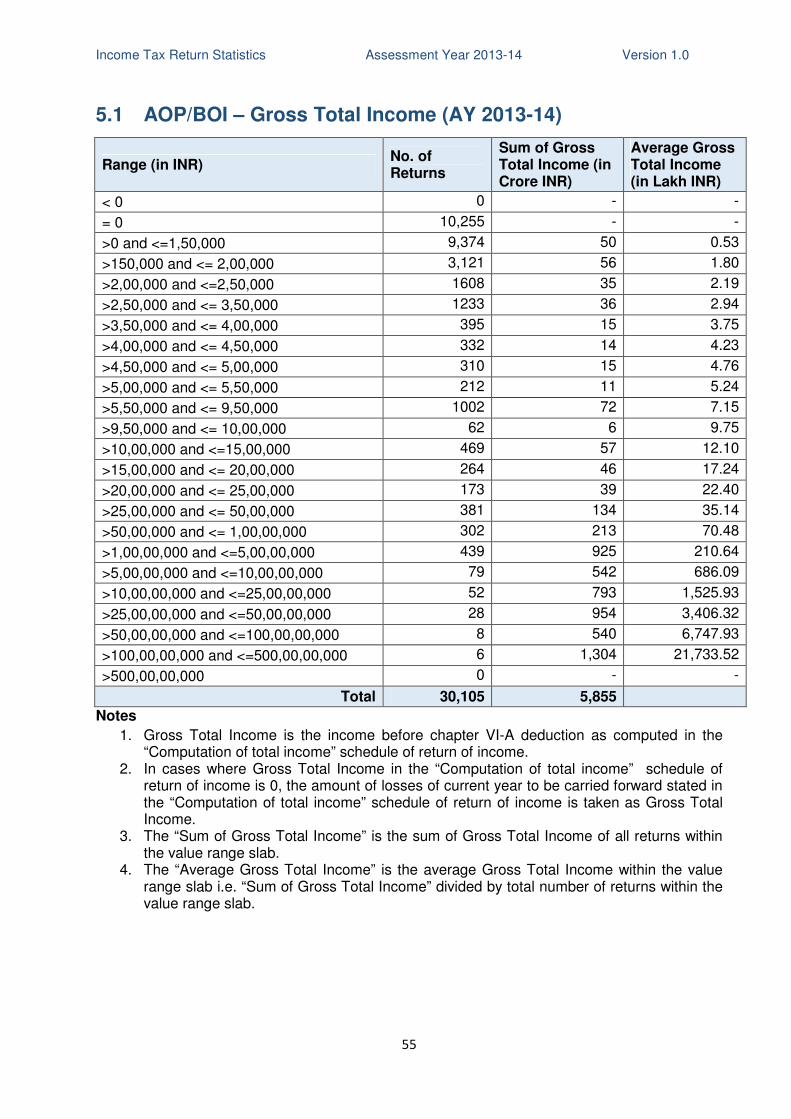
Income Tax Return Statistics Assessment Year 2013-14 Version 1.0
55
5.1 AOP/BOI – Gross Total Income (AY 2013-14)
Range (in INR) No. of Returns
Sum of Gross Total Income (in Crore INR)
Average Gross Total Income (in Lakh INR)
< 0 0 - -
= 0 10,255 - -
>0 and <=1,50,000 9,374 50 0.53
>150,000 and <= 2,00,000 3,121 56 1.80
>2,00,000 and <=2,50,000 1608 35 2.19
>2,50,000 and <= 3,50,000 1233 36 2.94
>3,50,000 and <= 4,00,000 395 15 3.75
>4,00,000 and <= 4,50,000 332 14 4.23
>4,50,000 and <= 5,00,000 310 15 4.76
>5,00,000 and <= 5,50,000 212 11 5.24
>5,50,000 and <= 9,50,000 1002 72 7.15
>9,50,000 and <= 10,00,000 62 6 9.75
>10,00,000 and <=15,00,000 469 57 12.10
>15,00,000 and <= 20,00,000 264 46 17.24
>20,00,000 and <= 25,00,000 173 39 22.40
>25,00,000 and <= 50,00,000 381 134 35.14
>50,00,000 and <= 1,00,00,000 302 213 70.48
>1,00,00,000 and <=5,00,00,000 439 925 210.64
>5,00,00,000 and <=10,00,00,000 79 542 686.09
>10,00,00,000 and <=25,00,00,000 52 793 1,525.93
>25,00,00,000 and <=50,00,00,000 28 954 3,406.32
>50,00,00,000 and <=100,00,00,000 8 540 6,747.93
>100,00,00,000 and <=500,00,00,000 6 1,304 21,733.52
>500,00,00,000 0 - -
Total 30,105 5,855
Notes
1. Gross Total Income is the income before chapter VI-A deduction as computed in the “Computation of total income” schedule of return of income.
2. In cases where Gross Total Income in the “Computation of total income” schedule of return of income is 0, the amount of losses of current year to be carried forward stated in the “Computation of total income” schedule of return of income is taken as Gross Total Income.
3. The “Sum of Gross Total Income” is the sum of Gross Total Income of all returns within the value range slab.
4. The “Average Gross Total Income” is the average Gross Total Income within the value range slab i.e. “Sum of Gross Total Income” divided by total number of returns within the value range slab.
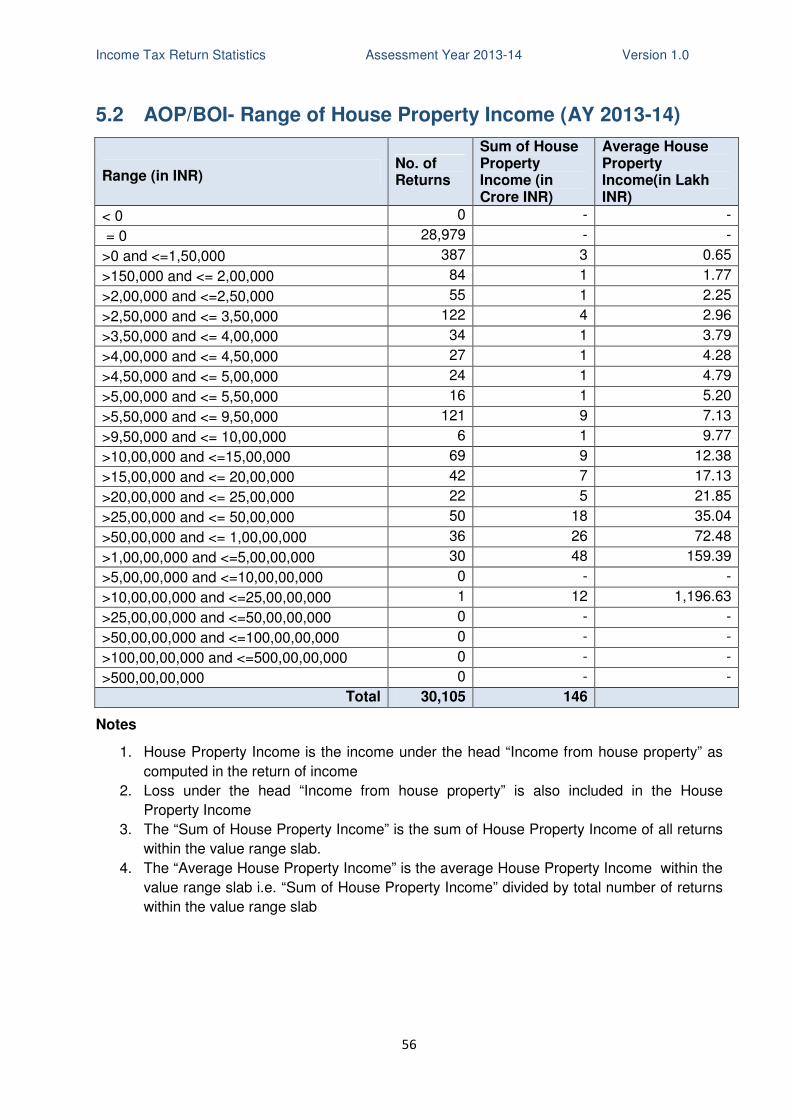
Income Tax Return Statistics Assessment Year 2013-14 Version 1.0
56
5.2 AOP/BOI- Range of House Property Income (AY 2013-14)
Range (in INR) No. of Returns
Sum of House Property Income (in Crore INR)
Average House Property Income(in Lakh INR)
< 0 0 - -
= 0 28,979 - -
>0 and <=1,50,000 387 3 0.65
>150,000 and <= 2,00,000 84 1 1.77
>2,00,000 and <=2,50,000 55 1 2.25
>2,50,000 and <= 3,50,000 122 4 2.96
>3,50,000 and <= 4,00,000 34 1 3.79
>4,00,000 and <= 4,50,000 27 1 4.28
>4,50,000 and <= 5,00,000 24 1 4.79
>5,00,000 and <= 5,50,000 16 1 5.20
>5,50,000 and <= 9,50,000 121 9 7.13
>9,50,000 and <= 10,00,000 6 1 9.77
>10,00,000 and <=15,00,000 69 9 12.38
>15,00,000 and <= 20,00,000 42 7 17.13
>20,00,000 and <= 25,00,000 22 5 21.85
>25,00,000 and <= 50,00,000 50 18 35.04
>50,00,000 and <= 1,00,00,000 36 26 72.48
>1,00,00,000 and <=5,00,00,000 30 48 159.39
>5,00,00,000 and <=10,00,00,000 0 - -
>10,00,00,000 and <=25,00,00,000 1 12 1,196.63
>25,00,00,000 and <=50,00,00,000 0 - -
>50,00,00,000 and <=100,00,00,000 0 - -
>100,00,00,000 and <=500,00,00,000 0 - -
>500,00,00,000 0 - -
Total 30,105 146
Notes
1. House Property Income is the income under the head “Income from house property” as
computed in the return of income
2. Loss under the head “Income from house property” is also included in the House
Property Income
3. The “Sum of House Property Income” is the sum of House Property Income of all returns
within the value range slab.
4. The “Average House Property Income” is the average House Property Income within the
value range slab i.e. “Sum of House Property Income” divided by total number of returns
within the value range slab
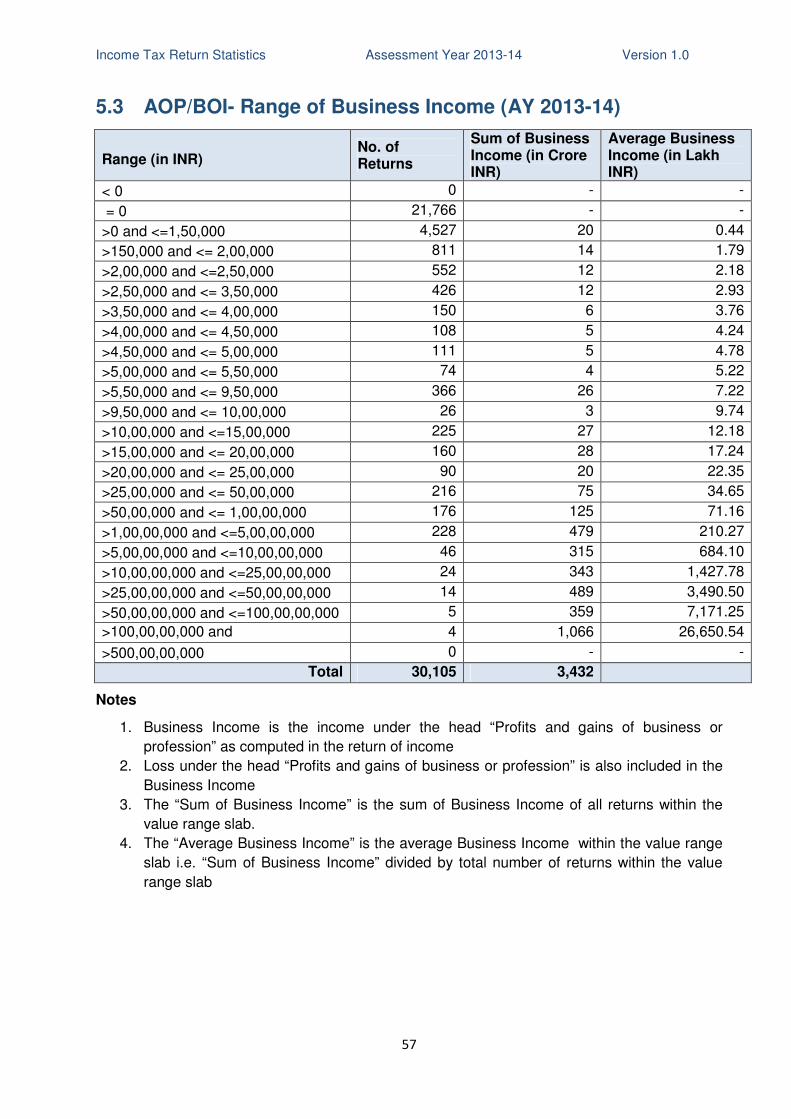
Income Tax Return Statistics Assessment Year 2013-14 Version 1.0
57
5.3 AOP/BOI- Range of Business Income (AY 2013-14)
Range (in INR) No. of Returns
Sum of Business Income (in Crore INR)
Average Business Income (in Lakh INR)
< 0 0 - -
= 0 21,766 - -
>0 and <=1,50,000 4,527 20 0.44
>150,000 and <= 2,00,000 811 14 1.79
>2,00,000 and <=2,50,000 552 12 2.18
>2,50,000 and <= 3,50,000 426 12 2.93
>3,50,000 and <= 4,00,000 150 6 3.76
>4,00,000 and <= 4,50,000 108 5 4.24
>4,50,000 and <= 5,00,000 111 5 4.78
>5,00,000 and <= 5,50,000 74 4 5.22
>5,50,000 and <= 9,50,000 366 26 7.22
>9,50,000 and <= 10,00,000 26 3 9.74
>10,00,000 and <=15,00,000 225 27 12.18
>15,00,000 and <= 20,00,000 160 28 17.24
>20,00,000 and <= 25,00,000 90 20 22.35
>25,00,000 and <= 50,00,000 216 75 34.65
>50,00,000 and <= 1,00,00,000 176 125 71.16
>1,00,00,000 and <=5,00,00,000 228 479 210.27
>5,00,00,000 and <=10,00,00,000 46 315 684.10
>10,00,00,000 and <=25,00,00,000 24 343 1,427.78
>25,00,00,000 and <=50,00,00,000 14 489 3,490.50
>50,00,00,000 and <=100,00,00,000 5 359 7,171.25
>100,00,00,000 and <=500,00,00,000
4 1,066 26,650.54
>500,00,00,000 0 - -
Total 30,105 3,432
Notes
1. Business Income is the income under the head “Profits and gains of business or
profession” as computed in the return of income
2. Loss under the head “Profits and gains of business or profession” is also included in the
Business Income
3. The “Sum of Business Income” is the sum of Business Income of all returns within the
value range slab.
4. The “Average Business Income” is the average Business Income within the value range
slab i.e. “Sum of Business Income” divided by total number of returns within the value
range slab
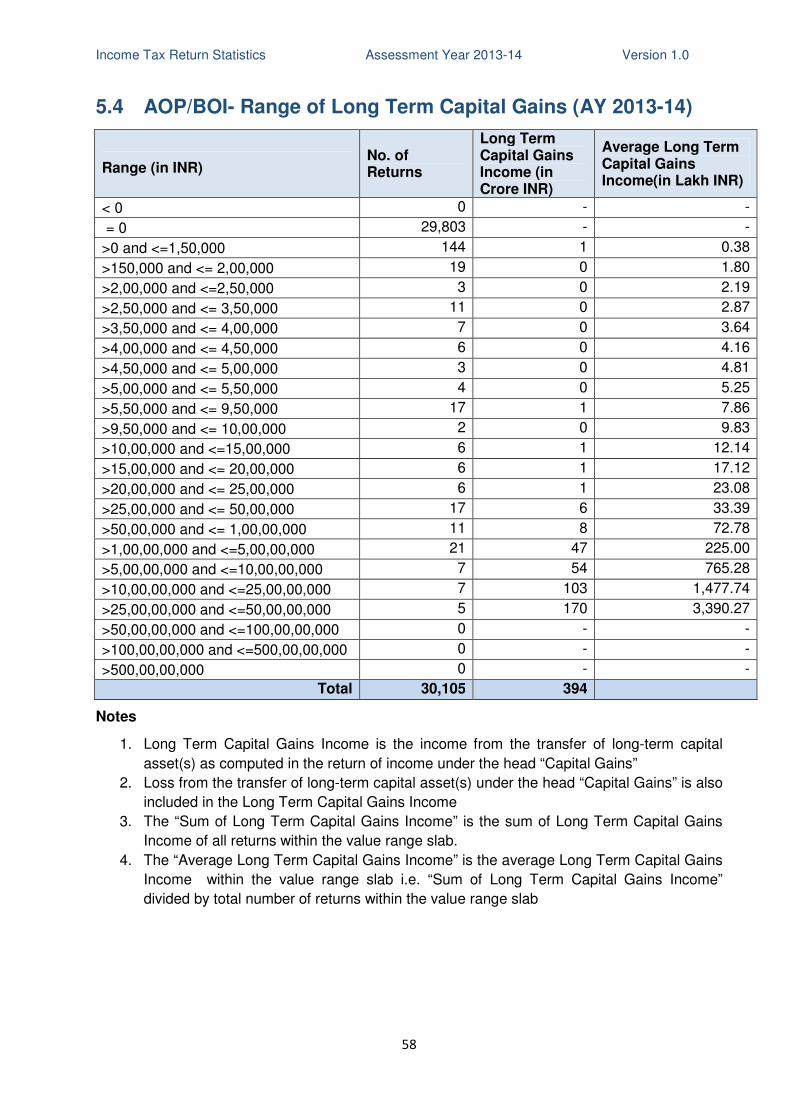
Income Tax Return Statistics Assessment Year 2013-14 Version 1.0
58
5.4 AOP/BOI- Range of Long Term Capital Gains (AY 2013-14)
Range (in INR) No. of Returns
Long Term Capital Gains Income (in Crore INR)
Average Long Term Capital Gains Income(in Lakh INR)
< 0 0 - -
= 0 29,803 - -
>0 and <=1,50,000 144 1 0.38
>150,000 and <= 2,00,000 19 0 1.80
>2,00,000 and <=2,50,000 3 0 2.19
>2,50,000 and <= 3,50,000 11 0 2.87
>3,50,000 and <= 4,00,000 7 0 3.64
>4,00,000 and <= 4,50,000 6 0 4.16
>4,50,000 and <= 5,00,000 3 0 4.81
>5,00,000 and <= 5,50,000 4 0 5.25
>5,50,000 and <= 9,50,000 17 1 7.86
>9,50,000 and <= 10,00,000 2 0 9.83
>10,00,000 and <=15,00,000 6 1 12.14
>15,00,000 and <= 20,00,000 6 1 17.12
>20,00,000 and <= 25,00,000 6 1 23.08
>25,00,000 and <= 50,00,000 17 6 33.39
>50,00,000 and <= 1,00,00,000 11 8 72.78
>1,00,00,000 and <=5,00,00,000 21 47 225.00
>5,00,00,000 and <=10,00,00,000 7 54 765.28
>10,00,00,000 and <=25,00,00,000 7 103 1,477.74
>25,00,00,000 and <=50,00,00,000 5 170 3,390.27
>50,00,00,000 and <=100,00,00,000 0 - -
>100,00,00,000 and <=500,00,00,000 0 - -
>500,00,00,000 0 - -
Total 30,105 394
Notes
1. Long Term Capital Gains Income is the income from the transfer of long-term capital
asset(s) as computed in the return of income under the head “Capital Gains”
2. Loss from the transfer of long-term capital asset(s) under the head “Capital Gains” is also
included in the Long Term Capital Gains Income
3. The “Sum of Long Term Capital Gains Income” is the sum of Long Term Capital Gains
Income of all returns within the value range slab.
4. The “Average Long Term Capital Gains Income” is the average Long Term Capital Gains
Income within the value range slab i.e. “Sum of Long Term Capital Gains Income”
divided by total number of returns within the value range slab
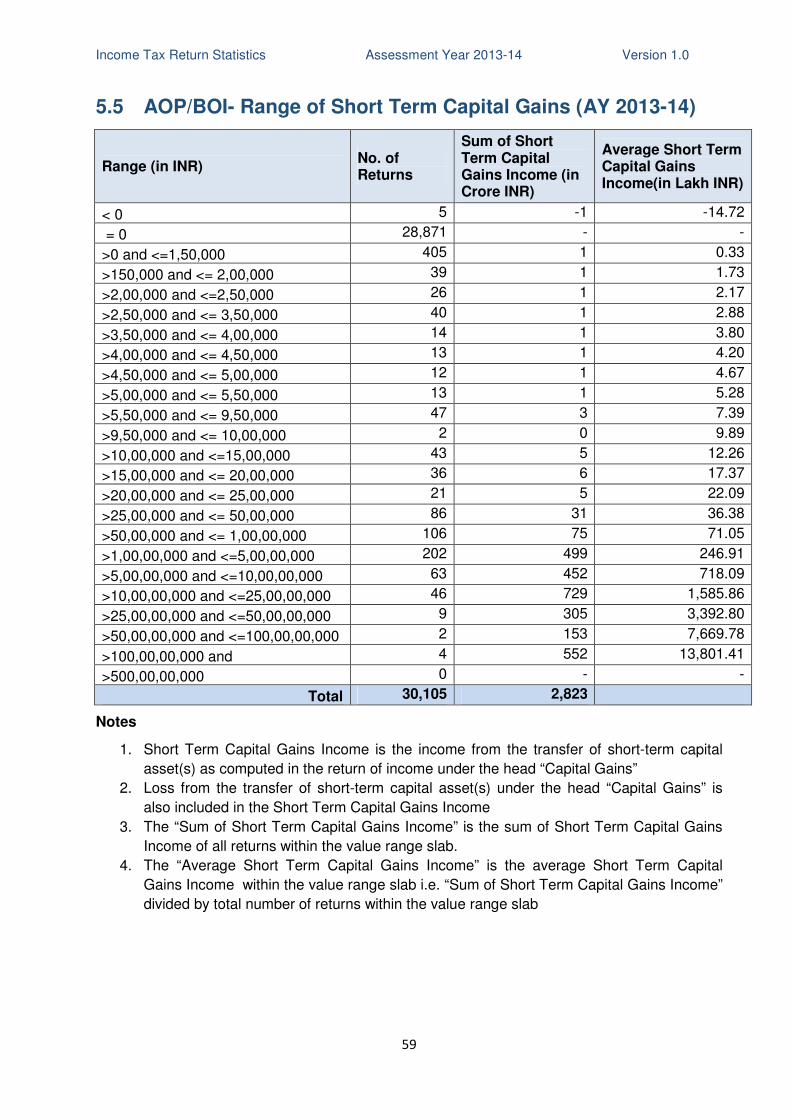
Income Tax Return Statistics Assessment Year 2013-14 Version 1.0
59
5.5 AOP/BOI- Range of Short Term Capital Gains (AY 2013-14)
Range (in INR) No. of Returns
Sum of Short Term Capital Gains Income (in Crore INR)
Average Short Term Capital Gains Income(in Lakh INR)
< 0 5 -1 -14.72
= 0 28,871 - -
>0 and <=1,50,000 405 1 0.33
>150,000 and <= 2,00,000 39 1 1.73
>2,00,000 and <=2,50,000 26 1 2.17
>2,50,000 and <= 3,50,000 40 1 2.88
>3,50,000 and <= 4,00,000 14 1 3.80
>4,00,000 and <= 4,50,000 13 1 4.20
>4,50,000 and <= 5,00,000 12 1 4.67
>5,00,000 and <= 5,50,000 13 1 5.28
>5,50,000 and <= 9,50,000 47 3 7.39
>9,50,000 and <= 10,00,000 2 0 9.89
>10,00,000 and <=15,00,000 43 5 12.26
>15,00,000 and <= 20,00,000 36 6 17.37
>20,00,000 and <= 25,00,000 21 5 22.09
>25,00,000 and <= 50,00,000 86 31 36.38
>50,00,000 and <= 1,00,00,000 106 75 71.05
>1,00,00,000 and <=5,00,00,000 202 499 246.91
>5,00,00,000 and <=10,00,00,000 63 452 718.09
>10,00,00,000 and <=25,00,00,000 46 729 1,585.86
>25,00,00,000 and <=50,00,00,000 9 305 3,392.80
>50,00,00,000 and <=100,00,00,000 2 153 7,669.78
>100,00,00,000 and 4 552 13,801.41
>500,00,00,000 0 - -
Total 30,105 2,823
Notes
1. Short Term Capital Gains Income is the income from the transfer of short-term capital
asset(s) as computed in the return of income under the head “Capital Gains”
2. Loss from the transfer of short-term capital asset(s) under the head “Capital Gains” is
also included in the Short Term Capital Gains Income
3. The “Sum of Short Term Capital Gains Income” is the sum of Short Term Capital Gains
Income of all returns within the value range slab.
4. The “Average Short Term Capital Gains Income” is the average Short Term Capital
Gains Income within the value range slab i.e. “Sum of Short Term Capital Gains Income”
divided by total number of returns within the value range slab
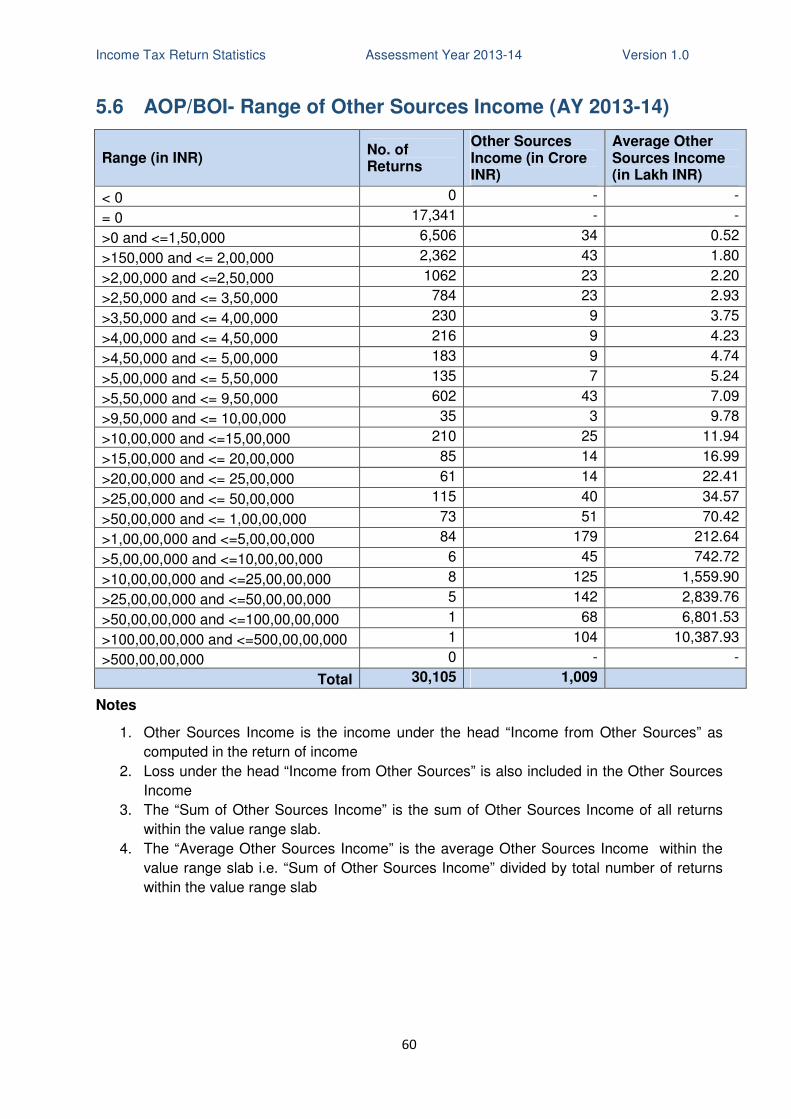
Income Tax Return Statistics Assessment Year 2013-14 Version 1.0
60
5.6 AOP/BOI- Range of Other Sources Income (AY 2013-14)
Range (in INR) No. of Returns
Other Sources Income (in Crore INR)
Average Other Sources Income (in Lakh INR)
< 0 0 - -
= 0 17,341 - -
>0 and <=1,50,000 6,506 34 0.52
>150,000 and <= 2,00,000 2,362 43 1.80
>2,00,000 and <=2,50,000 1062 23 2.20
>2,50,000 and <= 3,50,000 784 23 2.93
>3,50,000 and <= 4,00,000 230 9 3.75
>4,00,000 and <= 4,50,000 216 9 4.23
>4,50,000 and <= 5,00,000 183 9 4.74
>5,00,000 and <= 5,50,000 135 7 5.24
>5,50,000 and <= 9,50,000 602 43 7.09
>9,50,000 and <= 10,00,000 35 3 9.78
>10,00,000 and <=15,00,000 210 25 11.94
>15,00,000 and <= 20,00,000 85 14 16.99
>20,00,000 and <= 25,00,000 61 14 22.41
>25,00,000 and <= 50,00,000 115 40 34.57
>50,00,000 and <= 1,00,00,000 73 51 70.42
>1,00,00,000 and <=5,00,00,000 84 179 212.64
>5,00,00,000 and <=10,00,00,000 6 45 742.72
>10,00,00,000 and <=25,00,00,000 8 125 1,559.90
>25,00,00,000 and <=50,00,00,000 5 142 2,839.76
>50,00,00,000 and <=100,00,00,000 1 68 6,801.53
>100,00,00,000 and <=500,00,00,000 1 104 10,387.93
>500,00,00,000 0 - -
Total 30,105 1,009
Notes
1. Other Sources Income is the income under the head “Income from Other Sources” as
computed in the return of income
2. Loss under the head “Income from Other Sources” is also included in the Other Sources
Income
3. The “Sum of Other Sources Income” is the sum of Other Sources Income of all returns
within the value range slab.
4. The “Average Other Sources Income” is the average Other Sources Income within the
value range slab i.e. “Sum of Other Sources Income” divided by total number of returns
within the value range slab
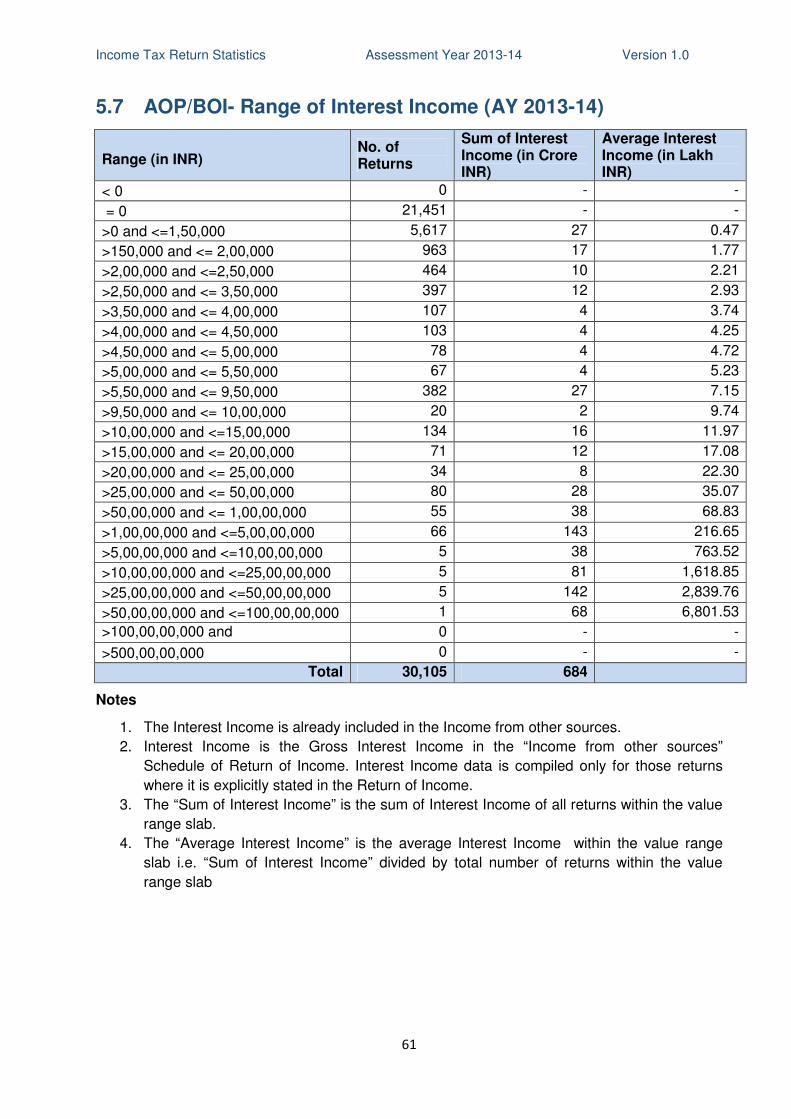
Income Tax Return Statistics Assessment Year 2013-14 Version 1.0
61
5.7 AOP/BOI- Range of Interest Income (AY 2013-14)
Range (in INR) No. of Returns
Sum of Interest Income (in Crore INR)
Average Interest Income (in Lakh INR)
< 0 0 - -
= 0 21,451 - -
>0 and <=1,50,000 5,617 27 0.47
>150,000 and <= 2,00,000 963 17 1.77
>2,00,000 and <=2,50,000 464 10 2.21
>2,50,000 and <= 3,50,000 397 12 2.93
>3,50,000 and <= 4,00,000 107 4 3.74
>4,00,000 and <= 4,50,000 103 4 4.25
>4,50,000 and <= 5,00,000 78 4 4.72
>5,00,000 and <= 5,50,000 67 4 5.23
>5,50,000 and <= 9,50,000 382 27 7.15
>9,50,000 and <= 10,00,000 20 2 9.74
>10,00,000 and <=15,00,000 134 16 11.97
>15,00,000 and <= 20,00,000 71 12 17.08
>20,00,000 and <= 25,00,000 34 8 22.30
>25,00,000 and <= 50,00,000 80 28 35.07
>50,00,000 and <= 1,00,00,000 55 38 68.83
>1,00,00,000 and <=5,00,00,000 66 143 216.65
>5,00,00,000 and <=10,00,00,000 5 38 763.52
>10,00,00,000 and <=25,00,00,000 5 81 1,618.85
>25,00,00,000 and <=50,00,00,000 5 142 2,839.76
>50,00,00,000 and <=100,00,00,000 1 68 6,801.53
>100,00,00,000 and <=500,00,00,000
0 - -
>500,00,00,000 0 - -
Total 30,105 684
Notes
1. The Interest Income is already included in the Income from other sources.
2. Interest Income is the Gross Interest Income in the “Income from other sources”
Schedule of Return of Income. Interest Income data is compiled only for those returns
where it is explicitly stated in the Return of Income.
3. The “Sum of Interest Income” is the sum of Interest Income of all returns within the value
range slab.
4. The “Average Interest Income” is the average Interest Income within the value range
slab i.e. “Sum of Interest Income” divided by total number of returns within the value
range slab
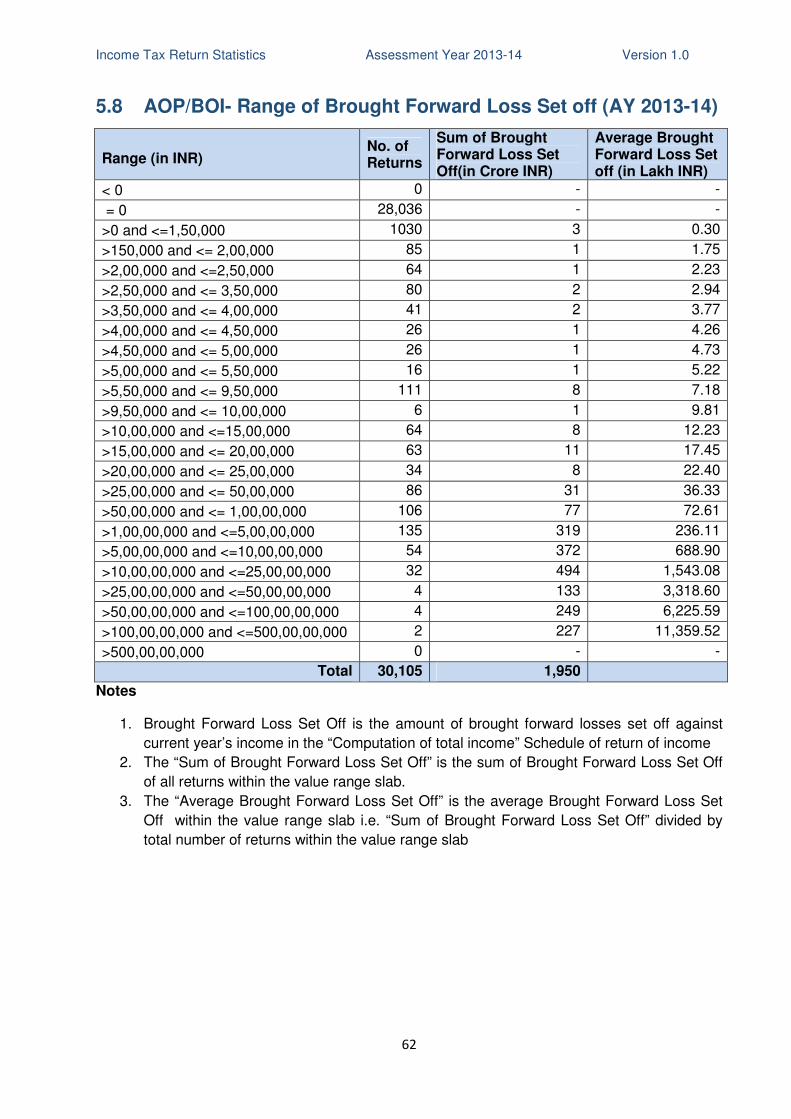
Income Tax Return Statistics Assessment Year 2013-14 Version 1.0
62
5.8 AOP/BOI- Range of Brought Forward Loss Set off (AY 2013-14)
Range (in INR) No. of Returns
Sum of Brought Forward Loss Set Off(in Crore INR)
Average Brought Forward Loss Set off (in Lakh INR)
< 0 0 - -
= 0 28,036 - -
>0 and <=1,50,000 1030 3 0.30
>150,000 and <= 2,00,000 85 1 1.75
>2,00,000 and <=2,50,000 64 1 2.23
>2,50,000 and <= 3,50,000 80 2 2.94
>3,50,000 and <= 4,00,000 41 2 3.77
>4,00,000 and <= 4,50,000 26 1 4.26
>4,50,000 and <= 5,00,000 26 1 4.73
>5,00,000 and <= 5,50,000 16 1 5.22
>5,50,000 and <= 9,50,000 111 8 7.18
>9,50,000 and <= 10,00,000 6 1 9.81
>10,00,000 and <=15,00,000 64 8 12.23
>15,00,000 and <= 20,00,000 63 11 17.45
>20,00,000 and <= 25,00,000 34 8 22.40
>25,00,000 and <= 50,00,000 86 31 36.33
>50,00,000 and <= 1,00,00,000 106 77 72.61
>1,00,00,000 and <=5,00,00,000 135 319 236.11
>5,00,00,000 and <=10,00,00,000 54 372 688.90
>10,00,00,000 and <=25,00,00,000 32 494 1,543.08
>25,00,00,000 and <=50,00,00,000 4 133 3,318.60
>50,00,00,000 and <=100,00,00,000 4 249 6,225.59
>100,00,00,000 and <=500,00,00,000 2 227 11,359.52
>500,00,00,000 0 - -
Total 30,105 1,950
Notes
1. Brought Forward Loss Set Off is the amount of brought forward losses set off against
current year’s income in the “Computation of total income” Schedule of return of income
2. The “Sum of Brought Forward Loss Set Off” is the sum of Brought Forward Loss Set Off
of all returns within the value range slab.
3. The “Average Brought Forward Loss Set Off” is the average Brought Forward Loss Set
Off within the value range slab i.e. “Sum of Brought Forward Loss Set Off” divided by
total number of returns within the value range slab
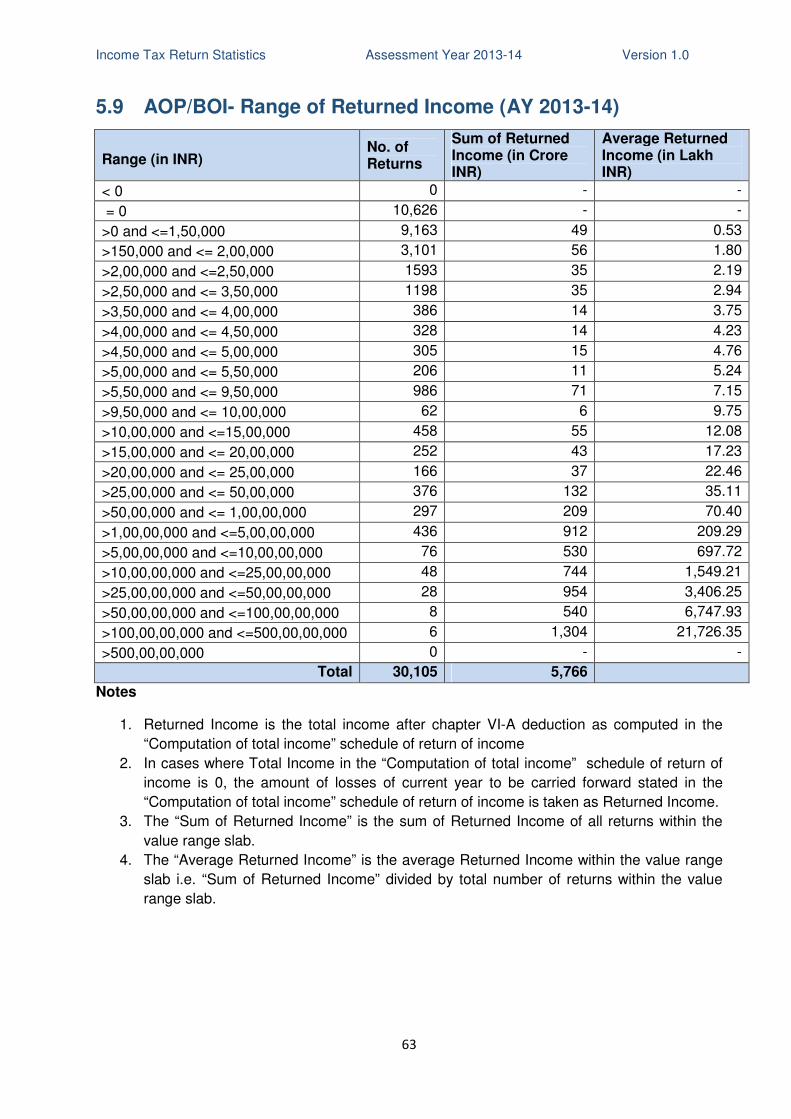
Income Tax Return Statistics Assessment Year 2013-14 Version 1.0
63
5.9 AOP/BOI- Range of Returned Income (AY 2013-14)
Range (in INR) No. of Returns
Sum of Returned Income (in Crore INR)
Average Returned Income (in Lakh INR)
< 0 0 - -
= 0 10,626 - -
>0 and <=1,50,000 9,163 49 0.53
>150,000 and <= 2,00,000 3,101 56 1.80
>2,00,000 and <=2,50,000 1593 35 2.19
>2,50,000 and <= 3,50,000 1198 35 2.94
>3,50,000 and <= 4,00,000 386 14 3.75
>4,00,000 and <= 4,50,000 328 14 4.23
>4,50,000 and <= 5,00,000 305 15 4.76
>5,00,000 and <= 5,50,000 206 11 5.24
>5,50,000 and <= 9,50,000 986 71 7.15
>9,50,000 and <= 10,00,000 62 6 9.75
>10,00,000 and <=15,00,000 458 55 12.08
>15,00,000 and <= 20,00,000 252 43 17.23
>20,00,000 and <= 25,00,000 166 37 22.46
>25,00,000 and <= 50,00,000 376 132 35.11
>50,00,000 and <= 1,00,00,000 297 209 70.40
>1,00,00,000 and <=5,00,00,000 436 912 209.29
>5,00,00,000 and <=10,00,00,000 76 530 697.72
>10,00,00,000 and <=25,00,00,000 48 744 1,549.21
>25,00,00,000 and <=50,00,00,000 28 954 3,406.25
>50,00,00,000 and <=100,00,00,000 8 540 6,747.93
>100,00,00,000 and <=500,00,00,000 6 1,304 21,726.35
>500,00,00,000 0 - -
Total 30,105 5,766
Notes
1. Returned Income is the total income after chapter VI-A deduction as computed in the
“Computation of total income” schedule of return of income
2. In cases where Total Income in the “Computation of total income” schedule of return of
income is 0, the amount of losses of current year to be carried forward stated in the
“Computation of total income” schedule of return of income is taken as Returned Income.
3. The “Sum of Returned Income” is the sum of Returned Income of all returns within the
value range slab.
4. The “Average Returned Income” is the average Returned Income within the value range
slab i.e. “Sum of Returned Income” divided by total number of returns within the value
range slab.
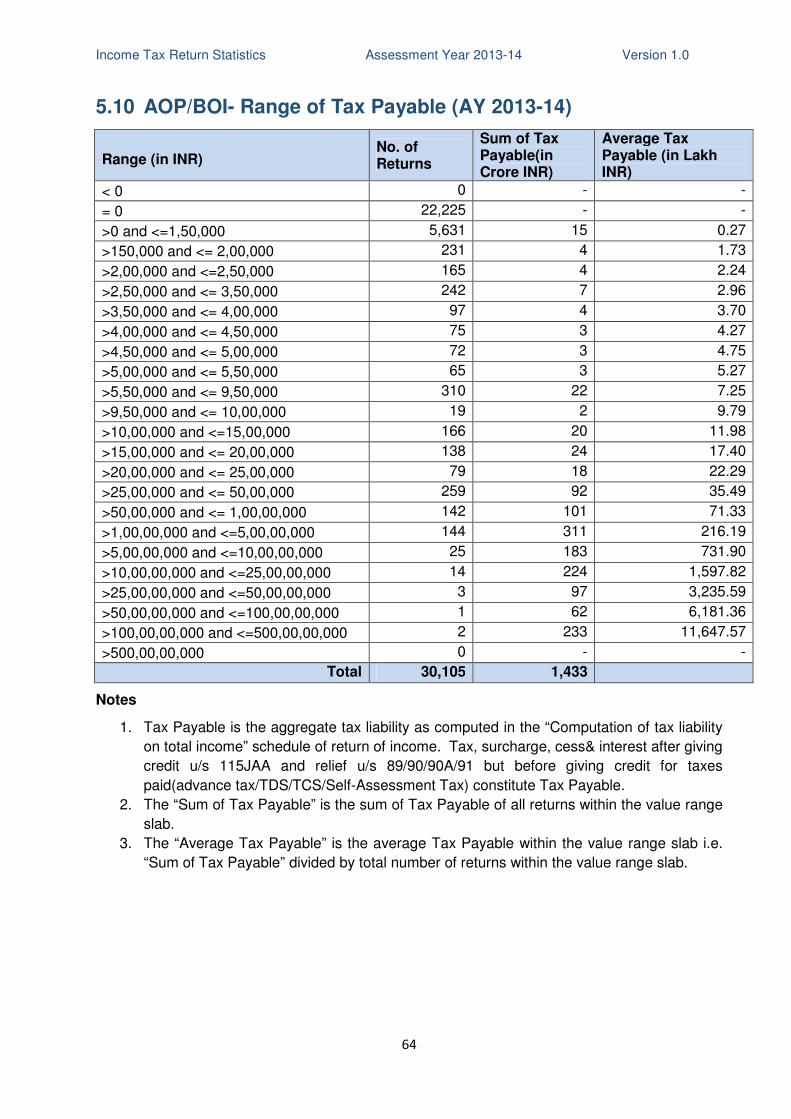
Income Tax Return Statistics Assessment Year 2013-14 Version 1.0
64
5.10 AOP/BOI- Range of Tax Payable (AY 2013-14)
Range (in INR) No. of Returns
Sum of Tax Payable(in Crore INR)
Average Tax Payable (in Lakh INR)
< 0 0 - -
= 0 22,225 - -
>0 and <=1,50,000 5,631 15 0.27
>150,000 and <= 2,00,000 231 4 1.73
>2,00,000 and <=2,50,000 165 4 2.24
>2,50,000 and <= 3,50,000 242 7 2.96
>3,50,000 and <= 4,00,000 97 4 3.70
>4,00,000 and <= 4,50,000 75 3 4.27
>4,50,000 and <= 5,00,000 72 3 4.75
>5,00,000 and <= 5,50,000 65 3 5.27
>5,50,000 and <= 9,50,000 310 22 7.25
>9,50,000 and <= 10,00,000 19 2 9.79
>10,00,000 and <=15,00,000 166 20 11.98
>15,00,000 and <= 20,00,000 138 24 17.40
>20,00,000 and <= 25,00,000 79 18 22.29
>25,00,000 and <= 50,00,000 259 92 35.49
>50,00,000 and <= 1,00,00,000 142 101 71.33
>1,00,00,000 and <=5,00,00,000 144 311 216.19
>5,00,00,000 and <=10,00,00,000 25 183 731.90
>10,00,00,000 and <=25,00,00,000 14 224 1,597.82
>25,00,00,000 and <=50,00,00,000 3 97 3,235.59
>50,00,00,000 and <=100,00,00,000 1 62 6,181.36
>100,00,00,000 and <=500,00,00,000 2 233 11,647.57
>500,00,00,000 0 - -
Total 30,105 1,433
Notes
1. Tax Payable is the aggregate tax liability as computed in the “Computation of tax liability
on total income” schedule of return of income. Tax, surcharge, cess& interest after giving
credit u/s 115JAA and relief u/s 89/90/90A/91 but before giving credit for taxes
paid(advance tax/TDS/TCS/Self-Assessment Tax) constitute Tax Payable.
2. The “Sum of Tax Payable” is the sum of Tax Payable of all returns within the value range
slab.
3. The “Average Tax Payable” is the average Tax Payable within the value range slab i.e.
“Sum of Tax Payable” divided by total number of returns within the value range slab.
Income Tax Return Statistics Assessment Year 2013-14 Version 1.0
65
6. Income Tax Returns - Company
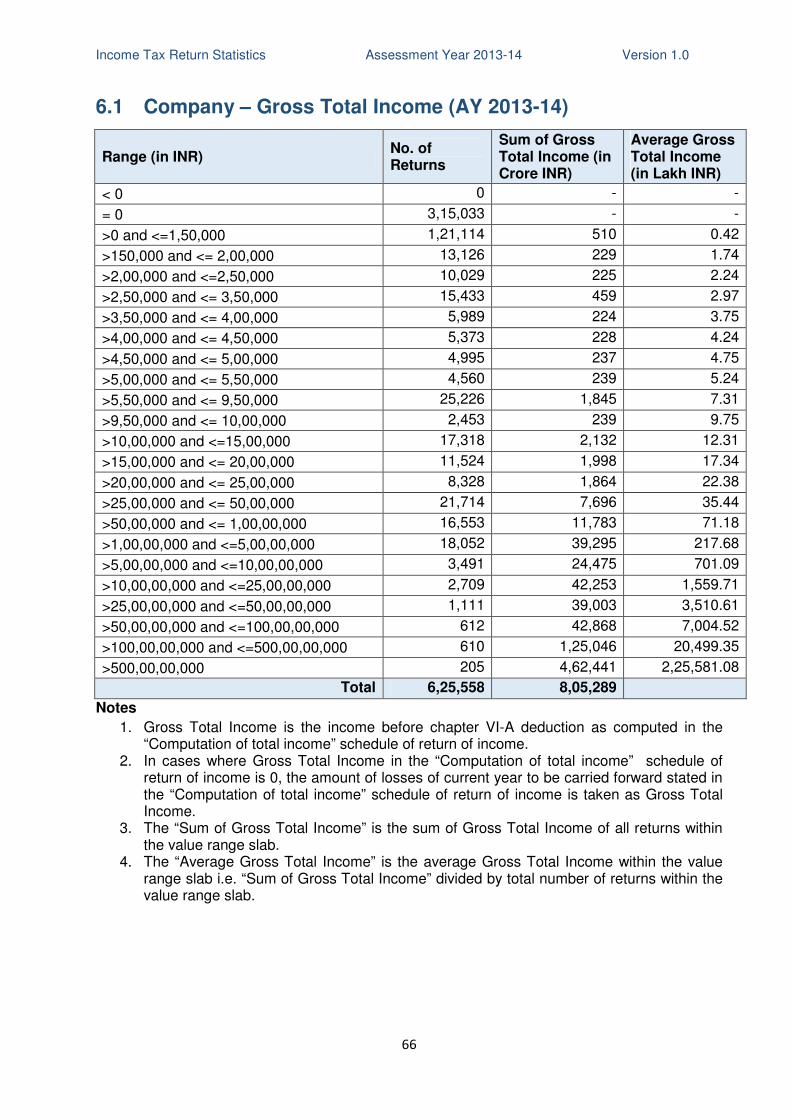
Income Tax Return Statistics Assessment Year 2013-14 Version 1.0
66
6.1 Company – Gross Total Income (AY 2013-14)
Range (in INR) No. of Returns
Sum of Gross Total Income (in Crore INR)
Average Gross Total Income (in Lakh INR)
< 0 0 - -
= 0 3,15,033 - -
>0 and <=1,50,000 1,21,114 510 0.42
>150,000 and <= 2,00,000 13,126 229 1.74
>2,00,000 and <=2,50,000 10,029 225 2.24
>2,50,000 and <= 3,50,000 15,433 459 2.97
>3,50,000 and <= 4,00,000 5,989 224 3.75
>4,00,000 and <= 4,50,000 5,373 228 4.24
>4,50,000 and <= 5,00,000 4,995 237 4.75
>5,00,000 and <= 5,50,000 4,560 239 5.24
>5,50,000 and <= 9,50,000 25,226 1,845 7.31
>9,50,000 and <= 10,00,000 2,453 239 9.75
>10,00,000 and <=15,00,000 17,318 2,132 12.31
>15,00,000 and <= 20,00,000 11,524 1,998 17.34
>20,00,000 and <= 25,00,000 8,328 1,864 22.38
>25,00,000 and <= 50,00,000 21,714 7,696 35.44
>50,00,000 and <= 1,00,00,000 16,553 11,783 71.18
>1,00,00,000 and <=5,00,00,000 18,052 39,295 217.68
>5,00,00,000 and <=10,00,00,000 3,491 24,475 701.09
>10,00,00,000 and <=25,00,00,000 2,709 42,253 1,559.71
>25,00,00,000 and <=50,00,00,000 1,111 39,003 3,510.61
>50,00,00,000 and <=100,00,00,000 612 42,868 7,004.52
>100,00,00,000 and <=500,00,00,000 610 1,25,046 20,499.35
>500,00,00,000 205 4,62,441 2,25,581.08
Total 6,25,558 8,05,289
Notes
1. Gross Total Income is the income before chapter VI-A deduction as computed in the “Computation of total income” schedule of return of income.
2. In cases where Gross Total Income in the “Computation of total income” schedule of return of income is 0, the amount of losses of current year to be carried forward stated in the “Computation of total income” schedule of return of income is taken as Gross Total Income.
3. The “Sum of Gross Total Income” is the sum of Gross Total Income of all returns within the value range slab.
4. The “Average Gross Total Income” is the average Gross Total Income within the value range slab i.e. “Sum of Gross Total Income” divided by total number of returns within the value range slab.
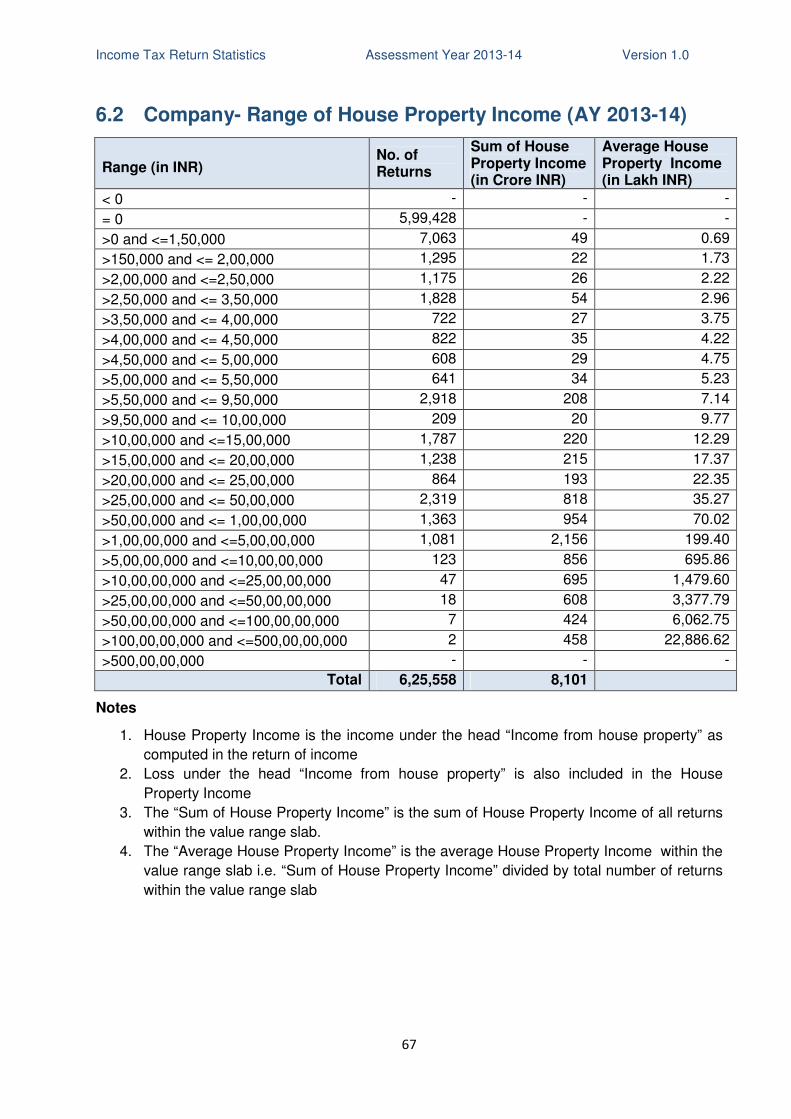
Income Tax Return Statistics Assessment Year 2013-14 Version 1.0
67
6.2 Company- Range of House Property Income (AY 2013-14)
Range (in INR) No. of Returns
Sum of House Property Income (in Crore INR)
Average House Property Income (in Lakh INR)
< 0 - - -
= 0 5,99,428 - -
>0 and <=1,50,000 7,063 49 0.69
>150,000 and <= 2,00,000 1,295 22 1.73
>2,00,000 and <=2,50,000 1,175 26 2.22
>2,50,000 and <= 3,50,000 1,828 54 2.96
>3,50,000 and <= 4,00,000 722 27 3.75
>4,00,000 and <= 4,50,000 822 35 4.22
>4,50,000 and <= 5,00,000 608 29 4.75
>5,00,000 and <= 5,50,000 641 34 5.23
>5,50,000 and <= 9,50,000 2,918 208 7.14
>9,50,000 and <= 10,00,000 209 20 9.77
>10,00,000 and <=15,00,000 1,787 220 12.29
>15,00,000 and <= 20,00,000 1,238 215 17.37
>20,00,000 and <= 25,00,000 864 193 22.35
>25,00,000 and <= 50,00,000 2,319 818 35.27
>50,00,000 and <= 1,00,00,000 1,363 954 70.02
>1,00,00,000 and <=5,00,00,000 1,081 2,156 199.40
>5,00,00,000 and <=10,00,00,000 123 856 695.86
>10,00,00,000 and <=25,00,00,000 47 695 1,479.60
>25,00,00,000 and <=50,00,00,000 18 608 3,377.79
>50,00,00,000 and <=100,00,00,000 7 424 6,062.75
>100,00,00,000 and <=500,00,00,000 2 458 22,886.62
>500,00,00,000 - - -
Total 6,25,558 8,101
Notes
1. House Property Income is the income under the head “Income from house property” as
computed in the return of income
2. Loss under the head “Income from house property” is also included in the House
Property Income
3. The “Sum of House Property Income” is the sum of House Property Income of all returns
within the value range slab.
4. The “Average House Property Income” is the average House Property Income within the
value range slab i.e. “Sum of House Property Income” divided by total number of returns
within the value range slab
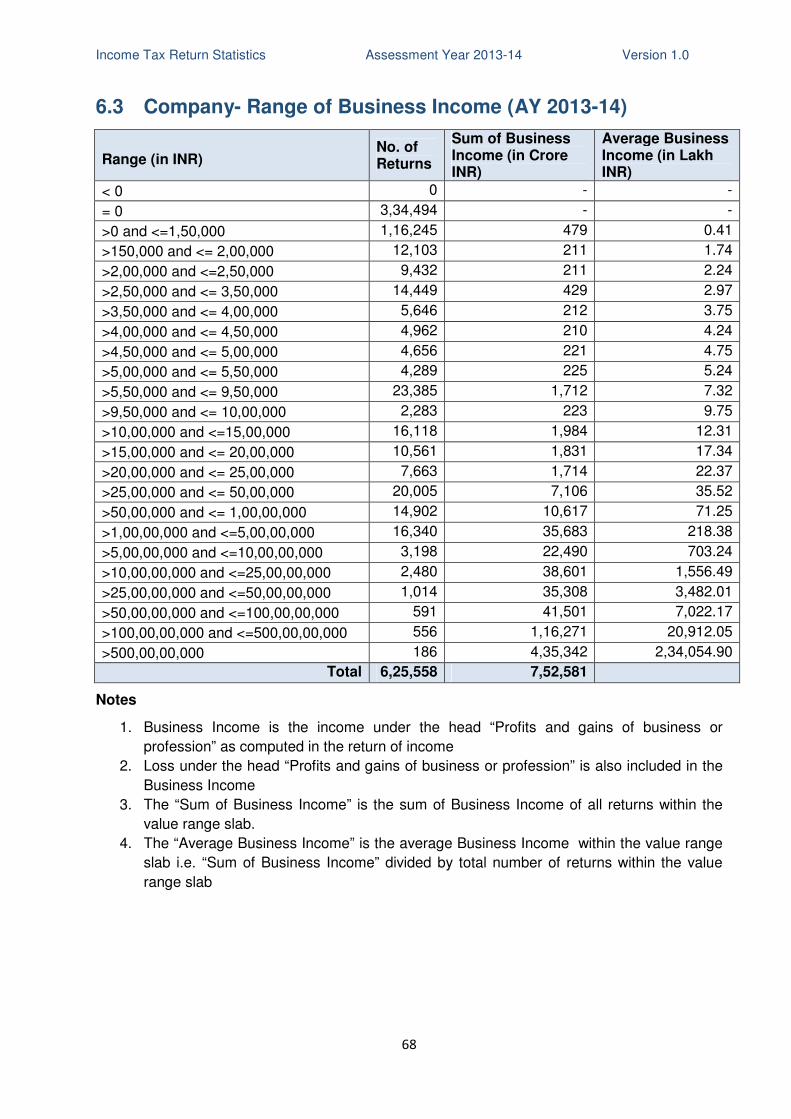
Income Tax Return Statistics Assessment Year 2013-14 Version 1.0
68
6.3 Company- Range of Business Income (AY 2013-14)
Range (in INR) No. of Returns
Sum of Business Income (in Crore INR)
Average Business Income (in Lakh INR)
< 0 0 - -
= 0 3,34,494 - -
>0 and <=1,50,000 1,16,245 479 0.41
>150,000 and <= 2,00,000 12,103 211 1.74
>2,00,000 and <=2,50,000 9,432 211 2.24
>2,50,000 and <= 3,50,000 14,449 429 2.97
>3,50,000 and <= 4,00,000 5,646 212 3.75
>4,00,000 and <= 4,50,000 4,962 210 4.24
>4,50,000 and <= 5,00,000 4,656 221 4.75
>5,00,000 and <= 5,50,000 4,289 225 5.24
>5,50,000 and <= 9,50,000 23,385 1,712 7.32
>9,50,000 and <= 10,00,000 2,283 223 9.75
>10,00,000 and <=15,00,000 16,118 1,984 12.31
>15,00,000 and <= 20,00,000 10,561 1,831 17.34
>20,00,000 and <= 25,00,000 7,663 1,714 22.37
>25,00,000 and <= 50,00,000 20,005 7,106 35.52
>50,00,000 and <= 1,00,00,000 14,902 10,617 71.25
>1,00,00,000 and <=5,00,00,000 16,340 35,683 218.38
>5,00,00,000 and <=10,00,00,000 3,198 22,490 703.24
>10,00,00,000 and <=25,00,00,000 2,480 38,601 1,556.49
>25,00,00,000 and <=50,00,00,000 1,014 35,308 3,482.01
>50,00,00,000 and <=100,00,00,000 591 41,501 7,022.17
>100,00,00,000 and <=500,00,00,000 556 1,16,271 20,912.05
>500,00,00,000 186 4,35,342 2,34,054.90
Total 6,25,558 7,52,581
Notes
1. Business Income is the income under the head “Profits and gains of business or
profession” as computed in the return of income
2. Loss under the head “Profits and gains of business or profession” is also included in the
Business Income
3. The “Sum of Business Income” is the sum of Business Income of all returns within the
value range slab.
4. The “Average Business Income” is the average Business Income within the value range
slab i.e. “Sum of Business Income” divided by total number of returns within the value
range slab
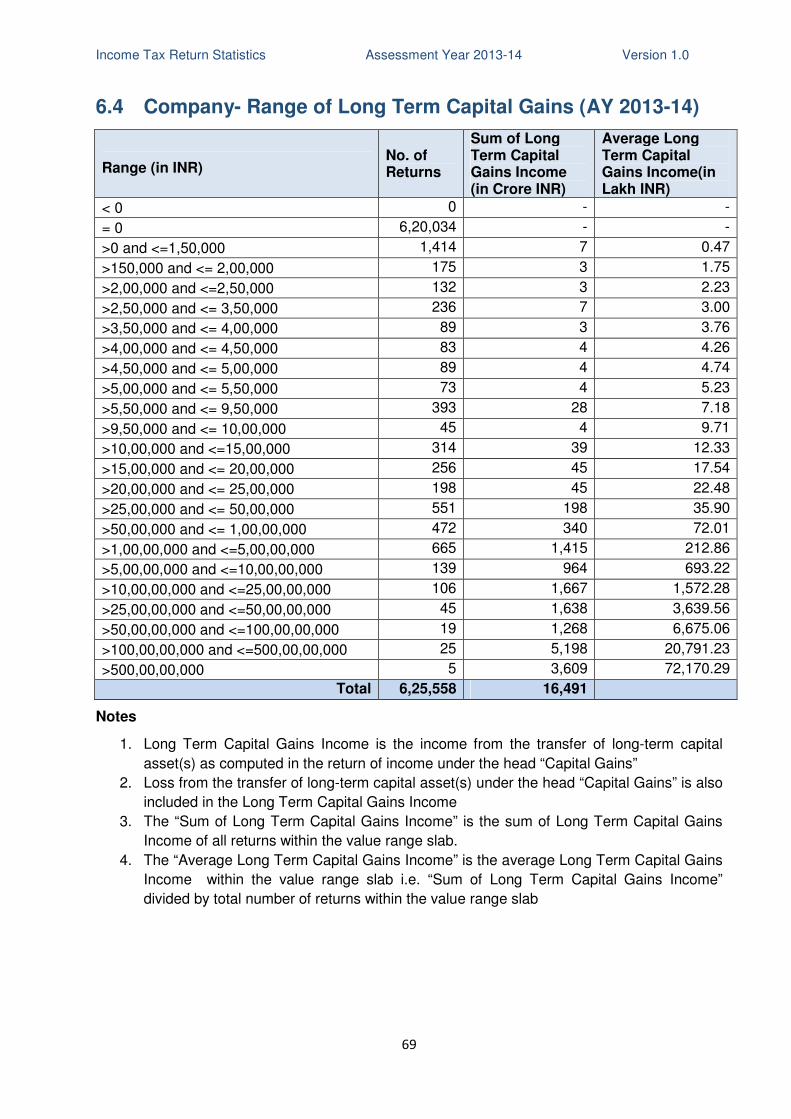
Income Tax Return Statistics Assessment Year 2013-14 Version 1.0
69
6.4 Company- Range of Long Term Capital Gains (AY 2013-14)
Range (in INR) No. of Returns
Sum of Long Term Capital Gains Income (in Crore INR)
Average Long Term Capital Gains Income(in Lakh INR)
< 0 0 - -
= 0 6,20,034 - -
>0 and <=1,50,000 1,414 7 0.47
>150,000 and <= 2,00,000 175 3 1.75
>2,00,000 and <=2,50,000 132 3 2.23
>2,50,000 and <= 3,50,000 236 7 3.00
>3,50,000 and <= 4,00,000 89 3 3.76
>4,00,000 and <= 4,50,000 83 4 4.26
>4,50,000 and <= 5,00,000 89 4 4.74
>5,00,000 and <= 5,50,000 73 4 5.23
>5,50,000 and <= 9,50,000 393 28 7.18
>9,50,000 and <= 10,00,000 45 4 9.71
>10,00,000 and <=15,00,000 314 39 12.33
>15,00,000 and <= 20,00,000 256 45 17.54
>20,00,000 and <= 25,00,000 198 45 22.48
>25,00,000 and <= 50,00,000 551 198 35.90
>50,00,000 and <= 1,00,00,000 472 340 72.01
>1,00,00,000 and <=5,00,00,000 665 1,415 212.86
>5,00,00,000 and <=10,00,00,000 139 964 693.22
>10,00,00,000 and <=25,00,00,000 106 1,667 1,572.28
>25,00,00,000 and <=50,00,00,000 45 1,638 3,639.56
>50,00,00,000 and <=100,00,00,000 19 1,268 6,675.06
>100,00,00,000 and <=500,00,00,000 25 5,198 20,791.23
>500,00,00,000 5 3,609 72,170.29
Total 6,25,558 16,491
Notes
1. Long Term Capital Gains Income is the income from the transfer of long-term capital
asset(s) as computed in the return of income under the head “Capital Gains”
2. Loss from the transfer of long-term capital asset(s) under the head “Capital Gains” is also
included in the Long Term Capital Gains Income
3. The “Sum of Long Term Capital Gains Income” is the sum of Long Term Capital Gains
Income of all returns within the value range slab.
4. The “Average Long Term Capital Gains Income” is the average Long Term Capital Gains
Income within the value range slab i.e. “Sum of Long Term Capital Gains Income”
divided by total number of returns within the value range slab
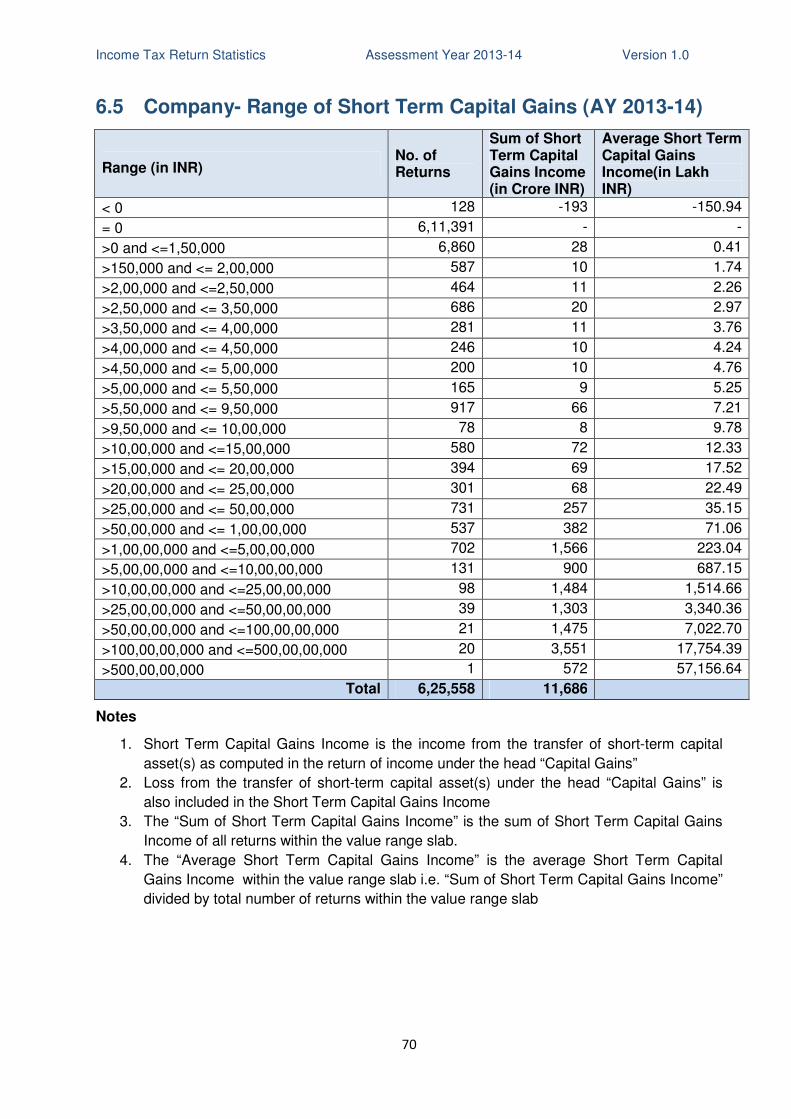
Income Tax Return Statistics Assessment Year 2013-14 Version 1.0
70
6.5 Company- Range of Short Term Capital Gains (AY 2013-14)
Range (in INR) No. of Returns
Sum of Short Term Capital Gains Income (in Crore INR)
Average Short Term Capital Gains Income(in Lakh INR)
< 0 128 -193 -150.94
= 0 6,11,391 - -
>0 and <=1,50,000 6,860 28 0.41
>150,000 and <= 2,00,000 587 10 1.74
>2,00,000 and <=2,50,000 464 11 2.26
>2,50,000 and <= 3,50,000 686 20 2.97
>3,50,000 and <= 4,00,000 281 11 3.76
>4,00,000 and <= 4,50,000 246 10 4.24
>4,50,000 and <= 5,00,000 200 10 4.76
>5,00,000 and <= 5,50,000 165 9 5.25
>5,50,000 and <= 9,50,000 917 66 7.21
>9,50,000 and <= 10,00,000 78 8 9.78
>10,00,000 and <=15,00,000 580 72 12.33
>15,00,000 and <= 20,00,000 394 69 17.52
>20,00,000 and <= 25,00,000 301 68 22.49
>25,00,000 and <= 50,00,000 731 257 35.15
>50,00,000 and <= 1,00,00,000 537 382 71.06
>1,00,00,000 and <=5,00,00,000 702 1,566 223.04
>5,00,00,000 and <=10,00,00,000 131 900 687.15
>10,00,00,000 and <=25,00,00,000 98 1,484 1,514.66
>25,00,00,000 and <=50,00,00,000 39 1,303 3,340.36
>50,00,00,000 and <=100,00,00,000 21 1,475 7,022.70
>100,00,00,000 and <=500,00,00,000 20 3,551 17,754.39
>500,00,00,000 1 572 57,156.64
Total 6,25,558 11,686
Notes
1. Short Term Capital Gains Income is the income from the transfer of short-term capital
asset(s) as computed in the return of income under the head “Capital Gains”
2. Loss from the transfer of short-term capital asset(s) under the head “Capital Gains” is
also included in the Short Term Capital Gains Income
3. The “Sum of Short Term Capital Gains Income” is the sum of Short Term Capital Gains
Income of all returns within the value range slab.
4. The “Average Short Term Capital Gains Income” is the average Short Term Capital
Gains Income within the value range slab i.e. “Sum of Short Term Capital Gains Income”
divided by total number of returns within the value range slab
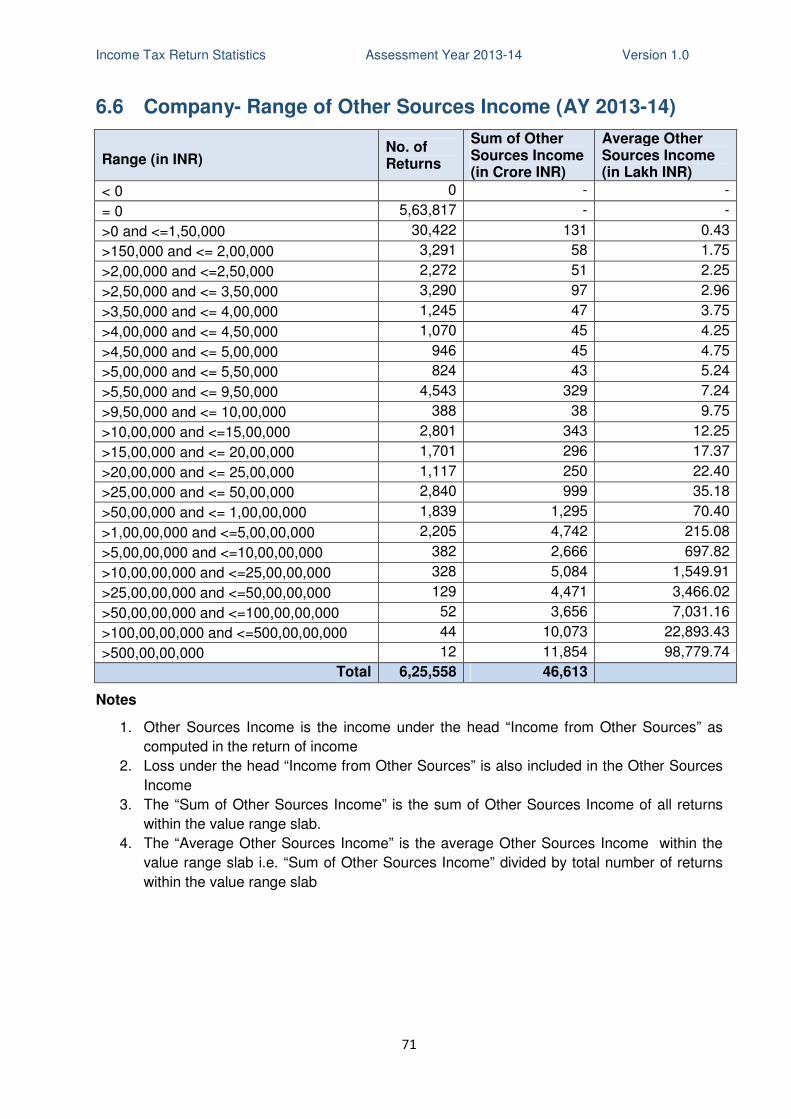
Income Tax Return Statistics Assessment Year 2013-14 Version 1.0
71
6.6 Company- Range of Other Sources Income (AY 2013-14)
Range (in INR) No. of Returns
Sum of Other Sources Income (in Crore INR)
Average Other Sources Income (in Lakh INR)
< 0 0 - -
= 0 5,63,817 - -
>0 and <=1,50,000 30,422 131 0.43
>150,000 and <= 2,00,000 3,291 58 1.75
>2,00,000 and <=2,50,000 2,272 51 2.25
>2,50,000 and <= 3,50,000 3,290 97 2.96
>3,50,000 and <= 4,00,000 1,245 47 3.75
>4,00,000 and <= 4,50,000 1,070 45 4.25
>4,50,000 and <= 5,00,000 946 45 4.75
>5,00,000 and <= 5,50,000 824 43 5.24
>5,50,000 and <= 9,50,000 4,543 329 7.24
>9,50,000 and <= 10,00,000 388 38 9.75
>10,00,000 and <=15,00,000 2,801 343 12.25
>15,00,000 and <= 20,00,000 1,701 296 17.37
>20,00,000 and <= 25,00,000 1,117 250 22.40
>25,00,000 and <= 50,00,000 2,840 999 35.18
>50,00,000 and <= 1,00,00,000 1,839 1,295 70.40
>1,00,00,000 and <=5,00,00,000 2,205 4,742 215.08
>5,00,00,000 and <=10,00,00,000 382 2,666 697.82
>10,00,00,000 and <=25,00,00,000 328 5,084 1,549.91
>25,00,00,000 and <=50,00,00,000 129 4,471 3,466.02
>50,00,00,000 and <=100,00,00,000 52 3,656 7,031.16
>100,00,00,000 and <=500,00,00,000 44 10,073 22,893.43
>500,00,00,000 12 11,854 98,779.74
Total 6,25,558 46,613
Notes
1. Other Sources Income is the income under the head “Income from Other Sources” as
computed in the return of income
2. Loss under the head “Income from Other Sources” is also included in the Other Sources
Income
3. The “Sum of Other Sources Income” is the sum of Other Sources Income of all returns
within the value range slab.
4. The “Average Other Sources Income” is the average Other Sources Income within the
value range slab i.e. “Sum of Other Sources Income” divided by total number of returns
within the value range slab
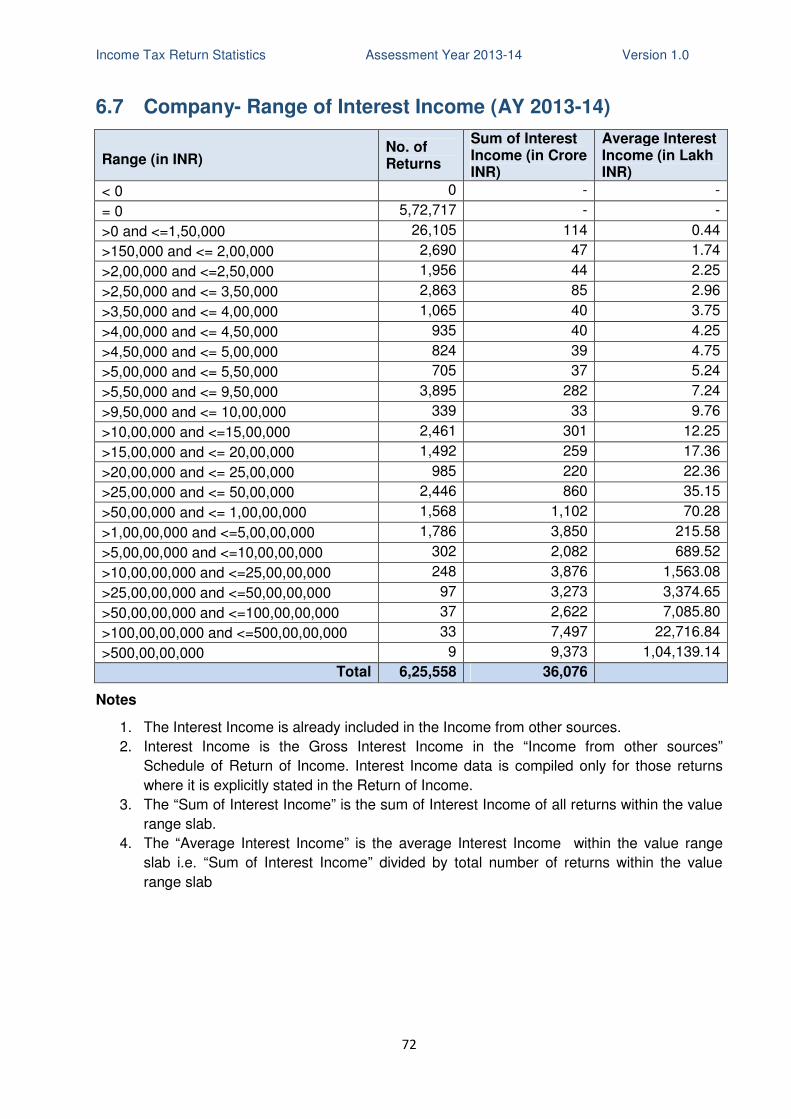
Income Tax Return Statistics Assessment Year 2013-14 Version 1.0
72
6.7 Company- Range of Interest Income (AY 2013-14)
Range (in INR) No. of Returns
Sum of Interest Income (in Crore INR)
Average Interest Income (in Lakh INR)
< 0 0 - -
= 0 5,72,717 - -
>0 and <=1,50,000 26,105 114 0.44
>150,000 and <= 2,00,000 2,690 47 1.74
>2,00,000 and <=2,50,000 1,956 44 2.25
>2,50,000 and <= 3,50,000 2,863 85 2.96
>3,50,000 and <= 4,00,000 1,065 40 3.75
>4,00,000 and <= 4,50,000 935 40 4.25
>4,50,000 and <= 5,00,000 824 39 4.75
>5,00,000 and <= 5,50,000 705 37 5.24
>5,50,000 and <= 9,50,000 3,895 282 7.24
>9,50,000 and <= 10,00,000 339 33 9.76
>10,00,000 and <=15,00,000 2,461 301 12.25
>15,00,000 and <= 20,00,000 1,492 259 17.36
>20,00,000 and <= 25,00,000 985 220 22.36
>25,00,000 and <= 50,00,000 2,446 860 35.15
>50,00,000 and <= 1,00,00,000 1,568 1,102 70.28
>1,00,00,000 and <=5,00,00,000 1,786 3,850 215.58
>5,00,00,000 and <=10,00,00,000 302 2,082 689.52
>10,00,00,000 and <=25,00,00,000 248 3,876 1,563.08
>25,00,00,000 and <=50,00,00,000 97 3,273 3,374.65
>50,00,00,000 and <=100,00,00,000 37 2,622 7,085.80
>100,00,00,000 and <=500,00,00,000 33 7,497 22,716.84
>500,00,00,000 9 9,373 1,04,139.14
Total 6,25,558 36,076
Notes
1. The Interest Income is already included in the Income from other sources.
2. Interest Income is the Gross Interest Income in the “Income from other sources”
Schedule of Return of Income. Interest Income data is compiled only for those returns
where it is explicitly stated in the Return of Income.
3. The “Sum of Interest Income” is the sum of Interest Income of all returns within the value
range slab.
4. The “Average Interest Income” is the average Interest Income within the value range
slab i.e. “Sum of Interest Income” divided by total number of returns within the value
range slab
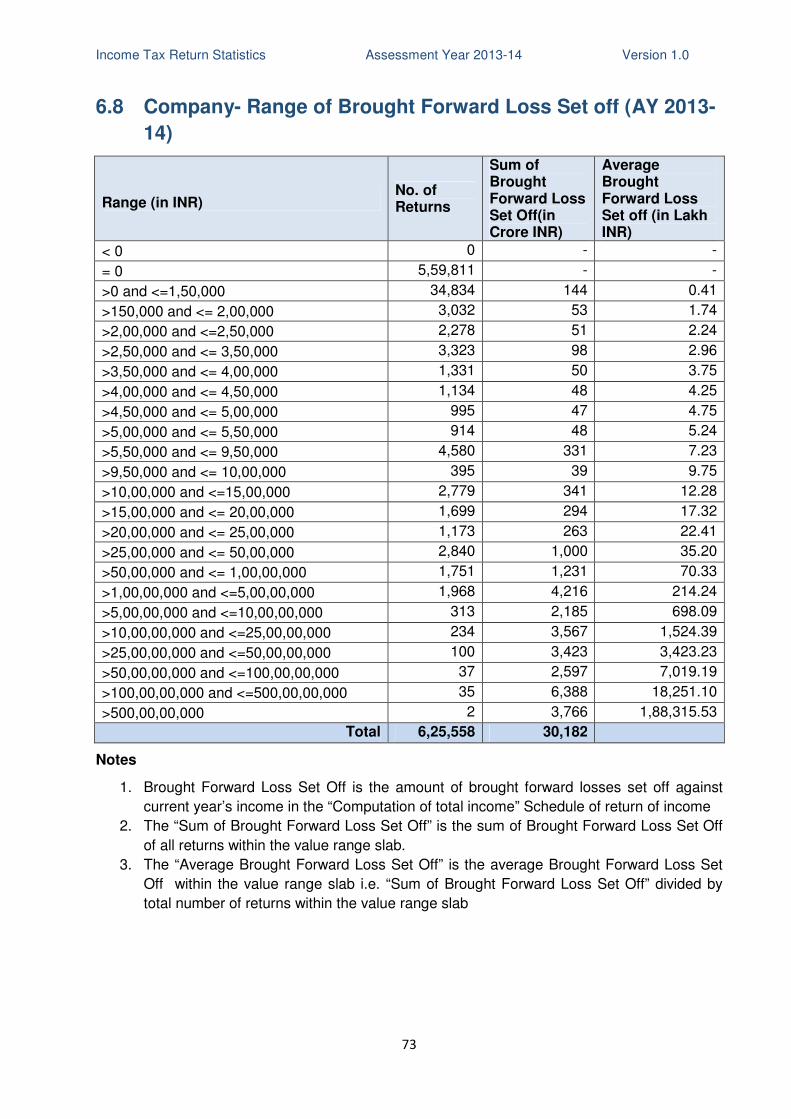
Income Tax Return Statistics Assessment Year 2013-14 Version 1.0
73
6.8 Company- Range of Brought Forward Loss Set off (AY 2013-
14)
Range (in INR) No. of Returns
Sum of Brought Forward Loss Set Off(in Crore INR)
Average Brought Forward Loss Set off (in Lakh INR)
< 0 0 - -
= 0 5,59,811 - -
>0 and <=1,50,000 34,834 144 0.41
>150,000 and <= 2,00,000 3,032 53 1.74
>2,00,000 and <=2,50,000 2,278 51 2.24
>2,50,000 and <= 3,50,000 3,323 98 2.96
>3,50,000 and <= 4,00,000 1,331 50 3.75
>4,00,000 and <= 4,50,000 1,134 48 4.25
>4,50,000 and <= 5,00,000 995 47 4.75
>5,00,000 and <= 5,50,000 914 48 5.24
>5,50,000 and <= 9,50,000 4,580 331 7.23
>9,50,000 and <= 10,00,000 395 39 9.75
>10,00,000 and <=15,00,000 2,779 341 12.28
>15,00,000 and <= 20,00,000 1,699 294 17.32
>20,00,000 and <= 25,00,000 1,173 263 22.41
>25,00,000 and <= 50,00,000 2,840 1,000 35.20
>50,00,000 and <= 1,00,00,000 1,751 1,231 70.33
>1,00,00,000 and <=5,00,00,000 1,968 4,216 214.24
>5,00,00,000 and <=10,00,00,000 313 2,185 698.09
>10,00,00,000 and <=25,00,00,000 234 3,567 1,524.39
>25,00,00,000 and <=50,00,00,000 100 3,423 3,423.23
>50,00,00,000 and <=100,00,00,000 37 2,597 7,019.19
>100,00,00,000 and <=500,00,00,000 35 6,388 18,251.10
>500,00,00,000 2 3,766 1,88,315.53
Total 6,25,558 30,182
Notes
1. Brought Forward Loss Set Off is the amount of brought forward losses set off against
current year’s income in the “Computation of total income” Schedule of return of income
2. The “Sum of Brought Forward Loss Set Off” is the sum of Brought Forward Loss Set Off
of all returns within the value range slab.
3. The “Average Brought Forward Loss Set Off” is the average Brought Forward Loss Set
Off within the value range slab i.e. “Sum of Brought Forward Loss Set Off” divided by
total number of returns within the value range slab
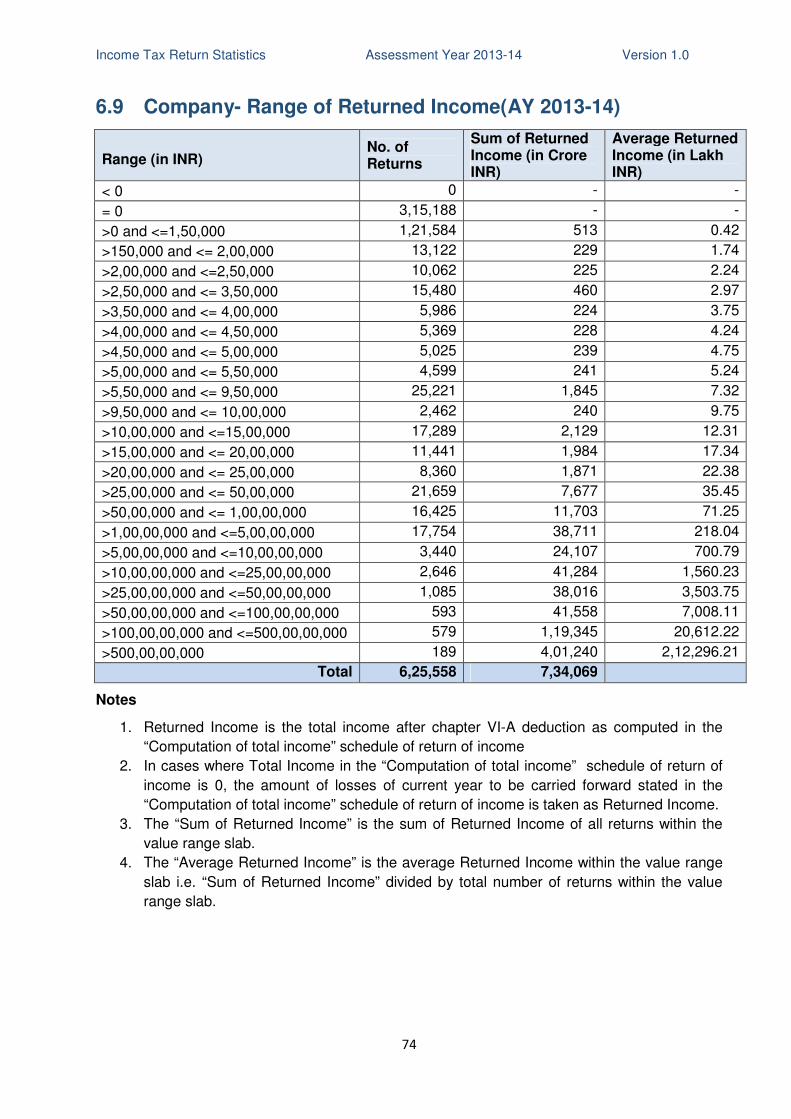
Income Tax Return Statistics Assessment Year 2013-14 Version 1.0
74
6.9 Company- Range of Returned Income(AY 2013-14)
Range (in INR) No. of Returns
Sum of Returned Income (in Crore INR)
Average Returned Income (in Lakh INR)
< 0 0 - -
= 0 3,15,188 - -
>0 and <=1,50,000 1,21,584 513 0.42
>150,000 and <= 2,00,000 13,122 229 1.74
>2,00,000 and <=2,50,000 10,062 225 2.24
>2,50,000 and <= 3,50,000 15,480 460 2.97
>3,50,000 and <= 4,00,000 5,986 224 3.75
>4,00,000 and <= 4,50,000 5,369 228 4.24
>4,50,000 and <= 5,00,000 5,025 239 4.75
>5,00,000 and <= 5,50,000 4,599 241 5.24
>5,50,000 and <= 9,50,000 25,221 1,845 7.32
>9,50,000 and <= 10,00,000 2,462 240 9.75
>10,00,000 and <=15,00,000 17,289 2,129 12.31
>15,00,000 and <= 20,00,000 11,441 1,984 17.34
>20,00,000 and <= 25,00,000 8,360 1,871 22.38
>25,00,000 and <= 50,00,000 21,659 7,677 35.45
>50,00,000 and <= 1,00,00,000 16,425 11,703 71.25
>1,00,00,000 and <=5,00,00,000 17,754 38,711 218.04
>5,00,00,000 and <=10,00,00,000 3,440 24,107 700.79
>10,00,00,000 and <=25,00,00,000 2,646 41,284 1,560.23
>25,00,00,000 and <=50,00,00,000 1,085 38,016 3,503.75
>50,00,00,000 and <=100,00,00,000 593 41,558 7,008.11
>100,00,00,000 and <=500,00,00,000 579 1,19,345 20,612.22
>500,00,00,000 189 4,01,240 2,12,296.21
Total 6,25,558 7,34,069
Notes
1. Returned Income is the total income after chapter VI-A deduction as computed in the
“Computation of total income” schedule of return of income
2. In cases where Total Income in the “Computation of total income” schedule of return of
income is 0, the amount of losses of current year to be carried forward stated in the
“Computation of total income” schedule of return of income is taken as Returned Income.
3. The “Sum of Returned Income” is the sum of Returned Income of all returns within the
value range slab.
4. The “Average Returned Income” is the average Returned Income within the value range
slab i.e. “Sum of Returned Income” divided by total number of returns within the value
range slab.
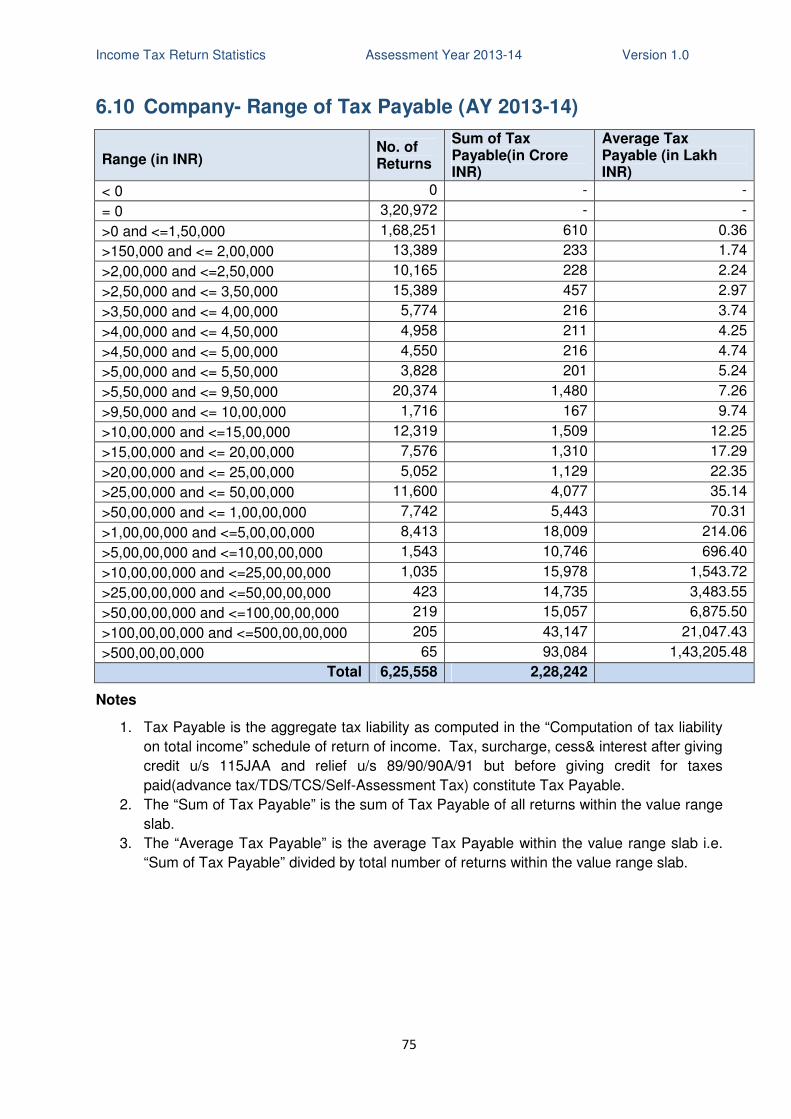
Income Tax Return Statistics Assessment Year 2013-14 Version 1.0
75
6.10 Company- Range of Tax Payable (AY 2013-14)
Range (in INR) No. of Returns
Sum of Tax Payable(in Crore INR)
Average Tax Payable (in Lakh INR)
< 0 0 - -
= 0 3,20,972 - -
>0 and <=1,50,000 1,68,251 610 0.36
>150,000 and <= 2,00,000 13,389 233 1.74
>2,00,000 and <=2,50,000 10,165 228 2.24
>2,50,000 and <= 3,50,000 15,389 457 2.97
>3,50,000 and <= 4,00,000 5,774 216 3.74
>4,00,000 and <= 4,50,000 4,958 211 4.25
>4,50,000 and <= 5,00,000 4,550 216 4.74
>5,00,000 and <= 5,50,000 3,828 201 5.24
>5,50,000 and <= 9,50,000 20,374 1,480 7.26
>9,50,000 and <= 10,00,000 1,716 167 9.74
>10,00,000 and <=15,00,000 12,319 1,509 12.25
>15,00,000 and <= 20,00,000 7,576 1,310 17.29
>20,00,000 and <= 25,00,000 5,052 1,129 22.35
>25,00,000 and <= 50,00,000 11,600 4,077 35.14
>50,00,000 and <= 1,00,00,000 7,742 5,443 70.31
>1,00,00,000 and <=5,00,00,000 8,413 18,009 214.06
>5,00,00,000 and <=10,00,00,000 1,543 10,746 696.40
>10,00,00,000 and <=25,00,00,000 1,035 15,978 1,543.72
>25,00,00,000 and <=50,00,00,000 423 14,735 3,483.55
>50,00,00,000 and <=100,00,00,000 219 15,057 6,875.50
>100,00,00,000 and <=500,00,00,000 205 43,147 21,047.43
>500,00,00,000 65 93,084 1,43,205.48
Total 6,25,558 2,28,242
Notes
1. Tax Payable is the aggregate tax liability as computed in the “Computation of tax liability
on total income” schedule of return of income. Tax, surcharge, cess& interest after giving
credit u/s 115JAA and relief u/s 89/90/90A/91 but before giving credit for taxes
paid(advance tax/TDS/TCS/Self-Assessment Tax) constitute Tax Payable.
2. The “Sum of Tax Payable” is the sum of Tax Payable of all returns within the value range
slab.
3. The “Average Tax Payable” is the average Tax Payable within the value range slab i.e.
“Sum of Tax Payable” divided by total number of returns within the value range slab.
Income Tax Return Statistics Assessment Year 2013-14 Version 1.0
76
7. Type of Business
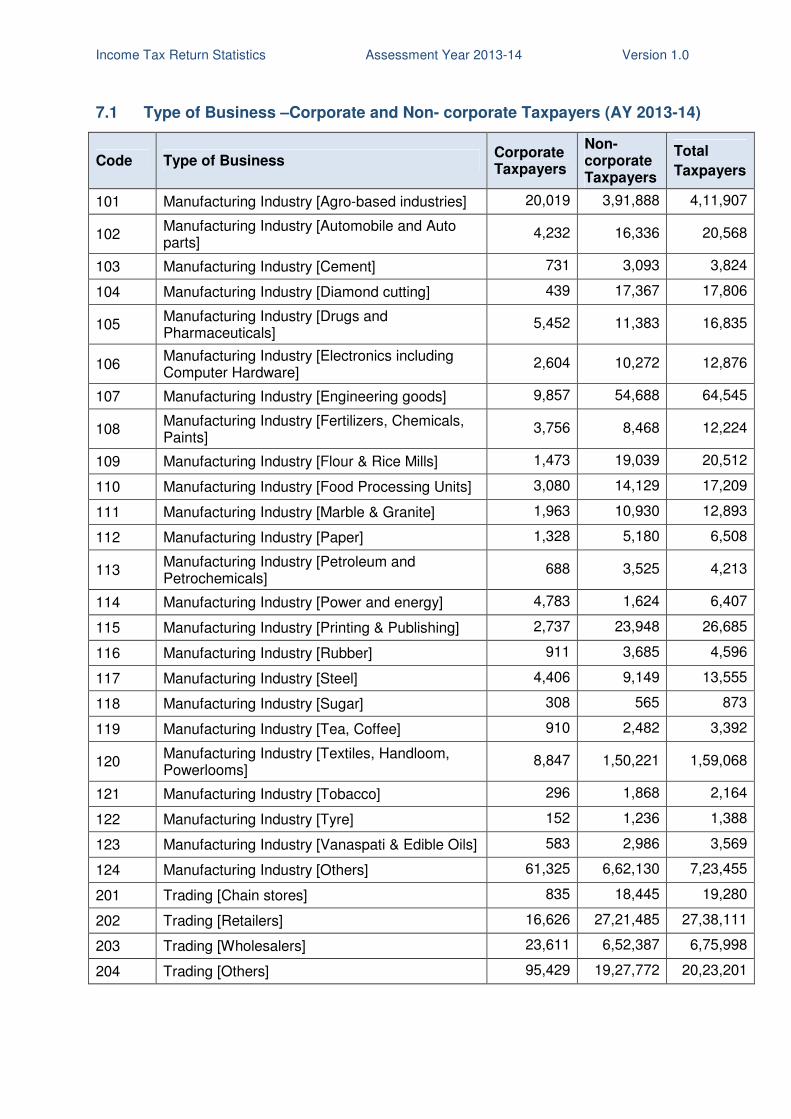
Income Tax Return Statistics Assessment Year 2013-14 Version 1.0
7.1 Type of Business –Corporate and Non- corporate Taxpayers (AY 2013-14)
Code Type of Business Corporate Taxpayers
Non- corporate Taxpayers
Total
Taxpayers
101 Manufacturing Industry [Agro-based industries] 20,019 3,91,888 4,11,907
102 Manufacturing Industry [Automobile and Auto parts]
4,232 16,336 20,568
103 Manufacturing Industry [Cement] 731 3,093 3,824
104 Manufacturing Industry [Diamond cutting] 439 17,367 17,806
105 Manufacturing Industry [Drugs and Pharmaceuticals]
5,452 11,383 16,835
106 Manufacturing Industry [Electronics including Computer Hardware]
2,604 10,272 12,876
107 Manufacturing Industry [Engineering goods] 9,857 54,688 64,545
108 Manufacturing Industry [Fertilizers, Chemicals, Paints]
3,756 8,468 12,224
109 Manufacturing Industry [Flour & Rice Mills] 1,473 19,039 20,512
110 Manufacturing Industry [Food Processing Units] 3,080 14,129 17,209
111 Manufacturing Industry [Marble & Granite] 1,963 10,930 12,893
112 Manufacturing Industry [Paper] 1,328 5,180 6,508
113 Manufacturing Industry [Petroleum and Petrochemicals]
688 3,525 4,213
114 Manufacturing Industry [Power and energy] 4,783 1,624 6,407
115 Manufacturing Industry [Printing & Publishing] 2,737 23,948 26,685
116 Manufacturing Industry [Rubber] 911 3,685 4,596
117 Manufacturing Industry [Steel] 4,406 9,149 13,555
118 Manufacturing Industry [Sugar] 308 565 873
119 Manufacturing Industry [Tea, Coffee] 910 2,482 3,392
120 Manufacturing Industry [Textiles, Handloom, Powerlooms]
8,847 1,50,221 1,59,068
121 Manufacturing Industry [Tobacco] 296 1,868 2,164
122 Manufacturing Industry [Tyre] 152 1,236 1,388
123 Manufacturing Industry [Vanaspati & Edible Oils] 583 2,986 3,569
124 Manufacturing Industry [Others] 61,325 6,62,130 7,23,455
201 Trading [Chain stores] 835 18,445 19,280
202 Trading [Retailers] 16,626 27,21,485 27,38,111
203 Trading [Wholesalers] 23,611 6,52,387 6,75,998
204 Trading [Others] 95,429 19,27,772 20,23,201
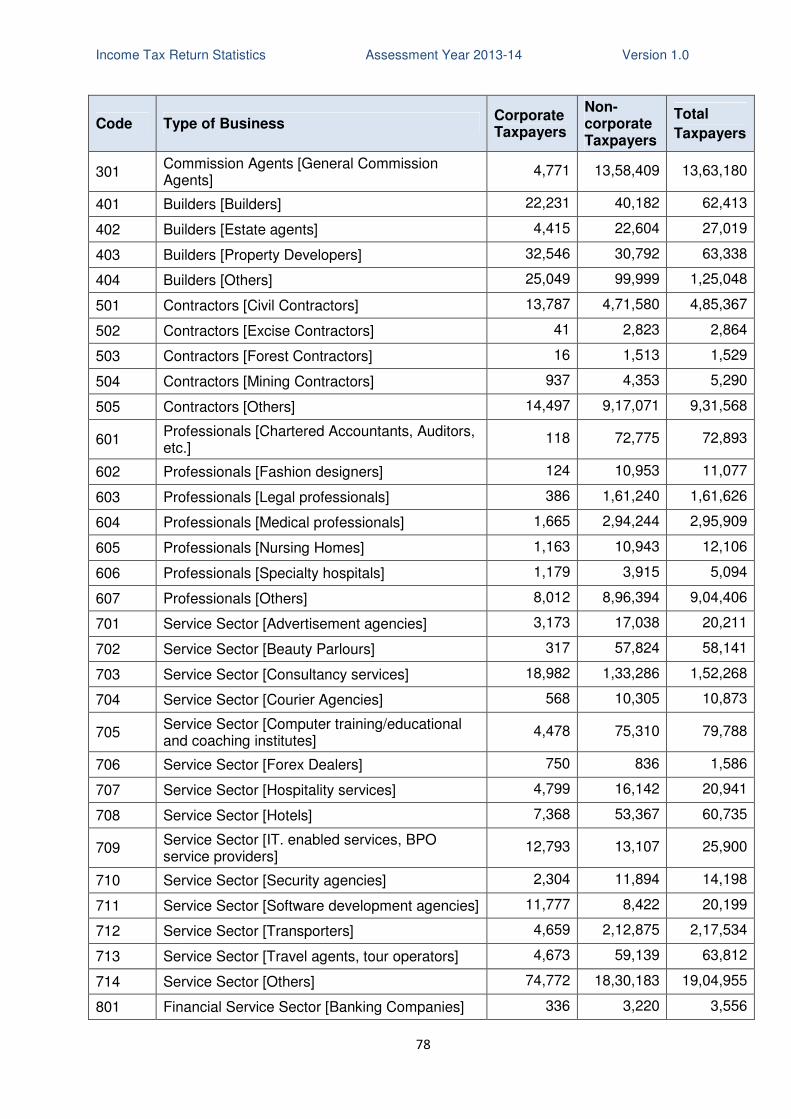
Income Tax Return Statistics Assessment Year 2013-14 Version 1.0
78
Code Type of Business Corporate Taxpayers
Non- corporate Taxpayers
Total
Taxpayers
301 Commission Agents [General Commission Agents]
4,771 13,58,409 13,63,180
401 Builders [Builders] 22,231 40,182 62,413
402 Builders [Estate agents] 4,415 22,604 27,019
403 Builders [Property Developers] 32,546 30,792 63,338
404 Builders [Others] 25,049 99,999 1,25,048
501 Contractors [Civil Contractors] 13,787 4,71,580 4,85,367
502 Contractors [Excise Contractors] 41 2,823 2,864
503 Contractors [Forest Contractors] 16 1,513 1,529
504 Contractors [Mining Contractors] 937 4,353 5,290
505 Contractors [Others] 14,497 9,17,071 9,31,568
601 Professionals [Chartered Accountants, Auditors, etc.]
118 72,775 72,893
602 Professionals [Fashion designers] 124 10,953 11,077
603 Professionals [Legal professionals] 386 1,61,240 1,61,626
604 Professionals [Medical professionals] 1,665 2,94,244 2,95,909
605 Professionals [Nursing Homes] 1,163 10,943 12,106
606 Professionals [Specialty hospitals] 1,179 3,915 5,094
607 Professionals [Others] 8,012 8,96,394 9,04,406
701 Service Sector [Advertisement agencies] 3,173 17,038 20,211
702 Service Sector [Beauty Parlours] 317 57,824 58,141
703 Service Sector [Consultancy services] 18,982 1,33,286 1,52,268
704 Service Sector [Courier Agencies] 568 10,305 10,873
705 Service Sector [Computer training/educational and coaching institutes]
4,478 75,310 79,788
706 Service Sector [Forex Dealers] 750 836 1,586
707 Service Sector [Hospitality services] 4,799 16,142 20,941
708 Service Sector [Hotels] 7,368 53,367 60,735
709 Service Sector [IT. enabled services, BPO service providers]
12,793 13,107 25,900
710 Service Sector [Security agencies] 2,304 11,894 14,198
711 Service Sector [Software development agencies] 11,777 8,422 20,199
712 Service Sector [Transporters] 4,659 2,12,875 2,17,534
713 Service Sector [Travel agents, tour operators] 4,673 59,139 63,812
714 Service Sector [Others] 74,772 18,30,183 19,04,955
801 Financial Service Sector [Banking Companies] 336 3,220 3,556
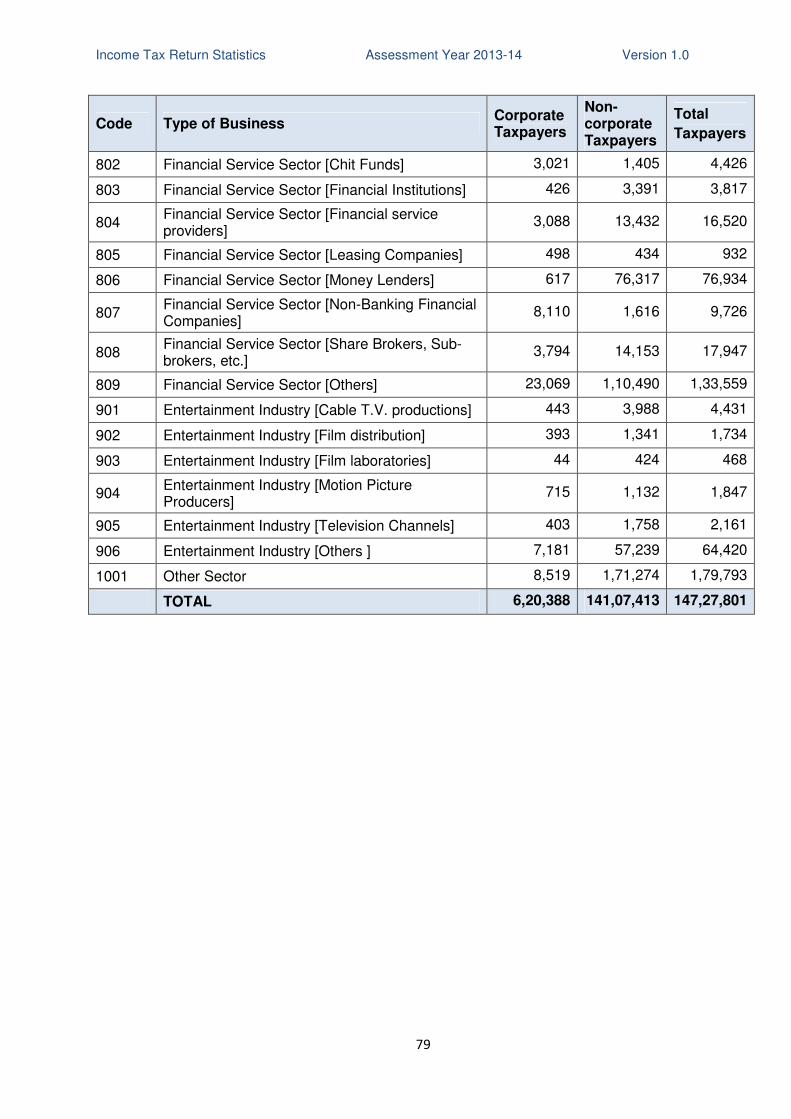
Income Tax Return Statistics Assessment Year 2013-14 Version 1.0
79
Code Type of Business Corporate Taxpayers
Non- corporate Taxpayers
Total
Taxpayers
802 Financial Service Sector [Chit Funds] 3,021 1,405 4,426
803 Financial Service Sector [Financial Institutions] 426 3,391 3,817
804 Financial Service Sector [Financial service providers]
3,088 13,432 16,520
805 Financial Service Sector [Leasing Companies] 498 434 932
806 Financial Service Sector [Money Lenders] 617 76,317 76,934
807 Financial Service Sector [Non-Banking Financial Companies]
8,110 1,616 9,726
808 Financial Service Sector [Share Brokers, Sub-brokers, etc.]
3,794 14,153 17,947
809 Financial Service Sector [Others] 23,069 1,10,490 1,33,559
901 Entertainment Industry [Cable T.V. productions] 443 3,988 4,431
902 Entertainment Industry [Film distribution] 393 1,341 1,734
903 Entertainment Industry [Film laboratories] 44 424 468
904 Entertainment Industry [Motion Picture Producers]
715 1,132 1,847
905 Entertainment Industry [Television Channels] 403 1,758 2,161
906 Entertainment Industry [Others ] 7,181 57,239 64,420
1001 Other Sector 8,519 1,71,274 1,79,793
TOTAL 6,20,388 141,07,413 147,27,801