income tab data report presentation€¦ · income tab data request participating clients in march...
TRANSCRIPT
WIC Income Tab Data Report
Slide 1

Background• There’s a lot of attention at the federal level on WIC’s income eligibility determination.
Slide 2

Background• Washington WIC will have a Management Evaluation (ME) in early 2016– FNS staff will review policy and procedures– They will visit local clinics to observe clinic practices
Slide 3

Income Tab Data Request
Participating clients in March 2015Total participating caseload = 163,052
Slide 4

Results
Piqued
interest
our
Slide 5

Results
Clinic staff are doing a GREAT job!
• There were few errors
• The magnitude of the errors was small
• Some limitations in the data
Slide 6
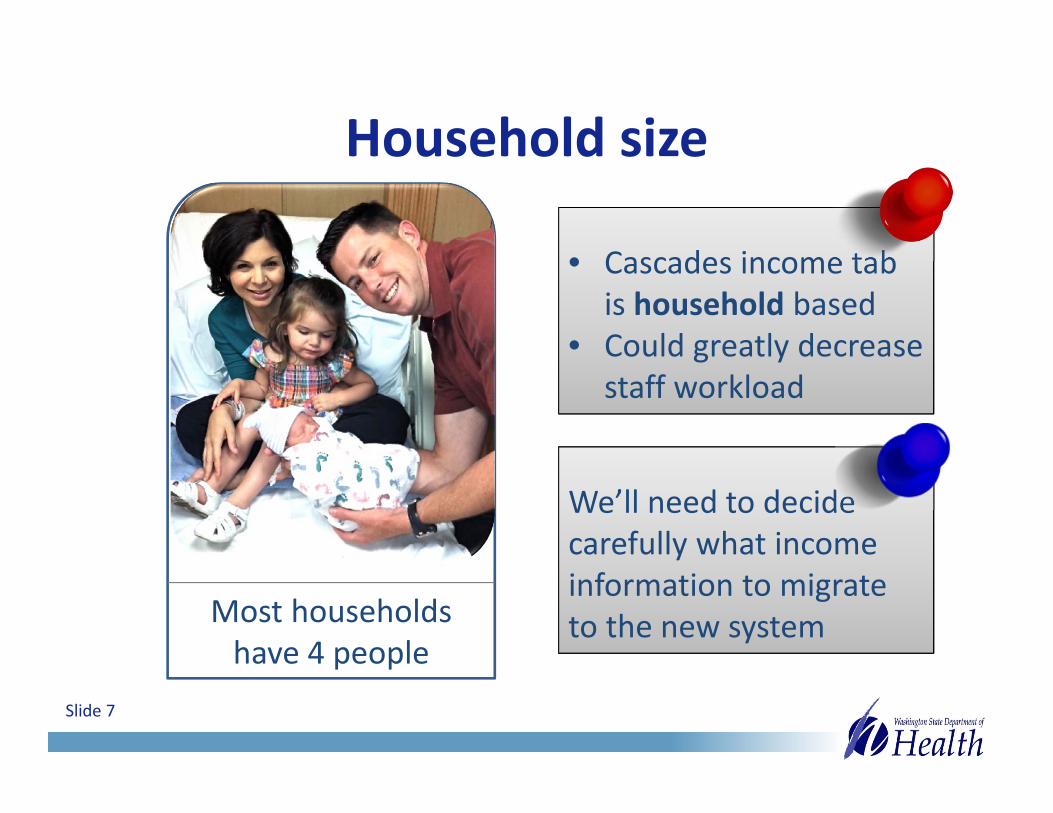
Household size
Most households have 4 people
• Cascades income tab is household based
• Could greatly decrease staff workload
We’ll need to decide carefully what income information to migrate to the new system
Slide 7

Household Size
Most households of 1 were infants or children
• Each foster child is a household of 1
• Select Foster Care as the source of income
Households of 1 = 2.4%
Foster Care as the source of income = 1.3%
Slide 8
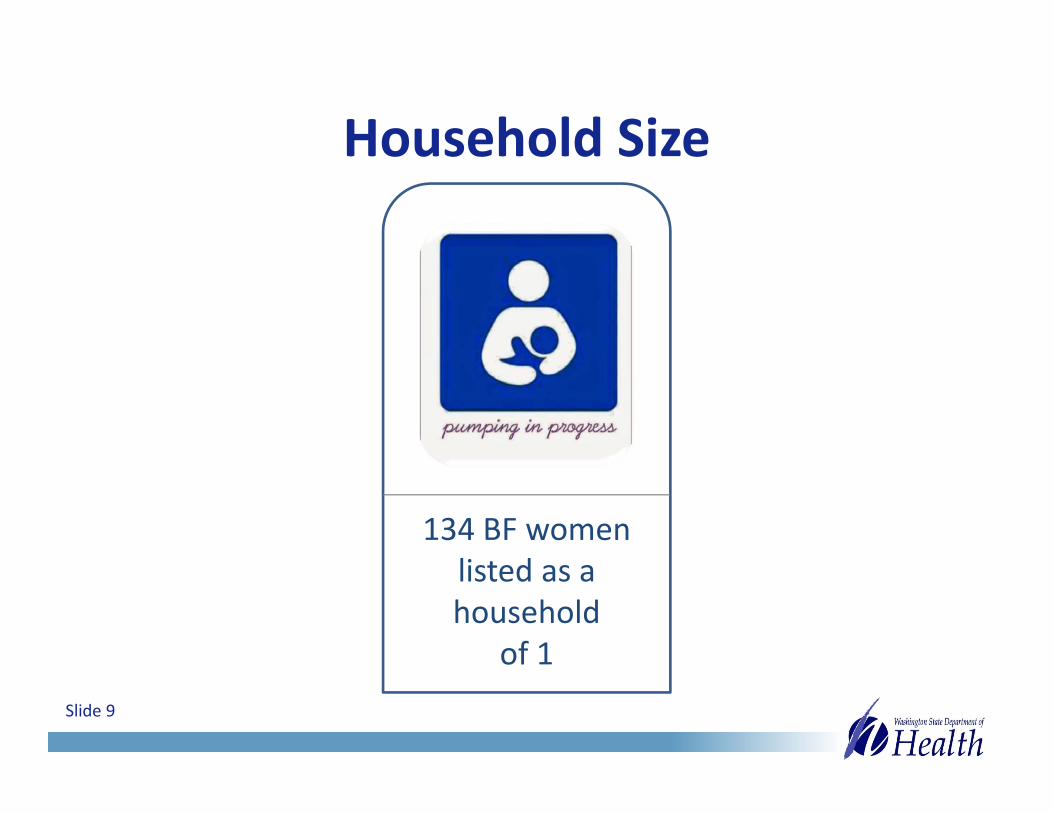
Household Size
134 BF women listed as a household
of 1Slide 9

Source of Income
Most clients/caregivers are employed
• Most common primary source of income = employment (70.5%)
• Large majority (77.1%) have some income from employment
Slide 10

Adjunctive Eligibility
Program # of clients % of caseload
Medicaid Title 19 andstate/federal non‐Title 19
101,653 62.3 %
TANF 891 0.5 %
SNAP 2,538 1.6 %
FDPIR 11 < 0.1 %
Adjunctive Eligibility due to a household member
2,493 1.6 %
Slide 11
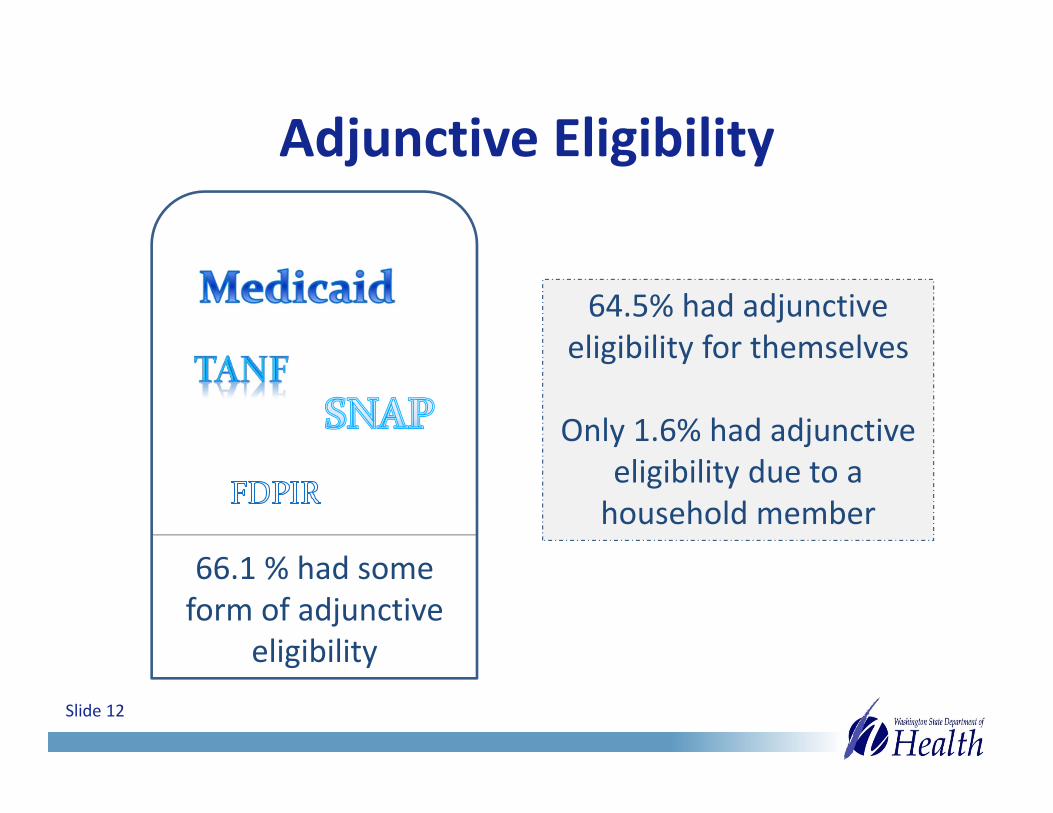
Adjunctive Eligibility
66.1 % had some form of adjunctive
eligibility
64.5% had adjunctive eligibility for themselves
Only 1.6% had adjunctive eligibility due to a household member
Slide 12
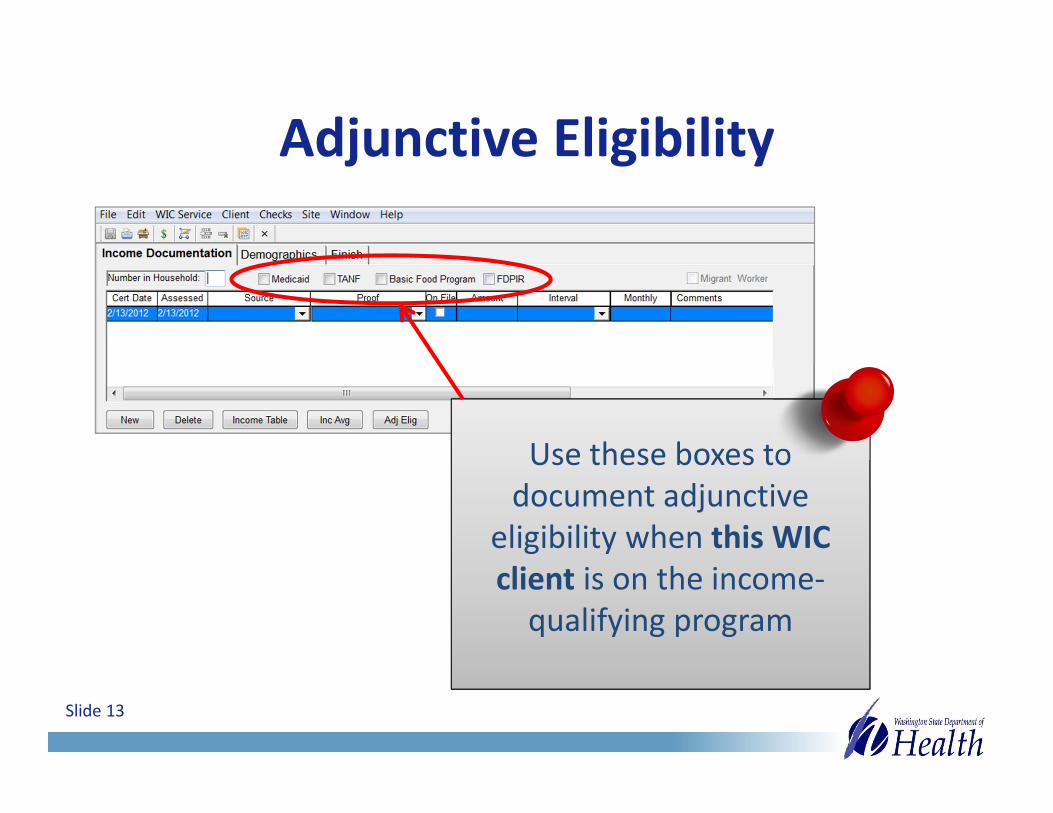
Adjunctive Eligibility
Use these boxes to document adjunctive
eligibility when this WIC client is on the income‐qualifying program
Slide 13

Adjunctive Eligibility
Use the Adjunctive Eligibility (Adj Elig) pop‐upto document adjunctive eligibility due to a household member
Slide 14

Adjunctive Eligibility
63.8 % used ProviderOne for
adjunctive eligibility
• The majority of these clients had a P1 number in Client Services
• 3% didn’t have a number in the P1 field• The P1 number could be
in the Comments field
Slide 15

Adjunctive Eligibility
When the client is on the income‐qualifying program:• Check this box • Document the P1
number here
Slide 16
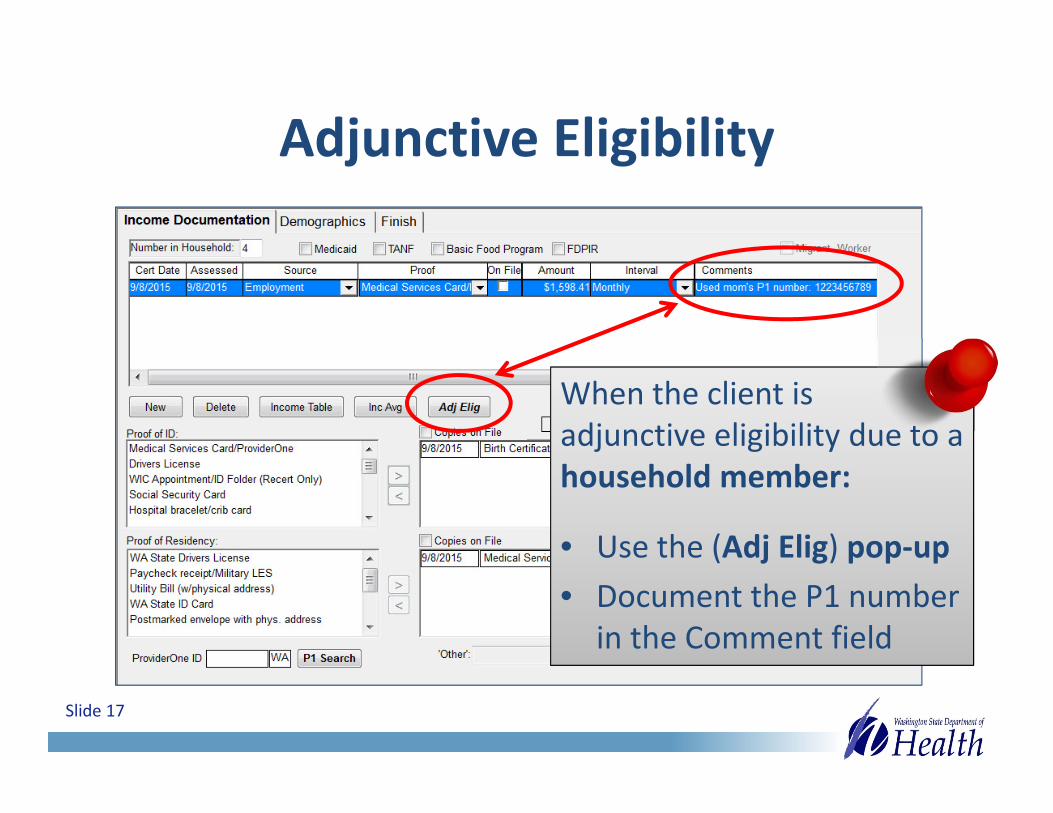
Adjunctive Eligibility
When the client is adjunctive eligibility due to a household member:
• Use the (Adj Elig) pop‐up• Document the P1 number
in the Comment field
Slide 17

Adjunctive Eligibility
4,072 (0.1%) have:
• The Medicaid box marked
• No P1 number• Income above WIC
guidelines
• Document the P1 number • Make sure you get a
“positive” search result
Slide 18

Adjunctive Eligibility
The last P1 number searched is saved and can’t be removed
Unexpected finding22.1% had a P1 number listed but no adjunctive eligibility documented
Slide 19

Adjunctive Eligibility
3.6% of clients with adjunctive eligibility have income over WIC’s guidelines
Medicaid Expansion• The GAO estimated 2–9%
of clients with adjunctive eligibility have income over WIC’s guidelines
Slide 20
Zero Income
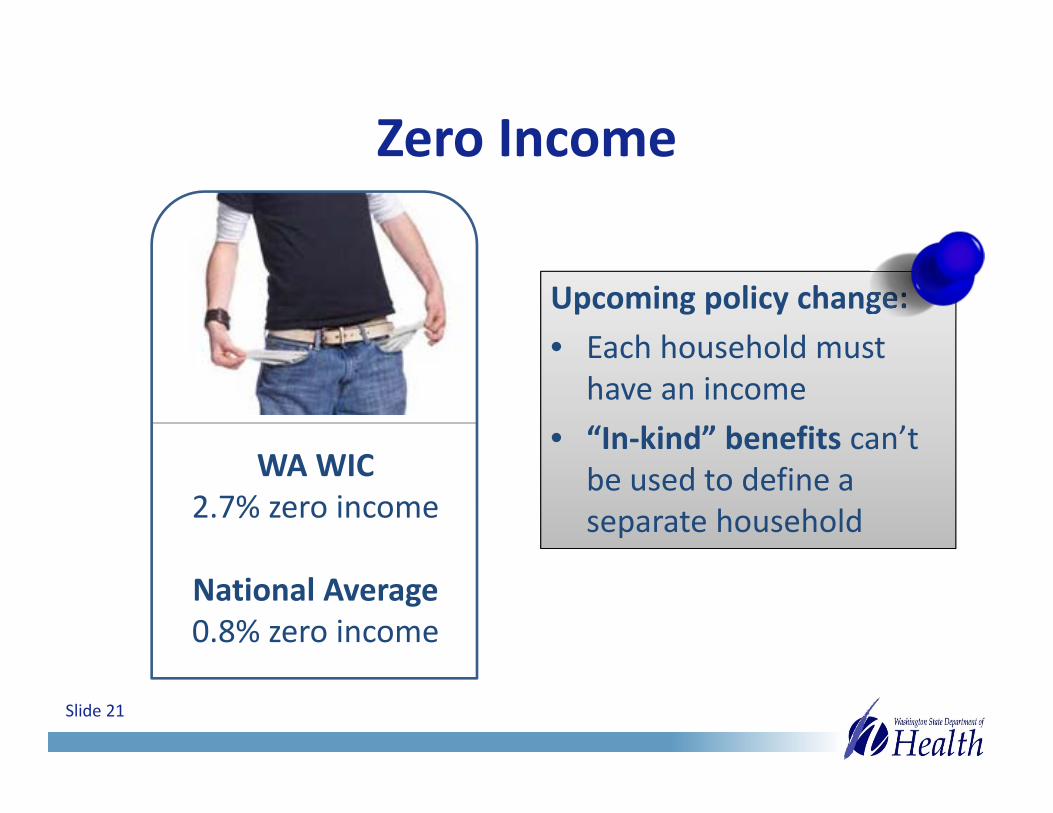
WA WIC2.7% zero income
National Average0.8% zero income
Upcoming policy change:• Each household must
have an income• “In‐kind” benefits can’t
be used to define a separate household
Slide 21

Proof of ID
ProviderOne Card
68.8%
112,179
WIC Appt/ID Folder
6.1%
9,957
Driver’s License
5.0%
8,236
Slide 22

Proof of ID
Very low rates of “Not Provided” and
No Proof of ID
Very low rates of no proof:• “Not Provided” Grace Period =
0.3% (n = 488)
• No Proof of Residency/ID Form = 0.1% (n = 133)
Slide 23

Proof of ID
For 1.7 % the ID didn’t match the
category• Each WIC client must
show ID
Infants and Children had these marked:• Driver’s license• Voter Registration Card• Work and school ID
Slide 24

Proof of Income
Highest potential errorA fairly large number had the P1 card
selected as proof of income, but no adjunctive eligibility marked
17% (n= 28,565) Slide 25

Proof of Income
Less commonAdjunctive eligibility marked, but the
proof didn’t match (usually paystubs were marked)
5.2% (n= 8,526)Slide 26
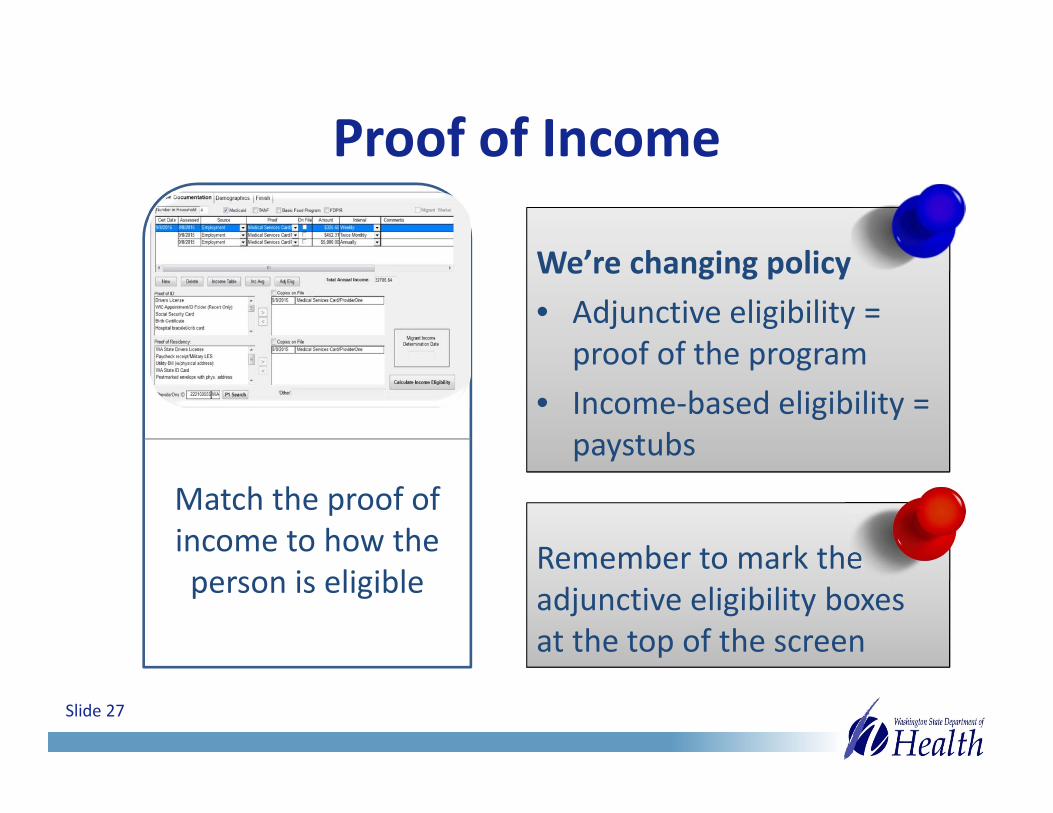
Proof of Income
Match the proof of income to how the person is eligible
We’re changing policy• Adjunctive eligibility =
proof of the program• Income‐based eligibility =
paystubs
Remember to mark the adjunctive eligibility boxes at the top of the screen
Slide 27

Proof of Income
Low rates of no proof:• “Not Provided” Grace Period =
0.7% (n = 1,133)
• WIC Statement of Income Form = 0.9% (n = 1,511)
Slide 28

Income Averaging and Interval
Monthly Interval 62.8%
Income Averaging 0.1%
Changing policy:• GAO report – need more
consistency• Monthly = last 30 days
Don’t forget about the option to income average:• Fluctuating income• Recent raise• Lump sum payment
Slide 29

Proof of Residency
ProviderOne Card
77.0%
125,599
WA Driver’s License
7.7%
12,570
Utility bill
4.8%
7,765
Slide 30

Proof of Residency
Low rates of no proof:• Grace Period = 0.4%• No Proof of Residency = 0.2%
Slide 31

Next Steps
• Keep doing what you’re doing
• Review training materials with staff
• Submit policy changes to FNS this month
• Develop training materials and staff tools
Slide 32

USDA is an equal opportunity provider and employer.
Washington State WIC Nutrition Program doesn’t discriminate.
DOH 961‐1092 November 2015