income inequality, household debt and current account
TRANSCRIPT

Income inequality, household debt and
current account imbalances
Jan Behringer
Macroeconomic Policy Institute (IMK) and University of Wurzburg
Joint work with C. Belabed, T. Theobald and T. van Treeck
Financial support by the Institute for New Economic Thinking (INET) is gratefully acknowledged
5th FMM International Summer School
Berlin, August 2015
www.imk-boeckler.de August 2015 0 / 25

Outline
I. Macroeconomic implications of income inequality
Income inequality and macroeconomic instability in the United States
Income inequality and macroeconomic instability in Germany
II. Income distribution and current account imbalances
Introduction and literature
Descriptive analysis/illustration of hypotheses
Estimation methodology
Estimation results
Conclusion
www.imk-boeckler.de August 2015 1 / 25

Outline
I. Macroeconomic implications of income inequality
Income inequality and macroeconomic instability in the United States
Income inequality and macroeconomic instability in Germany
II. Income distribution and current account imbalances
Introduction and literature
Descriptive analysis/illustration of hypotheses
Estimation methodology
Estimation results
Conclusion
www.imk-boeckler.de August 2015 2 / 25

Income inequality in the United States and Germany
Gini coefficients of income inequality, mid-1980s and late2000s
0.20
0.25
0.30
0.35
0.40
0.45
0.50
Gin
i coe
ffici
ents
, mid
−19
80s
and
late
200
0s
Mex
ico
Uni
ted
Stat
esIs
rael
Uni
ted
King
dom
Italy
Aust
ralia
New
Zea
land
Japa
nC
anad
aG
erm
any
Net
herla
nds
Fran
ceLu
xem
bour
gFi
nlan
dH
unga
rySw
eden
Cze
ch R
epub
licBe
lgiu
mN
orw
ayD
enm
ark
Source: OECD Database on Household Income, Distribution and Poverty, own calculations
Gini coefficients of income inequality
Income inequality increased in most, but not all OECD countries
→ Inequality has increased to a similar degree in the U.S. and Germany
→ Strong increase in income inequality in New Zealand, Finland and Sweden
→ Little change in income inequality in France, Hungary and Belgium
www.imk-boeckler.de August 2015 3 / 25
A closer look at the United States
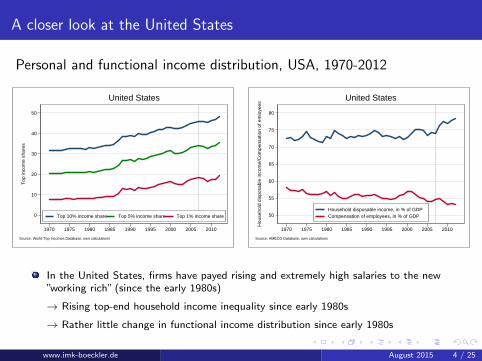
Personal and functional income distribution, USA, 1970-2012
0
10
20
30
40
50
Top
inco
me
shar
es
1970 1975 1980 1985 1990 1995 2000 2005 2010
Top 10% income share Top 5% income share Top 1% income share
Source: World Top Incomes Database, own calculations
United States
50
55
60
65
70
75
80
Hou
seho
ld d
ispo
sabl
e in
com
e/C
ompe
nsat
ion
of e
mlo
yees
1970 1975 1980 1985 1990 1995 2000 2005 2010
Household disposable income, in % of GDPCompensation of employees, in % of GDP
Source: AMECO Database, own calculations
United States
In the United States, firms have payed rising and extremely high salaries to the new”working rich” (since the early 1980s)
→ Rising top-end household income inequality since early 1980s
→ Rather little change in functional income distribution since early 1980s
www.imk-boeckler.de August 2015 4 / 25

A closer look at the United States
Household saving and debt, USA, 1970-2012
0
20
40
60
80
100
120
140
Deb
t, in
% o
f hou
seho
ld d
ispo
sabl
e in
com
e
6
8
10
12
14
16
18
20
Sav
ing,
in %
of h
ouse
hold
dis
posa
ble
inco
me
1970 1975 1980 1985 1990 1995 2000 2005 2010
Saving, in % of household disposable incomeDebt, in % of household disposable income
Source: AMECO Database, BIS, own calculations
United States
United States post-1980: Debt-driven consumption and crisis
→ Strong increase in household indebtedness prior to the Great Recession
→ Strongly falling household saving rate prior to the Great Recession
www.imk-boeckler.de August 2015 5 / 25

A closer look at the United States
Income inequality, household debt and the saving rate -
What happened in the United States?
Keynesian models would predict that higher income inequality leads to a higherhousehold saving rate
Mainstream theories of consumption are unable to explain the decline in the householdsaving rate and the rise in household debt in the United States
With upward-looking status comparisons, there may be a negative link between personalinequality and the aggregate household saving rate (”expenditure cascades” model byFrank et al., 2010)
This is not about eccentric luxury consumption, but basic middle class needs (privatefinancing of important positional goods such as education, housing, health care, etc. inthe United States)
www.imk-boeckler.de August 2015 6 / 25

A closer look at Germany
Personal and functional income distribution, DEU, 1970-2012
0
10
20
30
40
Top
inco
me
shar
es
1970 1975 1980 1985 1990 1995 2000 2005 2010
Top 10% income share Top 5% income share Top 1% income share
Source: World Top Incomes Database, own calculations
Germany
−2
0
2
4
6
8
10
Dis
p. c
orpo
rate
inco
me,
in %
of d
isp.
priv
ate
inco
me
36
38
40
42
44
46
48
Cap
ital i
ncom
e, in
% o
f nat
iona
l inc
ome
1991 1994 1997 2000 2003 2006 2009 2012
Capital income, in % of national incomeDisp. corporate income, in % of disp. private income
Source: AMECO Database, own calculations
Germany
In Germany, firms have accumulated financial assets with their retained profits (duringthe 1980s and 2000s)
→ Top-end personal income inequality has not increased very much
→ Strongly increasing capital income share
www.imk-boeckler.de August 2015 7 / 25
A closer look at Germany
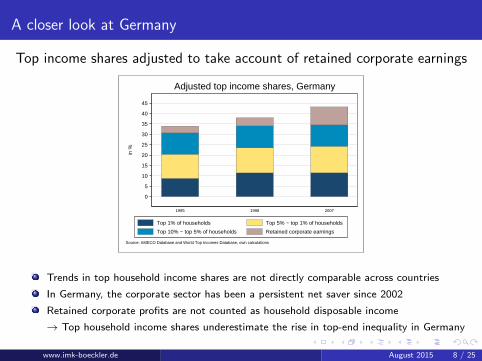
Top income shares adjusted to take account of retained corporate earnings
0
5
10
15
20
25
30
35
40
45
in %
1995 1998 2007
Source: AMECO Database and World Top Incomes Database, own calculations
Adjusted top income shares, Germany
Top 1% of households Top 5% − top 1% of households
Top 10% − top 5% of households Retained corporate earnings
Trends in top household income shares are not directly comparable across countries
In Germany, the corporate sector has been a persistent net saver since 2002
Retained corporate profits are not counted as household disposable income
→ Top household income shares underestimate the rise in top-end inequality in Germany
www.imk-boeckler.de August 2015 8 / 25

Outline
I. Macroeconomic implications of income inequality
Income inequality and macroeconomic instability in the United States
Income inequality and macroeconomic instability in Germany
II. Income distribution and current account imbalances
Introduction and literature
Descriptive analysis/illustration of hypotheses
Estimation methodology
Estimation results
Conclusion
www.imk-boeckler.de August 2015 9 / 25

Introduction and literature
Income inequality, household leverage and current account imbalances
Keynesians often assume a positive link between personal inequality and the householdsaving rate because “the rich save more than the poor”
With upward-looking status comparisons, there may be a negative link between personalinequality and the aggregate household saving rate (“expenditure cascades” model byFrank et al., 2010)
Link between rising (top-end) income inequality and the decline in saving (and rise inhousehold debt) prior to the Great Recession (e.g. Palley, 1994; Cynamon and Fazzari,2008, 2014; Fitoussi and Stiglitz, 2009; Rajan, 2010; Kumhof and Ranciere, 2010;Stockhammer, 2013; van Treeck, 2014)
The corporate veil: Functional income distribution and aggregate demand
If households have a higher propensity to spend out of current income than firms, afalling wage share is linked to a decline in the consumption-to-GDP ratio (e.g. Kalecki,1954; Kaldor, 1966)
Existence of a corporate veil, i.e. consumers react differently to a rise in dividends than toan increase in corporate retained earnings (e.g. Feldstein and Fane, 1973; Poterba, 1991;Baker et al., 2007; Atkinson, 2009)
www.imk-boeckler.de August 2015 10 / 25

Introduction and literature
The current hype about top income shares ...
Atkinson, Piketty and Saez (2011) distinguish between “U-shape” and “L-shape” countriesin terms of top income shares
Leigh (2007) recommends using top income shares when other measures of personalinequality (e.g. Gini coefficient) are not available
Kumhof et al. (2012) use top income shares as a proxy of the distribution of incomebetween “investors” and “workers”
... goes a bit too far
Changes in Gini coefficient and top income shares can have very different macroeconomicimplications (expenditure cascades)
Sole focus on top income shares is misleading to the extent that the functionaldistribution has worsened more in the “L-shape” countries than in the “U-shape” countries
www.imk-boeckler.de August 2015 11 / 25

Hypotheses
Hypothesis I
Rising personal inequality leads to a decrease of the current account, ceteris paribus
The further inequality rises towards the top of the income distribution, the stronger theeffect on private household net lending and the current account
Hypothesis II
The existence of the corporate veil affects the current account
An increase in corporate net lending is not fully compensated by a simultaneous decreasein household net lending
Hypothesis III
The joint effects of changes in personal and functional income distribution contribute toa significant degree to the explanation of the global current account imbalances
www.imk-boeckler.de August 2015 12 / 25
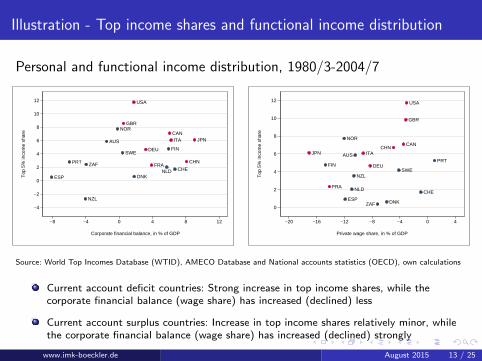
Illustration - Top income shares and functional income distribution
Personal and functional income distribution, 1980/3-2004/7
AUS
CAN
CHE
CHN
DEU
DNKESP
FIN
FRA
GBR
ITA JPN
NLD
NOR
NZL
PRT
SWE
USA
ZAF
−4
−2
0
2
4
6
8
10
12
Top
5%
inco
me
shar
e
−8 −4 0 4 8 12
Corporate financial balance, in % of GDP
AUS
CAN
CHE
CHN
DEU
DNKESP
FIN
FRA
GBR
ITAJPN
NLD
NOR
NZL
PRT
SWE
USA
ZAF0
2
4
6
8
10
12
Top
5%
inco
me
shar
e
−20 −16 −12 −8 −4 0 4
Private wage share, in % of GDP
Source: World Top Incomes Database (WTID), AMECO Database and National accounts statistics (OECD), own calculations
Current account deficit countries: Strong increase in top income shares, while thecorporate financial balance (wage share) has increased (declined) less
Current account surplus countries: Increase in top income shares relatively minor, whilethe corporate financial balance (wage share) has increased (declined) strongly
www.imk-boeckler.de August 2015 13 / 25

Illustration - Sectoral financial balances
Current account and corporatefinancial balance, 1980/3-2004/7
AUS
CAN
CHECHN
DEU
DNK
ESP
FIN
FRA
GBRIRL
ITA
JPN
NLD
NOR
NZL
PRT
SWE
USAZAF
−12
−8
−4
0
4
8
12
Cur
rent
acc
ount
bal
ance
, in
% o
f GD
P
−8 −6 −4 −2 0 2 4 6 8 10
Corporate financial balance, in % of GDP
Household and corporate financialbalance, 1980/3-2004/7
AUS
CAN
CHE
CHN
DEU
DNKESP
FIN
FRA
GBR
IRL
ITA
JPN
NLD
NOR
NZL
PRT
SWE
USA
ZAF
−12
−10
−8
−6
−4
−2
0
2
Hou
seho
ld fi
nanc
ial b
alan
ce, i
n %
of G
DP
−8 −6 −4 −2 0 2 4 6 8 10
Corporate financial balance, in % of GDP
Source: AMECO Database and National accounts statistics (OECD), own calculations
Corporate financial balance is positively related to the current account
No systematic relationship between corporate and household financial balance
www.imk-boeckler.de August 2015 14 / 25

Estimation methodology
Current account regression specification
We amend the approach developed by Chinn and Prasad (2003), Gruber and Kamin(2007), Chinn et al. (2007, 2011), Lee et al. (2008), Kumhof et al. (2012), Phillips et al.(2013) and estimate the following model
CAi,t = βXi,t + γCORPi,t + δINEQi,t + εi,t (1)
Cross-sectional demeaning: i indexes each country in the sample of J countries
Xi,t = Xi,t −∑J
i=1(GDPi,t ∗ Xi,t
)∑Ji=1 GDPi,t
(2)
Estimation approach
Model I (4-year non-overlapping averages): Pooled OLS with cluster-robust standarderrors (CGER, 2008)
Model II (annual data): Pooled GLS with panel-wide AR(1) correction (EBA, 2013)
Countries: AUS, CAN, CHN, DNK, FIN, FRA, DEU, IRE, ITA, JPN, NLD, NZL, NOR,PRT, ZAF, ESP, SWE, CHE, GBR, USA
Sample period: 1972-2007
www.imk-boeckler.de August 2015 15 / 25

Table I: Pooled OLS, 4-year non-overlapping averages, GDP-demeaning, 1972-2007
Regressor (1.1) (1.2) (1.3) (1.4)
Net foreign assets (% of GDP) 0.075*** 0.068*** 0.078*** 0.070***(0.009) (0.007) (0.009) (0.008)
Output per worker (rel. to top 3 economies) 0.013 -0.550 1.446 0.717(0.986) (1.168) (1.233) (0.892)
Dependency ratio -0.123 -0.244** -0.174* -0.273***(0.098) (0.096) (0.085) (0.072)
Population growth -1.667** -2.496*** -1.628** -2.215***(0.668) (0.725) (0.621) (0.697)
Terms of trade gap*Trade openness 0.008*** 0.006 0.008** 0.008*(0.002) (0.004) (0.003) (0.004)
Private credit (% of GDP) -0.060** -0.060*** -0.054** -0.055***(0.024) (0.021) (0.023) (0.019)
Fiscal balance (% of GDP) 0.322*** 0.432*** 0.228*** 0.333***(0.062) (0.090) (0.075) (0.086)
Corporate balance (% of GDP) - 0.448*** - 0.431***(0.126) (0.118)
Top 1% income share - - -0.380** -0.328***(0.153) (0.089)
Likelihood ratio (LR) test - 49.36 14.93 68.10p-value 0.000 0.000 0.000Variance inflation factor (VIF) 1.60 1.57 1.58 1.57
Observations 162 128 156 126Adjusted R-squared 0.579 0.738 0.618 0.772
Notes: Dependent variable is the current account balance in % of GDP. All regressions are estimated by POLS.Robust standard errors are reported in parantheses. All regressions include a constant term. *, ** and ***denotes significance at 10%, 5% and 1% levels, respectively.

Table II: Pooled OLS, 4-year non-overlapping averages, GDP-demeaning, 1972-2007
Regressor (2.1) (2.2) (2.3) (2.4)
Net foreign assets (% of GDP) 0.070*** 0.070*** 0.069*** 0.071***(0.008) (0.008) (0.009) (0.007)
Output per worker (rel. to top 3 economies) 0.717 0.170 -0.202 -1.277(0.892) (0.818) (0.778) (1.052)
Dependency ratio -0.273*** -0.286*** -0.352*** -0.321***(0.072) (0.069) (0.074) (0.082)
Population growth -2.215*** -2.086** -2.828*** -2.161***(0.697) (0.830) (0.725) (0.714)
Terms of trade gap*Trade openness 0.008* 0.008** 0.005 0.007*(0.004) (0.003) (0.005) (0.004)
Private credit (% of GDP) -0.055*** -0.054*** -0.051*** -0.060***(0.019) (0.018) (0.015) (0.020)
Fiscal balance (% of GDP) 0.333*** 0.334*** 0.394*** 0.351***(0.086) (0.084) (0.072) (0.093)
Corporate balance (% of GDP) 0.431*** 0.458*** 0.407*** 0.400***(0.118) (0.114) (0.095) (0.123)
Top 1% income share -0.328*** - - -(0.089)
Top 5% income share - -0.228*** - -(0.058)
Top 10% income share - - -0.178*** -(0.053)
Gini coefficient - - - -0.136***(0.042)
Variance inflation factor (VIF) 1.57 1.53 1.59 1.81Observations 126 123 123 128Adjusted R-squared 0.772 0.785 0.800 0.756
Notes: Dependent variable is the current account balance in % of GDP. All regressions are estimated by POLS.Robust standard errors are reported in parantheses. All regressions include a constant term. *, ** and ***denotes significance at 10%, 5% and 1% levels, respectively.

Table III: Pooled OLS, 4-year non-overlapping averages, 1972-2007
Regressor (3.1) (3.2) (3.3) (3.4)
Net foreign assets (% of GDP) 0.056*** 0.057*** 0.055*** 0.056***(0.008) (0.009) (0.008) (0.008)
Output per worker (rel. to top 3 economies) -1.224 -1.610 -1.992* -2.034(1.333) (1.257) (1.105) (1.775)
Dependency ratio -0.102 -0.111 -0.207** -0.131(0.090) (0.084) (0.073) (0.108)
Population growth -1.687** -1.220 -2.438*** -1.922**(0.741) (0.797) (0.636) (0.759)
Terms of trade gap*Trade openness 0.006** 0.006** 0.003 0.005*(0.003) (0.003) (0.003) (0.002)
Private credit (% of GDP) -0.008 -0.004 -0.011 -0.013(0.009) (0.008) (0.010) (0.008)
Fiscal balance (% of GDP) -0.617*** -0.617*** -0.529*** -0.594***(0.130) (0.130) (0.111) (0.132)
Corporate balance (% of GDP) -0.499*** -0.460*** -0.519*** -0.514***(0.140) (0.136) (0.108) (0.142)
Top 1% income share -0.182 - - -(0.117)
Top 5% income share - -0.171** - -(0.070)
Top 10% income share - - -0.125** -(0.053)
Gini coefficient - - - -0.042(0.079)
Variance inflation factor (VIF) 1.62 1.57 1.64 1.85Observations 126 123 123 128Adjusted R-squared 0.710 0.710 0.770 0.710
Notes: Dependent variable is the household financial balance in % of GDP. All regressions are estimated byPOLS. Robust standard errors are reported in parantheses. All regressions include a constant term. *, ** and*** denotes significance at 10%, 5% and 1% levels, respectively.

Table IV: Pooled OLS, 4-year non-overlapping averages, 1972-2007
Regressor (4.1) (4.2) (4.3) (4.4)
Net foreign assets (% of GDP) 0.098*** 0.096*** 0.097*** 0.097***(0.015) (0.014) (0.015) (0.016)
Output per worker (rel. to top 3 economies) -3.832* -5.104** -6.226** -7.270**(1.896) (1.786) (2.214) (2.860)
Dependency ratio -0.279** -0.314*** -0.443*** -0.397**(0.107) (0.103) (0.143) (0.160)
Population growth -0.026 -0.174 -1.170 -0.830(0.958) (1.104) (1.323) (1.444)
Terms of trade gap*Trade openness -0.003 -0.003 -0.006 -0.006*(0.003) (0.003) (0.004) (0.004)
Private credit (% of GDP) 0.010 0.004 0.003 -0.009(0.017) (0.015) (0.017) (0.017)
Fiscal balance (% of GDP) 0.655*** 0.673*** 0.741*** 0.732***(0.090) (0.088) (0.126) (0.130)
Corporate balance (% of GDP) -0.051 -0.001 -0.049 -0.120(0.172) (0.161) (0.175) (0.196)
Top 1% income share -0.719*** - - -(0.193)
Top 5% income share - -0.448*** - -(0.114)
Top 10% income share - - -0.345*** -(0.098)
Gini coefficient - - - -0.208*(0.106)
Variance inflation factor (VIF) 1.62 1.57 1.64 1.85Observations 126 123 123 128Adjusted R-squared 0.702 0.716 0.697 0.628
Notes: Dependent variable is the gross saving in % of GDP. All regressions are estimated by POLS. Robuststandard errors are reported in parantheses. All regressions include a constant term. *, ** and *** denotessignificance at 10%, 5% and 1% levels, respectively.

Contribution analysis
−8
−6
−4
−2
0
2
4
6
8
10
12
% o
f GD
P
CAN CHN DEU FRA GBR ITA JPN USA
Model 2.1
Net foreign assets Relative output per worker Dependency ratio
Population growth Terms of trade Private credit
Fiscal balance Corporate balance Top 1% income share
−8
−6
−4
−2
0
2
4
6
8
10
12
% o
f GD
P
CAN CHN DEU FRA GBR ITA JPN USA
Model 2.4
Net foreign assets Relative output per worker Dependency ratio
Population growth Terms of trade Private credit
Fiscal balance Corporate balance Gini coefficient
Notes: The figures show estimated contributions of the change in the explanatory variables to the change in thecurrent account balance for the period 1980/3-2004/7 or the longest time span for which data are available. Theestimated contributions are based on Model 2.1 and Model 2.4.
Estimated contributions are based on regression results of Table II (POLS, 4-yearnon-overlapping averages, GDP-demeaning, 1972-2007)
Large effects of corporate financial balance and top 1% income share
Smaller effects of Gini coefficient
www.imk-boeckler.de August 2015 20 / 25

Table V: Pooled GLS, annual data, GDP-demeaning, 1972-2007
Regressor (5.1) (5.2) (5.3) (5.4)
L.Net foreign assets (% of GDP) 0.073*** 0.077*** 0.074*** 0.075***(0.010) (0.011) (0.010) (0.010)
L.NFA/Y*(Dummy if NFA/Y < -60%) -0.056*** -0.060*** -0.053*** -0.054***(0.015) (0.016) (0.016) (0.014)
L.Output per worker (rel. to top 3 economies) -5.854*** -5.369*** -5.816*** -8.486***(2.025) (2.075) (2.028) (2.116)
L.Relative output per worker*Capital openness 12.294*** 11.101*** 11.144*** 13.728***(2.813) (2.924) (2.851) (2.849)
Dependency ratio -0.053 -0.075 -0.124** -0.172***(0.061) (0.064) (0.061) (0.061)
Population growth -1.890*** -1.970*** -2.158*** -1.927***(0.370) (0.405) (0.379) (0.366)
Reserve currency status -2.866*** -2.515** -2.295** -2.683***(1.109) (1.133) (1.133) (1.041)
Output gap -0.368*** -0.362*** -0.323*** -0.375***(0.087) (0.089) (0.093) (0.086)
Terms of trade gap*Trade openness 0.004*** 0.004*** 0.005*** 0.004***(0.001) (0.001) (0.001) (0.001)
Private credit (% of GDP) -0.042*** -0.042*** -0.043*** -0.046***(0.008) (0.008) (0.008) (0.007)
L.Fiscal balance (% of GDP) 0.161*** 0.163*** 0.182*** 0.136***(0.049) (0.050) (0.051) (0.049)
L.Corporate balance (% of GDP) 0.196*** 0.195*** 0.202*** 0.163***(0.042) (0.043) (0.043) (0.042)
Personal income inequality -0.141* -0.103** -0.116*** -0.181***(0.074) (0.050) (0.042) (0.040)
Observations 460 452 450 466R-squared 0.484 0.482 0.504 0.510
Notes: Dependent variable is the current account balance in % of GDP. All regressions are estimated by PGLSwith a panel-wide AR(1) correction. Heteroskedasticity-robust standard errors are reported in parantheses. Allregressions include a constant term. L. denotes one year lag. *, ** and *** denotes significance at 10%, 5%and 1% levels, respectively. The top 1%, 5%, 10% income share, Gini coefficient is used as measure of personalincome inequality in Model (5.1)-(5.4), respectively.

Table VI: Pooled GLS, annual data, 1972-2007
Regressor (6.1) (6.2) (6.3) (6.4)
L.Net foreign assets (% of GDP) 0.037*** 0.046*** 0.040*** 0.040***(0.009) (0.008) (0.008) (0.009)
L.NFA/Y*(Dummy if NFA/Y < -60%) -0.004 -0.012 -0.004 -0.006(0.014) (0.014) (0.013) (0.014)
L.Output per worker (rel. to top 3 economies) -9.657*** -8.969*** -8.989*** -9.910***(1.517) (1.503) (1.532) (1.715)
L.Relative output per worker*Capital openness 10.666*** 9.398*** 8.857*** 10.678***(2.148) (2.186) (2.191) (2.226)
Dependency ratio 0.047 0.011 -0.039 0.030(0.057) (0.058) (0.057) (0.060)
Population growth -0.975** -0.762* -1.390*** -1.038**(0.404) (0.397) (0.400) (0.404)
Reserve currency status -1.264 -0.128 -0.404 -0.950(1.064) (1.080) (1.018) (1.023)
Output gap -0.187*** -0.180*** -0.185*** -0.159**(0.071) (0.069) (0.070) (0.071)
Terms of trade gap*Trade openness -0.000 -0.000 -0.000 -0.000(0.001) (0.001) (0.001) (0.001)
Private credit (% of GDP) -0.030*** -0.025*** -0.029*** -0.028***(0.007) (0.006) (0.006) (0.006)
L.Fiscal balance (% of GDP) -0.326*** -0.327*** -0.302*** -0.341***(0.047) (0.047) (0.046) (0.047)
L.Corporate balance (% of GDP) -0.308*** -0.296*** -0.328*** -0.322***(0.042) (0.042) (0.040) (0.041)
Personal income inequality 0.029 -0.047 -0.057 -0.011(0.065) (0.044) (0.037) (0.039)
Observations 463 455 453 469R-squared 0.463 0.454 0.525 0.485
Notes: Dependent variable is the household financial balance in % of GDP. All regressions are estimated byPGLS with a panel-wide AR(1) correction. Heteroskedasticity-robust standard errors are reported in paranthe-ses. All regressions include a constant term. L. denotes one year lag. *, ** and *** denotes significance at10%, 5% and 1% levels, respectively. The top 1%, 5%, 10% income share, Gini coefficient is used as measureof personal income inequality in Model (6.1)-(6.4), respectively.

Table VII: Pooled GLS, annual data, 1972-2007
Regressor (7.1) (7.2) (7.3) (7.4)
L.Net foreign assets (% of GDP) 0.040*** 0.047*** 0.042*** 0.041***(0.009) (0.008) (0.009) (0.009)
L.NFA/Y*(Dummy if NFA/Y < -60%) -0.005 -0.011 -0.004 -0.006(0.014) (0.014) (0.014) (0.014)
L.Output per worker (rel. to top 3 economies) -8.061*** -7.570*** -7.531*** -9.098***(1.486) (1.449) (1.500) (1.758)
L.Relative output per worker*Capital openness 10.070*** 8.634*** 8.168*** 10.771***(2.214) (2.211) (2.237) (2.306)
Dependency ratio -0.016 -0.042 -0.104* -0.039(0.058) (0.057) (0.056) (0.060)
Population growth -1.305*** -0.906** -1.713*** -1.353***(0.431) (0.412) (0.427) (0.436)
Reserve currency status -1.341 -0.165 -0.503 -1.466(1.111) (1.110) (1.059) (1.069)
Output gap -0.180** -0.169** -0.178** -0.160**(0.073) (0.070) (0.073) (0.073)
Terms of trade gap*Trade openness -0.000 -0.000 -0.000 -0.000(0.001) (0.001) (0.001) (0.001)
Private credit (% of GDP) - - - -
L.Fiscal balance (% of GDP) -0.383*** -0.372*** -0.365*** -0.392***(0.044) (0.044) (0.044) (0.044)
L.Corporate balance (% of GDP) -0.336*** -0.313*** -0.357*** -0.349***(0.042) (0.041) (0.041) (0.041)
Personal income inequality -0.080 -0.103** -0.111*** -0.048(0.062) (0.042) (0.035) (0.038)
Observations 464 456 454 470R-squared 0.435 0.437 0.501 0.453
Notes: Dependent variable is the household financial balance in % of GDP. All regressions are estimated byPGLS with a panel-wide AR(1) correction. Heteroskedasticity-robust standard errors are reported in paranthe-ses. All regressions include a constant term. L. denotes one year lag. *, ** and *** denotes significance at10%, 5% and 1% levels, respectively. The top 1%, 5%, 10% income share, Gini coefficient is used as measureof personal income inequality in Model (7.1)-(7.4), respectively.

Table VIII: Pooled GLS, annual data, 1972-2007
Regressor (8.1) (8.2) (8.3) (8.4)
L.Net foreign assets (% of GDP) 0.089*** 0.099*** 0.094*** 0.092***(0.013) (0.013) (0.013) (0.014)
L.NFA/Y*(Dummy if NFA/Y < -60%) -0.083*** -0.088*** -0.085*** -0.087***(0.017) (0.018) (0.018) (0.018)
L.Output per worker (rel. to top 3 economies) -16.839*** -16.140*** -19.684*** -22.070***(2.351) (2.293) (2.641) (3.206)
L.Relative output per worker*Capital openness 22.875*** 20.162*** 24.374*** 26.811***(3.204) (3.171) (3.529) (3.950)
Dependency ratio -0.067 -0.111 -0.121* -0.141*(0.071) (0.071) (0.073) (0.074)
Population growth -0.577 -0.645 -0.840* -0.586(0.451) (0.464) (0.476) (0.464)
Reserve currency status -2.916** -1.976 -2.238* -3.132**(1.280) (1.272) (1.337) (1.341)
Output gap 0.353*** 0.396*** 0.360*** 0.361***(0.069) (0.070) (0.076) (0.068)
Terms of trade gap*Trade openness 0.003*** 0.003*** 0.003*** 0.003***(0.001) (0.001) (0.001) (0.001)
Private credit (% of GDP) -0.018** -0.017** -0.019** -0.021***(0.007) (0.007) (0.008) (0.007)
L.Fiscal balance (% of GDP) 0.305*** 0.321*** 0.331*** 0.296***(0.048) (0.048) (0.052) (0.048)
L.Corporate balance (% of GDP) 0.094** 0.097** 0.085* 0.064(0.045) (0.046) (0.049) (0.046)
Personal income inequality -0.282*** -0.226*** -0.190*** -0.180***(0.084) (0.058) (0.052) (0.056)
Observations 460 452 450 466R-squared 0.729 0.734 0.727 0.724
Notes: Dependent variable is gross saving in % of GDP. All regressions are estimated by PGLS with a panel-wide AR(1) correction. Heteroskedasticity-robust standard errors are reported in parantheses. All regressionsinclude a constant term. L. denotes one year lag. *, ** and *** denotes significance at 10%, 5% and 1%levels, respectively. The top 1%, 5%, 10% income share, Gini coefficient is used as measure of personal incomeinequality in Model (8.1)-(8.4), respectively.

Conclusions
Overview
We analyze potential links between income distribution and current account imbalances
How does rising (top-end) personal income inequality affect household saving andthe current account?
How do shifts in the functional income distribution (profits or corporate income vs.wages or household income) affect the current account?
Main results
An increase in personal income inequality leads to a decrease of the current account,ceteris paribus
The explanatory power of top income shares is significantly higher than that of the Ginicoefficient
Consumers do not fully pierce the corporate veil, i.e. an increase in the corporate financialbalance leads to an increase in the current account balance, ceteris paribus
The joint effects of changes in personal and functional income distribution contribute tothe explanation of the global current account imbalances observed prior to the GreatRecession
www.imk-boeckler.de August 2015 25 / 25

Towards a renaissance of the relative income hypothesis?
The expenditure cascades model (Frank et al., 2010)
Consumption demand of household i, Ci, depends on:
its own income, Yi (+)
the consumption of households with a marginally higher income, Ci+1 (+)
CN = kYN for i = N (3)
Ci = αkYi + (1− α)Ci+1 for i = 1, ...,N − 1; 0 < α < 1 (4)
A rise in top income shares exerts downward pressure on the saving rates of allhouseholds below the top, but α depends on institutions
A rise in the Gini may have little effect on the aggregate saving rate
When firms retain their profits rather than passing them on to top income households,expenditure cascades may be weaker (the “corporate veil”), i.e., corporate governanceinstitutions matter

Towards a renaissance of the relative income hypothesis?
The relative income hypothesis (James Duesenberry, Robert Frank)
Higher (permanent) income inequality can lead to
Lower savingHigher debt(A higher labour supply)
Households build consumption norms by looking at the consumption of other housholdsjust above them in the income distribution as a result of “positional concerns” (R. Frank)
Expenditure cascades?
“Expenditure cascades” can start at the very top and go all the way down the incomedistribution (R. Frank)
Strength of “expenditure cascades” depends on
where the shift in inequality occurs (top-middle-bottom)norms and institutions

A closer look at Germany
Weak demand for credit due to specific nature of inequality
Very strong increase in the Gini coefficient, but no increase of inequality at the very top(OECD, 2008, 2011)
Lower altitude of “expenditure cascades”Strong decline in relative incomes at the bottom, where households are likelyliquidity constraintIncreased middle class fear of status loss due to strongly declining incomes at thebottom (Groh-Samberg, 2009)
Weak demand for credit due to institutions/norms
Specific German production and economic policy model reinforces fear of status loss andprecautionary saving motive in a context of rising inequality
Firm-specific human capital and low female participation lead to higher risk ofstatus loss in case of (male) unemployment (Carlin and Soskice, 2008)Pension and labour market reforms of 2000s have increased income uncertainty(Deutsche Bundesbank, 2007)No help to be expected from fiscal and monetary policy in case of unemployment(Hein and Truger, 2007; Fitoussi and Stiglitz, 2009)

Personal and functional income distribution
A mechanical look at the ”determinants” of private consumption
CY
= (1− s) ∗YHH
Y(5)
62
64
66
68
70
72
74
76
78
80
1980 1985 1990 1995 2000 2005 2010
Household disposable income as % of national disposable incomePrivate consumption in % of GDP
Source: AMECO Database
United States
52
54
56
58
60
62
Priv
ate
cons
umpt
ion
63
65
67
69
71
73
Dis
posa
ble
inco
me
1980 1985 1990 1995 2000 2005 2010
Household disposable income as % of national disposable incomePrivate consumption in % of GDP
Source: AMECO Database
Germany
Source: AMECO Database, own calculations
United States: Increase in C/Y ”due to” decline in s, with YHH/Y constant
Germany: Decrease in C/Y mainly ”due to” decrease in YHH/Y, and to a lesser extent toincrease in s

Personal and functional income distribution
Two types of income inequality and corporate behaviour
In the United States, firms have payed rising and extremely high salaries to the new”working rich” (since the early 1980s)
→ The ”wage share” has remained roughly constant
→ Top-end personal income inequality has skyrocketted
In Germany, firms have accumulated financial assets with their retained profits (duringthe 1980s and 2000s)
→ The ”wage share” has fallen dramatically
→ Top-end personal income inequality has not increased very much

Illustration for the G7 countries - Canada
Top income shares, CAN, 1972-2007
−10
−5
0
5
10
15
20
Hou
seho
ld fi
nanc
ial b
alan
ce0
5
10
15
20
25
30
35
Inco
me
shar
e
1972 1977 1982 1987 1992 1997 2002 2007
Top 1% income share Top 5% income shareHousehold financial balance in % of GDP
Source: The World Top Incomes Database, AMECO Database
Canada
Wage share, CAN, 1972-2007
−15
−10
−5
0
5
10
Cor
pora
te fi
nanc
ial b
alan
ce
45
50
55
60
65
70
75
Priv
ate
wag
e sh
are
1972 1977 1982 1987 1992 1997 2002 2007
Private wage share as % of GDPCorporate financial balance in % of GDP
Source: AMECO Database
Canada
Source: The World Top Incomes Database and AMECO Database, own calculations
Rising top income shares and declining household financial balance since early 1980s
Slightly falling wage share and slightly improving corporate financial balance since early1980s

Illustration for the G7 countries - France
Top income shares, FRA, 1972-2007
−10
−5
0
5
10
15
20
Hou
seho
ld fi
nanc
ial b
alan
ce0
5
10
15
20
25
30
35
Inco
me
shar
e
1972 1977 1982 1987 1992 1997 2002 2007
Top 1% income share Top 5% income shareHousehold financial balance in % of GDP
Source: The World Top Incomes Database, AMECO Database
France
Wage share, FRA, 1972-2007
−15
−10
−5
0
5
10
Cor
pora
te fi
nanc
ial b
alan
ce
45
50
55
60
65
70
75
Priv
ate
wag
e sh
are
1972 1977 1982 1987 1992 1997 2002 2007
Private wage share as % of GDPCorporate financial balance in % of GDP
Source: AMECO Database
France
Source: The World Top Incomes Database and AMECO Database, own calculations
Constant top income shares and constant household financial balance since 1970
Strongly falling wage share and strongly improving corporate financial balance since early1980s

Illustration for the G7 countries - Germany
Top income shares, DEU, 1972-2007
−10
−5
0
5
10
15
20
Hou
seho
ld fi
nanc
ial b
alan
ce0
5
10
15
20
25
30
35
Inco
me
shar
e
1972 1977 1982 1987 1992 1997 2002 2007
Top 1% income share Top 5% income shareHousehold financial balance in % of GDP
Source: The World Top Incomes Database, AMECO Database
Germany
Wage share, DEU, 1972-2007
−15
−10
−5
0
5
10
Cor
pora
te fi
nanc
ial b
alan
ce
45
50
55
60
65
70
75
Priv
ate
wag
e sh
are
1972 1977 1982 1987 1992 1997 2002 2007
Private wage share as % of GDPCorporate financial balance in % of GDP
Source: AMECO Database
Germany
Source: The World Top Incomes Database and AMECO Database, own calculations
Constant top income shares and constant household financial balance since 1980
Strongly falling wage share and strongly improving corporate financial balance since early1980s

Illustration for the G7 countries - Italy
Top income shares, ITA, 1975-2007
−10
−5
0
5
10
15
20
Hou
seho
ld fi
nanc
ial b
alan
ce0
5
10
15
20
25
30
35
Inco
me
shar
e
1972 1977 1982 1987 1992 1997 2002 2007
Top 1% income share Top 5% income shareHousehold financial balance in % of GDP
Source: The World Top Incomes Database, AMECO Database
Italy
Wage share, ITA, 1972-2007
−15
−10
−5
0
5
10
Cor
pora
te fi
nanc
ial b
alan
ce
45
50
55
60
65
70
75
Priv
ate
wag
e sh
are
1972 1977 1982 1987 1992 1997 2002 2007
Private wage share as % of GDPCorporate financial balance in % of GDP
Source: AMECO Database
Italy
Source: The World Top Incomes Database and AMECO Database, own calculations
Rising top income shares and declining household financial balance since mid-1980s
Strongly falling wage share and strongly improving corporate financial balance since early1980s

Illustration for the G7 countries - Japan
Top income shares, JPN, 1972-2007
−10
−5
0
5
10
15
20
Hou
seho
ld fi
nanc
ial b
alan
ce0
5
10
15
20
25
30
35
Inco
me
shar
e
1972 1977 1982 1987 1992 1997 2002 2007
Top 1% income share Top 5% income shareHousehold financial balance in % of GDP
Source: The World Top Incomes Database, AMECO Database
Japan
Wage share, JPN, 1972-2007
−15
−10
−5
0
5
10
Cor
pora
te fi
nanc
ial b
alan
ce
45
50
55
60
65
70
75
Priv
ate
wag
e sh
are
1972 1977 1982 1987 1992 1997 2002 2007
Private wage share as % of GDPCorporate financial balance in % of GDP
Source: AMECO Database
Japan
Source: The World Top Incomes Database and AMECO Database, own calculations
Rising top income shares and declining household financial balance since early 1990s
Strongly falling wage share and strongly improving corporate financial balance since early1980s

Illustration for the G7 countries - United Kingdom
Top income shares, GBR, 1972-2007
−10
−5
0
5
10
15
20
Hou
seho
ld fi
nanc
ial b
alan
ce0
5
10
15
20
25
30
35
Inco
me
shar
e
1972 1977 1982 1987 1992 1997 2002 2007
Top 1% income share Top 5% income shareHousehold financial balance in % of GDP
Source: The World Top Incomes Database, AMECO Database
United Kingdom
Wage share, GBR, 1972-2007
−15
−10
−5
0
5
10
Cor
pora
te fi
nanc
ial b
alan
ce
45
50
55
60
65
70
75
Priv
ate
wag
e sh
are
1972 1977 1982 1987 1992 1997 2002 2007
Private wage share as % of GDPCorporate financial balance in % of GDP
Source: AMECO Database
United Kingdom
Source: The World Top Incomes Database and AMECO Database, own calculations
Rising top income shares and declining household financial balance since 1990s
Fluctuating wage share and negative correlation with corporate financial balance sincemid-1980s

Illustration for the G7 countries - United States
Top income shares, USA, 1972-2007
−10
−5
0
5
10
15
20
Hou
seho
ld fi
nanc
ial b
alan
ce0
5
10
15
20
25
30
35
Inco
me
shar
e
1972 1977 1982 1987 1992 1997 2002 2007
Top 1% income share Top 5% income shareHousehold financial balance in % of GDP
Source: The World Top Incomes Database, AMECO Database
United States
Wage share, USA, 1972-2007
−15
−10
−5
0
5
10
Cor
pora
te fi
nanc
ial b
alan
ce
45
50
55
60
65
70
75
Priv
ate
wag
e sh
are
1972 1977 1982 1987 1992 1997 2002 2007
Private wage share as % of GDPCorporate financial balance in % of GDP
Source: AMECO Database
United States
Source: The World Top Incomes Database and AMECO Database, own calculations
Rising top income shares and declining household financial balance since early 1980s
Slightly falling wage share and slightly improving corporate financial balance since early1980s

Contribution analysis
−8
−6
−4
−2
0
2
4
6
8
10
% o
f GD
P
1972−75 1976−79 1980−83 1984−87 1988−91 1992−95 1996−99 2000−03 2004−07
United States
Net foreign assets Relative output per worker Dependency ratio
Population growth Terms of trade Private credit
Fiscal balance Corporate balance Top 1% income share
−8
−6
−4
−2
0
2
4
6
8
10
% o
f GD
P
1980−83 1984−87 1988−91 1992−95 1996−99 2000−03 2004−07
Germany
Net foreign assets Relative output per worker Dependency ratio
Population growth Terms of trade Private credit
Fiscal balance Corporate balance Top 1% income share
Notes: The figures show estimated contributions of the explanatory variables to the current account balance for theperiod 1972/5-2004/7 or the longest time span for which data are available. The estimated contributions are basedon Model 2.1.
Estimated contributions are based on regression results of Table II (POLS, 4-yearnon-overlapping averages, GDP-demeaning, 1972-2007)
United States: Large effects of top 1% income share since the 1980s
Germany: Large effect of the corporate financial balance in the 2000s
www.imk-boeckler.de August 2015 38 / 25