inclusive tourism canadian study
Post on 21-Oct-2014
1.222 views
DESCRIPTION
North American travleers with disabilitiesTRANSCRIPT
A profile of travellers looking for
accessible travel destinations
An Overview of North American Travellers based on the 2006 Travel Activities and Motivations Survey (TAMS)
July 2007
Ministry of Tourism
Tourism Research Unit
TABLE OF CONTENTS EXECUTIVE SUMMARY.....................................................................................................2
INTRODUCTION...............................................................................................................5
How many travellers are looking for accessible travel? .................................................6
How frequently are they travelling? ...............................................................................7
Where are they travelling?..............................................................................................7 Canadian travellers ..............................................................................................................8 American travellers ..............................................................................................................8
What activities is this segment participating in?............................................................9 Most Popular Activities .........................................................................................................9 Differences between the segments .....................................................................................11
What activities are trip motivators for this segment? ..................................................13 Canadian Travellers............................................................................................................13 American Travellers ...........................................................................................................15
Is this segment interested in camping?........................................................................17
Does this segment participate in tours? .......................................................................18
What are the benefits sought from travel by this segment? ........................................19
What other considerations are important to this segment when they choose a travel destination? ........................................................................................................20
What are the demographics of the segment looking for accessible travel destinations? .................................................................................................................22
APPENDIX: DETAILED REVIEW OF ACTIVITY CATEGORIES .........................................23 Water-based Outdoor Activities .......................................................................................23 Winter Outdoor Activities ................................................................................................24 Land-based Outdoor Activities.........................................................................................25 Team Sport-related Activities ..........................................................................................27 Aboriginal Experiences & Activities ..................................................................................28 Performing Arts..............................................................................................................29 Festivals and Events .......................................................................................................30 Theme and Amusement Parks.........................................................................................31 Exhibits, Architecture, Historic Sites/Buildings and Museums.............................................32 Hands-on Learning Activities ...........................................................................................33 Spectator Sports/Competitions ........................................................................................34 Air-based Activities .........................................................................................................35 Other Recreational Activities ...........................................................................................35 Shopping, Dining & Food-related Activities.......................................................................36 Accommodation-related Activities ....................................................................................37

2
EXECUTIVE SUMMARY This report is based on the 2006 Travel Activities and Motivations Survey. In the survey, respondents were asked to indicate the importance (highly important, somewhat important or not at all important) of a destination being disabled-person-friendly in choosing a destination for an out-of-town pleasure or vacation trip. In Canada, there were 1.2 million travellers (or 5.9% of all Canadian travellers) who indicated that an accessible travel destination was highly important to them when choosing a destination for an out-of-town pleasure or vacation trip. Another 3.2 million Canadian travellers (or 15.5%) indicated that this consideration was somewhat important to them in choosing their travel destination. In the U.S., 16.1 million travellers (or 9.2% of all American travellers) indicated that an accessible travel destination was highly important to them when choosing a destination while another 32.5 million (or 18.4%) indicated it was somewhat important to them. On average, Canadian and American travellers looking for accessible destinations are taking slightly fewer trips than other travellers. The incidence of travel by those looking for accessible destinations is similar or a little lower than other travellers to destinations within their home country, but noticeably lower than other travellers outside of North America Travellers who are looking for accessible travel destinations participate in a wide variety of activities while travelling, and though their participation rates are notably lower in some instances (e.g. hiking and skiing), they have similar or higher participation rates in almost half of the activities included in the survey. There is, however, notable consistency among the most popular activities reported by travellers who are looking for accessible destinations and other travellers. In fact, of the top 25 activities listed by Canadian travellers who are looking for accessible destinations, only 4 do not factor on the list of top 25 activities of other Canadian travellers, while of the top 25 activities listed by American travellers who are looking for accessible destinations, only 3 are not on the list of top 25 activities of other American travellers. There are a number of individual activities which are noticeably more or less popular among travellers looking for accessible travel destinations compared to other travellers. Canadian travellers looking for accessible travel destinations: Have higher incidences than other travellers of attending horse races and
competitions; attending aboriginal festivals; playing team sports like football and bowling; and participating in amateur tournaments and competitions other than sports
Are much less likely than other travellers, however, to participate in active outdoor pursuits such as ocean snorkelling, ocean or freshwater kayaking/canoeing, hiking and skiing
3
American travellers looking for accessible travel destinations: Have much higher incidences than other travellers of attending comedy festivals;
attending aboriginal festivals and outdoor adventure/sports activities; and going to the circus
Are much less likely than other travellers, however, to participate in active outdoor pursuits such as skiing, ocean snorkelling, freshwater kayaking/canoeing, hiking and golfing
Travellers looking for accessible travel destinations reported many of the same trip motivators as did other travellers. Whereas there were similarities in terms of ‘traditional’ vacation trip activities such as visiting historic sites, natural wonders and nature parks, camping and going to amusement parks and casinos, there were also a number of trip motivators which emerged as notably more or less important among travellers looking for accessible travel destinations. Looking at the 25 most popular activities which acted as trip motivators, Canadian travellers looking for accessible travel destinations: Reported shopping for clothes/shoes/jewellery, sunbathing/ sitting on a beach and
fresh water fishing as their top three activities which were trip motivator Mentioned the following activities more frequently than other travellers shopping for
clothes/shoes/ jewellery, visiting amusement parks, going to casinos, eating at local restaurants, going to the zoo, seeing live theatre and staying at private campgrounds
Mentioned the following activities less frequently than other travellers sunbathing, swimming in oceans and strolling around a city to observe buildings and architecture
Looking at the 25 most popular activities which acted as trip motivators, American travellers looking for accessible travel destinations: Reported visiting amusement parks, going to casinos and eating in local restaurants
as their top three activities which were trip motivators Mentioned the following activities more frequently than other travellers going to
casinos, eating at local restaurants, shopping for clothes/shoes/ jewellery, fresh water fishing and visiting aquariums and zoos
Mentioned the following activities less frequently than other travellers sunbathing / sitting on a beach or swimming in the ocean
Travellers looking for accessible travel destinations appear to seek a greater number of benefits from their travel experiences than do other travellers. Their incidence of rating benefits as highly important was higher than other travellers for each of the benefits presented in the survey, except for ‘Taking a break from the day-to-day environment’ – where their incidence of rating it as highly important was just slightly lower than other travellers. The four most frequently mentioned benefits sought – to relax and relieve stress, enrich relationship with spouse/children, take a break from the day-to-day environment and create lasting memories were constant among travellers looking for accessible travel destinations and other travellers in both the Canadian and American markets.

4
The top benefits which were noticeably more important to travellers looking for accessible travel destinations than other travellers were:
To have stories to share back at home or something interesting to talk about To be challenged physically / to feel physically energized To be pampered To stimulate the mind/ / be intellectually challenged
Travellers looking for accessible travel destinations appear to consider a greater number of factors in their choice of travel destinations than do other travellers. Their incidence of rating each of the considerations listed on the survey as highly important was markedly higher than other travellers in all cases, except for ‘Availability of mid range accommodation’ – where their incidence of rating it as highly important was only marginally higher than other travellers. Travellers looking for accessible travel destinations and other travellers share the same four top considerations when choosing a travel destination – feeling safe at the destination, no health concerns at the destination, convenient access by car and lots of things for adults to see and do. These four considerations were consistent for travellers in both the Canadian and American markets, though more American travellers – both those looking for accessible travel destinations and others – rated ‘Convenient access by car’ as highly important than ‘No health concerns at the destination’. The top considerations which were noticeably more important to Canadian travellers looking for accessible travel destinations than other Canadian travellers were:
Being familiar with the culture and language of the destination Convenient access by train/bus Lots of things for children to see and do Having friends and family who live there
Meanwhile, American travellers looking for accessible travel destinations differed somewhat from their Canadian counterparts in terms of considerations which were more important to them than other travellers:
Convenient access by train/bus Being at a place that is very different , culturally, than yours Having friends and family who live there Great shopping opportunities
Finally, in looking at the demographic profiles of Canadian and American travellers looking for accessible travel destinations, it can be seen that the segment is generally older than other travellers, less likely to have children under 18 living at home, has lower levels of education and has lower household incomes than other travellers.
5
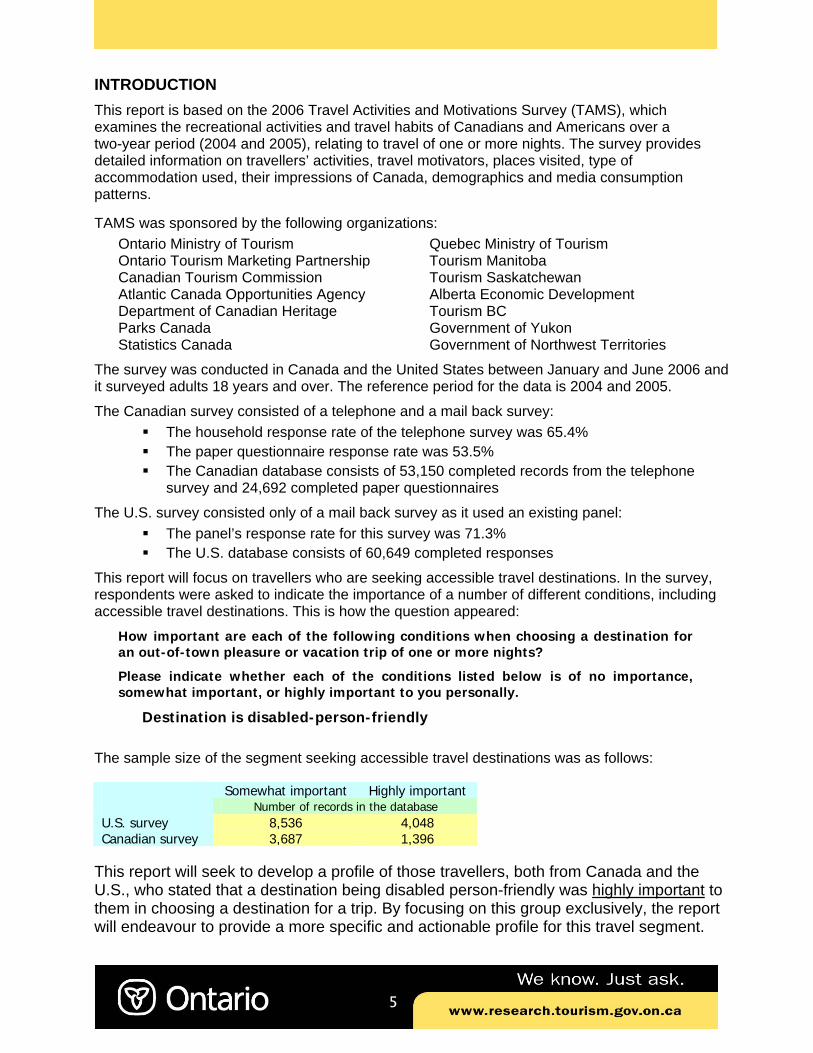
INTRODUCTION This report is based on the 2006 Travel Activities and Motivations Survey (TAMS), which examines the recreational activities and travel habits of Canadians and Americans over a two-year period (2004 and 2005), relating to travel of one or more nights. The survey provides detailed information on travellers’ activities, travel motivators, places visited, type of accommodation used, their impressions of Canada, demographics and media consumption patterns.
TAMS was sponsored by the following organizations: Ontario Ministry of Tourism Quebec Ministry of Tourism Ontario Tourism Marketing Partnership Tourism Manitoba Canadian Tourism Commission Tourism Saskatchewan Atlantic Canada Opportunities Agency Alberta Economic Development Department of Canadian Heritage Tourism BC Parks Canada Government of Yukon Statistics Canada Government of Northwest Territories
The survey was conducted in Canada and the United States between January and June 2006 and it surveyed adults 18 years and over. The reference period for the data is 2004 and 2005.
The Canadian survey consisted of a telephone and a mail back survey: The household response rate of the telephone survey was 65.4% The paper questionnaire response rate was 53.5% The Canadian database consists of 53,150 completed records from the telephone
survey and 24,692 completed paper questionnaires
The U.S. survey consisted only of a mail back survey as it used an existing panel: The panel’s response rate for this survey was 71.3% The U.S. database consists of 60,649 completed responses
This report will focus on travellers who are seeking accessible travel destinations. In the survey, respondents were asked to indicate the importance of a number of different conditions, including accessible travel destinations. This is how the question appeared:
How important are each of the following conditions when choosing a destination for an out-of-town pleasure or vacation trip of one or more nights?
Please indicate whether each of the conditions listed below is of no importance, somewhat important, or highly important to you personally.
Destination is disabled-person-friendly
The sample size of the segment seeking accessible travel destinations was as follows:
Somewhat important Highly important Number of records in the database U.S. survey 8,536 4,048 Canadian survey 3,687 1,396
This report will seek to develop a profile of those travellers, both from Canada and the U.S., who stated that a destination being disabled person-friendly was highly important to them in choosing a destination for a trip. By focusing on this group exclusively, the report will endeavour to provide a more specific and actionable profile for this travel segment.
6
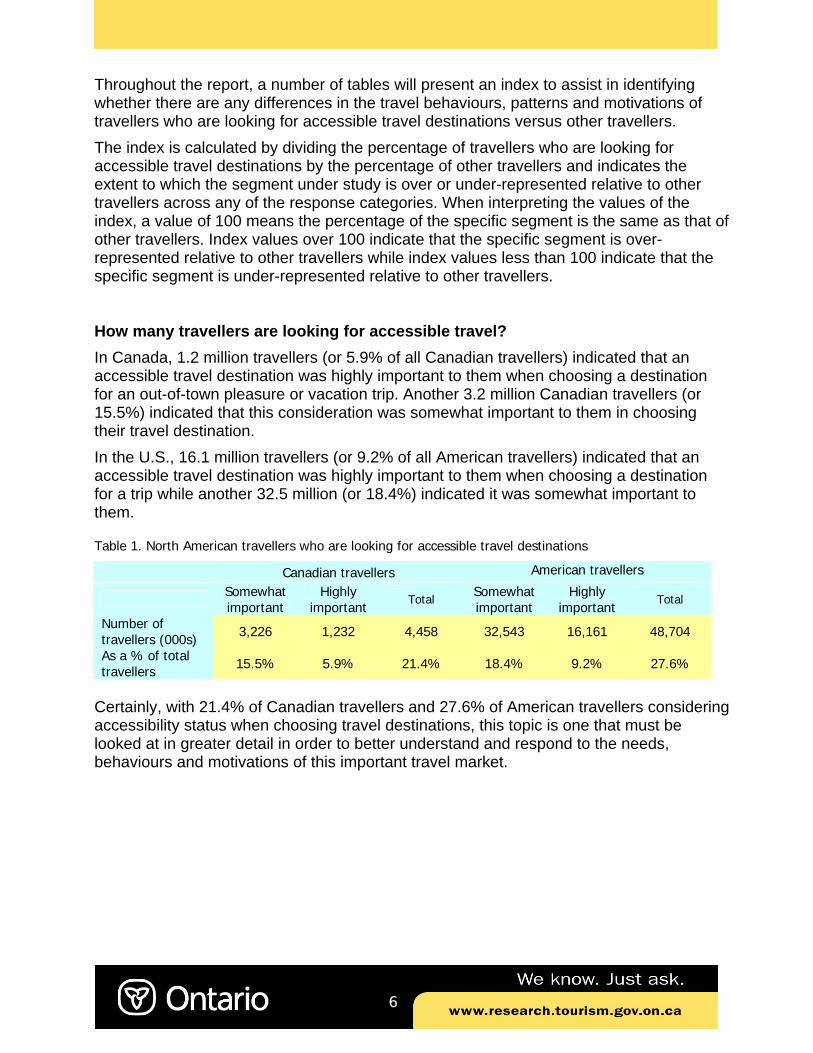
Throughout the report, a number of tables will present an index to assist in identifying whether there are any differences in the travel behaviours, patterns and motivations of travellers who are looking for accessible travel destinations versus other travellers. The index is calculated by dividing the percentage of travellers who are looking for accessible travel destinations by the percentage of other travellers and indicates the extent to which the segment under study is over or under-represented relative to other travellers across any of the response categories. When interpreting the values of the index, a value of 100 means the percentage of the specific segment is the same as that of other travellers. Index values over 100 indicate that the specific segment is over-represented relative to other travellers while index values less than 100 indicate that the specific segment is under-represented relative to other travellers. How many travellers are looking for accessible travel? In Canada, 1.2 million travellers (or 5.9% of all Canadian travellers) indicated that an accessible travel destination was highly important to them when choosing a destination for an out-of-town pleasure or vacation trip. Another 3.2 million Canadian travellers (or 15.5%) indicated that this consideration was somewhat important to them in choosing their travel destination. In the U.S., 16.1 million travellers (or 9.2% of all American travellers) indicated that an accessible travel destination was highly important to them when choosing a destination for a trip while another 32.5 million (or 18.4%) indicated it was somewhat important to them.
Table 1. North American travellers who are looking for accessible travel destinations
Canadian travellers American travellers
Somewhat important
Highly important
Total Somewhat important
Highly important
Total
Number of travellers (000s) 3,226 1,232 4,458 32,543 16,161 48,704
As a % of total travellers 15.5% 5.9% 21.4% 18.4% 9.2% 27.6%
Certainly, with 21.4% of Canadian travellers and 27.6% of American travellers considering accessibility status when choosing travel destinations, this topic is one that must be looked at in greater detail in order to better understand and respond to the needs, behaviours and motivations of this important travel market.
7
How frequently are they travelling? Canadian travellers looking for accessible travel destinations took an average of 3.3 trips1 during the two-year period covered in the survey, slightly fewer than the 3.7 trips reported by other Canadian travellers. The situation was similar for American travellers, with those looking for accessible travel destinations taking an average of 3.2 trips compared to other American travellers who took an average of 3.6 trips.
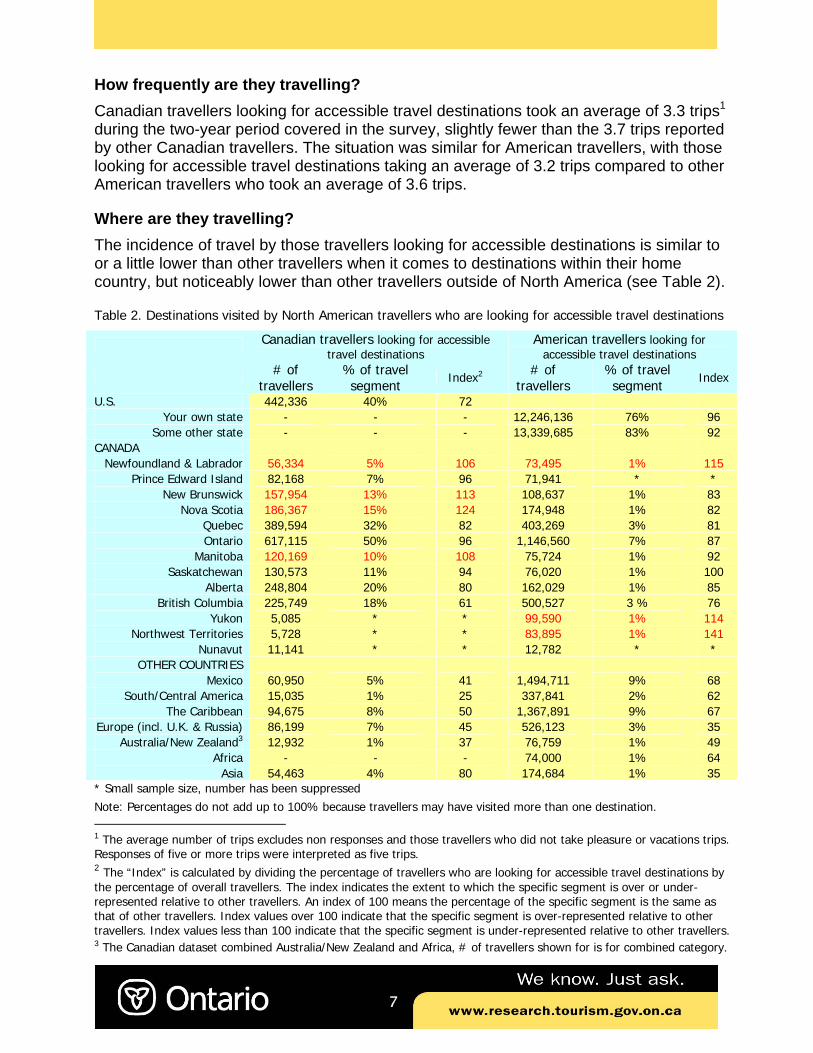
Where are they travelling? The incidence of travel by those travellers looking for accessible destinations is similar to or a little lower than other travellers when it comes to destinations within their home country, but noticeably lower than other travellers outside of North America (see Table 2).
Table 2. Destinations visited by North American travellers who are looking for accessible travel destinations
Canadian travellers looking for accessible travel destinations
American travellers looking for accessible travel destinations
# of travellers
% of travel segment
Index2 # of travellers
% of travel segment
Index
U.S. 442,336 40% 72 Your own state - - - 12,246,136 76% 96
Some other state - - - 13,339,685 83% 92 CANADA
Newfoundland & Labrador 56,334 5% 106 73,495 1% 115 Prince Edward Island 82,168 7% 96 71,941 * *
New Brunswick 157,954 13% 113 108,637 1% 83 Nova Scotia 186,367 15% 124 174,948 1% 82
Quebec 389,594 32% 82 403,269 3% 81 Ontario 617,115 50% 96 1,146,560 7% 87
Manitoba 120,169 10% 108 75,724 1% 92 Saskatchewan 130,573 11% 94 76,020 1% 100
Alberta 248,804 20% 80 162,029 1% 85 British Columbia 225,749 18% 61 500,527 3 % 76
Yukon 5,085 * * 99,590 1% 114 Northwest Territories 5,728 * * 83,895 1% 141
Nunavut 11,141 * * 12,782 * * OTHER COUNTRIES
Mexico 60,950 5% 41 1,494,711 9% 68 South/Central America 15,035 1% 25 337,841 2% 62
The Caribbean 94,675 8% 50 1,367,891 9% 67 Europe (incl. U.K. & Russia) 86,199 7% 45 526,123 3% 35
Australia/New Zealand3 12,932 1% 37 76,759 1% 49 Africa - - - 74,000 1% 64
Asia 54,463 4% 80 174,684 1% 35 * Small sample size, number has been suppressed Note: Percentages do not add up to 100% because travellers may have visited more than one destination. 1 The average number of trips excludes non responses and those travellers who did not take pleasure or vacations trips. Responses of five or more trips were interpreted as five trips. 2 The “Index” is calculated by dividing the percentage of travellers who are looking for accessible travel destinations by the percentage of overall travellers. The index indicates the extent to which the specific segment is over or under-represented relative to other travellers. An index of 100 means the percentage of the specific segment is the same as that of other travellers. Index values over 100 indicate that the specific segment is over-represented relative to other travellers. Index values less than 100 indicate that the specific segment is under-represented relative to other travellers. 3 The Canadian dataset combined Australia/New Zealand and Africa, # of travellers shown for is for combined category.
8
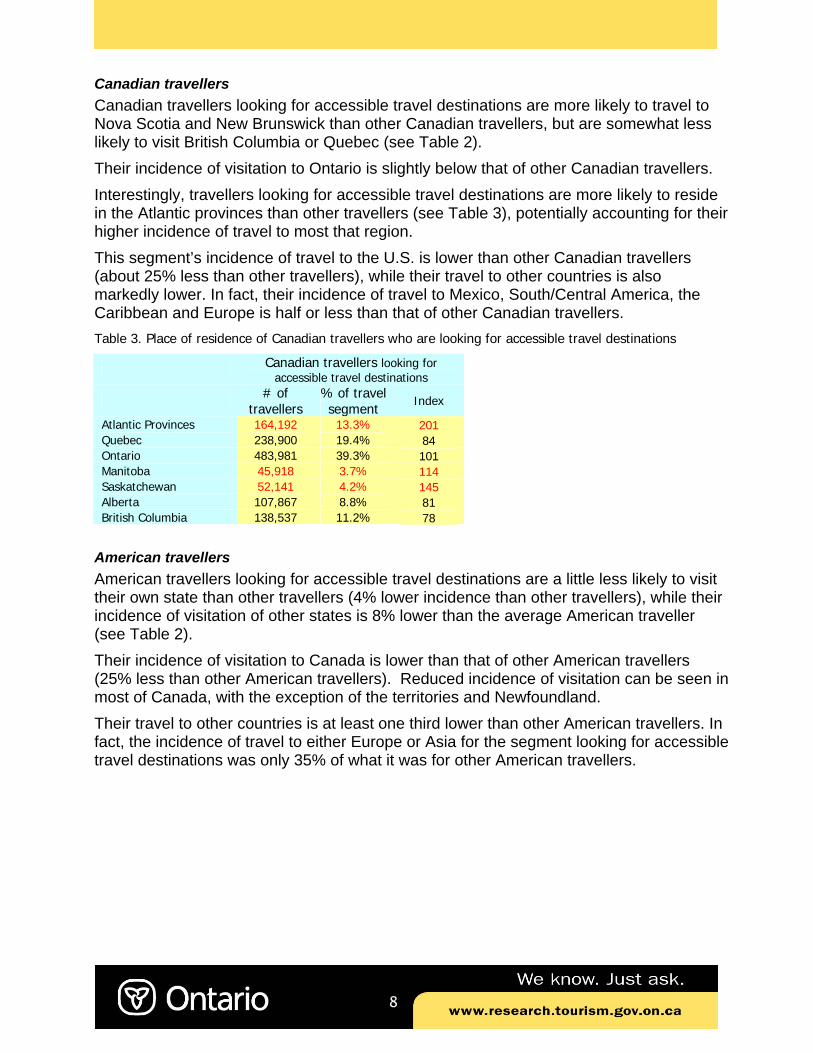
Canadian travellers Canadian travellers looking for accessible travel destinations are more likely to travel to Nova Scotia and New Brunswick than other Canadian travellers, but are somewhat less likely to visit British Columbia or Quebec (see Table 2). Their incidence of visitation to Ontario is slightly below that of other Canadian travellers. Interestingly, travellers looking for accessible travel destinations are more likely to reside in the Atlantic provinces than other travellers (see Table 3), potentially accounting for their higher incidence of travel to most that region. This segment’s incidence of travel to the U.S. is lower than other Canadian travellers (about 25% less than other travellers), while their travel to other countries is also markedly lower. In fact, their incidence of travel to Mexico, South/Central America, the Caribbean and Europe is half or less than that of other Canadian travellers. Table 3. Place of residence of Canadian travellers who are looking for accessible travel destinations
Canadian travellers looking for accessible travel destinations
# of travellers
% of travel segment
Index
Atlantic Provinces 164,192 13.3% 201 Quebec 238,900 19.4% 84 Ontario 483,981 39.3% 101 Manitoba 45,918 3.7% 114 Saskatchewan 52,141 4.2% 145 Alberta 107,867 8.8% 81 British Columbia 138,537 11.2% 78
American travellers American travellers looking for accessible travel destinations are a little less likely to visit their own state than other travellers (4% lower incidence than other travellers), while their incidence of visitation of other states is 8% lower than the average American traveller (see Table 2). Their incidence of visitation to Canada is lower than that of other American travellers (25% less than other American travellers). Reduced incidence of visitation can be seen in most of Canada, with the exception of the territories and Newfoundland. Their travel to other countries is at least one third lower than other American travellers. In fact, the incidence of travel to either Europe or Asia for the segment looking for accessible travel destinations was only 35% of what it was for other American travellers.

9
What activities is this segment participating in? Travellers who are looking for accessible travel destinations participate in a wide variety of activities while travelling, and though their participation rates are notably lower in some instances (e.g. hiking and skiing), they are similar or higher in almost half of the activities included in the survey.
Most Popular Activities There is notable consistency among the most popular activities when comparing travellers who are looking for accessible destinations with other travellers. In fact, of the top 10 activities reported by Canadian travellers looking for accessible travel destinations, 8 are also on the top 10 list of other travellers (see Table 4). Among the top 25 activities listed by travellers looking for accessible destinations, only 4 do not factor on the top 25 activities list of other Canadian travellers. Table 4. Comparison of top 25 activities for Canadian travellers who are looking for accessible travel destinations vs. other Canadian travellers
Canadian travellers looking for accessible travel destinations Other Canadian travellers
Top 25 activities: Rank % who participated Index Rank % who
participated
Shop/browse – clothing, shoes, jewellery 1 55% 95 2 58% Restaurants - local ingredients/recipes 2 51% 88 1 58% Shop/browse – bookstores or music stores 3 36% 85 3 42% Went to local outdoor cafes 4 31% 78 6 40% Shop local arts-crafts studio/exhibition 5 29% 76 7 38% Went to casino(s) 6 29% 113 15 25% Strolled around a city observe its buildings and architecture 7 28% 68 4 42%
Went to the movies/cinema 8 27% 95 12 28% Swimming in lakes 9 26% 73 8 36% Sunbathing/sitting on beach 10 25% 59 5 41% Shop/browse – antiques 11 24% 100 19 24% Farmers' markets or country fairs 12 23% 116 25 20% Visited amusement parks 13 23% 104 22 22% Nature park 14 22% 73 9 31% Visited known historic sites/ buildings 15 21% 71 10 30% Stayed at public campground park 16 21% 80 14 26% Shop/browse – greenhouse/garden centre 17 21% 123 35 17% Visited museum- general history/heritage 18 19% 80 20 24% Fishing - fresh water 19 18% 87 23 21% Dining in other high-end restaurants 20 18% 63 13 28% Stayed at private campground 21 18% 93 27 19% Visited zoos 22 17% 103 34 17% Stayed in lakeside/riverside resort 23 17% 76 21 23% Visited well known natural 'wonders' 24 17% 70 18 9% Attended fireworks displays 25 17% 106 37 6%
10
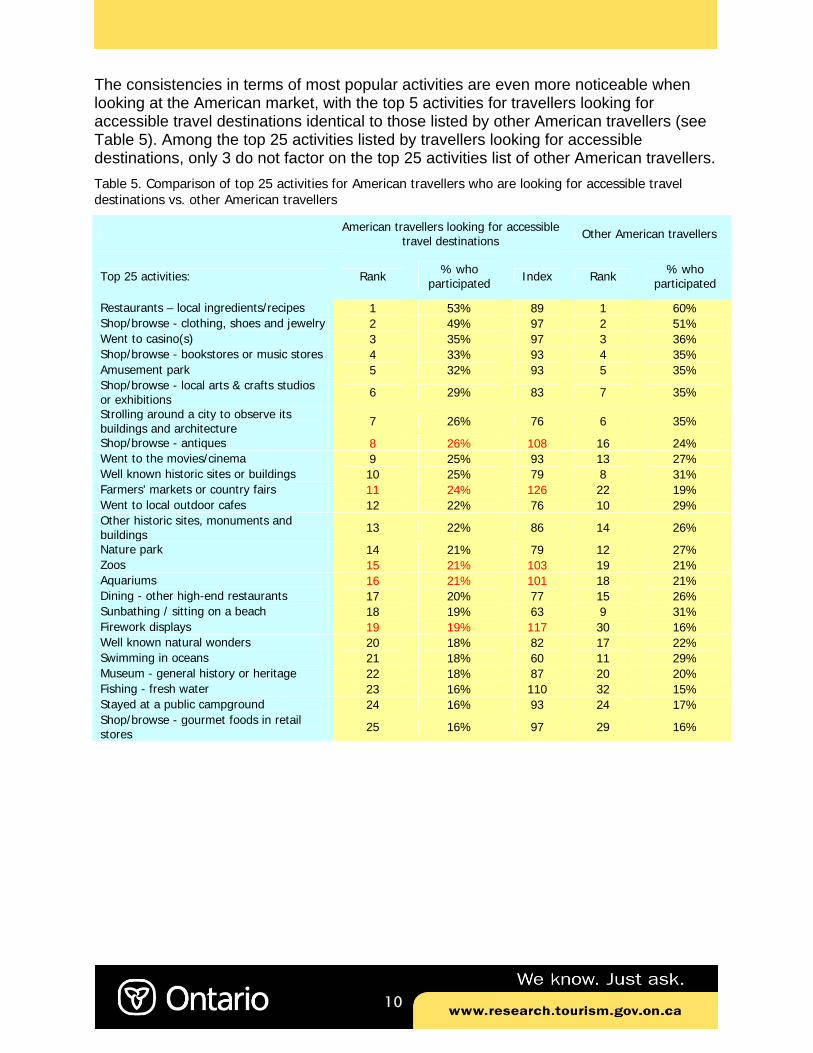
The consistencies in terms of most popular activities are even more noticeable when looking at the American market, with the top 5 activities for travellers looking for accessible travel destinations identical to those listed by other American travellers (see Table 5). Among the top 25 activities listed by travellers looking for accessible destinations, only 3 do not factor on the top 25 activities list of other American travellers. Table 5. Comparison of top 25 activities for American travellers who are looking for accessible travel destinations vs. other American travellers
American travellers looking for accessible travel destinations Other American travellers
Top 25 activities: Rank % who participated Index Rank % who
participated
Restaurants – local ingredients/recipes 1 53% 89 1 60% Shop/browse - clothing, shoes and jewelry 2 49% 97 2 51% Went to casino(s) 3 35% 97 3 36% Shop/browse - bookstores or music stores 4 33% 93 4 35% Amusement park 5 32% 93 5 35% Shop/browse - local arts & crafts studios or exhibitions 6 29% 83 7 35%
Strolling around a city to observe its buildings and architecture 7 26% 76 6 35%
Shop/browse - antiques 8 26% 108 16 24% Went to the movies/cinema 9 25% 93 13 27% Well known historic sites or buildings 10 25% 79 8 31% Farmers' markets or country fairs 11 24% 126 22 19% Went to local outdoor cafes 12 22% 76 10 29% Other historic sites, monuments and buildings 13 22% 86 14 26%
Nature park 14 21% 79 12 27% Zoos 15 21% 103 19 21% Aquariums 16 21% 101 18 21% Dining - other high-end restaurants 17 20% 77 15 26% Sunbathing / sitting on a beach 18 19% 63 9 31% Firework displays 19 19% 117 30 16% Well known natural wonders 20 18% 82 17 22% Swimming in oceans 21 18% 60 11 29% Museum - general history or heritage 22 18% 87 20 20% Fishing - fresh water 23 16% 110 32 15% Stayed at a public campground 24 16% 93 24 17% Shop/browse - gourmet foods in retail stores 25 16% 97 29 16%
11
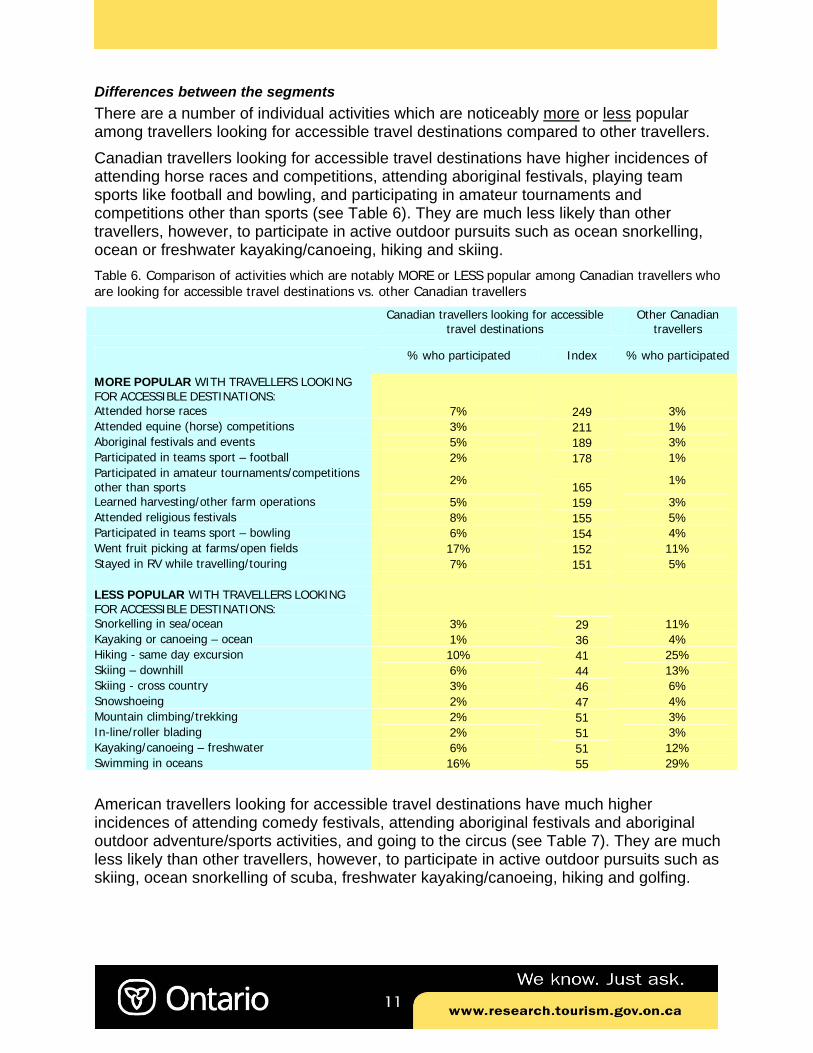
Differences between the segments There are a number of individual activities which are noticeably more or less popular among travellers looking for accessible travel destinations compared to other travellers. Canadian travellers looking for accessible travel destinations have higher incidences of attending horse races and competitions, attending aboriginal festivals, playing team sports like football and bowling, and participating in amateur tournaments and competitions other than sports (see Table 6). They are much less likely than other travellers, however, to participate in active outdoor pursuits such as ocean snorkelling, ocean or freshwater kayaking/canoeing, hiking and skiing. Table 6. Comparison of activities which are notably MORE or LESS popular among Canadian travellers who are looking for accessible travel destinations vs. other Canadian travellers
Canadian travellers looking for accessible travel destinations
Other Canadian travellers
% who participated Index % who participated
MORE POPULAR WITH TRAVELLERS LOOKING FOR ACCESSIBLE DESTINATIONS:
Attended horse races 7% 249 3% Attended equine (horse) competitions 3% 211 1% Aboriginal festivals and events 5% 189 3% Participated in teams sport – football 2% 178 1% Participated in amateur tournaments/competitions other than sports 2% 165 1%
Learned harvesting/other farm operations 5% 159 3% Attended religious festivals 8% 155 5% Participated in teams sport – bowling 6% 154 4% Went fruit picking at farms/open fields 17% 152 11% Stayed in RV while travelling/touring 7% 151 5% LESS POPULAR WITH TRAVELLERS LOOKING FOR ACCESSIBLE DESTINATIONS:
Snorkelling in sea/ocean 3% 29 11% Kayaking or canoeing – ocean 1% 36 4% Hiking - same day excursion 10% 41 25% Skiing – downhill 6% 44 13% Skiing - cross country 3% 46 6% Snowshoeing 2% 47 4% Mountain climbing/trekking 2% 51 3% In-line/roller blading 2% 51 3% Kayaking/canoeing – freshwater 6% 51 12% Swimming in oceans 16% 55 29%
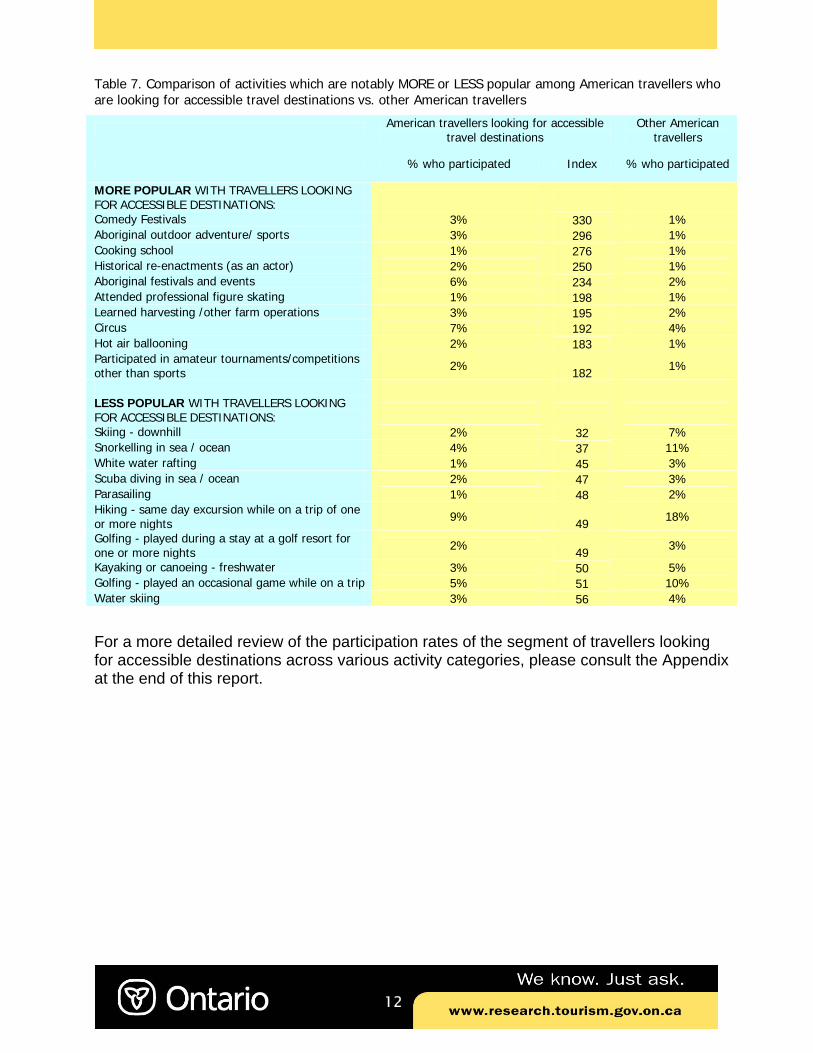
American travellers looking for accessible travel destinations have much higher incidences of attending comedy festivals, attending aboriginal festivals and aboriginal outdoor adventure/sports activities, and going to the circus (see Table 7). They are much less likely than other travellers, however, to participate in active outdoor pursuits such as skiing, ocean snorkelling of scuba, freshwater kayaking/canoeing, hiking and golfing.
12
Table 7. Comparison of activities which are notably MORE or LESS popular among American travellers who are looking for accessible travel destinations vs. other American travellers
American travellers looking for accessible travel destinations
Other American travellers
% who participated Index % who participated
MORE POPULAR WITH TRAVELLERS LOOKING FOR ACCESSIBLE DESTINATIONS:
Comedy Festivals 3% 330 1% Aboriginal outdoor adventure/ sports 3% 296 1% Cooking school 1% 276 1% Historical re-enactments (as an actor) 2% 250 1% Aboriginal festivals and events 6% 234 2% Attended professional figure skating 1% 198 1% Learned harvesting /other farm operations 3% 195 2% Circus 7% 192 4% Hot air ballooning 2% 183 1% Participated in amateur tournaments/competitions other than sports 2% 182 1%
LESS POPULAR WITH TRAVELLERS LOOKING FOR ACCESSIBLE DESTINATIONS:
Skiing - downhill 2% 32 7% Snorkelling in sea / ocean 4% 37 11% White water rafting 1% 45 3% Scuba diving in sea / ocean 2% 47 3% Parasailing 1% 48 2% Hiking - same day excursion while on a trip of one or more nights 9% 49 18%
Golfing - played during a stay at a golf resort for one or more nights 2% 49 3%
Kayaking or canoeing - freshwater 3% 50 5% Golfing - played an occasional game while on a trip 5% 51 10% Water skiing 3% 56 4% For a more detailed review of the participation rates of the segment of travellers looking for accessible destinations across various activity categories, please consult the Appendix at the end of this report.

13
What activities are trip motivators for this segment? When asked whether any of the activities that they had participated in while on a trip was the main reason for taking at least one of their trips, travellers looking for accessible travel destinations reported many of the same trip motivators as did other travellers in general. There was much overlap in terms of general pleasure or vacation trips activities such as visiting historic sites, natural wonders and nature parks, camping and going to amusement parks and casinos. Beyond these, the trip motivators of the segment looking for accessible travel destinations varied from those of other travellers. The differences are in some cases notable, and show variation between the Canadian and American markets.
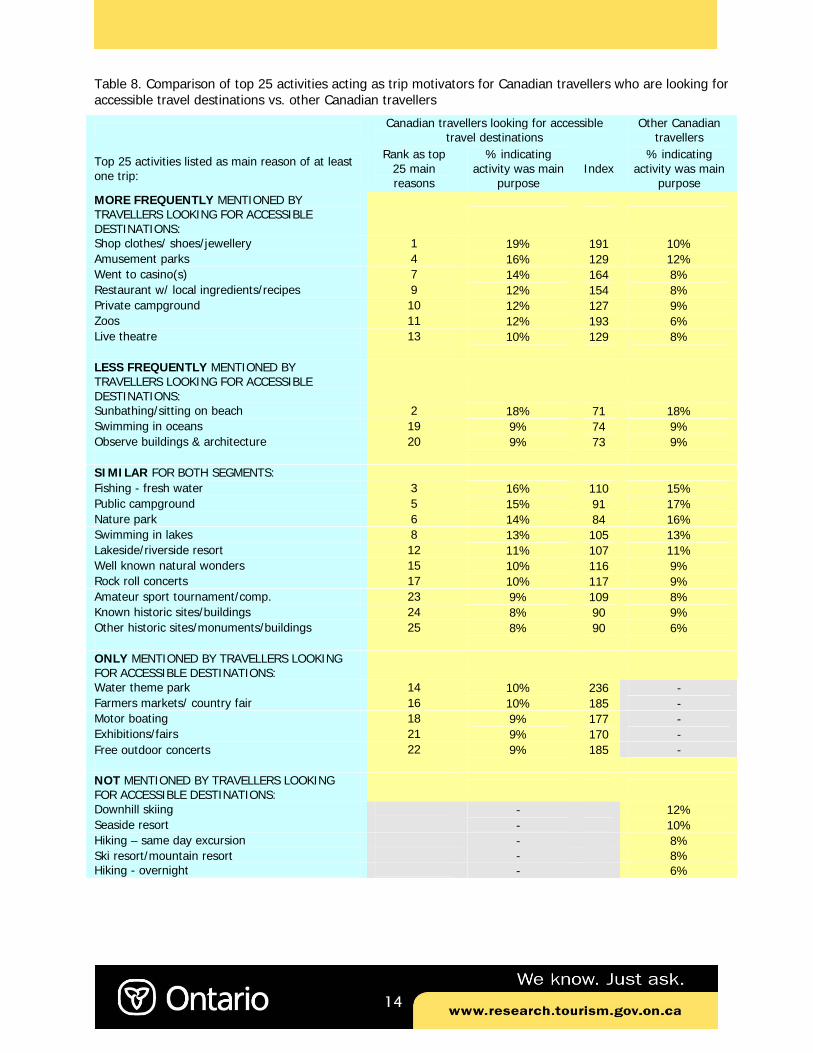
Canadian Travellers The top three activities which were trip motivators for Canadian travellers looking for accessible travel destinations were shopping for clothes/shoes/jewellery, sunbathing/ sitting on a beach and fresh water fishing (see Table 8). Some of the more popular trip motivators for the segment looking for accessible travel destinations varied from those mentioned by other Canadian travellers. Looking at the 25 most popular trip motivators for the segment looking for accessible travel destinations, shopping for clothes/shoes/ jewellery, visiting amusement parks, going to casinos, eating at local restaurants, going to the zoo, seeing live theatre, and staying at private campgrounds was mentioned more frequently by this segment than by other Canadian travellers. On the other hand, this segment was less likely than other Canadian travellers to report that sunbathing, swimming in oceans and strolling around a city to observe buildings and architecture was the main purpose for at least one of their trips. There were similarities between Canadian travellers looking for accessible travel destinations and other Canadian travellers in terms of a number of the activities which acted as trip motivators for their travel during the study period. Some of the most significant common trip motivators include fresh water fishing, staying in public campgrounds, visiting nature parks and swimming in lakes. There were also a number of trip motivators which were reported within the top 25 by Canadian travellers looking for accessible travel destinations which did not factor in the top 25 mentioned by other Canadian travellers. These included visiting water theme parks, going to farmers markets or country fairs, motor boating, going to exhibitions/fairs, and attending free outdoor concerts. Other Canadian travellers included downhill skiing, staying at seaside or ski/mountain resorts, and sameday or overnight hiking excursions among their top trip motivators while these did not appear on the list of the segment looking for accessible travel destinations.
14
Table 8. Comparison of top 25 activities acting as trip motivators for Canadian travellers who are looking for accessible travel destinations vs. other Canadian travellers
Canadian travellers looking for accessible travel destinations
Other Canadian travellers
Top 25 activities listed as main reason of at least one trip:
Rank as top 25 main reasons
% indicating activity was main
purpose Index
% indicating activity was main
purpose MORE FREQUENTLY MENTIONED BY TRAVELLERS LOOKING FOR ACCESSIBLE DESTINATIONS:
Shop clothes/ shoes/jewellery 1 19% 191 10% Amusement parks 4 16% 129 12% Went to casino(s) 7 14% 164 8% Restaurant w/ local ingredients/recipes 9 12% 154 8% Private campground 10 12% 127 9% Zoos 11 12% 193 6% Live theatre 13 10% 129 8% LESS FREQUENTLY MENTIONED BY TRAVELLERS LOOKING FOR ACCESSIBLE DESTINATIONS:
Sunbathing/sitting on beach 2 18% 71 18% Swimming in oceans 19 9% 74 9% Observe buildings & architecture 20 9% 73 9% SIMILAR FOR BOTH SEGMENTS: Fishing - fresh water 3 16% 110 15% Public campground 5 15% 91 17% Nature park 6 14% 84 16% Swimming in lakes 8 13% 105 13% Lakeside/riverside resort 12 11% 107 11% Well known natural wonders 15 10% 116 9% Rock roll concerts 17 10% 117 9% Amateur sport tournament/comp. 23 9% 109 8% Known historic sites/buildings 24 8% 90 9% Other historic sites/monuments/buildings 25 8% 90 6% ONLY MENTIONED BY TRAVELLERS LOOKING FOR ACCESSIBLE DESTINATIONS:
Water theme park 14 10% 236 - Farmers markets/ country fair 16 10% 185 - Motor boating 18 9% 177 - Exhibitions/fairs 21 9% 170 - Free outdoor concerts 22 9% 185 - NOT MENTIONED BY TRAVELLERS LOOKING FOR ACCESSIBLE DESTINATIONS:
Downhill skiing - 12% Seaside resort - 10% Hiking – same day excursion - 8% Ski resort/mountain resort - 8% Hiking - overnight - 6%
15
American Travellers The top three activities which were trip motivators for American travellers looking for accessible travel destinations were visiting amusement parks, going to casinos, and eating in local restaurants (see Table 9). Some of the more popular trip motivators for the segment looking for accessible travel destinations varied from those mentioned by other American travellers. Looking at the 25 most popular activities which acted as trip motivators for the segment looking for accessible destinations, going to casinos, eating at local restaurants, shopping for clothes/shoes/ jewellery, fresh water fishing, visiting aquariums and zoos, and visiting other historic sites were mentioned more frequently by this segment than by other American travellers. On the other hand, this segment was less likely than other American travellers to report that sunbathing /sitting on a beach or swimming in the ocean was the main purpose for at least one of their trips. A number of trip motivators were reported by similar proportions of both American travellers looking for accessible travel destinations and other American travellers. Some of the most significant include: going to amusement parks, visiting nature parks, well known historic sites/buildings and natural wonders, strolling around the city to observe architecture, and staying at public campgrounds. There were also a number of trip motivators which were reported in the top 25 by American travellers looking for accessible travel destinations which did not factor in the top 25 mentioned by other American travellers. These included visiting farmers markets or country fairs, going to the movies, shopping for arts & crafts, books or antiques, viewing fireworks or going to museums. Other American travellers included rock & roll concerts, downhill skiing, staying at lakeside or ski resorts, hiking, attending baseball games, and swimming in lakes among their top trip motivators while these did not appear on the top 25 list of trip motivators of the segment looking for accessible travel destinations.

16
Table 9. Comparison of top 25 activities acting as trip motivators for American travellers who are looking for accessible travel destinations vs. other American travellers
American travellers looking for accessible travel destinations
Other American travellers
Top 25 activities listed as main reason of at least one trip:
Rank as top 25 main reasons
% indicating activity was main purpose Index % indicating activity
was main purpose
MORE FREQUENTLY MENTIONED BY TRAVELLERS LOOKING FOR ACCESSIBLE DESTINATIONS:
Went to casino(s) 2 24% 126 19% Restaurant w/ local ingredients/recipes 3 16% 201 8% Shop clothes/ shoes/jewellery 6 14% 196 7% Fishing - fresh water 8 12% 151 8% Aquariums 9 12% 162 7% Zoos 10 11% 151 8% Other historic sites/monuments/buildings 14 10% 130 8% Lakeside/riverside resort 20 8% 130 6% LESS FREQUENTLY MENTIONED BY TRAVELLERS LOOKING FOR ACCESSIBLE DESTINATIONS:
Sunbathing/sitting on beach 4 14% 78 18% Swimming in oceans 15 10% 81 12% SIMILAR FOR BOTH SEGMENTS: Amusement parks 1 26% 100 26% Nature park 5 14% 95 15% Known historic sites/buildings 7 13% 120 11% Public campground 11 11% 110 10% Observe buildings & architecture 13 11% 111 10% Well known natural wonders 16 10% 98 10% Water theme park 21 8% 120 7% Seaside resort 22 8% 81 10% ONLY MENTIONED BY TRAVELLERS LOOKING FOR ACCESSIBLE DESTINATIONS:
Farmers markets/ country fair 12 11% 236 5% Movies 17 10% 222 4% Shop/browse – arts & crafts 18 9% 213 4% Fireworks 19 8% 177 5% Shop/browse – bookstores and music 23 8% 212 4% Museums – general history/heritage 24 8% 150 5% Shop/browse - Antiques 25 7% 204 4% NOT MENTIONED BY TRAVELLERS LOOKING FOR ACCESSIBLE DESTINATIONS:
Rock roll concerts - 8% Downhill skiing - 7% Lakeside/riverside resort - 6% Hiking – same day - 6% Attending baseball game - 6% Swimming in lakes - 5% Staying at a ski/mountain resort - 5%
17
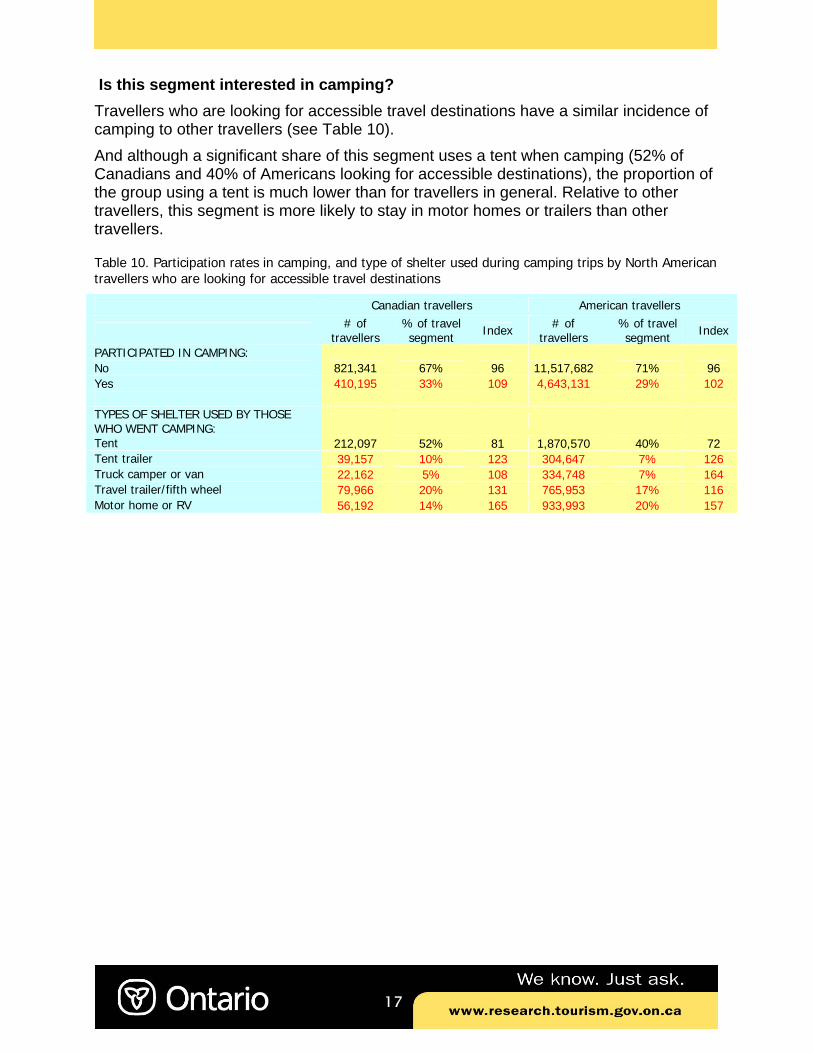
Is this segment interested in camping? Travellers who are looking for accessible travel destinations have a similar incidence of camping to other travellers (see Table 10). And although a significant share of this segment uses a tent when camping (52% of Canadians and 40% of Americans looking for accessible destinations), the proportion of the group using a tent is much lower than for travellers in general. Relative to other travellers, this segment is more likely to stay in motor homes or trailers than other travellers.
Table 10. Participation rates in camping, and type of shelter used during camping trips by North American travellers who are looking for accessible travel destinations
Canadian travellers American travellers
# of travellers
% of travel segment Index # of
travellers % of travel segment Index
PARTICIPATED IN CAMPING: No 821,341 67% 96 11,517,682 71% 96 Yes 410,195 33% 109 4,643,131 29% 102 TYPES OF SHELTER USED BY THOSE WHO WENT CAMPING:
Tent 212,097 52% 81 1,870,570 40% 72 Tent trailer 39,157 10% 123 304,647 7% 126 Truck camper or van 22,162 5% 108 334,748 7% 164 Travel trailer/fifth wheel 79,966 20% 131 765,953 17% 116 Motor home or RV 56,192 14% 165 933,993 20% 157

18
Does this segment participate in tours? Travellers who are looking for accessible travel destinations appear to participate in fewer tours than other travellers, with the exception of guided tours with a stay of one of more nights in a single location. The same trend is shown for both the Canadian and American segments (see Table 11). Table 11. Participation in tours by North American travellers who are looking for accessible travel destinations
Canadian travellers American travellers
# of travellers
% of travel segment Index # of
travellers % of travel segment Index
TYPES OF TOURS: Guided tour with overnight stay(s) different locations 101,425 10.4% 85 1,180,796 10.4% 95
Guided group tour with overnight stay(s) in single location 95,346 9.7% 105 1,235,552 9.7% 119
Guided group SAME-DAY tour 156,800 16.0% 61 2,194,252 16.0% 74 Self-guided SAME-DAY tour 254,901 26.0% 76 2,519,885 26.0% 82 Self-guided tour with overnight stay(s) different locations 167,709 17.1% 81 1,370,701 17.1% 83
When looking at same day tours, the incidence of participation of Canadian travellers looking for accessible travel destinations is notably higher than other travellers in terms of taking same day tours to a casino (almost twice that of other travellers) and a little higher in terms of visiting factories (see Table 12). This segment participates in same day city tours at a similar rate to other travellers. American travellers looking for accessible travel destinations are equally or more likely to participate in most same day tours as other American travellers, with the exception of wilderness/outdoor tours.
Table 12. Participation in same day tours by North American travellers who are looking for accessible travel destinations
Canadian travellers American travellers
# of travellers
% of travel segment Index # of
travellers % of travel segment Index
Same-day: countryside - scenic drive 199,656 54.1% 85 1,959,753 50.5% 117 Same-day: tour around the city 230,948 62.5% 105 2,213,541 57.1% 109 Same-day: pilot/passenger airplane/ helicopter 14,845 4.0% 61 185,329 4.8% 102
Same-day: water tour (sightseeing cruise) 127,174 34.4% 76 1,001,889 25.8% 100
Same-day: winery/wineries 42,290 11.4% 81 488,698 12.6% 106 Same-day: factory/factories 27,371 7.4% 112 313,103 8.1% 136 Same-day: tour to a casino 113,940 30.8% 197 1,029,738 26.6% 171 Same-day: wilderness/outdoor tour 102,124 27.6% 85 737,981 19.0% 75 Same-day: some other type of tour 75,566 20.5% 83 1,134,116 29.2% 99

19
What are the benefits sought from travel by this segment? Travellers looking for accessible travel destinations appear to seek a greater number of benefits from their travel experiences than do other travellers (see Table 13). Their incidence of rating each of the listed benefits as highly important was higher than other travellers in all cases, except for ‘Taking a break from the day-to-day environment’ – where their incidence of rating it as highly important was just slightly lower than other travellers. The four most frequently mentioned benefits sought – to relax and relieve stress, enrich relationship with spouse/children, take a break from the day-to-day environment and create lasting memories were constant among travellers looking for accessible travel destinations and other travellers in both the Canadian and American markets. Those benefits which were noticeably more important to travellers looking for accessible travel destinations than other travellers were:
To have stories to share back at home or something interesting to talk about To be challenged physically / to feel physically energized To be pampered To stimulate the mind/ / be intellectually challenged
Table 13. Benefits sought from pleasure travel by North American travellers who are looking for accessible travel destinations
Canadian travellers American travellers HIGHLY IMPORTANT HIGHLY IMPORTANT BENEFITS SOUGHT FROM TRAVEL:
# of travellers who said
% of travel segment Index # of
travellers % of travel segment Index
To relax and relieve stress 812,934 66% 102 12,105,826 75% 106 Enrich relationship spouse/children 802,779 65% 126 10,214,140 63% 118
Break from day-to-day environment 771,478 63% 95 11,268,682 70% 99
Create lasting memories 768,206 62% 122 10,796,422 67% 120 Keep family ties alive 737,671 60% 142 10,009,877 62% 141 Have life with no fixed schedule 698,107 57% 120 10,040,354 62% 121
Do something different 555,283 45% 103 7,651,695 47% 113 Enrich your perspective on life 404,777 33% 120 5,200,751 32% 145 Renew personal connections 404,175 33% 181 4,955,733 31% 177 Knowledge of history/cultures/ places 350,961 29% 119 4,515,024 28% 148
Be physically challenged/energized 347,126 28% 189 3,785,573 23% 225
Stories share/something talk about 333,668 27% 226 4,280,453 27% 233
To be pampered 324,437 26% 210 4,647,366 29% 206 Stimulate mind -intellectually 318,031 26% 151 5,143,631 32% 184 Seek solitude and isolation 148,676 12% 130 2,693,074 17% 140
20
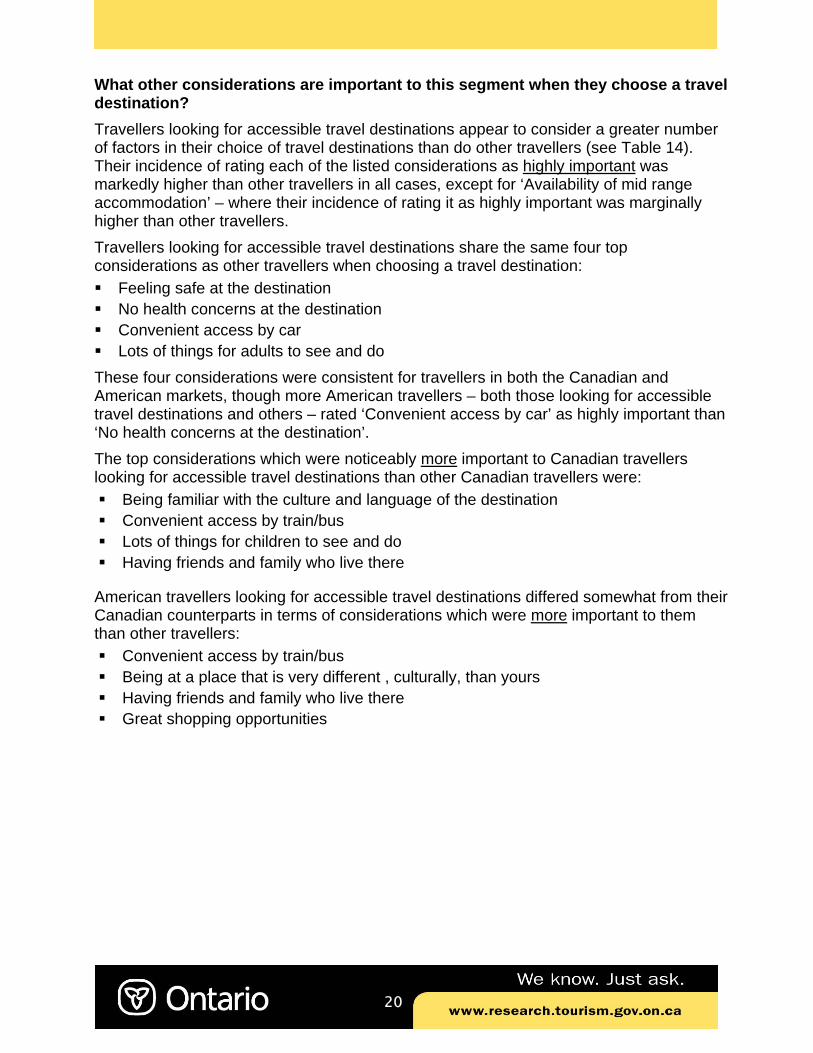
What other considerations are important to this segment when they choose a travel destination? Travellers looking for accessible travel destinations appear to consider a greater number of factors in their choice of travel destinations than do other travellers (see Table 14). Their incidence of rating each of the listed considerations as highly important was markedly higher than other travellers in all cases, except for ‘Availability of mid range accommodation’ – where their incidence of rating it as highly important was marginally higher than other travellers. Travellers looking for accessible travel destinations share the same four top considerations as other travellers when choosing a travel destination: Feeling safe at the destination No health concerns at the destination Convenient access by car Lots of things for adults to see and do
These four considerations were consistent for travellers in both the Canadian and American markets, though more American travellers – both those looking for accessible travel destinations and others – rated ‘Convenient access by car’ as highly important than ‘No health concerns at the destination’. The top considerations which were noticeably more important to Canadian travellers looking for accessible travel destinations than other Canadian travellers were:
Being familiar with the culture and language of the destination Convenient access by train/bus Lots of things for children to see and do Having friends and family who live there
American travellers looking for accessible travel destinations differed somewhat from their Canadian counterparts in terms of considerations which were more important to them than other travellers:
Convenient access by train/bus Being at a place that is very different , culturally, than yours Having friends and family who live there Great shopping opportunities
21
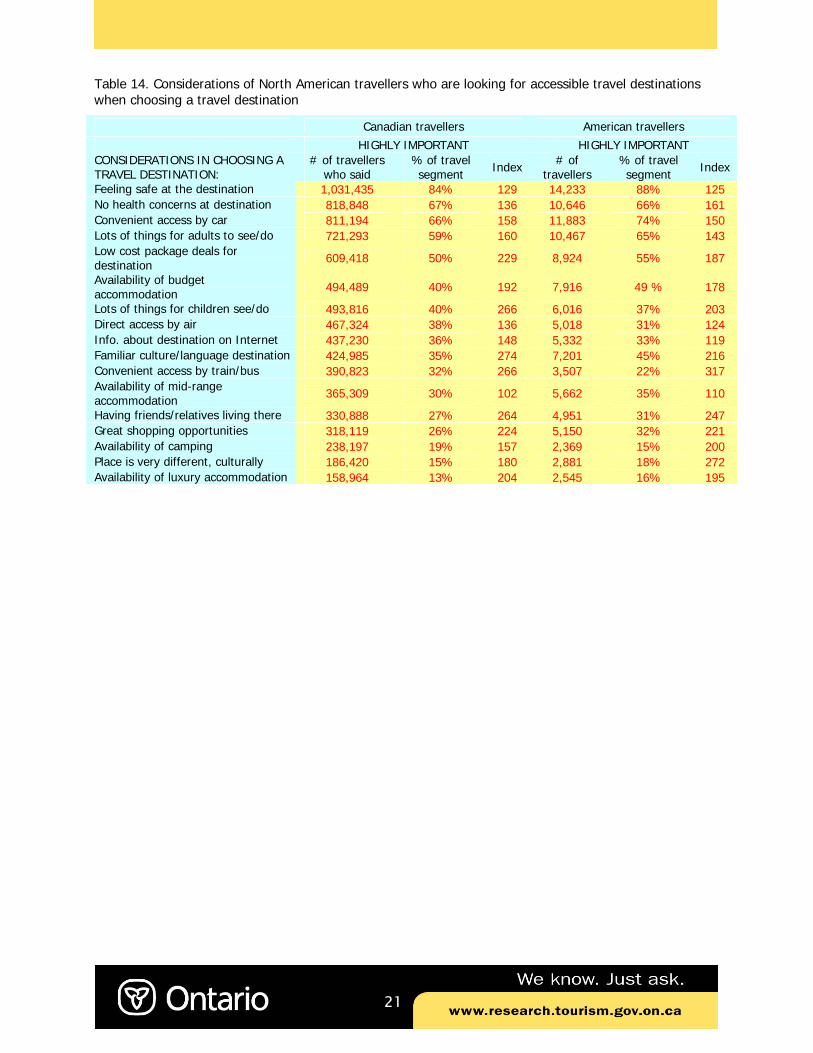
Table 14. Considerations of North American travellers who are looking for accessible travel destinations when choosing a travel destination
Canadian travellers American travellers HIGHLY IMPORTANT HIGHLY IMPORTANT CONSIDERATIONS IN CHOOSING A TRAVEL DESTINATION:
# of travellers who said
% of travel segment Index # of
travellers % of travel segment Index
Feeling safe at the destination 1,031,435 84% 129 14,233 88% 125 No health concerns at destination 818,848 67% 136 10,646 66% 161 Convenient access by car 811,194 66% 158 11,883 74% 150 Lots of things for adults to see/do 721,293 59% 160 10,467 65% 143 Low cost package deals for destination 609,418 50% 229 8,924 55% 187
Availability of budget accommodation 494,489 40% 192 7,916 49 % 178
Lots of things for children see/do 493,816 40% 266 6,016 37% 203 Direct access by air 467,324 38% 136 5,018 31% 124 Info. about destination on Internet 437,230 36% 148 5,332 33% 119 Familiar culture/language destination 424,985 35% 274 7,201 45% 216 Convenient access by train/bus 390,823 32% 266 3,507 22% 317 Availability of mid-range accommodation 365,309 30% 102 5,662 35% 110
Having friends/relatives living there 330,888 27% 264 4,951 31% 247 Great shopping opportunities 318,119 26% 224 5,150 32% 221 Availability of camping 238,197 19% 157 2,369 15% 200 Place is very different, culturally 186,420 15% 180 2,881 18% 272 Availability of luxury accommodation 158,964 13% 204 2,545 16% 195
22
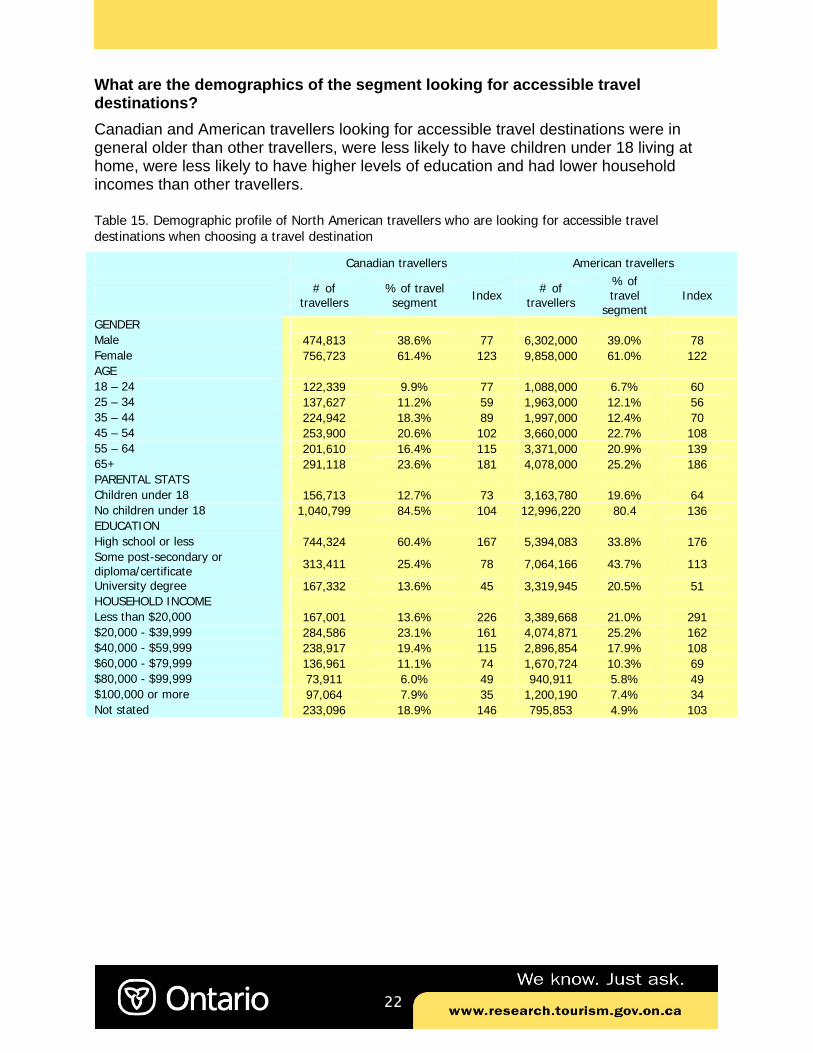
What are the demographics of the segment looking for accessible travel destinations? Canadian and American travellers looking for accessible travel destinations were in general older than other travellers, were less likely to have children under 18 living at home, were less likely to have higher levels of education and had lower household incomes than other travellers. Table 15. Demographic profile of North American travellers who are looking for accessible travel destinations when choosing a travel destination
Canadian travellers American travellers
# of travellers
% of travel segment Index # of
travellers
% of travel
segment Index
GENDER Male 474,813 38.6% 77 6,302,000 39.0% 78 Female 756,723 61.4% 123 9,858,000 61.0% 122 AGE 18 – 24 122,339 9.9% 77 1,088,000 6.7% 60 25 – 34 137,627 11.2% 59 1,963,000 12.1% 56 35 – 44 224,942 18.3% 89 1,997,000 12.4% 70 45 – 54 253,900 20.6% 102 3,660,000 22.7% 108 55 – 64 201,610 16.4% 115 3,371,000 20.9% 139 65+ 291,118 23.6% 181 4,078,000 25.2% 186 PARENTAL STATS Children under 18 156,713 12.7% 73 3,163,780 19.6% 64 No children under 18 1,040,799 84.5% 104 12,996,220 80.4 136 EDUCATION High school or less 744,324 60.4% 167 5,394,083 33.8% 176 Some post-secondary or diploma/certificate 313,411 25.4% 78 7,064,166 43.7% 113
University degree 167,332 13.6% 45 3,319,945 20.5% 51 HOUSEHOLD INCOME Less than $20,000 167,001 13.6% 226 3,389,668 21.0% 291 $20,000 - $39,999 284,586 23.1% 161 4,074,871 25.2% 162 $40,000 - $59,999 238,917 19.4% 115 2,896,854 17.9% 108 $60,000 - $79,999 136,961 11.1% 74 1,670,724 10.3% 69 $80,000 - $99,999 73,911 6.0% 49 940,911 5.8% 49 $100,000 or more 97,064 7.9% 35 1,200,190 7.4% 34 Not stated 233,096 18.9% 146 795,853 4.9% 103

23
APPENDIX: DETAILED REVIEW OF ACTIVITY CATEGORIES
Water-based Outdoor Activities Travellers who are looking for accessible travel destinations tend to be less active than other travellers in the area of water-based outdoor activities (see Table A). The participation rates of Canadian travellers looking for accessible destinations are
lower than other travellers for all activities in this category, except for water skiing. Participation rates for this segment are similar (a little lower) to other travellers in the areas of fresh-water fishing and motor boating, two of the more popular activities in this category, but are significantly lower in the areas of sunbathing / sitting on a beach and swimming in lakes – the most popular activities in this category.
American travellers in this segment appear a little more active than their Canadian counterparts, with their participation rates higher than those of the average travellers in the areas of fresh-water fishing, trophy fishing and, interestingly, kite surfing. Participation rates for this segment are a little lower than for other travellers in the areas of salt-water fishing, motor boating and swimming in lakes, and significantly lower in the areas of sunbathing / sitting on a beach and swimming in oceans – some of the most popular activities in this category.
Table A. Participation rates for water-based activities by North American travellers who are looking for accessible travel destinations
Canadian travellers American travellers
# of travellers
% of travel segment
Index # of travellers
% of travel segment
Index
WATER-BASED OUTDOOR ACTIVITIES
Fishing - fresh water 209,130 18% 87 2,415,338 16% 110 Fishing - salt water 29,908 3% 61 979,998 7% 90 Fishing - trophy fishing 6,106 1% 71 156,003 1% 136 Kayaking or canoeing – freshwater 69,484 6% 51 394,046 3% 50
Kayaking or canoeing – ocean 16,385 1% 36 89,466 1% 24
Kite surfing * * * 89,239 1% 278 Motor boating 187,009 17% 91 1,157,502 8% 83 Parasailing 8,956 1% 57 152,589 1% 48 Sailing 33,779 3% 66 361,730 2% 87 Scuba diving in lakes / rivers * * * 55,148 * *
Scuba diving in sea / ocean * * * 228,291 2% 47 Snorkeling in lakes or rivers 9,143 1% 32 110,088 1% 63 Snorkeling in sea / ocean 34,630 3% 29 611,578 4% 37 Sunbathing or sitting on a beach 279,623 25% 59 2,835,264 19% 63
Swimming in lakes 295,156 26% 73 2,030,164 14% 81 Swimming in oceans 180,833 16% 55 2,580,663 18% 60 Water skiing 64,376 6% 104 332,716 2% 56 White water rafting 21,903 2% 70 212,380 1% 45 Wind surfing 12,408 1% 95 49,355 0.3% 88
* Small sample size, number has been suppressed.
24
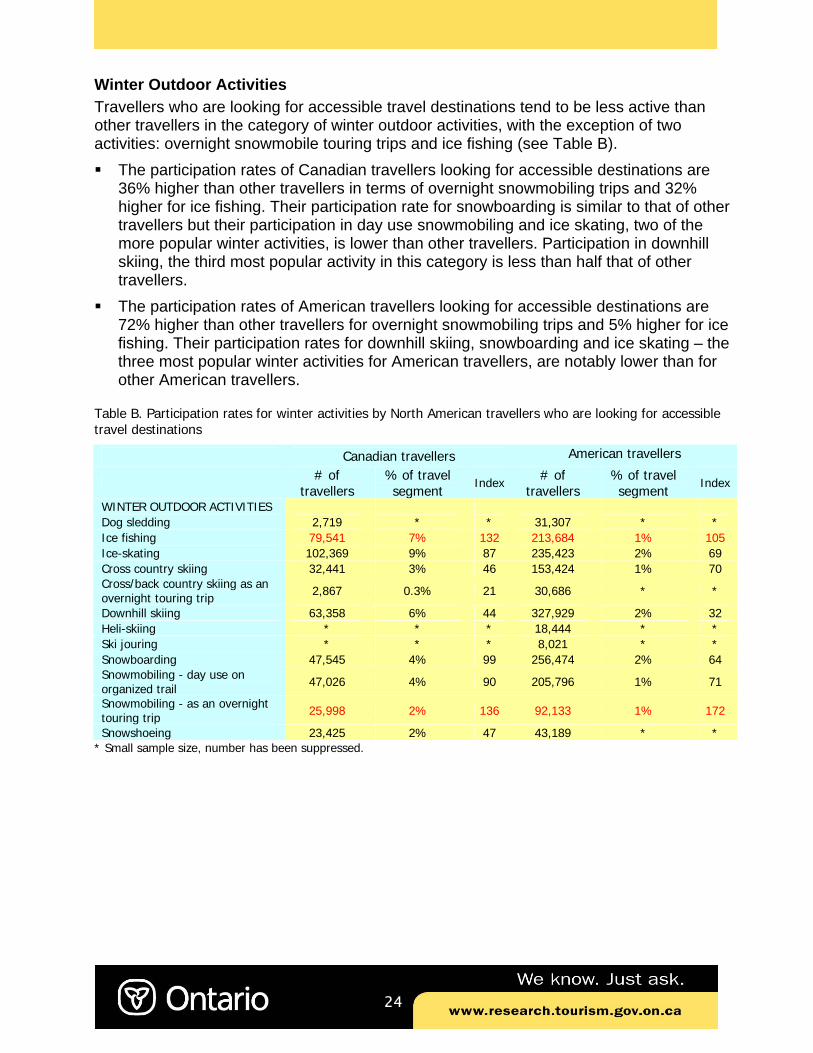
Winter Outdoor Activities Travellers who are looking for accessible travel destinations tend to be less active than other travellers in the category of winter outdoor activities, with the exception of two activities: overnight snowmobile touring trips and ice fishing (see Table B). The participation rates of Canadian travellers looking for accessible destinations are
36% higher than other travellers in terms of overnight snowmobiling trips and 32% higher for ice fishing. Their participation rate for snowboarding is similar to that of other travellers but their participation in day use snowmobiling and ice skating, two of the more popular winter activities, is lower than other travellers. Participation in downhill skiing, the third most popular activity in this category is less than half that of other travellers.
The participation rates of American travellers looking for accessible destinations are 72% higher than other travellers for overnight snowmobiling trips and 5% higher for ice fishing. Their participation rates for downhill skiing, snowboarding and ice skating – the three most popular winter activities for American travellers, are notably lower than for other American travellers.
Table B. Participation rates for winter activities by North American travellers who are looking for accessible travel destinations
Canadian travellers American travellers
# of travellers
% of travel segment
Index # of travellers
% of travel segment
Index
WINTER OUTDOOR ACTIVITIES Dog sledding 2,719 * * 31,307 * * Ice fishing 79,541 7% 132 213,684 1% 105 Ice-skating 102,369 9% 87 235,423 2% 69 Cross country skiing 32,441 3% 46 153,424 1% 70 Cross/back country skiing as an overnight touring trip 2,867 0.3% 21 30,686 * *
Downhill skiing 63,358 6% 44 327,929 2% 32 Heli-skiing * * * 18,444 * * Ski jouring * * * 8,021 * * Snowboarding 47,545 4% 99 256,474 2% 64 Snowmobiling - day use on organized trail 47,026 4% 90 205,796 1% 71
Snowmobiling - as an overnight touring trip 25,998 2% 136 92,133 1% 172
Snowshoeing 23,425 2% 47 43,189 * * * Small sample size, number has been suppressed.
25
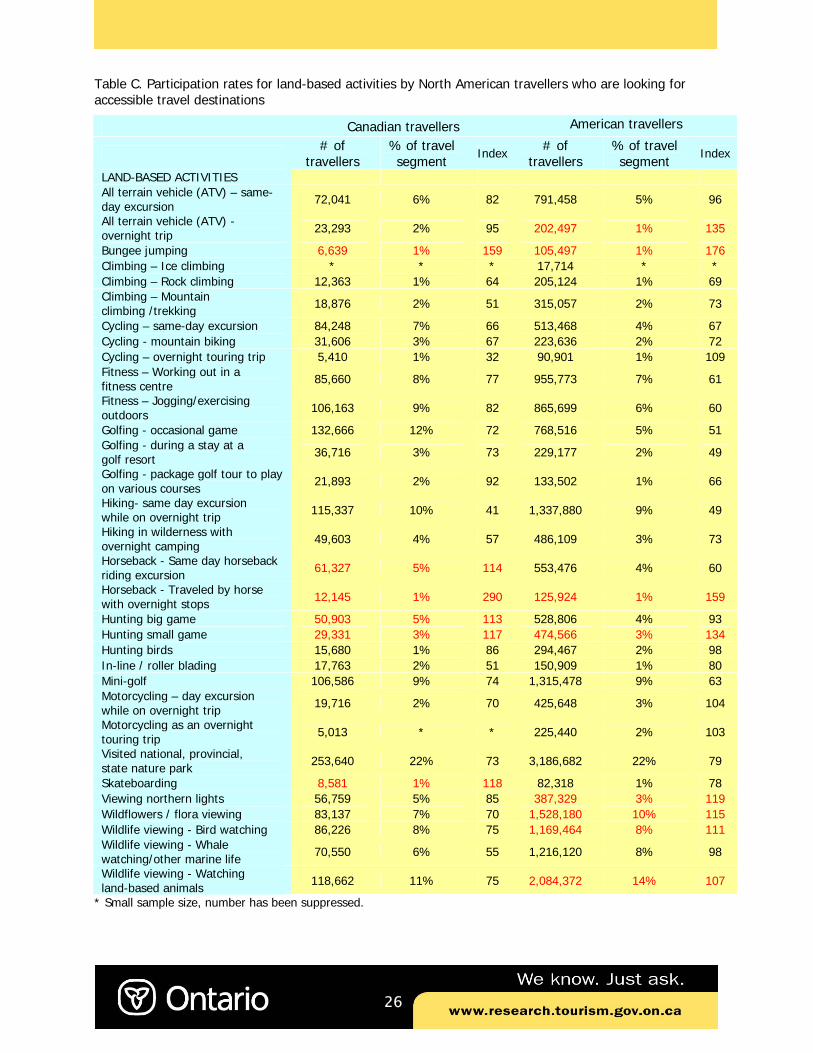
Land-based Outdoor Activities Travellers who are looking for accessible travel destinations are more active in certain areas and less active in other areas than other travellers in the category of land-based activities (see Table C). Canadian travellers looking for accessible destinations have higher participation rates
in the following activities: Horseback riding (with overnight stops or same-day), bungee jumping, skateboarding and hunting big and small game. These activities represent a broad set of specialized activities where the total volume of participants is relatively low. The participation rates of this segment are similar to those of other Canadian travellers in the area of ATV overnight trips and golf tours. Their participation rates, however, in the areas of visiting nature parks, same-day hiking excursions and occasional golf games – the three most popular activities in this category for the Canadian market – are markedly lower than that of other travellers.
American travellers looking for accessible destinations appear to have different interests in some areas than the Canadian segment. They have higher participation rates in the following activities: Bungee jumping, horseback riding with overnight stops, ATV overnight trips, hunting small game, viewing the northern lights, viewing flora, and bird watching. Their participation rates are similar (a little higher) to those of other American travellers in the areas of overnight cycling trips, motorcycling (both overnight and day excursions) and wildlife viewing (land-based animals). Their participation rates, however, in the areas of visiting nature parks, same-day hiking excursions, mini-golf and occasional golf games – the four most popular activities in this category for the American market – are markedly lower than that of other travellers.
26
Table C. Participation rates for land-based activities by North American travellers who are looking for accessible travel destinations
Canadian travellers American travellers
# of travellers
% of travel segment
Index # of travellers
% of travel segment
Index
LAND-BASED ACTIVITIES All terrain vehicle (ATV) – same-day excursion 72,041 6% 82 791,458 5% 96
All terrain vehicle (ATV) - overnight trip 23,293 2% 95 202,497 1% 135
Bungee jumping 6,639 1% 159 105,497 1% 176 Climbing – Ice climbing * * * 17,714 * * Climbing – Rock climbing 12,363 1% 64 205,124 1% 69 Climbing – Mountain climbing /trekking 18,876 2% 51 315,057 2% 73
Cycling – same-day excursion 84,248 7% 66 513,468 4% 67 Cycling - mountain biking 31,606 3% 67 223,636 2% 72 Cycling – overnight touring trip 5,410 1% 32 90,901 1% 109 Fitness – Working out in a fitness centre 85,660 8% 77 955,773 7% 61
Fitness – Jogging/exercising outdoors 106,163 9% 82 865,699 6% 60
Golfing - occasional game 132,666 12% 72 768,516 5% 51 Golfing - during a stay at a golf resort 36,716 3% 73 229,177 2% 49
Golfing - package golf tour to play on various courses 21,893 2% 92 133,502 1% 66
Hiking- same day excursion while on overnight trip 115,337 10% 41 1,337,880 9% 49
Hiking in wilderness with overnight camping 49,603 4% 57 486,109 3% 73
Horseback - Same day horseback riding excursion 61,327 5% 114 553,476 4% 60
Horseback - Traveled by horse with overnight stops 12,145 1% 290 125,924 1% 159
Hunting big game 50,903 5% 113 528,806 4% 93 Hunting small game 29,331 3% 117 474,566 3% 134 Hunting birds 15,680 1% 86 294,467 2% 98 In-line / roller blading 17,763 2% 51 150,909 1% 80 Mini-golf 106,586 9% 74 1,315,478 9% 63 Motorcycling – day excursion while on overnight trip 19,716 2% 70 425,648 3% 104
Motorcycling as an overnight touring trip 5,013 * * 225,440 2% 103
Visited national, provincial, state nature park 253,640 22% 73 3,186,682 22% 79
Skateboarding 8,581 1% 118 82,318 1% 78 Viewing northern lights 56,759 5% 85 387,329 3% 119 Wildflowers / flora viewing 83,137 7% 70 1,528,180 10% 115 Wildlife viewing - Bird watching 86,226 8% 75 1,169,464 8% 111 Wildlife viewing - Whale watching/other marine life 70,550 6% 55 1,216,120 8% 98
Wildlife viewing - Watching land-based animals 118,662 11% 75 2,084,372 14% 107
* Small sample size, number has been suppressed.
27
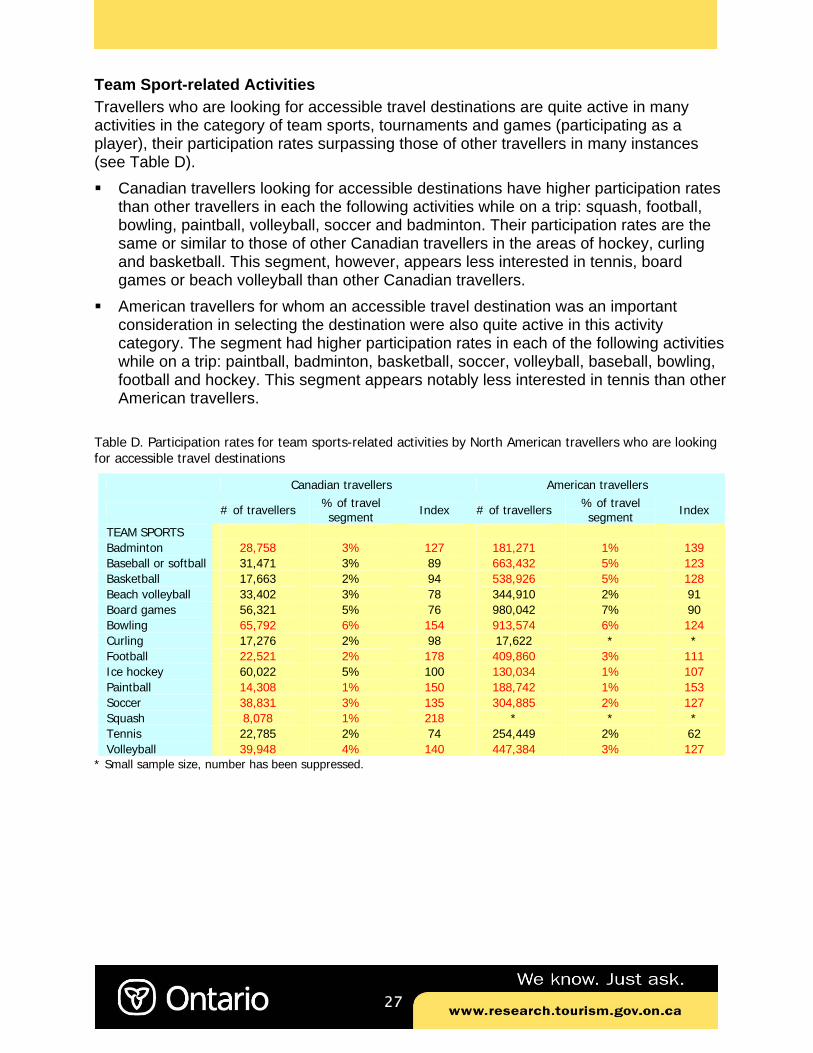
Team Sport-related Activities Travellers who are looking for accessible travel destinations are quite active in many activities in the category of team sports, tournaments and games (participating as a player), their participation rates surpassing those of other travellers in many instances (see Table D). Canadian travellers looking for accessible destinations have higher participation rates
than other travellers in each the following activities while on a trip: squash, football, bowling, paintball, volleyball, soccer and badminton. Their participation rates are the same or similar to those of other Canadian travellers in the areas of hockey, curling and basketball. This segment, however, appears less interested in tennis, board games or beach volleyball than other Canadian travellers.
American travellers for whom an accessible travel destination was an important consideration in selecting the destination were also quite active in this activity category. The segment had higher participation rates in each of the following activities while on a trip: paintball, badminton, basketball, soccer, volleyball, baseball, bowling, football and hockey. This segment appears notably less interested in tennis than other American travellers.
Table D. Participation rates for team sports-related activities by North American travellers who are looking for accessible travel destinations
Canadian travellers American travellers
# of travellers % of travel segment Index # of travellers % of travel
segment Index
TEAM SPORTS Badminton 28,758 3% 127 181,271 1% 139 Baseball or softball 31,471 3% 89 663,432 5% 123 Basketball 17,663 2% 94 538,926 5% 128 Beach volleyball 33,402 3% 78 344,910 2% 91 Board games 56,321 5% 76 980,042 7% 90 Bowling 65,792 6% 154 913,574 6% 124 Curling 17,276 2% 98 17,622 * * Football 22,521 2% 178 409,860 3% 111 Ice hockey 60,022 5% 100 130,034 1% 107 Paintball 14,308 1% 150 188,742 1% 153 Soccer 38,831 3% 135 304,885 2% 127 Squash 8,078 1% 218 * * * Tennis 22,785 2% 74 254,449 2% 62 Volleyball 39,948 4% 140 447,384 3% 127
* Small sample size, number has been suppressed.
28
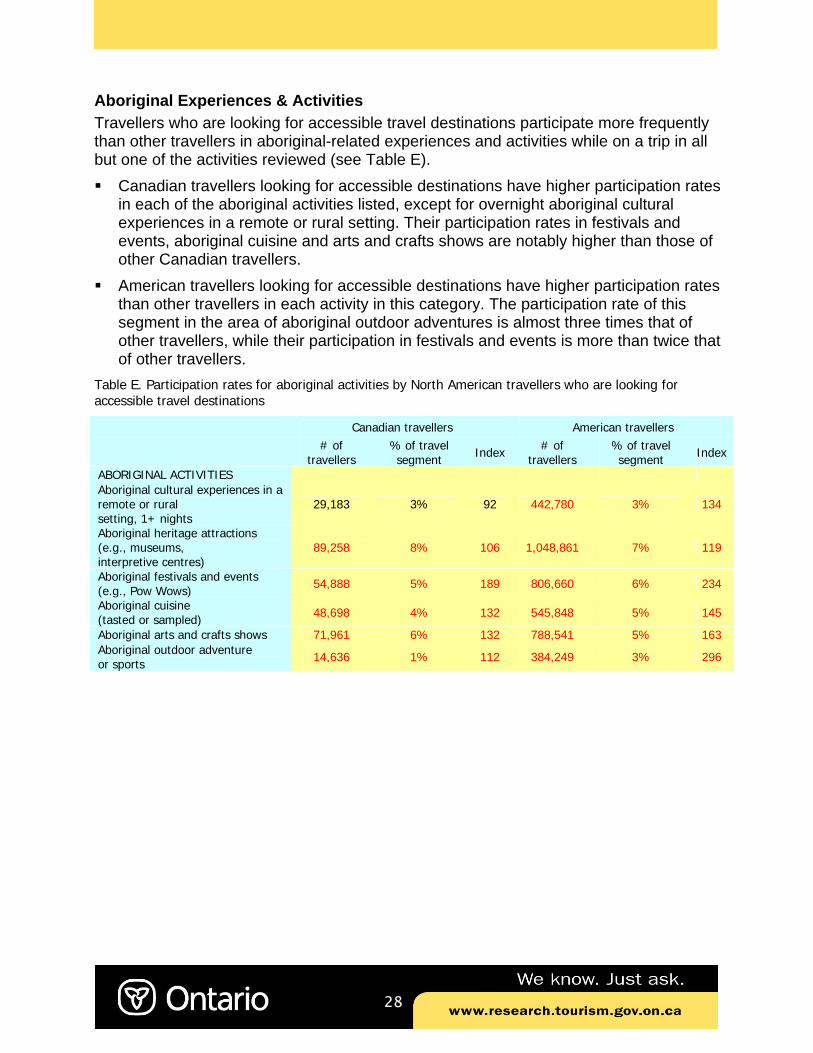
Aboriginal Experiences & Activities Travellers who are looking for accessible travel destinations participate more frequently than other travellers in aboriginal-related experiences and activities while on a trip in all but one of the activities reviewed (see Table E). Canadian travellers looking for accessible destinations have higher participation rates
in each of the aboriginal activities listed, except for overnight aboriginal cultural experiences in a remote or rural setting. Their participation rates in festivals and events, aboriginal cuisine and arts and crafts shows are notably higher than those of other Canadian travellers.
American travellers looking for accessible destinations have higher participation rates than other travellers in each activity in this category. The participation rate of this segment in the area of aboriginal outdoor adventures is almost three times that of other travellers, while their participation in festivals and events is more than twice that of other travellers.
Table E. Participation rates for aboriginal activities by North American travellers who are looking for accessible travel destinations
Canadian travellers American travellers
# of travellers
% of travel segment Index # of
travellers % of travel segment Index
ABORIGINAL ACTIVITIES Aboriginal cultural experiences in a remote or rural setting, 1+ nights
29,183 3% 92 442,780 3% 134
Aboriginal heritage attractions (e.g., museums, interpretive centres)
89,258 8% 106 1,048,861 7% 119
Aboriginal festivals and events (e.g., Pow Wows) 54,888 5% 189 806,660 6% 234
Aboriginal cuisine (tasted or sampled) 48,698 4% 132 545,848 5% 145
Aboriginal arts and crafts shows 71,961 6% 132 788,541 5% 163 Aboriginal outdoor adventure or sports 14,636 1% 112 384,249 3% 296
29
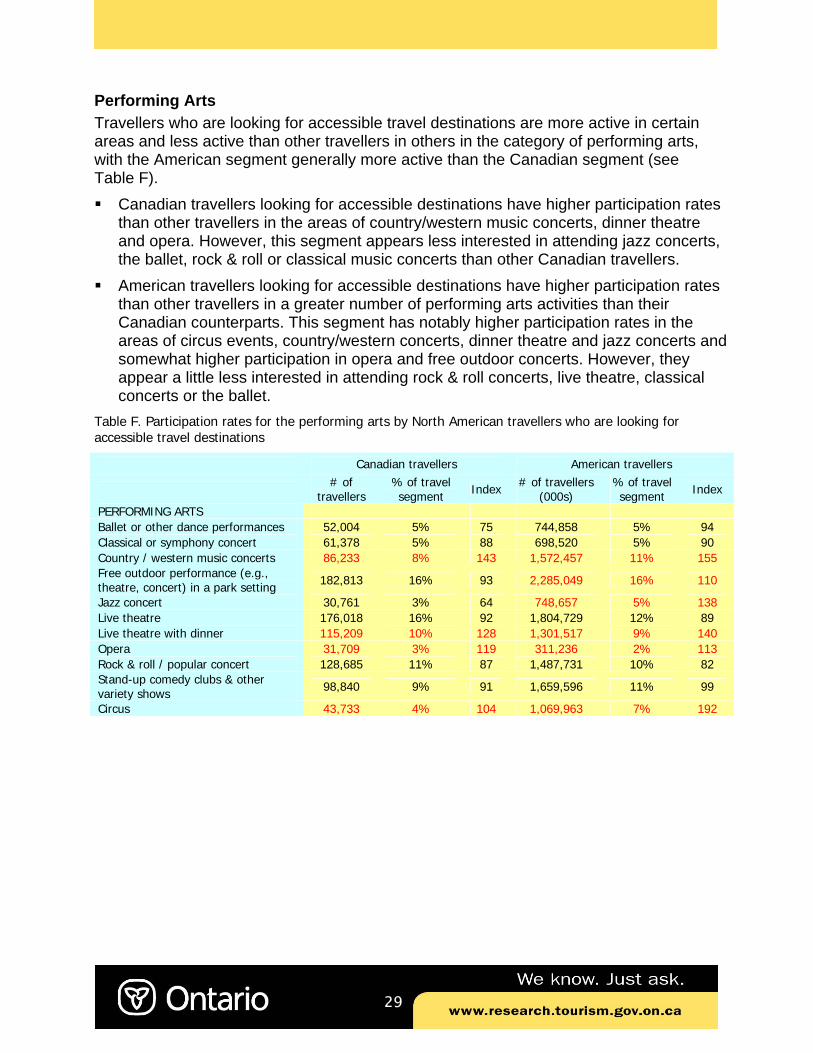
Performing Arts Travellers who are looking for accessible travel destinations are more active in certain areas and less active than other travellers in others in the category of performing arts, with the American segment generally more active than the Canadian segment (see Table F). Canadian travellers looking for accessible destinations have higher participation rates
than other travellers in the areas of country/western music concerts, dinner theatre and opera. However, this segment appears less interested in attending jazz concerts, the ballet, rock & roll or classical music concerts than other Canadian travellers.
American travellers looking for accessible destinations have higher participation rates than other travellers in a greater number of performing arts activities than their Canadian counterparts. This segment has notably higher participation rates in the areas of circus events, country/western concerts, dinner theatre and jazz concerts and somewhat higher participation in opera and free outdoor concerts. However, they appear a little less interested in attending rock & roll concerts, live theatre, classical concerts or the ballet.
Table F. Participation rates for the performing arts by North American travellers who are looking for accessible travel destinations
Canadian travellers American travellers
# of travellers
% of travel segment Index # of travellers
(000s) % of travel segment Index
PERFORMING ARTS Ballet or other dance performances 52,004 5% 75 744,858 5% 94 Classical or symphony concert 61,378 5% 88 698,520 5% 90 Country / western music concerts 86,233 8% 143 1,572,457 11% 155 Free outdoor performance (e.g., theatre, concert) in a park setting 182,813 16% 93 2,285,049 16% 110
Jazz concert 30,761 3% 64 748,657 5% 138 Live theatre 176,018 16% 92 1,804,729 12% 89 Live theatre with dinner 115,209 10% 128 1,301,517 9% 140 Opera 31,709 3% 119 311,236 2% 113 Rock & roll / popular concert 128,685 11% 87 1,487,731 10% 82 Stand-up comedy clubs & other variety shows 98,840 9% 91 1,659,596 11% 99
Circus 43,733 4% 104 1,069,963 7% 192
30
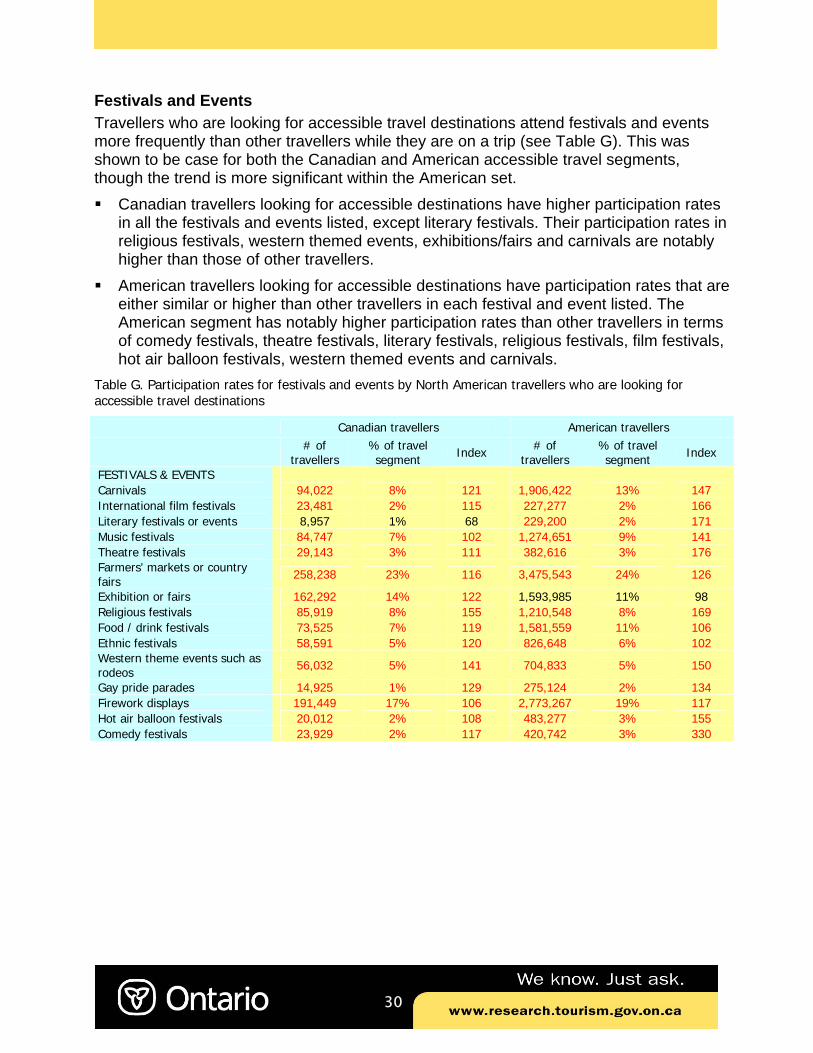
Festivals and Events Travellers who are looking for accessible travel destinations attend festivals and events more frequently than other travellers while they are on a trip (see Table G). This was shown to be case for both the Canadian and American accessible travel segments, though the trend is more significant within the American set. Canadian travellers looking for accessible destinations have higher participation rates
in all the festivals and events listed, except literary festivals. Their participation rates in religious festivals, western themed events, exhibitions/fairs and carnivals are notably higher than those of other travellers.
American travellers looking for accessible destinations have participation rates that are either similar or higher than other travellers in each festival and event listed. The American segment has notably higher participation rates than other travellers in terms of comedy festivals, theatre festivals, literary festivals, religious festivals, film festivals, hot air balloon festivals, western themed events and carnivals.
Table G. Participation rates for festivals and events by North American travellers who are looking for accessible travel destinations
Canadian travellers American travellers
# of travellers
% of travel segment Index # of
travellers % of travel segment Index
FESTIVALS & EVENTS Carnivals 94,022 8% 121 1,906,422 13% 147 International film festivals 23,481 2% 115 227,277 2% 166 Literary festivals or events 8,957 1% 68 229,200 2% 171 Music festivals 84,747 7% 102 1,274,651 9% 141 Theatre festivals 29,143 3% 111 382,616 3% 176 Farmers' markets or country fairs 258,238 23% 116 3,475,543 24% 126
Exhibition or fairs 162,292 14% 122 1,593,985 11% 98 Religious festivals 85,919 8% 155 1,210,548 8% 169 Food / drink festivals 73,525 7% 119 1,581,559 11% 106 Ethnic festivals 58,591 5% 120 826,648 6% 102 Western theme events such as rodeos 56,032 5% 141 704,833 5% 150
Gay pride parades 14,925 1% 129 275,124 2% 134 Firework displays 191,449 17% 106 2,773,267 19% 117 Hot air balloon festivals 20,012 2% 108 483,277 3% 155 Comedy festivals 23,929 2% 117 420,742 3% 330
31
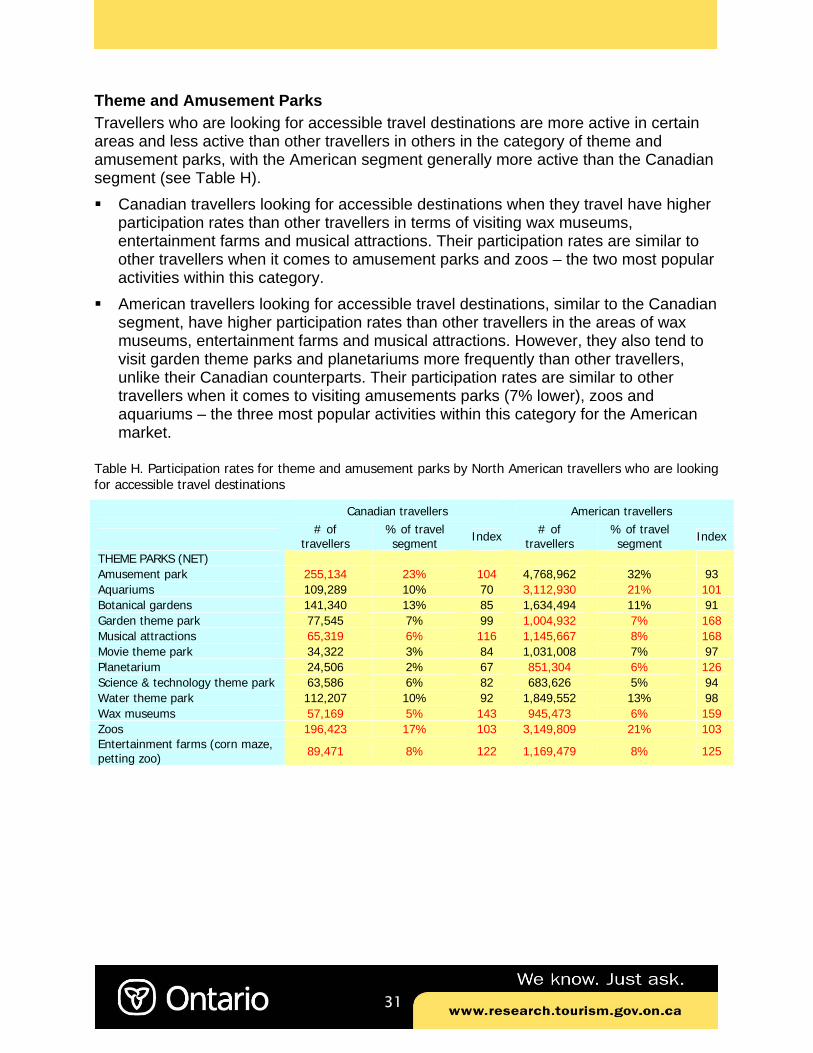
Theme and Amusement Parks Travellers who are looking for accessible travel destinations are more active in certain areas and less active than other travellers in others in the category of theme and amusement parks, with the American segment generally more active than the Canadian segment (see Table H). Canadian travellers looking for accessible destinations when they travel have higher
participation rates than other travellers in terms of visiting wax museums, entertainment farms and musical attractions. Their participation rates are similar to other travellers when it comes to amusement parks and zoos – the two most popular activities within this category.
American travellers looking for accessible travel destinations, similar to the Canadian segment, have higher participation rates than other travellers in the areas of wax museums, entertainment farms and musical attractions. However, they also tend to visit garden theme parks and planetariums more frequently than other travellers, unlike their Canadian counterparts. Their participation rates are similar to other travellers when it comes to visiting amusements parks (7% lower), zoos and aquariums – the three most popular activities within this category for the American market.
Table H. Participation rates for theme and amusement parks by North American travellers who are looking for accessible travel destinations
Canadian travellers American travellers
# of travellers
% of travel segment Index # of
travellers % of travel segment Index
THEME PARKS (NET) Amusement park 255,134 23% 104 4,768,962 32% 93 Aquariums 109,289 10% 70 3,112,930 21% 101 Botanical gardens 141,340 13% 85 1,634,494 11% 91 Garden theme park 77,545 7% 99 1,004,932 7% 168 Musical attractions 65,319 6% 116 1,145,667 8% 168 Movie theme park 34,322 3% 84 1,031,008 7% 97 Planetarium 24,506 2% 67 851,304 6% 126 Science & technology theme park 63,586 6% 82 683,626 5% 94 Water theme park 112,207 10% 92 1,849,552 13% 98 Wax museums 57,169 5% 143 945,473 6% 159 Zoos 196,423 17% 103 3,149,809 21% 103 Entertainment farms (corn maze, petting zoo) 89,471 8% 122 1,169,479 8% 125
32
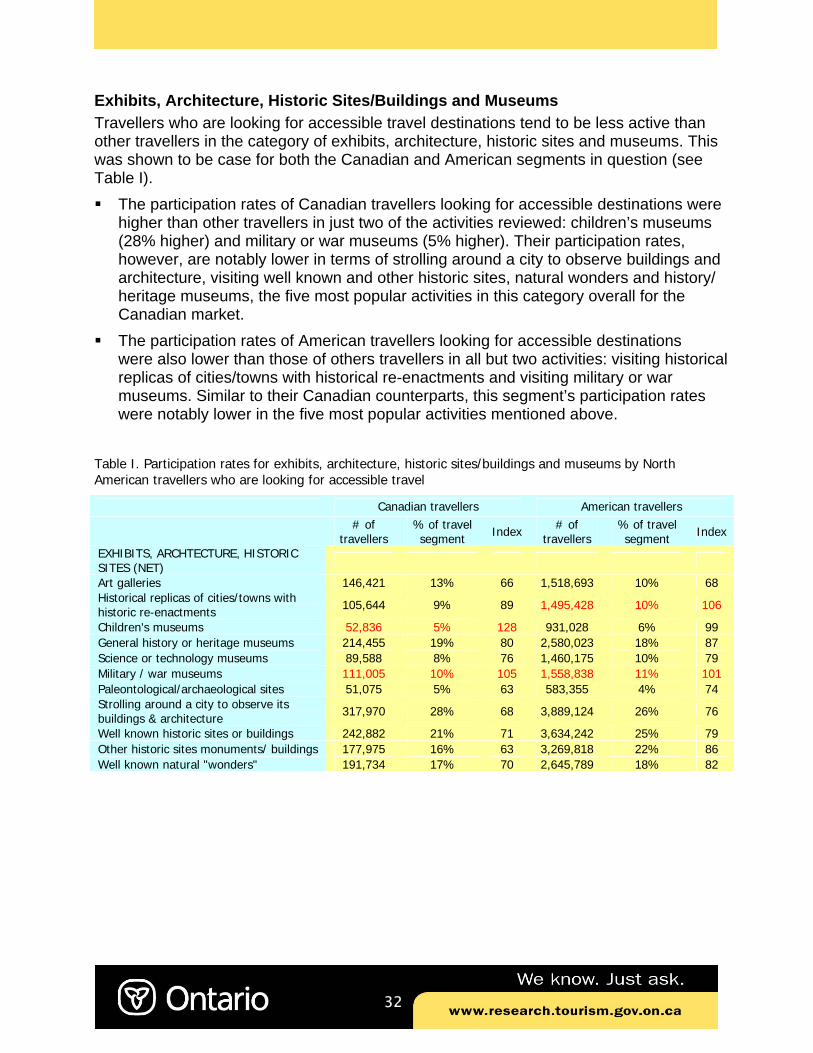
Exhibits, Architecture, Historic Sites/Buildings and Museums Travellers who are looking for accessible travel destinations tend to be less active than other travellers in the category of exhibits, architecture, historic sites and museums. This was shown to be case for both the Canadian and American segments in question (see Table I). The participation rates of Canadian travellers looking for accessible destinations were
higher than other travellers in just two of the activities reviewed: children’s museums (28% higher) and military or war museums (5% higher). Their participation rates, however, are notably lower in terms of strolling around a city to observe buildings and architecture, visiting well known and other historic sites, natural wonders and history/ heritage museums, the five most popular activities in this category overall for the Canadian market.
The participation rates of American travellers looking for accessible destinations were also lower than those of others travellers in all but two activities: visiting historical replicas of cities/towns with historical re-enactments and visiting military or war museums. Similar to their Canadian counterparts, this segment’s participation rates were notably lower in the five most popular activities mentioned above.
Table I. Participation rates for exhibits, architecture, historic sites/buildings and museums by North American travellers who are looking for accessible travel
Canadian travellers American travellers
# of travellers
% of travel segment Index # of
travellers % of travel segment Index
EXHIBITS, ARCHTECTURE, HISTORIC SITES (NET)
Art galleries 146,421 13% 66 1,518,693 10% 68 Historical replicas of cities/towns with historic re-enactments 105,644 9% 89 1,495,428 10% 106
Children's museums 52,836 5% 128 931,028 6% 99 General history or heritage museums 214,455 19% 80 2,580,023 18% 87 Science or technology museums 89,588 8% 76 1,460,175 10% 79 Military / war museums 111,005 10% 105 1,558,838 11% 101 Paleontological/archaeological sites 51,075 5% 63 583,355 4% 74 Strolling around a city to observe its buildings & architecture 317,970 28% 68 3,889,124 26% 76
Well known historic sites or buildings 242,882 21% 71 3,634,242 25% 79 Other historic sites monuments/ buildings 177,975 16% 63 3,269,818 22% 86 Well known natural "wonders" 191,734 17% 70 2,645,789 18% 82
33
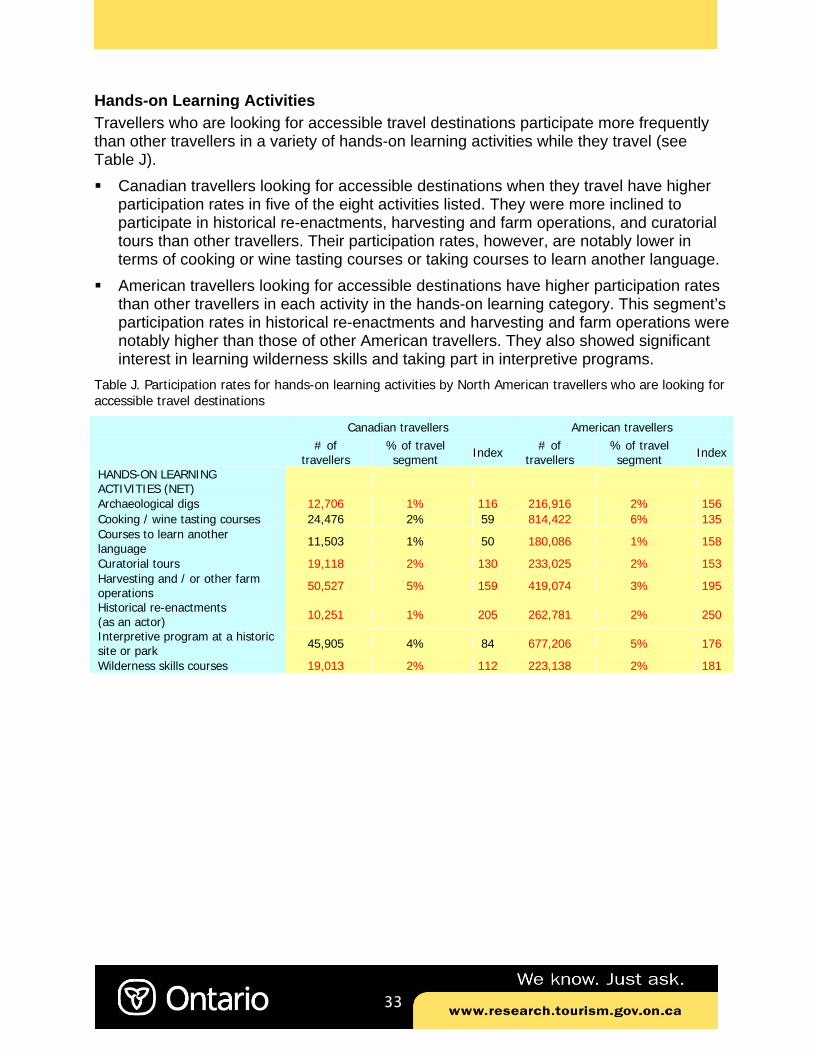
Hands-on Learning Activities Travellers who are looking for accessible travel destinations participate more frequently than other travellers in a variety of hands-on learning activities while they travel (see Table J). Canadian travellers looking for accessible destinations when they travel have higher
participation rates in five of the eight activities listed. They were more inclined to participate in historical re-enactments, harvesting and farm operations, and curatorial tours than other travellers. Their participation rates, however, are notably lower in terms of cooking or wine tasting courses or taking courses to learn another language.
American travellers looking for accessible destinations have higher participation rates than other travellers in each activity in the hands-on learning category. This segment’s participation rates in historical re-enactments and harvesting and farm operations were notably higher than those of other American travellers. They also showed significant interest in learning wilderness skills and taking part in interpretive programs.
Table J. Participation rates for hands-on learning activities by North American travellers who are looking for accessible travel destinations
Canadian travellers American travellers
# of travellers
% of travel segment Index # of
travellers % of travel segment Index
HANDS-ON LEARNING ACTIVITIES (NET)
Archaeological digs 12,706 1% 116 216,916 2% 156 Cooking / wine tasting courses 24,476 2% 59 814,422 6% 135 Courses to learn another language 11,503 1% 50 180,086 1% 158
Curatorial tours 19,118 2% 130 233,025 2% 153 Harvesting and / or other farm operations 50,527 5% 159 419,074 3% 195
Historical re-enactments (as an actor) 10,251 1% 205 262,781 2% 250
Interpretive program at a historic site or park 45,905 4% 84 677,206 5% 176
Wilderness skills courses 19,013 2% 112 223,138 2% 181

34
Spectator Sports/Competitions Travellers who are looking for an accessible travel destination attend spectator events more frequently than other travellers while on a trip (see Table K). Canadian travellers looking for accessible destinations have higher participation rates
in most of the spectator sports in this category, with their participations rates similar or higher than those of other travellers in 10 of the 14 activities listed. Participation rates of this segment are notably higher than those of other travellers in the areas of horse races, equine competitions, professional figure skating and amateur tournaments/ competitions other than sports.
American travellers looking for accessible travel destinations are also attending spectator events relatively more frequently while travelling than other American travellers, with participation rates similar to or higher than other travellers in 10 of the 14 activities in the category. Similar to their Canadian counterparts, this segment was more likely to attend horse races, equine competitions, professional figure skating and amateur tournaments/competitions other than sports but they also favoured attending basketball and soccer games.
Table K. Participation rates for spectator sports and competitions by North American travellers who are looking for accessible travel destinations
Canadian travellers American travellers
# of travellers
% of travel segment Index # of
travellers % of travel segment Index
SPECTATOR SPORTS (NET) Amateur sports tournaments/ competitions 114,334 10% 91 857,663 6% 77
Amateur tournaments/competitions other than sports 25,130 2% 165 259,241 2% 182
Auto races 48,591 4% 105 1,026,180 7% 124 Professional baseball games 61,411 5% 102 1,475,611 10% 93 Professional basketball games 16,210 1% 98 616,844 4% 131 Professional figure skating 17,229 2% 203 180,554 1% 198 Professional football games 42,122 4% 111 913,976 6% 108 Professional golf tournaments 11,122 1% 100 150,333 1% 76 Professional ice hockey games 98,134 9% 91 347,232 2% 92 Professional soccer games 13,157 1% 108 174,972 1% 134 Horse races 73,933 7% 249 532,400 4% 118 Equine (horse) competitions 28,101 3% 211 200,846 1% 111 Curling bonspiel 21,182 2% 114 33,650 * * National/international sporting events, e.g., the Olympics games 10,491 1% 93 125,796 1% 179
* Small sample size, number has been suppressed.
35
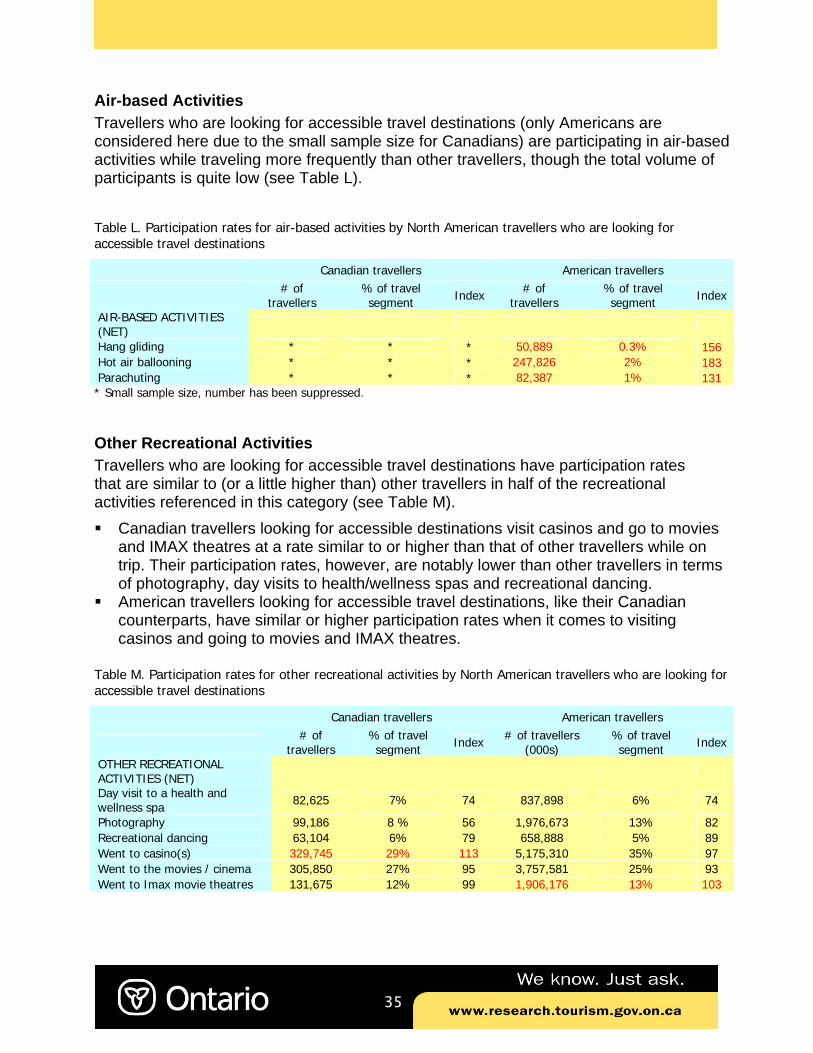
Air-based Activities Travellers who are looking for accessible travel destinations (only Americans are considered here due to the small sample size for Canadians) are participating in air-based activities while traveling more frequently than other travellers, though the total volume of participants is quite low (see Table L).
Table L. Participation rates for air-based activities by North American travellers who are looking for accessible travel destinations
Canadian travellers American travellers
# of travellers
% of travel segment Index # of
travellers % of travel segment Index
AIR-BASED ACTIVITIES (NET)
Hang gliding * * * 50,889 0.3% 156 Hot air ballooning * * * 247,826 2% 183 Parachuting * * * 82,387 1% 131 * Small sample size, number has been suppressed.
Other Recreational Activities Travellers who are looking for accessible travel destinations have participation rates that are similar to (or a little higher than) other travellers in half of the recreational activities referenced in this category (see Table M). Canadian travellers looking for accessible destinations visit casinos and go to movies
and IMAX theatres at a rate similar to or higher than that of other travellers while on trip. Their participation rates, however, are notably lower than other travellers in terms of photography, day visits to health/wellness spas and recreational dancing.
American travellers looking for accessible travel destinations, like their Canadian counterparts, have similar or higher participation rates when it comes to visiting casinos and going to movies and IMAX theatres.
Table M. Participation rates for other recreational activities by North American travellers who are looking for accessible travel destinations
Canadian travellers American travellers
# of travellers
% of travel segment Index # of travellers
(000s) % of travel segment Index
OTHER RECREATIONAL ACTIVITIES (NET)
Day visit to a health and wellness spa 82,625 7% 74 837,898 6% 74
Photography 99,186 8 % 56 1,976,673 13% 82 Recreational dancing 63,104 6% 79 658,888 5% 89 Went to casino(s) 329,745 29% 113 5,175,310 35% 97 Went to the movies / cinema 305,850 27% 95 3,757,581 25% 93 Went to Imax movie theatres 131,675 12% 99 1,906,176 13% 103
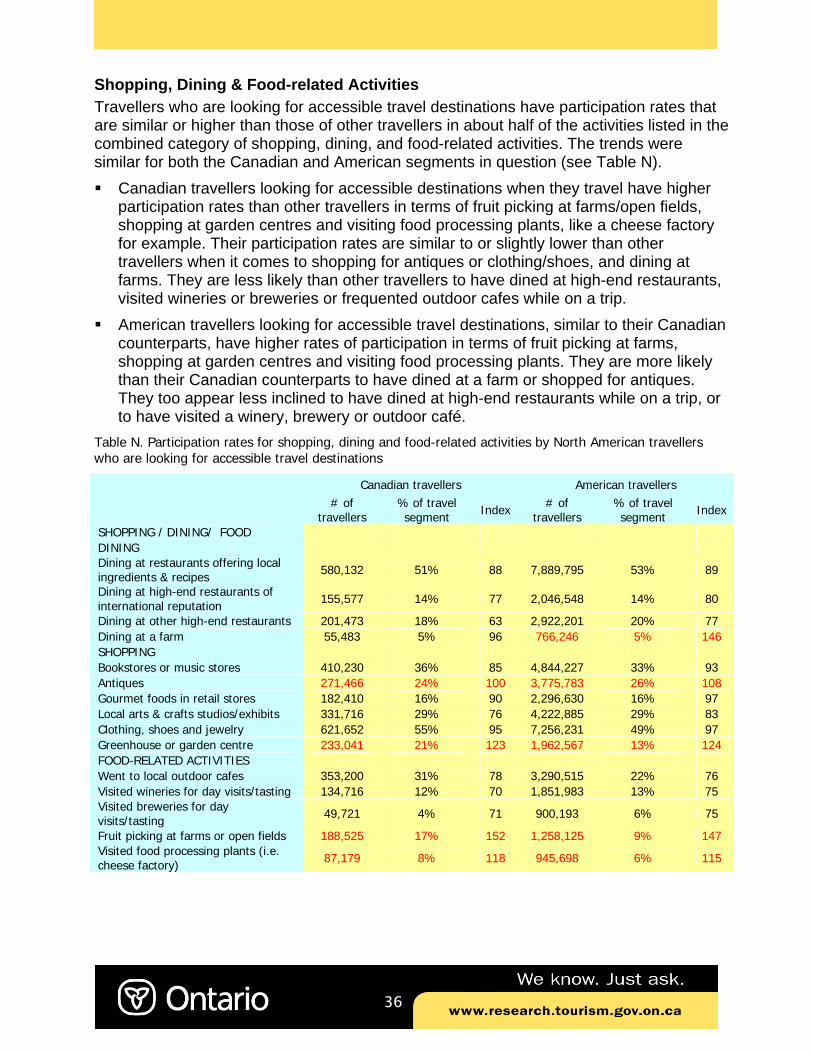
36
Shopping, Dining & Food-related Activities Travellers who are looking for accessible travel destinations have participation rates that are similar or higher than those of other travellers in about half of the activities listed in the combined category of shopping, dining, and food-related activities. The trends were similar for both the Canadian and American segments in question (see Table N). Canadian travellers looking for accessible destinations when they travel have higher
participation rates than other travellers in terms of fruit picking at farms/open fields, shopping at garden centres and visiting food processing plants, like a cheese factory for example. Their participation rates are similar to or slightly lower than other travellers when it comes to shopping for antiques or clothing/shoes, and dining at farms. They are less likely than other travellers to have dined at high-end restaurants, visited wineries or breweries or frequented outdoor cafes while on a trip.
American travellers looking for accessible travel destinations, similar to their Canadian counterparts, have higher rates of participation in terms of fruit picking at farms, shopping at garden centres and visiting food processing plants. They are more likely than their Canadian counterparts to have dined at a farm or shopped for antiques. They too appear less inclined to have dined at high-end restaurants while on a trip, or to have visited a winery, brewery or outdoor café.
Table N. Participation rates for shopping, dining and food-related activities by North American travellers who are looking for accessible travel destinations
Canadian travellers American travellers
# of travellers
% of travel segment Index # of
travellers % of travel segment Index
SHOPPING / DINING/ FOOD DINING Dining at restaurants offering local ingredients & recipes 580,132 51% 88 7,889,795 53% 89
Dining at high-end restaurants of international reputation 155,577 14% 77 2,046,548 14% 80
Dining at other high-end restaurants 201,473 18% 63 2,922,201 20% 77 Dining at a farm 55,483 5% 96 766,246 5% 146 SHOPPING Bookstores or music stores 410,230 36% 85 4,844,227 33% 93 Antiques 271,466 24% 100 3,775,783 26% 108 Gourmet foods in retail stores 182,410 16% 90 2,296,630 16% 97 Local arts & crafts studios/exhibits 331,716 29% 76 4,222,885 29% 83 Clothing, shoes and jewelry 621,652 55% 95 7,256,231 49% 97 Greenhouse or garden centre 233,041 21% 123 1,962,567 13% 124 FOOD-RELATED ACTIVITIES Went to local outdoor cafes 353,200 31% 78 3,290,515 22% 76 Visited wineries for day visits/tasting 134,716 12% 70 1,851,983 13% 75 Visited breweries for day visits/tasting 49,721 4% 71 900,193 6% 75
Fruit picking at farms or open fields 188,525 17% 152 1,258,125 9% 147 Visited food processing plants (i.e. cheese factory) 87,179 8% 118 945,698 6% 115
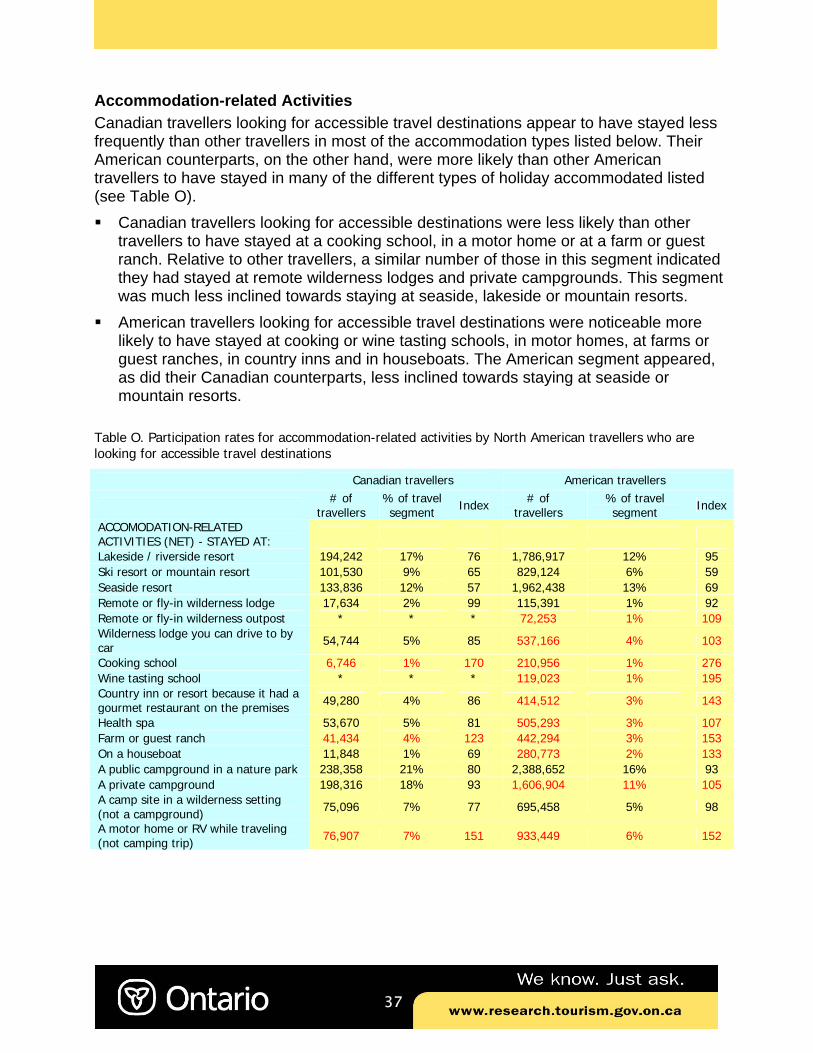
37
Accommodation-related Activities Canadian travellers looking for accessible travel destinations appear to have stayed less frequently than other travellers in most of the accommodation types listed below. Their American counterparts, on the other hand, were more likely than other American travellers to have stayed in many of the different types of holiday accommodated listed (see Table O). Canadian travellers looking for accessible destinations were less likely than other
travellers to have stayed at a cooking school, in a motor home or at a farm or guest ranch. Relative to other travellers, a similar number of those in this segment indicated they had stayed at remote wilderness lodges and private campgrounds. This segment was much less inclined towards staying at seaside, lakeside or mountain resorts.
American travellers looking for accessible travel destinations were noticeable more likely to have stayed at cooking or wine tasting schools, in motor homes, at farms or guest ranches, in country inns and in houseboats. The American segment appeared, as did their Canadian counterparts, less inclined towards staying at seaside or mountain resorts.
Table O. Participation rates for accommodation-related activities by North American travellers who are looking for accessible travel destinations
Canadian travellers American travellers
# of travellers
% of travel segment Index # of
travellers % of travel segment Index
ACCOMODATION-RELATED ACTIVITIES (NET) - STAYED AT:
Lakeside / riverside resort 194,242 17% 76 1,786,917 12% 95 Ski resort or mountain resort 101,530 9% 65 829,124 6% 59 Seaside resort 133,836 12% 57 1,962,438 13% 69 Remote or fly-in wilderness lodge 17,634 2% 99 115,391 1% 92 Remote or fly-in wilderness outpost * * * 72,253 1% 109 Wilderness lodge you can drive to by car 54,744 5% 85 537,166 4% 103
Cooking school 6,746 1% 170 210,956 1% 276 Wine tasting school * * * 119,023 1% 195 Country inn or resort because it had a gourmet restaurant on the premises 49,280 4% 86 414,512 3% 143
Health spa 53,670 5% 81 505,293 3% 107 Farm or guest ranch 41,434 4% 123 442,294 3% 153 On a houseboat 11,848 1% 69 280,773 2% 133 A public campground in a nature park 238,358 21% 80 2,388,652 16% 93 A private campground 198,316 18% 93 1,606,904 11% 105 A camp site in a wilderness setting (not a campground) 75,096 7% 77 695,458 5% 98
A motor home or RV while traveling (not camping trip) 76,907 7% 151 933,449 6% 152