inclusion matters
TRANSCRIPT

1 | P a g e
INCLUSION MATTERS
Annual Report 2019
March 2020
Version 10

2 | P a g e
Introduction
Our Strategy
Our Priorities - Inclusion Strategy
Shaping Our Story
Priority 1: Establish a culture of inclusive leadership
Leadership (WeLead)
Staff Diversity Network subgroups (Staff-led Change)
Communication
Priority 2: Deliver safe, compassionate and equitable care
Clinical Boards
Community & Equity of Health Outcomes
Whipps Cross Redevelopment Programme
Priority 3: Develop inclusive employment policies, systems and practices
Inclusion Ambassador Programme
Quality Improvement (WeImprove)
‘Pause and Review’ - Pre disciplinary checklist
Our Performance
A. Gender Pay Gap report
B. Workforce Disability Equality Standard (WDES)
C. Workforce Race Equality Standard (WRES)
Our Hospitals
Newham University Hospital
Royal London Hospital & Mile End Hospital
St Bartholomew’s Hospital
Whipps Cross University Hospital
Contact Us
Appendices
a. Staff Diversity Networks and Hospital Focused Committees
b. Strategic Priorities Inclusion Strategy 2020-2023
c. WeLead Framework
d. Gender Pay Gap Information 2017 to 2019
e. Workforce Information
f. Catchment Area Population Information

3 | P a g e
Introduction
Barts Health group of hospitals provide a huge range of clinical services to people in east
London and beyond.
We operate from four major hospital sites (The Royal London, St Bartholomew’s, Whipps
Cross and Newham) and a number of community locations, including Mile End hospital.
Around 2.5 million people living in east London look to our services to provide them with
the healthcare they need.
The Royal London in Whitechapel is a major teaching hospital providing local and specialist
services in state-of-the-art facilities. Whipps Cross in Leytonstone is a large general hospital
with a range of local services. Newham in Plaistow is a busy district hospital with innovative
facilities such as its orthopaedic centre. Mile End hospital is a shared facility in Mile End for
a range of inpatient, rehabilitation, mental health and community services, and St
Bartholomew’s in the City, London’s oldest hospital, is a regional and national centre of
excellence for cardiac and cancer care.
As well as district general hospital facilities for three east London boroughs, Tower Hamlets,
Waltham Forest and Newham, we have the largest cardiovascular centre in the UK, the
second largest cancer centre in London, an internationally-renowned trauma team, and the
home of the London Air Ambulance. The Royal London also houses one of the largest
children’s hospitals in the UK, a major dental hospital, and leading stroke and renal units.
East London is a vibrant and diverse area, located east of the City and North of the River
Thames. Population levels are projected to grow by 18% over the next 15 years which is the
fastest growing rate in London; this equates to 345,000 more people. Tower Hamlets and
Newham will see particularly fast rises in their population. There are high levels of
deprivation which impacts on the health of East Londoner’s; life expectancy and healthy life
expectancy are often lower than the national average. Employment rates and housing differ
within and between areas.
This report, provides the reader with information on how we have met our public sector
equality duty and beyond, setting out our strategy, how we are shaping our story around
identified priority areas, a summary of our performance and activity across each of our
hospitals.

4 | P a g e
Our Strategy
In 2012, Barts Health published its first Equality Objectives, setting out the key Diversity and
Inclusion priority areas for action. Since that time, we have reported progress through our
Equality Report “Inclusion Matters”. Each year, we have refreshed these objectives and
refined the goals and associated delivery actions.
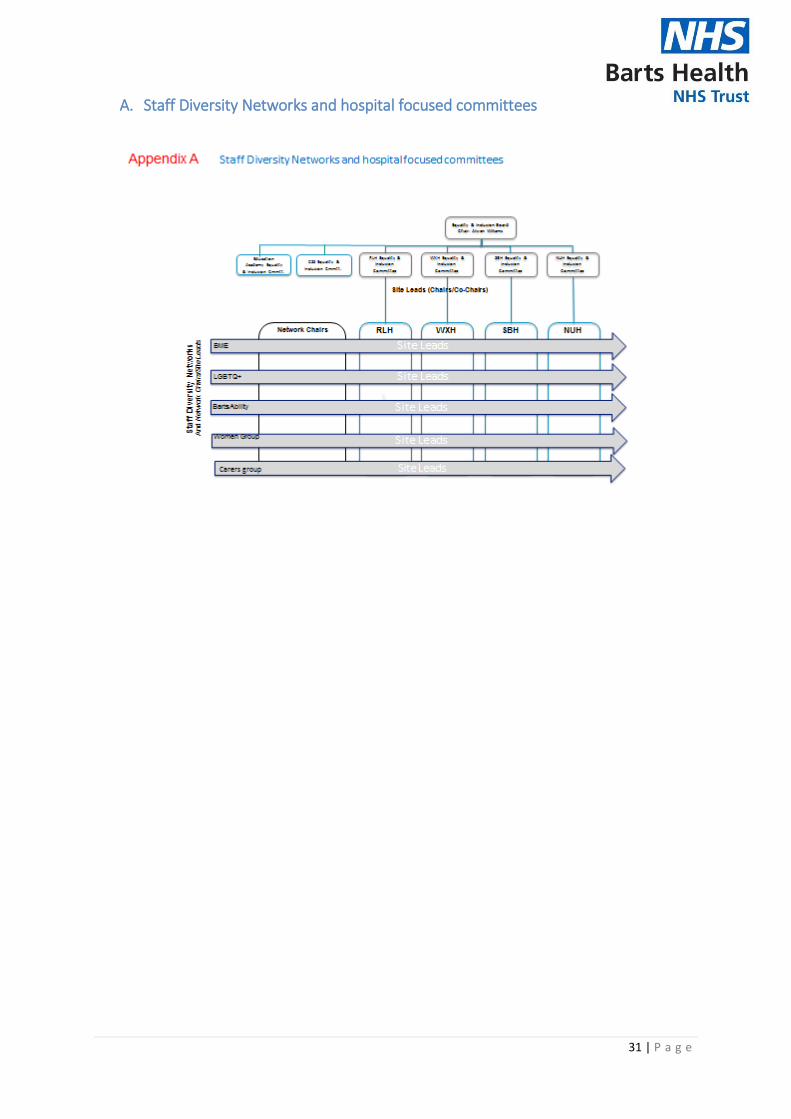
2015 saw a major overhaul of our governance of diversity and inclusion, with the creation of
CEO led Inclusion Board, adopting a shared governance model with our Staff Diversity
Networks and hospital focused committees (See Appendix A).
In September 2018, recognising the need for further focus, we published our first Diversity
and Inclusion Positive Action Charter, crystallising our commitment to take specific and
positive action to tackle under-representation, disadvantage and disproportionality.
Launched in 2019, our People Strategy sets a clear goal for Barts Health to become an
outstanding place to work, in which our WeCare values are visible in the way we work with
each other, our patients and our communities.
In line with our People Strategy, we are now taking a longer-term view of our diversity and
inclusion ambition for step change in the experience of our colleagues, patients, carers and
communities we serve. We have set our Diversity & Inclusion Strategy for the next three
years to drive the momentum necessary to deliver this ambition.
We are committed to Barts Health becoming an inclusive organisation, with equality of
opportunity afforded to all staff, diversity reflected at all levels in the organisation and our
WeCare values visible in all that we do. We are also committed to the delivery of equitable
care to our patients and to play a key role in improving health outcomes in East London and
we are determined to make sustainable progress at pace over the next 3 years.
Our 3 year ambition is for Barts Health to:
1. Ensure our services are equitable in terms of access, outcomes and experience for all
patients and help reduce health inequalities for our local population
2. Be positioned as a leading NHS Trust for delivery of the WRES and WDES by
reporting year-on-year improvements against all metrics;
3. Secure an increase in the number of staff sharing their disability on ESR and
narrowing the gap in their reported experience of working at Barts Health compared
to others;
4. Be recognised for our commitment to our LGBT staff via accreditation in the
Stonewall Workplace Equality Index (WEI) and
5. Have narrowed the gender pay gap by increasing the proportion of females in the
higher pay quartiles, as a reflection of the workforce, which is predominantly female,
and increase number of men in workforce at entry level opportunities (such as in
HCA roles, apprenticeships etc.)

5 | P a g e
We have now consolidated our six Positive Action Charter Commitments
into 3 strategic priorities as shown in figure 1 below:
Our Priorities
Figure 1: Strategic Priorities Inclusion Strategy 2020-2023
For further details on each of the strategic priorities and how we intend to measure our
achievements, please see Appendix B
Shaping Our Story
Using the headings of our three key priority areas, the following section of the report
provides the reader with a summary of activity covered in the last 12 months.
PRIORITY 1: ESTABLISH A CULTURE OF INCLUSIVE LEADERSHIP
In this section we illustrate three areas of work supporting priority one – Leadership
(WeLead) Staff Diversity Network (Staff-led Change) and Communication.
Leadership (WeLead)
Defining what outstanding leadership looks like in Barts Health, and how we will identify,
support and develop WeCare values-based leadership is an important feature of our journey
towards delivering our quality goals of excellent patient safety, best patient experience and
outstanding place to work.
Underpinning WeLead is the intention to have an explicit values-driven leadership
framework to set out what outstanding individual and team leadership looks like at Barts
Health. Our WeCare values set out core behaviours for all those working at Barts Health,
including those with leadership roles and responsibilities. We wish to be explicit about the
leadership skills and abilities required to lead in a WeCare values aligned way.
The WeLead framework is targeted at:
Establishing a Culture of Inclusive Leadership
Delivering Safe, Compassionate &Equitable Care
Inclusive Employment Policies, Systems & Practices

6 | P a g e
Leaders and leadership teams at Barts Health;
those who aspire to be leaders at Barts Health and
all those working with leaders at Barts Health who are interested in understanding
what outstanding leadership involves at Barts Health.
Approved by the Trust Board in January 2020, we will use WeLead Framework to:
Lead our delivery of Outstanding Safe & Compassionate Care
Guide present and future leaders in their careers across the NHS
Set the performance and behaviour expectations we have of ourselves and future
aspiring leaders
Determine the leadership recruitment and selection decisions we make,
Facilitate the induction of new colleagues
Shape our learning & development curricula to support leaders and leadership teams
Build diverse leadership pipelines and talent pools necessary to fulfil our
commitments to reflect the diversity of #teambartshealth at every leadership level
By way of illustration, For our WeCare value of equity, our WeLead framework identifies we
need Barts Health leaders to have qualities and abilities of:
Understanding diversity – appreciating not everyone sees of experiences the world
through the same lens and uses difference as strengths
Curiosity – actively seeks to educate self. Skilled in encouraging and seeking out
different ideas and experiences to enable growth
Courage – recognises that leadership involves personal risk taking. Champion and
role model for the business case for diversity and inclusion
Boldness – recognises rather than denies biases exist. Challenges effectively. Skilled
in reflexivity and enabling that in others
Further details on the WeLead Framework can be found at Appendix C.
Staff Diversity Network subgroups (Staff-led Change)
Our staff Diversity network continues to proactively drive positive change in the Trust and
beyond. The following pages provide the reader with a summary of some of its activities.
BartsAbility

7 | P a g e
Key achievements and reflection on progress:
Trust wide International Day of Person’s with a Disability event in December
BartsAbility has accepted invitations to share our work on developing staff networks,
BartsAbility Passport, and our approach to WDES implementation from a wide range of
other organisations, including Trust’s - Homerton, Portsmouth, Royal Free, North
Middlesex; Mid & South Essex University Hospital group; NHS England & NHS
Improvements; West Hertfordshire NHS, Guys & St Thomas, Royal Brompton & Harefield
NHS Trust, Barnet Enfield & Haringey Trust, St Georges Hospital Tooting NHS Trust,
Lewisham & Greenwich, and North Hants Healthcare NHS Trust.
BartsAbility has participated in the Trust’s Quality Improvement (QI) training and is using
this to deliver 2 key WeImprove projects:
o to support the aligning of network priorities and actions with Barts Health
Inclusion strategy priorities e.g. closing the gap between ESR disability data and
Staff Survey disability reported figures
o to increase the take and speed of funding for reasonable ajustments
Increasing signposting being made by BartsAbility to Reasonable Adjustment fund
contact point – Occupational Health
Looking ahead and plans for 2020
• Support the implementation of the Workforce Disability Equality Standard (WDES) Action
Plan and key priorities of the Trust’s Inclusion Strategy
• BartsAbility Schwartz Round and road show on each hospital site.
• Support the other subgroups of the diversity network as we develop Trust’s focus on
intersectionality.
• Providing opportunities for members to develop leaderships skills by working on
different projects of the network e.g. working on the anticipated duty of Access under
the Equality Act
• Further supporting the pilot of easy read application and Job Description forms and seek
to normalise this in the Trust’s recruitment process.
BME
Key achievements and reflection on progress:

8 | P a g e
Successful Black History Month celebration in October: Quotes from the event
“I’ve worked for Barts for 35years, I left the event uplifted, a take pride in the fact Barts Health
has now pushed the race agenda to the top through the BME network, what an outstanding
celebration the BME network has organised, you’ve raised the bar for the organisation.”
Site leads appointed across each hospital site
BME Network to work with Pathology and NHSBT to increase the number of black
donors especially in respect of providing blood to our Sickle Cell Anaemia patients
Looking ahead and plans for 2020
Themed site meetings for the year
WRES Experts included in Black History Month programme
Continue work with Pathology and NHS Blood & Transfusion to increase the number of
black donors
Carer’s Logo in development
Key achievements and reflection on progress:
Launch of network
Development of Staff Carer’s Policy underway
Appointing Co-Chairs
Network meeting held across each hospital site
Looking ahead and plans for 2020
Complete the development of Staff Carer’s Policy
Needs analysis of staff carers to inform any further review of Trust wide policies
LGBTQ+ network
Key achievements and reflection on progress:
Trust wide LGBTQ+ subgroup activity continues with additional focus on sites with the appointment of co-site leads for each of the Hospital sites now complete
9 | P a g e
Trust wide LGBT History Month activity in February
Development of Trans People Guidelines for staff
Awareness raising activity with Staff Stories on WeShare
Participation in Stonewall Workplace Equality Index (WEI) and hopeful of a significant improvement in our index rating due to be reported early 2020
Organised Trans Awareness session with Inclusion team
Looking ahead and plans for 2020
Developing an action plan following Stonewall Equality Index Feedback session in Feb
Women’s network
Key achievements and reflection on progress:
Focus on Menopause as a BIG conversation during the month(s) of October and
November across each site and as a Trust wide activity
Held ‘We are festive’ events in December with a focus on health &wellbeing, nutrition
etc
Looking ahead and plans for 2020
Planning group already established planning for 6th March Trust wide International
Women’s day event – focus on ‘Inspiring Women of Barts Health’
Site discussions on financial planning sessions being organised on every site for January
Increasing membership and focus on Trust wide issues (e.g. Gender Pay Gap, Flexible
working) now requiring protected administrative duty time or dedicated resource to
support this activity
Playing a key role in informing the development of the GPG action plan for 2020/21
This year has seen the development of a proposal for protected time for staff diversity
network chairs and site leads, in recognition of their key leadership contribution and
supporting in the delivery of the inclusion strategy implementation plan in the coming year.
• Communication Team
We have also worked closely with our staff diversity network subgroups to raise their profile
internally and externally.

10 | P a g e
Key achievements during the year and reflection on progress
We regularly feature blogs from staff diversity network leads and run communications
campaigns for key events throughout the year including Black History Month, LGBT History
Month, Mental Health awareness days, International Women’s Day, Carers Week and Pride.
PRIORITY 2: DELIVER SAFE, COMPASSIONATE AND EQUITABLE CARE
In this section we illustrate examples of pieces of work supporting priority two – Clinical
Boards; link between employment and health, Accessible Communication and the Capital
investment in Whipps Cross.
Last year we agreed that each of our Clinical Boards will have a Priority focusing on Equity.
The table below shows these priorities.
Clinical Boards
BOARD EQUITY OF CARE
Cancer Review of access to services by ethnic group, with a focus on late stage diagnosis in A&E.
Cardiovascular Review access to pacemakers, access to defibrillators Patients likely to decline surgery
Children’s Health
Children with complex needs Qi project Sickle Cell
Emergency Care
ED waits for older people
Medicine Diabetes • Foot Health • Type 1
• Access to insulin pumps
• Access to Endoscopy
Surgery See Cardiovascular
Women & Newborn Health
Reviewing access to care by ethnic group
Review breastfeeding rates by Ethnic Group New consultant appointed with both Public Health and Obstetrics qualification to regularly review data and work with the Equity Data Working Group.
Sexual Health Regularly review data on protected characteristics and innovation fully embedded into QI cycle.
Patient Experience
Standardise methods for collecting information on protected characteristics to facilitate
Table 1: Barts Health Clinical Board Priorities

11 | P a g e
A great example of the work of the clinical boards in tackling access issues
is demonstrated in the work of the Cancer Board.
Cancer Clinical Board
Cancer outcomes in the North East London (NEL) were amongst the poorest in the country as
recently as 2015, but we are now improving at a rate that is exceeding the overall England rate. The
contributing context for NEL is that five of the seven CCGs are classed as the most deprived in the UK
and there is a known link with deprivation and shortened life expectancy, including for cancer.
Consistent delivery against the constitutional access standards since October 2015, for which Bart’s
Health is nationally recognised as bucking the trend, has seen a parallel decline in emergency
presentation for new cancer diagnoses, where patients typically present late (Stage 4): this patient
group has the poorest outcomes. In addition, we have seen an improvement in the proportion of our
Stage 1 and Stage 2 cancer patients diagnosed, so that the WEL CCG group served by Barts Health is
now on a par/better with the national rate, from one of the lowest baselines in 2015.
The NHS Long Term Plan has early cancer diagnosis at the core of its ambitions, including a target of
75% of new cancer patients being diagnosed at an early stage 1 and 2 by 2028.
Strategic, holistic targeted planning to tackle the challenge of equitable access, early cancer
diagnosis in NEL and beyond by example setting, has led to the development of the Mile End Early
Diagnosis Centre (MEEDC). This centre will comprise of two endoscopy rooms, two ultrasound
rooms, as well as leveraging the use of the existing infrastructure including a CT scanner and
educational centre for training.
The current building work at the Mile End site follows a successful bid into NHSE with associated
external scrutiny, extensive engagement with patients and clinicians, and agreement of the clinical
model and principles for an early diagnosis cancer centre, The MEEDC will serve the whole of NEL,
and is founded upon collaborative working with our partners, BHRUT and HUH.
The key aim for the ME EDC is to provide person centred care, pathway excellence and efficiency of
cancer diagnostics across NEL, with opportunities for training of the hard to recruit to cancer
diagnostic specialties, including the development of allied health care professionals. Specific
initiatives are aimed to support hard to reach groups access cancer diagnostics. It is the first of its
kind. Research is also an important aspect of the MEEDC ethos, particularly with the opportunity
provided by one centre consolidation of at risk patient cohorts. Diagramme 1 below shows this
partnership.
12 | P a g e
Community and Equity of Health Outcomes
Barts Health recognises the opportunity it has in playing a major role as an Anchor
Institution for East London. As part of its continued commitment to move from good to
excellent, it seeks to show leadership in the local health economy.
The following are some of the existing work programmes that continue to support this
aspiration:
Community Works for Health local employment programme
Healthcare Horizons healthcare careers work with schools
Project Search
Learning Hub initiative in the Whitechapel Life Sciences development (and interim
proposal with Newham College)
Sustainable Development Management Plan
Sustainable Procurement
Clean Air Hospital Framework workshop at Whipps Cross University Hospital
Linking the Greenway with Newham Hospital as part of greener hospital approaches
The Trust’s Public Health team activities emphasis the clear links with its programmes and
the reduction of health inequalities and improving equity with its community engagement
programmes relating to employment, training and careers.
Communication Team
We have remained committed to ensuring that all of our communication is accessible - with
the use of plain English in all communication for internal and external audiences; subtitles
on films; infographics to ensure messages are understood; and a website and intranet that
meets accessibility standards, translatable into 200 languages and has supporting tools,
including AccessAble.
Key achievements during the year and reflection on progress
Our values are embedded within all our communications collateral, and the team take great
pride in developing communications that reflects our communities.
Looking ahead and over the next year we are committed to broadening our reach by
engaging BAME media outlets, as well as independent bloggers and influencers that could
reach individuals and groups that are not consumers of mainstream media.
Whipps Cross Redevelopment
The work to support the redevelopment of Whipps Cross Hospital continues, a key work
stream has been the engagement work with groups and communities across the boroughs
13 | P a g e
of Waltham Forest, Redbridge and West Essex. The work has focused on
engaging and informing patients and communities about the case for change and finding
out, what patients felt was important to them as part of the redevelopment of the site and
the hospital.
The engagement programme worked with groups with protected characteristics and
communities/patients who could be impacted by any redevelopment of the hospital. In total
from April-August 2019 the programme met over 40 organisations and community groups
including those who work with young people, learning disabilities or long term conditions,
to BME organisations. In total we saw approx. 700 people.
This engagement work has allowed the programme to engage with communities and groups
and to develop a database of organisations to involve and engage as the programme
progresses.
A major success of the engagement programme has been the diversity of the
organisations/communities engaged and how their views that have been used to help
develop our plans for the site. We have also invested support in developing the Community
Engagement Action Group, this group of local residents engages with and provides valuable
feedback to the programme.
We have engaged with a diverse range of groups, service users and communities across the
hospitals footprint who would not have otherwise engaged with us on such a matter as
Hospital redevelopment; examples of these include:
• Carers
• People and groups representing those with long term conditions such as Dementia,
Stroke and Diabetes, the Blind and Partially sighted
• Elderly BME groups and
• Waltham Forest Council of Mosques
Through work with the Children Centres in Redbridge, deprived communities or those
within Social housing communities across Waltham Forest, one of our aims will be to ensure
that we continue the engagement work within our clinical services review.
Looking ahead and plans for 2020 and beyond
As the programme develops, we need to provide assurance that we continue to pay due
regard to the Equalities Act to ensure that any identified impacts due to the redevelopment
are mitigated. The redevelopment of Whipps Cross University Hospital will have more
positive impacts for service users and those with protected characteristics including, a
building which is fully DDA compliant and meets the needs of all our service users.
We need to ensure services and the programme management team are aware of the need
to undertake any Equality Analysis, where any negative impact is identified and to have a
plan to mitigate any impact on patients and the community. Transport and Access has been
14 | P a g e
identified as a key issue for patients and visitors to the site, groups such as
those with a disability that requires a disabled parking space or assistance to and from the
hospital have highlighted this as a key improvement for the new hospital. We will work with
passenger transport groups and Transport for London (TFL).
We are keen to work with our local community groups and equality groups at the design &
brief stage to ensure we develop a site that provides access for their future healthcare
needs. The development of the hospital will also provide a healthcare facility that is fit for
the future and help reduce inequalities for groups. A success factor to this approach will be
ensuring that equalities and engagement is embedded within the programmes work
streams and risk register.
PRIORITY 3: DEVELOP INCLUSIVE EMPLOYMENT POLICIES, SYSTEMS AND PRACTICES
Here we amplify the work that has been done as part of the Inclusion Ambassador
Programme, how we are using the Quality Improvement (QI) methodology to progress the
ED & I work programme and further activity with the ‘Pre-disciplinary’ checklist.
Inclusion Ambassador Programme
The Inclusion Ambassador programme started late 2018 as part of the Inclusive Recruitment
review. Inclusion Ambassadors are volunteers trained to sit on interview panels, to provide
a neutral and unbiased perspective of the interview process to the panel members. The role
of the inclusion ambassador is to:
• Support the recruitment panel in reaching an unbiased recruitment decision
• Highlight with evidence (noted from your own notes and observations during the
interview process) any perceived unconscious bias or advantages of appointing
candidates.
• Remember the Trust WeCare values – Value the perspective and contributions of all
and ensure that all are respected, and that this is followed throughout the process
by the interview panel.
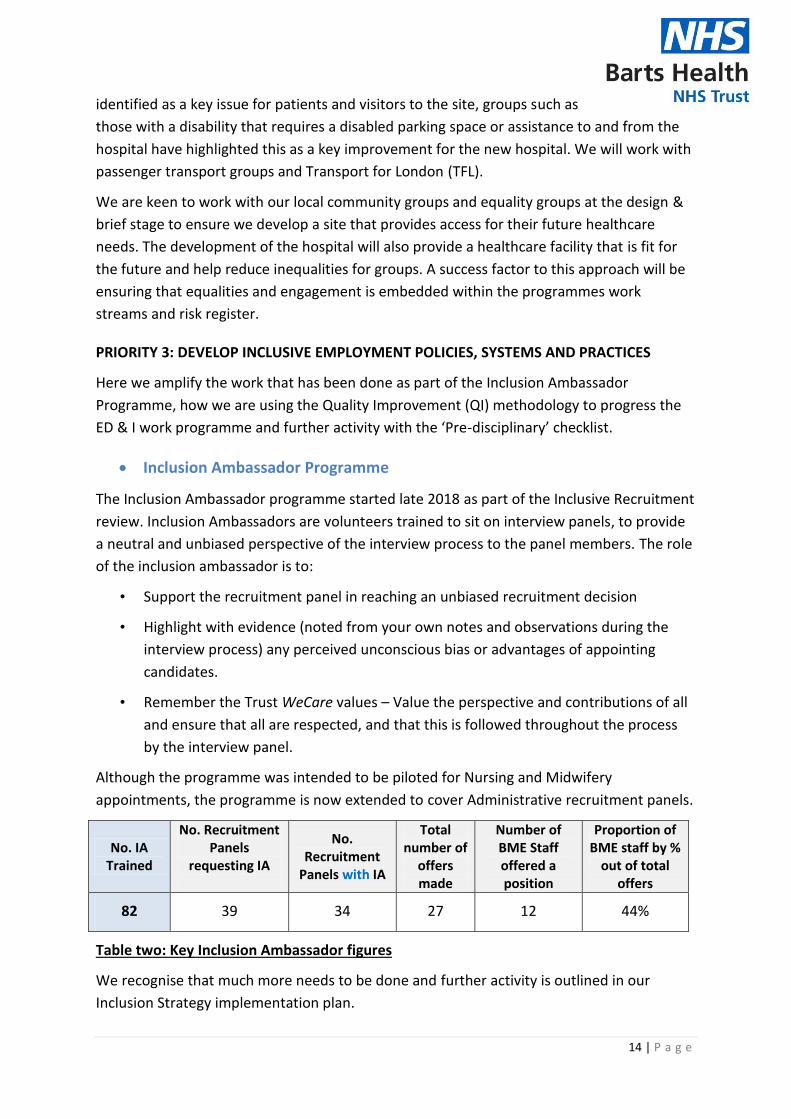
Although the programme was intended to be piloted for Nursing and Midwifery
appointments, the programme is now extended to cover Administrative recruitment panels.
No. IA Trained
No. Recruitment Panels
requesting IA
No. Recruitment
Panels with IA
Total number of
offers made
Number of BME Staff offered a position
Proportion of BME staff by %
out of total offers
82 39 34 27 12 44%
Table two: Key Inclusion Ambassador figures
We recognise that much more needs to be done and further activity is outlined in our
Inclusion Strategy implementation plan.

15 | P a g e
Quality Improvement (WeImprove)
Since we started our Safe and Compassionate improvement journey in 2015, we have
started to see significant improvements over the years. With the introduction of
WeImprove, we seek to drive further improvement by embedding the Quality Improvement
methodology. With regards to the Inclusion agenda, we are building on previous
achievements as documented in a NHS England publication
Examples of WeImprove Inclusion projects include:
• Closing the Gap campaign - encouraging staff to share Disability information on ESR
• Embracing Difference – Posters of staff with a named disability
• Dial Shifters - Talent Management (TMS) - Pipeline Career Development Programme for BME & Female staff
• Pause and Review – Pre disciplinary checklist
Workforce information showed that Black Minority Ethnic (BME) Staff are approximately
twice likely to enter the formal disciplinary process when compared to figures for White
Staff. With approximately 50% of the workforce being from a BME background, and the
Trust’s data showing that a disproportionate number of BME staff were going through the
formal disciplinary process, it became necessary to implement system changes.
With learning’s from Royal Free London NHS Foundation Trust and the known use of the
‘James Reason substitution test’ for cases of serious incidents, the Trust’s CEO led Equality &
Inclusion Board commissioned that a tool be developed to enable a ‘pause and review’
approach.
The main aim of the pre-disciplinary checklist was to combat any ‘rush to judgement’ and
facilitate a ‘pause and review’ process when it comes to undertaking a formal disciplinary or
considering entering the disciplinary process. This process is an example of values into
action and acknowledges the facilitation of a ‘1learning culture’ in the NHS rather than a
‘blame culture’
The pre-disciplinary checklist has been in use for over 2 years and our WRES 3 data for the
past 4 years is as follows:
Barts Health
NHS Trust
2015 2016 2017 2018 2019
2015/16
2.14
2016/17
1.91
2017/18
1.88
2018/19
1.76
2019/20
-
Table 3: WRES 3 data 2015-2018
1 R Kline, 2017 Middlesex Minds https://mdxminds.com/2017/09/19/rethinking-disciplinary-action-in-the-nhs/
16 | P a g e
The Trust is taking part in the PAN London evaluation of WRES 3 and the
case study was included in a recent NHS Resolution publication (2019)
Our Performance
Gender Pay Gap report
Introduction
The Trust recently developed its Inclusion Strategy and has as one of its 5 key goals: to have
narrowed the gender pay gap by increasing the proportion of females in the higher pay
quartiles, as a reflection of the workforce, which is predominantly female, and increase
number of men in workforce at entry level opportunities (such as in HCA roles,
apprenticeships etc.), focusing on SAS (Associate Specialists), Trust Grade doctors and
increasing female leadership in (HFMA) Finance Management positions – over the next
three years.
This the third year of publishing Gender Pay Gap data (GPG). A table comparing data for
2017 to 2019 is included as an Appendix (Appendix D).
The report provides additional focus on the bonus gender pay gap, which for Barts Health
relates to Clinical Excellence Awards (CEAs).
What is Gender Pay Gap?
The gender pay gap is the difference in the average/mean hourly wage of all men and
women across a workforce. If women do more of the less well-paid jobs within an
organisation than men, the gender pay gap is usually bigger.
The gender pay gap is not the same as equal pay, which is related to men and women
earning equal pay for similar jobs or work of equal value. The gender pay gap shows any
disparity of average pay across any given organisation.
Why Report on the Gender Pay Gap?
Employers in Great Britain with more than 250 staff are required by law to publish
information about gender pay. Employers have up to 12 months in which to publish this
information and for the public sector the data relates to the position as at 31st March each
year. This information is both submitted to the central Gender Pay Gap Service as well as on
the organisations own website.
It also goes beyond the standard profiles of male and female staff by band that have
historically been used in the NHS, and looks at pay in the whole including elements such as
enhancements for unsocial working.
This report is prepared in response to a mandatory requirement to measure and publish
Barts Health gender pay gap information. We are required to submit and publish this data by
30 March 2020.
17 | P a g e
The following data provides 2019 gender pay gap workforce information as
follows:
Average/mean hourly pay by staff group
Median pay by staff group
Clinical Excellence awards by age
Consultant gender/age profile
It is worth noting that Equality and Human Rights Commission (EHRC) is responsible for
monitoring compliance and can take enforcement action.
Gender Pay Gap: hourly rates of pay
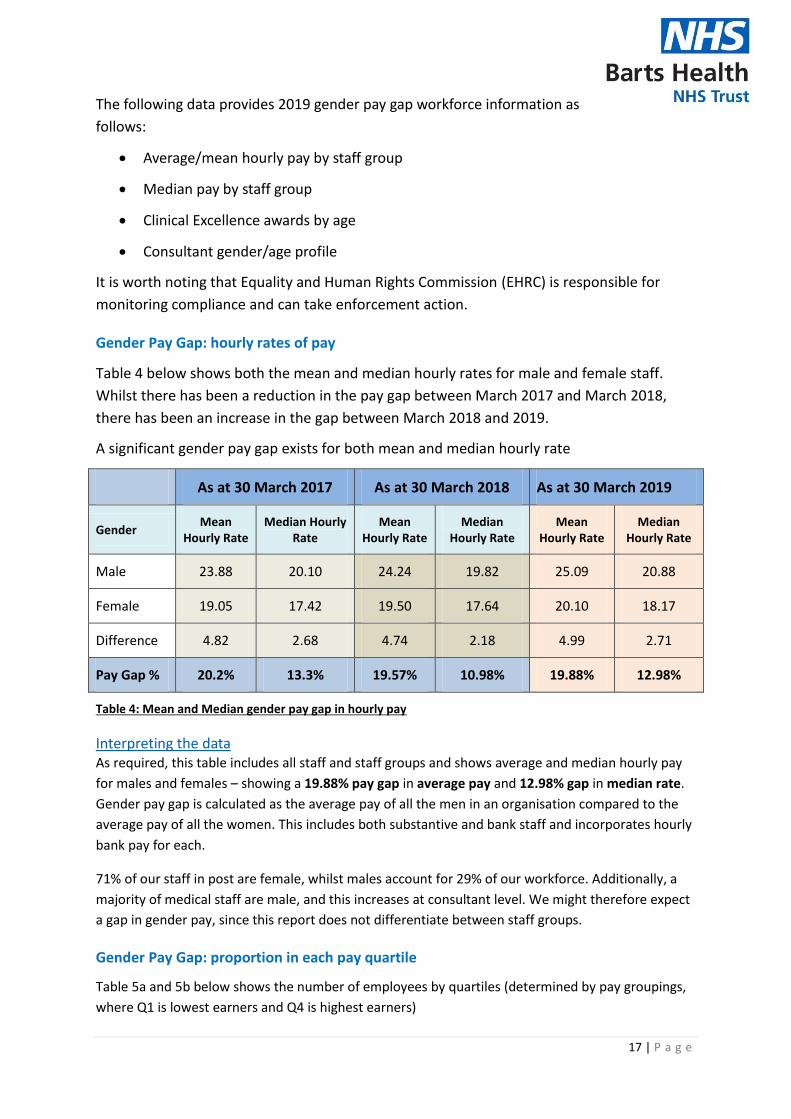
Table 4 below shows both the mean and median hourly rates for male and female staff.
Whilst there has been a reduction in the pay gap between March 2017 and March 2018,
there has been an increase in the gap between March 2018 and 2019.
A significant gender pay gap exists for both mean and median hourly rate
As at 30 March 2017 As at 30 March 2018 As at 30 March 2019
Gender Mean
Hourly Rate Median Hourly
Rate Mean
Hourly Rate Median
Hourly Rate Mean
Hourly Rate Median
Hourly Rate
Male 23.88 20.10 24.24 19.82 25.09 20.88
Female 19.05 17.42 19.50 17.64 20.10 18.17
Difference 4.82 2.68 4.74 2.18 4.99 2.71
Pay Gap % 20.2% 13.3% 19.57% 10.98% 19.88% 12.98%
Table 4: Mean and Median gender pay gap in hourly pay
Interpreting the data As required, this table includes all staff and staff groups and shows average and median hourly pay
for males and females – showing a 19.88% pay gap in average pay and 12.98% gap in median rate.
Gender pay gap is calculated as the average pay of all the men in an organisation compared to the
average pay of all the women. This includes both substantive and bank staff and incorporates hourly
bank pay for each.
71% of our staff in post are female, whilst males account for 29% of our workforce. Additionally, a
majority of medical staff are male, and this increases at consultant level. We might therefore expect
a gap in gender pay, since this report does not differentiate between staff groups.
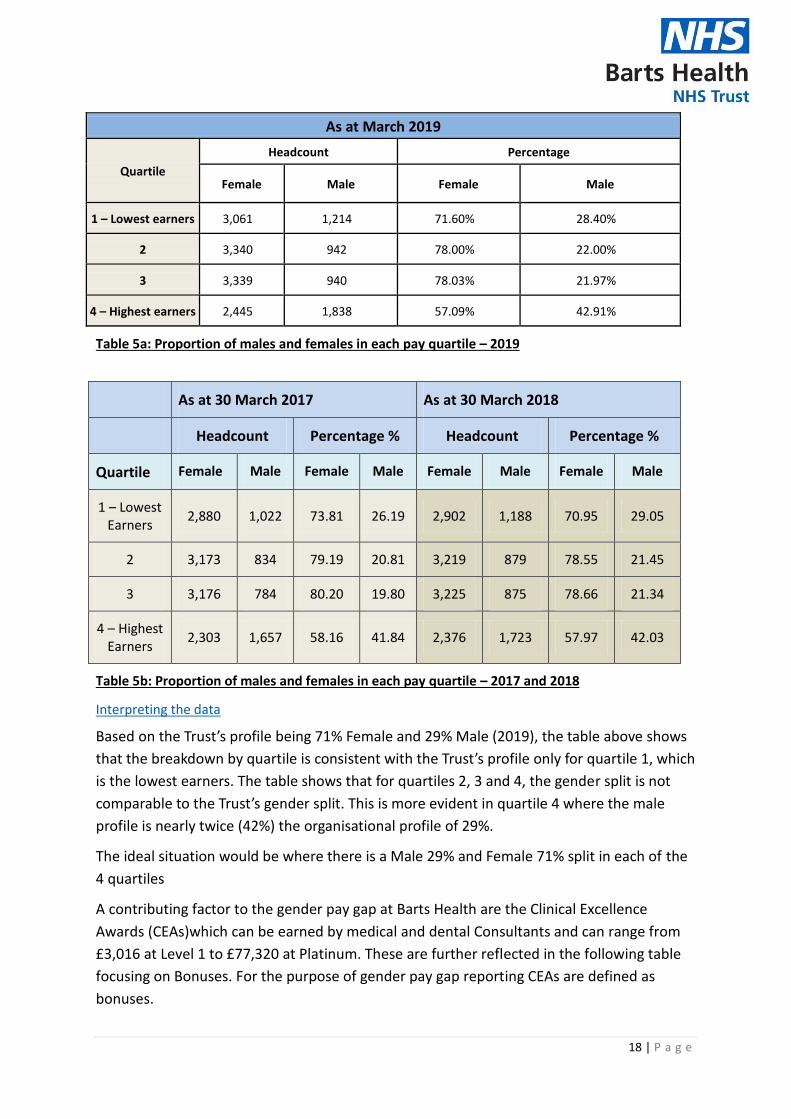
Gender Pay Gap: proportion in each pay quartile
Table 5a and 5b below shows the number of employees by quartiles (determined by pay groupings,
where Q1 is lowest earners and Q4 is highest earners)
18 | P a g e
As at March 2019
Quartile
Headcount Percentage
Female Male Female Male
1 – Lowest earners 3,061 1,214 71.60% 28.40%
2 3,340 942 78.00% 22.00%
3 3,339 940 78.03% 21.97%
4 – Highest earners 2,445 1,838 57.09% 42.91%
Table 5a: Proportion of males and females in each pay quartile – 2019
As at 30 March 2017 As at 30 March 2018
Headcount Percentage % Headcount Percentage %
Quartile Female Male Female Male Female Male Female Male
1 – Lowest Earners
2,880 1,022 73.81 26.19 2,902 1,188 70.95 29.05
2 3,173 834 79.19 20.81 3,219 879 78.55 21.45
3 3,176 784 80.20 19.80 3,225 875 78.66 21.34
4 – Highest Earners
2,303 1,657 58.16 41.84 2,376 1,723 57.97 42.03
Table 5b: Proportion of males and females in each pay quartile – 2017 and 2018
Interpreting the data
Based on the Trust’s profile being 71% Female and 29% Male (2019), the table above shows
that the breakdown by quartile is consistent with the Trust’s profile only for quartile 1, which
is the lowest earners. The table shows that for quartiles 2, 3 and 4, the gender split is not
comparable to the Trust’s gender split. This is more evident in quartile 4 where the male
profile is nearly twice (42%) the organisational profile of 29%.
The ideal situation would be where there is a Male 29% and Female 71% split in each of the
4 quartiles
A contributing factor to the gender pay gap at Barts Health are the Clinical Excellence
Awards (CEAs)which can be earned by medical and dental Consultants and can range from
£3,016 at Level 1 to £77,320 at Platinum. These are further reflected in the following table
focusing on Bonuses. For the purpose of gender pay gap reporting CEAs are defined as
bonuses.
19 | P a g e
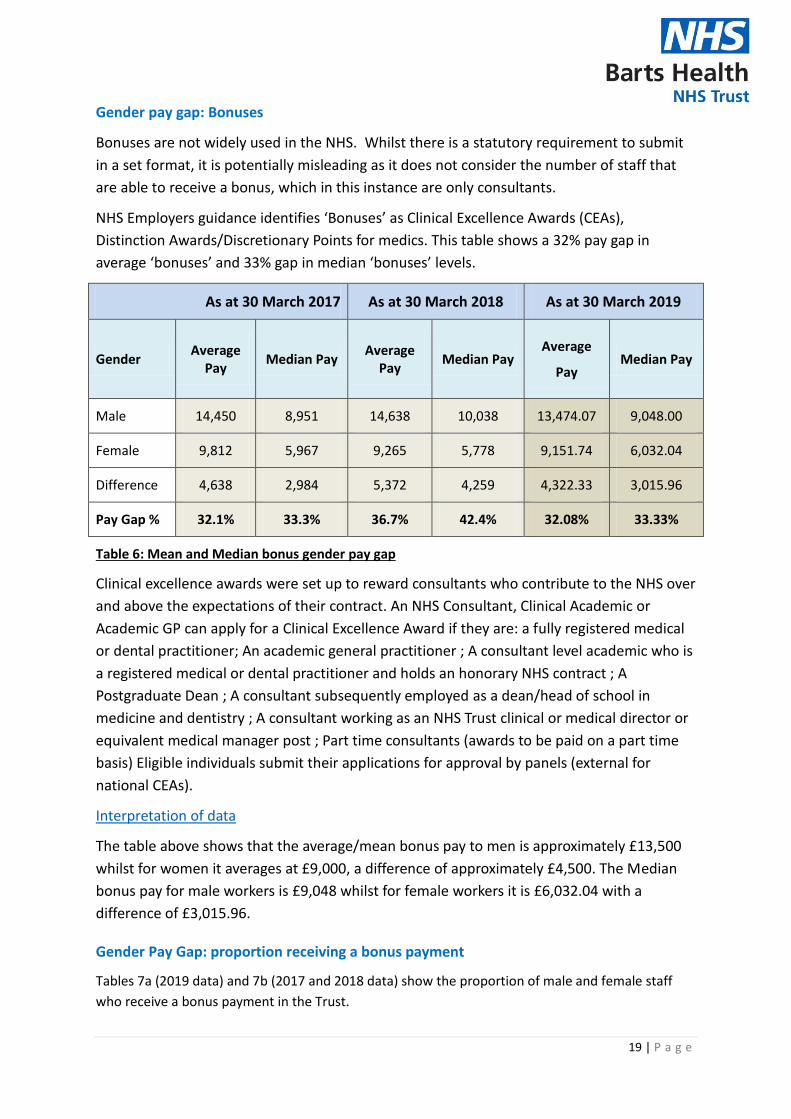
Gender pay gap: Bonuses
Bonuses are not widely used in the NHS. Whilst there is a statutory requirement to submit
in a set format, it is potentially misleading as it does not consider the number of staff that
are able to receive a bonus, which in this instance are only consultants.
NHS Employers guidance identifies ‘Bonuses’ as Clinical Excellence Awards (CEAs),
Distinction Awards/Discretionary Points for medics. This table shows a 32% pay gap in
average ‘bonuses’ and 33% gap in median ‘bonuses’ levels.
As at 30 March 2017 As at 30 March 2018 As at 30 March 2019
Gender Average
Pay Median Pay
Average Pay
Median Pay Average
Pay Median Pay
Male 14,450 8,951 14,638 10,038 13,474.07 9,048.00
Female 9,812 5,967 9,265 5,778 9,151.74 6,032.04
Difference 4,638 2,984 5,372 4,259 4,322.33 3,015.96
Pay Gap % 32.1% 33.3% 36.7% 42.4% 32.08% 33.33%
Table 6: Mean and Median bonus gender pay gap
Clinical excellence awards were set up to reward consultants who contribute to the NHS over
and above the expectations of their contract. An NHS Consultant, Clinical Academic or
Academic GP can apply for a Clinical Excellence Award if they are: a fully registered medical
or dental practitioner; An academic general practitioner ; A consultant level academic who is
a registered medical or dental practitioner and holds an honorary NHS contract ; A
Postgraduate Dean ; A consultant subsequently employed as a dean/head of school in
medicine and dentistry ; A consultant working as an NHS Trust clinical or medical director or
equivalent medical manager post ; Part time consultants (awards to be paid on a part time
basis) Eligible individuals submit their applications for approval by panels (external for
national CEAs).
Interpretation of data
The table above shows that the average/mean bonus pay to men is approximately £13,500
whilst for women it averages at £9,000, a difference of approximately £4,500. The Median
bonus pay for male workers is £9,048 whilst for female workers it is £6,032.04 with a
difference of £3,015.96.
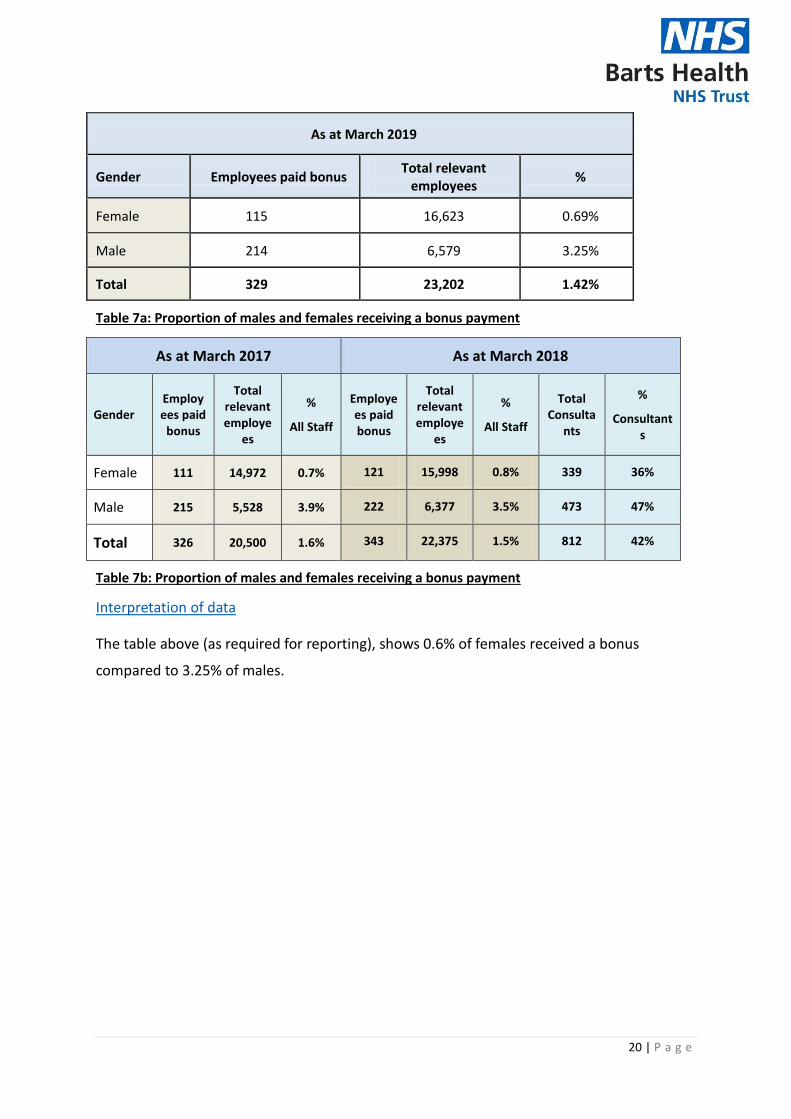
Gender Pay Gap: proportion receiving a bonus payment
Tables 7a (2019 data) and 7b (2017 and 2018 data) show the proportion of male and female staff
who receive a bonus payment in the Trust.
20 | P a g e
As at March 2019
Gender Employees paid bonus Total relevant
employees %
Female 115 16,623 0.69%
Male 214 6,579 3.25%
Total 329 23,202 1.42%
Table 7a: Proportion of males and females receiving a bonus payment
As at March 2017 As at March 2018
Gender Employees paid
bonus
Total relevant employe
es
%
All Staff
Employees paid bonus
Total relevant employe
es
%
All Staff
Total Consulta
nts
%
Consultants
Female 111 14,972 0.7% 121 15,998 0.8% 339 36%
Male 215 5,528 3.9% 222 6,377 3.5% 473 47%
Total 326 20,500 1.6% 343 22,375 1.5% 812 42%
Table 7b: Proportion of males and females receiving a bonus payment
Interpretation of data
The table above (as required for reporting), shows 0.6% of females received a bonus
compared to 3.25% of males.

21 | P a g e
Table 8: Clinical Excellence Awards by Age profile
A closer look at the CEA shows a higher representation in the 51 to 55 age group followed closely by
the 46 to 50 age group.
When you look at an age profile of consultants there remains an difference at each age group
although this is near the 1% mark
Table 9: age and gender profile for consultant CEA
A further breakdown of this information by gender shows a higher representation of Men in both
the 51 to 55 and 46 to 50 age group followed by 56 to 60. Looking ahead, this is also noticed in the
41 to 45 age group. With the younger age groups i.e. 31 to 35 and 36 to 40 however, we are
beginning to see more Female recipients compared to Male.
22 | P a g e
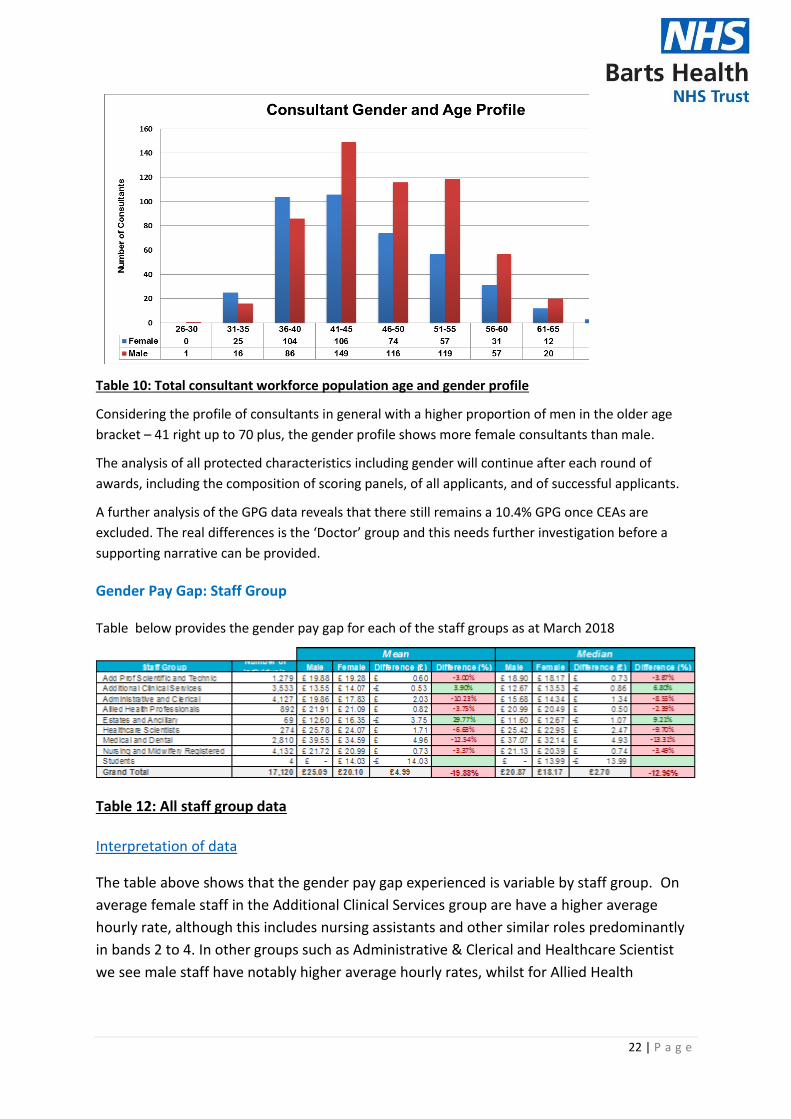
Table 10: Total consultant workforce population age and gender profile
Considering the profile of consultants in general with a higher proportion of men in the older age
bracket – 41 right up to 70 plus, the gender profile shows more female consultants than male.
The analysis of all protected characteristics including gender will continue after each round of
awards, including the composition of scoring panels, of all applicants, and of successful applicants.
A further analysis of the GPG data reveals that there still remains a 10.4% GPG once CEAs are
excluded. The real differences is the ‘Doctor’ group and this needs further investigation before a
supporting narrative can be provided.
Gender Pay Gap: Staff Group
Table below provides the gender pay gap for each of the staff groups as at March 2018
Table 12: All staff group data
Interpretation of data
The table above shows that the gender pay gap experienced is variable by staff group. On
average female staff in the Additional Clinical Services group are have a higher average
hourly rate, although this includes nursing assistants and other similar roles predominantly
in bands 2 to 4. In other groups such as Administrative & Clerical and Healthcare Scientist
we see male staff have notably higher average hourly rates, whilst for Allied Health

23 | P a g e
Professionals and Nursing and Midwifery staff we still see a higher average
hourly rate for men, albeit a closer gap.
As this includes bank work further analysis is required to understand the impact of bank
work on the average hourly rate.
As a Trust, we are disproportionately represented by women at the lower bands compared to the
higher bands and for new starters, there is not significant difference in the mean hourly rates being
earnt at the different bands although with a higher proportion of women starting in the lower bands
this does not help reduce the gender pay gap.
Next steps on the Gender Pay Gap
This is the Trust’s third year of reporting and engagement with relevant stakeholders such as the
Women’s network and our medical staff continues. Much more needs to be understood and further
analysis is required however, under the direction of the Trust Equality & Inclusion Board, the initial
steps from this report are as shown below:
a. Obtain internal sign-off for publication (March Trust Board )
b. Publish on Trust internet page and submit on government portal by 30 March 2020
c. The Trust Inclusion Board will oversee the development of clear objectives in this area for
the gender pay gap identified and the appointment of leadership and resources required
d. Establish Gender Pay Gap ‘Task & Finish’ group comprising members from Women’s
network with actions to inform GPG action planning with early pointers including conducting
‘GPG awareness raising events’, showcasing staff stories on Flexible working and Male
partners taking parental leave etc.
e. Report will be discussed at each site Inclusion Group, JLNC & People Leadership Team
f. As report functionality develops, we will undertake further analyses of pay gaps to build a
clearer picture of drivers
g. These findings will be incorporated in to the following reviews of policy and practice at the
Trust (enablers outlined in Inclusion strategy implementation plan 2020-2023):
h. Building capacity for delivery of the Career Development Programme for female and BME
staff
i. Inclusive Recruitment Work stream
ii. Inclusive leadership programme
iii. Reciprocal Mentoring Programme
iv. Flexible working policy and Health Roster implementation
i. Following national negotiations, the CEA process is to be reviewed in line with the reform of
local CEAs, which include a move to time limited payment The committee is asked to note
the findings and next steps, ahead of publication by 30th March
j. Women’s network to review the report with comments to inform further shaping of action
plan

24 | P a g e
Workforce Disability Equality Standard (WDES)
The Trust Board received the full 2019 WDES report at its meeting in August 2019. The
Workforce Disability Equality Standard (WDES) is a data based standard that uses a series of
metrics to help measure and improve the experiences of staff with a disability in the NHS.
The WDES slightly differs from the Workforce Race Equality Standard (WRES) with ten
metrics, whilst WRES has nine, also amongst its measures, WDES focuses on:
(a) staff engagement/ staff networks for staff, with a disability, compared to staff
without a disability and the overall engagement score for the organisation; and
(b) looks at the action taken to facilitate the voice of staff with a disability.
The WDES is designed to help us to get a better understanding of the issues faced by staff
with a disability; this activity will increase our understanding of needs of patients with
disabilities and improve patient outcomes. In early 2019, with protected funds authorised
by Group Director of People, a WDES Project Officer role was approved to support the
implementation of the Trust’s WDES work programme.
Implementing WDES supports the Trust’s ‘New Era’ (changing the mind-set) whilst focusing
on disability as an asset, it also supports positive culture change through action planning
that enables a more inclusive environment and increased focus on voice of staff with a
disability.
Following a series of WDES workshops, our WDES information was presented to Trust Board
in August 2019 together with the supporting Action Plan.
Workforce Race Equality Standard (WRES)
The Trust Board received the full 2019 WRES report at its meeting in September 2019.
Our People Strategy has a clear goal for Barts Health to become an outstanding place to
work, in which our WeCare values are visible in the way we work with each other, our
patients and our communities. Our Inclusion Strategy amplifies our commitment to
becoming an inclusive organisation, with equity of opportunity afforded to all staff and
diversity reflected at all levels in the organisation. A key component of our three-year
ambition includes being positioned as a leading NHS Trust for the delivery of the Workforce
Race Equality Standard (WRES) by reporting year on year improvements against all metrics.
This ambition has informed some of the improvement actions as reported in our annual
WRES report 2019, such as:
Introduction of Inclusion Ambassadors on recruitment panels, with a pilot starting
with Nursing and Midwifery now expanded to include senior administrative roles;
‘Pause and Review’ (a process that requires the manager to have a discussion with a
senior member of the site leadership team before progressing formal disciplinary
procedures) pre-disciplinary checklist

25 | P a g e
Continued Inclusion-Lab activity with our Leadership team and Staff
Diversity Network leads which saw over 100 of our top leaders and staff diversity network
leads benefitting from sessions delivered by Dr Eden Charles from NHS London
Leadership Academy.
The Trust has invested in two additional WRES experts, each bringing their expertise
to support the improvement of workforce race equality at Barts Health.
We have started to see some improvements for:
• WRES 1 – Increase Percentage of BME staff in Band 8a and above in 2018/19 when
compared to 2017/18
• WRES 3 - Relative likelihood of staff entering the formal disciplinary process, as
measured by entry into a formal disciplinary investigation, shows a reduction in
likelihood to 1.76 in 2018/19 from 1.88 in 2017/18.
Our Hospitals
NEWHAM UNIVERSITY HOSPITAL
Performance/overview of the year 2019
The site Equality and Inclusion committee continues to meet on a monthly basis. Regular items
for consideration by committee members include the review of Newham Hospital's Workforce
data, staff survey results and the prioritised support for career development and talent
management of staff.
Project Search continues to be supported at the Newham site.
Chief Executive of Newham Hospital, Tony Halton, has successfully refreshed and re-launched
the Equality and Inclusion committee with wider membership.
Key achievements during the year
Improving culture through Newham's Culture and Leadership Programme
Visible leadership
Completed the Culture and Leadership questionnaire. This is different to the NHS Staff Survey
in that the questions are specifically about leadership behaviour.
Looking ahead – plans for 2020
Development of the Site implementation plan of the Trust’s Inclusion Strategy
Move to ‘Good’ and then ‘Outstanding’ in the eyes of patients, staff and regulators, making
sure that every patient’s experience is as good as it possibly can be, and that all staff are proud
and happy to work at Newham.
26 | P a g e
Royal London and Mile End Hospitals (RLH/MEH)
Performance/overview of the year 2018/19
The Equality and Inclusion Committee is now co-chaired by the deputy Chief Executive Officer, and the
Head of nursing Gynaecology/Site Lead nurse Cancer care and reporting to the Trust wide Equality &
Inclusion Board. Meetings have now shifted to monthly to reflect the busy agenda. This includes sub-
group reports, and discussions around significant events and Trust wide priorities.
Attendance includes invited representatives from each Division, staffing representatives (cross section),
Staff Side, staff diversity network subgroups and other corporate departments e.g. Estates and
Facilities, Trust communications and Trust ‘Speak Up Guardian’.
Key Equality & Inclusion challenges during the year
Uncertainty around Brexit
Divisional staff representation at meetings.
Key achievements & Reflection on progress. Highlights during the reporting period include:
Improved patient access with accessibility guidelines developed by AccessAble.
RLH/MEH staff part of first cohort of trained Mental Health First Aiders (MHFA) trained
Listening to Staff and Patient Stories with learning outcomes
Responding to 2018 Staff Survey report, with support offered to implement action plans in response to identified themes e.g. recruitment or bullying and harassment.
Raising awareness among RLH/MEH staff about the different staff diversity network subgroups.
Site based Black History Month celebrations.
Interview skills Technique workshop with over 100 participants and increased number of senior staff signing up as mentors.
Interview panels now having an Inclusion Ambassador for all posts 8a and above.
Looking ahead and plans for 2020
In response to the Trust Inclusion Strategy Implementation Plan, proposing to specifically highlight, the
following actions:
Explore & implement reciprocal mentoring (Priority 1)
To develop the RLH/MEH as an Anchor institution (Priority 2)
Refresh ‘Your Health Matters Programme’ at the RLH (Priority 3)
Respond to the 2018 Staff Survey, with support offered to implement action plans in response to identified themes e.g. recruitment or bullying and harassment.
Following Brexit, to review plans and impact on workforce and patient’s demography.
Review of RLH/MEH WRES figures and formulating a realistic action plan.
Continue to support staff in achieving full potential within the workplace by ensuring access to mentors, role models, training and career development opportunities and supporting retention at RLH/MEH and in the development of Trust’s Health Talent Management Framework by raising awareness of and ensure IHI project Dial Shifters are implemented
Support Trust’s bid for top 100 Stonewall employers listing by 2022 and engaging with PRIDE

27 | P a g e
celebrations
Introduce a “link role” with the aim of increasing awareness and participation of our WeCare
values
ST BARTHOLOMEW’S HOSPITAL
Performance / overview of the year 2019/20:
Our goals of establishing Network leads with Executive sponsors were achieved this year with regular
forum meetings and staff engagement. This year we worked collaboratively on site with the
communication team and rest of management team to share knowledge, resources and activities
across the networks.
As a site, we piloted more training for Mental Health First Aiders (MHFA’s) and Inclusion Ambassadors
(IA’s) for interview panels. We appointed a lead for the MHFA’s who worked alongside Health and Well-
Being lead to launch a Standard Operating Procedure for MHFA’s. Also, we were able to have support
mechanisms for students, by training a Diversity champion on site.
We facilitated Schwartz Rounds with site leads in attendance which represented topics from across the
networks. This year we were aiming for an Inclusive leadership Training day for managers, but decided
to delay for the new year. On the other hand, much Diversity training has been accessed by staff this
year.
Key achievements during the year and reflection on progress:
There were 13 Mental Health First Aiders (MHFA) trained on site (across the floors) and their details
advertised for staff to arrange drop in sessions. MHFA’s have been asked to provide feedback to
Occupational leads and meet on a regular basis. As a site, we will propose to review also the benefits of
trained MHFA’s.
Approximately 15 Inclusion Ambassadors have been trained for interview panels and were working
collaboratively with the Recruitment team on site and Trust wide. We have also appointed a lead for
IA’s who will be able to feedback any concerns. Moreover, in the future we would like to ensure
deployment and local benefits review for recently trained IAs”.
Two exec sponsors participated as Reverse mentors with Network Leads/WRES expert. This consisted
of shadowing and attendance at Board meetings where the opportunity was given to reflect on
proceedings. There is an expectation of a Trust wide approach to Reverse Mentoring to be launched
with relevant model and training in the new year.

28 | P a g e
Looking ahead – plans for 2020 and beyond
For 2020, we would like to strengthen the Equality and Inclusion leadership, so we have formed an
Equality Committee Subgroup (consisting of site leads and exec sponsors only) to meet on alternate
months. Expand promotion of local network events to increase attendance.
Also, we would like to continue to work collaboratively with the Quality and Efficiency team to further
develop QI projects that will support Equality and Inclusion initiatives.
We are hoping to utilise the expertise of the WRES expert to look at workforce data alongside WRES
reporting across divisions on a quarterly basis if possible, also to include WDES data.
We would like to see a more structured approach to the MHFA drop in sessions and ensure that
managers and staff are able to access the service provided.
As a site, we were able to agree with forum members what our deliverables would be over a 3 year
period based on the Inclusion strategy, which are as follows:
• Working with Stonewall to provide further training for staff on Trans and LGBTQ+ awareness
• Working more with communities on projects, for example, Project search
• AccessAble assessment for staff environment, i.e. staff meeting rooms.
Whipps Cross University Hospital
Performance/overview of the year 2017/18
Whipps Cross has established a functioning Equality and Inclusion Committee that this year has
managed to meet regularly and most latterly appointed network leads. The Equality and Inclusion
Committee has been incorporated into the Hospital’s governance structure and reports to the People
and Values Committee, a sub-committee of the Hospital Management Board. The engagement locally
in terms of getting network leads into place, publicising the inclusion ambassadors and staging of the
recent Black History Month celebrations have been a cause for celebration. Early work has begun on
assessing ourselves against the Diversity and Inclusion Positive Action Charter so we have a programme
of work that will run through 2020. Challenges will remain about balancing capacity with operational
delivery, but with increasing numbers of permanent staff in post, we are optimistic this will improve.
Key Equality & Inclusion challenges during the year
Low capacity and low fill rates for vacancies impacting the pace of change
Adequately communicating events and meetings - Communications Plan to address this in 2020

29 | P a g e
Key achievements and Reflection on progress
Diarised programme of Equality and Inclusion activity
Appointed to Network Site Lead Roles: Women, BME, LGBT and Disability
Shared and socialised Trust’s equality objectives through Team Talk
Undertaken initial gap analysis against Positive Action Charter
Held local training on ‘Unconscious Bias’
Appointed 3 inclusion ambassadors for sitting on interview panels
Recipient of NHS 70 Windrush Award – Dr Sinha
Whipps Cross has seen real momentum gather and being sustained. This has been led by the
Senior Team and an enthusiastic and committed group of staff whose ideas and feedback will
lead to real change.
Workforce Transformation was agreed as one of WX site priorities with Equality and Inclusion
at the heart of that programme
Looking ahead – plans for 2019/20
Closer engagement with local stakeholders on the E&I journey at Whipps Cross
Early adoption of Inclusion Ambassadors on Interview Panels
Our staff engagement strategy will have 6 Equality and Inclusion events
Establishing the Equality and Inclusion Agenda as core business for our Divisions.
Further progress with WRES data across all bands – particularly senior bands.
Organising DisabledGo/AccessAble assessment and prioritisation of outputs.
Contact us
We would like to hear from you and welcome your feedback, so if you have any comments or
questions regarding this report or suggestions, please write to us. You can email:
[email protected] or write to:
The Inclusion Team
People Development Directorate
Barts Health NHS Trust
Ground Floor, 9 Prescot Street
London, E1 8PR
Twitter @NHSBartsHealth
Appendices
A. Staff Diversity Networks and hospital focused committees
B. Strategic Priorities Inclusion Strategy
C. WeLead Framework
D. Gender Pay Gap Information 2017 to 2019
E. Workforce Information
30 | P a g e
F. Catchment area/Local Population information
31 | P a g e
A. Staff Diversity Networks and hospital focused committees

32 | P a g e
B. Strategic Priorities Inclusion Strategy 2020 to 2023
PRIORITY ONE
A. Establish a culture of inclusive leadership, with senior leadership roles reflecting
diversity, with thriving staff diversity networks and our WeCare values visible and
impactful across the Trust
We will measure achievement as follows:
• Ensure the proportion of our senior leaders at Bands 8a and above (VSM) reflect
overall proportions of the workforce as a whole by 2029 (e.g. 52% of leaders being
BAME in line with profile in the overall workforce. This equates to recruiting 87
additional leaders of BAME ethnicity, on 2018 baseline, over the next 3 years
confirming what that means by hospital site, GSS & CSS)
• All of our leaders will have undertaken bespoke equalities leadership development
incorporating learnings from staff lived experiences and addressing power dynamics
• 20% of senior leaders will be participating in reciprocal mentoring
• Staff engagement as measured by the NHS Staff Survey will be in the top quartile for
all protected characteristic groups
• Formalised protected time for staff diversity network related activities
• Demonstrable learnings and improved outcomes from QI collaborative and
participation in WRES expert programme
• Scoped and developed a cultural competency training strategy for the Trust which
will be embedded into the curriculum of the Education Academy
PRIORITY TWO
2. Deliver safe, compassionate and equitable care to all our patients and take action to
reduce health inequalities across London
We will measure achievement as follows:
• All 8, (100%) of our Clinical Boards will be reviewing at least one equity indicator in
2019/20 (See page 13).
• Clinical boards will address inequities. e.g. in A&E, we have found patients over 70
are more likely to breach the 4-hour target than the average patient. We are aiming
to reduce the difference in 4-hour breaches between 70+ and the average by 25% in
20/21.
• In 2019/20, we aim to achieve 60% of inpatients screened for smoking and alcohol
use, 60% of smokers given advice, and, 50% of patients drinking above safe levels are
given brief advice or offered a specialist health referral.

33 | P a g e
• Recognise interdependencies with the objectives on community
engagement and improved patient information set out in the Patient Experience &
Engagement Strategy (include link)
• We will agree workforce targets for the recruitment from local community for each
hospital, CSS and GSS - Year 1 - agree overall and specific targets; Year 2 - 5%
increase on baseline numbers; Year 3 - 10% increase on baseline
• Place 150 local people into work (including apprenticeships) though advice, training
and placement – By end of year 3 – 450 achieved
• The Healthcare Horizons programme will work with over 25 schools to provide
careers advice and events, training and work experience to over 500 young people
looking to enter healthcare careers though Higher Education or apprenticeships – by
end of year 3, 1500 achieved
• The Project Search scheme will support over 20 interns with complex Learning
Disabilities and/or Autism to develop independent lifestyles and enter employment
in the NHS or with other local employers, and support 20 other supported
employment participants attain work
• Working with the Health Foundation, we will develop additional measures for
marking our development as an ‘Anchor Institution’, including local employment,
procurement and environmental sustainability.
PRIORITY THREE
3. Develop inclusive employment policies, systems and practices in terms of
recruitment, retention, appraisals, grievance and disciplinary, and equitable access
to learning and career development
We will measure achievement as follows:
• Full review of all employment policies with our people and unions to ensure our
values come to life in this new-era of the modern workplace promoting flexible
employment practices, including remote working; maternity & paternity leave; and
menopause in the workplace
• Training and roll out 60 Inclusion Ambassadors in year 1, and all recruitment
panellists appropriately trained and supported in the ambitions of our Charter
• Equality of the number of BME and white staff facing the disciplinary processes
• Equality of the number of BME and white staff enjoying access to learning and
development
• Becoming a Disability Confident Leader (Disability Confident employer scheme,
administered by DWP)

34 | P a g e
• Secure an increase in the number of staff sharing their disability
status on ESR to 3.6%
• Secure a place in the top 50% of Trusts for implementing workplace adjustments,
including those for staff living with on-going mental health needs
• Recognised for our commitment to our LGBT staff via accreditation in the Stonewall
Workplace Equality Index (WEI) and being positioned in the top 25% of the index for
the healthcare sector
• Narrowed the gender pay gap by increasing the proportion of females in the higher
pay quartiles, as a reflection of the workforce which is predominantly female,
increase number of men in workforce at the lower pay levels (such as into Health
Care Assistant roles etc.) increasing female representation in Finance management
roles.

35 | P a g e
C. WeLead Framework

36 | P a g e
D. Gender Pay Gap Information 2017 to 2019

37 | P a g e
E. Workforce Information
DESCRIPTION PAGE
1. Trust workforce profile by protected characteristics 39
2. Trust workforce by Staff group 41
3. Nurse & Midwifery profile by Ethnicity by Hospital site 42
4. Trust workforce profile by Band 44
5. Trust Workforce Profile by Band by Protected Characteristics 44
6. Trust level Starter Leaver information 46
7. TRAC Recruitment information – Applicant to Shortlisting to Offer
data
47
38 | P a g e
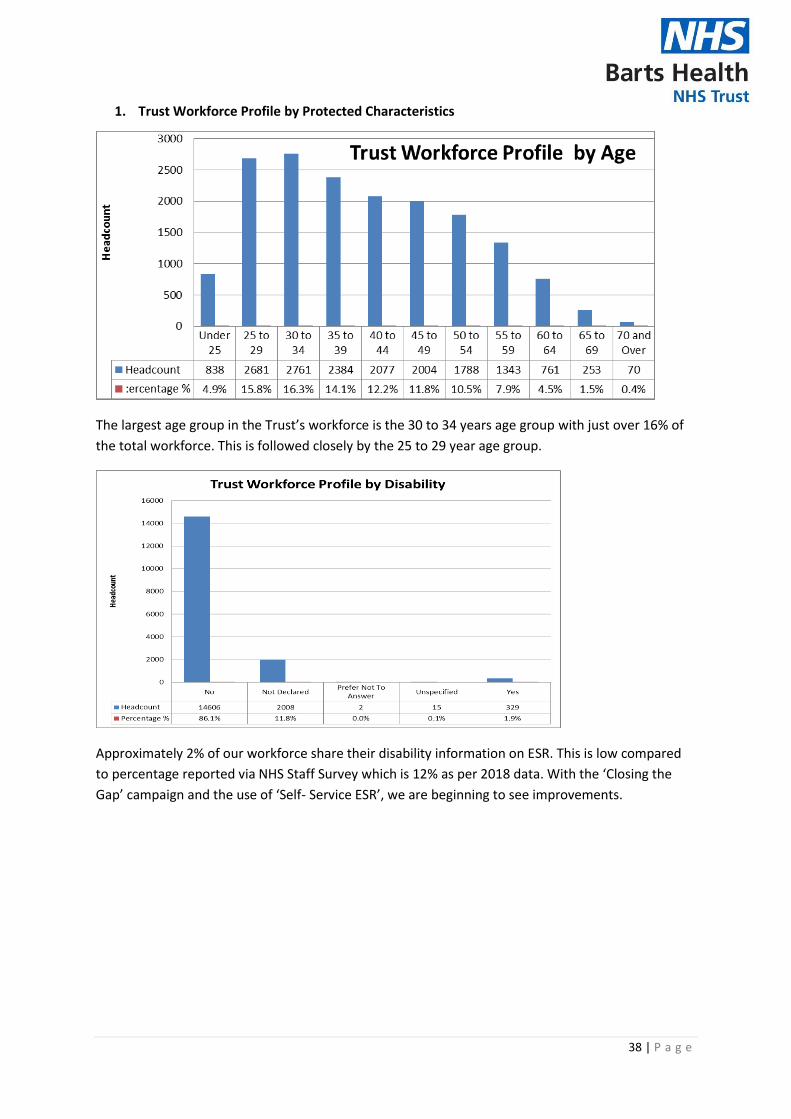
1. Trust Workforce Profile by Protected Characteristics
The largest age group in the Trust’s workforce is the 30 to 34 years age group with just over 16% of
the total workforce. This is followed closely by the 25 to 29 year age group.
Approximately 2% of our workforce share their disability information on ESR. This is low compared
to percentage reported via NHS Staff Survey which is 12% as per 2018 data. With the ‘Closing the
Gap’ campaign and the use of ‘Self- Service ESR’, we are beginning to see improvements.
39 | P a g e
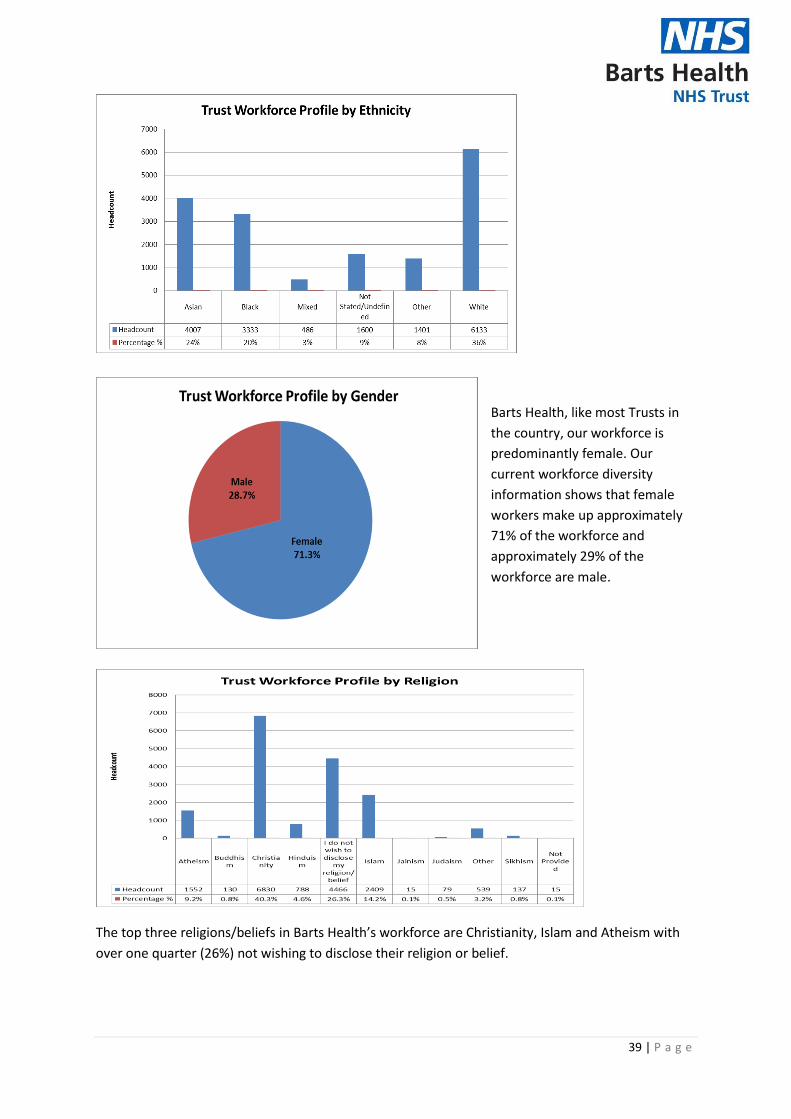
Barts Health, like most Trusts in
the country, our workforce is
predominantly female. Our
current workforce diversity
information shows that female
workers make up approximately
71% of the workforce and
approximately 29% of the
workforce are male.
The top three religions/beliefs in Barts Health’s workforce are Christianity, Islam and Atheism with
over one quarter (26%) not wishing to disclose their religion or belief.

40 | P a g e
SEXUAL ORIENTATION
Heterosexual or Straight 95.2%
Gay/Lesbian 2.45%
Unspecified 1.18%
Bisexual 1.04%
Undecided 0.07%
Other sexual orientation not listed 0.07%
Table: 1: ESR data as at July 2019
We should acknowledge that the systems we use are national systems and therefore we are unable
to expand the questions ourselves, specifically around the capture of transgender and non-binary.
2. Trust workforce by Staff Group
Nursing and midwifery are the largest staff group at 32% followed by Administration and Clerical
with 15.5%. In response to the national, PAN London and local issue of the under-representation of
BME nurses and midwives in senior bands across the NHS, further to the Trust wide profile, site
profiles are also available showing representation beyond Agenda for Change (AfC) Band 5.
Nursing and Midwifery is the largest staff group in the Trust however our data for this group shows
that we still have a lot to do. Although we are starting to see the dial shift positively in some areas,
further work planned as part of the implementation of the Inclusion Strategy is geared towards
driving further improvement in this area.

41 | P a g e
4. Workforce Profile by Band
The largest group of Barts Health staff are found in Band 5 – the entry point for Nurses.
5. Trust Workforce by Band and by Protected Characteristic
Band 5 has the largest range of age groups totalling 3461 spread across ages from Under 25 up to 70
and over. Such an age profile brings added diversity to the the staff groups involved (mainly Nursing
and Midwifery).

42 | P a g e

43 | P a g e
6. Trust Level Starter Leaver information
There are more leavers in the younger age groups 25 to 29 and 30 to 34 than there are in the age
groups 40 years and above. With the age group 40 to 44, the number of starters is close to the
number of leavers.
Compared to approximately 200 starters who identify as White, there were over 1200 leavers
during the reporting period. It is also noted that there is a higher starter figure for BME staff (over
1800) when compared to White (200).
Comparing the starter vs leaver data by Sex/Gender, the number of Female and Male starters are
both higher than the number of leavers.
44 | P a g e
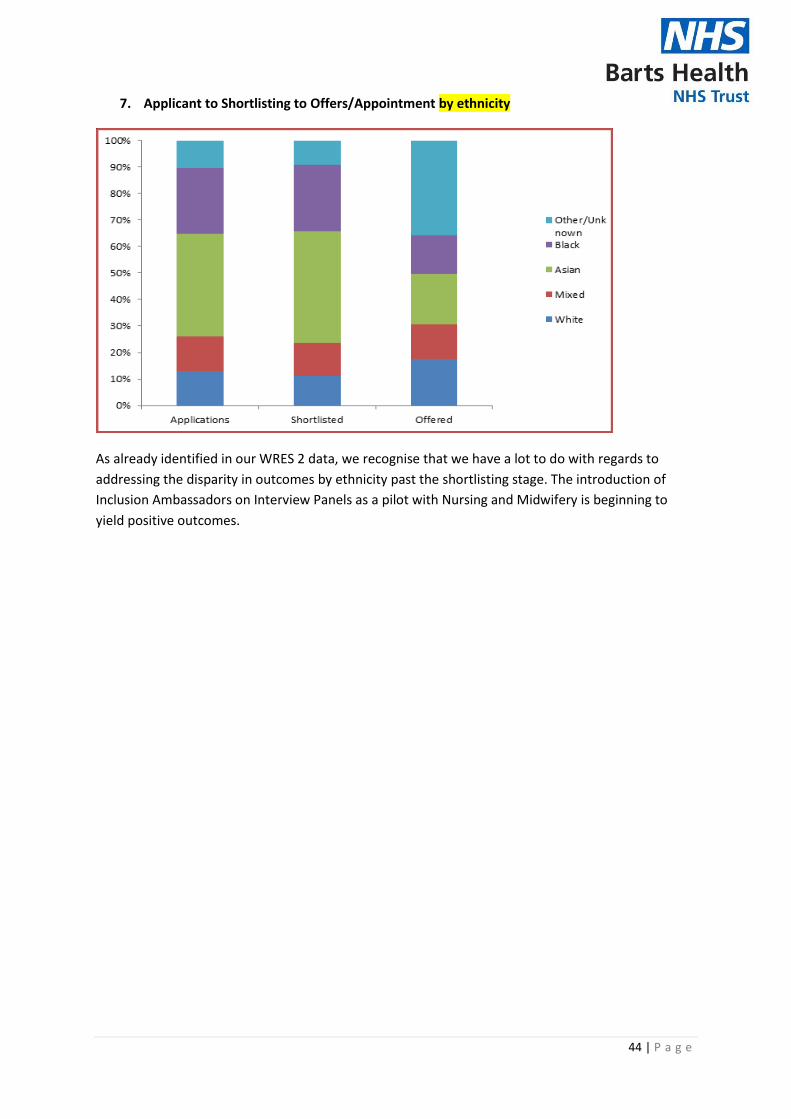
7. Applicant to Shortlisting to Offers/Appointment by ethnicity
As already identified in our WRES 2 data, we recognise that we have a lot to do with regards to
addressing the disparity in outcomes by ethnicity past the shortlisting stage. The introduction of
Inclusion Ambassadors on Interview Panels as a pilot with Nursing and Midwifery is beginning to
yield positive outcomes.

45 | P a g e
F. Catchment Area Demographic Information
Figure 1 below, shows the population pyramids for the three boroughs covered by Barts
Health NHS Trust, compared with that of the United Kingdom, based on mid-2014
population estimates. This demonstrates that the local population currently has a much
younger age profile than is the case for the UK. As the local population ages, there would be
expected to be changes in the prevalence of diseases seen locally, with an increased
prevalence of age related diseases. However the extent of this will depend on other factors.
The current young age profile of the population offers good opportunities for effective
preventive action at an early stage.
Figure 1: Population pyramids for the UK and Newham, Tower Hamlets and Waltham Forest.
Source: Office for National Statistics.

46 | P a g e
Population estimates for the local population are shown in table 1, below.
Table 1: Mid-2014 population estimates by age and sex.
Newham Tower Hamlets Waltham Forest Total Grand Total
Age Male Female Male Female Male Female Male Female
0-4 14,387 13,793 11,102 10,631 11,242 10,576 36,731 35,000 71,731
5-9 11,657 11,165 9,000 8,737 9,392 9,001 30,049 28,903 58,952
10-14 9,787 9,634 7,597 7,365 7,707 7,456 25,091 24,455 49,546
15-19 10,250 10,112 7,505 7,355 7,525 7,220 25,280 24,687 49,967
20-24 14,246 13,371 13,073 14,060 9,177 8,663 36,496 36,094 72,590
25-29 22,605 17,078 22,416 22,191 13,116 12,379 58,137 51,648 109,785
30-34 20,798 16,192 20,786 18,310 13,476 12,999 55,060 47,501 102,561
35-39 14,518 11,867 14,607 11,837 11,528 11,164 40,653 34,868 75,521
40-44 11,351 10,044 10,444 7,879 10,418 9,825 32,213 27,748 59,961
45-49 9,944 9,601 7,918 6,291 9,382 9,594 27,244 25,486 52,730
50-54 8,381 8,294 6,255 5,159 7,834 8,134 22,470 21,587 44,057
55-59 6,536 6,530 5,001 4,301 6,081 6,612 17,618 17,443 35,061
60-64 4,535 5,103 3,376 3,728 4,707 5,301 12,618 14,132 26,750
65-69 3,351 3,725 2,547 2,641 4,052 4,333 9,950 10,699 20,649
70-74 2,421 2,971 1,768 2,126 2,838 3,290 7,027 8,387 15,414
75-79 2,100 2,424 1,619 1,763 2,503 2,867 6,222 7,054 13,276
80-84 1,395 1,656 1,161 1,413 1,649 2,216 4,205 5,285 9,490
85-89 623 974 515 825 852 1,462 1,990 3,261 5,251
90+ 299 604 249 464 397 1,052 945 2,120 3,065
Grand Total 169,184 155,138 146,939 137,076 133,876 134,144 449,999 426,358 876,357
Source: Office for National Statistics
Population projections through to 2037 are shown in table 2. These figures are for Newham, Tower
Hamlets and Waltham Forest combined.
Table 2: Population projections 2017-2037
Age 2017 2022 2027 2032 2037
0-4 75,300 78,300 78,800 79,000 80,300
5-9 61,100 66,800 69,300 69,800 69,900
10-14 51,300 56,500 61,400 63,600 64,100
15-19 49,300 52,300 57,200 61,600 63,600
20-24 79,100 77,700 80,200 86,400 90,100
25-29 110,100 109,300 106,300 109,300 116,800
30-34 105,500 107,400 106,000 102,900 105,900
35-39 83,900 92,100 94,100 92,900 90,000
40-44 62,600 74,700 81,300 83,200 82,100
45-49 54,500 57,800 68,200 73,700 75,500
50-54 46,800 51,400 54,000 63,200 68,200
55-59 37,800 43,700 47,600 49,800 58,000
60-64 28,500 34,000 39,100 42,400 44,300
65-69 21,900 25,100 29,800 34,400 37,100
70-74 16,400 19,100 21,900 26,100 30,100
75-79 12,700 13,800 16,300 18,500 22,300
80-84 9,500 9,900 11,200 13,100 15,100
85-89 5,600 6,300 6,800 7,800 9,300
90+ 3,100 3,900 4,900 5,800 7,100
All ages 915,100 979,900 1,034,300 1,083,600 1,129,700
Source: Office for National Statistics
47 | P a g e
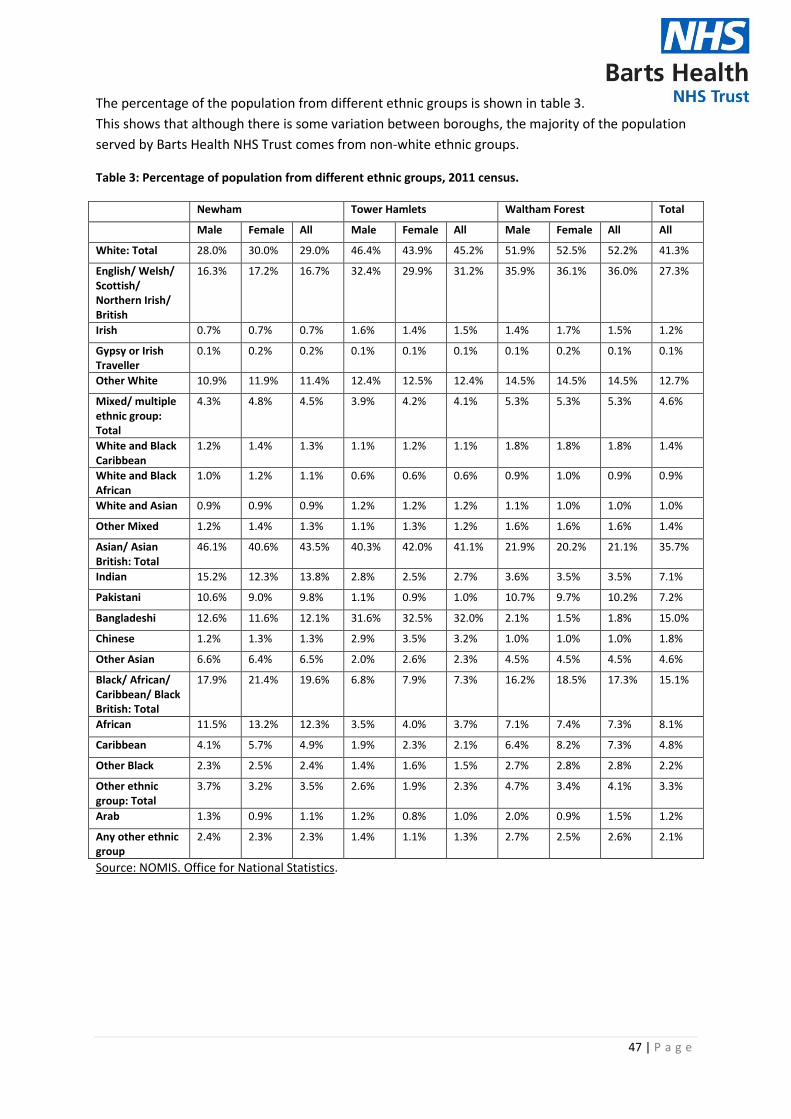
The percentage of the population from different ethnic groups is shown in table 3.
This shows that although there is some variation between boroughs, the majority of the population
served by Barts Health NHS Trust comes from non-white ethnic groups.
Table 3: Percentage of population from different ethnic groups, 2011 census.
Newham Tower Hamlets Waltham Forest Total
Male Female All Male Female All Male Female All All
White: Total 28.0% 30.0% 29.0% 46.4% 43.9% 45.2% 51.9% 52.5% 52.2% 41.3%
English/ Welsh/ Scottish/ Northern Irish/ British
16.3% 17.2% 16.7% 32.4% 29.9% 31.2% 35.9% 36.1% 36.0% 27.3%
Irish 0.7% 0.7% 0.7% 1.6% 1.4% 1.5% 1.4% 1.7% 1.5% 1.2%
Gypsy or Irish Traveller
0.1% 0.2% 0.2% 0.1% 0.1% 0.1% 0.1% 0.2% 0.1% 0.1%
Other White 10.9% 11.9% 11.4% 12.4% 12.5% 12.4% 14.5% 14.5% 14.5% 12.7%
Mixed/ multiple ethnic group: Total
4.3% 4.8% 4.5% 3.9% 4.2% 4.1% 5.3% 5.3% 5.3% 4.6%
White and Black Caribbean
1.2% 1.4% 1.3% 1.1% 1.2% 1.1% 1.8% 1.8% 1.8% 1.4%
White and Black African
1.0% 1.2% 1.1% 0.6% 0.6% 0.6% 0.9% 1.0% 0.9% 0.9%
White and Asian 0.9% 0.9% 0.9% 1.2% 1.2% 1.2% 1.1% 1.0% 1.0% 1.0%
Other Mixed 1.2% 1.4% 1.3% 1.1% 1.3% 1.2% 1.6% 1.6% 1.6% 1.4%
Asian/ Asian British: Total
46.1% 40.6% 43.5% 40.3% 42.0% 41.1% 21.9% 20.2% 21.1% 35.7%
Indian 15.2% 12.3% 13.8% 2.8% 2.5% 2.7% 3.6% 3.5% 3.5% 7.1%
Pakistani 10.6% 9.0% 9.8% 1.1% 0.9% 1.0% 10.7% 9.7% 10.2% 7.2%
Bangladeshi 12.6% 11.6% 12.1% 31.6% 32.5% 32.0% 2.1% 1.5% 1.8% 15.0%
Chinese 1.2% 1.3% 1.3% 2.9% 3.5% 3.2% 1.0% 1.0% 1.0% 1.8%
Other Asian 6.6% 6.4% 6.5% 2.0% 2.6% 2.3% 4.5% 4.5% 4.5% 4.6%
Black/ African/ Caribbean/ Black British: Total
17.9% 21.4% 19.6% 6.8% 7.9% 7.3% 16.2% 18.5% 17.3% 15.1%
African 11.5% 13.2% 12.3% 3.5% 4.0% 3.7% 7.1% 7.4% 7.3% 8.1%
Caribbean 4.1% 5.7% 4.9% 1.9% 2.3% 2.1% 6.4% 8.2% 7.3% 4.8%
Other Black 2.3% 2.5% 2.4% 1.4% 1.6% 1.5% 2.7% 2.8% 2.8% 2.2%
Other ethnic group: Total
3.7% 3.2% 3.5% 2.6% 1.9% 2.3% 4.7% 3.4% 4.1% 3.3%
Arab 1.3% 0.9% 1.1% 1.2% 0.8% 1.0% 2.0% 0.9% 1.5% 1.2%
Any other ethnic group
2.4% 2.3% 2.3% 1.4% 1.1% 1.3% 2.7% 2.5% 2.6% 2.1%
Source: NOMIS. Office for National Statistics.