including embodied energy considerations at the conceptual stage of building design
TRANSCRIPT

http://pia.sagepub.com/EnergyEngineers, Part A: Journal of Power and
Proceedings of the Institution of Mechanical
http://pia.sagepub.com/content/220/3/271The online version of this article can be found at:
DOI: 10.1243/095765006X76009
2006 220: 271Proceedings of the Institution of Mechanical Engineers, Part A: Journal of Power and EnergyY. G. Yohanis and B Norton
Including embodied energy considerations at the conceptual stage of building design
Published by:
http://www.sagepublications.com
On behalf of:
Institution of Mechanical Engineers
be found at: canProceedings of the Institution of Mechanical Engineers, Part A: Journal of Power and EnergyAdditional services and information for
http://pia.sagepub.com/cgi/alertsEmail Alerts:
http://pia.sagepub.com/subscriptionsSubscriptions:
http://www.sagepub.com/journalsReprints.navReprints:
http://www.sagepub.com/journalsPermissions.navPermissions:
http://pia.sagepub.com/content/220/3/271.refs.htmlCitations:
What is This?
- May 1, 2006Version of Record >>
at Universiti Teknologi MARA (UiTM) on August 1, 2014pia.sagepub.comDownloaded from at Universiti Teknologi MARA (UiTM) on August 1, 2014pia.sagepub.comDownloaded from
Including embodied energy considerations at theconceptual stage of building designY G Yohanis1� and B Norton2
1Thermal Systems Engineering Group, Faculty of Engineering, University of Ulster, Newtownabbey, UK2Dublin Institute of Technology, Aungier Street, Dublin, Ireland
The manuscript was received on 18 January 2005 and was accepted after revision for publication on 11 October 2005.
DOI: 10.1243/095765006X76009
Abstract: Designers need practical tools to aid decisionmaking at the conceptual stage of build-ing design. The aim of this paper is to investigate, using the early design model, the comparativeimpact of varying building parameters on the cost of non-domestic buildings. Cost comprises ofthe cost of operational energy, capital, and embodied energy (EE). Integrated assessment of costas a function of the following parameters has been carried out: overall heat loss coefficient,obstruction, depth of room, lighting level, installed illuminance, room temperature, rate of infil-tration, efficiency of heating plant, incidental heat gain, glazing ratio, cost of windows, and coef-ficient of performance of cooler. For the specific non-domestic building considered, inclusion ofEE in the analysis does not significantly influence design but may have an impact on materialchoices.
Keywords: embodied energy, life-cycle analysis, energy modelling
1 INTRODUCTION
To achieve environmental sustainability, thereduction of primary energy (PE) use in buildingsshould be an aimof a design process. In the EuropeanUnion, 40 per cent of total energy is consumedin buildings [1], a proportion that is increasingwith more use of air-conditioning (particularly insouthern Europe) [2] and economic prosperity (par-ticularly in eastern Europe) [3]. In the USA, 17 percent of the total PE consumption in 2000 [4] and13 per cent of the 1999 USA 100 year horizon globalwarming potential was from the commercial sector[5]. Koomey et al. [6] estimate that the currenttrend of CO2 emission from energy consumption inbuildings in the USA could increase by 12 per centover 1997 levels by 2010.
For an integrated approach to the energy-efficientdesign of buildings [7–10], it is crucial that designtools can address energy issues at theearliest stages of a design process. As the major
considerations at the early stage of the design pro-cess are orientation; configuration; size, location,and distribution of glazing; and shape and size, cru-cial opportunities for improving a building’s energyperformance occur at this stage. The natural energyflows brought about by the sun, wind, and tempera-ture differences can be organized so that only theminimum levels of artificial heating, cooling, andlighting need to be provided.
Energy in buildings can be categorized as eitheroperational energy (OE) or embodied energy (EE).OE includes all energy requirements for lighting,heating, and cooling to provide a required comfortlevel. EE is energy used in the production and trans-portation of building materials, subassemblies, orbuilding systems. The energy requirement for manu-facturing different building materials, the associatedCO2 emissions, and their implications for theenvironment have been studied in New Zealand byBuchanan and Honey [11], in Japan by Suzuki andOka [12] and Oka et al. [13], and in India by Debnathet al. [14]. Buchanan and Honey [11] have shownthat a significant decrease in CO2 emissions wouldresult if wood (as it is renewable and sustainable)is used instead of steel, concrete, or aluminum.Suzuki et al. [15] have shown that total energy
�Corresponding author: Thermal Systems Engineering Group,
Room 4B11, Faculty of Engineering, University of Ulster,
Jordanstown, Newtownabbey BT37 0QB, UK.
271
JPE159 # IMechE 2006 Proc. IMechE Vol. 220 Part A: J. Power and Energy
at Universiti Teknologi MARA (UiTM) on August 1, 2014pia.sagepub.comDownloaded from
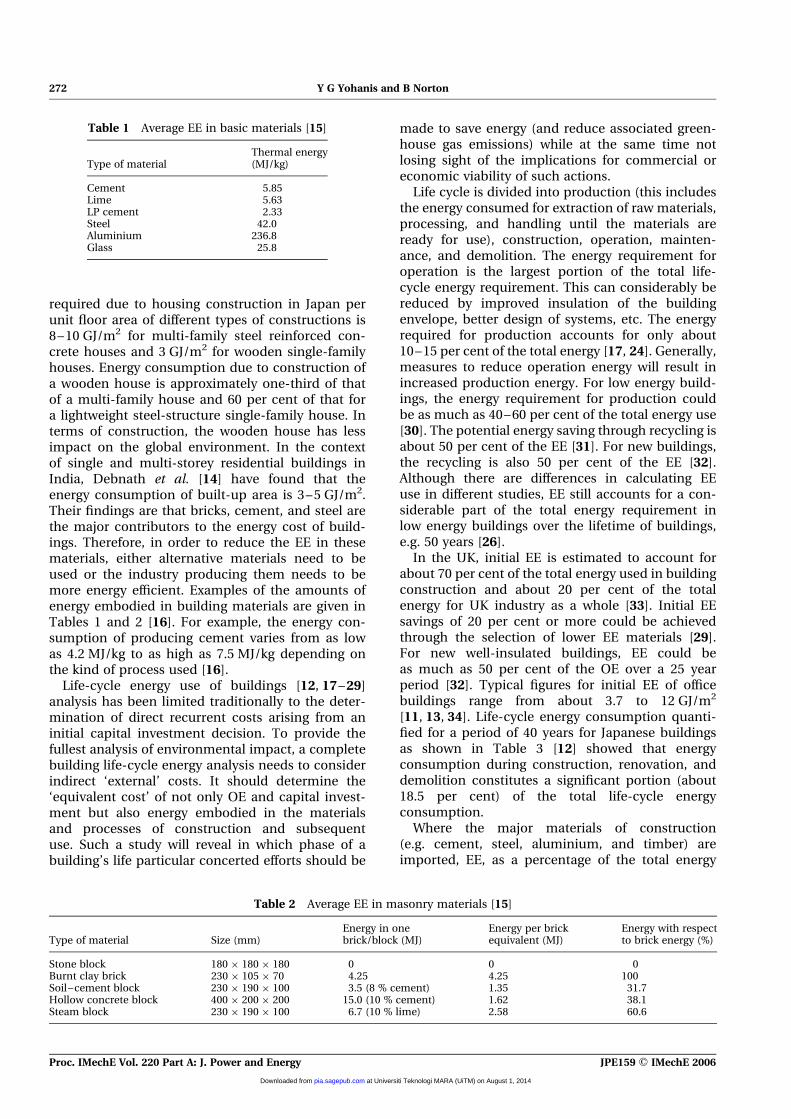
required due to housing construction in Japan perunit floor area of different types of constructions is8–10 GJ/m2 for multi-family steel reinforced con-crete houses and 3 GJ/m2 for wooden single-familyhouses. Energy consumption due to construction ofa wooden house is approximately one-third of thatof a multi-family house and 60 per cent of that fora lightweight steel-structure single-family house. Interms of construction, the wooden house has lessimpact on the global environment. In the contextof single and multi-storey residential buildings inIndia, Debnath et al. [14] have found that theenergy consumption of built-up area is 3–5 GJ/m2.Their findings are that bricks, cement, and steel arethe major contributors to the energy cost of build-ings. Therefore, in order to reduce the EE in thesematerials, either alternative materials need to beused or the industry producing them needs to bemore energy efficient. Examples of the amounts ofenergy embodied in building materials are given inTables 1 and 2 [16]. For example, the energy con-sumption of producing cement varies from as lowas 4.2 MJ/kg to as high as 7.5 MJ/kg depending onthe kind of process used [16].
Life-cycle energy use of buildings [12, 17–29]analysis has been limited traditionally to the deter-mination of direct recurrent costs arising from aninitial capital investment decision. To provide thefullest analysis of environmental impact, a completebuilding life-cycle energy analysis needs to considerindirect ‘external’ costs. It should determine the‘equivalent cost’ of not only OE and capital invest-ment but also energy embodied in the materialsand processes of construction and subsequentuse. Such a study will reveal in which phase of abuilding’s life particular concerted efforts should be
made to save energy (and reduce associated green-house gas emissions) while at the same time notlosing sight of the implications for commercial oreconomic viability of such actions.
Life cycle is divided into production (this includesthe energy consumed for extraction of raw materials,processing, and handling until the materials areready for use), construction, operation, mainten-ance, and demolition. The energy requirement foroperation is the largest portion of the total life-cycle energy requirement. This can considerably bereduced by improved insulation of the buildingenvelope, better design of systems, etc. The energyrequired for production accounts for only about10–15 per cent of the total energy [17, 24]. Generally,measures to reduce operation energy will result inincreased production energy. For low energy build-ings, the energy requirement for production couldbe as much as 40–60 per cent of the total energy use[30]. The potential energy saving through recycling isabout 50 per cent of the EE [31]. For new buildings,the recycling is also 50 per cent of the EE [32].Although there are differences in calculating EEuse in different studies, EE still accounts for a con-siderable part of the total energy requirement inlow energy buildings over the lifetime of buildings,e.g. 50 years [26].
In the UK, initial EE is estimated to account forabout 70 per cent of the total energy used in buildingconstruction and about 20 per cent of the totalenergy for UK industry as a whole [33]. Initial EEsavings of 20 per cent or more could be achievedthrough the selection of lower EE materials [29].For new well-insulated buildings, EE could beas much as 50 per cent of the OE over a 25 yearperiod [32]. Typical figures for initial EE of officebuildings range from about 3.7 to 12 GJ/m2
[11, 13, 34]. Life-cycle energy consumption quanti-fied for a period of 40 years for Japanese buildingsas shown in Table 3 [12] showed that energyconsumption during construction, renovation, anddemolition constitutes a significant portion (about18.5 per cent) of the total life-cycle energyconsumption.
Where the major materials of construction(e.g. cement, steel, aluminium, and timber) areimported, EE, as a percentage of the total energy
Table 2 Average EE in masonry materials [15]
Type of material Size (mm)Energy in onebrick/block (MJ)
Energy per brickequivalent (MJ)
Energy with respectto brick energy (%)
Stone block 180 � 180 � 180 0 0 0Burnt clay brick 230 � 105 � 70 4.25 4.25 100Soil–cement block 230 � 190 � 100 3.5 (8 % cement) 1.35 31.7Hollow concrete block 400 � 200 � 200 15.0 (10 % cement) 1.62 38.1Steam block 230 � 190 � 100 6.7 (10 % lime) 2.58 60.6
Table 1 Average EE in basic materials [15]
Type of materialThermal energy(MJ/kg)
Cement 5.85Lime 5.63LP cement 2.33Steel 42.0Aluminium 236.8Glass 25.8
272 Y G Yohanis and B Norton
Proc. IMechE Vol. 220 Part A: J. Power and Energy JPE159 # IMechE 2006
at Universiti Teknologi MARA (UiTM) on August 1, 2014pia.sagepub.comDownloaded from
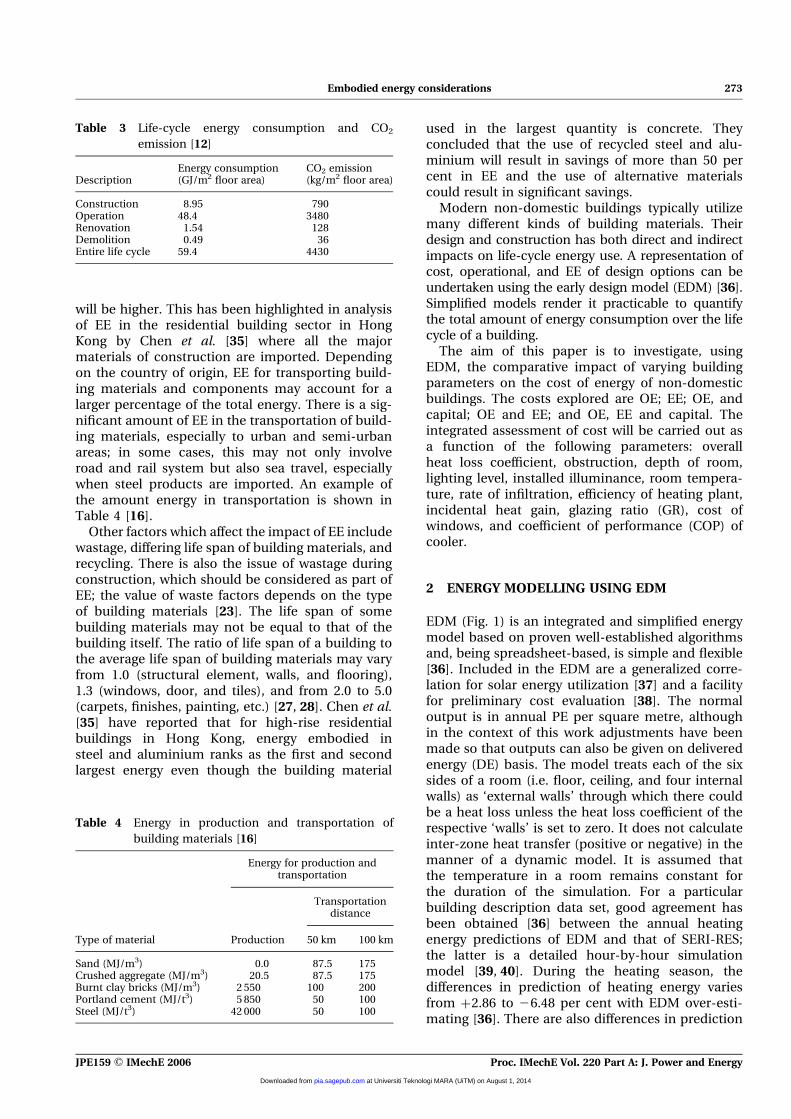
will be higher. This has been highlighted in analysisof EE in the residential building sector in HongKong by Chen et al. [35] where all the majormaterials of construction are imported. Dependingon the country of origin, EE for transporting build-ing materials and components may account for alarger percentage of the total energy. There is a sig-nificant amount of EE in the transportation of build-ing materials, especially to urban and semi-urbanareas; in some cases, this may not only involveroad and rail system but also sea travel, especiallywhen steel products are imported. An example ofthe amount energy in transportation is shown inTable 4 [16].
Other factors which affect the impact of EE includewastage, differing life span of building materials, andrecycling. There is also the issue of wastage duringconstruction, which should be considered as part ofEE; the value of waste factors depends on the typeof building materials [23]. The life span of somebuilding materials may not be equal to that of thebuilding itself. The ratio of life span of a building tothe average life span of building materials may varyfrom 1.0 (structural element, walls, and flooring),1.3 (windows, door, and tiles), and from 2.0 to 5.0(carpets, finishes, painting, etc.) [27, 28]. Chen et al.[35] have reported that for high-rise residentialbuildings in Hong Kong, energy embodied insteel and aluminium ranks as the first and secondlargest energy even though the building material
used in the largest quantity is concrete. Theyconcluded that the use of recycled steel and alu-minium will result in savings of more than 50 percent in EE and the use of alternative materialscould result in significant savings.
Modern non-domestic buildings typically utilizemany different kinds of building materials. Theirdesign and construction has both direct and indirectimpacts on life-cycle energy use. A representation ofcost, operational, and EE of design options can beundertaken using the early design model (EDM) [36].Simplified models render it practicable to quantifythe total amount of energy consumption over the lifecycle of a building.
The aim of this paper is to investigate, usingEDM, the comparative impact of varying buildingparameters on the cost of energy of non-domesticbuildings. The costs explored are OE; EE; OE, andcapital; OE and EE; and OE, EE and capital. Theintegrated assessment of cost will be carried out asa function of the following parameters: overallheat loss coefficient, obstruction, depth of room,lighting level, installed illuminance, room tempera-ture, rate of infiltration, efficiency of heating plant,incidental heat gain, glazing ratio (GR), cost ofwindows, and coefficient of performance (COP) ofcooler.
2 ENERGY MODELLING USING EDM
EDM (Fig. 1) is an integrated and simplified energymodel based on proven well-established algorithmsand, being spreadsheet-based, is simple and flexible[36]. Included in the EDM are a generalized corre-lation for solar energy utilization [37] and a facilityfor preliminary cost evaluation [38]. The normaloutput is in annual PE per square metre, althoughin the context of this work adjustments have beenmade so that outputs can also be given on deliveredenergy (DE) basis. The model treats each of the sixsides of a room (i.e. floor, ceiling, and four internalwalls) as ‘external walls’ through which there couldbe a heat loss unless the heat loss coefficient of therespective ‘walls’ is set to zero. It does not calculateinter-zone heat transfer (positive or negative) in themanner of a dynamic model. It is assumed thatthe temperature in a room remains constant forthe duration of the simulation. For a particularbuilding description data set, good agreement hasbeen obtained [36] between the annual heatingenergy predictions of EDM and that of SERI-RES;the latter is a detailed hour-by-hour simulationmodel [39, 40]. During the heating season, thedifferences in prediction of heating energy variesfrom þ2.86 to 26.48 per cent with EDM over-esti-mating [36]. There are also differences in prediction
Table 3 Life-cycle energy consumption and CO2
emission [12]
DescriptionEnergy consumption(GJ/m2 floor area)
CO2 emission(kg/m2 floor area)
Construction 8.95 790Operation 48.4 3480Renovation 1.54 128Demolition 0.49 36Entire life cycle 59.4 4430
Table 4 Energy in production and transportation of
building materials [16]
Type of material
Energy for production andtransportation
Production
Transportationdistance
50 km 100 km
Sand (MJ/m3) 0.0 87.5 175Crushed aggregate (MJ/m3) 20.5 87.5 175Burnt clay bricks (MJ/m3) 2 550 100 200Portland cement (MJ/t3) 5 850 50 100Steel (MJ/t3) 42 000 50 100
Embodied energy considerations 273
JPE159 # IMechE 2006 Proc. IMechE Vol. 220 Part A: J. Power and Energy
at Universiti Teknologi MARA (UiTM) on August 1, 2014pia.sagepub.comDownloaded from

of heating energy on monthly basis, but these arenot significant. The difference in the prediction ofenergy use will vary for data sets describing otherbuildings. EDM is not intended to provide precise
energy use predictions, but rather has been devel-oped to test the relative energy performance, ona common basis, of building design options andchoices of materials. It predicts the potential
Fig. 1 Simplified chart of the EDM [36]
274 Y G Yohanis and B Norton
Proc. IMechE Vol. 220 Part A: J. Power and Energy JPE159 # IMechE 2006
at Universiti Teknologi MARA (UiTM) on August 1, 2014pia.sagepub.comDownloaded from
performance of the building, assuming that systemsand occupants function optimally and rationally,respectively. It then follows that its energy predic-tions are not always likely to be similar to moni-tored data. The good agreement between EDMand SERI-RES does not imply that simplifiedmodels, such as EDM, can replace hour-by-hourmodels, such as SERI-RES; the latter provides forgreater temporal and spatial resolution and the abil-ity to consider controls and subsystems in consider-able detail.
In this work, EDM is used for estimating capitalcost, EE, and OE requirement at the earlieststages of design. For a given building orientationand weather data, building parameters (e.g. overallheat loss coefficient) and derived internal con-ditions (e.g. comfort temperature and infiltrationrate) can be varied to analyse the energy perform-ance and capital cost of a design option withrespect to building parameters including GR,room depth, infiltration, insulation levels, installedilluminance, internal heat gain, and obstruction.Comparative, rather than absolute, variations withbuilding parameters are examined using EDM. Tosimplify the analysis, price inflation, discountrate, and interest rate variations are ignored. Theinvestigations reported are, except where otherwiseindicated specifically, on PE basis.
Obstruction refers to the situation when an adja-cent building blocks out large areas of the skythereby reducing the availability of daylight, theuseful heating in winter due to solar gain, and thecooling load due to solar gain in summer. It isaccounted for in the program by considering GR,the distance to the adjacent building and the differ-ence in the heights of a building in question andthat of the adjacent building. An obstruction angleis the angle that a line, which connects the centreof a window in a room with the top corner of anadjacent building, makes with the horizontal. If thisangle is larger than 08, the adjacent building shadesthe room. An obstruction angle (H) of zero meansthat there is no obstruction and an angle of 908means there is maximum obstruction (i.e. completeshading).
The costing facility of EDM gives an indication ofthe cost implications of design options; it does notgive absolute costs. In order for a cost model to beuseful to a designer, it must give quick feedbackduring the design process. ‘Precise’ detailed com-mercial costing of buildings is not necessary in theearly conceptual stages of the design process tomeet the typical needs of the designer. The ‘costs’thus determined from the proposed model mightnot have a strong correspondence to actual costs;rather the aim is to carry out comparative studiesof design options on equal basis.
3 INPUT PARAMETERS FOR EDM
The minimum initial input parameters for EDMneed only be room and glazing dimensions. Defaultvalues are then used for all other parameters; thesereflect current consensus on good design practices.It is also possible to alter some (or, for more experi-enced users, all) of the default values dependingon the extent of the design analysis. Default valuesare given for the following parameters: latitude;average monthly climate data taking orientationinto account; tilt of glazing; percentage glazed areaof window; glazing transmission coefficient; rates ofinfiltration and ventilation; heating and coolingreference temperatures; heat gains; heat loss coeffi-cients; heating and cooling plant efficiencies; lightingdatum; internal and external reflectance.
The EDM uses fixed values for infiltration andventilation, thus wind and stack effects arising fromvarying external wind conditions are ignored. Themonthly and annual auxiliary heating requirementis calculated by subtracting the utilizable portion ofthe solar heat gain and the internal heat gain fromthe heat loss. Solar gains are assessed on the basisof solar radiation data [41], orientation, shading coef-ficients, glazing area, utilization factor, and obstruc-tion. EDM assumes the effective use of movableshading devices, such as blinds. An assumption isthat solar radiation is reduced by a simple trans-mission factor, dependent on the nature of theshading device and its position.
EDM does not include a facility to vary the rate ofinfiltration for every hour, weekday, weekend, andmonth or months. Therefore, it is necessary to deter-mine an equivalent single fixed infiltration value tobe used in the EDM. For a particular hour, weekday,weekend, month or months, the heat gain values indetailed hour-by-hour simulation programs are aclose representation of the heat gain that is likely toprevail in real situations. EDM, however, does nothave the facility to mirror this degree of detail;a single value is used in the program to representthe non-lighting heat gain data for a month or year.
The required temperature for comfort of occu-pants and the required temperature to ensureagainst fabric damage are scheduled in detailedsimulation programs (such as SERI-RES [39, 40] fora particular hour, weekday, weekend, month ormonths. In EDM, however, a single reference valueis used for amonth or year. To estimate this tempera-ture, the following equation is used
Tref ¼ (Tcomfort � Tambient)Ct þ Tambient (1)
where, Tref is temperature used in EDM, Ct is temp-erature correction factor, Tcomfort is required com-fort temperature, and Tambient is average ambient
Embodied energy considerations 275
JPE159 # IMechE 2006 Proc. IMechE Vol. 220 Part A: J. Power and Energy
at Universiti Teknologi MARA (UiTM) on August 1, 2014pia.sagepub.comDownloaded from
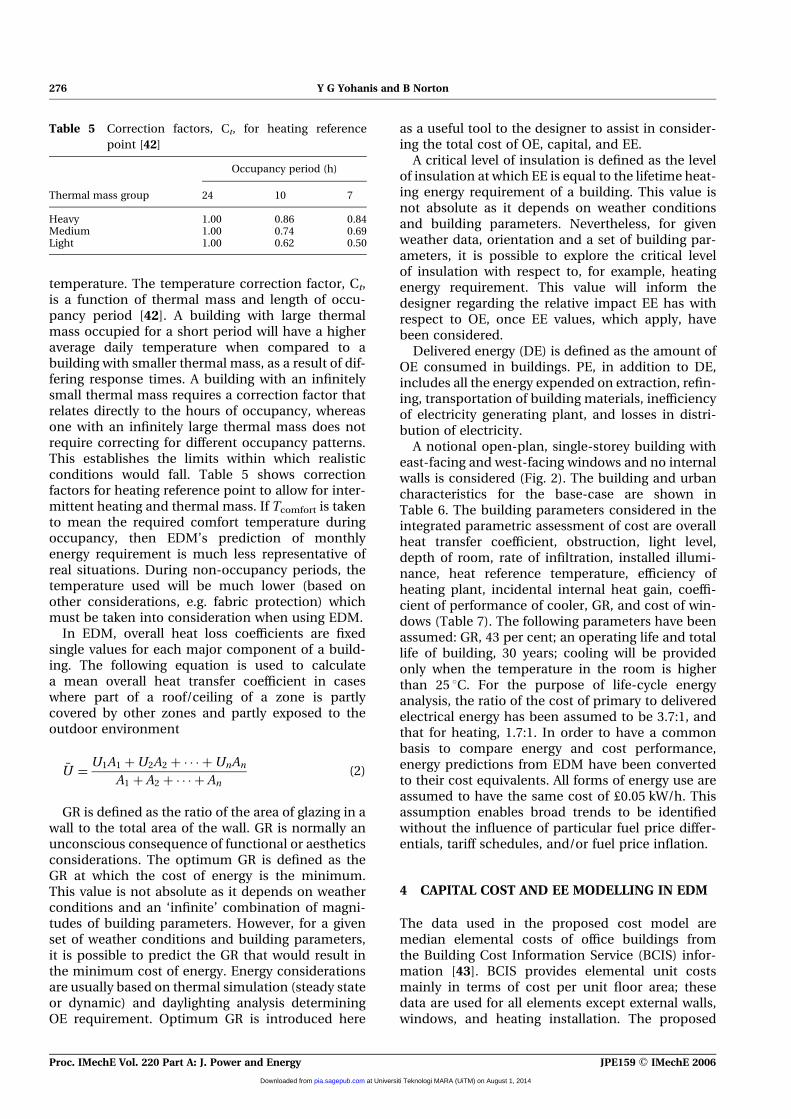
temperature. The temperature correction factor, Ct,is a function of thermal mass and length of occu-pancy period [42]. A building with large thermalmass occupied for a short period will have a higheraverage daily temperature when compared to abuilding with smaller thermal mass, as a result of dif-fering response times. A building with an infinitelysmall thermal mass requires a correction factor thatrelates directly to the hours of occupancy, whereasone with an infinitely large thermal mass does notrequire correcting for different occupancy patterns.This establishes the limits within which realisticconditions would fall. Table 5 shows correctionfactors for heating reference point to allow for inter-mittent heating and thermal mass. If Tcomfort is takento mean the required comfort temperature duringoccupancy, then EDM’s prediction of monthlyenergy requirement is much less representative ofreal situations. During non-occupancy periods, thetemperature used will be much lower (based onother considerations, e.g. fabric protection) whichmust be taken into consideration when using EDM.
In EDM, overall heat loss coefficients are fixedsingle values for each major component of a build-ing. The following equation is used to calculatea mean overall heat transfer coefficient in caseswhere part of a roof/ceiling of a zone is partlycovered by other zones and partly exposed to theoutdoor environment
�U ¼U1A1 þU2A2 þ � � � þUnAn
A1 þ A2 þ � � � þ An(2)
GR is defined as the ratio of the area of glazing in awall to the total area of the wall. GR is normally anunconscious consequence of functional or aestheticsconsiderations. The optimum GR is defined as theGR at which the cost of energy is the minimum.This value is not absolute as it depends on weatherconditions and an ‘infinite’ combination of magni-tudes of building parameters. However, for a givenset of weather conditions and building parameters,it is possible to predict the GR that would result inthe minimum cost of energy. Energy considerationsare usually based on thermal simulation (steady stateor dynamic) and daylighting analysis determiningOE requirement. Optimum GR is introduced here
as a useful tool to the designer to assist in consider-ing the total cost of OE, capital, and EE.
A critical level of insulation is defined as the levelof insulation at which EE is equal to the lifetime heat-ing energy requirement of a building. This value isnot absolute as it depends on weather conditionsand building parameters. Nevertheless, for givenweather data, orientation and a set of building par-ameters, it is possible to explore the critical levelof insulation with respect to, for example, heatingenergy requirement. This value will inform thedesigner regarding the relative impact EE has withrespect to OE, once EE values, which apply, havebeen considered.
Delivered energy (DE) is defined as the amount ofOE consumed in buildings. PE, in addition to DE,includes all the energy expended on extraction, refin-ing, transportation of building materials, inefficiencyof electricity generating plant, and losses in distri-bution of electricity.
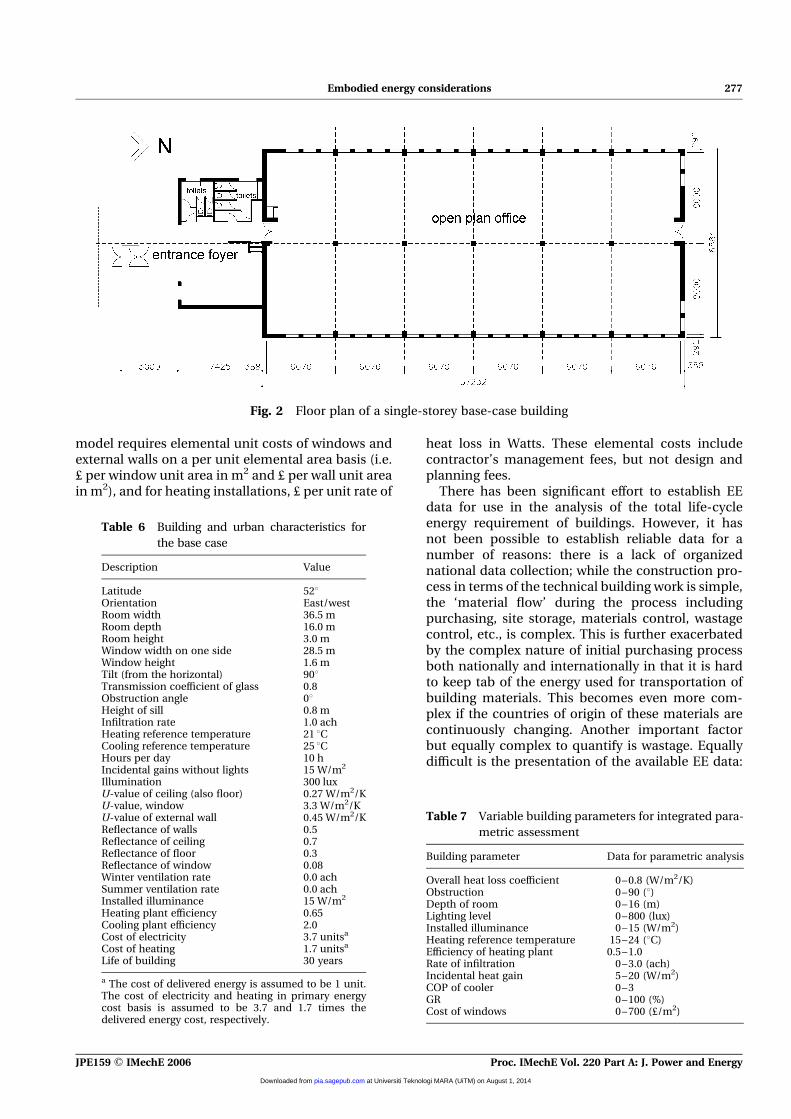
A notional open-plan, single-storey building witheast-facing and west-facing windows and no internalwalls is considered (Fig. 2). The building and urbancharacteristics for the base-case are shown inTable 6. The building parameters considered in theintegrated parametric assessment of cost are overallheat transfer coefficient, obstruction, light level,depth of room, rate of infiltration, installed illumi-nance, heat reference temperature, efficiency ofheating plant, incidental internal heat gain, coeffi-cient of performance of cooler, GR, and cost of win-dows (Table 7). The following parameters have beenassumed: GR, 43 per cent; an operating life and totallife of building, 30 years; cooling will be providedonly when the temperature in the room is higherthan 25 8C. For the purpose of life-cycle energyanalysis, the ratio of the cost of primary to deliveredelectrical energy has been assumed to be 3.7:1, andthat for heating, 1.7:1. In order to have a commonbasis to compare energy and cost performance,energy predictions from EDM have been convertedto their cost equivalents. All forms of energy use areassumed to have the same cost of £0.05 kW/h. Thisassumption enables broad trends to be identifiedwithout the influence of particular fuel price differ-entials, tariff schedules, and/or fuel price inflation.
4 CAPITAL COST AND EE MODELLING IN EDM
The data used in the proposed cost model aremedian elemental costs of office buildings fromthe Building Cost Information Service (BCIS) infor-mation [43]. BCIS provides elemental unit costsmainly in terms of cost per unit floor area; thesedata are used for all elements except external walls,windows, and heating installation. The proposed
Table 5 Correction factors, Ct, for heating reference
point [42]
Occupancy period (h)
Thermal mass group 24 10 7
Heavy 1.00 0.86 0.84Medium 1.00 0.74 0.69Light 1.00 0.62 0.50
276 Y G Yohanis and B Norton
Proc. IMechE Vol. 220 Part A: J. Power and Energy JPE159 # IMechE 2006
at Universiti Teknologi MARA (UiTM) on August 1, 2014pia.sagepub.comDownloaded from
model requires elemental unit costs of windows andexternal walls on a per unit elemental area basis (i.e.£ per window unit area in m2 and £ per wall unit areain m2), and for heating installations, £ per unit rate of
heat loss in Watts. These elemental costs includecontractor’s management fees, but not design andplanning fees.
There has been significant effort to establish EEdata for use in the analysis of the total life-cycleenergy requirement of buildings. However, it hasnot been possible to establish reliable data for anumber of reasons: there is a lack of organizednational data collection; while the construction pro-cess in terms of the technical building work is simple,the ‘material flow’ during the process includingpurchasing, site storage, materials control, wastagecontrol, etc., is complex. This is further exacerbatedby the complex nature of initial purchasing processboth nationally and internationally in that it is hardto keep tab of the energy used for transportation ofbuilding materials. This becomes even more com-plex if the countries of origin of these materials arecontinuously changing. Another important factorbut equally complex to quantify is wastage. Equallydifficult is the presentation of the available EE data:
Fig. 2 Floor plan of a single-storey base-case building
Table 7 Variable building parameters for integrated para-
metric assessment
Building parameter Data for parametric analysis
Overall heat loss coefficient 0–0.8 (W/m2/K)Obstruction 0–90 (8)Depth of room 0–16 (m)Lighting level 0–800 (lux)Installed illuminance 0–15 (W/m2)Heating reference temperature 15–24 (8C)Efficiency of heating plant 0.5–1.0Rate of infiltration 0–3.0 (ach)Incidental heat gain 5–20 (W/m2)COP of cooler 0–3GR 0–100 (%)Cost of windows 0–700 (£/m2)
Table 6 Building and urban characteristics for
the base case
Description Value
Latitude 528Orientation East/westRoom width 36.5 mRoom depth 16.0 mRoom height 3.0 mWindow width on one side 28.5 mWindow height 1.6 mTilt (from the horizontal) 908Transmission coefficient of glass 0.8Obstruction angle 08Height of sill 0.8 mInfiltration rate 1.0 achHeating reference temperature 21 8CCooling reference temperature 25 8CHours per day 10 hIncidental gains without lights 15 W/m2
Illumination 300 luxU-value of ceiling (also floor) 0.27 W/m2/KU-value, window 3.3 W/m2/KU-value of external wall 0.45 W/m2/KReflectance of walls 0.5Reflectance of ceiling 0.7Reflectance of floor 0.3Reflectance of window 0.08Winter ventilation rate 0.0 achSummer ventilation rate 0.0 achInstalled illuminance 15 W/m2
Heating plant efficiency 0.65Cooling plant efficiency 2.0Cost of electricity 3.7 unitsa
Cost of heating 1.7 unitsa
Life of building 30 years
a The cost of delivered energy is assumed to be 1 unit.The cost of electricity and heating in primary energycost basis is assumed to be 3.7 and 1.7 times thedelivered energy cost, respectively.
Embodied energy considerations 277
JPE159 # IMechE 2006 Proc. IMechE Vol. 220 Part A: J. Power and Energy
at Universiti Teknologi MARA (UiTM) on August 1, 2014pia.sagepub.comDownloaded from
some data are presented in MJ/kg while others arepresented in MJ/m2. In practical EE analysis, thelatter is the only useful data as it can be easily relatedto sizes of building elements. The EE data used in thiswork has been calculated from EE data for wall, roof,and floor construction systems [44] and from datagiven for building elements [45].
5 DISCUSSION
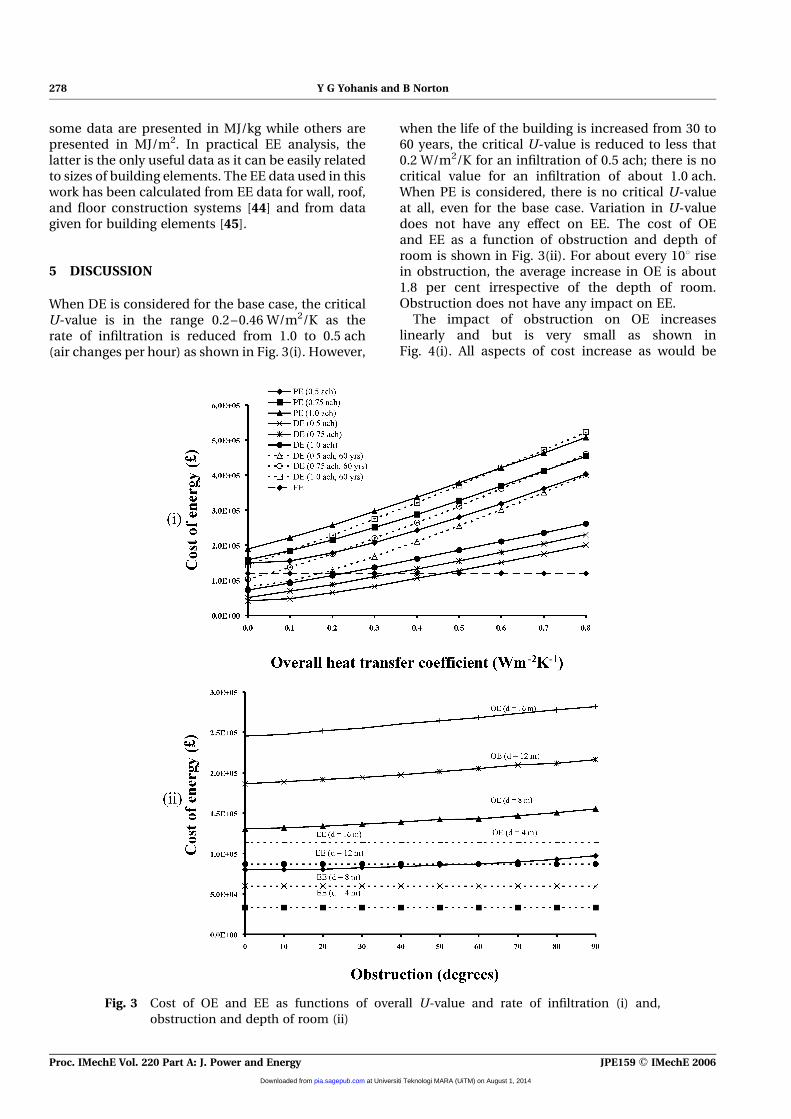
When DE is considered for the base case, the criticalU-value is in the range 0.2–0.46 W/m2/K as therate of infiltration is reduced from 1.0 to 0.5 ach(air changes per hour) as shown in Fig. 3(i). However,
when the life of the building is increased from 30 to60 years, the critical U-value is reduced to less that0.2 W/m2/K for an infiltration of 0.5 ach; there is nocritical value for an infiltration of about 1.0 ach.When PE is considered, there is no critical U-valueat all, even for the base case. Variation in U-valuedoes not have any effect on EE. The cost of OEand EE as a function of obstruction and depth ofroom is shown in Fig. 3(ii). For about every 108 risein obstruction, the average increase in OE is about1.8 per cent irrespective of the depth of room.Obstruction does not have any impact on EE.
The impact of obstruction on OE increaseslinearly and but is very small as shown inFig. 4(i). All aspects of cost increase as would be
Fig. 3 Cost of OE and EE as functions of overall U-value and rate of infiltration (i) and,
obstruction and depth of room (ii)
278 Y G Yohanis and B Norton
Proc. IMechE Vol. 220 Part A: J. Power and Energy JPE159 # IMechE 2006
at Universiti Teknologi MARA (UiTM) on August 1, 2014pia.sagepub.comDownloaded from
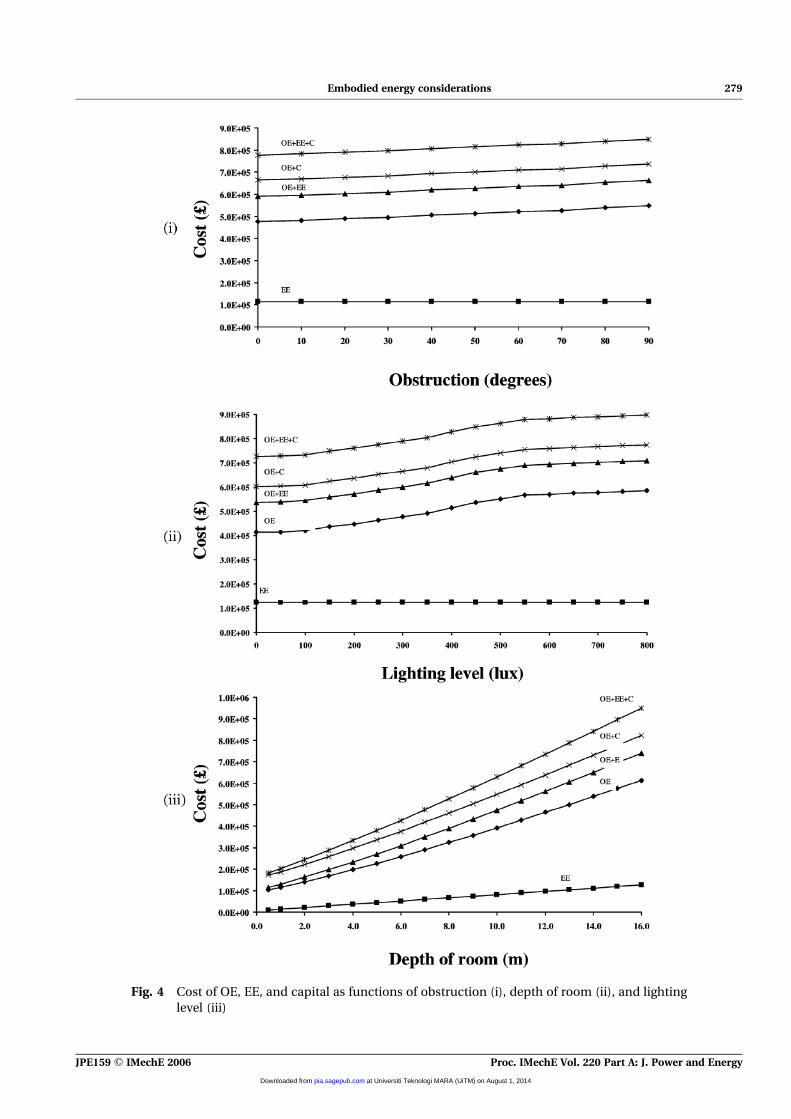
Fig. 4 Cost of OE, EE, and capital as functions of obstruction (i), depth of room (ii), and lighting
level (iii)
Embodied energy considerations 279
JPE159 # IMechE 2006 Proc. IMechE Vol. 220 Part A: J. Power and Energy
at Universiti Teknologi MARA (UiTM) on August 1, 2014pia.sagepub.comDownloaded from
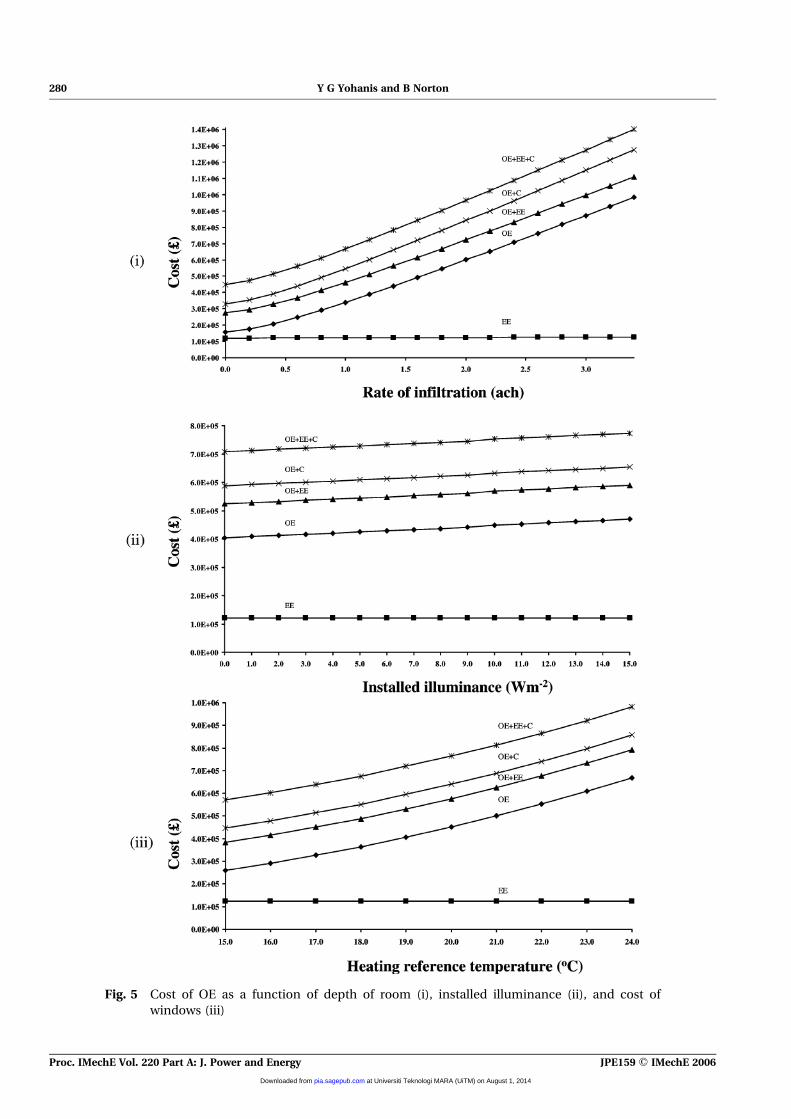
Fig. 5 Cost of OE as a function of depth of room (i), installed illuminance (ii), and cost of
windows (iii)
280 Y G Yohanis and B Norton
Proc. IMechE Vol. 220 Part A: J. Power and Energy JPE159 # IMechE 2006
at Universiti Teknologi MARA (UiTM) on August 1, 2014pia.sagepub.comDownloaded from
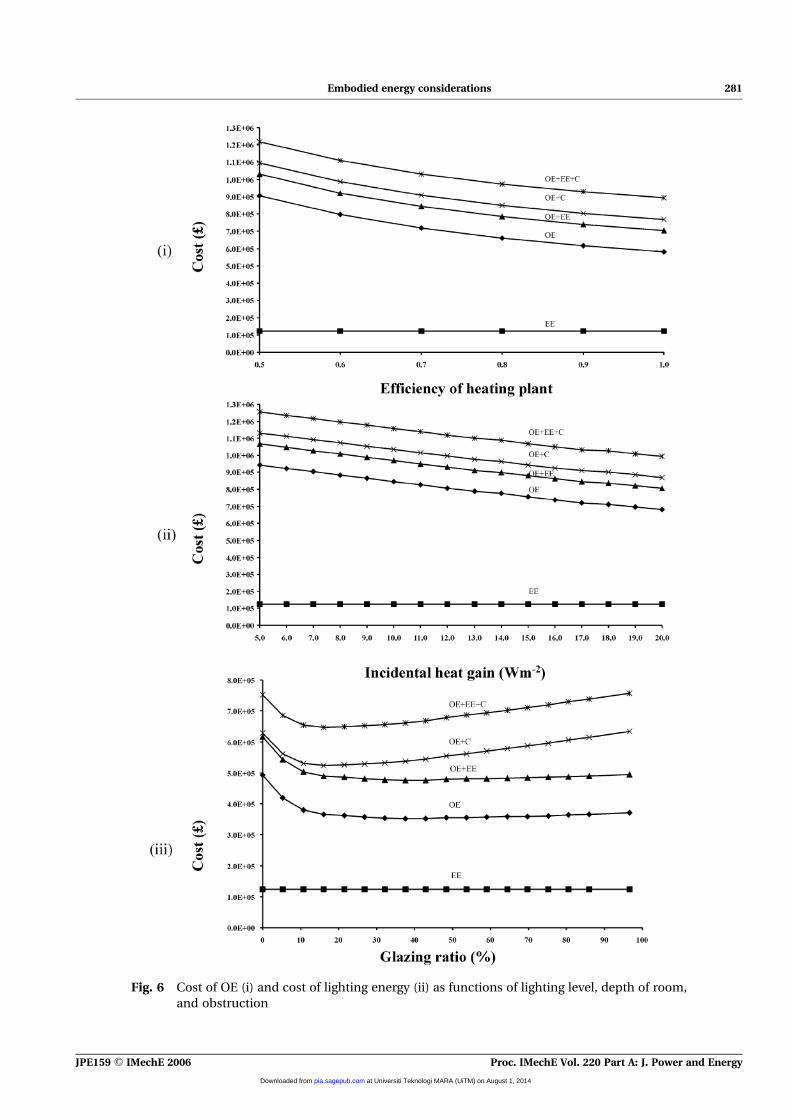
Fig. 6 Cost of OE (i) and cost of lighting energy (ii) as functions of lighting level, depth of room,
and obstruction
Embodied energy considerations 281
JPE159 # IMechE 2006 Proc. IMechE Vol. 220 Part A: J. Power and Energy
at Universiti Teknologi MARA (UiTM) on August 1, 2014pia.sagepub.comDownloaded from
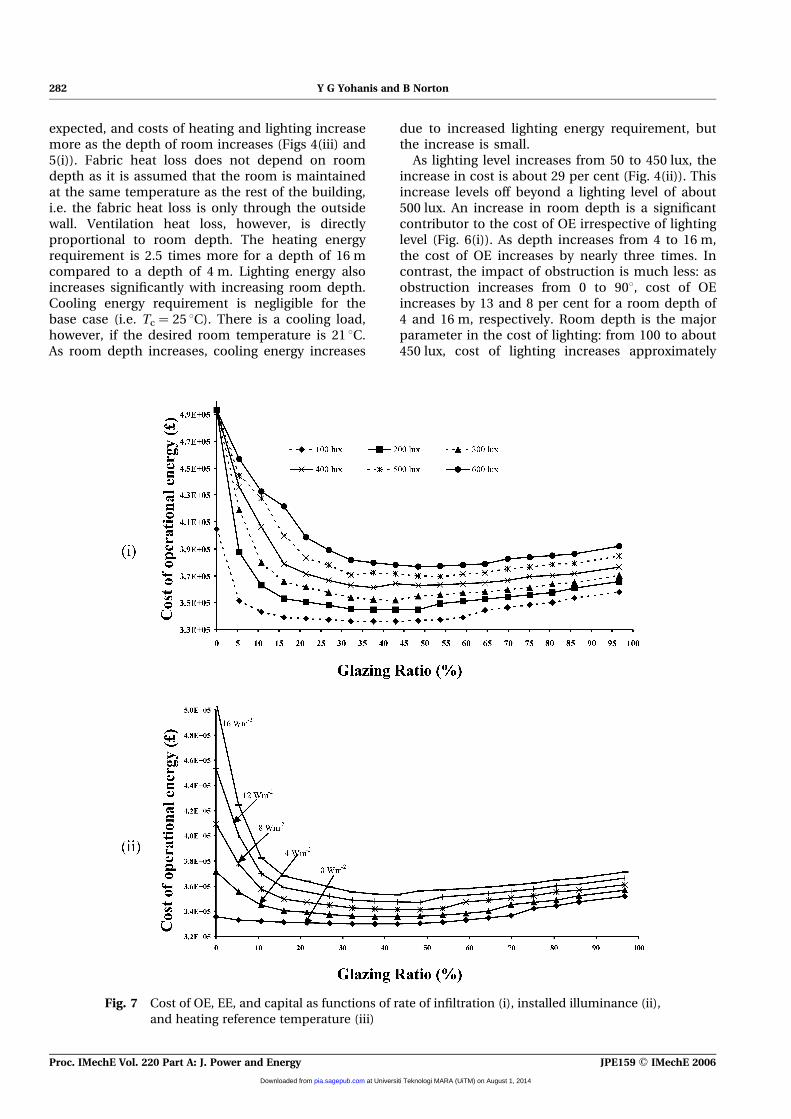
expected, and costs of heating and lighting increasemore as the depth of room increases (Figs 4(iii) and5(i)). Fabric heat loss does not depend on roomdepth as it is assumed that the room is maintainedat the same temperature as the rest of the building,i.e. the fabric heat loss is only through the outsidewall. Ventilation heat loss, however, is directlyproportional to room depth. The heating energyrequirement is 2.5 times more for a depth of 16 mcompared to a depth of 4 m. Lighting energy alsoincreases significantly with increasing room depth.Cooling energy requirement is negligible for thebase case (i.e. Tc ¼ 25 8C). There is a cooling load,however, if the desired room temperature is 21 8C.As room depth increases, cooling energy increases
due to increased lighting energy requirement, butthe increase is small.
As lighting level increases from 50 to 450 lux, theincrease in cost is about 29 per cent (Fig. 4(ii)). Thisincrease levels off beyond a lighting level of about500 lux. An increase in room depth is a significantcontributor to the cost of OE irrespective of lightinglevel (Fig. 6(i)). As depth increases from 4 to 16 m,the cost of OE increases by nearly three times. Incontrast, the impact of obstruction is much less: asobstruction increases from 0 to 908, cost of OEincreases by 13 and 8 per cent for a room depth of4 and 16 m, respectively. Room depth is the majorparameter in the cost of lighting: from 100 to about450 lux, cost of lighting increases approximately
Fig. 7 Cost of OE, EE, and capital as functions of rate of infiltration (i), installed illuminance (ii),
and heating reference temperature (iii)
282 Y G Yohanis and B Norton
Proc. IMechE Vol. 220 Part A: J. Power and Energy JPE159 # IMechE 2006
at Universiti Teknologi MARA (UiTM) on August 1, 2014pia.sagepub.comDownloaded from
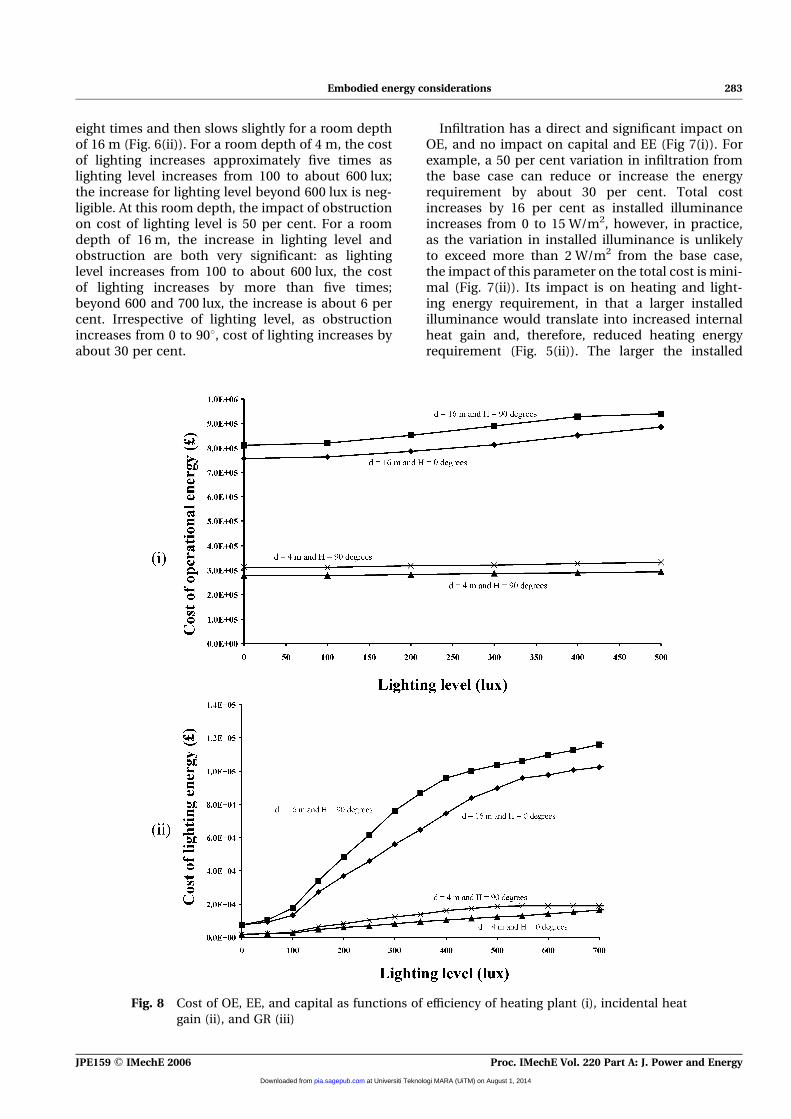
eight times and then slows slightly for a room depthof 16 m (Fig. 6(ii)). For a room depth of 4 m, the costof lighting increases approximately five times aslighting level increases from 100 to about 600 lux;the increase for lighting level beyond 600 lux is neg-ligible. At this room depth, the impact of obstructionon cost of lighting level is 50 per cent. For a roomdepth of 16 m, the increase in lighting level andobstruction are both very significant: as lightinglevel increases from 100 to about 600 lux, the costof lighting increases by more than five times;beyond 600 and 700 lux, the increase is about 6 percent. Irrespective of lighting level, as obstructionincreases from 0 to 908, cost of lighting increases byabout 30 per cent.
Infiltration has a direct and significant impact onOE, and no impact on capital and EE (Fig 7(i)). Forexample, a 50 per cent variation in infiltration fromthe base case can reduce or increase the energyrequirement by about 30 per cent. Total costincreases by 16 per cent as installed illuminanceincreases from 0 to 15 W/m2, however, in practice,as the variation in installed illuminance is unlikelyto exceed more than 2 W/m2 from the base case,the impact of this parameter on the total cost is mini-mal (Fig. 7(ii)). Its impact is on heating and light-ing energy requirement, in that a larger installedilluminance would translate into increased internalheat gain and, therefore, reduced heating energyrequirement (Fig. 5(ii)). The larger the installed
Fig. 8 Cost of OE, EE, and capital as functions of efficiency of heating plant (i), incidental heat
gain (ii), and GR (iii)
Embodied energy considerations 283
JPE159 # IMechE 2006 Proc. IMechE Vol. 220 Part A: J. Power and Energy
at Universiti Teknologi MARA (UiTM) on August 1, 2014pia.sagepub.comDownloaded from
illuminance (i.e. the larger the lighting level) thelarger is the lighting energy requirement. Its impacton cooling is negligible as the reference temperatureused is 25 8C as shown in Fig. 5(ii).
The usual design temperature for heating in build-ings is 21 8C, although actual room temperaturescould vary between 18 and 23 8C representing areduction or increase in OE of 27 or 22 per cent,respectively (Fig. 7(iii)). The average efficiency ofheating plant for buildings varies between 65 and80 per cent. However, it is possible for a boiler tobe 80 per cent efficient but for a large amount ofenergy to be lost in distribution so that the overall
efficiency of the system is reduced to 50 per cent.The increase in total cost is significant (Fig. 8(i)).
Incidental heat gain includes all heat gain fromoccupants, solar gain, equipment, excluding lightfittings. The larger this gain, the smaller the heatingenergy requirement and the larger the coolingenergy will be (Fig. 8(ii)). As incidental gain isreduced or increased by 1 W/m2 from the base-casevalue, the corresponding increase or reduction inOE is 2.6 or 2.4 per cent, respectively, therefore, asany significant variation in incidental gain is unli-kely, its impact on total cost is small. Further, asthe cooling reference temperature is set at a relatively
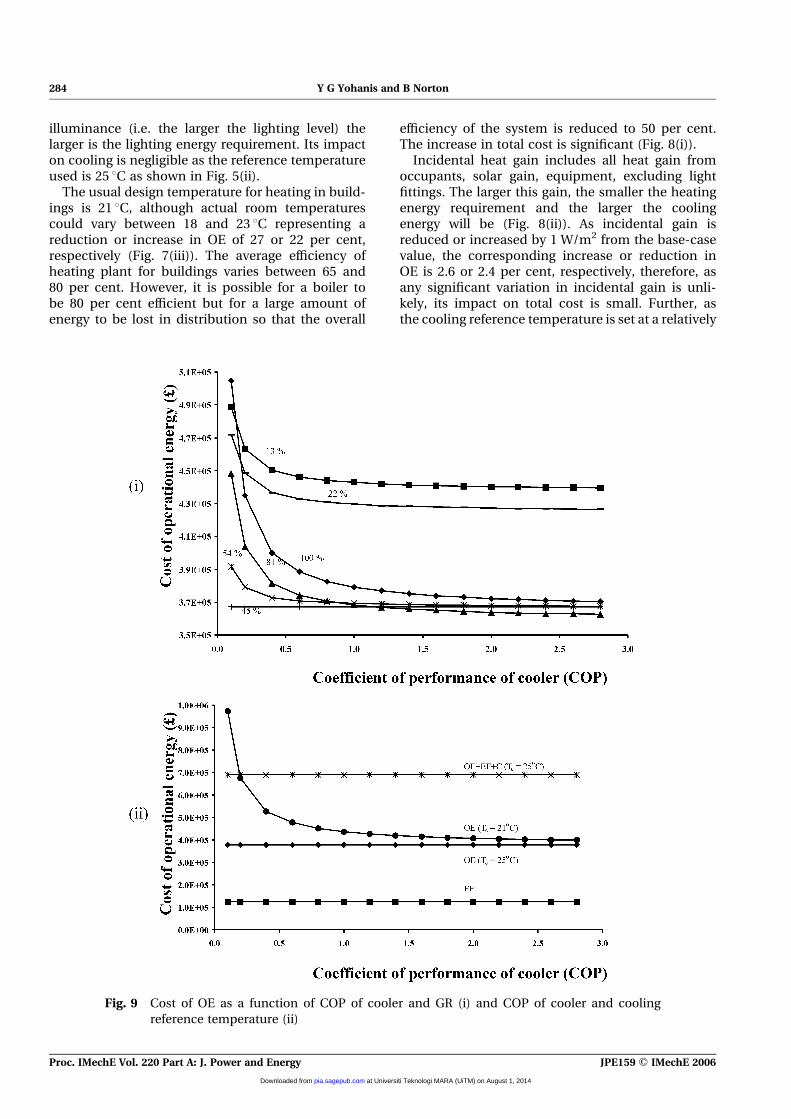
Fig. 9 Cost of OE as a function of COP of cooler and GR (i) and COP of cooler and cooling
reference temperature (ii)
284 Y G Yohanis and B Norton
Proc. IMechE Vol. 220 Part A: J. Power and Energy JPE159 # IMechE 2006
at Universiti Teknologi MARA (UiTM) on August 1, 2014pia.sagepub.comDownloaded from
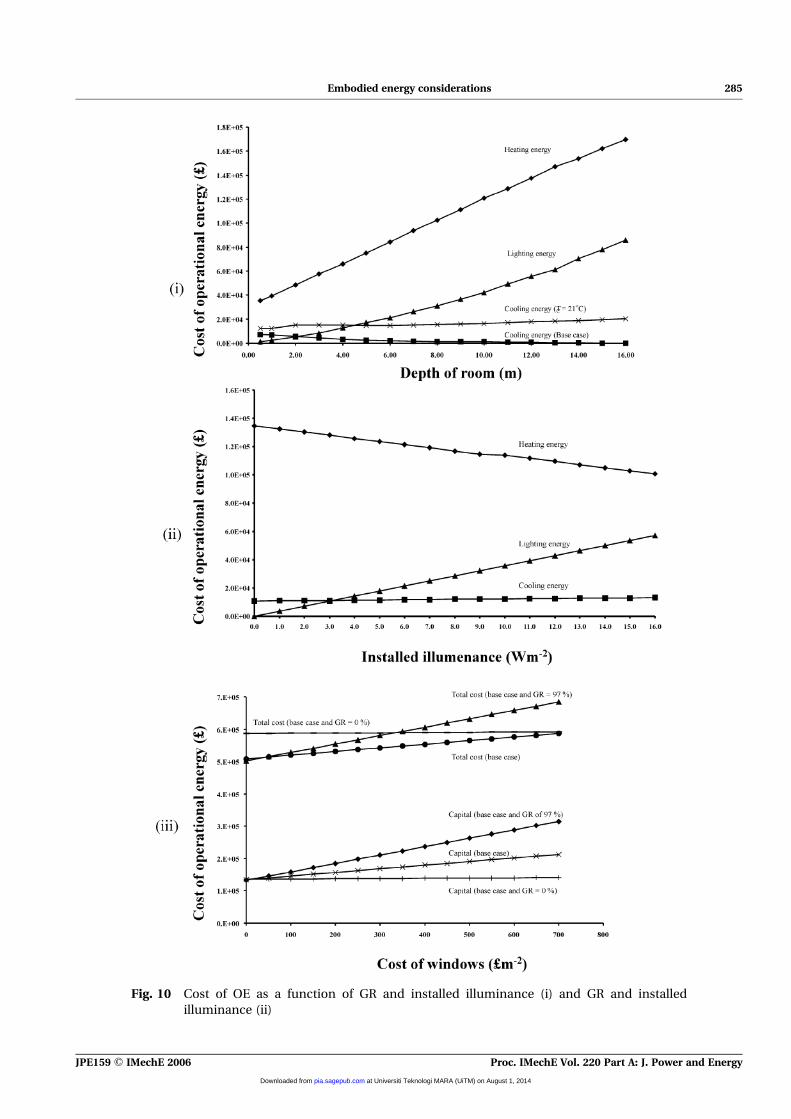
Fig. 10 Cost of OE as a function of GR and installed illuminance (i) and GR and installed
illuminance (ii)
Embodied energy considerations 285
JPE159 # IMechE 2006 Proc. IMechE Vol. 220 Part A: J. Power and Energy
at Universiti Teknologi MARA (UiTM) on August 1, 2014pia.sagepub.comDownloaded from
high level (i.e. 25 8C), incidental gain does not havemuch impact on cooling energy requirement.
The cost of OE is the lowest for a GR value of 45 percent in terms of cooling energy requirement (i.e.COP) (Fig. 9(i)). For larger values of GR, there is asharp increase in cost of OE for COP values lessthan 2.0. For larger values of COP, the impact oflarger GRs on OE is very small. For small values ofGR, however, there is a very sharp increase in thecost of OE. For a COP value of about 2.0 andhigher, the increase in cost as GR is reducedfrom the base case is significant. Fig. 9(ii) showsthat for a Tc ¼ 25 8C, variation in COP does nothave any impact on OE and EE. For lower Tc (e.g.Tc ¼ 21 8C), the increase in cost of energy is highfor low COP.
Fig. 8(iii) shows total cost as a function of GR forthe base case. The optimum GR for OE is about43 per cent; when the OE and capital are consideredtogether, it reduces to about 15 per cent. As GRapproaches zero, OE increases sharply due toincreased artificial lighting.
As GR is reduced and increased from the optimumvalue, the corresponding variation in cost is 40 and6 per cent, respectively for a range of lighting levels(see Fig. 10(i)). At the optimum GR, the variation incost is about 2–4 per cent as lighting level isincreased from 100 to 600 lux. For smaller valuesof GR, these values are slightly larger, and forlarger values of GR, slightly less. For GR values of20 per cent and larger, cost of OE increases byalmost 2 per cent as installed illuminance increasesby 4 W m2 (see Fig. 10(ii)). As it is unlikely for actualGRs to be less than 20 per cent and for installedilluminance to vary very much from about 12 W/m2,the combination of these parameters does not havea significant impact on the cost energy.
Fig. 5(iii) shows capital and total costs as functionsof the unit cost of windows and GR. For the basecase, total cost and capital increase by 1 per cent asthe unit cost of windows increases by 100 £/m2;even when GR approaches 100 per cent, this increaseis only about 2 per cent (see Fig. 5(iii)). The impact ofthe cost of windows on EE is negligible.
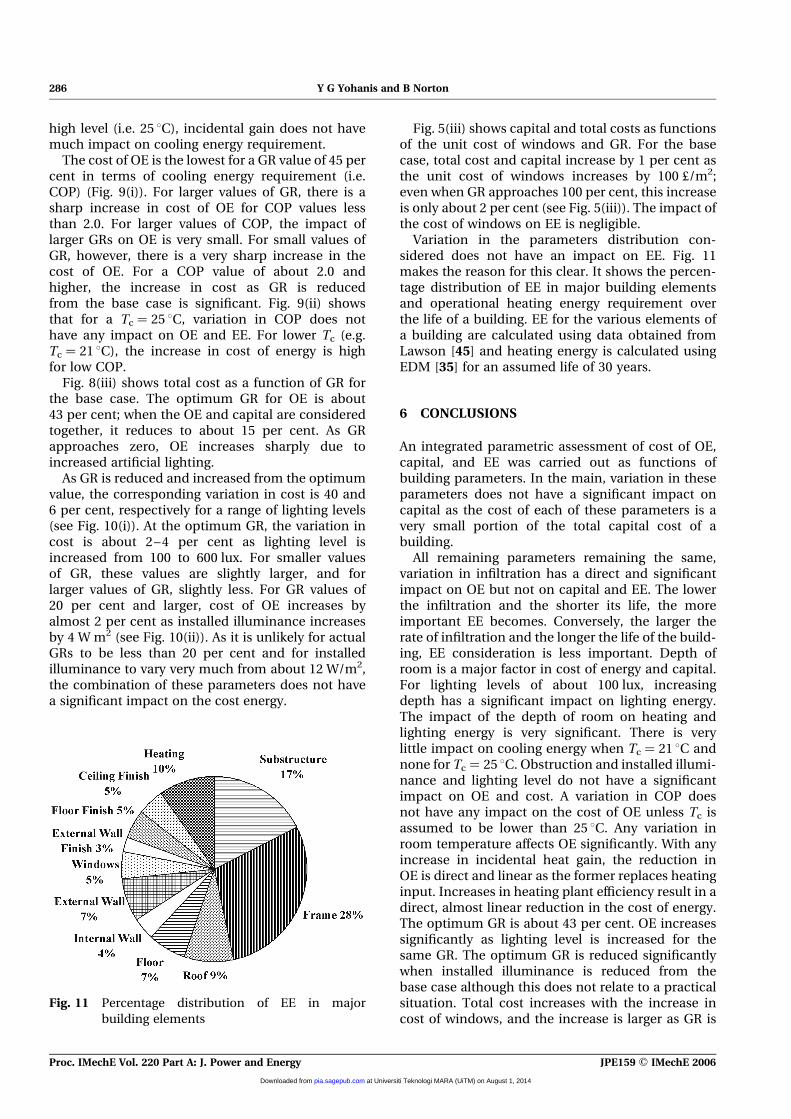
Variation in the parameters distribution con-sidered does not have an impact on EE. Fig. 11makes the reason for this clear. It shows the percen-tage distribution of EE in major building elementsand operational heating energy requirement overthe life of a building. EE for the various elements ofa building are calculated using data obtained fromLawson [45] and heating energy is calculated usingEDM [35] for an assumed life of 30 years.
6 CONCLUSIONS
An integrated parametric assessment of cost of OE,capital, and EE was carried out as functions ofbuilding parameters. In the main, variation in theseparameters does not have a significant impact oncapital as the cost of each of these parameters is avery small portion of the total capital cost of abuilding.
All remaining parameters remaining the same,variation in infiltration has a direct and significantimpact on OE but not on capital and EE. The lowerthe infiltration and the shorter its life, the moreimportant EE becomes. Conversely, the larger therate of infiltration and the longer the life of the build-ing, EE consideration is less important. Depth ofroom is a major factor in cost of energy and capital.For lighting levels of about 100 lux, increasingdepth has a significant impact on lighting energy.The impact of the depth of room on heating andlighting energy is very significant. There is verylittle impact on cooling energy when Tc ¼ 21 8C andnone for Tc ¼ 25 8C. Obstruction and installed illumi-nance and lighting level do not have a significantimpact on OE and cost. A variation in COP doesnot have any impact on the cost of OE unless Tc isassumed to be lower than 25 8C. Any variation inroom temperature affects OE significantly. With anyincrease in incidental heat gain, the reduction inOE is direct and linear as the former replaces heatinginput. Increases in heating plant efficiency result in adirect, almost linear reduction in the cost of energy.The optimum GR is about 43 per cent. OE increasessignificantly as lighting level is increased for thesame GR. The optimum GR is reduced significantlywhen installed illuminance is reduced from thebase case although this does not relate to a practicalsituation. Total cost increases with the increase incost of windows, and the increase is larger as GR is
Fig. 11 Percentage distribution of EE in major
building elements
286 Y G Yohanis and B Norton
Proc. IMechE Vol. 220 Part A: J. Power and Energy JPE159 # IMechE 2006
at Universiti Teknologi MARA (UiTM) on August 1, 2014pia.sagepub.comDownloaded from
increased. Any increase in installed illuminanceresults in an increase in lighting energy and a corre-sponding reduction in heating energy.
The impact of the variation of building parameterson EE varies from very small to negligible. Thereasons for this are two-fold: EE compared with OEis much smaller even when the life of a building of30 years is considered (in reality, building lifewould be much longer); a large part of the EE in abuilding is in the substructure, frame, roof, floor,internal wall, external wall, etc. so that a variationin one component (e.g. insulation) does not have asignificant impact on EE.
REFERENCES
1 Anon. Energy use on Europe and annual energy review,1996 (Commission of the European Union, Brussels).
2 Santomouris, M. and Argindon, A. Renewable energiesand energy conservation technologies for buildings inSouthern Europe. Int. J. Solar Energy, 1994, 15, 69–79.
3 Staznners, D. and Boudeau, P. (Eds). Europe’s environ-ment – the Dobros assessment, 1995 (EuropeanEnvironmental Agency, Denmark).
4 Anon. Annual energy review 2000, 2001 (Energy Infor-mation Administration, US Department of Energy,Washington, DC).
5 Anon. Emissions of greenhouse gases in the UnitedStates 2000, 2000 (Energy Information and Adminis-tration, US Department of Energy, Washington, DC).
6 Koomey, J. G., Martin, N. C., Brown, M., Price, L. K.,and Levine, M. D. Costs of reducing carbon emissions:US building sector scenarios. Energy Policy, 1998, 26(5),433–440.
7 Norton, B., Lo, S. N. G., Kronin, K. P., andYohanis, Y. G.Towards the harmonious integration of informationtechnology in building design and constructions.Int. J. Ambient Energy, 1995, 16(2), 95–109.
8 Augenbroe, G. L. M. Integrated building performanceevaluation in the early design stages. Build. Environ.,1992, 27(2), 149–171.
9 Augenbroe, G. L. M. and Winkelmann, F. C. Inte-gration of simulation into building design; the needfor a joint approach. In Proceedings of ASME Inter-national Solar Energy Conference, Miami, USA, 1990,247–255.
10 Papamichael, M. K. Design process and knowledge,possibilities and limitations of computer aided design.PhD Thesis, University of California, Berkeley, USA,1991.
11 Buchanan, A. H. and Honey, B. G. Energy and carbondioxide implications of building construction. EnergyBuild., 1994, 20, 205–217.
12 Suzuki, M. and Oka, T. Estimation of life cycle energyconsumption and CO2 emission of office buildings inJapan. Energy Build., 1998, 28, 33–41.
13 Oka, T., Suzuki, M., and Konnya, T. The estimation ofenergy consumption and amounts of pollutants due tothe construction of buildings. Energy Build., 1993, 19,303–311.
14 Debnath, A., Singh, S. V., and Singh, Y. P. Comparativeassessment of energy requirements for different typesof residential buildings in India. Energy Build., 1995,23(2), 141–146.
15 Suzuki, M., Oka, T., and Okada, K. The estimation ofenergy consumption and CO2 emission due to housingconstruction in Japan. Energy Build., 1995, 22, 165–169.
16 Reddy, B. V. and Jagadish, K. S. Embodied energy ofcommon and alternative building materials and tech-nologies. Energy Build., 2003, 35(2), 129–137.
17 Adalberth, K. Energy use during the life cycle of single-unit dwellings: examples. Build. Environ., 1997, 32,321–329.
18 Cole, R. J. and Kernan, P. C. Life cycle energy use inoffice building. Build. Environ., 1996, 31(4), 307–317.
19 Feist, W. Life-cycle energy balances compared: low-energy house, passive house, self-sufficient house. InProceedings of the International Symposium of CIBW67, Vienna, Austria, 1996.
20 Scheuer, C., Keoleian, G. A., and Reppe, P. Life cycleenergy and environmental performance of a new uni-versity building: modeling challenges and design impli-cations. Energy Build., 2003, 35(10), 1049–1064.
21 Eaton, K. J. and Amato, A. A comparative life cycleassessment of steel and concrete framed office build-ings. J. Construct. Steel Res., 1998, 46(1–3), 286–287.
22 Blanchard, S. and Reppe, P. Life cycle analysis of a resi-dential home in Michigan, 1998, pp. x, 155. (School ofNatural Resources and Environment, University ofMichigan, Ann Arbor, MI, USA).
23 Keoleian, G., Blanchard, S., and Reppe, P. Life-cycleenergy, costs, and strategies for improving a single-family house. J. Ind. Ecol., 2001, 4(2), 135–156.
24 Adalberth, K. Energy use in four multi-family housesduring their life cycle. Int. J. Low Energy Sust. Build.,1999–2000, available from, www.ce.kth.se/bim/leas/journal.htm.
25 Thormark, C. Including recycling in energy use into thelife-cycle of building. Int. J. Build. Res. Inform., 2000,28(3), 1–8.
26 Thormack, C. A low energy building in a life cycle – itsembodied energy, energy need for operation and recy-cling potential. Build. Environ., 2002, 37(4), 429–435.
27 Adalberth, K. Energy use during the life cycle of build-ing: a method. Build. Environ., 1997, 32(4), 317–320.
28 McCoubrie, A. and Treloar, G. Life-cycle embodiedenergy in office furniture. Eds Treloar, T. Fay and S.,Tucker. In Proceedings of the Embodied Energy: theCurrent State of Play, Deakin University, Geelong,Australia, 1996, pp. 113–118.
29 Atkinson, C., Hobbs, S., West, J., and Edwards, S. Lifecycle embodied energy and carbon dioxide emissionsin buildings. Ind. Environ., 1996, 2, 29–31.
30 Winther, B. N., and Hestnes, A. G. Solar versus green:the analysis of a Norwegian row house. Solar Energy,1999, 66(6), 387–393.
31 Thormark, C. Conservation of energy and naturalresources by recycling building waste. Resour. Conserv.Recy., 2001, 33(2), 113–130.
32 Thormark, C. Including recycling in energy use into thelife-cycle of buildings. Int. J. Build. Res. Inform., 2000,28(3), 1–8.
Embodied energy considerations 287
JPE159 # IMechE 2006 Proc. IMechE Vol. 220 Part A: J. Power and Energy
at Universiti Teknologi MARA (UiTM) on August 1, 2014pia.sagepub.comDownloaded from
33 West, J. Life cycle embodied energy and CO2 in build-ings, BRE unpublished internal document, 1997.
34 Tucker, S. N. and Treloar, G. J. Embodied energy inconstruction and refurbishment of buildings. In Pro-ceedings of CIB International Conference on Buildingsand the Environment, BRE, Garston, 1994.
35 Chen, T. Y., Burnett, J., and Chau, C. K. Analysis ofembodied energy use in the residential building ofHong Kong. Energy, 2001, 26(4), 323–340.
36 Yohanis, Y. G. and Norton, B. The early design modelfor prediction of energy and cost performance of build-ing design options. Int. J. Solar Energy, 2000, 20(3),207–226.
37 Yohanis, Y. G. and Norton, B. Utilisation factor forbuilding solar-heat gain for use in a simplified energymodel. Appl. Energy, 1999, 63(4), 227–239.
38 Yohanis, Y. G. and Norton, B. Estimating at the earlieststages of design the financial cost and operationalenergy requirement of buildings. J. Financ. Manage.Prop. Construct., 1998, 3(2), 41–58.
39 Palmiter, L. and Wheeling, T. SERI-RES, ResidentialEnergy Simulator, Version 1.0, 1983 (Ecotype Group,Seattle, USA).
40 Haves, P. and Littler, J. Refinements to SERI-RES,ETSU, Report 1130, 1987.
41 Page, J. and Lebens, R. Designer’s Handbook of UKData for Solar Energy Applications, ETSU, ReportS1134, 1984.
42 Baker, N. and Hoch, D. Experience with a designtool which combines the energy value of daylight andthe thermal value of solar gain. In Proceedings theUK-ISES Conference, Daylighting Buildings, ImperialCollege, London, 1989.
43 RICS. Building Cost Information Service News, TheRoyal Institution of Chartered Surveyors London, 13,1995.
44 Howard, N. P. Embodied energy and consequentialCO2 in construction. Energy and mass flow in build-ings. In Proceedings of the International Symposiumof CIBW67, Centre Scientifique et Technique duBatiment, Vienna, Austria, 1996, 161–176.
45 Lawson, W. R. Embodied energy of building materials,environment design guide, 1996 (Royal AustralianInstitute of Architects), Manuka, Australia.
APPENDIX
Notation
A area of glazing (m2)C cost (£)Ct temperature correction factord depth of room (m)H obstruction (8)t tonneTambient average ambient temperature (8C)Tc cooling reference temperature (8C)Tcomfort required comfort temperature (8C)Tref reference temperature (8C)U heat loss coefficient (W/m2/K1)�U mean overall heat transfer coefficient
(W/m2/K1)
288 Y G Yohanis and B Norton
Proc. IMechE Vol. 220 Part A: J. Power and Energy JPE159 # IMechE 2006
at Universiti Teknologi MARA (UiTM) on August 1, 2014pia.sagepub.comDownloaded from