inception report // geography of covid-19
TRANSCRIPT

(Akkermans, 2017) (Ambroziak & Hartwell, 2018)
INCEPTION REPORT //
Geography of Covid-19 Territorial impacts of Covid-19 and policy answers in European regions and cities Report // October 2021

This INCEPTION REPORT is conducted within the framework of the ESPON 2020 Cooperation Programme, partly financed by the European Regional Development Fund.
The ESPON EGTC is the Single Beneficiary of the ESPON 2020 Cooperation Programme. The Single Operation within the programme is implemented by the ESPON EGTC and co-financed by the European Regional Development Fund, the EU Member States and the Partner States, Iceland, Liechtenstein, Norway and Switzerland.
This delivery does not necessarily reflect the opinions of members of the ESPON 2020 Monitoring Committee.
Authors EM Normandie Business School (Sebastien Bourdin – project leader) and its partners from EconomiX Lab CNRS (Nadine Levratto, Giuseppe Arcuri, Mounir Amdaoud) and HÉTFA Research Institute (Hajnalka Lőcsei, András Igari)
Information on ESPON and its projects can be found at www.espon.eu. The website provides the possibility to download and examine the most recent documents produced by finalised and ongoing ESPON projects.
© ESPON, 2021 Published in October 2021
Printing, reproduction or quotation is authorised provided the source is acknowledged and a copy is forwarded to the ESPON EGTC in Luxembourg.
Contact: [email protected]

INCEPTION REPORT // Geography of Covid-19
ESPON // espon.eu 3
INCEPTION REPORT //
Geography of Covid-19 Territorial impacts of Covid-19 and policy answers in European regions and cities Report // September 2021
Disclaimer
This document is a final report.
The information contained herein is subject to change and does not commit the ESPON EGTC and the countries participating in the ESPON 2020 Cooperation Programme.
The final version of the report will be published as soon as approved.
INCEPTION REPORT // Geography of Covid-19
4 ESPON // espon.eu
Table of contents
1 Introduction ........................................................................................................................ 6 1.1 Background and context of the study: Understanding territorial impacts of COVID-19 and policy
answers in European regions and cities ..................................................................................... 6 1.2 Objectives and expected outcomes ............................................................................................ 8 1.2.1 Gaps of knowledge and research needs ..................................................................................... 8 1.2.2 Goals of this project .................................................................................................................... 8 1.2.3 Policy issues ............................................................................................................................... 9
2 Methodological approach of our study .......................................................................... 10 2.1 Measures of choice for assessing COVID-19 ........................................................................... 10 2.2 Identifying the determinants of COVID-19 spread and spatial concentration ............................ 11 2.3 Analysing the social consequences of COVID-19 ..................................................................... 13 2.4 How can the data be processed? .............................................................................................. 15 2.4.1 Dynamic maps .......................................................................................................................... 15 2.4.2 Spatial econometrics ................................................................................................................. 15 2.4.3 Building an ecological index to estimate social consequences and propose a regional typology
.................................................................................................................................................. 17
3 First results of spatial econometric analyses to test potential explanatory variables for the spread of the virus and its spatial concentration ............................................. 19
4 First updated maps of the geographical pattern of COVID-19..................................... 24

INCEPTION REPORT // Geography of Covid-19
ESPON // espon.eu 5
List of maps, figures, charts and tables List of maps Map 1 COVID-19 death rate per 10.000 Inhabitants, end of July 2020 ....................................................... 19 Map 2 COVID-19 death rate per 10.000 Inhabitants, end of February 2021 ............................................... 20 Map 3 Cluster map of COVID-19 death rate (end of July 2020) ................................................................. 21 Map 4 Cluster map of COVID-19 death rate (end of February 2021) .......................................................... 21 Map 5 New deaths: the number of death per month ................................................................................... 24 Map 6 Cumulative deaths: the cumulate number of death per month ......................................................... 25
List of tables Table 1 Definition and source of the variables ............................................................................................ 13 Table 2 Empirical results for COVID-19 death rate determinants ............................................................... 22 Table 3 Preliminary list of sample areas ..................................................................................................... 26 Table 4 Availability of pandemic data by countries ..................................................................................... 27 Table 5 Descriptive statistics....................................................................................................................... 30 Table 6 Correlation matrix ........................................................................................................................... 30 Table 7 A list of social indicators ................................................................................................................. 31 Table 8 B list of social indicators ................................................................................................................. 33
List of figures Figure 1: Evolution of the COVID-related mortality rate in European countries ............................................ 6 Figure 2 Conceptual framework .................................................................................................................... 8 Figure 3 Covid-19 deaths by country .......................................................................................................... 29
List of box Box 1 Spatial econometrics models 16
INCEPTION REPORT // Geography of Covid-19
6 ESPON // espon.eu
Introduction
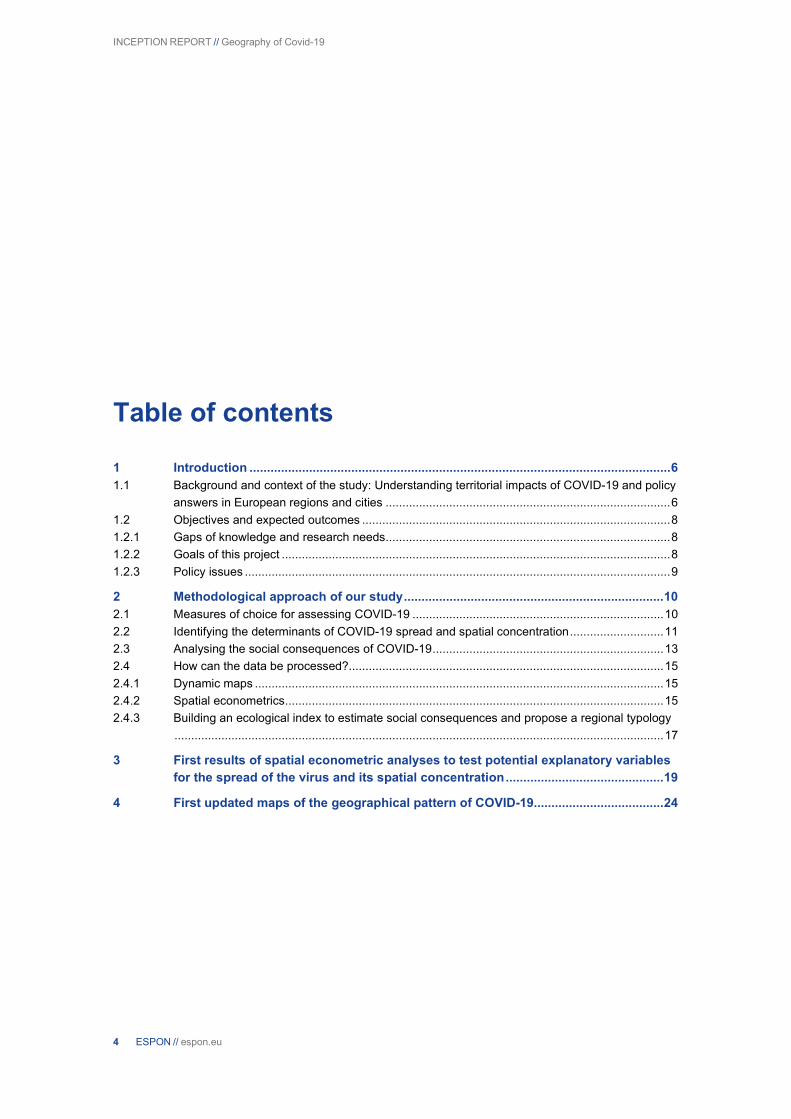
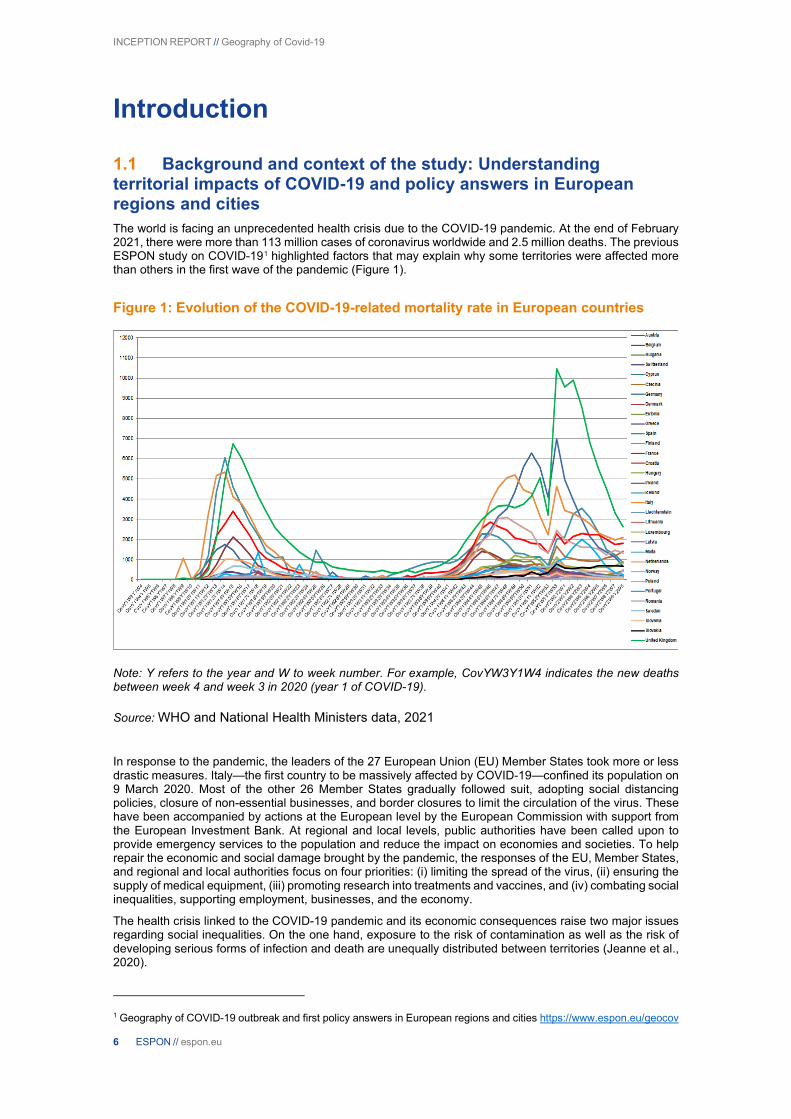
1.1 Background and context of the study: Understanding territorial impacts of COVID-19 and policy answers in European regions and cities The world is facing an unprecedented health crisis due to the COVID-19 pandemic. At the end of February 2021, there were more than 113 million cases of coronavirus worldwide and 2.5 million deaths. The previous ESPON study on COVID-191 highlighted factors that may explain why some territories were affected more than others in the first wave of the pandemic (Figure 1).
Figure 1: Evolution of the COVID-19-related mortality rate in European countries
Note: Y refers to the year and W to week number. For example, CovYW3Y1W4 indicates the new deaths between week 4 and week 3 in 2020 (year 1 of COVID-19).
Source: WHO and National Health Ministers data, 2021
In response to the pandemic, the leaders of the 27 European Union (EU) Member States took more or less drastic measures. Italy—the first country to be massively affected by COVID-19—confined its population on 9 March 2020. Most of the other 26 Member States gradually followed suit, adopting social distancing policies, closure of non-essential businesses, and border closures to limit the circulation of the virus. These have been accompanied by actions at the European level by the European Commission with support from the European Investment Bank. At regional and local levels, public authorities have been called upon to provide emergency services to the population and reduce the impact on economies and societies. To help repair the economic and social damage brought by the pandemic, the responses of the EU, Member States, and regional and local authorities focus on four priorities: (i) limiting the spread of the virus, (ii) ensuring the supply of medical equipment, (iii) promoting research into treatments and vaccines, and (iv) combating social inequalities, supporting employment, businesses, and the economy.
The health crisis linked to the COVID-19 pandemic and its economic consequences raise two major issues regarding social inequalities. On the one hand, exposure to the risk of contamination as well as the risk of developing serious forms of infection and death are unequally distributed between territories (Jeanne et al., 2020).
1 Geography of COVID-19 outbreak and first policy answers in European regions and cities https://www.espon.eu/geocov
INCEPTION REPORT // Geography of Covid-19
ESPON // espon.eu 7
Of the above approaches, the former assumes that, as the virus is transmitted from person to person, its spread adapts to population flows and human mobility, appearing first in the main transport hubs (major airports, capitals, tourist zones), then in smaller centres, and finally in rural, peripheral areas (according to the so-called hierarchical diffusion model). Hence, in the initial phase of the waves, metropolitan regions were most affected, while peripheral areas were only affected later—both at the European and national levels (Amdaoud et al., 2021; Bogoch et al., 2020; Bourdin et al., 2021; Brockmann-Helbing, 2020; Gatto et al., 2020). However, in later phases, the effects on neighbourhoods became more important (the so-called contagious diffusion) (Morrill et al., 1988; Haggett, 2007; Childs et al., 2015; Kincses-Tóth, 2020).
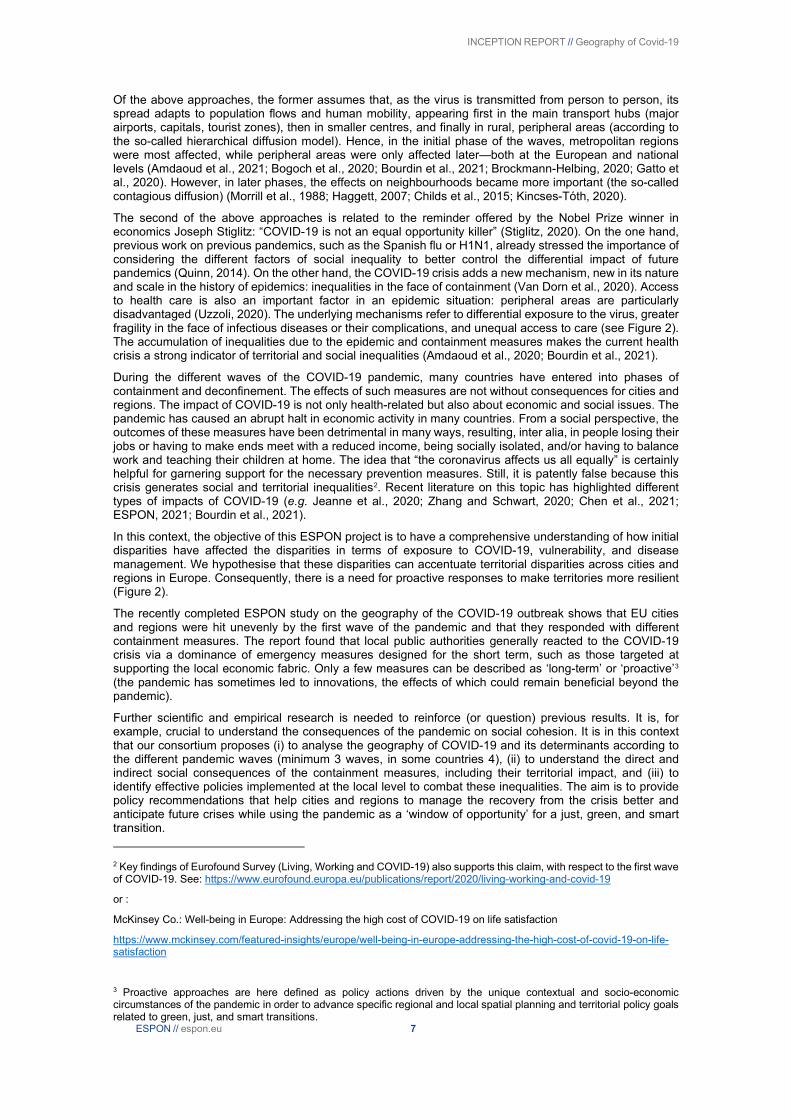
The second of the above approaches is related to the reminder offered by the Nobel Prize winner in economics Joseph Stiglitz: “COVID-19 is not an equal opportunity killer” (Stiglitz, 2020). On the one hand, previous work on previous pandemics, such as the Spanish flu or H1N1, already stressed the importance of considering the different factors of social inequality to better control the differential impact of future pandemics (Quinn, 2014). On the other hand, the COVID-19 crisis adds a new mechanism, new in its nature and scale in the history of epidemics: inequalities in the face of containment (Van Dorn et al., 2020). Access to health care is also an important factor in an epidemic situation: peripheral areas are particularly disadvantaged (Uzzoli, 2020). The underlying mechanisms refer to differential exposure to the virus, greater fragility in the face of infectious diseases or their complications, and unequal access to care (see Figure 2). The accumulation of inequalities due to the epidemic and containment measures makes the current health crisis a strong indicator of territorial and social inequalities (Amdaoud et al., 2020; Bourdin et al., 2021).
During the different waves of the COVID-19 pandemic, many countries have entered into phases of containment and deconfinement. The effects of such measures are not without consequences for cities and regions. The impact of COVID-19 is not only health-related but also about economic and social issues. The pandemic has caused an abrupt halt in economic activity in many countries. From a social perspective, the outcomes of these measures have been detrimental in many ways, resulting, inter alia, in people losing their jobs or having to make ends meet with a reduced income, being socially isolated, and/or having to balance work and teaching their children at home. The idea that “the coronavirus affects us all equally” is certainly helpful for garnering support for the necessary prevention measures. Still, it is patently false because this crisis generates social and territorial inequalities2. Recent literature on this topic has highlighted different types of impacts of COVID-19 (e.g. Jeanne et al., 2020; Zhang and Schwart, 2020; Chen et al., 2021; ESPON, 2021; Bourdin et al., 2021).
In this context, the objective of this ESPON project is to have a comprehensive understanding of how initial disparities have affected the disparities in terms of exposure to COVID-19, vulnerability, and disease management. We hypothesise that these disparities can accentuate territorial disparities across cities and regions in Europe. Consequently, there is a need for proactive responses to make territories more resilient (Figure 2).
The recently completed ESPON study on the geography of the COVID-19 outbreak shows that EU cities and regions were hit unevenly by the first wave of the pandemic and that they responded with different containment measures. The report found that local public authorities generally reacted to the COVID-19 crisis via a dominance of emergency measures designed for the short term, such as those targeted at supporting the local economic fabric. Only a few measures can be described as ‘long-term’ or ‘proactive’3 (the pandemic has sometimes led to innovations, the effects of which could remain beneficial beyond the pandemic).
Further scientific and empirical research is needed to reinforce (or question) previous results. It is, for example, crucial to understand the consequences of the pandemic on social cohesion. It is in this context that our consortium proposes (i) to analyse the geography of COVID-19 and its determinants according to the different pandemic waves (minimum 3 waves, in some countries 4), (ii) to understand the direct and indirect social consequences of the containment measures, including their territorial impact, and (iii) to identify effective policies implemented at the local level to combat these inequalities. The aim is to provide policy recommendations that help cities and regions to manage the recovery from the crisis better and anticipate future crises while using the pandemic as a ‘window of opportunity’ for a just, green, and smart transition.
2 Key findings of Eurofound Survey (Living, Working and COVID-19) also supports this claim, with respect to the first wave of COVID-19. See: https://www.eurofound.europa.eu/publications/report/2020/living-working-and-covid-19
or :
McKinsey Co.: Well-being in Europe: Addressing the high cost of COVID-19 on life satisfaction
https://www.mckinsey.com/featured-insights/europe/well-being-in-europe-addressing-the-high-cost-of-covid-19-on-life-satisfaction
3 Proactive approaches are here defined as policy actions driven by the unique contextual and socio-economic circumstances of the pandemic in order to advance specific regional and local spatial planning and territorial policy goals related to green, just, and smart transitions.
INCEPTION REPORT // Geography of Covid-19
8 ESPON // espon.eu
Figure 2. Conceptual framework of the project
1.2 Objectives and expected outcomes This project aims to identify the paths to be taken to make cities and regions more resilient and inclusive to combat the medium- and long-term effects of the pandemic.
1.2.1 Gaps of knowledge and research needs Regional science has highlighted some important factors that explain why some territories are affected more than others by the COVID-19 pandemic. The recent ESPON study on the geography of COVID-19 highlights the role of socio-economic characteristics, quality of governance, connectivity, and health infrastructures of the regions to explain the territorial differences in terms of casualties. Most studies have been confined to the first wave of the pandemic. A key question is therefore whether the factors that explain different territorial impacts of the pandemic during the first wave also hold explanatory power for the second and third waves.
Eradicating the pandemic and emerging from the economic and social crises it instigated pose a major challenge to Europe and its territories. A main challenge lies in understanding the effects of confinement measures on social inequalities and how territorial specificities result in different types of disparities.
Many European regions and cities have taken various policy measures to address the effects of confinement measures. The effects of these policy responses have not been sufficiently studied, however. There is still a lack of knowledge of how European territories are implementing policies to tackle the pandemic’s socio-economic inequalities and the effectiveness of these policies. Research is needed to highlight good practices and policy responses that saw the COVID-19 crisis as a ‘window of opportunity’ to advance other goals in the public interest.
1.2.2 Goals of this project This project will study the geography of COVID-19 during the first, second, and third waves (and if the fourth wave ends by the end of 2021, it will also be included in the analysis), seek to understand its determinants, and examine how different European cities and regions are facing the challenges related to the effects of containment. It will study cities and regions in which proactive measures have been put in place to fight against inequalities, especially those of a social nature.
The project will particularly examine the factors that best explain the level of exposure of cities, regions, and functional urban areas to the COVID-19 pandemic. In this context, we will assess whether the presence of borders (Medeiros et al., 2020), local wealth conditions, poverty, or inequalities explain why territories are differently affected by the virus’ diffusion. Finally, through case studies, we will analyse how local authorities implemented policies to respond to the challenges of the crisis in specific local and regional contexts. The project results, which will be formulated into concrete policy recommendations (effective strategies), will help European territories exploit the transformative potential of this crisis, which can be seen as a ‘window of opportunity’ to advance other legitimate policy goals. An important aspect will be to transfer knowledge and
INCEPTION REPORT // Geography of Covid-19
ESPON // espon.eu 9
provide examples of good practice, helping other cities and regions face future crises and to better resolve ‘covidfencing’ related issues (Medeiros, 2020).
1.2.3 Policy issues The main issues that this project will address can be summarised as follows.
First, the project will examine how territories were affected differently by each respective wave. Here, it will be important to consider the pre-existing inequalities between cities and regions and see how they have influenced the spread of the pandemic. We will explore how potential explanatory factors, such as income and assets, education, density of population, quality of government, and quality of health infrastructure, affect the exposure risk to the pandemic.
Second, the project will describe and analyse the policy responses to the COVID-19 crisis and their consequences through case studies in different settings. The aim will be to determine the types of strategies and policies in place in each of the cities/regions and how these policy responses have been designed and implemented. An interesting question is the extent to which these policy measures exacerbate social exclusion or, on the contrary, contribute to the fight against inequality via better targeted social policies, accelerated digitalisation, and greener mobility. A key point is to ascertain whether identified good practices can be upscaled and transferred to other regions and cities. To meet this goal, local knowledge is crucial. Hence, we are partnering with the Council of European Municipalities and Regions (CEMR) and will work together with EUROCITIES, the European Committee of the Regions, and the European Confederation of Local Intermediate Authorities (CEPLI). These organisations have already confirmed their willingness to participate in the project and to be approached in this capacity.
INCEPTION REPORT // Geography of Covid-19
10 ESPON // espon.eu
2 Methodological approach of our study Our study is divided into four tasks, the first two of which are devoted to a quantitative approach:
T1: Analysis of the geography of the pandemic and its evolution
T2: Analysis of the social consequences of COVID-19 containment measures on European cities and regions
T3: Case studies
T4: Proposals for transnational policy implementation based on case studies
The first task of the project consists of describing and mapping the evolution of the territorial patterns of the COVID-19 pandemic. The aim is to understand which factors influence the concentration and spatial diffusion of the virus. In particular, territorial determinants are studied. Once the geography of the COVID-19 has been analysed, the socio-economic consequences of the COVID-19 must be studied. Thus, the objective of the second task is to identify indicators that can capture the social consequences of the containment measures at the local level. After collecting the data, it will be necessary to carry out a typology that reflects specific territorial and/or socio-economic characteristics that result in territories being more or less seriously affected by the pandemic and/or more or less strongly affected by containment measures.
Furthermore, some sample areas (metropolitan regions, areas connected to different regional typologies, etc.; see Table 3 in Appendix) where LAU-level coronavirus-related data are available will also be analysed to help refine our findings. These sample areas will be presented separately as short small studies to help understand the localisation of the phenomena presented in the activities above (Task 1—spatial diffusion and disparities of mortality, and Task 2—social consequences). Particular attention will be paid to ensure that the selected areas are sufficiently diverse in terms of regional typologies and macro-regionally, so that they are representative of as many regions of Europe as possible.
2.1 Measures of choice for assessing COVID-19 An important issue is the choice of the explained variable, that is, the variable that best captures the geography of COVID-19. Several variables can be mobilised (hospitalisations, COVID-19 cases, fatalities due to COVID-19, excess mortality). The two reasons for choosing the variable that best estimates the incidence of the COVID-19 pandemic in Europe are reliability and comparability.
First, there is currently no scientific consensus on the choice of measure. All the variables have advantages and weaknesses that must be considered to analyse the results with full knowledge of the facts. The number of reported cases is not included in the European-level data collection. Indeed, the collection of these data has been widely criticised, and the number of reported cases depends largely on the testing policy in each country. This policy varies greatly between countries and over time.
Second, the number of hospitalisations by itself does not indicate whether they are specific hospitalisations for COVID-19 or for another health problem. A more refined variable is to take into account hospitalisations in intensive care. However, the problem is that these variables are not readily available for all countries at a local/regional level. We therefore decided to discard this variable as well. However, these LAU-level data (number of reported cases, hospitalisation, ICU) are only used for some sample areas, as mentioned above.
Another possibility is to take into account the reporting of the number of COVID-19-related deaths. An often made criticism regarding this variable is that some deaths may have been counted as COVID-19 related, whereas the patients died of another disease. Another problem is the inclusion of COVID-19-related deaths in nursing homes and at home. The inclusion of these deaths in the statistics varies by country. Furthermore, the testing capacity and availability of the testing points/healthcare institutions are key determinants of how many deaths are found in an area. Due to the characteristics of COVID-19 (since COVID-19 patients often present with symptoms typical of other diseases, testing is often the only way to confirm infection), many cases may be hidden. Despite these criticisms, we chose to retain this variable because, first, these data can be considered as one of the main officially recognised indicators of the pandemic (available from all countries, mostly at a regional/local level). Second, the data can be used to capture spatial inequalities, taking into account the issues mentioned above. Thirdly, they have been used in several previous studies (Gatto et al., 2020; Hradsky and Komarek 2021; James et al., 2021). As mentioned, these data are available from the various statistical institutes in Europe at the regional or even sub-regional level. In the previous ESPON project, this data collection was carried out systematically. We are therefore proceeding in the same way and will collect data on the number of COVID-19-related deaths from the various national statistical institutes.
INCEPTION REPORT // Geography of Covid-19
ESPON // espon.eu 11
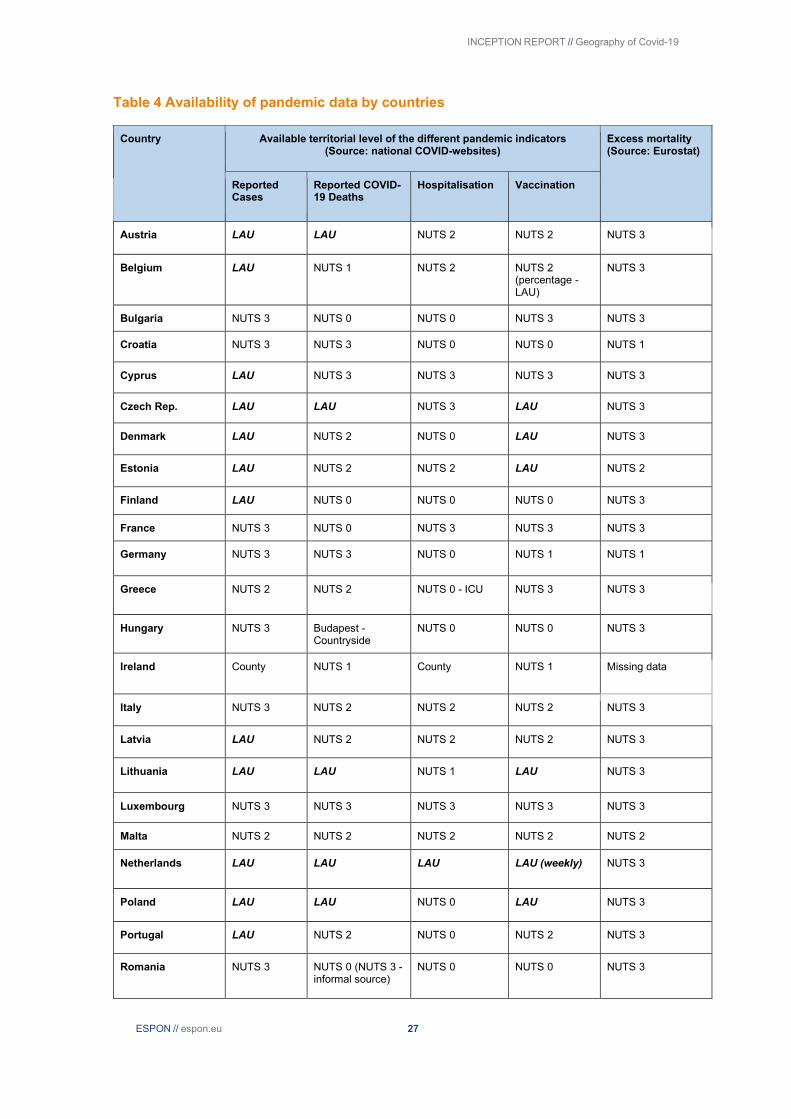
Finally, the spatial detail of published data on reported COVID-19 deaths varies from country to country, and it has been changing many times over the last year, while the published data on excess mortality are more timely and spatially consistent (see Table 4 in the Appendix). Most of the data are available in Eurostat at the NUTS 3 level, if not at the NUTS 2 level, except those for the United Kingdom. The excess mortality rate is an indicator that is commonly used in the scientific literature. The collection of data related to deaths is simple (due to a regular follow-up by EuroMOMO4) and European countries are used to it. A recent study by Felix-Cardoso et al. (2020) showed that the use of this indicator is preferable to COVID-19-related mortality because the latter often tends to underestimate the true incidence of COVID-19. However, as with the other indicators, the excess mortality index is subject to criticism. For example, with containment, car use was very limited. As a result, traffic fatalities decreased, thus negatively influencing excess mortality. Conversely, it was observed that people refused to go to the hospital for treatment of their disease (other than COVID-19) for fear of contracting the virus. This may have positively influenced the mortality rate. Given the interest of this variable, we chose to retain it. Thus, using econometric models, it will be possible to compare whether the determinants influencing the two explanatory variables have similar influences. The collection of these data is carried out on EUROSTAT (which collects these data via the national statistical institutes). The estimation of excess deaths is based on the calculation of a standardised indicator (z-score), which allows comparison of excesses between different geographical levels. This indicator makes it possible to estimate excess mortality not only in relation to the average mortality of previous years (which would be a percentage) but also by accounting for the dispersion of the data around the average, i.e., the variations, sometimes strong, in weekly mortality. The z-score is calculated by the formula: (observed number - expected number)/ standard deviation of the expected number. The five categories of excess are defined as follows:
-No excess: standardised indicator of death (z-score) <2
-Moderate excess of death: standardised indicator of death (z-score) between 2 and 4.99
-High excess of death: standardised indicator of death (z-score) between 5 and 6.99
-Very high excess of death: standardised indicator of death (z-score) between 7 and 11.99
-Exceptional excess of deaths: standardised indicator of death (z-score) greater than 12
Consequently, in our study, we will collect data on fatalities due to COVID-19 and excess mortality (and calculate a z-score). Despite the challenges of their usage, we believe that these indicators complement each other and together provide an adequate picture of the spatiality of the COVID-19 pandemic in Europe. These variables–COVID-19-related mortality and excess mortality—will be used in absolute and relative measures (per 10,000 inhabitants). A database will be created to include data generated from the beginning of the pandemic until the end of November 2021.
As far as possible, data will be collected at the NUTS 3 level, or at least, at the NUTS 2 level. Furthermore, if data is available at the LAU level for some countries, we will collect the data and propose some sample areas to focus on at the local level. For the available territorial levels of the different pandemic indicators from each country and data sources, please see Table 4 in the Appendix.
This research project covers the countries of Europe: the EU27 and the EFTA countries; however, depending on data type and availability, some countries are only partially included (e.g., no excess mortality data for the United Kingdom; note that for this country, such data are available on the official website of the National Institute of Statistics).
2.2 Identifying the determinants of COVID-19 spread and spatial concentration With our geodatabase, it will be possible to test various potential explanatory variables to describe and understand the spread of COVID-19 patterns and the different waves. We will test the hypothesis that pre-existing spatial characteristics and inequalities have an impact on the spread of the virus and its spatial concentration. We have identified different variables that could be integrated in our spatial econometric models; we will discuss these choices during a steering committee to finalise the choice in November 2021.
In the first step of this activity, we will show the spatiotemporal pattern of COVID-19 diffusion over time in Europe with descriptive statistics. This sub-activity will compare different pandemic data, the separation of each wave of COVID-19 in Europe, and the spatial diffusion processes during each wave. It will especially focus on the spatial patterns of COVID-19 during the primary (initial) phases of each wave, and it will show
4 EuroMomo is a contraction of the term European mortality monitoring. It is a statistical network that compiles mortality statistics of 24 European countries or federal regions, including France.

INCEPTION REPORT // Geography of Covid-19
12 ESPON // espon.eu
the changing role of the different types of regions (metropolitan, urban-intermediate-rural, coastal, island, mountainous, sparsely populated, border [Eurostat, 2019]) during the pandemic.
The second activity will involve building a spatial econometric model for exploring the possible factors behind the heterogeneity of mortality indicators. We have identified several variables characterising the EU regions that may influence the magnitude of the pandemic (Table 1). To account for factors related to the level of economic development, the first variable we consider is GDP per capita. The growth of global connections has presented a challenge for spatial approaches in the initial stages of disease management, “when the cause of a disease is not yet clear but the plane has already taken off” (Zhou and Coleman 2016). Referring to the previous SARS outbreak, Van Wagner (2008) recounts how Toronto’s status as a global city proved to be a vulnerability in this regard. In our case, we consider GDP per capita as a marker of a region’s relative position in a network of global cities and its potential to be further ahead in the pandemic trajectory. However, we cannot rule out the possibility that less affluent regions have a higher proportion of manual workers who cannot telecommute and thus have more difficulty complying with containment obligations, therefore being more exposed to COVID-19 (Ribeiro et al., 2021; Clouston et al., 2021).
Population density is also relevant because it directly affects the patterns and rates of contact between individuals in a population. Available data suggest a positive relationship between COVID-19 transmission and population density in U.S. counties (Sy et al., 2021), Italian regions (Bourdin et al., 2021), or Indian districts (Bhadra et al., 2021).
We also consider the percentage of elderly people (over 65) in a region. First, elderly people are already at a higher risk of falling ill. Second, early COVID-19 data suggest that the mortality rate per case was higher in the elderly (e.g., the Novel Coronavirus Pneumonia Emergency Response Epidemiology Team 2020). However, it is unclear whether a relatively large population of elderly people necessarily translates into higher rates of transmission of infection. Indeed, the tool of choice for containing the spread of the disease has been social distancing. In this regard, studies in the transportation field indicate that older adults tend to travel less frequently, for shorter distances, and have higher rates of immobility than most people (Sikder and Pinjari 2012; Lecomte et al., 2018). In other words, many older adults are already in some form of social isolation. The social distancing associated with confinement during the pandemic may reinforce this condition, as suggested by the age-structured analysis of social contacts in Luxembourg (Latsuzbaia et al., 2020).
Furthermore, Kaufmann (2009) highlighted that poverty is an aggravating factor during a pandemic. This is also shown by several recent studies on COVID-19. Using the example of New York City, Cordes and Castro (2020) showed that households receiving public assistance or those whose rent was higher than 50% of their income were more likely to be infected by the virus. Therefore, we added a variable related to the level of exposure of the population to the risk of poverty.
The quality of the health care system may also explain differences across regions. Empirical studies have reported that well-structured health resources positively affect a government’s ability to respond to public health emergencies, such as large epidemics (Forster et al., 2018). Health infrastructure also has a significant impact on the government’s ability to rapidly detect, diagnose, and report new infections (Palagyi et al., 2019). The COVID-19 crisis revealed that the number of available beds is a critical issue in managing a health emergency (Holzer and Newbold, 2020). Using an English example, McCabe et al. (2020) showed that the lack of such resources has negative impacts on the ability of the medical profession to treat patients. Guzzi et al. (2020) reached similar conclusions at the regional level in Italy. Thus, the determinants of health care reflect government and regional health care expenditures, and we considered them here through the number of hospital beds over the total population. The data on the number of critical care hospital beds would have been more appropriate but unfortunately not available for all European regions.
Another important aspect identified in the literature concerns the level of education. This is traditionally used as a proxy for social capital (Putnam, 1998; Alesina and Ferrara, 2000). It is assumed that a more educated population will tend to comply more with rules. Indeed, educated people have the knowledge to take the necessary measures to avoid the spread of the virus. This is what Zhong et al. (2020) demonstrated using a Chinese example. Furthermore, during the COVID-19 pandemic, people with a higher level of education tend to have had the opportunity to work from home, which is not the case for workers who, for example, had to travel to their workplace, increasing the possible sources of contamination (Phannajit et al., 2021). Therefore, we included the share of higher education graduates in the total population in our study.
The quality of public institutions is also an aspect that influences lethality levels. Rodríguez-Pose and Burlina (2021) showed that the hardest hit regions were regions where the quality of institutions was declining. This is the case in countries such as Spain, Italy, and, to a lesser extent, France (Rodríguez-Pose and Ketterer, 2020). This decline in national and local institutions may have compromised the credibility of governments to respond to such a crisis. As a result, populations did not necessarily trust policy recommendations to combat the spread of the virus. For these reasons, we included the quality of governance index developed by Charron et al. (2014).
Lastly, as a new element, we also want to examine the impact of geographical characteristics on mortality. The impact of different geographical and environmental characteristics on COVID-19 has also been investigated by some researchers, who have shown that different environmental indicators can influence the
INCEPTION REPORT // Geography of Covid-19
ESPON // espon.eu 13
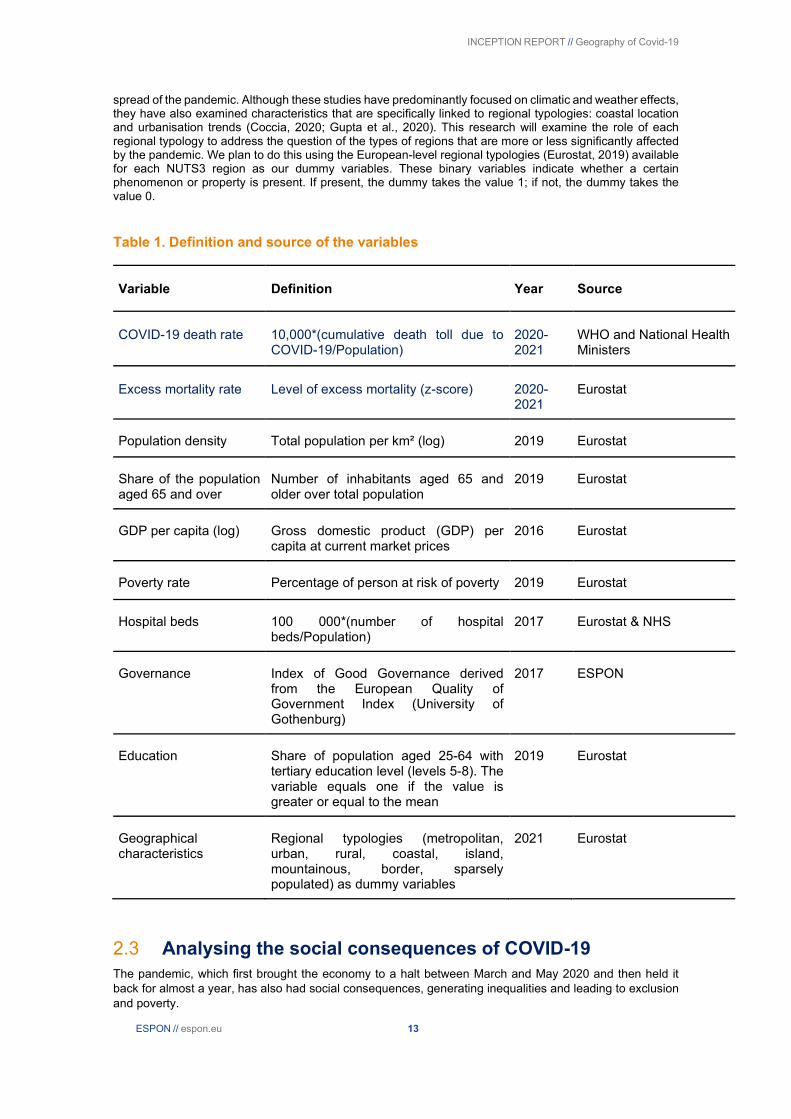
spread of the pandemic. Although these studies have predominantly focused on climatic and weather effects, they have also examined characteristics that are specifically linked to regional typologies: coastal location and urbanisation trends (Coccia, 2020; Gupta et al., 2020). This research will examine the role of each regional typology to address the question of the types of regions that are more or less significantly affected by the pandemic. We plan to do this using the European-level regional typologies (Eurostat, 2019) available for each NUTS3 region as our dummy variables. These binary variables indicate whether a certain phenomenon or property is present. If present, the dummy takes the value 1; if not, the dummy takes the value 0.
Table 1. Definition and source of the variables
Variable Definition Year Source
COVID-19 death rate 10,000*(cumulative death toll due to COVID-19/Population)
2020-2021
WHO and National Health Ministers
Excess mortality rate Level of excess mortality (z-score) 2020-2021
Eurostat
Population density Total population per km² (log) 2019 Eurostat
Share of the population aged 65 and over
Number of inhabitants aged 65 and older over total population
2019 Eurostat
GDP per capita (log) Gross domestic product (GDP) per capita at current market prices
2016 Eurostat
Poverty rate Percentage of person at risk of poverty 2019 Eurostat
Hospital beds 100 000*(number of hospital beds/Population)
2017 Eurostat & NHS
Governance Index of Good Governance derived from the European Quality of Government Index (University of Gothenburg)
2017 ESPON
Education Share of population aged 25-64 with tertiary education level (levels 5-8). The variable equals one if the value is greater or equal to the mean
2019 Eurostat
Geographical characteristics
Regional typologies (metropolitan, urban, rural, coastal, island, mountainous, border, sparsely populated) as dummy variables
2021 Eurostat
2.3 Analysing the social consequences of COVID-19 The pandemic, which first brought the economy to a halt between March and May 2020 and then held it back for almost a year, has also had social consequences, generating inequalities and leading to exclusion and poverty.

INCEPTION REPORT // Geography of Covid-19
14 ESPON // espon.eu
The crisis initially prevented people in precarious situations from getting out of them; it then pushed people who were close to being poor into poverty. In particular, these include employees and self-employed people with an already precarious status, part-time or fixed-term workers, and workers in sectors strongly affected by the crisis, such as tourism; lastly, it weighed on young people at a pivotal moment in their lives, with perhaps harmful long-term consequences. The effects of the crisis are far from being homogeneous for the entire population and in all territories.
National surveys show that the most disadvantaged are disproportionally impacted by illness and job loss. Jobs have diminished, particularly in temporary work (Chen and Wang, 2021). The most disadvantaged households also face greater uncertainty and difficulties with regard to their housing situation (e.g. paying rent, mortgage, or bills). COVID-19 has also led to increased social isolation, especially among single people, the elderly, and single-parent households. These groups have been particularly affected by the COVID-19 confinement measures (Ali et al., 2020; Clouston et al., 2020). Other factors aggravated the effects of the confinement measures, such as dwelling size (more overcrowding among the least advantaged), the unequal distribution of domestic tasks between men and women (including childcare), or domestic disputes and violence. Home schooling also generated social inequalities (Van Dor et al., 2020). Students with educational hardships spent on average less time on schoolwork and encountered various difficulties (connection, work organisation, autonomy, lack of materials, understanding of lessons).
As a result, we found several main topics that seem to be important for consideration, and they are likely to be captured by appropriate spatial data that can be collected for 2020 and (hopefully) 2021:
● Labour market and working conditions ● Living conditions and environment ● Health, mental health, and social care ● Social exclusion, poverty, and wealth ● Education and training ● Mobilities
Note: income and wealth, living conditions, and, especially, health topics are riskier to fill with regional data.
Taking into account the poor availability of databases revealed so far, two different types of datasets will be developed regarding social consequences:
Regional database
Content: Labour market and working conditions; living conditions and environment; social exclusion, poverty, and wealth; education and training; and mobilities
Data sources: Eurostat, national statistical offices (EU Labour Force Survey, EU SILC), Google Mobility database
Spatial frame: Across ESPON countries
Territorial level: At NUTS 2 and NUTS 3 levels (if possible)
Time frame: 2016–2020 (2021), to evaluate the evolution and the specific impact of COVID-19 crisis
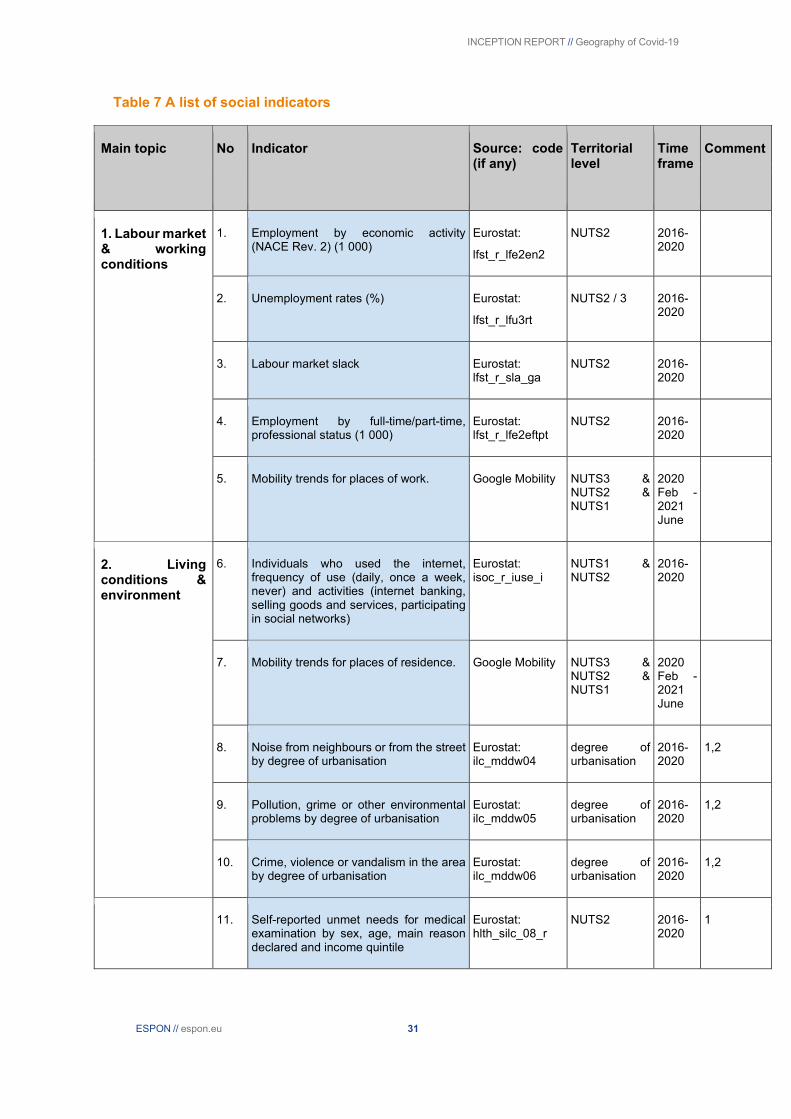
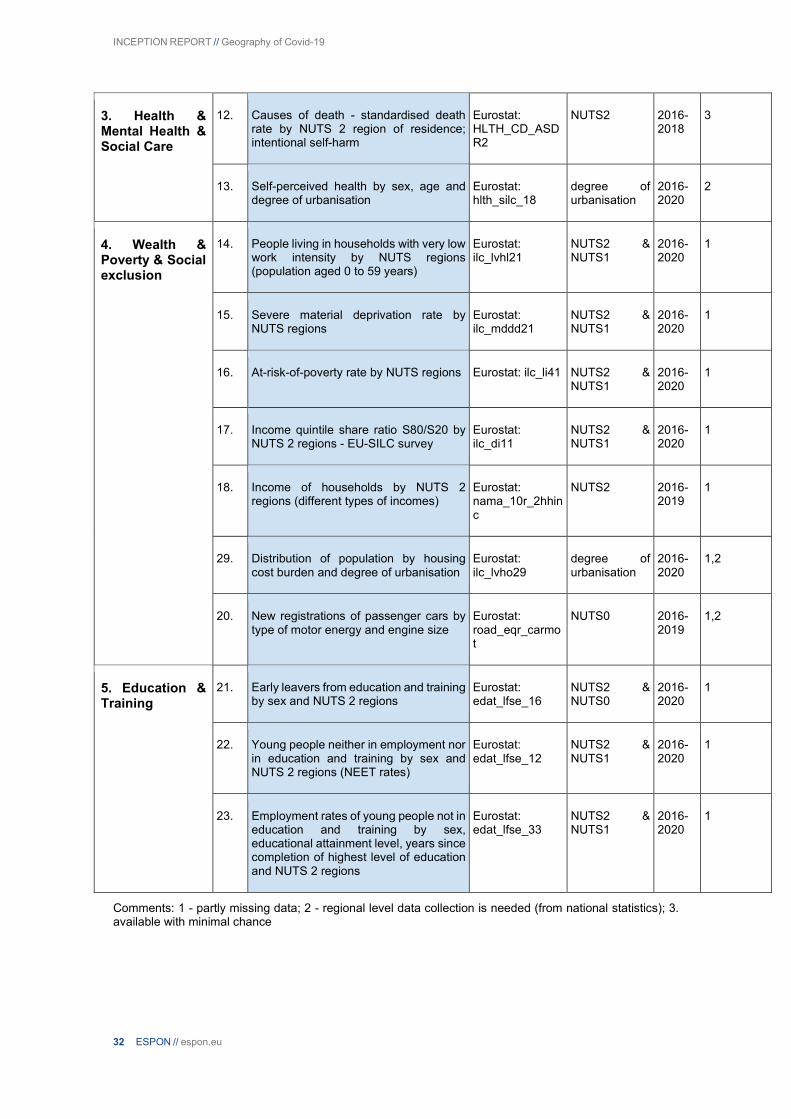
An initial proposal of indicators is available in Tables 6 and 7 in the Appendix. The A list refers to headline indicators and the B list to secondary indicators. The latter may be used in case of necessity.
Original database via a survey of elected officials, politicians, etc.
A survey will be conducted with the help of many European organisations, such as the Committee of the Regions, Eurocities, CEPLI, CPMR, and European Social Survey. The objective is to have a better understanding of the social impacts of COVID-19 in cities and regions and how elected officials have responded to these consequences.
Time frame: December 2021 to February 2022
Hybrid database of the types of regions and samples of metropolitan regions
Content: Pay and income; psychosocial risks; youth issues (e.g. youth unemployment, NEETs); working time; working conditions; teleworking; subjective well-being; trust; work-life balance; unemployment; living conditions; and quality of life.
Sources: Regional database (see in A point above), microdata of Eurofound Living and Working Survey, or investigators’ own survey. In case there are no representative data for metropolitan regions and for types of regions in Eurofound database

INCEPTION REPORT // Geography of Covid-19
ESPON // espon.eu 15
Spatial frame: Type of regions and cities (to be decided regarding the availability of the data and to cover as possible different parts of Europe) where we have been able to collect data on fatalities and hospitalisations
Time frame: Spring 2020, autumn 2020, autumn 2021
These data will be collected at the NUTS 3 level (and if not possible, at the NUTS 2 level). We are currently in discussion with national institutes of statistics about the possibility of collecting these data at the regional/local level for 2021. Using examples of metropolitan areas where we have been able to collect data on fatalities and hospitalisations, we will collect socio-economic data to construct a social deprivation index to measure the effects of COVID-19.
2.4 How can the data be processed?
2.4.1 Dynamic maps The first step will be to produce maps to provide a spatio-temporal overview of the geography of the COVID-19. The emergency context has highlighted fixed maps, generally weekly, of the situation by territories. However, dynamic mapping makes it possible to observe trends and their changes over time. We will use the data collected for the incidence of COVID-19 to produce dynamic maps. This will allow us to draw a geography of the COVID-19 and the changes in the trajectories of the pandemic on the European territory. With this technique, it will be easier to identify the different waves and their spatialities across Europe. This dynamic cartography will also be supplemented by the production of synthetic tables and graphs that will make it possible to understand the geography of COVID-19.
2.4.2 Spatial econometrics Several researchers have applied mapping and geostatistical methods to analyse disease spread patterns during epidemics, such as tuberculosis, SARS-CoV, MERS-CoV, H1N1 influenza, and dengue. Conducted on different scales and for different diseases, these studies highlight (i) a spatial concentration of the diseases and (ii) the effects of spatial dependence between regions, partly explaining the spatial heterogeneity of the spread of the pandemic. The spatial dependence effects refer directly to the issue of spatial autocorrelation (Le Gallo, 2014), that is, the coincidence of similarity of values with similarity of location (Anselin, 2001).
From a methodological point of view, to consider the spatial concentration and potential spatial spillover effects, we will use spatial econometrics techniques (Box 1). The spatial polarisation of COVID-19 incidence can result from a contagion effect, spreading the disease from one territory to another. In the presence of this type of spatial grouping of data, the classical methods of analysis are accompanied by a risk of bias. Indeed, if the phenomenon observed in a region is influenced by what is happening in neighbouring territories, the normality of the residuals is no longer respected.
To test the existence of a spatial data clustering phenomenon, we will apply exploratory spatial data analysis (ESDA). First, we will use Moran’s index and local indicators of spatial association (LISA) to assess the level of concentration of the COVID-19 across time. This method has been applied in studying geographical patterns of various phenomena (income disparities, homicide rates, urban segregation, etc.). Particularly, LISA maps identify clusters or collections of geographical units similar to the pandemic indicator used in statistical terms. They can be used to identify hot spots or cold spots across space. Hot spots are of particular interest in epidemiological analysis, such as the spread of COVID-19, as they allow the identification of ‘hot’ groups of areas significantly affected by the virus. A hot spot is a group of regions with, for instance, a relatively high indicator, which are also surrounded by areas of high indicators.
Second, we will use spatial econometric models to highlight the importance of accounting for spatial interdependencies among the observations. These approaches typically use spatial weight matrices intending to augment standard linear model specifications (OLS) by allowing for spatial spillovers among the observations. The form of the model depends on whether the spatial interdependencies are thought to derive from omitted variables, motivating a spatially lagged error term (SEM), or from the dependent variable, motivating a spatially lagged term for the dependent variable (SAR). A mixed model (SAC) assumes both processes. Using spatial models is all the more important, as several researchers in the field of health geography have recently called for the spatial dimension of neighbourhood effects to be taken into account (Baltagi et al., 2018). This recommendation mainly comes from public health policies that call for the consideration of the specific problems of deprived neighbourhoods. However, the effective implementation of policies targeted at disadvantaged areas requires a better knowledge of the mechanisms that support the

INCEPTION REPORT // Geography of Covid-19
16 ESPON // espon.eu
conclusion that ‘place’ matters independently of the ‘individual’. Thus, it is crucial to identify the plausible causal pathways by which neighbourhood social and material environments may affect health. Following Flowerdew et al. (2008), we explore the idea that people’s health in one geographical area may be influenced by the composition of that area’s population and the area’s geographical context. Hence, we will explore different kinds of neighbourhoods by using different spatial weight matrices based either on contiguity or distance on the one hand and by considering various spatial units on the other hand. Combining different characteristics will enable us to circumvent the so-called modifiable areal unit problem (MAUP), which, according to analytical conclusions, may differ substantially based on how the data are aggregated.
Third, another problem encountered in spatial econometrics is that of spatial heterogeneity. That is, the relationship between the dependent and independent variables may be spatially unstable. For example, the density variable may be an explanatory and significant factor in some European regions but not in others. To account for spatial heterogeneity, we will also use geographically weighted regression (GWR). In contrast to classical linear regression and spatial autoregressive models that produce an equation for the entire data table, GWR produces an equation for each spatial entity. It is based on the idea that explanatory variables can be the same and yet not have the same effect at all points. The model’s parameters are thus variable (Bourdin, 2019).

INCEPTION REPORT // Geography of Covid-19
ESPON // espon.eu 17
Box 1 Spatial econometrics models
2.4.3 Building an ecological index to estimate social consequences and propose a regional typology Traditional indicators such as the unemployment rate or the poverty rate are relevant; however, it is also possible to develop so-called ‘ecological’ indices that measure social inequalities. Obtaining an adequate measure of the socio-economic level is a major and recurrent issue in health research. Motivated by the lack of routinely measured individual data in the general population to inform the social situation, experts in population health research have turned to the use of aggregate or ecological measures. In the absence of measuring the individual’s socio-economic level, the social dimensions of his or her place of residence are often used. The social situation is multidimensional by definition. To date, several ecological indicators have been developed in line with this idea in the international literature (Pampalon et al., 2010). These indices

INCEPTION REPORT // Geography of Covid-19
18 ESPON // espon.eu
refer to Townsend’s (1988) concept of ‘social disadvantage’ or deprivation, which generalises the idea that poverty has multiple aspects: income, employment, level of education, housing, etc. (Pampalon et al., 2010).
The capacity of territories to respond to the COVID-19 crisis varies between and within countries. This refers in part to their territorial characteristics. Therefore, it is necessary to create a typology that reflects the geography of COVID-19 and its consequences. Exploratory data analysis in the form of factor analysis combined with classification, typology, or taxonomy is commonly used to describe disparities or fractures between or within regions. These methods allow the grouping of individuals (here: spatial units) relative to each other, according to their similarities (within a class or group) and dissimilarities (between classes or groups) and based on their characteristics defined by a set of variables. The dimensions explored in this project are diverse and include, among others, socio-economic and demographic dynamics, quality of life, and socio-sanitary situations.
INCEPTION REPORT // Geography of Covid-19
ESPON // espon.eu 19
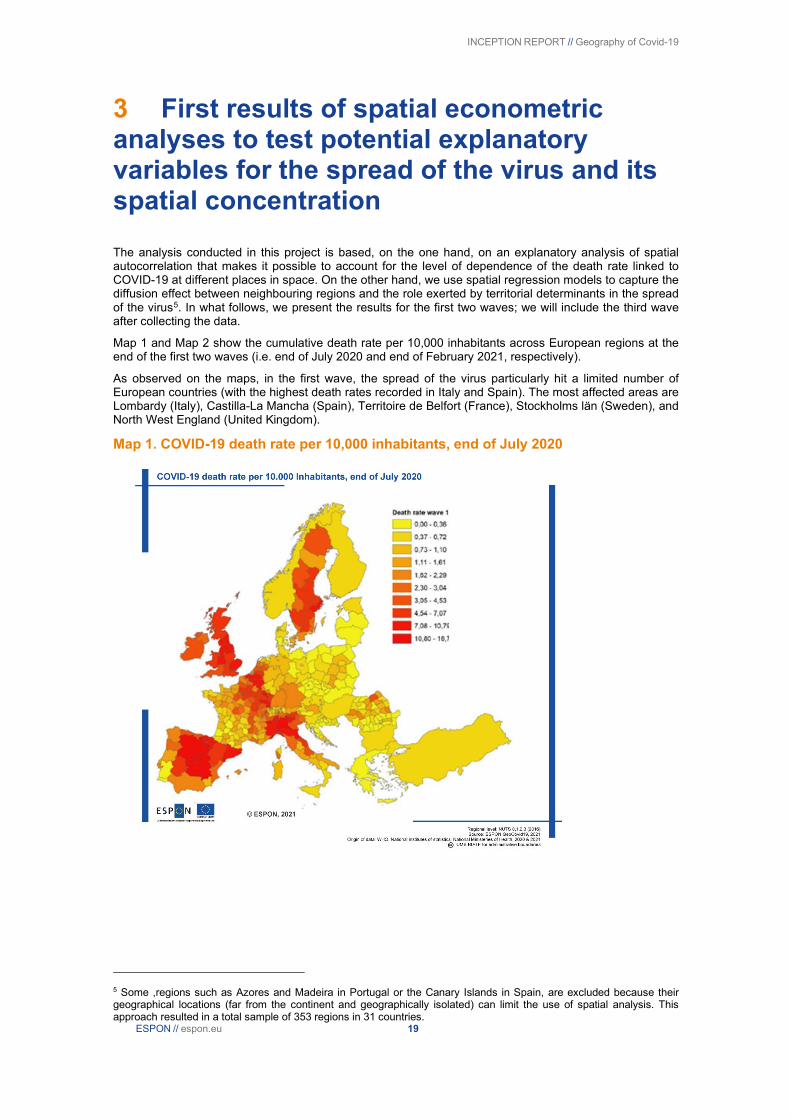
3 First results of spatial econometric analyses to test potential explanatory variables for the spread of the virus and its spatial concentration The analysis conducted in this project is based, on the one hand, on an explanatory analysis of spatial autocorrelation that makes it possible to account for the level of dependence of the death rate linked to COVID-19 at different places in space. On the other hand, we use spatial regression models to capture the diffusion effect between neighbouring regions and the role exerted by territorial determinants in the spread of the virus5. In what follows, we present the results for the first two waves; we will include the third wave after collecting the data.
Map 1 and Map 2 show the cumulative death rate per 10,000 inhabitants across European regions at the end of the first two waves (i.e. end of July 2020 and end of February 2021, respectively).
As observed on the maps, in the first wave, the spread of the virus particularly hit a limited number of European countries (with the highest death rates recorded in Italy and Spain). The most affected areas are Lombardy (Italy), Castilla-La Mancha (Spain), Territoire de Belfort (France), Stockholms län (Sweden), and North West England (United Kingdom).
Map 1. COVID-19 death rate per 10,000 inhabitants, end of July 2020
5 Some ,regions such as Azores and Madeira in Portugal or the Canary Islands in Spain, are excluded because their geographical locations (far from the continent and geographically isolated) can limit the use of spatial analysis. This approach resulted in a total sample of 353 regions in 31 countries.
INCEPTION REPORT // Geography of Covid-19
20 ESPON // espon.eu
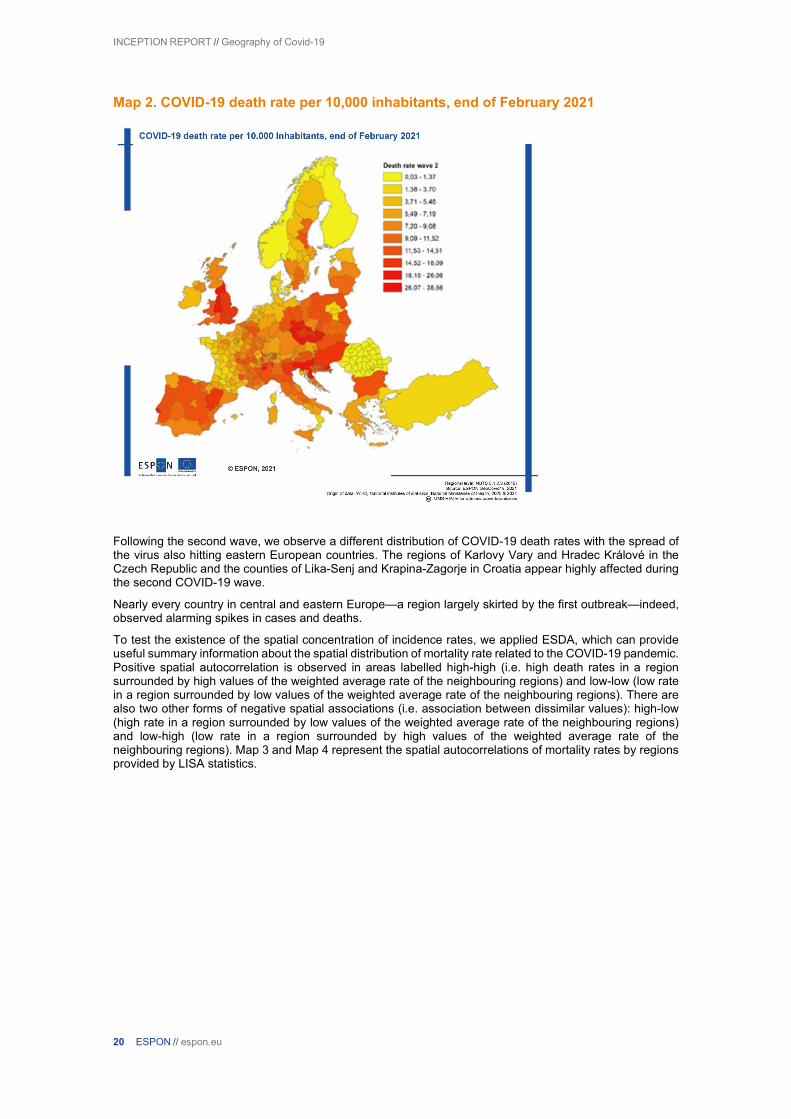
Map 2. COVID-19 death rate per 10,000 inhabitants, end of February 2021
Following the second wave, we observe a different distribution of COVID-19 death rates with the spread of the virus also hitting eastern European countries. The regions of Karlovy Vary and Hradec Králové in the Czech Republic and the counties of Lika-Senj and Krapina-Zagorje in Croatia appear highly affected during the second COVID-19 wave.
Nearly every country in central and eastern Europe—a region largely skirted by the first outbreak—indeed, observed alarming spikes in cases and deaths.
To test the existence of the spatial concentration of incidence rates, we applied ESDA, which can provide useful summary information about the spatial distribution of mortality rate related to the COVID-19 pandemic. Positive spatial autocorrelation is observed in areas labelled high-high (i.e. high death rates in a region surrounded by high values of the weighted average rate of the neighbouring regions) and low-low (low rate in a region surrounded by low values of the weighted average rate of the neighbouring regions). There are also two other forms of negative spatial associations (i.e. association between dissimilar values): high-low (high rate in a region surrounded by low values of the weighted average rate of the neighbouring regions) and low-high (low rate in a region surrounded by high values of the weighted average rate of the neighbouring regions). Map 3 and Map 4 represent the spatial autocorrelations of mortality rates by regions provided by LISA statistics.

INCEPTION REPORT // Geography of Covid-19
ESPON // espon.eu 21
Map 3. Cluster map of COVID-19 death rate (end of July 2020)6
Map 4 Cluster map of COVID-19 death rate (end of February 2021)
The kinetics of the COVID-19 across European regions and regional disparities
6 Note that some regions are identified as “neighbourless” and thus not included in the analysis; however, in reality, they have strong connections to other regions (ferry connections, etc.). Due to the construction of the spatial weight matrix, it is not possible to include these types of connections in our study.
INCEPTION REPORT // Geography of Covid-19
22 ESPON // espon.eu
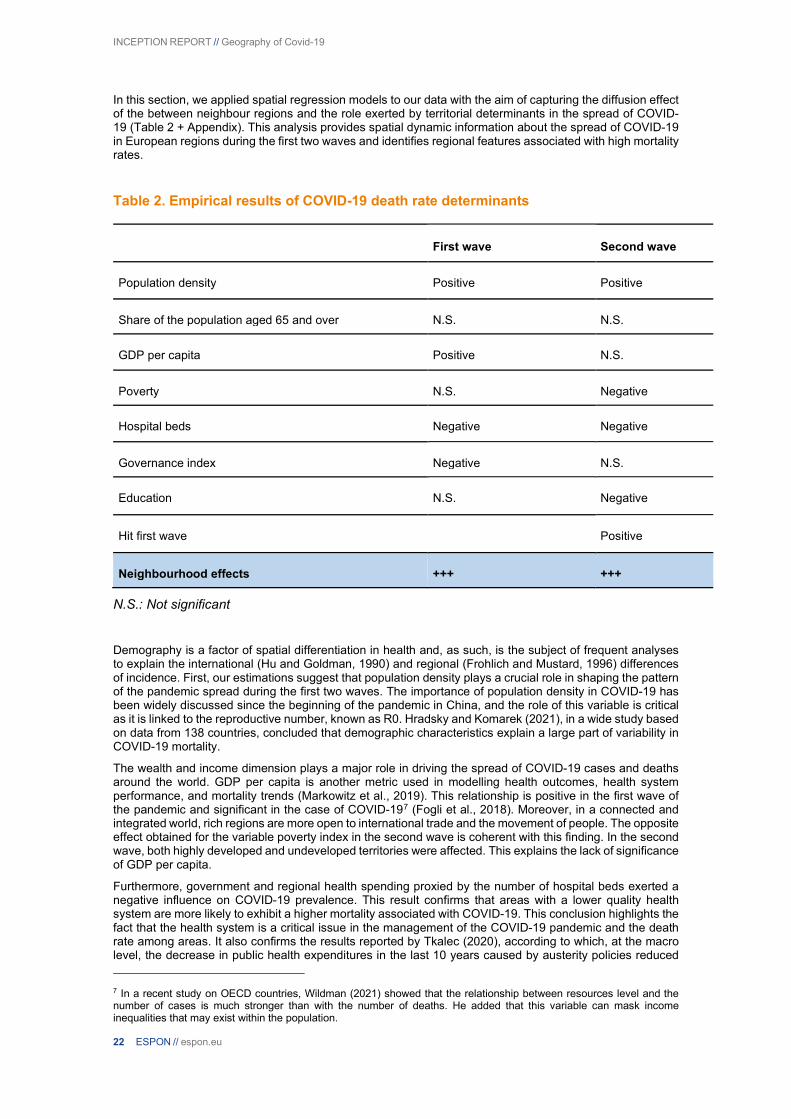
In this section, we applied spatial regression models to our data with the aim of capturing the diffusion effect of the between neighbour regions and the role exerted by territorial determinants in the spread of COVID-19 (Table 2 + Appendix). This analysis provides spatial dynamic information about the spread of COVID-19 in European regions during the first two waves and identifies regional features associated with high mortality rates.
Table 2. Empirical results of COVID-19 death rate determinants
First wave Second wave
Population density Positive Positive
Share of the population aged 65 and over N.S. N.S.
GDP per capita Positive N.S.
Poverty N.S. Negative
Hospital beds Negative Negative
Governance index Negative N.S.
Education N.S. Negative
Hit first wave Positive
Neighbourhood effects +++ +++
N.S.: Not significant
Demography is a factor of spatial differentiation in health and, as such, is the subject of frequent analyses to explain the international (Hu and Goldman, 1990) and regional (Frohlich and Mustard, 1996) differences of incidence. First, our estimations suggest that population density plays a crucial role in shaping the pattern of the pandemic spread during the first two waves. The importance of population density in COVID-19 has been widely discussed since the beginning of the pandemic in China, and the role of this variable is critical as it is linked to the reproductive number, known as R0. Hradsky and Komarek (2021), in a wide study based on data from 138 countries, concluded that demographic characteristics explain a large part of variability in COVID-19 mortality.
The wealth and income dimension plays a major role in driving the spread of COVID-19 cases and deaths around the world. GDP per capita is another metric used in modelling health outcomes, health system performance, and mortality trends (Markowitz et al., 2019). This relationship is positive in the first wave of the pandemic and significant in the case of COVID-197 (Fogli et al., 2018). Moreover, in a connected and integrated world, rich regions are more open to international trade and the movement of people. The opposite effect obtained for the variable poverty index in the second wave is coherent with this finding. In the second wave, both highly developed and undeveloped territories were affected. This explains the lack of significance of GDP per capita.
Furthermore, government and regional health spending proxied by the number of hospital beds exerted a negative influence on COVID-19 prevalence. This result confirms that areas with a lower quality health system are more likely to exhibit a higher mortality associated with COVID-19. This conclusion highlights the fact that the health system is a critical issue in the management of the COVID-19 pandemic and the death rate among areas. It also confirms the results reported by Tkalec (2020), according to which, at the macro level, the decrease in public health expenditures in the last 10 years caused by austerity policies reduced
7 In a recent study on OECD countries, Wildman (2021) showed that the relationship between resources level and the number of cases is much stronger than with the number of deaths. He added that this variable can mask income inequalities that may exist within the population.
INCEPTION REPORT // Geography of Covid-19
ESPON // espon.eu 23
the adaptation capacity of the health system and intensified the tragic consequences of the COVID-19 pandemic in some countries. In a short report comparing COVID-19 pandemic responses in Brazil, Russia, India, China, and South Africa (BRIC countries), Zhu et al. (2021) highlighted the role of health system resources in effectively curbing health emergencies.
The global spread of COVID-19 has been accompanied, especially during the first wave, by a trend of disinformation undermining policy responses and amplifying distrust and concerns among citizens. Thus, building trust in public institutions is a key issue. In this context, we consider governance quality at the subnational level as a fundamental indicator that could profoundly influence the prevalence of the pandemic. Our findings confirm the hypothesis that a higher quality of governance at the subnational level significantly reduces the death rate registered in European regions.
In a survey of social and behavioural results to support the COVID-19 pandemic response, Van Bavel et al. (2020) highlighted how most measures needed to contain a are, by their very nature, difficult to enforce directly: this, in turn, makes trust in public authorities and among citizens all the more relevant. Thus, the negative impact of the COVID-19 pandemic can be mitigated by trust in institutions and among citizens, the basic component of social capital defined by Putnam (1995) as “features of social organizations, such as networks, norms and social trust that facilitate coordination and cooperation for mutual benefit.” Amdaoud et al. (2021) tested this hypothesis on French départements, an administrative level equivalent to NUTS 3 areas. Their results confirm that social trust factors influence the rate of mortality and that citizens adapt their confidence according to the intensity of the crisis.
Based on different studies (Putnam, 1995; Alesina and Ferrara, 2000), education is a relevant determinant of social capital. Through civil education from schooling, students learn the basic norms and responsibilities in society and practice them in a peer culture that shapes values such as reciprocity, respect, and trust. For this reason, we introduce the variable education (part of population aged 25–64 with tertiary education level) as a proxy of social capital. Our findings show that during the second wave, death rates due to COVID-19 were negatively correlated with social trust. On the contrary, in places where a vast majority of citizens exhibited a high level of confidence towards institutions, rules were expected to be more respected by others and were indeed more respected by everyone, inducing a lower mortality rate. The spread of the virus may thus be more difficult in places where interpersonal relations and social trust are higher than in low social trust regions, as mentioned by Habibov et al. (2017). Possible mechanisms for building social trust for the adoption of healthy behaviours during the outbreak of a contagious disease could be via community norms that promote a healthy lifestyle, the diffusion of health information, the promotion of access to local health services, and cohesive social networks that provide effective support. This idea is corroborated in a recent work by Barrios et al. (2021), which showed that a region’s civic capital is at the origin of its collective capital, enabling human societies to improve policy actions from the government. Our findings confirmed those of Putnam et al. (1993), who concluded that information and political decisions are not enough to ensure the success of sanitary policies. Instead, they recommended mobilising ‘social capital’ in the community as an informal means of action against the pandemic. This background helps to adapt measures to the context and to increase their effectiveness. Further, the differences in the level of education of the workforce influence the incidence rate of the disease. People with a higher education diploma are likely to have the possibility of remote working due to the specificity of their work (Özgüzel et al., 20208). These results lead us to consider that information and education should be seriously considered in non-medical policies to combat the COVID-19 pandemic.
8 Potential for remote working across different places: https://voxeu.org/article/potential-remote-working-across-different-places

INCEPTION REPORT // Geography of Covid-19
24 ESPON // espon.eu
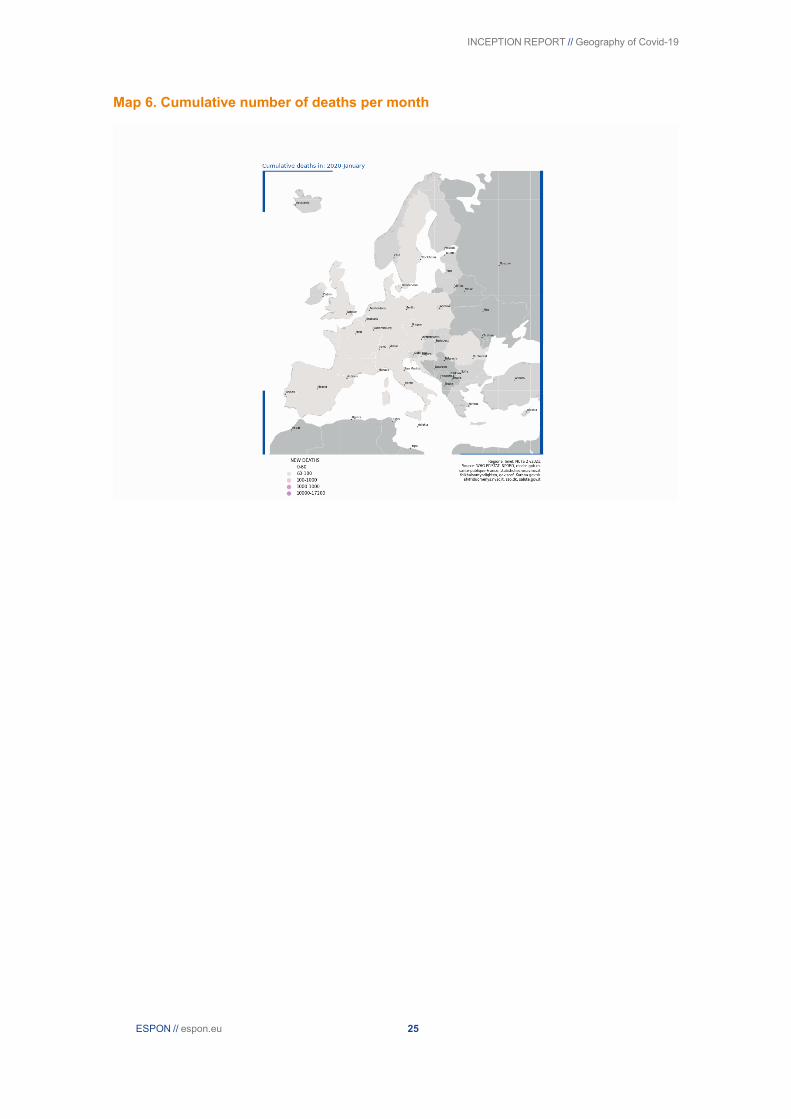
4 First updated maps of the geographical pattern of COVID-19 Below are two maps depicting (i) the cumulative number of deaths and (ii) new weekly deaths between January 2020 and April 2021. The next step is to collect data generated between April 2021 and December 2021.
Map 5. Number of new deaths per month
INCEPTION REPORT // Geography of Covid-19
ESPON // espon.eu 25
Map 6. Cumulative number of deaths per month

INCEPTION REPORT // Geography of Covid-19
26 ESPON // espon.eu
Appendix
Table 3 Preliminary list of sample areas
Sample area Country Observed regional typology
Task (Topic) Macroregion
Netherlands (whole country)
Netherlands Urban-Rural (+Metropolitan)
Task 2 (Social consequences) / Task 1 (Mortality)
Western
West Midlands United Kingdom
Metropolitan Task 1 (Mortality) Western
Vienna Austria Metropolitan Task 2 (Social consequences) Western
Podkarpackie Voivodeship
Poland Urban-Rural (+Border)
Task 1 (Mortality) Eastern
Slovenia (whole country)
Slovenia Mountainous (+Coastal, Urban-Rural)
Task 2 (Social consequences) / Task 1 (Mortality)
Eastern
Prague Czech Rep. Metropolitan Task 1 (Mortality) / Task 1 (Spatial diffusion)
Eastern
Norrland Sweden Sparsely populated Task 1 (Spatial Diffusion) Northern
Stockholm Sweden Metropolitan Task 2 (Social consequences) Northern
Cyprus (whole country)
Cyprus Island Task 1 (Spatial Diffusion) Southern
Portugal (continental) Portugal Coastal (+Border) Task 1 (Spatial Diffusion) Southern
INCEPTION REPORT // Geography of Covid-19
ESPON // espon.eu 27
Table 4 Availability of pandemic data by countries
Country Available territorial level of the different pandemic indicators (Source: national COVID-websites)
Excess mortality (Source: Eurostat)
Reported Cases
Reported COVID-19 Deaths
Hospitalisation Vaccination
Austria LAU LAU NUTS 2 NUTS 2 NUTS 3
Belgium LAU NUTS 1 NUTS 2 NUTS 2 (percentage - LAU)
NUTS 3
Bulgaria NUTS 3 NUTS 0 NUTS 0 NUTS 3 NUTS 3
Croatia NUTS 3 NUTS 3 NUTS 0 NUTS 0 NUTS 1
Cyprus LAU NUTS 3 NUTS 3 NUTS 3 NUTS 3
Czech Rep. LAU LAU NUTS 3 LAU NUTS 3
Denmark LAU NUTS 2 NUTS 0 LAU NUTS 3
Estonia LAU NUTS 2 NUTS 2 LAU NUTS 2
Finland LAU NUTS 0 NUTS 0 NUTS 0 NUTS 3
France NUTS 3 NUTS 0 NUTS 3 NUTS 3 NUTS 3
Germany NUTS 3 NUTS 3 NUTS 0 NUTS 1 NUTS 1
Greece NUTS 2 NUTS 2 NUTS 0 - ICU NUTS 3 NUTS 3
Hungary NUTS 3 Budapest - Countryside
NUTS 0 NUTS 0 NUTS 3
Ireland County NUTS 1 County NUTS 1 Missing data
Italy NUTS 3 NUTS 2 NUTS 2 NUTS 2 NUTS 3
Latvia LAU NUTS 2 NUTS 2 NUTS 2 NUTS 3
Lithuania LAU LAU NUTS 1 LAU NUTS 3
Luxembourg NUTS 3 NUTS 3 NUTS 3 NUTS 3 NUTS 3
Malta NUTS 2 NUTS 2 NUTS 2 NUTS 2 NUTS 2
Netherlands LAU LAU LAU LAU (weekly) NUTS 3
Poland LAU LAU NUTS 0 LAU NUTS 3
Portugal LAU NUTS 2 NUTS 0 NUTS 2 NUTS 3
Romania NUTS 3 NUTS 0 (NUTS 3 - informal source)
NUTS 0 NUTS 0 NUTS 3

INCEPTION REPORT // Geography of Covid-19
28 ESPON // espon.eu
Slovakia LAU NUTS 0 LAU NUTS 3 NUTS 3
Slovenia LAU NUTS 3 NUTS 0 LAU NUTS 1
Spain NUTS 3 NUTS 3 NUTS 2 NUTS 2 NUTS 3
Sweden LAU NUTS 3 NUTS 3 LAU NUTS 3
United Kingdom LAU LAU NHS regions LAU NUTS 3 (until the end of 2020)
Iceland NUTS 2 NUTS 2 NUTS 2 NUTS 2 NUTS 3
Liechtenstein LAU NUTS 3 NUTS 3 - ICU NUTS 3 NUTS 3
Norway LAU LAU NUTS 0 NUTS 1 NUTS 3
Switzerland NUTS 3 NUTS 3 NUTS 3 NUTS 3 NUTS 3

INCEPTION REPORT // Geography of Covid-19
ESPON // espon.eu 29
Figure 3 Covid-19 deaths by country
Covid-19 deaths by country
Source: WHO and National Health Ministers data, 2021

INCEPTION REPORT // Geography of Covid-19
30 ESPON // espon.eu
Table 5 Descriptive statistics
Variable Nb regions Mean Std.Dev. Min Max
Covid death rate first wave 353 2,35 2,93 0,00 16,71
Covid death rate second wave 353 8,25 5,74 0,00 38,56
Population density 353 4,79 1,26 0,96 9,95
Share of the population aged 65 and over 353 20,75 3,44 9,08 30,32
GDP per capita (log) 353 10,01 0,76 4,92 12,05
Poverty 353 21,01 7,78 8,50 53,60
Hospital beds 353 522,64 194,02 101,97 1286,28
Governance 353 0,64 0,48 0 1
Education 353 0,32 0,10 0,12 0,60
Hit first wave 353 0,31 0,46 0 1
Table 6 Correlation matrix
INCEPTION REPORT // Geography of Covid-19
ESPON // espon.eu 31
Table 7 A list of social indicators
Main topic No Indicator Source: code (if any)
Territorial level
Time frame
Comment
1. Labour market & working conditions
1. Employment by economic activity (NACE Rev. 2) (1 000)
Eurostat:
lfst_r_lfe2en2
NUTS2 2016-2020
2. Unemployment rates (%) Eurostat:
lfst_r_lfu3rt
NUTS2 / 3 2016-2020
3. Labour market slack Eurostat: lfst_r_sla_ga
NUTS2 2016-2020
4. Employment by full-time/part-time, professional status (1 000)
Eurostat: lfst_r_lfe2eftpt
NUTS2 2016-2020
5. Mobility trends for places of work. Google Mobility NUTS3 & NUTS2 & NUTS1
2020 Feb - 2021 June
2. Living conditions & environment
6. Individuals who used the internet, frequency of use (daily, once a week, never) and activities (internet banking, selling goods and services, participating in social networks)
Eurostat: isoc_r_iuse_i
NUTS1 & NUTS2
2016-2020
7. Mobility trends for places of residence. Google Mobility NUTS3 & NUTS2 & NUTS1
2020 Feb - 2021 June
8. Noise from neighbours or from the street by degree of urbanisation
Eurostat: ilc_mddw04
degree of urbanisation
2016-2020
1,2
9. Pollution, grime or other environmental problems by degree of urbanisation
Eurostat: ilc_mddw05
degree of urbanisation
2016-2020
1,2
10. Crime, violence or vandalism in the area by degree of urbanisation
Eurostat: ilc_mddw06
degree of urbanisation
2016-2020
1,2
11. Self-reported unmet needs for medical examination by sex, age, main reason declared and income quintile
Eurostat: hlth_silc_08_r
NUTS2 2016-2020
1
INCEPTION REPORT // Geography of Covid-19
32 ESPON // espon.eu
3. Health & Mental Health & Social Care
12. Causes of death - standardised death rate by NUTS 2 region of residence; intentional self-harm
Eurostat: HLTH_CD_ASDR2
NUTS2 2016-2018
3
13. Self-perceived health by sex, age and degree of urbanisation
Eurostat: hlth_silc_18
degree of urbanisation
2016-2020
2
4. Wealth & Poverty & Social exclusion
14. People living in households with very low work intensity by NUTS regions (population aged 0 to 59 years)
Eurostat: ilc_lvhl21
NUTS2 & NUTS1
2016-2020
1
15. Severe material deprivation rate by NUTS regions
Eurostat: ilc_mddd21
NUTS2 & NUTS1
2016-2020
1
16. At-risk-of-poverty rate by NUTS regions Eurostat: ilc_li41 NUTS2 & NUTS1
2016-2020
1
17. Income quintile share ratio S80/S20 by NUTS 2 regions - EU-SILC survey
Eurostat: ilc_di11
NUTS2 & NUTS1
2016-2020
1
18. Income of households by NUTS 2 regions (different types of incomes)
Eurostat: nama_10r_2hhinc
NUTS2 2016-2019
1
29. Distribution of population by housing cost burden and degree of urbanisation
Eurostat: ilc_lvho29
degree of urbanisation
2016-2020
1,2
20. New registrations of passenger cars by type of motor energy and engine size
Eurostat: road_eqr_carmot
NUTS0 2016-2019
1,2
5. Education & Training
21. Early leavers from education and training by sex and NUTS 2 regions
Eurostat: edat_lfse_16
NUTS2 & NUTS0
2016-2020
1
22. Young people neither in employment nor in education and training by sex and NUTS 2 regions (NEET rates)
Eurostat: edat_lfse_12
NUTS2 & NUTS1
2016-2020
1
23. Employment rates of young people not in education and training by sex, educational attainment level, years since completion of highest level of education and NUTS 2 regions
Eurostat: edat_lfse_33
NUTS2 & NUTS1
2016-2020
1
Comments: 1 - partly missing data; 2 - regional level data collection is needed (from national statistics); 3. available with minimal chance

INCEPTION REPORT // Geography of Covid-19
ESPON // espon.eu 33
Table 8 B list of social indicators
Main topic No Indicator Source: code (if any)
Territorial level
Time frame
Comment
1. Labour market & working conditions
24. Long-term unemployment (12 months and more) by sex, age, educational attainment level and NUTS 2 regions (%)
Eurostat: lfst_r_lfu2ltu
NUTS2 2016-2020
25. Average number of usual weekly hours of work in main job by sex, age and NUTS 2 regions (hours)
Eurostat: lfst_r_lfe2ehour
NUTS2 2016-2020
2. Living conditions & environment
26. Mobility trends for Grocery and Pharmacy: places like grocery markets, food warehouses, farmers markets, specialty food shops, drug stores, and pharmacies.
Google Mobility NUTS3 & NUTS2 & NUTS1
2020 Feb - 2021 June
27. Mobility trends for Transit stations: places like public transport hubs such as subway, bus, and train stations.
Google Mobility NUTS3 & NUTS2 & NUTS1
2020 Feb - 2021 June
28. Mobility trends for Retail and recreation: places like restaurants, cafes, shopping centers, theme parks, museums, libraries, and movie theaters.
Google Mobility NUTS3 & NUTS2 & NUTS1
2020 Feb - 2021 June
29. Households with broadband access Eurostat: isoc_r_broad_h
NUTS1 & NUTS2
2016-2020
30. Households with access to the internet at home
Eurostat: isoc_r_iacc_h
NUTS1 & NUTS2
2016-2020
31. Air quality statistics - PM10, NO2 EEA sample places
2016-2021
1
3. Wealth & Poverty & Social exclusion
32. Mean and median income by degree of urbanisation
Eurostat: ilc_di17 degree of urbanisation
2016-2020
1,2
33. Material and social deprivation rate by NUTS regions
Eurostat: ilc_mdsd08
NUTS2 & NUTS1
2016-2020
34. People at risk of poverty or social exclusion by NUTS regions
Eurostat: ilc_peps11 NUTS2 & NUTS1
2016-2020
1
Comments: 1 - partly missing data; 2 - regional level data collection is needed (from national statistics)

INCEPTION REPORT // Geography of Covid-19
34 ESPON // espon.eu
References
Alesina, A., Ferrara, E. 2000. “The Determinants of Trust." NBER Working Papers 7621, National Bureau of Economic Research, Inc
Amdaoud, M., Arcuri, G., & Levratto, N.2021. « Are regions equal in adversity? A spatial analysis of spread and dynamics of COVID-19 in Europe.” The European Journal of Health Economics, 22, 629–642 https://doi.org/10.1007/s10198-021-01280-6
Barrios, J.M., Benmelech, E., Hochberg, Y.V., Sapienza, P., & Zingales, L.2021. “Civic capital and social distancing during the Covid-19 pandemic.” Journal of Public Economics ,193, 104310 (2021). https://doi.org/10.1016/j.jpubeco.2020.104310
Bogoch, I. I.–Watts, A.–Thomas-Bachli, A.–Huber, C.–Kraemer, M. U.–Khan, K. (2020) Potential for global spread of a novel coronavirus from China. Journal of travel medicine, 27, 2. https://doi.org/10.1093/jtm/taaa011
Bourdin,S., Ludovic, J., Nadou, F., & Noiret, G. 2021. « Does lockdown work? A spatial analysis of the spread and concentration of Covid-19 in Italy.” Regional Studies, 55:7, 1182 1193, DOI: 10.1080/00343404.2021.1887471
Brockmann, D. & Helbing D. (2020) Spreading Routes on a Global Scale. Research on Complex Sytems, Berlin. https://rocs.hu-berlin.de/project/viz-event-horizon/ Downloaded: 17. 08. 2021.
Charron, N., Dijkstra, L., & Lapuente, V. (2014). Regional governance matters: Quality of government within European Union member states. Regional studies, 48(1), 68-90.
Childs, L. M., Abuelezam, N. N., Dye, C., Gupta, S., Murray, M. B., Williams, B. G. & Buckee C. O. (2015): Modelling challenges in context: Lessons from malaria, HIV, and tuberculosis. Epidemics, 10, pp. 102-107. Doi: 10.1016/j.epidem.2015.02.002
Coccia, M. (2020): Factors determining the diffusion of COVID-19 and suggested strategy to prevent future accelerated viral infectivity similar to COVID. Science of the Total Environment, 50 (729), pp. 1-20. Doi: https://doi.org/10.1016/j.scitotenv.2020.138474
ESPON (2020) «Geography of COVID-19 outbreak and first policy answers in European regions and cities» , https://www.espon.eu/geocov
Eurostat (2019): Methodological manual on territorial typologies – 2018 edition. Publications Office of European Union, Luxembourg
Felix-Cardoso, J., Vasconcelos, H., Rodrigues, P., & Cruz-Correia, R. (2020). Excess mortality during COVID-19 in five European countries and a critique of mortality analysis data. MedRxiv.
Fogli, A., Veldkamp, L.2018. Germs, Social Networks, and Growth, Staff Report 572, Federal Reserve Bank of Minneapolis.
Frohlich, N., & Mustard, C. 1996. “A regional comparison of socioeconomic and health indices in a Canadian province.” Social Science & Medicine, 42 (9),1273-1281
Gatto, M., Bertuzzo, E., Mari, L., Miccoli, S., Carraro, L., Casagrandi, R., & Rinaldo, A. (2020). Spread and dynamics of the COVID-19 epidemic in Italy: Effects of emergency containment measures. Proceedings of the National Academy of Sciences of the USA, 117, 10484–10491.
Gupta, A., Banerjee, S., Das, S. (2020) Significance of geographical factors to the COVID-19 outbreak in India. Model Earth Systems and Environment. 17 Jun. 2020. pp. 1-9. Doi: 10.1007/s40808-020-00838-2
Habibov, N., Cheung, A., & Auchynnikava, A. 2017. « Does Social Trust Increase Willingness to Pay Taxes to Improve Public Healthcare? Cross‐sectional Cross‐Country Instrumental Variable Analysis.” Social Science & Medicine,189, 25–34.
Haggett, P. (2001) Geography: A Global Synthesis. Harlow, England; New York: Pearson Hall
Hradsky, O., Komarek, A. 2021. “Demographic and public health characteristics explain large part of variability in COVID-19 mortality across countries.” European Journal of Public Health, 31( 1), 12–16. https://doi.org/10.1093/eurpub/ckaa226
Hu, Y., & Goldman, N. 1990. “Mortality Differentials by Marital Status: An International Comparison.” Demography. 27, 233–250.
James, N, Menzies, M, & Radchenko, P.2021. « COVID-19 second wave mortality in Europe and the United States.” Chaos, 31(3):031105. doi: 10.1063/5.0041569. PMID: 33810707.

INCEPTION REPORT // Geography of Covid-19
ESPON // espon.eu 35
Kincses Á. & Tóth G. (2020) How coronavirus spread in Europe over time: national probabilities based on migration networks. Regional Statistics, 10, 2, pp. 228-231. Doi: 10.15196/RS100210
Markowitz, S., Nesson, E., & Robinson, J. 2019. “The effects of employment on influenza rates.” Economics and Human Biology. 34, 286-295.
Medeiros, E.; Guillermo-Ramírez, M.; Ocskay G.; & Peyrony, J. (2021) Covidfencing effects on cross-border deterritorialism: the case of Europe. European Planning Studies, 29(5): 962-982
Morril, R., Gale, G. L. & Thrall, G. I. (1988) Spatial diffusion. Reprint. Edited by Grant Ian Thrall. WVU Research Repository, 2020.
Putnam, R.D., Leonardi, R., & Nanetti, R.Y, 1993. Making Democracy Work: Civic Traditions in Modern Italy. Princeton University Press, New Jersey
Putnam, R.D. 1995. “Bowling alone: America's declining social capital.” Journal of Democracy. 6, 65–78
Tkalec, I. 2020. Dynamics in Public Health Infrastructure: Hospital Beds and COVID-19. Policy Puzzle No. 2, Policy Briefs, 2020/28, Global Governance Programme, GlobalStat. 2020. Available at: https://hdl.handle.net/1814/67592 (20 July 2021, date last accessed).
Uzzoli A. (2020): Health inequality and its regional distribution in Hungary with special focus on access to health care. In: Nemethova, V. (eds.): 10th Central European Winter Seminar of Regional Science. Proceedings. Bratislava, Szlovákia: Ekonóm, 1-11.
Van Bavel, J.J., Baicker, K., Boggio, P.S., Capraro, V., Cichocka, A., Cikara, M., et al.2020. “Using social and behavioural science to support COVID-19 pandemic response.” Nature human behavior 4, 460–471
Wildman, J. 2021. “COVID-19 and income inequality in OECD countries.” The European Journal of Health Economics 22, 455–462 . https://doi.org/10.1007/s10198-021-01266-4
Zhu, J., Yan, W., zhu, L. , Liu, J. 2021. « COVID-19 pandemic in BRICS countries and its association with socio-economic and demographic characteristics, health vulnerability, resources, and policy response.” Infectious Diseases of Poverty 10, 97. https://doi.org/10.1186/s40249-021-00881-w

ESPON 2021
ESPON EGTC 4 rue Erasme, L-1468 Luxembourg Grand Duchy of Luxembourg Phone: +352 20 600 280 Email: [email protected] www.espon.eu The ESPON EGTC is the Single Beneficiary of the ESPON 2020 Cooperation Programme. The Single Operation within the programme is implemented by the ESPON EGTC and co-financed by the European Regional Development Fund, the EU Member States and the Partner States, Iceland, Liechtenstein, Norway and Switzerland. Disclaimer This delivery does not necessarily reflect the opinion of the members of the ESPON 2021 Monitoring Committee.