incentive structure of tax systems in africa · tax levied on business and personal incomes, often...
TRANSCRIPT

Incentive Structure of Tax Systems in Africa
Jean-Francois Ruhashyankiko Economist
IMF Institute
Richard Stern Regional Program Coordinator for Africa
International Finance Corporation World Bank Group.
Paper presented at the high-level seminar: Realizing the Potential for Profitable Investment in Africa Organized by the IMF Institute and the Joint Africa Institute Tunis, Tunisia, February 28 – March 1, 2006
The views expressed in this paper are those of the author(s) only, and the presence of them, or of links to them, on the IMF website does not imply that the IMF, its Executive Board, or its management endorses or shares the views expressed in the paper.
RREEAALLIIZZIINNGG TTHHEE PPOOTTEENNTTIIAALL FFOORR PPRROOFFIITTAABBLLEE IINNVVEESSTTMMEENNTT IINN AAFFRRIICCAA High-Level Seminar organized by the IMF Institute and the Joint Africa Institute
TTUUNNIISS,,TTUUNNIISSIIAA,,FFEEBBRRUUAARRYY2288––MMAARRCCHH11,,22000066

Preliminary: Not for Quotation
The views expressed in this paper are those of the authors and should not be attributed to the International Monetary Fund or the World Bank,
their Executive Boards, or their managements.
Incentive Structure of Tax Systems in Africa
Jean-Francois Ruhashyankiko and
Richard E. Stern1
Abstract
In this paper, we present macro- and micro-based empirical evidence that tax systems in Africa strongly affect investments and economic growth. A fundamental problem that we find is that tax systems are often designed to collect short-term revenues rather than pursue long-term developmental objectives. Moreover, low income, informal business activities, and inefficient tax administrations result in a deficit of voluntary compliance. We also consider ways through which African tax systems could be adapted to harness local business constituencies and promote voluntary compliance under these constraints. The reorganization toward modern fiscal states is likely to require incentives for businesses to act as tax withholding agents, improvements in taxpayers’ literacy, and controls of corruption. JEL Classification Numbers: O16, H21, H11 Keywords: capital investments, tax systems, government performance Author’s E-Mail Address: [email protected]; [email protected]
1 Jean-Francois Ruhashyankiko is an economist at the IMF and Richard Stern is the Regional Program Coordinator for Africa at the International Finance Corporation, World Bank Group.

- 2 -
Contents Page
I. Introduction ............................................................................................................................3
II. Small Open Economy in a Global World..............................................................................6 A. Background on Investments and Taxation................................................................6 B. First Stage: Isolate Non-tax Factors ..........................................................................9 C. Second Stage: Estimate Impact of Taxes on Growth..............................................11 D. The Growth-Breaking Tax Level............................................................................12
III. Organization of Tax Administrations ................................................................................13 A. Evolution of Organizational Forms.........................................................................13 B. Impact and Limits of Organizational Reforms........................................................14 C. Danger of Status Quo ..............................................................................................15
IV. Harnessing Formal Businesses ..........................................................................................17 A. Evidence from Investment Climate and METR......................................................17 B. Promoting Voluntary Compliance ..........................................................................20
V. Concluding Remarks...........................................................................................................22 Figures 1. Effect of Tax on Desired Capital Stock .......................................................................24 2. Illustration of Construction of Best-Practice Frontier .................................................25 3. Evolution of Organizational Forms for Tax Administration .......................................25 Tables 1. Average Growth and Components of Tax Structure....................................................26 2. Performance Indicator (Theta).....................................................................................27 3. Fixed Effects Regression Results.................................................................................28 4. Observed versus Growth Breaking Tax Levels ...........................................................29 5. Regression Results for Tax Administration Efficiency ...............................................30 6. Fixed Effects Regression Results with Corruption......................................................31 7. Share of Countries where Businesses Report Tax as Key Obstacle ............................32 8. Summary Marginal Effective Tax Rate (METR) on Capital.......................................33

- 3 -
I. INTRODUCTION
With few exceptions, colonial tax systems remained largely unchanged until the fiscal crises of the 1980s in Africa (Fjeldstad and Rakner, 2003). In the decades that followed, tax reforms became essential components of structural adjustment programs with prominent recommendations involving flattening tax rates and broadening tax bases. Such reforms led to the introduction of value-added tax (VAT), lower and broader personal and corporate incomes taxes, simplification of tax brackets, revision of excise taxes, reductions of import duties, and eliminations of export taxes. Generally, tax policies recommended for developing countries were much the same as those advocated for industrialized countries despite important differences in investment climate and economic conditions, not to mention differences in cultural and social backgrounds. As a result, tax systems today are generally not supported by local constituencies and inappropriately address business incentives to invest productively, create jobs, and thereby contribute to growth.2 In this paper, we present the idea that tax systems in Africa strongly affect investments and economic growth. It also considers how African tax systems could be adapted to harness local constituencies and give incentives for compliance. Hence, we combine a positive analysis of the incentive structure of tax systems in Africa with a normative analysis that discusses possible ways to overcome tax obstacles to investment decisions. A fundamental problem that we find is that tax systems are often designed to collect short-term revenues rather than to pursue long-term developmental objectives. Moreover, these revenues are raised through a set of tax instruments, which may—or may not—be appropriate for industrialized countries, but interact in a complex fashion and rely on coercive tax administrations in developing countries. We corroborate our analyses with three pieces of empirical evidence. The first piece is macro-based evidence from panel data regressions of economic growth on tax level (measured as total fiscal revenues over GDP), tax mix (measured here as international taxes over domestic taxes), and tax components (i.e., consumption tax and income tax), after having isolated the influence of non-tax factors (see Branson and Lovell, 2001). The second piece of evidence is based on pooled regressions of C-efficiency of tax administration on common variables plus corruption (see Ebrill and others, 2001). Finally, the third piece relies on micro-based evidence from marginal effective tax rates (METR) on capital (see McKenzie and other, 1998). From a positive perspective, we summarize our findings by observing that industrialized and developing countries differ deeply with respect to “voluntary” compliance.3 Knowing that it 2 See World Bank’s Investment Climate Survey, reported in World Development Report (2005); in particular, Chapter 5 is devoted to regulation and taxation issues.
3 See Curtis and Ruhashyankiko (2005) for an assessment of voluntary compliance by U.S. multinational corporations.

- 4 -
is never perfect, voluntary compliance gives an indication of the extent to which taxpayers comply with tax laws and regulations and, more importantly, accurately report their income and deductions. The difference does not result from intrinsic higher honesty or ethics, but from higher income levels, more intense formal business activities, more efficient tax administrations, and less reliance on trade taxes. We introduce each of these four interrelated points below. First, high income means that industrialized countries can design tax systems to encourage domestic savings required to finance productive investments and promote economic growth. The difference between income and savings is consumption. Hence, for a given level of income, the best way to encourage savings is to tax consumption. Based on the work of Hall and Rabushka (1995), advocates of pro-growth tax systems favor a broad-based consumption tax levied on business and personal incomes, often called the “flat tax.” Such a flat tax system achieves some of the administrative advantage of VAT while addressing the concerns that consumption taxes impose a relatively heavier tax burden on low-income taxpayers. Many African countries have experiences with VAT; indeed, among the reforms listed above, VAT has probably been among the most successful (Ebrill and others, 2001).4 Furthermore, consumption taxes represent about 27 percent of total tax revenues on average across the continent, the second largest share after trade taxes for most countries (see Table 1). The experience shows, however, that African policymakers prefer levying tax on goods and services rather than attempting the more ambitious task of targeting income (Thisen, 2003). Second, intense formal business activities means that industrialized countries rely on businesses as tax withholding agents to collect taxes. The obvious advantage is that most of the money earned and spent in a modern market economy passes at some point through businesses, which generally keep better records and are easier to locate and track than individuals. Given the level of development of African countries, small business taxpayers—often referred to as the “hard-to-tax”—pose extraordinary challenges (Bird and Wallace, 2003). Evidence from METR on capital indicates that businesses, especially small businesses, face substantial distortions under current—often post-reform—tax systems in several African countries (Barbour and Stern, 2005). Experience shows that African policymakers have focused on increasing collection and compliance from few existing large business taxpayers rather than attempting the more ambitious task of eliminating distortions and engaging with micro, small, and medium businesses (Gloppen and Rakner, 2002). Third, relatively efficient tax administrations in industrialized countries result from a combination of functional organization structure, taxpayer segmentation principle, and self-
4 In 1969, only one country in sub-Saharan Africa had VAT. As of April 2001, there were 27 sub-Saharan African countries with VAT and 123 countries in the world for (fora discussion of the evolution and spread of VAT, see Ebrill and others, 2001).

- 5 -
assessment practices.5 The functional organization structure breaks with the traditional organization based on the types of taxes (i.e., VAT department, customs and excise department, corporate income tax department, personal income tax department, etc.) and is widely perceived as more efficient. The taxpayer segmentation principle forces tax administrations to consider and address the specifics needs and compliance issues of taxpayers by segment. Self-assessment practices contrast with administrative assessments (e.g., imputed or presumptive taxes) and effectively shift the burden of proof from taxpayers to the tax administration. Our evidence suggests that tax administrations in Africa suffer relatively weak performance partly because its operations remain unchecked by exacting demands from literate taxpayers and controls of corruption. Experience shows that many African policymakers have preferred maintaining weak traditional organization structures plagued by corruption and coercive enforcement rather than attempting the more ambitious task of reorganizing and rooting out graft and coercive practices. Finally, from a normative perspective, the real challenge for African countries is not only to determine how to transition away from trade taxes while maintaining or increasing tax revenues,6 but also—and concurrently—promoting economic growth. More generally, the real challenge of building modern fiscal states is to adapt to global forces by upgrading to an efficient tax administration that harnesses formal businesses to promote economic growth. Sooner rather than later, policymakers will need to realize that the effectiveness of a tax administration ultimately depends on voluntary compliance that is fostered by its relationships with businesses, which constitute a cradle of money and information. The paper is organized as follows. In Section II, we consider the effect of tax systems in a small open economy, present the empirical methodology, and analyze the results. In Section III, we give a broad overview of advances in designs of tax administrations and provide further macro-based evidence. In Section IV, we discuss micro-based evidence which highlights the need to harness formal businesses and engage them as prime constituencies to foster voluntary compliance. Finally, in Section V, we provide concluding remarks on the challenge of building modern fiscal states.
5 A recent report on administrative reform led by Gus O’Donnell (2004), the United Kingdom Treasury’s Permanent Secretary, reveals that more than 60 countries had developed dedicated taxpayer clients services by 2004. Reforms began with Argentina in the late 1970s and were applied to other Latin American countries, notably Peru, Bolivia, and Uruguay, in the early 1980s. With the encouragement of the IMF and some bilateral donors, reforms spread to several African countries in the 1990s, to transition economies in the mid-1990s, and finally to Southeast Asia.
6 Such revenue targets have remained a major component of macroeconomic program conditionality in order to raise revenues to finance valuable public expenditures, including those that improve the investment climate.

- 6 -
II. SMALL OPEN ECONOMY IN A GLOBAL WORLD
This section considers the role of globalization in investment decisions under domestic tax systems and presents a methodology to calculate the growth-breaking tax level for African countries. This growth-breaking tax level helps identify whether domestic tax systems are hindering economic growth. Globalization and the importance of international capital flows is not a new phenomenon. For example, Entin (2004) documents that “From the first Spanish and English settlements in Florida (St. Augustine,1565) and Virginia (Jamestown, 1607) until World War I, a period of over 300 years, the region that became the United States experienced a massive inflow of population and capital from Europe, Africa, and Asia. The capital inflow allowed the country to run current account deficits for most of that period. (There was a brief period of current account surplus for about a dozen years after the Civil War, when the U.S. was deflating and importing gold to restore the dollar to the gold standard at the pre-war parity. Being money, the gold inflow was not considered an import. If gold were treated as a commodity, even these surpluses might have been deficits.) Much of the investment in the early U.S. canals, railroads, and industry was financed by foreigners.” (Entin, 2004, p.17) If globalization is not new, the world has changed. Since current account deficits—or its counterpart of savings minus investments—can no longer be covered by gold, developing countries cannot rely on foreigners to finance all domestic investments. Attracting foreign aid, foreign direct investment (FDI) and portfolio investment is one option; adapting the tax system to mobilize domestic savings and channel it to productive domestic investments is another. We focus on the latter.
A. Background on Investments and Taxation
We proceed by describing the effect of the tax system on the desired capital stock to show how it is influenced by globalization and how tax instruments interact. In a market economy, investors are people with money—or the ability to raise it from other investors in financial markets or from savers—who are concerned with the rate of return on their capital, net of both business and personal taxes. Investors can be either debt holders, equity holders, or both. Businesses make investments in physical capital if the rate of return on capital invested is higher than the cost of capital that accrues to investors. Actually, businesses will invest—or equivalently accumulate capital—up to the point where the rate of return generated by the last unit of capital is just equal to the cost of capital. The imposition of taxes affects investment by altering the rate of return on capital invested and the cost of capital. There are several ways in which this can occur, depending upon the details of the tax system. In all cases, taxes directly affect the willingness of investors to commit money and therefore the ability of the business to make investments. From the business’s perspective, if we presume that the proportion of investment financed by debt is φ , the nominal interest rate on debt is i , the nominal required rate of return on equity is r , and the expected rate of inflation is π , then the combined required rate of return on debt and equity, or:

- 7 -
( )1 ,R i rφ φ π= + − − (1) which reflects the real (inflation adjusted) rate of return that investors (debt and equity holders) could earn in the next best alternative investment opportunity with similar characteristics. Small open economies control neither i nor r but do influence their net-of-tax required rate of return on debt and equity through personal income taxes levied on interest income iτ , and dividends rτ . Assuming no interest deductibility and no capital gains tax, the combined net-of-tax required rate of return on debt and equity is: ( ) ( )( )1 1 1 .n i rR i rφ τ φ τ π= − + − − − (2) Small open economies also take the relative price kp of a unit of capital goods—frequently imported in developing countries—with respect to output as given. If we denote the present value of tax incentives such as tax credits and accelerated depreciation allowances for tax purposes by aAτ , and the loss in the value of the capital due to economic depreciation byδ , the cost of capital is: ( )( )1 .n a kR A pδ τ+ − (3) Finally, corporate income taxes levied on business income bτ affects investments by altering the cost of capital. In order to provide investors with their net-of-tax required rate of return equal to nR , businesses need to generate a gross-of-corporate tax net-of-depreciation rate of return on the marginal unit of capital equal to gR . Denoting the marginal revenue product of capital by kMRP ,7 the equilibrium condition for value-maximizing businesses is:
( )( )
1,
1b k
ga k
MRPRA pτ
δτ
−= −
− (4)
where capital is accumulated up to the point that the marginal unit breaks even in the sense that it earns just enough to cover the cost of capital. Figure 1 illustrates equation (4) and the effect of tax on desired capital stock. With global financial and capital markets, the supply of investment goods—and the supply of savings to pay for it—are fairly elastic over time.8 Hence, the required return to capital is depicted as a horizontal line. The demand for capital is fairly elastic because the marginal product of capital declines only gradually as the stock increases. Because capital is more sensitive to taxation than labor, a tax on capital will have a relatively large adverse impact on the desired
7 This assumes that investment is continuously divisible, and that the marginal revenue product of capital—the increment to revenue arising from investing in one more unit of capital—eventually declines as the amount of capital employed increases. 8 The evidence suggests that savers readily finance capital assets at about 3 percent after-tax risk-adjusted rate of return, substituting additional savings for additional consumption (Robbins and Robbins, 1992).

- 8 -
amount of capital, which will then cause a relatively large drop in capital stock.9 Such drop in capital stock / 0K K∆ < will directly impact the rate of economic growth. It important to keep in mind that the tax level (measured as total fiscal revenues over GDP) comprises a set of tax instruments { }, , ,i r a bAτ τ τ τ that cover most forms of taxation from personal income taxes to corporate income taxes via tax incentives and other intricate features of the tax systems such as withholdings and carry forwards (neglected here for simplicity). It is clear that these instruments interact in a complex fashion, depending upon the details of the tax system. Moreover, the incidence of these instruments on capital accumulation depends greatly on the time frame. Indeed, physical capital cannot disappear overnight (in the event of a tax increase), and it takes time to add to the stock of buildings, machinery, land, and inventories (in the event of a tax reduction). Immediately after a tax increase is imposed on savers or businesses, the after-tax returns on old assets are reduced, thereby reducing the incentive to renew such assets over time.10 The desired stock of capital will be immediately lower than the actual stock but the latter will converge toward the former over time. Given the complexity created by the interaction of these instruments and influence of time frames, most macro-based evidence relies on tax levels and tax mixes based on broad categories of taxation such as trade taxes mostly levied on imports, consumption taxes mostly levied on domestic goods and services, and income taxes levied on incomes and profits. Table 1 presents the summary values of real GDP growth as well as trade, consumption, and income taxes in percentage of GDP for each country in our African panel.11 In total, our panel comprises 43 African countries and 586 observations. This represents an average of 14 non-missing yearly data points for each country from 1981 to 2003. Many African countries still rely disproportionately on international trade taxation but there is a wide variance between Lesotho (52 percent) and South Africa (4 percent) on average. Traditionally, border taxation has been replaced by consumption taxation, which constitutes the main source of tax revenue on the continent (Keen and Ligthart, 2002). Here again, there is a large variance between Botswana (57 percent) and Nigeria (7 percent). Other oil producers such as Nigeria,
9 This results from the fact that labor supply is fairly inelastic while capital supply in global markets is elastic (and there are no fundamental differences in their respective demand elasticities).
10 In industrialized countries, financial market adjustments would come swiftly. Bond and stock prices would fall, restoring after-tax returns for new buyers and forcing new borrowers to offer higher interest rates and rates of return to new investors (Entin, 2004).
11 All data come from the IMF’s World Economic Outlook, Economic Trends in Africa, September 2005. Ten African countries drop out of our analysis due to insufficient information: Democratic Republic of Congo, Djibouti, Liberia, Libya, Namibia, Sierra Leone, Somalia, Swaziland, The Gambia, and Zimbabwe.

- 9 -
Equatorial Guinea, Gabon, Egypt, Republic of Congo, and Algeria also have a lower dependence on consumption taxes on average. Besides several oil producers, only a handful of countries rely primarily on income tax. This contrasts with industrialized countries, which derive most of their revenues from income taxation. The gray areas reflect achievements that are worse than the average for Africa. We now turn to the determination of the growth-breaking tax level. That term refers to the level of tax at which changes in the set of tax instruments it comprises will have zero impact on growth. In other words, the growth-breaking tax level gives the point at which the growth impact of changes in the set of tax instruments switches from negative to positive. We adapt a simple methodology applied in New Zealand by Branson and Lovell (2001).12 It considers the rate of economic growth as a function of the tax structure and all non-tax factors and seeks to focus on the former while isolating for the latter. It is an analytical tool that consists of a two-stage procedure. The first stage uses linear programming techniques to isolate non-tax factors that influence economic growth. The second stage uses econometric techniques to analyze the separate impacts of the tax level and the tax mix on economic growth, independently of the non-tax factors that were isolated in the first stage. The outcome of this procedure is to determine a growth-breaking tax level independently of the non-tax determinants of economic growth.
B. First Stage: Isolate Non-tax Factors
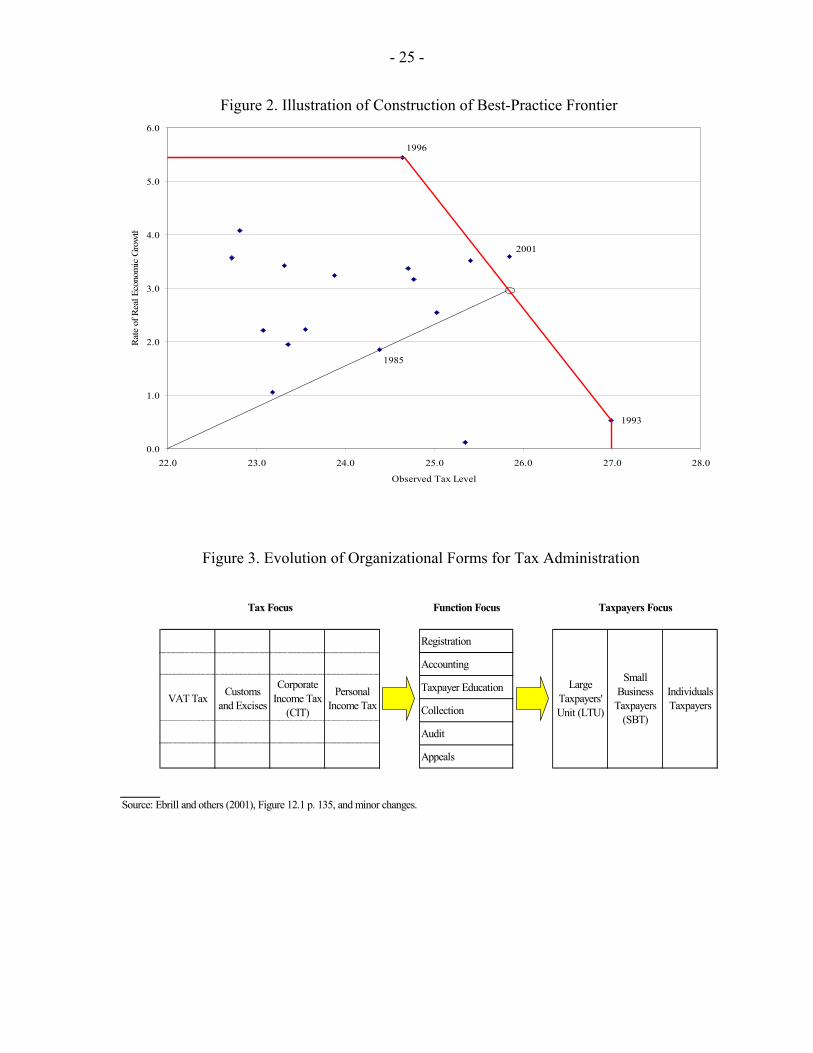
The first stage of the methodology seeks to isolate all of these non-tax factors that have been identified as determinants of economic growth. This can be done with the use of linear programming techniques to isolate non-tax factors. Consider the rate of growth of real GDP in country i and time t denoted itg as a function of the tax structure and these other non-tax factors: [ ], ; ,it it it itg f λ µ= Θ (5) where itΘ is a vector capturing non-tax factors. The tax structure comprises two elements: the tax level ( ) /it Tit Cit Yit itT T T GDPλ = + + and the tax mix /( )it Tit Cit YitT T Tµ = + , where TitT , CitT , and YitT are international trade tax revenues, consumption tax revenues, and income tax revenues, respectively. The task is to eliminate the influence of itΘ on itg in equation (5). The linear programming techniques can be used to construct a best-practice frontier, which is replicated for each country in the African panel sample. The construction of this best-practice frontier is explained in Figure 2, which presents a scatter plot of tax level and rate of growth for Africa as a whole, only for illustrative purposes. Each observation point represents a given year. The 12 The methodology is based on Data Envelopment Analysis, occasionally called frontier analysis, initially developed in the unrelated context of business operational research by Charnes and others (1978), and popularized in Charnes and others (1994).

- 10 -
best-practice frontier links the highest growth rate, which happened in 1996, to the highest tax level experienced in 1993. The former gives the highest rate of growth achievable for any given tax level while the latter gives the highest tax level achievable for any given rate of growth. Hence, the best-practice frontier is the outermost combination of growth and tax level achievable. All observation points near or beyond the frontier must have benefited from favorable non-tax factors while observation points within the frontier must have experienced unfavorable non-tax factors. These observation points within the frontier suggest there is some scope left either to increase the rate of growth without decreasing the tax level, or to increase the tax level without hurting economic growth, or indeed both. It is therefore possible to construct an indicator denoted itθ of economic performance that measures the distance of each point to the best-practice frontier.13 This indicator is a proxy for itΘ , which varies over time for each country and satisfies 0 1itθ< ≤ . For each country, if
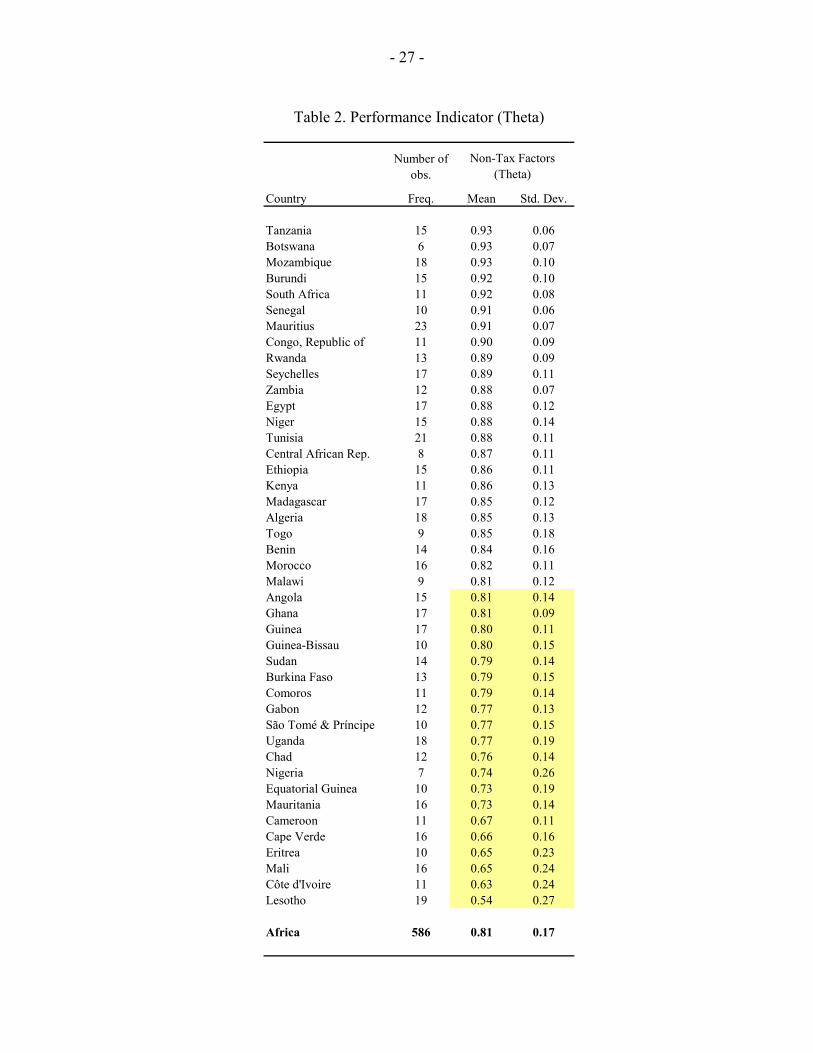
1itθ = , that year’s growth rate and tax level were not exceeded by any convex combination of growth rates and tax levels observed in any other years. It follows that non-tax factors must have been relatively favorable during that year. For each country, if 1itθ < , that year’s growth rate and tax level were exceeded by a convex combination of growth rates and tax levels observed in some other years. It follows that non-tax factors were relatively unfavorable during that year. Dividing each tax component by itθ recognizes that the tax level would have been higher had non-tax factors been more favorable. Hence, this avoids ascribing poor revenue collection in a given year to weak tax administration while, in fact, poor revenue collection resulted from weak economic performance beyond the control or influence of the tax administration. Hence, we can rewrite the growth equation (5) to reflect the rate of growth of real GDP, itg in country i and time t as a function of the tax structure alone: [ ]/ , .it it it itg f λ θ µ= (6) Table 2 shows the summary results, which indicate that the overall mean value of itθ (theta) is 81 percent for Africa as a whole. Each country has its own best-practice frontier and, therefore, individual country performance could be tracked over time; we simply present the number of observations, the mean value, and the standard deviation. This allows comparing the average performance over time for each African country in the sample. Countries at the top—like Tanzania, Botswana, and Mozambique with the highest value of itθ at 93 percent—have experienced relatively favorable non-tax factors on average. At the other end, Lesotho, Côte d’Ivoire, and Mali with the lowest value of itθ have experienced relatively unfavorable non-tax factors on average. The gray area indicates a performance below average for Africa.
13 For a specific example, we take the distance from the origin to point-1985 divided by the distance from the origin to the projection of point-1985 on the best-practice frontier. We obtain ,1985 0.93Africaθ = , whereas ,1993 ,1996 ,2001 1Africa Africa Africaθ θ θ= = = .

- 11 -
C. Second Stage: Estimate Impact of Taxes on Growth
After eliminating the influence of non-tax factors as suggested in the first stage, the second stage uses econometric techniques to analyze the separate impacts of the tax level and the tax mix on economic growth. As in Branson and Lovell (2001), a log-quadratic specification is assumed:
( ) ( ) ( )
( ) ( ) ( )
20
2
1ln / ln ln /2
1 ln ln / ln .2
it it it it it it
it it it it
g λ µ λλ
µµ λ µ
β β λ θ β µ β λ θ
β µ β λ θ µ×
= + + + ⎡ ⎤⎣ ⎦
+ + ×⎡ ⎤ ⎡ ⎤ ⎡ ⎤⎣ ⎦ ⎣ ⎦ ⎣ ⎦
(7)
This specification can be estimated using our panel of African countries with country fixed-effects to control for time-invariant determinants of growth that have not been accounted for in the first stage purge. These fixed-effects, for instance, control for the oil-producing status of 11 countries in the panel.14 The tax structure of oil-producing countries may be substantially different from the 32 non-oil-producing countries. Table 3 presents the estimated coefficients of equation (7), using fixed-effects panel data regressions. These reveal that most of the explained variance of residuals takes place within countries rather than across countries. Fixed-effects are jointly significant indicating the presence of country-specific time-invariant factors. The interpretation of the negative coefficient of ˆ
λβ is as expected and has been subject to debates best summarized by Engen and Skinner (1996), and Tanzi and Zee (1997). Suffice to say that a simplistic theoretical trade-off between tax level and growth, which appears supported by the data, cannot be relied upon for policymaking. One of the main problems is that the tax level, as already indicated, comprises a set of tax instruments which interact in a complex fashion with an uncertain incidence depending on the time frame. Hence, it is not clear which of these instruments, if any, could be used to foster growth. What is clear, however, is that the tax mix has a significant negative effect on the rate of real GDP growth. This indicates that a decrease in international taxes relative to domestic taxes fosters economic growth. In other words, trade liberalization in the process of globalization, regional integration, and expansion of free trade zones is expected to promote growth. However, the second regression indicates that it does seem to make a difference whether trade taxes are replaced by consumption or income taxes, in order to maintain the tax level. This links to an interesting debate between proponents and opponents of selective reforms (see Keen and Ligthart, 2002; and Emran and Stiglitz, 2005). We find that if income taxes make up for the reduction of international trade taxes, then the net impact on economic growth is expected to be positive. If, on the other hand, consumption taxes make up for the reduction of trade taxes, then the net impact on economic growth is expected to be negative. 14 These countries are Algeria, Angola, Cameroon, Chad, Republic of Congo, Egypt, Côte d'Ivoire, Equatorial Guinea, Gabon, Nigeria, and São Tomé & Príncipe.

- 12 -
Indeed, on the one hand, there is the significantly positive impact of the reduction of trade taxes, while, on the other hand, there is the significantly negative impact of the increase of consumption taxes. The results show that these two effects combined will likely result in a negative impact on the rate of real GDP growth, as indicated by the significant -0.32 on the natural log of consumption tax. This result appears surprising because consumption tax taxes savings only once—either when the funds are withdrawn and used for consumption or when the funds are first earned—whereas income tax taxes savings both when the money is earned and again when the savings earn a return. This is the reason why advocates of pro-growth tax systems call for consumption taxes. There is a difference, however, between pro-growth consumption tax, which is broad-based and levied on income, and African consumption tax, such as VAT, which tends to be relatively narrow-based and levied on goods and services. We come back to this issue in the next section.
D. The Growth-Breaking Tax Level
Given the non-tax factors captured by the performance indicator itθ (in Table 2) and the
estimated coefficients from fixed-effect regressions { }β̂ (in Table 3), it is possible to
determine the growth-breaking tax level. This is the tax level at which the growth impact of changes in the set of tax instruments it comprises switches from negative to positive. This breaking point is simply given by one of the zeros of the log-quadratic function (7).15 Table 4 presents the results where countries are ranked in decreasing order of the size and significance of the difference between the observed tax level mean and the growth-breaking tax level mean. Again, a finer assessment could be made by investigating each country profile over time rather than averages presented here for discussion purposes. Countries in the upper part have a positive difference on average owing to high tax levels and relatively strong revenue collection records. With the exception of Botswana, Seychelles, and Lesotho, all other 7 countries in this upper part are either oil producers or North African. Countries in the lower part display either a non significant difference or a negative difference on average. When the difference is negative and significant, there is evidence that the observed tax level—and the interaction of tax instruments it comprises—hinder economic growth. That is the case for the vast majority of sub-Saharan Africa, including South Africa. In total for Africa and on average over the period and across countries, the observed tax level of 20 percent is about 1 percentage points below the growth-breaking tax level of 21 percent. Thus, there is evidence that tax systems in sub-Saharan Africa hinder economic growth. This, however, not only hides large differences across countries (as shown in Table 4) but also within countries, both over time as well as across industry-sector and asset classes. Such
15 At this stage, we depart from Branson and Lovell (2001) because our estimated coefficient ˆ
λλβ is positive and ˆµµβ is non significant. Hence, our log-quadratic function is
convex with respect to the tax level.

- 13 -
differences will be further highlighted by evidence from tax administration efficiency and micro-based evidence from METR. On the whole, the analysis and results from this section indicate that answers to falling trade taxes and to the need for increasing tax levels (tax revenue collection in percentage of GDP) are likely to require an overhaul of tax instruments. We showed how these instruments interact in a complex fashion over a certain time frame, and we found that their interaction is strongly affecting economic growth in most countries. This overhaul of tax instruments that comprise the tax level is likely to require ambitious long-term developmental planning rather than quick-and-easy short-term fixes.
III. ORGANIZATION OF TAX ADMINISTRATIONS
This section provides a broad overview of the evolution of organizational forms for tax administration. In the previous section, we found—but deferred discussion on the evidence—that consumption taxes appear to hinder growth in Africa. In this section, we seek to identify whether consumption taxes per se are detrimental to economic growth, or whether it is consumption taxes collected by traditionally organized and inefficient tax administrations.
A. Evolution of Organizational Forms
The trend toward reorganizing tax administration has been most pronounced in East European countries which have replaced traditional organizations based on the types of taxes and geographic divisions by new functional organizations, augmented by special units organized around taxpayer characteristics, such as size of assets or sales. In the last decade, several African countries have seized upon the organizational concept of a large taxpayers’ unit (LTU) as a mechanism to introduce reforms of structures and procedures of tax administration.16 Figure 3 borrows a schematic summary of the evolution of organizational forms for tax administration from Ebrill and others (2001). It shows three different approaches based on different focuses. Traditional organizations were exclusively tax focused and functions were replicated in each department. In addition, each geographic office came along with all its functions, thereby inducing tremendous duplications in the system. New functional organizations regroup all functions across the board into well defined and specialized functional categories that can generate economies of scale and improve the overall efficiency of tax administrations. Moreover, this organizational form is compatible with a taxpayers’ focus by drawing specific specialists from common functional categories. The novelty in the functional focus of tax administrations should not be underestimated. Indeed, functional organizations intrinsically involve—or should involve—a management of 16 See for example, Gill (2000) for a diagnostic framework for reform, and Fjeldstad and Rakner (2003) for a review of the outcome of such reform focusing on sub-Saharan Africa.

- 14 -
the tax system to ensure that voluntary compliance with tax laws can be maximized. In particular, the adoption of self-assessment principles is intended to making compliance as simple as possible and at least cost to businesses. In effect, self-assessment switches the burden of proof from taxpayers to tax administrations by recognizing the needs of specific taxpayer segments. Based on risk management principles, tax administrations trigger audits of taxpayers that are particularly at risk of non compliance given their facts and circumstances as well as changes in tax laws and provisions. Tax administrations obviously retain their enforcing rights and obligations where there is non compliance but all interactions with taxpayers require informing them of their obligations at each point of the process from the drafting of new laws to any final appeal in a court of law. Related advantages of a functionally organized tax administration is to provide a single point of access for taxpayer inquiries, a common registration function with unique tax identification number, and a “whole of client” view of obligations. For the administration itself, the functional organization provides the basis for a uniform accounting framework and the ability to build dedicated information technology and processing systems. In addition, it facilitates the specialization of tasks, integration of decision making, coordination of policy implementations and operation practices, and effective monitoring of overall performance (Gill, 2000). The taxpayer focus, in turn, allows an efficient way to enforce collection and return management across taxes and to organize audits across taxes. Increasingly, the functional focus is being combined with the taxpayer focus. The rationale for this organizational design is that each taxpayer segment—as defined by assets or sales—has different characteristics and tax compliance behaviors. Hence, each segment presents different risks to the revenue base. According to this organizational design, maximizing voluntary compliance for each taxpayer segment requires delivering provisions that are appropriate to the specific compliance issues posed by each segment (McCarten, 2004). Many industrialized countries (e.g., Australia, Netherlands, United States) and developing ones (e.g., Pakistan) have gone beyond establishing LTUs and have reorganized their administration around different segments of taxpayers. The extreme heterogeneity of business taxpayers in Africa and other developing countries makes the cases of exploring this organizational design persuasive. By contrast, traditional tax focus in many African countries has created serious tax compliance issues, and tax administrations have become increasingly moribund compared with their counterparts in industrialized countries. Specifically, intimidating approaches toward taxpayers and corruption among tax inspectors have established a record of mutual mistrust between taxpayers and tax administrations. There is little culture of self-assessment and voluntary compliance with tax legislation, few experiences of appeals to competent authorities or courts against the decisions of tax administrations, and limited tradition of holding politicians accountable for the use of money raised through taxes (Fjeldstad and Rakner, 2003).
B. Impact and Limits of Organizational Reforms
Although it is still too early to draw general conclusions from African countries that have reorganized functionally or adopted LTUs, experience from early reformers indicates that

- 15 -
such reorganization bears the potential to increase tax revenue without hampering economic growth. However, functional reorganizations and adoption of LTUs alone are unlikely to be successful unless policymakers use all leverages at their disposal to ensure: enhanced autonomy of tax administrations, capacity-building of tax administration, performance-based pay systems, automation of all processes, investment in communication and technology infrastructures, simplification of laws and procedures, universal self-assessment in all taxes, sharing information across inspectors, independent internal controls, risk management principles, audit-based taxpayer controls, improved dispute resolution mechanisms, and last but not least professional and efficient taxpayer services. It follows that—however desirable such a complete reorganization—it will have different impacts in different countries depending on the relative degree of completion, whether key institutional and policy support have been implemented, and whether the reorganized institutions and policies effectively tackle corruption issues that have plagued tax administrations over the years. In many cases, such a reorganization will likely have disappointing results due to a tendency to adopt hybrid approaches, starting with an overall functional focus, but subsequently crafting components of the tax focus on supposedly new organizational structures.
C. Danger of Status Quo
We started the paper by noting that tax policies recommended for developing countries over the last decades were much the same as those advocated for industrialized countries. The analysis below shows that in spite of the commonality of tax policies, the efficiency of African tax administrations has drifted away over the years at least until 2001, albeit not in a way that is unheard of in other developing and transition countries. There is, however, a danger that in the absence of a complete reorganization, the drifting will worsen in a way that could be damaging for African businesses. Ebrill and others (2001) suggested that an efficiency indicator of tax administration could be based on VAT revenue collection. This is because VAT is narrowly defined and the basis on which it is assessed—usually equivalent to aggregate private consumption—can be measured from statistical sources that are derived independently from revenue data. Their measure, called “C-efficiency” of the VAT, is defined as the ratio of VAT revenue to aggregate private consumption divided by the standard statutory VAT rate. It gives “both a summary indicator of performance and a useful gauge of the extent to which the VAT bears uniformly upon a broad base.” Although weak, the evidence suggests that problems of tax administrations in Africa are not necessarily worse than in other developing and transition countries if we control for literacy and corruption. This can be shown by running simple regressions of the ratio of VAT revenue divided by aggregate private consumption denoted /VAT C on a set of explanatory variables, including the statutory VAT rate denoted VATτ in 2001, the income—measured as natural log of real GDP—denoted Income, and the degree of Literacy of the population,

- 16 -
which is taken as a proxy for taxpayers’ literacy.17 This is close to the standard regression in Ebrill and other (2001, p. 45) to which we add, as McCarten (2003) did before us, the degree of Corruption. For the latter, we use data from the International Country Risk Guide (ICRG). We adopt the following specification where Africa is a dummy variable for African countries in the sample: 0 1 2 3 4 5 .VATv Africa Income Literacy Corruptionγ γ τ γ γ γ γ= + + + + + (8) Table 5 summarizes the results from regression (8) starting with 3 4 5 0γ γ γ= = = , then relaxing this restriction. The pooled regression is run on a sample of 29 developing and emerging countries, 9 of which are in Africa with 330 observations. The base case shows that African countries, with comparable statutory VAT rates, have on average less VAT revenue per unit of aggregate private consumption (see also Ebrill and others, 2001). However, the coefficient on the African dummy becomes insignificant once we control for their lower degree of literacy and higher corruption. The latter two variables are significant at a 99 percent level of confidence. Table 6 presents further evidence by returning to our fixed-effect regression (7) and using our African panel. The first regression basically reproduces the second regression from Table 3 with less observations and countries due to a more limited coverage of corruption data. As before, the coefficient on the log consumption tax is significant and negative. The novelty comes from the second regression in which we introduce an interaction between the log consumption tax and an indicator of corruption from ICRG. The results are revealing. When the interaction term is introduced, the log consumption tax is no longer significant, whereas the interaction term is significant. This indicates that contrary to our first interpretation, it is not consumption tax per se that is detrimental to growth but consumption tax raised on a narrow base by an inefficient tax administration plagued by corruption. On the whole, the analysis and results from this section corroborate the previous section’s conclusion. In particular, the evidence seems to suggest that measures to correct the lack of efficiency in African tax administrations rest on strategic reorganization of these administrations, rather than quick-and-easy short-term fixes. In addition, and contrary to the evidence from the previous section, the growth-inhibiting aspect of consumption tax does not appear to result from disincentive provided by consumption taxes per se but from the inefficient way such taxes are collected by tax administrations that are, in general, unchecked by exacting demands from literate taxpayers and controls of corruption.
17 Illiteracy may also be capturing the importance of the informal sector.

- 17 -
IV. HARNESSING FORMAL BUSINESSES
We have already considered the effect of the tax system and the administration of the tax system. In this section, we turn to the “demand side” of the tax system, meaning the constituency of taxpayers. No one likes to pay taxes; thus there is a tendency for individuals to call for taxes on businesses and for the latter to complain about excessive taxes. In reality, formal businesses pay taxes but individuals—and individuals only—eventually suffer the entire burden of tax systems on their labor or capital incomes. The reason is simply that businesses are individual entrepreneurs who get money from lenders and shareholders, hire employees, and serve customers. By affecting these five categories of individuals, businesses play an active role in determining the incidence of taxes among ultimate taxpayers. In practice, businesses determine this allocation by responding to the respective bargaining power of each of these five categories. However, businesses are not completely free to pass on the tax bill by changing the level of royalties to entrepreneurs, the level of interests to lenders, the level of dividends to shareholders, the level of wages to employees, and the level of prices to customers. There is ample evidence that corporate taxes impose distortions on these choices, especially with respect to such matters as entry or exit from informality, organizational form (the incorporation decision), financial structure (debt-equity ratio), and dividend policy (pay-out ratio) as surveyed by Gravelle (1994).
A. Evidence from Investment Climate and METR
There is general consensus among economists on the relative unimportance of taxes and tax systems for investment and business choices, compared to other standard determinants of economic growth.18 Yet, Investment Climate Surveys (see World Development Report, 2005) conducted on thousands of established and operating businesses throughout the world reveal that 82 percent of businesses report tax rates as one of their top concerns. Table 6 presents a breakout of these data, which show that sub-Saharan Africa beats the odds with a systematic greater perception that taxes are an obstacle to investment. This has several explanations. First, there is a simple explanation that perceptions are sometimes misplaced and strongly influenced by business cycles and other facts and circumstances that appear to bear important relevance in the short term. The numbers uncovered by the surveys, however, indicate that there is probably more to these numbers than a simple anecdote. After all, businesses do carry out most investments and their concerns ought to be considered carefully. It is certainly plausible that neat models of perfect competition and information do not reflect harsh realities across the developing world. Second, it is likely that the consensus itself is misplaced and that the failure to understand and take account of the economic consequences of taxation leads to a gross misrepresentation 18 The methodology used in Section II sought to address this view by isolating non-tax factors.

- 18 -
of its effects. To clarify this point, Entin (2004) proposes practical definitions of the three important and often confused concepts of statutory tax, tax incidence, and tax burden. “Statutory tax” refers to the person who is obligated by law to make the tax payment and may be different from the person who perceives taxes as an obstacle to investment; “tax incidence” differs in the short-term and the long-term, and refers to the allocation of tax between supply and demand based on their respective elasticities in the market for the taxed good, service, or factor of production; and “tax burden” measures the changes in after-tax incomes after all the economic adjustments to the tax have occurred across all affected markets as consumption behavior, resource use, and incomes shift to their new patterns. Considering carefully these concepts leads us far from a consensus but in an area of conflicting theories (Tanzi and Zee, 2000). Macroeconomic studies of economic growth have no data to discriminate between these concepts in order to assess the real impact of taxation and—to the extent that fiscal policies have an impact on long-term growth (i.e., endogenous theories)—these studies suffer from omitted variables. More microeconomic studies of investment and finance theories acknowledge the importance of transaction costs, of which taxes or effective taxes are a component. Third, conflicting theories may not be that helpful in environments marked by complex economic incentives and political-economy considerations. For example, Emran and Stiglitz (2000; 2005) warn that pro-growth tax policy will confront dual economy constraints for low income developing countries. The argument is that the increasing dependence on VAT collections from large enterprises in the formal sector is reinforcing structural dualism and ultimately discouraging growth by making formal sector participation unattractive. In another vein, Auriol and Warlters (2005) find rationality for governments in developing countries to explain the seemingly irrational commitments to maintaining high barriers to entry from the informal to the formal sector. Their argument is that developing country governments consciously raise barriers to entry into the formal sector in an effort to maximize tax revenue on oligopoly profits without having to improve tax administration capacity. These two references highlight the fact that in many developing countries, taxation interacts with economic incentives and political-economy considerations that may become serious obstacles to investments, even if taxes in isolation were proven not so important. Fourth, the effect on the incentives to invest depend not just on the statutory rate of corporate income tax but more fundamentally on effective taxation which summarizes (i) treatment of financial costs, (ii) capital depreciation rules, and (iii) other tax features such as withholding and carry-forward rules. There is a standard approach for summarizing effective taxation. Here again, confusion may emerge between the “average effective tax rate,” which influences the location of investment, and the “marginal effective tax rate or METR,” which influences the level of investment. It is common to find comments on the relative unimportance of tax—compared to non-tax factors—in capital flows, location of FDI, or location of portfolio investment studies. These studies, however, suffer the same handicap as macroeconomic studies of economic growth; that is, unavailability of widespread comparable data. Besides, it is likely that the relative unimportance of tax applies more to studies on the location—rather than level—of investment.

- 19 -
Finally, METR studies on capital do indeed show that taxation of capital creates important distortions in the tax system, especially for small businesses.19 The METR on capital denoted ϒ is defined as the tax rate which, if applied to the net-of-corporate-tax rate of return nR , yields the gross-of-tax rate of return gR or:
( )1 .g nn g
n
R RR R
R−
+ ϒ = ⇒ ϒ = (9)
Ideally, taxation of capital should be neutral, which implies an METR equal to zero. It can be shown that this condition is satisfied either when there are no taxes on capital, or when there are corporate income taxes but interests are deductible and depreciation allowances for tax purposes reflect true economic depreciation. In the presence of corporate income taxes, METR will seldom be equal to zero but it could be either negative, which reflects the presence of distorting subsidies, or positive, which indicates the presence of distorting taxes. Table 7 presents a comparison of METR calculation in four capital inputs (i.e., buildings, machinery, land, and inventories), in five African countries (i.e., Malawi, Rwanda, South Africa, Tanzania, and Zimbabwe), and reproduced for four industry-sectors (i.e., agriculture, tourism, manufacturing, and financial sector). These numbers are drawn from detailed country studies by Foreign Investment Advisory Service (FIAS) at the International Finance Corporation (IFC)/World Bank.20 The results highlight the presence of substantial distortions created by the tax system with few items close to zero, or in the single digits. To summarize the results, we computed averages and variances per country—across industries and assets—as well as averages and variances per asset in each industry but across countries. The averages give a rough indication of the overall burden of taxes on capital, whereas large variances identify the presence of substantial distortions. The heaviest burdens are observed in South Africa and Tanzania and appear to adversely affect capital investments in machinery and inventory across countries. The highest distortions are observed in Zimbabwe and Rwanda and seem to penalize capital investments in building and land assets across countries. Further evidence in Barbour and Stern (2005) suggests that small businesses are particularly affected by these distortions and face the highest tax distortions across all asset classes and industries, with the exception perhaps of agriculture.
19 METR studies could equally be performed on material input costs, labor input, as well as intangible and tangible capital input (see e.g., McKenzie and others, 1998). We focus on tangible capital input, which specifically refers to buildings, machinery, land, and inventories.
20 Barbour and Stern (2005) provide more details on these data and results. They use the standard methodology explained in McKenzie and others (1998), among others.

- 20 -
In sum, the results clearly show that domestic tax systems do seem to matter for investors and businesses. It may not list among the most important determinants of economic growth and may be limited in explaining the location of investments but the evidence suggest that tax systems do create substantial distortions and are therefore likely to affect economic choices, capital accumulation, as well as economic growth.
B. Promoting Voluntary Compliance
It is hard to imagine a well functioning modern fiscal state without businesses at its core. It is equally hard to imagine how businesses could be brought to the core under current practices with high distortions due to capital income taxation. Yet, both businesses and tax administrations are set to gain from closer collaboration. Modern fiscal states make intense use of businesses as tax withholding agents. Actually, tax withholding—also known as taxation at the source—is a central feature of modern income tax and a principal means of collecting revenue around the world. Tax withholding is most commonly applied to wages and salaries, and is often regarded as the backbone of the personal income tax. The essence is that a tax administration collects the tax, not directly from the individual recipient of income, but from the business payer who deducts the tax from the income paid to the individual. As a result, tax withholding enables the collection of tax on income regularly as the income arises and also reduces evasion because the tax is collected from a party not directly interested in its payment (Soos, 1998). In other words, withholding labor income tax has the potential to raise voluntary compliance insofar as the payer of the tax is not the recipient of the net-of-tax income. Given the argument made earlier that businesses pay taxes but do incur the eventual burden, it may be tempting to advocate tax withholding in connection with other types of income, such as interest, dividends, or capital gains. This, however, raises at least two types of difficulties. First, as discussed throughout the paper, taxes on capital income create distortions that are likely to penalize capital accumulation and economic growth. This is supported by both macro-based and micro-based evidence presented earlier. Second, and more fundamentally, withholding capital income tax does not contribute to increase voluntary compliance because capital owners are typically closely involved in the management of the business and therefore its investment decision. This means that, in many instances, the payer of the tax is the same person as the recipient of the net-of-tax income. In other words, withholding capital income tax will not favor voluntary compliance. This problem is particularly acute for micro, small, and medium businesses. And, by global standards, even large businesses in Africa tend to be quite small. It follows that one of the best ways to promote voluntary compliance with businesses as withholding agents for various taxes is to eliminate corporate taxes on domestic businesses. This point is probably made more forcefully by Nobel economist Wassily Leontief, who was quoted in The New York Times as saying: “Corporate income taxes fall ultimately on people. Economists have tried but have never succeeded in finding out how the weight of these taxes is ultimately distributed among income groups. There can be little doubt that elimination of corporate income taxes would simplify our tax system and limit its abuse.” (The New York Times, February 1, 1985, p. A29)

- 21 -
Elimination of corporate taxes should not be confused by elimination of taxes levied on businesses income. The former is distorting and abused; the latter is promising. Indeed, advocates of flat tax call for the strengthening of businesses as withholding agents for consumption taxes levied on business and individual incomes. The principles of flat tax are brilliant for their simplicity and efficiency as well as their ability to accommodate progressivity for equity purposes. Here is how it works: Businesses take their gross revenues from sales and deduct total allowable costs to obtain their taxable income, which is taxed at a flat rate. Total allowable costs include three items that are fully expendable (100 percent): (a) purchases of goods, services, and materials from other firms; (b) wages, salaries, and retirement benefits; and (c) purchase of capital inputs (i.e., buildings, machinery, land, and inventories). Withholding tax on labor income (b) is common, as indicated above. What is less common is that there is no interest deductibility, no tax incentives such as tax credit or depreciation allowance, no taxes on interest, dividends, or capital gains, and no taxes on capital income at all. Hence, the set of tax instruments is null{ }0i r a bAτ τ τ τ= = = = in equations (2)-(4), and METR in equation (9), 0ϒ = because g nR R= , indicate no distortions. Yet, businesses pay a flat rate on their taxable income. And individuals are withheld on their labor income but can claim allowance based on family characteristics and income level; such personal allowance introduces progressivity in the flat tax system. Since taxes are levied on income but savings income is not taxed, this system is a perfect consumption-based tax system. Here again voluntary compliance is fostered by the fact that the business payer may or may not be the recipient of net-of-tax income but is not the target of the tax. Consumption is the target of flat tax proposed by Hall and Rabushka (1995). This consumption-based tax system differs from consumption taxes observed in most African countries in at least three respects. First, savings income is typically taxed and often heavily given the level of development. Second, the consumption-based tax system levies tax on income (as explained above) rather than on goods and services (as common VAT and excise, for example). Third, this system is broad-based rather than narrow-based, as observed in Africa (on this latter point, see Emran and Stiglitz, 2000; 2005). In principle, tax incentives could be used to incentivize purchases of capital inputs (i.e., buildings, machinery, land, and inventories). In practice, however, tax incentives have proven extremely complex, and when simple, they interact in a complex fashion with other tax instruments and create large distortions (captured in METR numbers) and perverse effect on capital accumulation within a certain time frame. Whether under a flat tax system or a regular tax system, the treatment of (a) purchases of goods, services, and materials from other firms could be adapted to recognize that many of these firms in Africa are in the informal sector. Subject to a simplification of business taxation, it is possible to use formal businesses as withholding agents or pre-payers of income, sales, and other taxes legally due from unincorporated or informal suppliers of goods or services or purchasers of business products. This would replace highly distorting imputed/presumptive regimes for small business taxation (on this latter point, see Barbour and Stern, 2005). In addition, it would induce unincorporated or informal suppliers or purchasers to register in order to claim a tax refund by expensing (a), (b), and (c). Under a

- 22 -
flat tax system, given its simplicity, there is no need to hold sophisticated books. Indeed, all what is required is gross revenues from sales, three deductions of allowable costs (a), (b), and (c), and one multiplication by the flat tax rate. Even under a regular tax system, a flat tax system could be generalized for small businesses in lieu of the current imputed/presumptive regimes and the complex handling of VAT for small businesses (again for the latter point, see Barbour and Stern, 2005). Pro-growth advocates of tax reforms in industrialized countries typically militate for tax systems based on retail excise taxes, broad-based VAT, savings-deferred income tax, returns-exempt flat tax, or some combination of each (Entin, 2004). Since African tax systems already rely predominantly on excises and VAT, the latter two options might be worth investigating. A savings-deferred income tax is tax on income less net savings in which all savings is tax-deferred.21A returns-exempt flat tax does not allow a deduction for or deferral of current savings, which must be done on an after-tax basis, but it does not subsequently tax the returns on that after-tax savings. Hence, both options are income taxes that seek to promote savings and mobilize resources for productive investments, job creation, and economic growth. African tax administrations probably need to understand that they rely on formal businesses to collect taxes and that their performance depends on their interactions with businesses. Of course, businesses and tax administrations’ interests diverge insofar as tax administrations want to raise more revenue while businesses—as with any taxpayer—want to pay as little taxes as possible. But it would be erroneous to conclude, from this divergence of interests alone, that tax administrations could not induce cooperation through reductions in corporate tax for which most economists find little support at any rate (Bird, 1996).
V. CONCLUDING REMARKS
Recent data show that the tax level in major industrialized countries is about double the tax level in African countries (i.e., 38 percent of GDP compared with 20 percent of GDP as reported in Table 4). There is, however, historical and casual evidence to suggest that the tax level currently achieved by many African countries is much higher than the tax level in some industrialized countries when they had the same level of income (Steinmo, 1993, and Palmade, 2005).22 Moreover, considering that about one half of African GDP is accounted for by the informal and subsistence sectors, a tax level of 20 percent of GDP means about 40 percent of formal sector GDP. 21 This type of tax is also called an inflow-outflow tax, a consumed income tax, an individual cash flow tax, or an expenditure tax.
22 Steinmo (1993) presents historical data showing that the tax level of many industrialized countries, including Sweden, did not reach 15 percent of GDP until World War II, when incomes were substantially higher than they are currently in many African countries.

- 23 -
Given the difficult local conditions marked by widespread poverty, large—and growing—informal sectors, and limited capacity in administrative organization, the achievement in terms of short-term tax revenue collection could be deemed as remarkable. Unfortunately, most evidence suggests that this achievement strongly affected productive investments, formal businesses, and especially small businesses. Indeed, the evidence shows that taxes and tax administrations are perceived by businesses as a major obstacle to investment. In Section II, we found that an observed tax level of 20 percent—on average across countries and over time—is only about 1 percent lower than the growth-breaking tax level but indicates that current tax systems are distorting productive investments and hindering growth. We also found that compensating the reduction in trade taxes—induced by globalization—through consumption taxes is expected to have a net negative impact on economic growth but then qualified that such a negative impact may actually result form coercive collection by inefficient tax administrations. Finally, this macro-based evidence was corroborated by micro-based evidence using METR which indicate that taxes create heavy burdens and high distortions on formal businesses. As a consequence, African tax systems suffer from a deficit of voluntary compliance. In Section III, we found that the key to improve voluntary compliance—besides implementing a complete functional reorganization of tax administrations with LTUs—is to improve taxpayers’ literacy and control corruption. Also, in Section IV, we provided a context to describe ways—including a flat tax system—to foster voluntary compliance with a central role for businesses as tax withholding agents. African countries attempting to become fully integrated in the global economy will probably need to address business investors’ concerns with the tax system as a serious obstacle to productive investments, job creation, and economic growth. The logic rests on the widespread knowledge that increased economic growth will raise the level of business activity and the overall tax base, such that tax revenues can eventually increase in spite of falling trade taxes resulting from globalization. However, this dynamic cannot be achieved through quick-and-easy short-term fixes. Indeed, in Section II, we concluded that fundamental answers to globalization pressures on the tax mix and to low tax revenue collection in percentage of GDP—the tax level—is likely to rest on strategic and sustained promotion of formal business activities throughout African economies. Likewise, in Section III, we concluded that measures to correct the lack of efficiency in African tax administrations rest on strategic reorganization of these administrations, which would require time. This is the same time that would be required for the actual capital stock to converge toward the desired stock of capital stock, following the transition toward modern fiscal states. A call for outright expansion of income taxation is unlikely to succeed because there are many reasons—which include low level of income and limited administrative capacities, as well as political pressures and socio-ethnic conditions—why income taxes and property taxes have been neglected in many African countries. This call is difficult since it needs to confront that rarely would increasing income taxes be considered a viable option on the grounds of both tax policy—because of their negative impact on investment—and tax administration—because their revenue yield is less certain and less timely than that from consumption tax

- 24 -
changes (Tanzi and Zee, 2000). In addition, it is perfectly conceivable that political elites in power would prefer regressive consumption taxes on the arguable grounds that levels of income in the population are too low and administrative capacities too weak. Instead, calling for a transition toward modern fiscal states is likely to benefit labor productivity and the competitiveness of African businesses. In addition, this will enable the creation of more formal sector jobs, which should relieve the current pressure VAT exercises on the informal sector (Emran and Stiglitz, 2000), the excessive focus on compliance of a narrow base of existing large taxpayers (Gloppen and Rakner, 2002), and eventually contribute to expand broad-based taxation (Auriol and Warlters, 2005) and long-term growth (Tanzi and Zee, 1997).
Figure 1. Effect of Tax on Desired Capital Stock
Return to capital
K' KDesired amount of capital
Marginal product of capital (demand)
Global required return to capital (supply)
Rn (net return)
Rg (gross return)
Tax
Drop in capital stock
- 25 -
Figure 3. Evolution of Organizational Forms for Tax Administration
Function Focus
Registration
Accounting
Taxpayer Education
Collection
Audit
Appeals
Source: Ebrill and others (2001), Figure 12.1 p. 135, and minor changes.
Small Business
Taxpayers (SBT)
Individuals Taxpayers
Customs and Excises
Taxpayers FocusTax Focus
VAT TaxCorporate
Income Tax (CIT)
Personal Income Tax
Large Taxpayers' Unit (LTU)
Figure 2. Illustration of Construction of Best-Practice Frontier
0.0
1.0
2.0
3.0
4.0
5.0
6.0
22.0 23.0 24.0 25.0 26.0 27.0 28.0
Observed Tax Level
Rat
e of
Rea
l Eco
nom
ic G
row
th
1993
1996
2001
1985

- 26 -
Table 1. Average Growth and Components of Tax Structure
Number of obs.
Country Freq. Mean Std. Dev. Mean Std. Dev. Mean Std. Dev. Mean Std. Dev.
Algeria 18 3.45 1.67 7.51 2.41 19.64 4.63 10.84 4.89Angola 15 5.81 3.86 4.18 1.36 9.01 6.45 74.32 20.84Benin 14 4.84 0.90 48.58 8.92 15.68 3.01 25.55 3.74Botswana 6 11.37 4.57 14.81 3.76 57.32 5.35 8.75 1.82Burkina Faso 13 4.43 2.68 29.19 12.32 34.00 14.72 22.43 2.57Burundi 15 4.33 3.57 24.62 5.64 36.36 6.34 22.55 4.41Cameroon 11 5.08 1.32 15.85 2.53 37.88 15.88 22.84 15.72Cape Verde 16 4.57 2.07 42.13 4.33 7.81 4.24 25.69 4.97Central African Rep. 8 3.73 2.25 37.86 4.23 32.74 2.98 20.46 3.07Chad 12 7.63 4.14 25.34 6.79 21.08 4.59 31.08 9.16Comoros 11 3.33 2.06 43.37 11.12 26.52 15.06 15.40 3.88Congo, Republic of 11 3.60 2.12 13.89 6.01 22.29 3.96 58.75 12.31Côte d'Ivoire 11 3.20 2.77 35.73 2.88 26.11 3.82 20.77 3.17Egypt 17 4.33 1.35 12.69 1.52 25.54 4.64 22.10 2.46Equatorial Guinea 10 21.83 21.37 12.41 10.65 10.15 8.12 55.93 22.96Eritrea 10 6.94 6.70 34.21 15.11 25.43 11.26 49.46 20.94Ethiopia 15 6.46 4.25 24.59 5.27 18.35 3.79 26.26 3.19Gabon 12 3.70 2.10 19.79 2.08 10.14 3.62 12.37 1.56Ghana 17 4.46 0.67 26.58 7.91 35.94 5.86 23.19 5.72Guinea 17 3.93 1.47 13.65 4.39 32.33 12.67 7.77 4.04Guinea-Bissau 10 4.72 2.92 12.47 3.05 42.78 10.09 7.18 0.78Kenya 11 2.01 1.26 24.10 8.81 26.46 8.33 32.34 3.01Lesotho 19 4.95 3.15 51.51 6.10 16.25 4.12 15.91 3.78Madagascar 17 3.33 2.20 44.38 8.46 23.97 3.48 14.14 2.86Malawi 9 5.90 4.77 16.65 5.46 33.65 3.08 38.00 3.47Mali 16 5.82 3.37 41.73 9.23 24.25 6.06 15.94 2.76Mauritania 16 4.03 2.03 23.40 11.78 21.13 7.33 23.67 5.67Mauritius 23 5.41 1.66 42.44 10.72 27.60 9.02 18.59 2.25Morocco 16 6.11 3.56 16.47 3.82 41.24 3.93 24.86 3.02Mozambique 18 7.18 3.96 17.87 4.52 48.38 6.37 17.80 3.25Niger 15 4.31 2.90 42.35 6.89 18.32 3.37 25.65 4.14Nigeria 7 3.60 3.30 9.66 2.57 6.97 4.07 19.95 5.37Rwanda 13 9.35 8.51 29.87 13.74 41.52 7.79 25.32 4.64São Tomé & Príncipe 14 2.36 1.18 29.89 6.84 28.78 8.39 18.60 8.19Senegal 10 4.77 1.57 21.83 5.24 50.14 6.90 21.81 0.73Seychelles 10 5.54 3.40 42.43 10.20 10.03 8.56 21.68 3.61South Africa 17 3.22 1.93 3.85 1.34 34.36 1.92 54.84 6.36Sudan 11 5.56 1.60 27.70 13.34 15.22 5.76 16.60 8.95Tanzania 15 4.05 2.17 26.68 8.13 24.00 4.01 32.37 5.16Togo 9 7.34 4.70 39.56 3.72 15.34 5.74 31.13 7.40Tunisia 21 4.93 2.05 13.16 3.35 37.25 5.56 25.55 11.93Uganda 18 6.14 2.56 48.66 8.93 29.17 4.60 14.22 5.08Zambia 12 3.95 2.05 29.50 3.59 30.81 4.51 33.19 5.92
Africa 586 5.20 4.76 27.01 15.32 26.78 12.94 25.26 15.66
Source: IMF’s World Economic Outlook, Economic Trends in Africa, September 2005.
Income Taxes (percentage of total
revenue)
Real GDP Growth (percentage)
Trade Taxes (percentage of total revenue)
Consumption Taxes (percentage of total
revenue)
- 27 -
Table 2. Performance Indicator (Theta)
Number of obs.
Country Freq. Mean Std. Dev.
Tanzania 15 0.93 0.06Botswana 6 0.93 0.07Mozambique 18 0.93 0.10Burundi 15 0.92 0.10South Africa 11 0.92 0.08Senegal 10 0.91 0.06Mauritius 23 0.91 0.07Congo, Republic of 11 0.90 0.09Rwanda 13 0.89 0.09Seychelles 17 0.89 0.11Zambia 12 0.88 0.07Egypt 17 0.88 0.12Niger 15 0.88 0.14Tunisia 21 0.88 0.11Central African Rep. 8 0.87 0.11Ethiopia 15 0.86 0.11Kenya 11 0.86 0.13Madagascar 17 0.85 0.12Algeria 18 0.85 0.13Togo 9 0.85 0.18Benin 14 0.84 0.16Morocco 16 0.82 0.11Malawi 9 0.81 0.12Angola 15 0.81 0.14Ghana 17 0.81 0.09Guinea 17 0.80 0.11Guinea-Bissau 10 0.80 0.15Sudan 14 0.79 0.14Burkina Faso 13 0.79 0.15Comoros 11 0.79 0.14Gabon 12 0.77 0.13São Tomé & Príncipe 10 0.77 0.15Uganda 18 0.77 0.19Chad 12 0.76 0.14Nigeria 7 0.74 0.26Equatorial Guinea 10 0.73 0.19Mauritania 16 0.73 0.14Cameroon 11 0.67 0.11Cape Verde 16 0.66 0.16Eritrea 10 0.65 0.23Mali 16 0.65 0.24Côte d'Ivoire 11 0.63 0.24Lesotho 19 0.54 0.27
Africa 586 0.81 0.17
Non-Tax Factors (Theta)

- 28 -
Table 3. Fixed-Effects Regression Results
Dependent variable: Rate of real GDP growth
Coef. Std. Err. t P>| t | [95% Conf.Interval]
Constant 23.04 2.48 9.28 0.000 18.17 27.92Level: ln(λ/θ) -7.37 0.88 -8.35 0.000 -9.11 -5.64Mix: ln(µ) -2.49 0.70 -3.58 0.000 -3.85 -1.12Level squared: [ln(λ/θ)]^2 0.19 0.11 1.74 0.083 -0.02 0.40Mix squared: [ln(µ)]^2 0.03 0.05 0.51 0.613 -0.07 0.13Interaction: [ln(λ/θ)]x[ln(µ)] 0.72 0.15 4.90 0.000 0.43 1.01
Fixed effects F(42, 538) = 11.27 0.000Regression F(5,538) = 77.86 0.000Within R-square = 0.42Number of observations = 586Number of countries = 43
Dependent variable: Rate of real GDP growth Coef. Std. Err. t P>| t | [95% Conf.Interval]
Constant 24.64 2.60 9.49 0.000 19.54 29.74Level: ln(λ/θ) -7.72 0.89 -8.67 0.000 -9.47 -5.97Mix: ln(µ) -2.03 0.72 -2.84 0.005 -3.44 -0.63Level squared: [ln(λ/θ)]^2 0.23 0.11 2.12 0.035 0.02 0.44Mix squared: [ln(µ)]^2 -0.05 0.06 -0.88 0.381 -0.16 0.06Interaction: [ln(λ/θ)]x[ln(µ)] 0.71 0.15 4.85 0.000 0.42 1.00ln(Income tax) -0.12 0.11 -1.15 0.249 -0.33 0.09ln(Consumption tax) -0.32 0.10 -3.06 0.002 -0.52 -0.11
Fixed effects F(42, 536) = 11.44 0.000Regression F(7,536) = 58.06 0.000Within R-square = 0.43Number of observations = 586Number of countries = 43

- 29 -
Table 4. Observed versus Growth-Breaking Tax Levels
Number of obs.
Country Freq. Mean Std. Dev. Mean Std. Dev. Difference of Means
Significant at 95 percent?
Botswana 6 47.3 3.9 36.0 1.1 11.3 YesAlgeria 18 34.7 5.1 23.6 2.0 11.1 YesNigeria 7 32.8 11.2 22.1 1.5 10.6 YesAngola 15 38.0 7.2 29.9 1.1 8.1 YesGabon 12 25.8 3.9 18.5 0.8 7.3 YesSeychelles 10 42.2 5.0 36.0 2.4 6.2 YesTunisia 21 29.1 1.5 24.3 1.9 4.8 YesLesotho 19 39.3 6.6 36.0 1.1 3.3 YesEgypt 17 25.6 2.6 23.3 0.9 2.3 YesCôte d'Ivoire 11 20.6 3.9 19.1 0.7 1.4 YesMauritania 16 25.1 4.4 21.2 2.5 3.9 NoCape Verde 16 19.8 3.7 17.1 1.7 2.7 NoKenya 11 24.6 3.9 21.9 2.6 2.7 NoMauritius 23 20.9 1.7 18.5 1.9 2.4 NoMali 16 18.9 14.7 18.0 1.0 0.9 NoMorocco 16 24.1 3.0 23.6 1.1 0.5 NoCongo, Republic of 11 25.8 2.9 25.4 2.5 0.4 NoEritrea 10 19.6 7.4 21.2 0.8 -1.6 YesZambia 12 19.2 2.1 21.2 0.7 -1.9 YesEthiopia 15 18.0 2.5 20.5 1.3 -2.5 NoTogo 9 16.2 4.3 18.7 0.6 -2.5 YesSão Tomé & Príncipe 14 16.7 3.0 19.9 0.6 -3.2 YesBenin 14 13.6 3.5 17.4 0.6 -3.9 YesComoros 11 13.8 2.1 17.9 2.1 -4.1 NoGhana 17 17.1 2.6 21.4 1.4 -4.2 YesBurundi 15 16.9 2.7 21.6 1.3 -4.6 YesEquatorial Guinea 10 21.4 6.4 26.1 4.3 -4.7 NoSenegal 10 17.3 1.3 22.9 1.4 -5.6 YesMadagascar 17 11.7 1.9 17.5 0.8 -5.8 YesSouth Africa 17 24.7 2.7 30.5 1.1 -5.8 YesCameroon 11 17.5 2.8 23.3 0.8 -5.9 YesMalawi 9 17.8 2.3 24.0 1.5 -6.2 YesUganda 18 8.9 2.5 17.6 1.5 -8.7 YesSudan 11 10.1 3.4 18.9 1.2 -8.8 YesTanzania 15 12.2 1.6 21.2 1.3 -9.0 YesNiger 15 9.2 1.6 18.3 0.9 -9.1 YesBurkina Faso 13 11.6 1.0 20.8 2.8 -9.2 YesGuinea 17 12.3 1.9 22.1 1.0 -9.8 YesCentral African Rep. 8 8.9 1.2 19.4 0.8 -10.6 YesGuinea-Bissau 10 12.6 2.3 23.6 0.7 -11.0 YesMozambique 18 12.4 1.5 23.4 1.1 -11.0 YesRwanda 13 10.4 1.6 21.6 2.3 -11.2 YesChad 12 7.1 1.8 21.0 1.2 -13.9 Yes
Total 586 20.2 9.9 21.2 3.6 -1.1
Growth Breaking Tax Level (percentage of GDP)
Observed Tax Level (percentage of GDP)
Observed minus Growth Breaking Tax Level

- 30 -
Table 5. Regression Results for Tax Administration Efficiency
Dependent variable: VAT Revenue to Aggregate Private Consumption Ratio
Coef. Std. Err. t P>| t | [95% Conf.Interval]
Constant 0.38 0.47 0.81 0.417 -0.54 1.30Statutory 0.36 0.03 10.70 0.000 0.29 0.42Africa dummy -0.77 0.32 -2.42 0.016 -1.39 -0.15
Regression F(2, 327) = 9.22 0.000Adjusted R-square = 0.12Number of observations = 330Number of countries = 29
Dependent variable: VAT Revenue to Aggregate Private Consumption Ratio
Coef. Std. Err. t P>| t | [95% Conf.Interval]
Constant -1.56 1.95 -0.80 0.424 -5.40 2.28Statutory 0.26 0.05 5.42 0.000 0.17 0.36Income 0.10 0.07 1.39 0.166 -0.04 0.24Literacy 0.08 0.01 5.21 0.000 0.05 0.10Corruption -0.06 0.01 -5.55 0.000 -0.08 -0.04Africa dummy 0.87 0.55 1.57 0.118 -0.22 1.96
Regression F(5, 324) = 24.83Adjusted R-square = 0.27Number of observations = 330Number of countries = 29

- 31 -
Table 6. Fixed Effects Regression Results with Corruption
Dependent variable: Rate of real GDP growth
Coef. Std. Err. t P>| t | [95% Conf.Interval]
Constant 14.41 2.60 5.55 0.000 19.54 29.74Level: ln(λ/θ) -7.18 0.89 -8.07 0.000 -9.47 -5.97Mix: ln(µ) -2.32 0.72 -3.24 0.006 -3.44 -0.63Level squared: [ln(λ/θ)]^2 0.29 0.11 2.67 0.039 0.02 0.44Mix squared: [ln(µ)]^2 -0.10 0.06 -1.70 0.124 -0.16 0.06Interaction: [ln(λ/θ)]x[ln(µ)] 0.79 0.15 5.39 0.000 0.42 1.00ln(Income tax) -0.02 0.13 -0.17 0.867 -0.29 0.24ln(Consumption tax) -0.32 0.14 -2.32 0.021 -0.59 -0.05
Fixed-effects F(28, 309) = 9.88 0.000Regression F(7,309) = 41.01 0.000Within R-square = 0.48Number of observations = 345Number of countries = 29
Dependent variable: Rate of real GDP growth Coef. Std. Err. t P>| t | [95% Conf.Interval]
Constant 14.10 2.60 5.43 0.000 19.54 29.74Level: ln(λ/θ) -7.22 0.89 -8.11 0.000 -9.47 -5.97Mix: ln(µ) -1.56 0.72 -2.18 0.016 -3.44 -0.63Level squared: [ln(λ/θ)]^2 0.36 0.11 3.35 0.022 0.02 0.44Mix squared: [ln(µ)]^2 -0.10 0.06 -1.70 0.124 -0.16 0.06Interaction: [ln(λ/θ)]x[ln(µ)] 0.65 0.15 4.42 0.000 0.42 1.00ln(Income tax) -0.08 0.13 -0.59 0.557 -0.34 0.19ln(Consumption tax) -0.16 0.15 -1.05 0.296 -0.46 0.14ln(Cons. tax) x Corruption -0.04 0.02 -2.48 0.014 -0.01 0.00
Fixed-effects F(28, 308) = 9.94 0.000Regression F(8,308) = 37.25 0.000Within R-square = 0.49Number of observations = 345Number of countries = 29

- 32 -
Table 7. Share of Countries where Businesses Report Tax as Key Obstacle
Biggest Obstacle (percentage)
Among Top Three Obstacles
(percentage)
Among Top Five Obstacles
(percentage)
All countries 18 56 82
Upper-middle-income 40 90 100Lower-middle- income 12 35 71Lower-income 11 56 83
Sub-Saharan Africa 33 67 83Eastern Europe & Central Asia 14 62 86Latin America 50 50 50Asia 14 29 71
Note: Reports share of countries where firms rank tax rates as a top constraint in a list of 18 possible obstacles.Source: Table 5.1, p. 107 in World Development Report (2005) based on World Bank Investment Climate Surveys.

- 33 -
Tabl
e 8.
Sum
mar
y M
argi
nal E
ffec
tive
Tax
Rat
e (M
ETR
) on
Cap
ital
Sout
h A
fric
aM
alaw
iR
wan
daTa
nzan
iaZi
mba
bwe
Ave
rage
Var
ianc
e
Agr
icul
ture
Mac
hine
ry22
.617
.311
.930
.36.
617
.784
.9B
uild
ings
-12.
40.
916
.3-4
6.5
-10.
471
5.9
Land
32.0
-2.2
4.5
8.7
-39.
70.
767
4.7
Inve
ntor
ies
40.5
18.9
24.1
27.5
56.4
33.5
227.
7To
uris
mM
achi
nery
25.1
7.2
-11.
1-3
.8-2
.43.
019
5.1
Bui
ldin
gs29
.8-1
2.4
-1.3
20.5
-46.
5-2
.090
1.6
Land
32.0
-2.2
7.5
1.6
-39.
7-0
.266
5.9
Inve
ntor
ies
43.3
22.7
51.6
21.9
58.5
39.6
278.
5M
anuf
actu
ring
Mac
hine
ry25
.17.
2-1
1.1
3.8
-2.4
4.5
180.
8B
uild
ings
29.8
-12.
4-1
.327
.7-4
6.5
-0.5
992.
9La
nd32
.0-2
.27.
51.
6-3
9.7
-0.2
665.
9In
vent
orie
s43
.318
.949
.221
.956
.437
.927
9.0
Fina
ncia
l Sec
tor
Mac
hine
ry44
.27.
529
.963
.820
.633
.247
1.9
Bui
ldin
gs29
.816
.2-0
.917
.4-2
7.6
7.0
493.
1La
nd32
.018
.69.
71.
3-3
9.7
4.4
736.
5In
vent
orie
s40
.543
.959
.521
.756
.444
.422
5.7
Ave
rage
33.5
8.4
14.4
17.6
-4.7
Var
ianc
e51
.023
7.9
493.
027
1.0
1775
.9
Sour
ce: D
etai
led
coun
try st
udie
s by
Fore
ign
Inve
stm
ent A
dvis
ory
Serv
ice
(FIA
S) a
t Int
erna
tiona
l Fin
ance
Cor
pora
tion
(IFC
) / W
orld
Ban
k

- 34 -
References
Auriol, Emmanuelle, and Michael Warlters, 2005, “Taxation Base in Developing Countries,” Journal of Public Economics, Vol. 89, No. 4, pp. 625-46.
Barbour, Paul A., and Richard E. Stern, 2005, “Designing a Small Business Tax System that
Enhances Growth: Lesson from Africa,” Foreign Investment Advisory Service (Washington: The World Bank).
Bird, Richard M., 1996, “Why Tax Corporations?” Technical Committee on Business Taxation,
Working Paper 96-2 (Ottawa: Technical Committee on Business Taxation). ______, and Sally Wallace, 2003, “Is It Really So Hard to Tax the Hard-to-Tax? The Context and
Role of Presumptive Taxes,” International Tax Program, Paper 0307 (Toronto: Institute for International Business).
Branson, Johannah, and C. A. Knox Lovell, 2001, “A Growth Maximizing Tax Structure for New
Zealand,” International Tax and Public Finance, No. 8, pp. 129-46. Charnes, A., W. W. Cooper, A.Y. Lewin, and Rhodes, 1978, “Measuring the Efficiency of Decision
Making Units,” European Journal of Operations Research, Vol. 2, No. 6, pp. 429-44. Charnes, A., W. W. Cooper, A.Y. Lewin, and L. M. Seiford, 1994, “Data Development Analysis:
Theory, Methodology, and Applications” (Boston: Kluwer Academic Publishers). Curtis, Stephen, and Jean-Francois Ruhashyankiko, 2005, “U.S. Multinational Corporations: Has
Voluntary Compliance Increased?” Draft (Washington: International Monetary Fund). Ebrill, Liam, Michael Keen, Jean-Paul Bodin, and Victoria Summers, 2001, “The Modern VAT”
(Washington: International Monetary Fund). Emran, Shahe M., and Joseph E. Stiglitz, 2000, “VAT versus Trade Taxes: The (In)efficiency of
Indirect Tax Reform in Developing Countries,” Draft (Washington: The Brookings Institution and Stanford University).
______, 2005, “On Selective Indirect Tax Reform in Developing Countries,” Journal of Public
Economics, Vol. 89, pp. 599-623. Entin, Stephen J., 2004, “Tax Incidence, Tax Burden, and Tax Shifting: Who Really Pays the Tax?”
Center for Data Analysis, Report CDA04-12 (Washington: The Heritage Foundation). Engen, Eric, and Jonathan Skinner, 1996, “Taxation and Economic Growth,” National Tax Journal,
Vol. 49, No. 4, pp. 617-42.

- 35 -
Fjeldstad, Odd-Helge, and Lise Rakner, 2003, “Taxation and Tax Reform in Developing Countries:
Illustrations from sub-Saharan Africa,” CMI Report, R2003:6 (Norway: Chr. Michelsen Institute).
Gill, Jit B., 2000, “A Diagnostic Framework for Revenue Administration,” World Bank Technical
Paper No. 472 (Washington: The World Bank). Gravelle, Jane G., 1994, “The Economic Effects of Taxing Capital Income” (Cambridge: MIT
Press). Gloppen, Siri, and Lise Rakner, 2002, “Accountability Though Tax Reform: Reflection from sub-
Saharan Africa,” IDS Bulletin, Vol. 33 , No. 3, pp. 30-40. Hall, Robert, and Alvin E. Rabushka, 1995, “The Flat Tax” (Stanford: Hoover Institution Press). Keen, Michael, and Jenny E. Ligthart, 2002, “Coordinating Tariff Reduction and Domestic Tax
Reform,” Journal of International Economics, Vol. 56, pp. 489-507. McCarten, William, 2003, “The Role of Organizational Design in the Revenue Strategies of
Developing Countries: Benchmarking with VAT Performance,” Draft (Washington: The World Bank).
______, 2004, “Focusing on the Few: The Role of Large Taxpayer Units in the
Revenue Strategies of Developing Countries,” Second Draft (Washington: The World Bank). McKenzie, Kenneth J., Mario Mansour, and Arine Brûlé, 1998, “The Calculation of Marginal
Effective Tax Rates,” Technical Committee on Business Taxation, Working Paper 98-15 (Ottawa: Technical Committee on Business Taxation).
O’Donnell, Gus, 2004, “Review of the Revenue Departments,” Report (London: United Kingdom
Treasury). Palmade, Vincent, 2005, “Industry Level Analysis: The Way to Indentify the Binding Constraints to
Economic Growth,” Policy Research Working Paper 3551 (Washington: The World Bank). Robbins, Gary, and Aldona Robbins, 1992, “Capital Taxes and Growth,” NCPA Policy Report No.
169 (Washington: National Center for Policy Analysis). Soos, Piroska E., 1998, “The Origins of Taxation at Source in England” (Amsterdam: International
Bureau of Fiscal Documentation Publications). Steinmo, Sven, 1993, “Taxation and Democracy: Swedish, British and American Approaches to
Financing the Modern State” (New Haven: Yale University Press).

- 36 -
Tanzi, Vito, and Howell Zee, 1997, “Fiscal Policy and Long-Run Growth,” IMF Staff Papers, Vol. 44, No. 2, pp. 179-209.
______, 2000, “Tax Policy for Emerging Markets,” IMF Working Paper 00-35 (Washington:
International Monetary Fund). Thisen, Jean K., 2003, “Fiscal Policy and Growth in Africa: Fiscal Federalism, Decentralization and
Incidence of Taxation,” Ad-hoc Expert Group Meeting (Addis Ababa: Economic Commission for Africa).
World Development Report, 2005, “A Better Investment Climate for Everyone” (Washington: The
World Bank).

Incentive Structure of Tax Systems in Africabased on a paper by Ruhashyankiko and Stern (2006)
Realizing the Potential for Profitable Investment in AfricaHigh-Level Seminar organized
by the IMF Institute and the Joint Africa InstituteTunis, Tunisia, February 28 – March 1, 2006
presented by Jean-Francois Ruhashyankiko
The views expressed in this paper are those of the authors and should not be attributed to the International Monetary Fund or the World Bank, their Executive Boards, or their managements.

Incentive Structure of Tax Systems in Africa 2
Anecdote on Globalization
U.S. history from circa 1600 to WWI:About 300 years of current account deficits;Supported by massive inflows of population and capital from Europe, Africa, and Asia“Much of the investment in the early U.S. canals, railroads, and industry was financed by foreigners.” (Entin, 2004, p.17)
Solution to turn CA deficits into surpluses? Import gold (not treated as a commodity back then...)
Globalization is not new but the world has changed; new solutions?Foreign aidAttract foreign investments (direct or portfolio)Mobilize domestic savings and channel it to productive investments
0CA S I= − <
Domestictax systemscould help

Incentive Structure of Tax Systems in Africa 3
Tax Systems Reforms in Africa
Colonial tax systems remained largely unchanged until the fiscalcrises of the 1980s in Africa
Next decades saw many reforms:Introduction of value-added tax (VAT)Lower and broader personal and corporate income taxesSimplification of tax bracketsRevision of excise taxesReductions of import dutiesEliminations of export taxes
Same reforms as those recommended for industrialized countries... despite important differences in investment climate and economicconditions, not to mention differences in cultural and social backgrounds

Incentive Structure of Tax Systems in Africa 4
Outcome of Recent Reforms: Great Achievement
Current tax level: 38 percent of GDP in industrialized countries compared to 20 percent (on average) in Africa
However, current tax level in Africa is much higher than tax level in industrialized countries when they had the same income per capita
Moreover, 20 percent of GDP with a 50 percent share of informal and subsistence economy means an actual tax level of 40 percent!
How can that be achieved?
Especially given difficult local conditions marked by:Widespread povertyLarge (and growing) informal sectorsLimited capacity in administrative organization

Incentive Structure of Tax Systems in Africa 5
Preview of the fundamental problem:Tax systems are designed to collect short-term revenues rather than to pursue long-term developmental objectives
Preview of the fundamental problem:Tax systems are designed to collect short-term revenues rather than to pursue long-term developmental objectives
Great but Painful Achievement
1a. Taxes are among top obstacles to investments1b. Taxes create distortions on productive investments
2a. Coercive tax law enforcement by corrupt tax administrations2b. Deadweight losses due to inefficient tax administrations
3a. Taxes create heavy burdens/distortions on formal businesses3b. Taxes create heavy burdens/distortions on small businesses

Incentive Structure of Tax Systems in Africa 6
1a. Top Obstacles to Investments
Investment Climate Surveys list 18 potential obstacles to investment; taxes and tax administrations are always among the highest obstacles, especially (but not only) in Africa...
Biggest Obstacle (percentage)
Among Top Three Obstacles
(percentage)
Among Top Five Obstacles
(percentage)
All countries 18 56 82
Sub-Saharan Africa 33 67 83Eastern Europe & Central Asia 14 62 86Latin America 50 50 50Asia 14 29 71
Original source: Table 5.1 p. 107 in World Development Report (2005).Source: Table 7 in Ruhashyankiko and Stern (2006).

Incentive Structure of Tax Systems in Africa 7
1b. Distortions on Productive Investments
After isolating non-tax factors that determine economic growth, high tax levels and especially trade taxes hinder economic growth
Reductions in trade taxes compensated by increases in consumption taxes appearto hinder economic growth...
Dependent variable: Rate of real GDP growth
Coef. Std. Err. P>| t |
Constant 23.04 2.48 0.000Adj. Tax level -7.37 0.88 0.000Trade tax -2.49 0.70 0.000
Within R-square = 0.42Number of observations = 586Number of countries = 43
Source: Table 3 in Ruhashyankiko and Stern (2006).
Dependent variable: Rate of real GDP growth
Coef. Std. Err. P>| t |
Constant 24.64 2.60 0.000Adj. Tax level -7.72 0.89 0.000Trade tax -2.03 0.72 0.005Income tax -0.12 0.11 0.249Consumption tax -0.32 0.10 0.002
Within R-square = 0.43Number of observations = 586Number of countries = 43
Source: Table 3 in Ruhashyankiko and Stern (2006).

Incentive Structure of Tax Systems in Africa 8
2a. Corrupt Tax Administrations
Increases in consumption taxes hinder economic growth when such taxes are collected by corrupt tax administrations
Dependent variable: Rate of real GDP growth
Coef. Std. Err. P>| t |
Constant 14.41 2.60 0.000Adj. Tax level -7.18 0.89 0.000Trade tax -2.32 0.72 0.006Income tax -0.02 0.13 0.867Consumption tax -0.32 0.14 0.021
Within R-square = 0.48Number of observations = 345Number of countries = 29
Source: Table 6 in Ruhashyankiko and Stern (2006).
Dependent variable: Rate of real GDP growth
Coef. Std. Err. P>| t |
Constant 14.10 2.60 0.000Adj. Tax level -7.22 0.89 0.000Trade tax -1.56 0.72 0.016Income tax -0.08 0.13 0.557Consumption tax -0.16 0.15 0.296Consumption tax x Corruption -0.04 0.02 0.014
Within R-square = 0.49Number of observations = 345Number of countries = 29
Source: Table 6 in Ruhashyankiko and Stern (2006).

Incentive Structure of Tax Systems in Africa 9
2b. Inefficient Tax Administrations
One way to measure efficiency of tax administrations is the ratio of VAT revenue to private consumption
African tax administrations appearless efficient...
But they are not necessarily less efficient compared to other developing countries once we controlfor:
Level of taxpayers’ literacyDegree of corruption
Dependent variable: VAT Revenue to Aggregate Private Consumption Ratio
Coef. Std. Err. P>| t |
Constant 0.38 0.47 0.417Statutory 0.36 0.03 0.000Africa dummy -0.77 0.32 0.016
Adjusted R-square = 0.12Number of observations = 330Number of countries = 29
Dependent variable: VAT Revenue to Aggregate Private Consumption Ratio
Coef. Std. Err. P>| t |
Constant -1.56 1.95 0.424Statutory 0.26 0.05 0.000Income 0.10 0.07 0.166Literacy 0.08 0.01 0.000Corruption -0.06 0.01 0.000Africa dummy 0.87 0.55 0.118
Adjusted R-square = 0.27Number of observations = 330Number of countries = 29
Source: Table 5 in Ruhashyankiko and Stern (2006).

Incentive Structure of Tax Systems in Africa 10
3a. Heavy Burdens/Distortions on Formal BusinessesSouth Africa Malawi Rwanda Tanzania Zimbabwe Average Variance
AgricultureMachinery 22.6 17.3 11.9 30.3 6.6 17.7 84.9Buildings -12.4 0.9 16.3 -46.5 -10.4 715.9Land 32.0 -2.2 4.5 8.7 -39.7 0.7 674.7Inventories 40.5 18.9 24.1 27.5 56.4 33.5 227.7
TourismMachinery 25.1 7.2 -11.1 -3.8 -2.4 3.0 195.1Buildings 29.8 -12.4 -1.3 20.5 -46.5 -2.0 901.6Land 32.0 -2.2 7.5 1.6 -39.7 -0.2 665.9Inventories 43.3 22.7 51.6 21.9 58.5 39.6 278.5
Manufacturing
Machinery 25.1 7.2 -11.1 3.8 -2.4 4.5 180.8Buildings 29.8 -12.4 -1.3 27.7 -46.5 -0.5 992.9Land 32.0 -2.2 7.5 1.6 -39.7 -0.2 665.9Inventories 43.3 18.9 49.2 21.9 56.4 37.9 279.0
Financial Sector
Machinery 44.2 7.5 29.9 63.8 20.6 33.2 471.9Buildings 29.8 16.2 -0.9 17.4 -27.6 7.0 493.1Land 32.0 18.6 9.7 1.3 -39.7 4.4 736.5Inventories 40.5 43.9 59.5 21.7 56.4 44.4 225.7
Average 33.5 8.4 14.4 17.6 -4.7Variance 51.0 237.9 493.0 271.0 1775.9
Original source: Detailed country studies by Foreign Investment Advisory Service (FIAS) at International Finance Corporation (IFC) / World Bank Group
Source: Table 8 in Ruhashyankiko and Stern (2006).
Marginal Effective Tax Rates (METR) (in percentage)
Averages gives an indication heavy burdens
Variances gives an indication of high distortions

Incentive Structure of Tax Systems in Africa 11
0.0
10.0
20.0
30.0
40.0
50.0
60.0
Singapore Canada South Africa EuropeanUnion
EasternEurope
NewZealand
Ex-SovietUnion
LatinAmerica
Middle East Asia (excl.Singapore)
Africa (excl.S. Africa)
3b. Heavy Burdens/Distortions on Small Businesses
Small businesses fail to claim/get credits/refundsValue-added tax actually a consumption tax affecting productive inputs
Small businesses fail to claim/get credits/refundsValue-added tax actually a consumption tax affecting productive inputs
Average VAT refunds 1998-2001 (percent of gross VAT collections)
Source: IMF survey responses, IMF staff estimates, and World Economic Outlook.

Incentive Structure of Tax Systems in Africa 12
Fundamental Problem
Fundamental problem:Tax systems are designed to collect short-term revenues rather than to pursue long-term developmental objectives
Consequence: African tax systems suffer from a deficit of voluntary compliance(voluntary compliance gives an indication of the extent to whichtaxpayers comply with tax laws and regulations and, more importantly, accurately report their income and deductions)
Strategies to promote voluntary compliance:A. Reorganizing the tax administrationB. Harnessing formal businessesC. Setting the objective straight
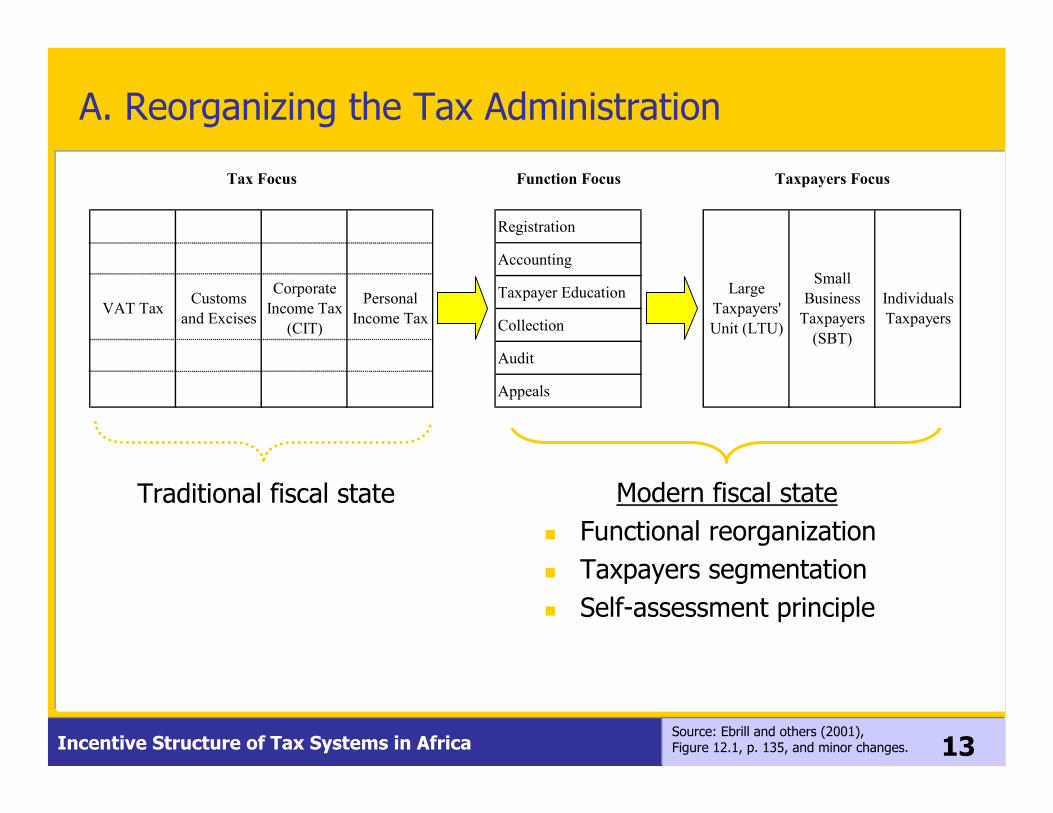
Incentive Structure of Tax Systems in Africa 13
A. Reorganizing the Tax Administration
Modern fiscal stateFunctional reorganizationTaxpayers segmentationSelf-assessment principle
Function Focus
Registration
Accounting
Taxpayer Education
Collection
Audit
Appeals
Small Business
Taxpayers (SBT)
Individuals Taxpayers
Customs and Excises
Taxpayers FocusTax Focus
VAT TaxCorporate
Income Tax (CIT)
Personal Income Tax
Large Taxpayers' Unit (LTU)
Traditional fiscal state
Source: Ebrill and others (2001), Figure 12.1, p. 135, and minor changes.

Incentive Structure of Tax Systems in Africa 14
B. Harnessing Formal Businesses
Pro-growth flat tax system
Adapted to local conditionLong-term developmentRely on businesses as withholding agentsConsumption taxes
Broad-basedLevied (withheld) on business and personal incomesProgressive with generous allowances for the poor and small businesses
Simple
African tax systems
Borrowed from outsideShort-term tax collectionAlienate businesses and deter voluntary complianceTrade taxes and VAT
Narrow-based Levied on goods and servicesRegressive
Distortionary corporate tax; inefficient/wasted tax incentives;... Distortionary imputed/presumptive regimes for small businessesComplex (even post-reform)

Incentive Structure of Tax Systems in Africa 15
C. Setting the objective straight
For modern fiscal states, businesses are sources of taxable income and information; businesses have a function equivalent to traditional custom barriers at the border
Businesses are key to promote formal jobs, foster economic growth, and reduce poverty
Ultimately, Africa’s competitiveness in the new global world depends on its businesses.
Long-term objective: Economic development
Neutraltax system
X
XGlobal competitors
Africanbusinesses