incentive-based approachesfor mitigatinggreenhouse gas emissions: issues and prospects for india
DESCRIPTION
Incentive-based Approaches for Mitigating Greenhouse Gas Emissions: Issues and Prospects for India Shreekant Gupta†TRANSCRIPT
WORKING PAPERS SERIESJULIAN SIMON CENTRE FOR POLICY RESEARCH
October 2002
Incentive-Based Approachesfor Mitigating
Greenhouse Gas Emissions
ISSUES AND PROSPECTS FOR INDIA
Shreekant Gupta
Liberty InstituteJ-259, Saket, New Delhi – 110 017
Tel: 91-11-6528244 Fax: 91-11-6532345Email: [email protected]: www.libertyindia.org

About the Author
Shreekant Gupta is Associate Professor (Reader) at the Delhi School of Economics, University of Delhi wherehe teaches and conducts research in environmental and natural resource economics. He has over fifteen years ofexperience in applied economic research and policy analysis, mainly on environmental issues such market-basedinstruments (MBIs), environmental valuation, climate change and poverty and environment linkages. He justcompleted a Fulbright Fellowship at the Massachusetts Institute of Technology where he worked on emissionstrading programs in the United States. He received his Ph.D in Economics from the University of Maryland atCollege Park, USA, in 1993. He also holds a Masters degree in economics from the Delhi School of Economics,University of Delhi.
He has served on several committees on the environment including the Task Force to Evaluate MBIs and theExpert Group on Kyoto Protocol Mechanisms, both set up by the Indian Ministry of Environment, and theEconomic Options Committee for the Montreal Protocol and the Expert Group on Environmental Impacts ofTrade Liberalization of the United Nations Environment Program (UNEP). His forthcoming books areEnvironmental Policy in India: The Political Economy of Social Choices (Edward Elgar 2002) and ClimateChange Economics and Policy: An Indian Perspective (Resources for the Future 2002). He has also beenconsultant and advisor to UNEP, Asian Development Bank, World Bank, ERM (UK), ICF, Chemonics, TataEnergy Research Institute, and the Center for Science and Environment. His extracurricular interest is curbingabuse of state power through public interest litigation.
© 2002 Shreekant Gupta
This paper was first published by the MIT Joint Progam on the Science and Policy of Global Change,Massachusetts, USA. Web site: !""#$%%&'()*+,%-./01.2!13-4%It will also be part of a forthcoming book India and Global Climate Change:Perspectives on Economics and Policy from a Developing Country (ed: Michael A. Toman, UjjayantChakravorty, Shreekant Gupta) to be published in July 2003, by Resourcs for the Future (RFF), USA.
The views expressed here are of the author and do not necessarily reflect those of Liberty Institute.
Published by Barun Mitra on behalf of Liberty Institute,E-6, Press Apartments, Patparganj, Delhi 110 092.

Incentive-based Approaches for Mitigating Greenhouse Gas Emissions:Issues and Prospects for India
Shreekant Gupta†
Abstract
As a consequence of the flexibility mechanisms incorporated in the Kyoto Protocol, incentive-basedpolicies such as emissions trading and the clean development mechanism are being widely discussedin the context of greenhouse gas (GHG) abatement. This paper examines various issues related toincentive-based approaches for India. Some of the specific questions it addresses are: does India standto gain or lose if emissions trading is realised even if it remains outside such an arrangement? Arethere any other incentive-based approaches, e.g., carbon taxes that India could adopt? In the ultimateanalysis, however, market-based instruments (MBIs) for GHG abatement in India cannot be viewed inisolation from an overall incentive-based orientation towards environmental policy as well as broadereconomic and legal reform that creates a suitable milieu for MBIs. Therefore, the paper goes on toexamine problems of implementing MBIs in general, particularly those related to monitoringof emissions and of enforcement. Several specific solutions are also proposed.
Contents
1. Introduction .................................................................................................................................12. The Context for Incentive-based Approaches............................................................................23. Incentive-based Approaches for Climate Change: Short-run and Long-run Issues .................4
3.1 Looking at the Short-run: CDM as an Incentive-based Policy..........................................53.2 Looking Beyond CDM: Equity and Tradable Permits ......................................................7
4. The Role and Potential for Economywide/Sectoral Policies in India .....................................114.1 Removal of Energy Subsidies...........................................................................................114.2 The Potential for Using Carbon Taxes .............................................................................14
5. Problems in Implementing MBIs in India and Possible Solutions..........................................165.1 Monitoring of Discharges: Conceptual Issues and Suggestions .....................................175.2 Monitoring and Enforcement Regime in India ................................................................185.3 Policy Barriers...................................................................................................................205.4 Institutional and Organizational Barriers .........................................................................215.5 Political and Cultural Barriers ..........................................................................................215.6 Possible Solutions .............................................................................................................225.7 Distributional Consequences of Market-based Instruments............................................22
6. Conclusions ...............................................................................................................................237. References .................................................................................................................................24
1. INTRODUCTION
As a consequence of the flexibility mechanisms incorporated in the Kyoto Protocol, incentive-based policies such as emissions trading and the clean development mechanism (CDM) are beingwidely discussed in the context of greenhouse gas (GHG) abatement. Whether developingcountries such as India will ratify the Protocol or not and whether they will eventually take partin a global emissions trading system is something that will only become clear as time passes. It isclear, however, that in either case these countries will be affected by any global architecture forGHG abatement that emerges.
† Department of Economics, Delhi School of Economics, University of Delhi, Delhi 110007, India; visiting scholar
with the MIT Joint Program on the Science and Policy of Global Change. E-mail: [email protected]

2
It is therefore important that the issues surrounding the use of incentive-based approachessuch as emissions trading are clearly understood and their implications for India are spelt out.Some of the specific questions that arise are: does India stand to gain or lose if emissions tradingbecomes a reality even if it remains outside such an arrangement? What are the terms underwhich it would be advantageous for India to take part in such trading? Are there any otherincentive-based approaches, e.g., carbon taxes that India can/should adopt, either as part of aninternational collective effort or suo moto?
The following section sets the context for incentive-based approaches for addressingenvironmental problems in general. It briefly describes these policies as well as the internationaland national mandate for their use in the Indian context. Section 3 focuses in particular onincentive-based policies in the context of climate change. It examines mechanisms in the short-run such as CDM, as well as policies that could play a role in the longer-term, e.g., emissionstrading. A key issue with respect to the latter is the initial allocation of permits and the potentialgains from trade that could accrue to India. Section 4 examines domestic actions that India couldundertake to complement an international agreement on GHGs. In particular, it focuses on thepossibility of using a domestic carbon tax and its synergistic effects with a global emissionstrading regime. Section 5 reviews problems in implementing incentive-based policies such astaxes and tradable permits in India in general and possible solutions. The final section concludes.It should be mentioned that this paper focuses on carbon dioxide emissions and does not addressother greenhouse gases such as methane.1
2. THE CONTEXT FOR INCENTIVE-BASED APPROACHES
Economists have advocated the use of incentive-based policies (IBPs) to addressenvironmental problems for over three decades. This advocacy is primarily on grounds ofcost-effectiveness.2 In other words, IBPs are a more cost-effective means of achieving a givenenvironmental quality than alternative approaches such as direct regulation of polluters.
Essentially, IBPs work through the market system to influence the behaviour of economicagents such as firms and households, by creating economic incentives/disincentives, which inturn affect the pollution or other environmental impacts generated by these agents. For thisreason IBPs are more commonly referred to as market-based instruments (MBIs).3 By contrast,the conventional approach to environmental regulation is through a set of “dos” and “don’ts”such as mandatory emission standards, equipment or process requirements. Thus, regulatorsattempt to determine both how much pollution is generated and also how it is abated.Occasionally these measures are combined with an outright ban or prohibition of activities thatare deemed to be detrimental to the environment. This approach allows little flexibility to theagents being regulated in complying with the regulations. Hence it is referred to as “commandand control” (CAC).
1 For an early attempt to address the issue of other GHGs using a multi-gas framework see Reilly et al. (1999).2 A policy is cost-effective if it achieves its objective at least-cost compared to alternative policies.3 A variety of terms has been used to describe MBIs. Some of these are “economic incentives,” “economic
instruments,” “economic approaches,” “market-oriented approaches,” “market-based incentives,” and “incentivemechanisms.”
3
MBIs can be broadly classified in two groups: price-based instruments and quantity-basedinstruments. While all of these instruments can be used to address a wide range of environmentalproblems, they are discussed below primarily in terms of their application to greenhouse gas(GHG) abatement. Within the first group, one can further differentiate between direct andindirect price-based instruments. The former induce generators of pollution to reduce pollutionby charging for the use environmental resources, e.g., air and water. Indirect price-basedinstruments on the other hand, increase (decrease) the prices of outputs and inputs that arecomplementary (substitutes) to the polluting activity. For example, a tax on petrol (or a subsidyto mass transit) is an indirect price-based instrument to address vehicular air pollution.4
Quantity-based instruments create transferable/saleable rights for the use of environmentalresources such as air and water, which are assigned/sold/auctioned to polluters. The majorinstrument in this category is marketable permits.5 Under this approach, a target level ofenvironmental quality is translated into the total amount of allowable emissions/effluent that canbe discharged. The regulator then allots/sells/auctions the right to discharge in the form of permitswhich can be bought and sold (i.e., traded), subject to an overall ceiling of allowable dischargeswhich has been fixed a priori. Given that this ceiling is less than the current aggregate level ofdischarges, there is a scarcity value to the permits and this puts an initial price on them. This pricewould increase over time as economic activity increases and more agents bid for the permits.6
In fact, Article 17 of the Kyoto Protocol specifically allows emissions trading among Annex B(mainly industrialised) countries as a means of fulfilling their commitment to reduce GHGemissions.7 As mentioned earlier, this proposal has attracted a huge amount of attention fromeconomists, policy makers and non-governmental organizations (NGOs). It is also possible that aglobal emission trading system may emerge in the long run that includes all nations and notsimply the industrialised ones. Emission trading is discussed in greater detail in Section 3 below.
Despite the longstanding advocacy by economists, it is only recently that MBIs have beenendorsed both by the international community and by the Indian government. Principle 16 of theRio Declaration on Environment and Development, which was adopted at the UN Conference onEnvironment and Development (UNCED) in 1992, and to which India is a signatory, states:
National authorities should endeavour to promote the internalisation of environmentalcosts and the use of economic instruments, taking into account the approach that thepolluter should, in principle, bear the cost of pollution, with due regard to the publicinterest and without distorting international trade and investment.
The action programme to implement this declaration (better known as Agenda 21) which hasbeen adopted by more than 178 nations including India, also reiterates this principle. In Chapter 8
4 From this example it will be clear that the effectiveness of indirect instruments crucially depends on the strength of
the linkage between the transactions to which it is applied and the environmental problem that the instrumentseeks to address.
5 Also known as tradable permits, tradable pollution permits, transferable permits, emissions permits, emissionstrading or pollution licenses.
6 It is important to note two additional aspects of tradable permits. Firstly, tradable permits are not a “license topollute,” as is sometimes argued: while purchase of permits does allow the buyer to discharge more, this ismatched by an equal reduction by another agent which has sold the permit, and thus forfeited its right todischarge by that amount. Secondly, if permits are designed so that they expire annually (or every few years) andhave to be repurchased, the regulator can even tighten ambient environmental standards over time by reducingthe amount of permits it sells each time.
7 This is sometimes also referred to as “cap and trade” since emission limits or quotas are allocated to Annex Bcountries which can then be traded.

4
it states “environmental law and regulation are important but cannot alone be expected to dealwith the problems of environment and development. Prices, markets and governmental fiscal andeconomic policies also play a complementary role in shaping attitudes and behaviour towards theenvironment” (para 8.27, emphasis added). The document goes on to cite the increasing use ofeconomic approaches not only in industrialised countries but also in Central and Eastern Europeand in developing countries. It further states “within a supportive international and nationaleconomic context and given the necessary legal and regulatory framework, economic and market-oriented approaches can in many cases enhance capacity to deal with the issues of environmentand development” (para 8.29).8 Finally, Agenda 21 also calls for more effective and widespreaduse of economic and market-oriented approaches to reinforce the synergy between environmentand development.
A few months before the Rio conference in 1992 the Government of India also came out witha Policy Statement for Abatement of Pollution that, inter alia, declared that market-basedapproaches would be considered in controlling pollution. It stated “economic instruments will beinvestigated to encourage the shift from curative to preventive measures, internalise the costs ofpollution and conserve resources, particularly water” (para 7.3). In particular, effluent chargesfor water pollution were singled out as an example of an economic instrument.
More recently, in 1995 the Ministry of Environment and Forests (MoEF) of the Governmentof India constituted a task force to evaluate MBIs for industrial pollution abatement. The taskforce submitted its report in January 1997. It recommended that MBIs such as taxes and permitsbe introduced at least on a pilot basis. There have been a number of government-sponsoredworkshops and meetings on MBIs since then and there are indications that some suchinstruments may be introduced in the near future.9
In sum, the underlying principle of MBIs (not specifically in the context of climate change)has been cautiously endorsed by the international community as well as by the Indiangovernment. As we see below, however, there are still a number of misgivings about MBIs bothin the context of GHG abatement and for overall environmental protection.10
3. INCENTIVE-BASED APPROACHES FOR CLIMATE CHANGE: Short-Run andLong-Run Issues
In the context of India, the clean development mechanism (CDM) proposed under Article 12of the Kyoto Protocol is the only policy that approximates an incentive-based approach in theshort-run (that is, during the ‘first’ commitment period 2008-2012).11 In the long-run (beyond2012), India might participate in GHG abatement through IBPs such as emissions trading. This,of course, would depend on a number of factors such as whether India accepted a cap on GHGemissions, how the permits were allocated, and so on. In this section, therefore, I examine issuesrelated to IBPs in the short- and long-term from India’s perspective.
8 Note the emphasis on the legal and regulatory framework as a prerequisite. I address this issue in Section 5 below.9 Remarks to this effect were made by the Special Secretary, Ministry of Environment and Forests (MoEF),
Government of India at the joint MoEF-USEPA workshop on “Market Mechanisms for Air Pollution Control,”New Delhi, March 12-13, 2002.
10 For recent surveys on the experience with MBIs (in the U.S. and internationally) see U.S. EPA (2001), Stavins(2001a, 2001b), and Huber (1998).
11 This is often refereed to as the ‘first’ commitment period though it is not clear as to when the next commitmentperiod will start and how long it will be. Thus, so far it is the only commitment period.
5
3.1 Looking at the Short-run: CDM as an Incentive-based Policy
CDM is the only Kyoto flexibility mechanism that explicitly attempts to engage developingcountries in international GHG abatement efforts.12 It is similar in nature to joint implementation(JI) except that JI takes place between developed (Annex B) countries, whereas CDM refers tocooperative agreements in which the host is a developing country (Karp and Liu, 2000).Specifically, under CDM developed countries (or firms in those countries) fund GHG abatementprojects in developing countries where abatement costs are much lower. In turn, the developedcountries receive credits (“certified emission reductions” or CERs) that can be used to offsettheir emission reduction obligations (see Toman, 2000, and Babu, 2002, for details).
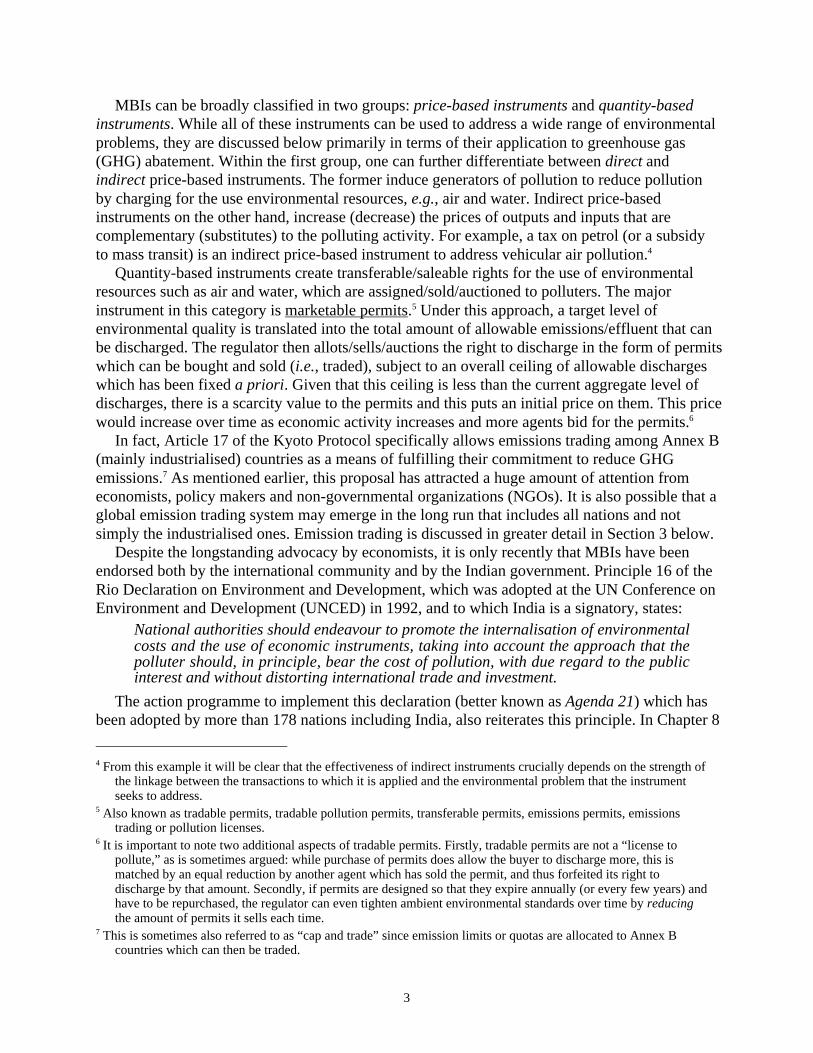
There are two issues relating to CDM that are important in the context of IBPs. First, it shouldbe noted that CDM will be implemented on a project-by-project basis-the basic rationale forundertaking a CDM project is the difference in marginal abatement costs (MACs) between thehost country and the Annex 1 country. However, the key feature of a market—a competitivelydetermined price—is missing under CDM. In a permit market even inframarginal units ofabatement are sold at the prevailing market price. Thus, in Figure 1 with maximum level ofunconstrained carbon emissions Ef, at price P* emissions reduction would EfE*, and the shadedarea to the left of Ef would be the surplus for a seller of permits from selling inframarginal unitsof abatement. Similarly, a buyer of permits (not shown) would also gain from buying permits atP*. Unlike permit markets with an observable price, division of gains from trade (the differencebetween MACs) will be an important issue for CDM projects. Some researchers have suggestedthat rather than receiving a competitive market price for emission reductions, developingcountries may simply be paid the actual cost of abatement, perhaps with some markup (Chander,2002). On the other hand, Babu et al. (2002) posit that the total gains from CDM as well as theshare of developing countries will depend on their relative bargaining power vis-à-vis developedcountries. This result holds whether CDM projects take place between individual firms acrosscountries or through bilateral negotiations between governments.
Figure 1. Surplus for a seller of permits
12 Joint implementation (formerly AIJ) and emissions trading being the other two. For an overview of Kyoto
flexibility mechanisms see Weiner (1999).

6
Thus, while a project-specific basis for defining and creating CERs under CDM does implybilateral transactions (betweens firms or governments), a situation where the host country isrequired to accept payment at its MAC (or a small markup over it) is only one of a set of possibleoutcomes. The actual outcome would depend to a considerable extent on how well CDM itselfis defined as an institution and how well market institutions (e.g., brokerage for secondarytransactions) evolve. It is for instance possible that developing countries produce CERs for theirown account and sell them at prevailing market prices into an active international exchangesystem. While bilateral exchange with monopsony by rich buyers is a possibility, also eminentlypossible is a situation in which a big CER supplier (like China) could act like a dominant firmmonopolist, especially if Russian “hot air” were constrained.
Though one would expect bargaining theory to shed light on this issue, unfortunately CDMdoes not lend itself to easy application of bargaining theory. For instance, in several bargainingmodels the outcome depends on relative bargaining power—a concept that is difficult tooperationalize. In non-cooperative bargaining in particular, the models hinge critically on theexact bargaining protocol. It is, therefore, difficult to apply them to real world situations such asCDM without knowledge of how actual bargaining will be implemented. Further, several of the‘clean’ theoretical results are based on two person bargaining, as also on the assumption of nocollusion, whereas CDM will involve many players and may have coalitions (e.g., E.U. countriesmight act as one). One should, however, mention here that some robust experimental regularitieshave been observed in bargaining games of which a fair (50-50) division is the most prominent.13
These empirical findings are contrary to what received theory predicts and only recently havethere been attempts to develop a positive theory of the 50-50 division of the gains from trade.14
This is useful to bear in mind in the context of CDM projects.The second issue vis-à-vis CDM as an IBP is that if developing countries were obliged to take
on emission reductions in the future, implementation of low cost abatement projects (the so-called low hanging fruit) now would leave them with higher cost options later. As Karp and Liu(2000), however, rightly point out the main problem with CDM is not that the most lucrativeprojects would be taken up first (as they should be) but the possibility that the host countryreceives inadequate compensation. The latter of course, is a function of the way CDM is set upas argued above. Thus, if host countries could create and bank their own CERs (if they thoughtthe current price was too low) this would solve the problem.15 More fundamentally, the questionfacing developing countries in this context is whether to cash in on CDM opportunities now or towait. In any event, it would perhaps be more desirable to have global emissions trading wheredeveloping countries such as India could sell their emission reductions at a competitive market
13 Most notable is Güth et al. (1982) who studied experimentally the two-player ultimatum game and found that the
average proposal by first-movers was roughly in the neighborhood of 60-40.14 See for instance Lopomo and Ok (2001).15 It is a moot point whether additional ‘low fruit’ opportunities would keep arising. This would happen only if
convergence of technologies between North and South did not occur. This (lack of convergence) seems unlikelyespecially with deregulation and globalization taking place in several economies in the South particularly Indiaand China. Most of the old technologies in the energy intensive sectors in the South (power and transport forexample) are being replaced by state of art technologies. Therefore, it seems more plausible to view the ‘lowfruit’ as a one time opportunity.

7
price. This is discussed in greater detail below. In passing, it should be noted that even ifcompetitive trade in emissions were not established, developing countries (other than energyexporters) would still benefit from the implementation of the Kyoto Protocol since internationalprices of fossil fuels would fall due to cuts in Annex B consumption (Babiker et al., 2000).This would facilitate faster economic growth in developing countries (Chander, 2002).
The prospects for CDM in the near-term, however, are uncertain due to several developmentspost-COP 5 (1999). These are, inter alia: (i) U.S. pullout from the Kyoto Protocol and(ii) granting of Article 3.4 sinks.16 While the first development reduces global demand for GHGabatement drastically, the granting of sinks (combined with Russian and Ukrainian hot air)relaxes the abatement targets substantially. If Russia and Ukraine did not exercise market power(e.g., cartelize), Annex B emissions in 2010 would actually increase by 9% over the 2000 leveland the carbon-equivalent price would fall to below $5 per ton C—in effect, not significantlydifferent from zero! 17 This is to be expected given a sharp drop in demand for abatement coupledwith a huge increase in supply (sinks and hot air). On the other hand, if Russia and Ukraine wereto cartelize in order to maximize revenue, Annex B emissions between 2000 and 2010 wouldroughly remain unchanged and the carbon-equivalent price would be around $25 per ton C(Babiker et al., 2002). In either event, despite fungibility of emission reductions under the Kyotoflexibility mechanisms, there do not appear to be many takers for CDM in the short-run.
3.2 Looking Beyond CDM: Equity and Tradable Permits
International negotiations to decide on the architecture of GHG abatement regime beyond2008-2012 will start in earnest by 2005. If India decided to accept a voluntary nationalcommitment (which is what it would need to do to participate in Article 17 emissions trading)the basis for establishing this commitment would be vital. In addition to the widely discussed(but unlikely) per capita criterion another possibility would be a ‘growth baseline.’18 It could alsoretain the option just to participate in project-based credit trading. In the long-run, however, therewould have to be some international consensus on allocation based on equity, howsoever thatwere defined. Cazorla and Toman (2000) provide a useful survey of various concepts of equityand how these concepts could be applied in the context of climate change. According to them,while the concept of equity can be interpreted in many ways, “any criteria that might be used todistribute current and future burdens of GHG mitigation must be based, explicitly or otherwise,on some concept of equity” (op. cit., p. 5, emphasis added). I return to this point later.
In the discussion below as an illustration I trace out the implications for India should it takepart in global emissions trading that meets the commitments by Annex B countries (see Table 1for Kyoto emission reduction targets). While this relates to the scenario prior to the US pullout
16 Under the Bonn and Marrakech agreements a total of about 70 MMtc of sinks have been allowed (see Babiker et
al., 2002, for details).17 These results are consistent with several other studies cited by Babiker et al. (2002).18 This is an approach to developing country emissions commitments that would not cap emissions in absolute terms
but would require countries to increase their GHGs emissions at a slower rate than their economies. In otherwords, emission intensity (the ratio of GHG emissions to gross domestic product) would decline—very muchlike the Clear Skies Initiative announced by President Bush in February this year.

8
Table 1. Emissions Levels Corresponding to Kyoto Commitments
USA JPN EEC OOE EET FSUNon-
Annex BCHN IND
Reference emissions1990 (Mton)
1362 298 822 318 266 891 2022 833 183
Reference emissions2010 (Mton)
1838 424 1064 472 395 763 4142 1792 486
Kyoto commitments/ 1990
93% 94% 92% 94.5% 104% 98% NA NA NA
Emissions target in2010 (Mton)
1267 280 756 301 273 873 4142 1792 486
Reduction/referenceemissions (Mton)
571 144 308 171 118 0 0 0 0
Reduction/referenceemissions (%)
31 34 29 36 30 0 0 0 0
“hot air” (Mton) 0 0 0 0 0 111 0 0 0
Source: Ellerman and others 1998, Table 1Annex B regions: USA, Japan (JPN), European Union (EEC), other OECD countries (OOE), Eastern Europe (EET), former Soviet
Union (FSU)
Non Annex B regions: China (CHN), India (IND), energy exporting countries (EEX), dynamic Asian economies (DAE), Brazil
(BRA), rest of world (ROW)—only selected Non-Annex B regions are shown in table.
from the Kyoto Protocol and before the developments at COP 7 at Marrakech in 2001,19 theexercise is nevertheless useful in highlighting the potential volume of permit trading and theresulting permit prices.
Likely prices of permits under alternative trading scenarios to implement Kyoto commitmentsare estimated using the Emissions Prediction and Policy Assessment (EPPA) model developed atMIT.20 Under full global trading, emissions trading would not be restricted to Annex B countries(as proposed under the Kyoto Protocol) but would include countries such as India and China.21
Since the latter have many more low-cost abatement options, the market price of permits wouldbe much lower ($24/ton of carbon) compared to $127/ton under Annex B trading only. The gainsfrom trade for India and China would be about $1.5 billion and $6 billion, respectively(Table 2). Moreover, the gains from trading worldwide would be $109 billion as compared to$66 billion from Annex B trading only.
19 Following the Kyoto Protocol at COP 3 in 1997, a three year negotiation under the Buenos Aires Plan of Action
(on the details needed for implementation) was launched by COP 4 (at Buenos Aires) in 1998. After the electionof President George Bush in November 2000, however, the United States withdrew from the pact with Bushcalling the treaty “deeply flawed.” Other countries/groups such as E.U., Japan and Canada pushed ahead andresumed negotiations at Bonn in July 2001 (COP 6 Part II). The so-called Marrakech Accords were agreed to atMarrakech (COP 7) in November 2001. See Babiker et al. (2002) for details.
20 This is a multi-sectoral, multi-regional, computable general equilibrium (CGE) model of global economic activity,energy use and carbon emissions. The model can be used to generate MAC curves for different regions andcountries which in turn are used to analyze various emissions trading scenarios. See Ellerman et al. (1998) fordetails.
21 Though the issue of allocation of quotas to these countries is not explicitly addressed, it is assumed that theiremissions will be as in the business as usual (BAU) scenario. This is consistent with other modeling exercises ofthis nature such as the MS-MRTS model and the G cubed model discussed below.

9
Table 2. World Emissions Trading
USA JPN EEC OOE EET FSU World CHN IND
Reductions / ref 2010(Mton)
182 12 73 59 52 101 1202 437 102
“hot air” (Mton) — — — — — 111 111 — —Permits market price
($/ton)24 24 24 24 24 24 24 24 24
Cost of abatement($billion)
1.66 0.14 0.71 0.41 0.43 0.81 11.15 4.22 0.95
Permits exp (–) / imp (+)(Mton)
390 132 234 112 66 –211 0 –437 –102
Flows exp (–) / imp (+)($billion)
9.27 3.15 5.57 2.67 1.57 –5.03 0.00–10.4
0–2.44
Total cost ($billion) 10.94 3.29 6.29 3.09 2.01 –4.22 11.15 –6.17 –1.49Gains from trade ($billion) 26.69 31.08 24.00 9.73 2.66 4.22 108.61 6.17 1.49
Source: Ellerman and others 1998, Table C
In this context, it is important to realise that India would not be the only player from the Southif global emissions trading to implement Kyoto were to emerge. In fact, since India’s emissionsare relatively small compared to those of China, the latter would have a much larger amount ofpermits to sell. Basically, three countries would account for the bulk of exports: China (47%),FSU (23%) and India (11%), for a total of 81% altogether (Ellerman et al., 1998). It is alsoimportant to note that compared to projected emission levels in 2010 of about 1790 million tonsand 490 million tons for China and India, respectively, the amount of permits sold by eachcountry would be much less—440 and 100 million tons, respectively (Tables 1 and 2).
Several other models such as the MS-MRT model and the G-cubed model also producebroadly similar results.22 In the MS-MRT model, under the global trading scenario, non-Annex 1countries assume an emissions target equal to their emissions under the no trading scenario(BAU). Similarly, in the G cubed model the allocation of permits to non-Annex 1 countries isconsistent with their baseline emissions. As with the EPPA model, permit prices are lower underfull global trading ($31 and $23 per ton, respectively) compared to restricted trading amongAnnex B countries only.
More generally, an allocation based on the per capita rule would give India permits in excessof its actual emissions much like Russian “hot air,” which would be a windfall, at least in theshort run.23 For instance, on the basis of the per capita criterion, India could potentially increase
22 The Multi-Sector Multi-Region Trade (MS-MRT) model is a dynamic, multi-region general equilibrium model
that is designed to study the effect of carbon restrictions on trade and economic welfare in different regions ofthe world. Unlike EPPA, China and India are grouped as one region in the model so it is not possible to look attheir trading activity separately. See Bernstein et al. (1999) for details. The G cubed model is also a multi-sector,multi-region intertemporal general equilibrium model of the world economy. See McKibbin et al. (1999) fordetails. These models are among 13 that were used to compare the outcomes of a set of post-Kyoto scenarios in aspecial issue of the Energy Journal (Weyant, 1999).
23 Of the Annex B countries, year 2010 emissions for Russia, Ukraine and the Baltic states (principal constituents ofthe former Soviet Union, FSU) are predicted to be below the aggregate level to which they committed at Kyoto.The difference between the FSU commitment (873 Mton) and predicted emissions (763 Mton) is known as “hotair” (111 Mton), a de facto right to emit (Ellerman et al., 1998). See also Table 1.

10
its emissions in 2010 by 722% over the 1990 level (Gupta and Bhandari, 1998, Table 6). Actualemissions, however, may not increase even three times over the same period (Table 1).24 Thiscreation of Indian “hot air” may not be acceptable internationally and some compromise may berequired.25
More important, the implications of technical progress for permit prices and for alternativeallocation criteria needs to be carefully thought through—diffused technical progress of the kindthat leads to a downward shift in the marginal abatement cost (MAC) curve of developingcountries, could actually lead to a fall in revenue for permit exporting countries (Bertram, 1996).This result is particularly true when quotas are allocated using the per capita rule that givesdeveloping countries such as India a large number of permits.
A downward shift in the MAC curve for developing countries has three effects which arerelevant to their gains and losses from technical progress for a given global emissions budget:(i) abatement costs fall which frees up resources for other uses, (ii) the volume of quotas sold bydeveloping countries to developed countries increases, and (iii) the world price of quota falls(Bertram, op. cit.). The first two effects represent gains for developing countries whereas thethird is a loss. The net result depends on the slopes of the MAC curves as well as the rule used toallocate quotas.
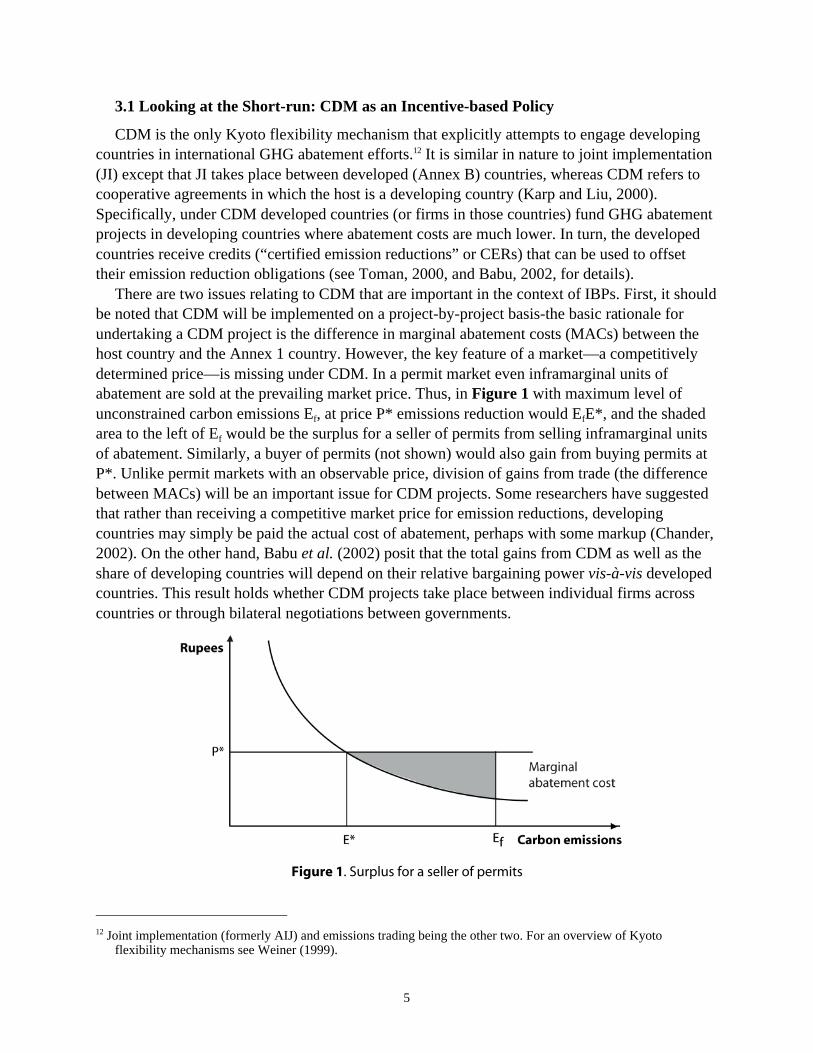
Figure 2 (cf. Bertram, op. cit., Fig. 1) depicts MAC curves for two regions—the industrialisedNorth and the developing South with the global emission budget fixed as the length of the
Figure 2. Technical progress and permit prices.
24 It should be noted that in calculating per capita entitlement in year t, population is not pegged at some reference
year but is taken at the actual level that prevails in year t. Thus, India with an increasing population gainsdisproportionately as compared to countries such as China that have stabilised their population. The “hot air”that India would acquire would be less if the reference population level were fixed at year 1990 or 2000.
25 It should also be noted that China’s emissions are projected to roughly double (from 833 Mton in 1990 to about1800 Mton in 2010). However, under the per capita criterion it can increase its emissions by 162% over the sameperiod (Gupta and Bhandari, op. cit., Table 6). Thus, it does not stand to gain as much by creation of “hot air”and may therefore be a less enthusiastic supporter of the per capita rule.
11
horizontal axis. Emissions in the North emissions are measured from ON and increase to the right.Thus, maximum unconstrained emissions for the North are ONN and its marginal abatement curve(MACN) is drawn sloping up from N. The South’s emissions are measured from OS and increaseto the left and its marginal abatement cost is MACS. Since aggregate business-as-usual emissions(ONN+OSS) would violate the global emission budget, under a tax or a permit system both regionswould move up their MAC curves to E with a corresponding emissions tax/permit price P*.
Technical progress, e.g., through CDM leads to a downward shift in the South’s MAC curve toMACS´. As Bertram shows, if the North’s MAC curve is sufficiently steep over the relevant range,then the decline in price of quotas will mean a fall in revenue of the South. For instance, the percapita rule would allocate ONB and OSB of quotas to the North and South, respectively. In theoriginal situation (before technical progress) the North would abate to point E and buy BA ofquota from the South paying a sum of BDEA. After technical progress, the North would abateless (to point G) and buy BF of quota from the South paying a sum of BKGF. Total revenue forthe South would fall since BDEA > BKGF (effectively, KDEL > ALGF).26 Further, if this fall inrevenue is greater than the reduction in the South’s abatement costs then the South will loseoverall from its own technical progress. He further shows that the slope of the North’s MAC curvevaries directly with the quota allocated to the South. In other words, with a liberal allocation rulesuch as the per capita rule the South could lose revenue due to technical progress.27
4. THE ROLE AND POTENTIAL FOR ECONOMYWIDE/SECTORAL POLICIES ININDIA TO REDUCE GHG EMISSIONS
If India were to undertake to sell emission reductions as indicated above, how could thesereductions be achieved efficiently? Again, rather than the project-by-project approach of CDM,it may be better to use an incentive-based approach such as a carbon tax and/or to remove energysubsidies. These steps would not only be more transparent but would also be more broad-basedin their impact. In addition, such measures would be easily verifiable and implementable. A keyissue of how to make these measures politically implementable is addressed below.
4.1 Removal of Energy Subsidies
Strictly speaking, this is not a tax since what is essentially proposed is the elimination of anegative tax, i.e., the subsidy.28 While one could view this as a sector-wide CDM project, there is
26 It can be easily verified that an alternate allocation rule such as OSS to the South (in effect covering the South’s
baseline emissions) would lead to less loss in revenue to the South from technical progress.27 “...with an exogenously set global budget allocated by the per capita rule with a consequent large redistribution of
global permanent income towards the South, inhabitants of the South would lose from technical progresswherever in the world it takes place” (Bertram, op. cit., p. 480, emphasis added). It is important to note that as apermit exporter the South would also be a net loser from technical progress in the North alone or from uniformlydiffused technical progress. Thus, given the possibility of technical progress it would be better for the South toopt for a more conservative quota allocation rule such as one that covers its business-as-usual emissions—that is,a NRFTS (no-regrets for-the-South) rule.
28 Subsidy is defined as the difference between domestic fossil fuel prices and their (private) opportunity costevaluated at end-user prices. When fuels are traded internationally border prices serve as opportunity cost,which is the case for petroleum products. In this case end-user opportunity cost would be border prices plus adistribution markup.

12
an ongoing debate about whether something like this would be eligible for CDM credit, that is,whether it would be “additional” enough. The same issues are also likely to come up innegotiating a national growth baseline.
It is true that these subsidies have been declining—during the first half of 1990s total fossilfuel subsidies in 14 developing countries declined by 45%. During the same period, OECDsubsidies declined by 21% (Reid and Goldemberg, 1998). In India, with the dismantling of theAdministered Price Mechanism (APM) for petroleum products and ongoing economic reforms,these subsidies are set to decline even further. In general, energy price reforms in developingcountries should be acknowledged as positive steps towards addressing climate change (op. cit.).There is, however, still a long way to go—the International Energy Agency estimates that ineight largest energy producing countries outside the OECD (China, India, Indonesia, Iran,Kazakhstan, Russia, South Africa and Venezuela), end-use energy prices are about 20% belowtheir opportunity cost (Fischer and Toman, 2000). Larsen (1994) estimated world fossil fuel(coal, natural gas and petroleum) subsidies in the range of $210-220 billion (with the formerSoviet Union accounting for more than two-thirds of the total), or 20-25% of the value of worldfossil fuel consumption. The importance of focusing on a few key countries is underscored bythe fact that 90% of the world coal is consumed by 15 countries; almost 80% of world petroleumproducts by 28 countries and almost 90% of the world natural gas by 18 countries (Larsen,1994). Further, these countries emit 85% of global carbon from fossil fuels (op. cit.).
More important, this study and an earlier one by Larsen and Shah (1992) estimates theenvironmental benefits associated with the elimination of these subsidies.29 As mentioned earlier,in determining the level of energy subsidy border prices are used as the benchmark (a surrogatefor the marginal opportunity cost of production). The subsidy is simply the ratio of the domesticprice to the world price times the domestic consumption of the fuel. Removal of these subsidiesis expected to lead to reductions in fossil fuel consumption and therefore carbon emissions. Thesize of the reductions would, of course, depend on the price elasticities. The studies use a partialequilibrium approach that assumes factor prices, other than energy prices, and the level ofaggregate output remain constant. They also assume constant price elasticity of demand for eachfossil fuel. Long-run own price elasticities of energy demand for various countries are obtainedfrom Bohi (1981) and other studies.
In the case of India subsidies for coal were $2.55 billion (based on a domestic price to borderprice ratio of 0.62). For petroleum products the figure was $4.25 billion (based on a price ratio of0.33 for kerosene and 0.79 for diesel) for a total energy subsidy of $6.8 billion, or 2.3% of GDP(Larsen, 1994, Tables 2 and 5). Further, an increase in prices of these fuels would result in areduction in CO2 emissions by 9% in the year 2010 relative to the baseline (that is, withoutremoval of subsidies).30
29 The main difference between the two is that the more recent study by Larsen allows for the possibility of interfuel
substitution (between coal, petroleum and natural gas) whereas the earlier one does not.30 For India, the own price elasticity used for coal is 0.6 and for petroleum products it is 0.25. It should also be noted
that emissions without the subsidies do go up but not by as much—thus, emissions increase by 2.5 times over 1989levels without subsidies compared to 2.8 times if the subsidies were not removed (Larsen, op. cit. Table 6).

13
The study by Larsen and Shah (henceforth L-S) estimates the welfare gain of removing fossilfuel subsidies in 13 non-OECD countries/regions as approximated by the Harberger triangle.31
Total welfare gains in subsidizing countries from removing fossil fuel subsidies is $33 billion,i.e., 15% of world subsidies. As expected, welfare gains are largest for the former Soviet Union($29.3 billion) and the welfare gain for India is $74 million. These figures could be anunderestimate for various reasons. First, as a measurement issue the Harberger triangle wouldunderstate welfare gains because the approach uses linear approximations to nonlinear demandand supply functions used by L-S. More important, however, these figures may significantlyunderstate true welfare gains if costs of local pollution and alternative uses of revenue fromsubsidy removal are not taken into account.
On the other hand, however, if all countries removed these subsidies at the same time therewould be large reductions in their fossil fuel demand and a fall in world energy prices at thesame time.32 On account of the latter, energy exporting countries would lose and energyimporters would gain. Thus, welfare gains for the former Soviet Union would be reduced to$22 billion but for India they would increase to almost $21 billion (L-S, op. cit., Table 4). For theworld as a whole (that is, including subsidizing and non-subsidizing countries) the welfare gainwould be $22.5 billion (down from $33 billion earlier).
From a practical viewpoint, removal of subsidies in developing countries such as India maybe difficult to implement politically. This is due to the fact that large constituencies have beencreated (such as truckers) who benefit from these subsidies. The environmental benefits,however, of reduced carbon emissions would be a good reason for doing so. In this context, it isuseful to note that an OECD carbon tax that would achieve the same world emission reductionsas those resulting from subsidy removal in non-OECD countries, would be quite substantial—inthe range of $50-90/ton (L-S, op. cit., Table 5). Therefore, as an alternative to (or in conjunctionwith) emissions trading with countries such as India, it might be possible for OECD countries tosubstitute some of their own carbon taxes by compensating non-OECD countries for removingfossil fuel subsidies. Though removal of subsidies is welfare improving in the long run even inthe absence of this compensation, transfers from rich countries would help mitigate short runadjustment costs and the distributional consequences (of removing subsidies) in poor countries,and make this step more feasible. This also assumes OECD countries could get credits againsttheir emission reduction obligations for doing so.
A more recent study for coal-based electricity generation in India also shows that policies thatremove price distortions (namely, marginal cost pricing and elimination of subsidy to producers)combined with freer imports of high quality coal, could reduce carbon emissions by 6.6%(Khanna and Zilberman, 1999). Further, this reduction in carbon emissions is accompanied by anincrease in the volume of electricity generated, lower coal consumption and an increase in socialwelfare by 8.6%. This reinforces the beneficial impact of the removal of trade and domesticpolicy distortions on carbon abatement.
31 An important caveat is that welfare calculations are based on estimating producer and consumer surpluses of fossil
fuel production and consumption, respectively, and this assumes full employment of resources. It shouldtherefore be considered as a long-run approximation to welfare gain (Larsen and Shah, op. cit.).
32 Removal of subsidies leads to a downward shift in world energy demand and results in a lower equilibrium priceand quantity (but this quantity is greater than what would have prevailed if world price effects had not beenconsidered).
14
4.2 The Potential for Using Carbon Taxes
Though recent discussion on economic responses towards climate change has been dominatedby tradable permits, there has also been considerable work on the role of carbon taxes (seeBaranzini et al., 2000, for a recent survey). The world’s first carbon tax was introduced byFinland in January 1990 ($6.10 per ton of carbon on all fossil fuels). Since then, five othercountries—Sweden ($45/ton), Norway, the Netherlands, Denmark and most recently,Italy—have implemented taxes based on the carbon content of energy products.33 These arecertainly the most direct price instruments to reduce carbon emissions.
An early study estimated that even a modest tax of $10/ton on the carbon content of fossilfuels, imposed individually by all countries could raise $55 billion in the very first year of itsoperation (Shah and Larsen, 1992, henceforth S-L). In this context, India’s carbon emissionsestimated at 148.2 million tons in 1990 could have yielded potential tax revenue of $1482million.34 It is also true that carbon taxes in general are easier to administer than taxes onpersonal and corporate income and thereby less prone to tax avoidance and evasion. The issueis one of their relative efficiency and equity vis-à-vis other taxes.
S-L examine the incidence of such a carbon tax for Pakistan and conclude that under partialforward shifting of the tax, it is roughly proportional or progressive in incidence (depending onwhether income or expenditure is taken as a base). Given that a tax on personal income is alsonot necessarily progressive in developing countries (due to widespread evasion and exemption ofrural incomes) they conclude “regressivity of carbon taxes should be less of a concern indeveloping countries than in developed countries” (op. cit., p. 11).
They also estimate the efficiency costs of carbon taxes for five countries including India.35
These costs are defined as the net marginal welfare cost of replacing other taxes by a carbon tax.The two taxes considered are personal income tax and corporate income tax. With respect to thepersonal income tax, a revenue neutral switch to a $10/ton carbon tax leads to a net welfare lossin all countries studied. For India this figure is $129 million. For corporate income tax, however,there is a net increase in welfare of $250 million for India.36
It is also of interest to consider welfare costs of carbon taxes with no change in existing taxes.In this case L-S find that welfare costs for India are $130 million, that is, about 8.8 cents perdollar of revenue from the carbon tax ($1482 million). In other words, welfare costs representonly a small fraction of carbon tax revenues. It is also interesting to note that the welfare loss($130 million) is almost the same as that in the previous case where carbon tax revenues wererecycled to reduce personal income taxes ($129 million). In other words, personal income taxesare so ineffective and tax evasion is so widespread that the welfare effect of a reduction in thesetaxes is negligible.
33 Austria and Germany recently introduced energy taxes but these are not based on carbon content.34 Since the amount of tax being considered is small the authors believe that a partial equilibrium approach is
reasonable, unlike taxes of $100/ton or higher that are frequently discussed in global models.35 The other countries were USA, Japan, Indonesia and Pakistan.36 This increase is incidentally the highest among all the countries studied. In fact, these results “lend support to the
widely-supported view that corporate income taxes are far more distortionary than labor income taxes.” (op. cit.,p. 19).

15
Any discussion of a carbon tax in the Indian context must also bear in mind subsidies thatalready exist on fossil fuels. In fact, as mentioned above a large proportion of the carbon taxwould go towards neutralising these subsidies. For instance, the price of coal in India was only85% of long run marginal cost (LRMC) in 1990 (Bates and Moore, 1991), implying a subsidy of15%. Thus, a carbon tax of $10/ton would lead to an approximately 26% increase in coal pricesin 1987 (the reference year). Thus, to the extent that a carbon tax eliminates these subsidies itshould be considered a welfare gain.
In light of this result, S-L re-examine the welfare cost of a revenue neutral switch from apersonal income tax to a $10/ton carbon tax. The difference as compared to the earlier case isthat now a welfare gain of $33.8 million (from removing the subsidy on coal through a carbontax) is explicitly included in the calculations.37 This gain is exactly offset by a welfare loss of$33.9 million due to the carbon tax on petroleum products.38 In sum, the efficiency cost of arevenue neutral switch to a carbon tax is zero, provided welfare gains from removal of otherprice distortions are accounted for.
Last but not least, in addition to abating emissions of greenhouse gases (GHGs), a carbon taxcould also result in reduced emissions of local and regional pollutants such as oxides of sulphurand nitrogen, carbon monoxide, and particulates (SO2, NOx, CO, and PM, respectively). This isdue to its effect on the level and composition of fossil fuel use. In other words, such a tax wouldnot only address a global externality, but also help in addressing regional and localenvironmental problems. Since coal is the predominant fossil fuel consumed in India, emissionreductions due to a carbon tax would be the highest here (compared to other countries).Comparing the welfare cost ($130 million) of a $10/ton carbon tax (no change in existing taxes)with various estimates of benefits of a reduction in SO2, NOx and PM emissions, the benefit-costratio ranges from 1.9 to 9.5 (S-L, op. cit., Table 4.1).39
A more recent study by Bussolo and O’Connor (2001) uses a CGE model to specificallyexamine the ancillary benefits of limiting CO2 emissions for India. Ancillary benefits are definedin terms of reduced mortality and morbidity due to reduced particulate concentrations and areestimated at 334 lives saved per million tonnes of carbon abated (or $58/ton of carbon emissionsreduced in monetary terms). These benefits are juxtaposed against the welfare costs of CO2
abatement through a tax to arrive at the level of “no regrets” abatement (the level of abatementwhere ancillary benefits are at least as much as the cost of abatement). This level ranges from13-23% of baseline CO2 emissions in the year 2010 (depending on the values of statistical lifeand substitution elasticities used in the analysis). In other words, just on the strength of ancillarybenefits CO2 emissions could be reduced by at least 12-13% over the baseline in the year 2010without any net cost.
Unlike the partial equilibrium approach and small levels of carbon tax in the S-L study citedabove, a more recent exercise by Fisher-Vanden et al. 1997) uses a multi-sector computable
37 In these calculations interfuel substitution is ignored as in previous cases, thus under/over stating the true welfare
gain/loss.38 The authors do not consider the removal of subsidy in the price of petroleum products in this simulation.39 The wide range for this ratio is due to the uncertainty/imprecision in arriving at a monetary value of the benefits
of emission reductions. The main monetary benefits come from improved health and reduced corrosion but theestimates are “likely to be crude at best” (op. cit., p. 23).

16
general equilibrium model for India to examine the impact of rather large carbon taxes on carbonemissions. Three scenarios are analysed over the modelling horizon (1990-2030), namely,varying carbon taxes to ensure stabilization of carbon emissions at 1990 levels in each timeperiod (the so called 1X case), at most a doubling of carbon emissions in each period (the 2Xcase), and at most a tripling of carbon emissions in each period (the 3X case). In the 1X case,carbon taxes start at $40 per ton of carbon (TC) and go up to $1100/TC in the year 2030.40 Thecorresponding figures for the year 2030 are $162/ton and $25/ton in the 2X and 3X case,respectively. Though the revenue received from these taxes is recycled back to households asadditions to personal income, there is a fall in GDP and consumption—in the 1X scenario forinstance GDP and consumption in 2030 decline by 6.3% and 14.6 %, respectively. These taxesalso imply a significant increase in fuel prices—a $100/ton carbon tax would translate into anincrease of 98% in crude oil prices and 276% in coal prices over 1985 levels (op. cit., Table 11).
What this analysis suggests is that a national carbon tax large enough to stabilize carbonemissions would be costly for India.41 Thus, it may be desirable to couple a stabilization targetwith global emissions trading where permit allocations are either grandfathered (at 1990 levels ofcarbon emissions) or decided on a per capita basis. In the former case, due to rapid futureeconomic growth India would be a net buyer of permits. But on the whole this approach wouldstill be less expensive ($50 billion in 2030) than domestic abatement through a national carbontax ($72 billion in 2030). With a per capita allocation, however, India would be a net seller ofpermits and would have a net gain of $57 billion in 2030. Thus, an allocation of permits inbetween these two cases would make India indifferent to participation in a global carbonstabilization agreement.
5. PROBLEMS IN IMPLEMENTING MBIS IN INDIA AND POSSIBLE SOLUTIONS
The preceding discussion indicates that, the vexatious problem of carving up the globalcommons aside, incentive-based policies are beneficial both for India and for developedcountries. In the Indian context, these policies include not only emissions trading but alsocarbon taxes and other economic policy reforms. It should not, however, be presumed thatimplementation of MBIs by India is an easy task. To begin with, the framework forenvironmental regulation in India is predominantly command and control (CAC). There is areluctance to consider MBIs even for local environmental issues such as vehicular or industrialpollution. No matter how compelling the case for MBIs, and notwithstanding the mountingevidence of their use globally, their implementation is far from certain in India. In the ultimateanalysis MBIs for GHG abatement cannot be viewed in isolation from an overall incentive-basedorientation towards environmental policy as well as broader economic and legal reform thatcreates a suitable milieu for MBIs. The following discussion applies to MBIs in general and notspecifically to those targeted at GHG abatement.
Given the growing number of MBIs that are being used by countries around the world, thequestion is whether India is so different that none of the country experiences can be replicated
40 All figures are in 1985 dollars.41 Unlike S-L or Bussolo and O’Connor this study does not consider the additional benefits of reduced emissions of
local and regional pollutants.
17
here. And if so, what are these differences? In this context, note in particular the experience ofChina, Thailand, Malaysia, Indonesia, and other developing countries including the formerlyplanned economies of Europe. Many of these countries have (or had until recently), problemssimilar to those that are cited in the Indian context against the use of MBIs: imperfectlyfunctioning markets, problems of monitoring and enforcing standards (due to a bloated andinefficient bureaucracy, shortage of resources, large number of micro and small-scale firms),and so on. While these difficulties are real and cannot be ignored, it is also true that the Indiansituation is amenable to the implementation of well designed MBIs.
The implementation of MBIs has certain prerequisites like well-functioning markets,information on the types of abatement technology available and its cost (O’Connor 1995,p. 23-24). In addition, the collection of an emissions charge depends on a reasonably effectivetax administration and monitoring of actual emissions. Tradable permit schemes require anadministrative machinery for issuing permits, tracking trades, and monitoring the actualemissions. Since the development of these capabilities is crucial for the effectiveness of theinstruments, MBIs cannot be considered as a short cut to pollution control. In other words, MBIshave institutional requirements just like regulatory measures.
It is important therefore, to examine potential problems in using MBIs in India and how theycould be addressed. To begin with, I focus specifically on issues of monitoring and enforcement.I then examine barriers to implementation of MBIs in India more generally and classify thesebarriers into three groups. It is important to keep in mind that some barriers particularlyinstitutional and organizational, are not unique to MBIs and apply equally to a CAC regime.I also suggest possible solutions to problems in implementing MBIs. Finally, I address concernsof equity vis-à-vis MBIs.
5.1 Monitoring of Discharges: Conceptual Issues and Suggestions
Moving from a CAC regime to MBIs implies that attention has to be paid to the problem ofmonitoring emissions. For MBIs such as tradable permits to work well, the credibility of thesystem is important. If holders of permits cheat (by discharging more than their permits allowthem to, and/or sell their permits and still continue to emit), then the confidence of players inthe permit market will be undermined. Further, it is argued that since the effectiveness of MBIsdepends crucially on the ability to successfully monitor discharges, till such time as thecapability to monitor plant-level emissions/effluents is in place in India, it is not feasible tointroduce MBIs. In response, it can be argued:
• Monitoring of discharges is also required under a properly functioning command andcontrol regime. The emphasis on the phrase “properly functioning” is deliberate: thecurrent practice of merely confirming that pollution abatement equipment is installedand working is not enough.42 This “checklist” approach to ensuring compliance does notprovide much information about actual emissions/effluents. Therefore, monitoring ofdischarges is not a problem unique to MBIs.
42 In some cases, all that is required is that pollution abatement equipment is installed, not even whether it is
operating properly. This is particularly true when courts are deciding whether to shut down polluting units.

18
In cases where direct monitoring of discharges is not possible (or is expensive), both theoryand practice suggest several “second best” alternatives. To begin with, there are a number ofways to indirectly estimate these discharges. For instance:
• Data on inputs and/or output can be used to estimate emissions/effluents as long as theproduction function relationship between these variables is known. All that is requiredto implement these methods is detailed data on output in physical units or in monetaryvalues. Of course, the more disaggregated the data, the more fine-tuned are the pollutioncoefficients, and the more accurate are the estimates of pollution.
• The example of Sweden shows that it is possible to promote a system of self-monitoringamong large firms. In this case standard emission rates were used for determining NOxcharges for firms whenever emissions were not measurable. These rates were greaterthan the average actual emissions, and consequently encouraged the installation ofmeasurement equipment by firms (OECD, 1994, p. 59). This could be a feasiblemonitoring mechanism for large plants in India.
If it is not possible at all to estimate emissions/effluents (even indirectly), the followingoptions are still available to regulators:
• They could use indirect instruments aimed at the outputs and inputs of the pollutingindustry or substitutes and complements to its outputs. For example, a tax on leatherproducts would be an indirect method of addressing pollution from tanneries. Theseindirect instruments should be fine tuned to the extent possible, based on the pollutionpotential of different products/processes. For instance, a presumptive emissions tax onfuels should be differentiated by the emissions coefficients in different industries—thus,the cement industry which does not discharge the sulfur of its fuels, should ideally berefunded presumptive sulfur taxes on fuels (Eskeland and Jimenez, 1992).
• If emissions are fully determined by the consumption of one good, then that good can betaxed (e.g., carbon taxes based on the carbon content of fuels). By the same token,substitutes to the polluting good should be subsidized (e.g., mass transit if privatevehicles are a cause of urban air pollution), and complements to the polluting goodshould be taxed (such as parking space).
Finally, in the context of GHGs particularly CO2, it should be noted that monitoring ofemissions is intrinsically easier—consumption of fossil fuels (and their carbon content) such ascoal, oil and gas should be easily verifiable at an aggregate level
5.2 Monitoring and Enforcement Regime in India: Stylized Facts and Directions for Reform
Specific suggestions are offered below for modifying the current monitoring and enforcementregime. Again, these observations are made in the context of pollution in general and not GHGsin particular.
• While emission standards are set at the central level the responsibility for monitoring andenforcement rests with state pollution control boards (SPCBs).
• There is too much reliance on “pseudo-monitoring and enforcement,” namely, verifyingthat pollution control devices are installed (also known as initial compliance), ratherthan on monitoring actual discharges (i.e., continuing compliance).

19
• For firms, the probability of being monitored is low. The same is true for enforcement.This is not only due to a shortage of resources and underfunding of SPCBs, but also dueto the manner in which the Acts have been framed (see next point).
• The monitoring procedures are cumbersome. There is no provision for on-the-spot orremote monitoring. Samples have to be physically collected and sent to approvedlaboratories for analysis. In order for these samples to be used as admissible evidence ina legal case, elaborate procedures have to be followed. Thus, there is excessive burdenof proof on the SPCB to prove that a violation has occurred. This reduces the expectedpenalty and weakens enforcement.
The following recommendations on changing the current monitoring and enforcement rulesand practices are made with a view to introducing MBIs such as emissions trading. Theserecommendations, however, would also make the current CAC regime more effective:
• The definition of monitoring and enforcement should be changed from the static one usedat present to a dynamic one that emphasizes emissions discharged per unit of time. Thisimplies that in addition to monitoring the ability to meet discharge standards, attentionshould also be given to frequent measurement of actual performance.43
• The monitoring capabilities of SPCBs should be strengthened. Pecuniary incentives couldbe offered to SPCB staff such as rewards for detecting violations that ultimately resultin conviction.
• The laws should be amended to allow on-the-spot measurement of pollution parameterswhere technically feasible, with portable monitoring equipment for quick detection ofviolations. The Acts should also be amended (particularly the Air Act), to allow the useof remote monitoring as admissible evidence where technically feasible.
• Self reporting of discharges by firms should be encouraged.44 To this end, theEnvironmental Statement (an annual report required from firms on their environmentalperformance) should be implemented in a mandatory manner. In fact, this statementshould be a part of the company’s Annual Report, and the Companies Act should beappropriately modified to reflect this. If firms do not submit these statements, apresumptive value could be used for the amount of pollution generated by them.45
The role of NGOs and other independent groups in assisting self-reporting by firmsshould be examined.
• Regular monitoring of discharges by firms is essential. Often, however, due to paucity ofresources random monitoring may be required. In this context, to use the resourcesavailable for monitoring and enforcement efficiently, it could be announced that firms
43 This distinction was made 16 years ago by Russell et al. (1986) in their seminal study on enforcing pollution laws
in the United States.44 Even in developed countries such as the United States with extensive monitoring of point sources self reporting is
widely used.45 One method would be to assume that the pollution intensity (i.e., pollution per unit output) of non-reporting firms,
was equivalent to the highest decile of pollution intensity for firms in the same industry using similar processes.This figure could then be multiplied by the actual output of the non-reporting firm to arrive at a presumptivevalue of the amount of pollution generated by it.

20
detected violating the rules46 would be placed on a special list and put on probation for aspecified period. During this period they would be subject to a higher than averagefrequency of inspection.47 If they followed the rules during this period they would beremoved from the list. However, if they violated the rules during this period they wouldbe treated as habitual offenders and action would be taken against them.
I now turn to barriers to implementation of MBIs more generally and also propose possiblesolutions. The barriers are grouped into three categories as described below:
5.3 Policy Barriers
These mostly pertain to shortcomings in the current environmental policy framework thatpotentially hinder the introduction of MBIs:
(i) The biggest policy barrier is inadequate understanding of MBIs among all stakeholders(industry, NGOs, government and the general public). This results in a number ofmisconceptions about MBIs, not only among the general public and NGOs, but amongindustry and policymakers as well. While there are a number of legitimate concernsabout MBIs such as the problem of thin markets,48 it is not true that MBIs are a “licenseto pollute” as is often argued. A better understanding of what MBIs can and cannot doand their actual track record in other countries (particularly developing countries), isvital for their general acceptability.
(ii) More generally, market-based approaches are part of an overall economic approach toenvironmental problems. While regulatory agencies and industry in India have anumber of competent technical staff such as environmental scientists and engineers,there is a paucity of economists working on environmental issues.
(iii) There is an interest among stakeholders in favour of status quo. Many industries favorfine tuning of the current environmental policy regime rather than a major paradigmshift entailed by MBIs. For example, firms that have invested heavily in pollutionabatement equipment do not stand to gain much out of differential abatement implicit inMBIs.49 Firms that are still in the rent-seeking mindset of the ‘license-permit raj’ aremore comfortable with a CAC regime where they can lobby regulators than with amarket-based regime where they have to operate in a competitive market. Similarly,
46 Under MBIs, violation of rules by a firm would include, inter alia, discharges in excess of levels allowed by
permits held by the firm, non-payment of effluent taxes, non-reporting/under-reporting of discharges, etc.47 In other words, once a firm is caught a history is created and increases its chances of being caught again.48 More generally, advantages of permits may not be fully realised if market imperfections prevent the permit market
from functioning smoothly. For example, if the flow of information is imperfect, potential buyers and sellers ofpermits will not be able to engage in profitable trades. In the presence of this and other distortions in the permitmarket (e.g., large search costs, strategic behaviour on part of the players), an emission tax system may bepreferred. Further, in the United States it has been noted that much of the permit trading involves largecorporations, perhaps since it is only feasible for larger firms to absorb the high transaction costs withoutjeopardising the gains from trade (Tietenberg, 1991, p. 105). Also, with large transaction costs, the finalequilibrium allocation of permits, and hence the aggregate costs of control, also become sensitive to the initialpermit allocation (Hahn and Stavins, 1992, p. 466).
49 Under differential abatement firms can reduce/abate pollution by varying amounts depending on their costs ofpollution abatement. In other words, high cost firms may prefer to abate less and pay the pollution charges orbuy permits, whereas low cost firms would do just the opposite. By contrast, in a CAC regime all firms have toabate pollution uniformly.

21
bureaucrat-dominated regulatory agencies in India are more comfortable with CAC andsuspicious of markets. In short, it is not apparent that there is a serious commitment toMBIs among stakeholders.
(iv) In addition to a bias towards direct regulation, environmental agencies such as thecentral environment ministry, the pollution control boards and state environmentdepartments lack policy analysis capabilities. This makes it difficult for them to takea holistic and long-term view of environmental issues whether they be trade andenvironment, transboundary environmental problems, or MBIs. Most agencies are toocaught up in day-to-day administration, public interest litigation and answeringlegislative questions. Due to these short-term pressures they are unable to focus on‘big picture’ issues, and even if they would like to they lack the capability to do so.
(v) A major legal barrier is that enabling changes are required in current legislation toallow differential abatement entailed by MBIs. Since the CAC regime is enshrined inthe current legislation new legislation to supersede/modify existing laws may berequired. For example, Schedules I, II, and VI of the Environment (Protection) Rules,1986 specify environmental standards for various air and water pollutants such asparticulates and BOD. Thus, a tax on emissions where firms had the option of payingthe tax rather than abating would violate these rules.
5.4 Institutional and Organizational Barriers
Broadly speaking, the issue here is of governance that is a major barrier to successfulimplementation of MBIs. Good governance, however, is required not for MBIs alone but for anyregulatory regime. One aspect of governance not mentioned below but which is a constantbackdrop is corruption. Bribing of regulators at various stages of monitoring and enforcementcan render MBIs ineffective. Again, this problem is not unique to MBIs:
(i) In particular, state pollution control boards (SPCBs) are not autonomous of the stategovernment in their staffing and day-to-day functioning. This limits their effectiveness.Moreover, non-specialists who may be unfamiliar with the complexities ofenvironmental management often manage these boards.
(ii) Monitoring and enforcement are areas where institutional deficiencies could be criticalwith respect to the use of MBIs in India. As stated earlier, however, it is incorrect toargue that MBIs require more intensive monitoring and enforcement as compared tocommand and control (CAC). A well functioning CAC requires as much monitoringand enforcement as MBIs.
5.5 Political and Cultural Barriers
These are largely problems of political economy that militate against MBIs:
(i) Recent reforms notwithstanding, India has a tradition of direct state intervention invarious spheres of the economy and society. For a number of historical and otherreasons Indian policymakers and intelligentsia have viewed markets with suspicion.This is also true in the context of environmental policies. Given this mindset it is notsurprising that traditional CAC approaches have been relied on so far.
(ii) In addition to regulatory agencies, politicians too would lose discretion and influenceunder a market-based regime and are therefore reluctant to embrace it.

22
(iii) Government agencies typically do not have a tradition of openness and publicparticipation. This could be a problem for MBIs, particularly when they are beingphased-in and when dialog and discussion are required.
(iv) India is a pluralistic society where interest groups (industry, labour, farmers, etc.)jostle to extract concessions from the state. Further, a sense of being entitled to a freelunch is ingrained among various interest groups. Both of these features result in areluctance to pay for services be it higher education or a clean environment. Thus, thereis resistance to pay for the ‘use’ of water or air as would be the case under MBIs.
5.6 Possible Solutions
These range from specific measures to broad policies and are not listed in any particular orderbelow:
(i) It is necessary to strengthen the knowledge base for MBIs. Information on best practicesvis-à-vis MBIs around the world could be compiled and analyzed for possible lessonsfor (and application to) India. This information should be regularly updated since theapplication of MBIs around the world is increasing rapidly.
(ii) Maintaining (and perhaps even accelerating) the deregulation and opening of India’seconomy would help in the adoption of MBIs. A more market-oriented mindset on partof Indian industry would also help in acceptance of MBIs. Similarly, pressure to reducethe fiscal deficit by reducing government expenditure should result in downsizing ofgovernment. In the overall context of deregulation, there should be a review ofenvironmental functions the government could withdraw from—a knee-jerk responseof trying to solve environmental problems by enacting laws and regulations should beavoided.
(iii) Resources such as water should be rationally priced to discourage dilution. Sincewater is a state subject this will require consensus building among the states.
(iv) There should be a comprehensive overhaul of the functioning of SPCBs and theyshould be made autonomous of state governments. It should also be ensured thatenvironmental professionals rather than generalists manage these agencies. While someboards face resource constraints lack of autonomy is a greater problem.
(v) Existing environmental laws should be amended and/or new ones enacted to empowercentral/state governments to prescribe MBIs. Before this can happen, however, it willbe necessary to convince the political establishment at the highest levels about MBIs.
(vi) A key requirement for bringing about greater transparency and accountability (whichare critical for effective functioning of MBIs) is right to information. It is necessary tointegrate something like the Freedom of Information Act (FOIA) in the United Statesinto environmental laws and to implement it seriously.
5.7 Distributional Consequences of Market-based Instruments
As is the case with CAC policies, the benefits and costs of MBIs will vary by income classand by region. Here I briefly touch upon the distribution of the costs of environmental policies ingeneral, and MBIs in particular. Most empirical studies on the distribution of pollution controlcosts have been in the context of existing environmental policies that are largely CAC in nature.

23
Thus, studies in the US during the 1970s-80s show that abatement costs were shifted by industryto consumers through higher prices, and these in turn reduced the real incomes of various incomeclasses differently.50 Typically, the incidence of these costs was regressive. While these studiesdo not directly examine the distributional effects of MBIs, per se, it seems likely that theseeffects could be regressive as well (perhaps less so since total costs of abatement would belower) since the same dirty industries would have to undertake the bulk of pollution abatementunder both regimes.
Such undesirable distributional effects of the costs of environmental policies, however, can becorrected through other accompanying measures. For example, pollution taxes could be appliedtogether with reductions in other distortionary taxes as discussed earlier. Transitional reallocationproblems (such as output and job losses due to higher costs in polluting industries), will arisewhen the economy is moving towards a more environmentally-friendly production andconsumption structure. These problems should be addressed by targeted programs of assistancerather than by a general dilution of environmental goals.
Since the main objective of MBIs (and environmental policy in general), is efficient allocationof resources they are not very well suited for redistribution objectives. To quote a leadingenvironmental economist, “it is important to remember that the basic objectives of taxes onpollution (or other environmental programs) are allocative in nature; their purpose is to achieveimportant targets for environmental quality. ..... Where their adverse redistributional impact canbe easily addressed, it is surely important to do so, but environmental measures should not, ingeneral, be side-tracked on redistributional grounds” (Oates, 1994, p. 129).
6. CONCLUSIONS
Incentive-based approaches for mitigating GHG emissions in India cannot be viewed inisolation from a broader commitment to MBIs to address environmental problems. Despitenational and international mandates there are a number of obstacles to implementing MBIs inIndia. It is possible, however, to address these problems and to articulate broad principles forusing MBIs. In general, incentive-based policies (IBPs) are more flexible than command andcontrol regulation and are also more cost-effective. Thus, IBPs can help growth and/or free upresources that could address distributional concerns.
In the specific context of GHG emissions there is considerable scope for using incentive-based polices in the short and long-run. There is some uncertainty as to how the gains from tradeunder CDM would be divided between the North and the South and also about the demand forCDM projects in the short-term. It is therefore desirable for India to engage in emissions tradingcoupled with other incentive-based economy-wide/sectoral policies such as carbon taxes andenergy price reforms. It is unlikely, however, that entitlements purely on the basis of a per capitacriterion will be internationally acceptable, particularly since this would give India entitlementsmuch in excess of its actual emissions. Some compromise on this issue is therefore inevitable inthe long-run.
50 See Cropper and Oates (1992, pp. 727-728) for highlights of some of these studies.

24
Acknowledgements
I am grateful to Emily Aronow, Henry Jacoby, David Reiner, Ambuj Sagar, Sudhir Shah andMike Toman for detailed comments and discussions on earlier drafts. The usual disclaimerapplies. This paper was completed during my visit as Fulbright Fellow at the MassachusettsInstitute of Technology during 2001-2002. I am thankful to the Center of Energy andEnvironmental Policy Research and the Joint Program on the Science and Policy of GlobalChange at MIT for their hospitality and for providing a stimulating research environment.
7. REFERENCES
Babiker, Mustafa, H.D. Jacoby, J.M. Reilly and D.M. Reiner. 2002. The Evolution of a ClimateRegime: Kyoto to Marrakech. Report No. 82. Cambridge, MA: Massachusetts Institute ofTechnology, MIT Joint Program on the Science and Policy of Global Change.
Babiker, Mustafa, J.M. Reilly and H.D. Jacoby. 2000. The Kyoto Protocol and developingcountries. Energy Policy 28:525-36.
Babu, P.G., K.S. Kavi Kumar and B. Saha. 2002. Clean Development Mechanism: Issues andOptions. In India and Global Climate Change (forthcoming). Washington, DC: Resourcesfor the Future.
Baranzini, Andrea, J. Goldemberg and S. Speck. 2000. A future for carbon taxes. EcologicalEconomics 32:395-412.
Bates, Robin W. and E. Moore. 1991. Commercial Energy Efficiency and the Environment.Background Paper No. 5. World Development Report 1992. Washington, DC: The WorldBank.
Bernstein, P.M., W.D. Montgomery, T.F. Rutherford and Gui-Fang Yang. 1999. Effects ofRestrictions on International Permit Trading: The MS-MRT Model. Energy Journal SpecialIssue:221-256.
Bertram, I. Geoffrey. 1996. Tradable emission quotas, technical progress and climate change.Environment and Development Economics 1(4):465-487.
Bohi, Douglas R. 1981. Analyzing Demand Behavior: A Study of Energy Elasticities. Baltimore:Johns Hopkins University Press.
Bussolo, Maurizio and D. O’Connor. 2001. Clearing the air in India: the economics of climatepolicy with ancillary benefits. Technical paper no. 182. Paris: OECD Development Centre.
Cazorla, Marina and M. Toman. 2000. International Equity and Climate Change Policy. ClimateIssues Brief No. 27. Washington, DC: Resources for the Future.
Chander, Parkash. 2002. The Kyoto Protocol and Developing Countries: Strategy and EquityIssues. In India and Global Climate Change (forthcoming). Washington, DC: Resources forthe Future.
Chander, Parkash, H. Tulkens, J. Ypersele and S. Willems. 1998. The Kyoto Protocol: anEconomic and Game Theoretic Interpretation. CLIMNEG Working Paper No. 12. CORE,Universite Catholique de Louvain.
Cropper, Maureen L. and W.E. Oates. 1992. Environmental economics: a survey. Journal ofEconomic Literature 30:675-740.
Ellerman, A. Denny, H.D. Jacoby, and A. Decaux. 1998. The Effects on Developing Countriesof the Kyoto Protocol and CO2 Emissions Trading. Report No. 41. Cambridge, MA:Massachusetts Institute of Technology. MIT Joint Program on the Science and Policy ofGlobal Change.

25
Eskeland, Gunnar S. and E. Jimenez. 1992. Policy instruments for pollution control indeveloping countries. The World Bank Research Observer 7(2):145-169.
Fischer, Carolyn and M. Toman. 2000. Environmentally and Economically Damaging Subsidies:Concepts and Illustrations. Climate Change Issues Brief No. 14. Washington, DC:Resources for the Future.
Fisher-Vanden, K.A., P.R. Shukla, J.A. Edmonds, S.H. Kim and H.M. Pitcher. 1997. Carbontaxes and India. Energy Economics 19:289-325.
Gupta, Sujata and P.M. Bhandari. 1999. An effective allocation criterion for CO2 emissions.Energy Policy 27:727-736.
Güth, W., R. Schmittberger, and B. Schwarze. 1982. An Experimental Analysis of UltimatumBargaining. Journal of Economic Behavior and Organization 3:367-388.
Hahn, Robert W. and R.N. Stavins. 1992. Economic Incentives for Environmental Protection:Integrating Theory and Practice. American Economic Review 82(2):464-468.
Huber, Richard M., Jack Ruitenbeek, and Ronaldo Seroa da Motta. 1998. Market BasedInstruments for Environmental Policymaking in Latin America and the Caribbean: Lessonsfrom Eleven Countries. Discussion paper 381. Washington, DC: The World Bank.
Karp, Larry S., and Xuemei Liu. 2000. The Clean Development Mechanism and itsControversies. Working Paper No. 903. Department of Agricultural and ResourceEconomics and Policy, University of California at Berkeley.
Khanna, Madhu and D. Zilberman. 1999. Freer markets and the abatement of carbon emissions:the electricity-generating sector in India. Resources and Energy Economics 21:125-152.
Larsen, Bjorn. 1994. World Fossil Fuel Subsidies and Global Carbon Emissions in a Model withInterfuel Substitution. Policy Research Working Paper No. 1256. Washington, DC: TheWorld Bank.
Larsen, Bjorn and A. Shah. 1992. World Fossil Fuel Subsidies and Global Carbon Emissions.Policy Research Working Paper No. 1002. Washington, DC: The World Bank.
Lopomo, Giuseppe and E.A. Ok. 2001. Bargaining interdependence, and the rationality of fairdivision. RAND Journal of Economics 32(2):263-283.
McKibbin, W., M. Ross, R. Shackleton and P. Wilcoxen. 1999. Emissions Trading, CapitalFlows and the Kyoto Protocol. Energy Journal Special Issue:287-333.
Oates, Wallace E. 1994. Environment and taxation: the case of the United States. In TheEconomics of Environmental Regulation, edited by W.E. Oates. Cheltenham, U.K.: EdwardElgar.
O’Connor, David. 1995. Applying Economic Instruments to Developing Countries: From Theoryto Implementation. Paris: OECD Development Centre.
OECD (Organization for Economic Cooperation and Development). 1994. Managing theEnvironment: The Role of Economic Instruments. Paris: OECD Development Centre.
Reid, Walter V. and J. Goldemberg. 1998. Developing countries are combating climate change:Actions in developing countries that slow growth in carbon emissions. Energy Policy26(3):233-237.
Reilly, John, R. Prinn, J. Harnisch, J. Fitzmaurice, H. Jacoby, D. Kicklighter, J. Melillo, P.Stone, A. Sokolov and C. Wang. 1999. Multi-gas Assessment of the Kyoto Protocol. Nature401:549-555.
Russell, Clifford S., W. Harrington and W.J. Vaughan. 1986. Enforcing Pollution Control Laws.Washington, DC: Resources for the Future.
Shah, Anwar and B. Larsen. 1992. Carbon Taxes, the Greenhouse Effect, and DevelopingCountries. Policy Research Working Paper No. 957. Washington, DC: The World Bank.
Stavins, Robert N. 2001a. Experience with Market-Based Environmental Policy Instruments.Discussion Paper 01-58. Washington, DC: Resources for the Future.
26
Stavins, Robert N. 2001b. Lessons from the American Experiment with Market-BasedEnvironmental Policies. Discussion Paper 01-53. Washington, DC: Resources for theFuture.
Tietenberg, T.H. 1991. Economic Instruments for Environmental Regulation. In EconomicPolicy Towards the Environment, edited by Dieter Helm. Oxford: Blackwell Publishers, 86-110.
Toman, Michael. 2000. Establishing and Operating the Clean Development Mechanism. ClimateIssues Brief No. 22. Washington, DC: Resources for the Future.
U.S. EPA (Environmental Protection Agency). 2001. The United States Experience withEconomic Incentives for Protecting the Environment. EPA 240-R-01-001. Washington, DC:U.S. EPA.
Weiner, Jonathan B. 1999. Global Environmental Regulation: Instrument Choice in LegalContext. Yale Law Journal 108(4):677-800.
Weyant, John P. 1999. The Costs of the Kyoto Protocol: A Muti-Model Assessment. EnergyJournal Special Issue.

REPORT SERIES of the MIT Joint Program on the Science and Policy of Global Change
Contact the Joint Program Office to request a copy. The Report Series is distributed at no charge.
1. Uncertainty in Climate Change Policy Analysis Jacoby & Prinn December 19942. Description and Validation of the MIT Version of the GISS 2D Model Sokolov & Stone June 19953. Responses of Primary Production and Carbon Storage to Changes in Climate and Atmospheric CO2
Concentration Xiao et al. October 19954. Application of the Probabilistic Collocation Method for an Uncertainty Analysis Webster et al. Jan 19965. World Energy Consumption and CO2 Emissions: 1950-2050 Schmalensee et al. April 19966. The MIT Emission Prediction and Policy Analysis (EPPA) Model Yang et al. May 19967. Integrated Global System Model for Climate Policy Analysis Prinn et al. June 1996 (superseded by No. 36)8. Relative Roles of Changes in CO2 and Climate to Equilibrium Responses of Net Primary Production
and Carbon Storage Xiao et al. June 19969. CO2 Emissions Limits: Economic Adjustments and the Distribution of Burdens Jacoby et al. July 199710. Modeling the Emissions of N2O & CH4 from the Terrestrial Biosphere to the Atmosphere Liu Aug 199611. Global Warming Projections: Sensitivity to Deep Ocean Mixing Sokolov & Stone September 199612. Net Primary Production of Ecosystems in China and its Equilibrium Responses to Climate Changes
Xiao et al. November 199613. Greenhouse Policy Architectures and Institutions Schmalensee November 199614. What Does Stabilizing Greenhouse Gas Concentrations Mean? Jacoby et al. November 199615. Economic Assessment of CO2 Capture and Disposal Eckaus et al. December 199616. What Drives Deforestation in the Brazilian Amazon? Pfaff December 199617. A Flexible Climate Model For Use In Integrated Assessments Sokolov & Stone March 199718. Transient Climate Change & Potential Croplands of the World in the 21st Century Xiao et al. May 199719. Joint Implementation: Lessons from Title IV’s Voluntary Compliance Programs Atkeson June 199720. Parameterization of Urban Sub-grid Scale Processes in Global Atmospheric Chemistry Models Calbo et
al. July 199721. Needed: A Realistic Strategy for Global Warming Jacoby, Prinn & Schmalensee August 199722. Same Science, Differing Policies; The Saga of Global Climate Change Skolnikoff August 199723. Uncertainty in the Oceanic Heat & Carbon Uptake & their Impact on Climate Projections Sokolov et al.
Sep 199724. A Global Interactive Chemistry and Climate Model Wang, Prinn & Sokolov September 199725. Interactions Among Emissions, Atmospheric Chemistry and Climate Change Wang & Prinn Sep 199726. Necessary Conditions for Stabilization Agreements Yang & Jacoby October 199727. Annex I Differentiation Proposals: Implications for Welfare, Equity and Policy Reiner & Jacoby Oct 199728. Transient Climate Change & Net Ecosystem Production of the Terrestrial Biosphere Xiao et al. Nov 199729. Analysis of CO2 Emissions from Fossil Fuel in Korea: 1961−1994 Choi November 199730. Uncertainty in Future Carbon Emissions: A Preliminary Exploration Webster November 199731. Beyond Emissions Paths: Rethinking the Climate Impacts of Emissions Protocols in an Uncertain World
Webster & Reiner November 199732. Kyoto’s Unfinished Business Jacoby, Prinn & Schmalensee June 199833. Economic Development and the Structure of the Demand for Commercial Energy Judson et al. April 199834. Combined Effects of Anthropogenic Emissions and Resultant Climatic Changes on Atmospheric OH Wang
& Prinn April 199835. Impact of Emissions, Chemistry, and Climate on Atmospheric Carbon Monoxide Wang & Prinn Apr 199836. Integrated Global System Model for Climate Policy Assessment: Feedbacks and Sensitivity Studies
Prinn et al. June 199837. Quantifying the Uncertainty in Climate Predictions Webster & Sokolov July 199838. Sequential Climate Decisions Under Uncertainty: An Integrated Framework Valverde et al. Sep 199839. Uncertainty in Atm. CO2 (Ocean Carbon Cycle Model Analysis) Holian Oct 1998 (superseded by No. 80)40. Analysis of Post-Kyoto CO2 Emissions Trading Using Marginal Abatement Curves Ellerman & Decaux Oct 199841. The Effects on Developing Countries of the Kyoto Protocol & CO2 Emissions Trading Ellerman et al. Nov 199842. Obstacles to Global CO2 Trading: A Familiar Problem Ellerman November 199843. The Uses and Misuses of Technology Development as a Component of Climate Policy Jacoby Nov 199844. Primary Aluminum Production: Climate Policy, Emissions and Costs Harnisch et al. December 199845. Multi-Gas Assessment of the Kyoto Protocol Reilly et al. January 199946. From Science to Policy: The Science-Related Politics of Climate Change Policy in the U.S. Skolnikoff Jan 1999
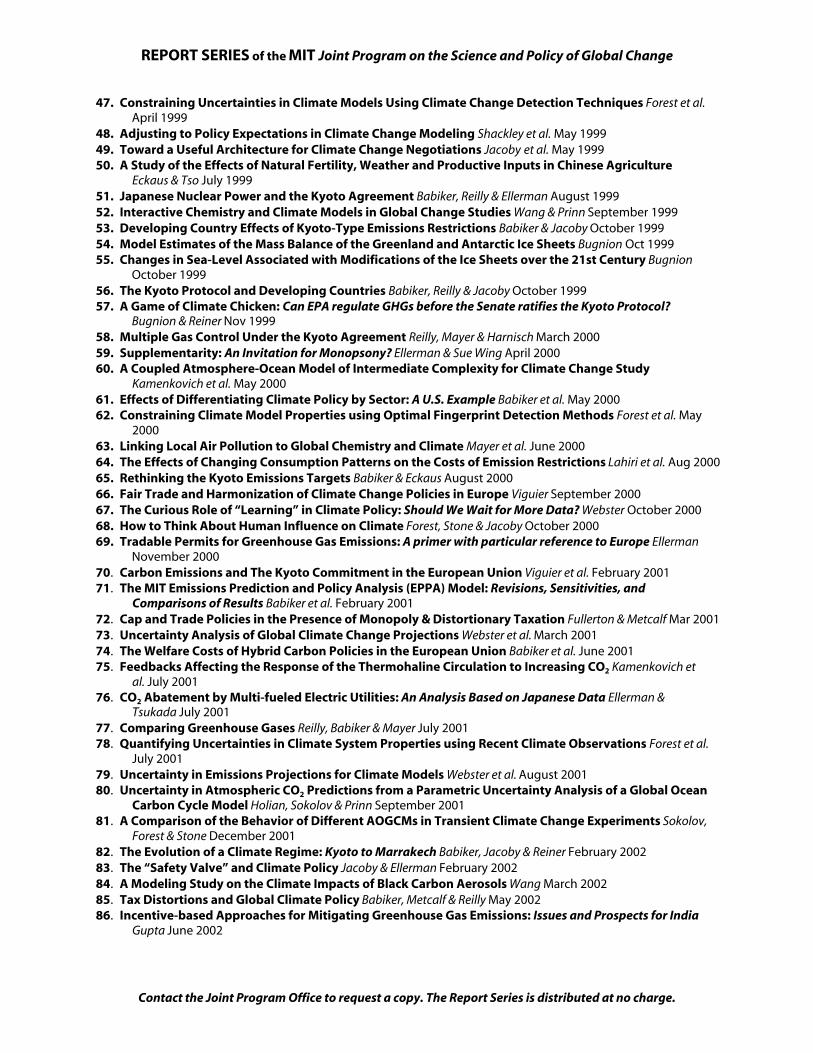
REPORT SERIES of the MIT Joint Program on the Science and Policy of Global Change
Contact the Joint Program Office to request a copy. The Report Series is distributed at no charge.
47. Constraining Uncertainties in Climate Models Using Climate Change Detection Techniques Forest et al.April 1999
48. Adjusting to Policy Expectations in Climate Change Modeling Shackley et al. May 199949. Toward a Useful Architecture for Climate Change Negotiations Jacoby et al. May 199950. A Study of the Effects of Natural Fertility, Weather and Productive Inputs in Chinese Agriculture
Eckaus & Tso July 199951. Japanese Nuclear Power and the Kyoto Agreement Babiker, Reilly & Ellerman August 199952. Interactive Chemistry and Climate Models in Global Change Studies Wang & Prinn September 199953. Developing Country Effects of Kyoto-Type Emissions Restrictions Babiker & Jacoby October 199954. Model Estimates of the Mass Balance of the Greenland and Antarctic Ice Sheets Bugnion Oct 199955. Changes in Sea-Level Associated with Modifications of the Ice Sheets over the 21st Century Bugnion
October 199956. The Kyoto Protocol and Developing Countries Babiker, Reilly & Jacoby October 199957. A Game of Climate Chicken: Can EPA regulate GHGs before the Senate ratifies the Kyoto Protocol?
Bugnion & Reiner Nov 199958. Multiple Gas Control Under the Kyoto Agreement Reilly, Mayer & Harnisch March 200059. Supplementarity: An Invitation for Monopsony? Ellerman & Sue Wing April 200060. A Coupled Atmosphere-Ocean Model of Intermediate Complexity for Climate Change Study
Kamenkovich et al. May 200061. Effects of Differentiating Climate Policy by Sector: A U.S. Example Babiker et al. May 200062. Constraining Climate Model Properties using Optimal Fingerprint Detection Methods Forest et al. May
200063. Linking Local Air Pollution to Global Chemistry and Climate Mayer et al. June 200064. The Effects of Changing Consumption Patterns on the Costs of Emission Restrictions Lahiri et al. Aug 200065. Rethinking the Kyoto Emissions Targets Babiker & Eckaus August 200066. Fair Trade and Harmonization of Climate Change Policies in Europe Viguier September 200067. The Curious Role of “Learning” in Climate Policy: Should We Wait for More Data? Webster October 200068. How to Think About Human Influence on Climate Forest, Stone & Jacoby October 200069. Tradable Permits for Greenhouse Gas Emissions: A primer with particular reference to Europe Ellerman
November 200070. Carbon Emissions and The Kyoto Commitment in the European Union Viguier et al. February 200171. The MIT Emissions Prediction and Policy Analysis (EPPA) Model: Revisions, Sensitivities, and
Comparisons of Results Babiker et al. February 200172. Cap and Trade Policies in the Presence of Monopoly & Distortionary Taxation Fullerton & Metcalf Mar 200173. Uncertainty Analysis of Global Climate Change Projections Webster et al. March 200174. The Welfare Costs of Hybrid Carbon Policies in the European Union Babiker et al. June 200175. Feedbacks Affecting the Response of the Thermohaline Circulation to Increasing CO2 Kamenkovich et
al. July 200176. CO2 Abatement by Multi-fueled Electric Utilities: An Analysis Based on Japanese Data Ellerman &
Tsukada July 200177. Comparing Greenhouse Gases Reilly, Babiker & Mayer July 200178. Quantifying Uncertainties in Climate System Properties using Recent Climate Observations Forest et al.
July 200179. Uncertainty in Emissions Projections for Climate Models Webster et al. August 200180. Uncertainty in Atmospheric CO2 Predictions from a Parametric Uncertainty Analysis of a Global Ocean
Carbon Cycle Model Holian, Sokolov & Prinn September 200181. A Comparison of the Behavior of Different AOGCMs in Transient Climate Change Experiments Sokolov,
Forest & Stone December 200182. The Evolution of a Climate Regime: Kyoto to Marrakech Babiker, Jacoby & Reiner February 200283. The “Safety Valve” and Climate Policy Jacoby & Ellerman February 200284. A Modeling Study on the Climate Impacts of Black Carbon Aerosols Wang March 200285. Tax Distortions and Global Climate Policy Babiker, Metcalf & Reilly May 200286. Incentive-based Approaches for Mitigating Greenhouse Gas Emissions: Issues and Prospects for India
Gupta June 2002