inbound supplier freight costs
DESCRIPTION
Inbound Supplier Freight Costs. $1.5B Industry Cost. Cost Reduction Opportunity. $500M Savings. No Barrier to Entry Easy to Implement No Cost or Fees. FDSI’s Inbound Supplier Freight Cost Reduction Solution. FDSI’s Program Stops your Suppliers from Profiting on Freight. - PowerPoint PPT PresentationTRANSCRIPT


Inbound Supplier Freight Costs$1.5B Industry Cost
Cost Reduction Opportunity$500M Savings
• No Barrier to Entry
• Easy to Implement
• No Cost or Fees

• FDSI’s Program Stops your Suppliers from Profiting on Freight
• FDSI Provides your Hospital with Deep Carrier Discounts
• FDSI Reduces your Hospital’s Premium Air Service Costs
• FDSI Provides Shipment Visibility Reporting Tools
• FDSI Provides an End to End Solution
FDSI’s Inbound Supplier Freight Cost Reduction Solution
• Experienced Transportation Professionals
• Customer Oriented Technology Solutions
• Multi-Modal Quality Carrier Network
FDSI Experienced Transportation Professionals
• Transportation & Operations Specialists
• Customer Service Coordinators
• Information Technology Specialists
• Freight Audit & Payment Department
• Hospital On-Site Consulting
• Dispatch
Visibility
Manageability
Measurability
Accountability
= Optimum Savings
Cost Reduction
FDSI Core TechnologyProvides

Reduce Premium Air Transportation Costs
Supplier ShipmentConsolidation
1,300+ CompliantSuppliers
Carrier Freight Audit& Payment Process
Hold DepartmentAccountable forFreight Costs
Establish Freight Cost Budget
Shipment Visibility Reporting
Carrier Least CostShipping Options
• A Variety of Quality Carriers
• Air, Ground, Ocean or Rail
• Less Than Truck Load (LTL)
• Full Truck Load (FTL)
• Vanline
• Flatbed
• Riggers
• Provide Deep Carrier Discounts
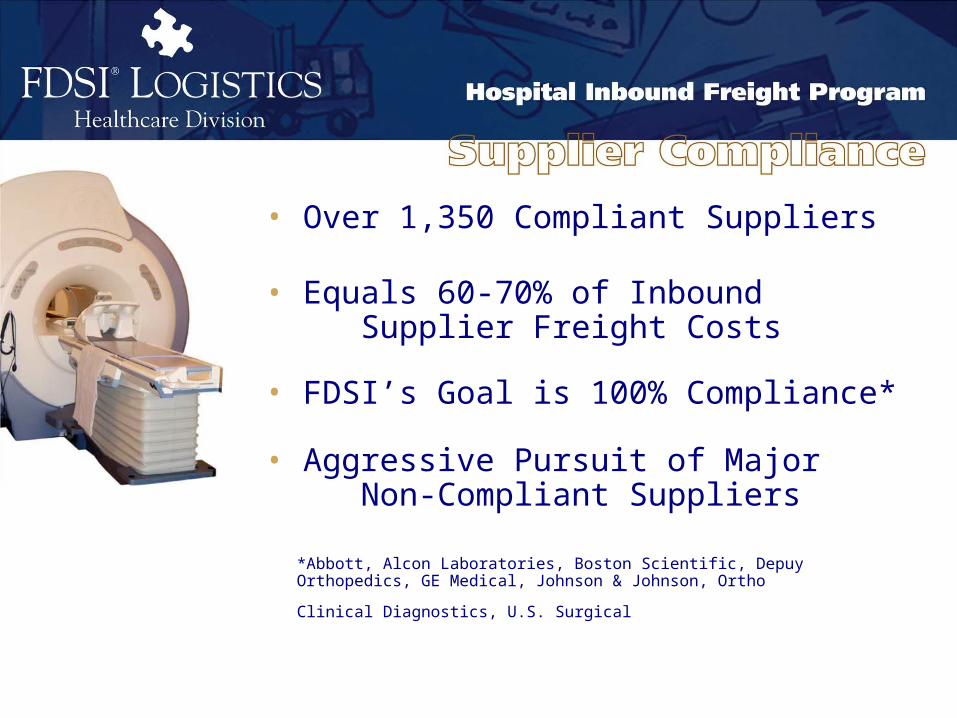
• Over 1,350 Compliant Suppliers
• Equals 60-70% of Inbound Supplier Freight Costs
• FDSI’s Goal is 100% Compliance*
• Aggressive Pursuit of Major Non-Compliant Suppliers
*Abbott, Alcon Laboratories, Boston Scientific, Depuy Orthopedics, GE Medical, Johnson
& Johnson, Ortho Clinical Diagnostics, U.S. Surgical

A Bills received byFDSI via mail or EDI
B Data is processed through automated filters that flag dups, gross errors, missing data for human review
C Corrections are made and database is updated
E Tariff/Pricing and PO numbers are checked for validity. Database isupdated with correct PO/SO or revised charges.
F GL Coding isperformed
H Weekly batches are Created and fundsrequested by FDSI
I Client funds FDSIvia wire or check and FDSI sends out carrier payments
D Physical bills or EDI files are forwarded toauditors
G Bill is flagged in database as “OK to pay”and electronic approval process is performed

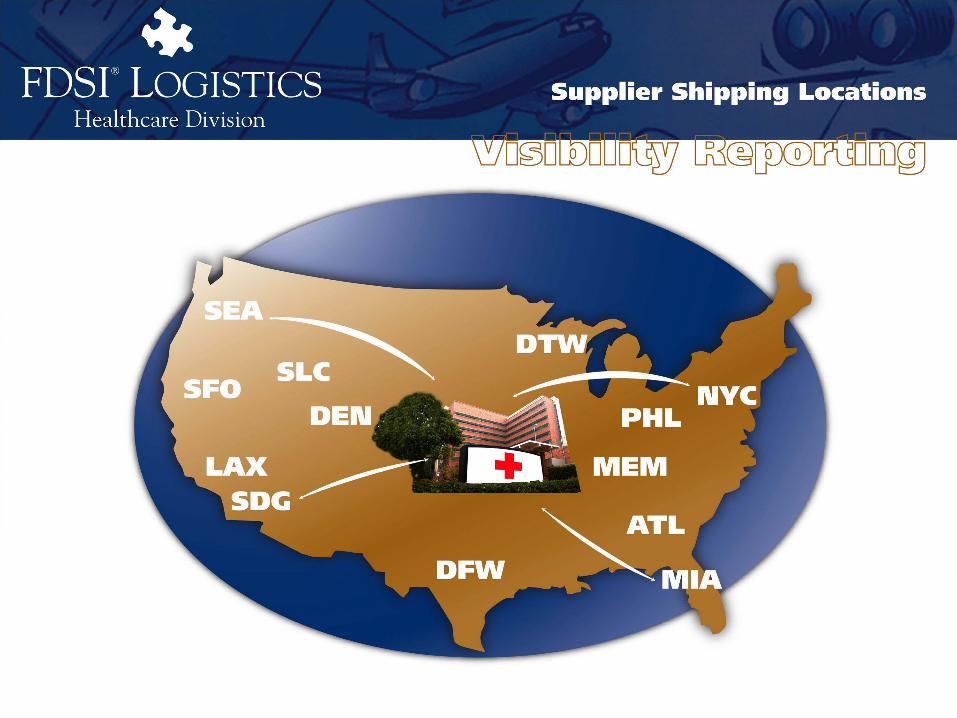
Monthly and YTD Visibility of all Incoming Shipments Provides:
• Supplier Origin Shipping Locations by Carrier Zone
• Identification of High Volume Suppliers that Ship Every Day
• Breakout of Premium Air vs Ground Shipments
• Identifies Opportunities to Reduce Premium Air Shipments
• Supplier Shipment Consolidation Option
• A Virtual Blueprint for Shipping Smarter

Reduce Premium Air Service Transportation Costs by 20-30%
• 70% of Inbound Shipments Move via Airfreight Direct from the Manufacturer/Supplier
• 50% of the Premium Air Service Shipments are not Consumed the Day they are Delivered
• Selective Mode Shifting of Priority to Standard, Standard to 2nd Day and 2nd Day to Ground will
Generate an Additional 20-30% Cost Savings

Summary by Service Type YTDFor 01/01/06 - 06/08/06
Savings% of TotalFDSI PriceList PriceShipmentsService Type
$13,959.2653%$44,988.49$58,947.751150Priority
2,361.389%7,541.789,903.16223Std Overnight
3,509.1518%15,146.6718,655.827532nd Day
836.758%6,352.547,189.29231Express Saver
612.6310%8,551.319,163.941161Ground
(0.63)2%1,623.121,622.4916First Overnight
$21,278.54$29,654.63$84,203.91$105,482.453534Grand Total

Service Change Analysis
vs

• Track and Trace Shipments
• Request Route Guides
• Rate Shop/Submit Rate Requests
• Look Up Freight Bills
• Submit Claims
• Review Claim Status
• Create/Request Custom Reports or Queries
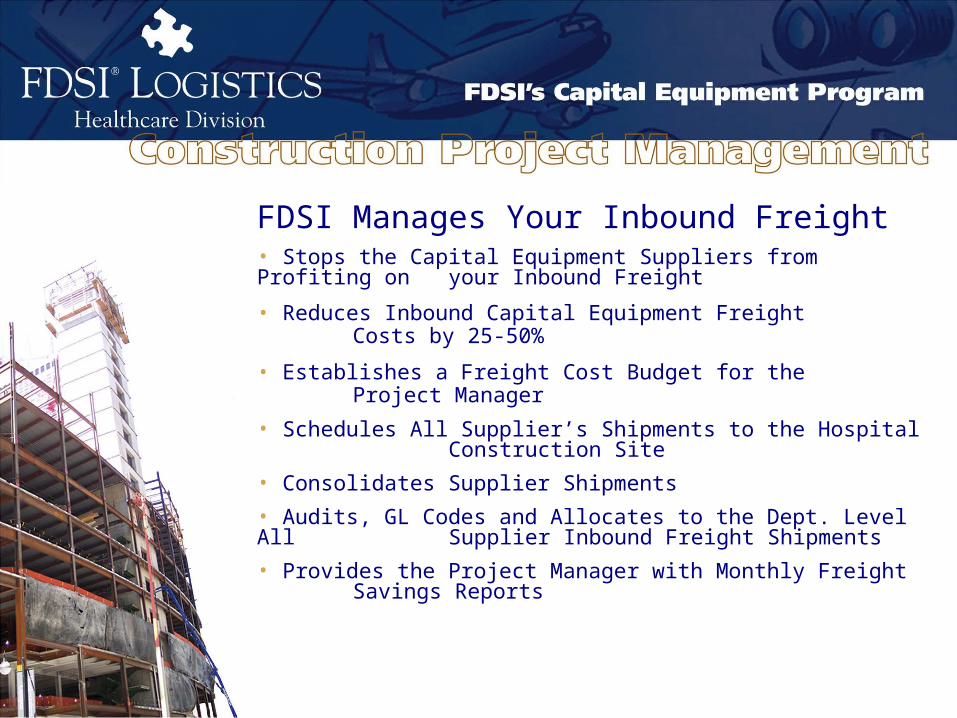
FDSI Manages Your Inbound Freight• Stops the Capital Equipment Suppliers from Profiting on your Inbound Freight
• Reduces Inbound Capital Equipment Freight Costs by 25-50%
• Establishes a Freight Cost Budget for the Project Manager
• Schedules All Supplier’s Shipments to the Hospital Construction Site
• Consolidates Supplier Shipments
• Audits, GL Codes and Allocates to the Dept. Level All Supplier Inbound Freight Shipments
• Provides the Project Manager with Monthly Freight Savings Reports

Estimated Costs: Radiology Lab
• Total Construction
• Capital Equipment
• Inbound Supplier Freight
• FDSI Compliant Supplier Match
• Inbound Supplier Freight Savings
$100M
$30M
$3M
$1.5M
$375K
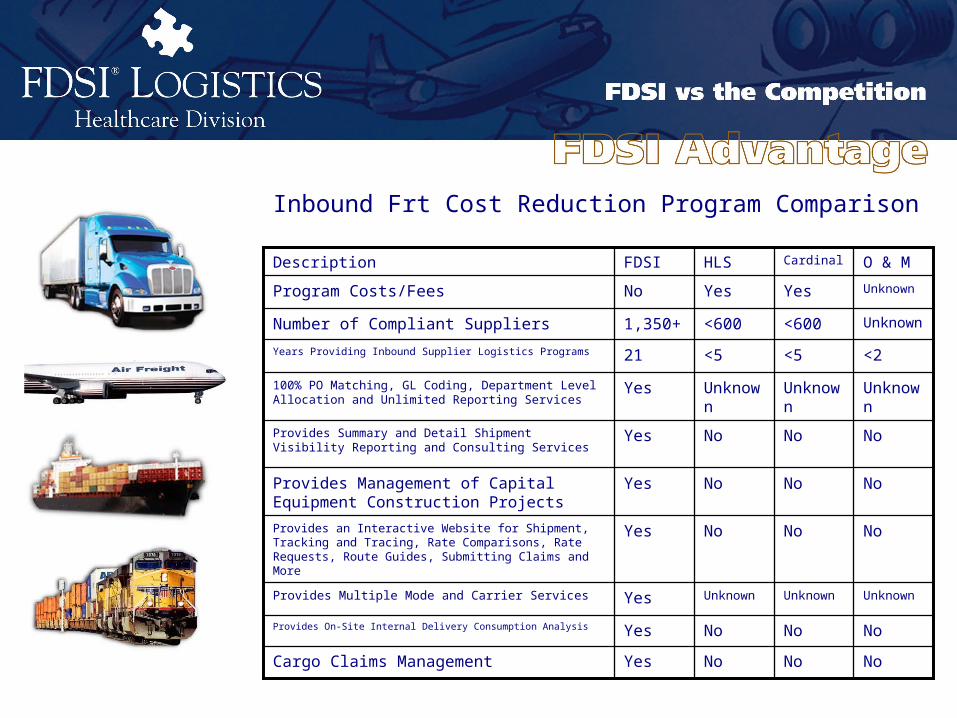
O & MCardinalHLSFDSIDescription
UnknownYesYesNoProgram Costs/Fees
Unknown<600<6001,350+Number of Compliant Suppliers
<2<5<521Years Providing Inbound Supplier Logistics Programs
UnknownUnknownUnknownYes100% PO Matching, GL Coding, Department Level Allocation and Unlimited Reporting Services
NoNoNoYesProvides Summary and Detail Shipment Visibility Reporting and Consulting Services
NoNoNoYesProvides Management of Capital Equipment Construction Projects
NoNoNoYesProvides an Interactive Website for Shipment, Tracking and Tracing, Rate Comparisons, Rate Requests, Route Guides, Submitting Claims and More
UnknownUnknownUnknownYesProvides Multiple Mode and Carrier Services
NoNoNoYesProvides On-Site Internal Delivery Consumption Analysis
NoNoNoYesCargo Claims Management
Inbound Frt Cost Reduction Program Comparison